Submitted:
03 December 2025
Posted:
04 December 2025
You are already at the latest version
Abstract
The study aims to compare differently processed oat products in terms of sensory and emotional perceptions by trained and untrained observers. A descriptive analysis was carried out for sensory profiling, and a hedonic test was conducted by 26 mothers. The Empathic Food Test (EFT) was used by trained subjects and 15 mothers for emotional profiling. Four products were compared: two products approved for infants (Holle, Hipp); one hydrothermally processed whole meal oat flour (TAU®); and oat flakes (Bauck). The sensory descriptive analysis revealed that the products for infants clearly differed from the other products in terms of their significantly lower aroma and flavor intensity. The TAU® and Bauck products varied widely in their sensory properties re-garding bitterness, sweetness, taste and smell. The emotional profiling conducted by trained observers revealed differences between the infant products and the other products. TAU® and Bauck scored higher than Hipp and Holle. In the hedonic sensory test, only minor differences between the samples were described. The emotional pro-filing conducted by consumers revealed product differences like those found by trained observers. Intensively processed oat products can be clearly distinguished from less processed ones via sensory and emotional profiling. The results were more distinct for trained observers.
Keywords:
sensory profiling
; emotional profiling
; oat processing
1. Introduction
The past 10 years have seen a growing debate about ultra-processed foods (UPFs) and their effects on health. Several systems have been developed to define the processing intensity of foods [1]. The most widely used of these is the NOVA system developed by Monteiro et al. [2], which is controversial [3,4]. The NOVA system addresses cereal processing; however, not all processes are described in detail [2], as some are summarized as breakfast cereals. According to the NOVA system, baby products are defined as ultra-processed foods. The instant property of cereal porridge products is associated with intensive processing via spray drying or roller drying.
In the European Union, food products for babies and young children are regulated by Directive 2006/125/EC of 5 December 2006 [5]. The directive stipulates a minimum level of nutrient content that these products often fail to meet, meaning that many products must be supplemented. In the case of cereal porridge, for example, it lacks vitamin B1.
One aspect that has received little attention in the evaluation of food processing is the sensory experience of the products by the target audience, i.e., the effects of the products on sensory and emotional well-being.
While sensory descriptions of taste, aroma, and mouthfeel are well established and regulated by ISO standards, methods for describing their effects of food on physical and emotional well-being are still relatively new. Several questionnaires focusing on the perceptions of food-induced emotions have been developed [6,7,8]. FIE measurement is used to assess quality questions, such as evaluating new ingredients [9], the importance of portion size [10], and comparing yogurt product attributes [11] and milk product attributes [12].
Sensory analysis is a commonly used method for evaluating grain processing stages. To the best of our knowledge, no studies have evaluated the sensory properties of grain-based baby food. Venter et al. (2025) [13] examined how microwaves and decortication alter the sensory properties of sorghum. Onyeoziri et al. (2021) [14] investigated how pearl millet can be stabilized for storage over several months through pre-processing such as extrusion cooking. Adebowale et al. (2020) [15] examined how microwave treatment can reduce the rancidity of whole-grain sorghum flour, while Rani et al. (2020) [16] compared different roasting methods for multigrain extruded flakes in terms of sensory acceptance. Kebakile et al. (2008) [17] investigated grinding techniques by evaluating the sensory characteristics of sorghum porridge.
Even though emotional profiling has increasingly been used in product evaluation [18,19], only a few studies on the evaluation of grain processing are available. Bartkiene et al. (2021) [20] compared extruded and fermented wheat bran as bread additives, Wohlers et al. (2024) [21] proved that both value-giving ingredients and the emotional profiling (EP) of breakfast cereals change during processing. Flake production was a gentler process than extrusion and popping in terms of ingredients and EP.
This study examined whether oat products for infants and comparable products that undergo different processing methods vary in terms of their sensory and emotional profiles.
2. Materials and Methods
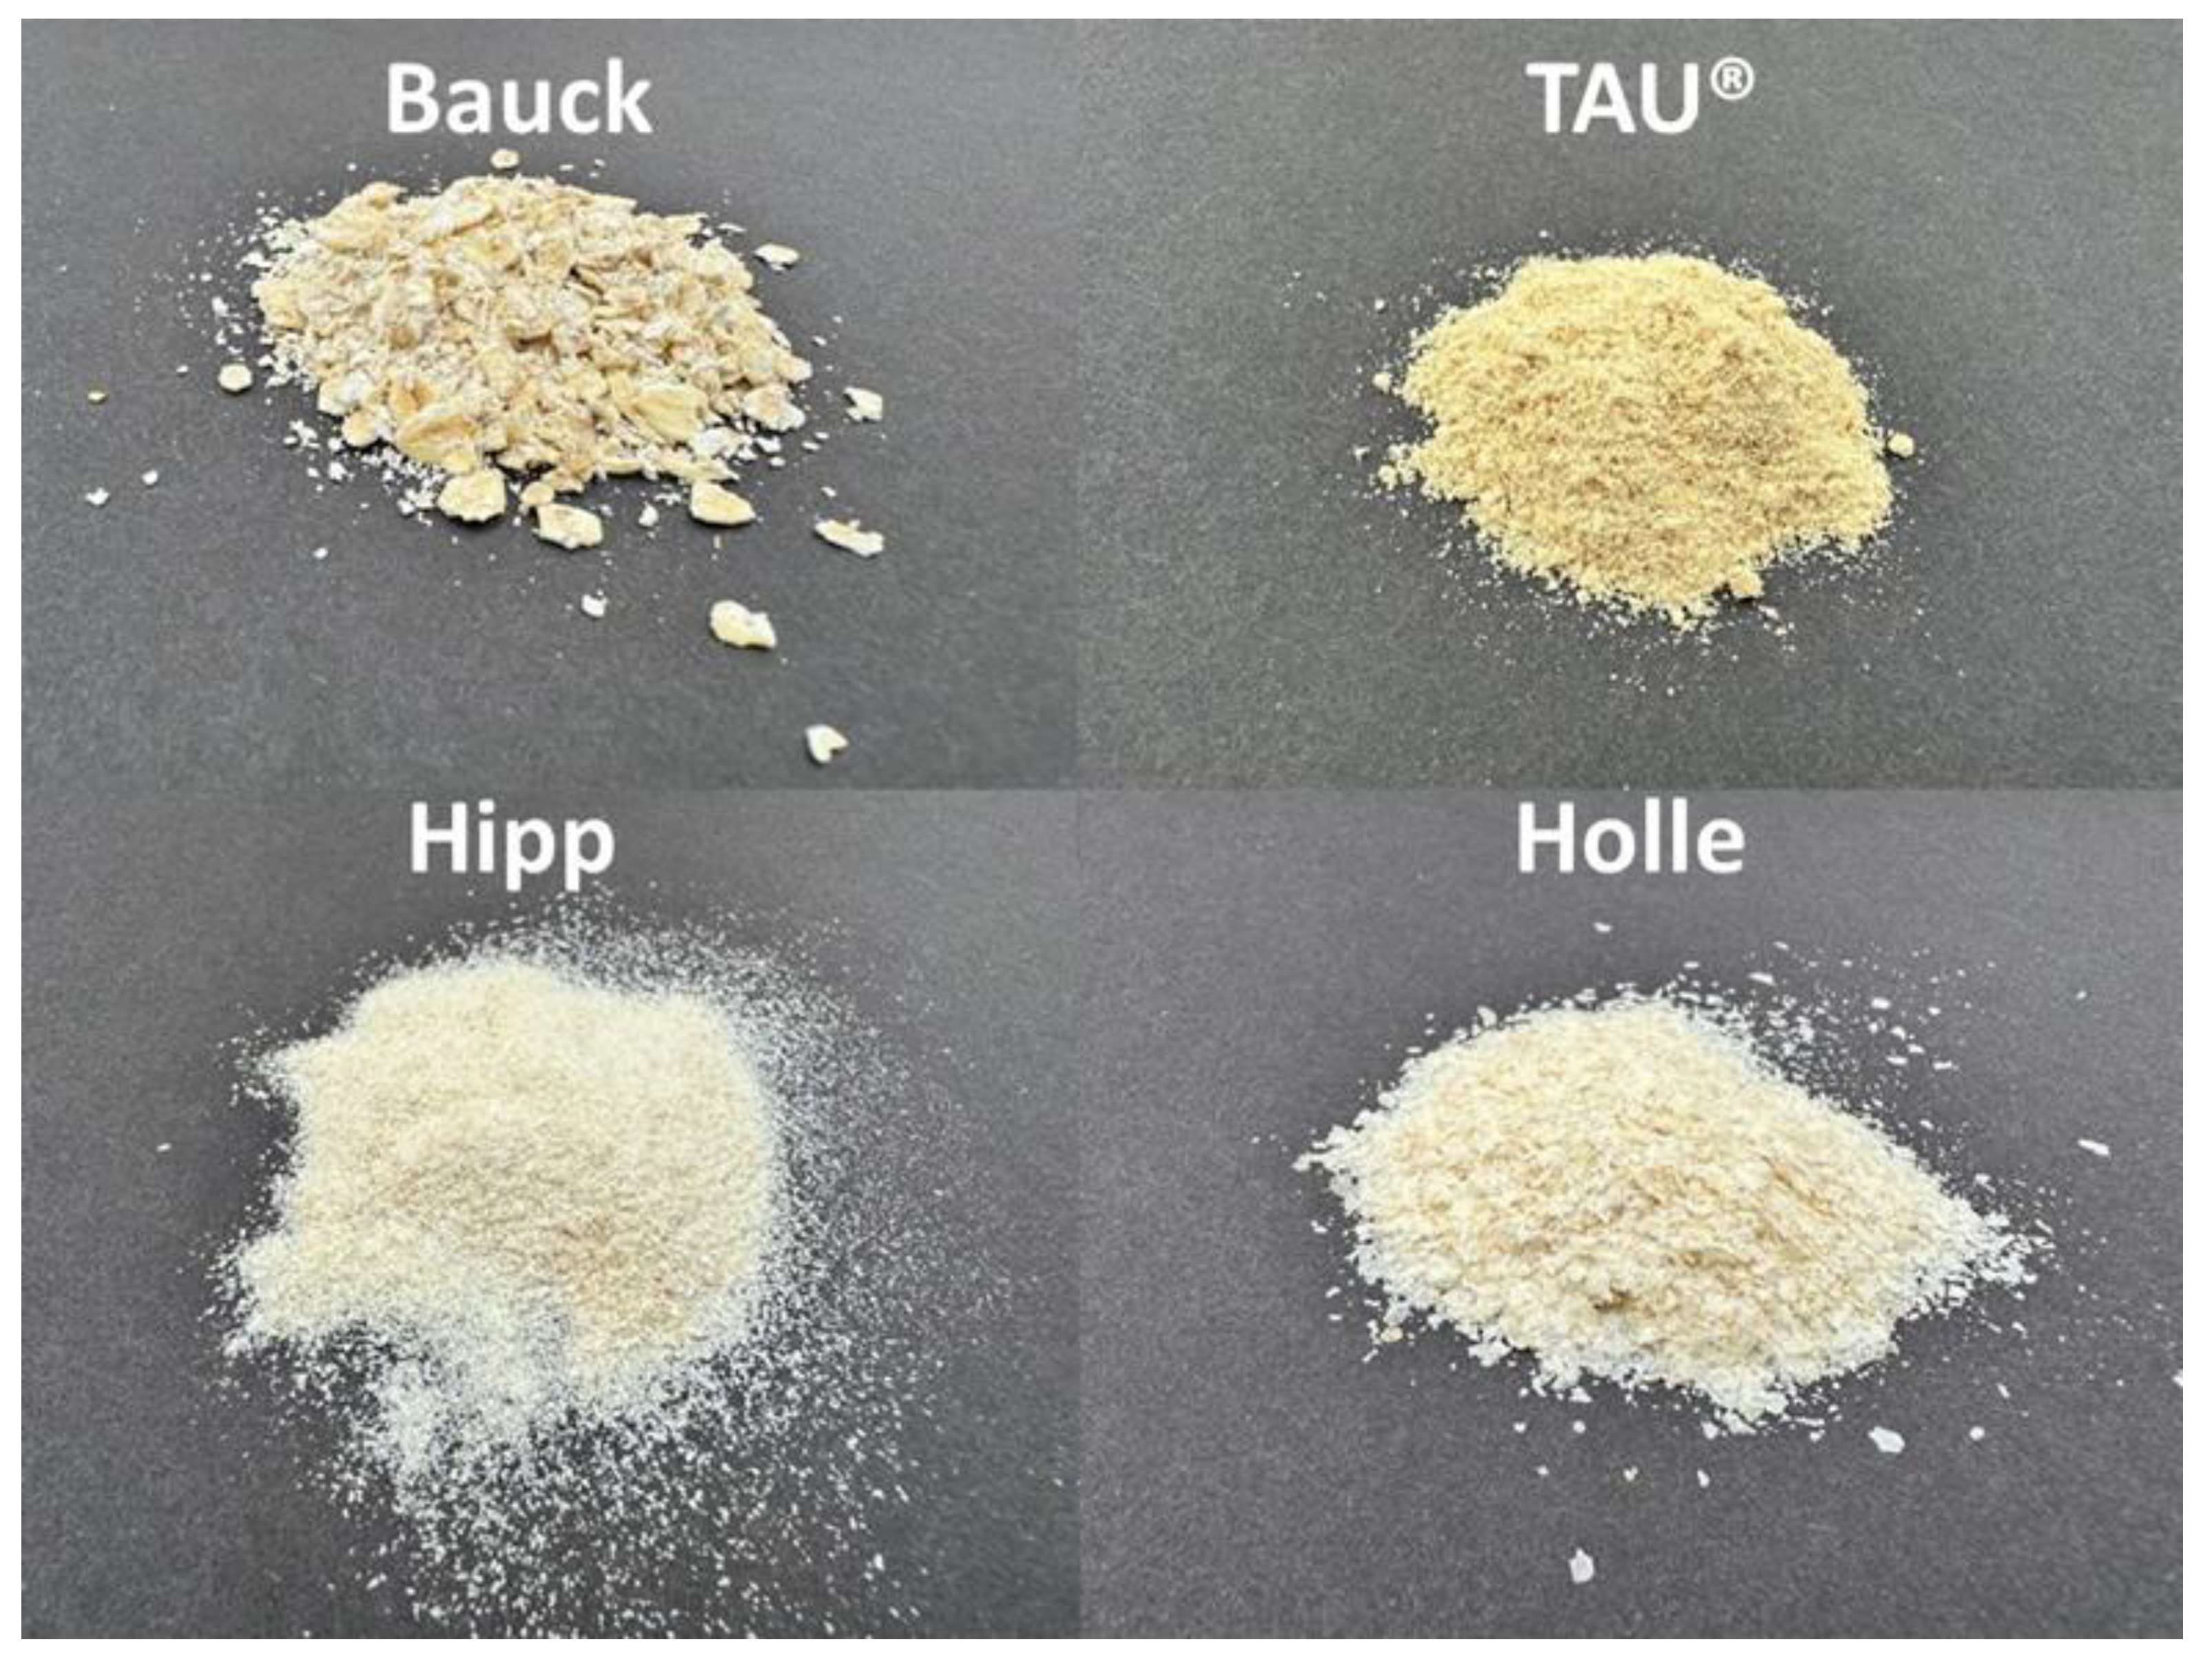
Four organically produced products were compared: two products approved for infants, enriched with vitamin B1 (Holle, Hipp); whole meal oat flour (TAU®), which was broken down using its own enzyme activity with water and heat (hydrothermal); and oat-flake porridge (Bauck) (Table 1). Samples of these products were sent to laboratories for chemical analysis, sensory profiling, and emotional profiling. For the consumer test, 40 g of each sample was packaged in a plastic bag for shipping. The label included a three-digit code and a recipe for preparation.
Conventional sensory profiling (according to DIN EN ISO 13299) was carried out by 12 members of the Döhler panel. The profiling took place in the sensory lab of Döhler Sensory & Consumer Science in Darmstadt. All panelists were trained according to DIN EN ISO 8586. The samples were offered at approximately 40 degrees Celsius (TAU® slightly warmer, due to skin formation). The neutralization between samples was carried out with water. They were measured on a scale of 0 (not perceptible) to 7 (very strong). The sensory software FIZZ Data was used for collection and analysis. Statistical analyses were conducted using XLstat.
Physical and emotional responses to the samples were determined using the Empathic Food Test (EFT) questionnaire [22]. Emotional profiling was performed with 13 trained observers. The EFT questionnaire generated two types of results: First a free description of the initial impression of food degustation on participants’ physical and emotional well-being. Second questions about 12 polar characteristics (see Table 2), which were rated on a five-point scale: “easy,” (score 1) “rather easy,” “neutral,” “rather difficult,” and “difficult” (score 5). Based on a factor analysis, five of the 12 items can be grouped into two scales (resp. mean scores): Scale 1 was comprised of five more emotionally oriented items, while scale 2 was composed of five items that focused on physical and mental effects [22]. The free description captured the effects of the product as determined by the participants’ first impressions. The free description also recorded characteristics that went beyond the 12 polar items. The procedure is comparable to the description of likes/dislikes in the hedonic consumer test. Text analysis was used to record the number of identical observations. Similar characteristics, such as being alert and focused, can be grouped together in a cluster.
Figure 1.
The appearance of the four products.
For consumer testing we searched for test subjects in the spring of 2025 by communicating with preschools near Erdmannhausen (Germany) and leveraging a mailing list of the Working Group for Nutrition Research (Arbeitskreis für Ernährungsforschung, Bad Vilbel, Germany). Thirty-two people signed up for the trial. The participants were introduced to the study through two video conferences during which the products to be tasted were not mentioned. The video conference also integrated an introduction to Empathic Food Test, including a body scan and a tasting of two water samples, alongside a discussion. The four coded samples were sent by post to the 32 participants. The package contained a procedure plan and a questionnaire on consent to data us. The questions focused on age, gender and the consumption of oat products. The samples (40 g each) were placed in a plastic bag with a sticker bearing a code and a recipe for preparation. Twenty-six people returned the questionnaires. Among the 26 participating women were 24 mothers with young children and two grandmothers. Five of these mothers had been breastfeeding at the time of the survey. All participants consumed oat products (13 consumed them often, 9 consumed them regularly, and 4 consumed them rarely). Almost all the participants’ children (or grandchildren) consume oat products (10 consumed them often, 10 consumed them regularly, and 5 consumed them rarely). In the consumer test, the participants were first asked to complete the emotional profiling questionnaires and then, after a break, the sensory profiling. The same questionnaire used for the trained observers was applied to emotional profiling. The questionnaire for the sensory consumer test asked about appearance, smell, texture, aroma, taste on five-point scales (from 1 = “very pleasant” to 5 = “very unpleasant”) and overall impression or willingness to buy (from 1 = “I would buy” to 3 = “I would not buy”). One comparative study [23] showed that experience and the length of the introduction to EFT influence results. The results for comparisons of pairs of food varied depending on whether consumers were not prepared at all, prepared briefly (0.75 hours), or prepared extensively (4 hours). This was probably because consumers were unfamiliar with the perception of food-induced emotions and had to first be trained to distinguish these perceptions from taste. The online introduction to EFT for consumers was very short, lasting approximately 50 minutes. Only one sample pair was tasted. Considering the above, there was a risk that not all participants would be able to distinguish between taste and effect on well-being on their first attempt. This was confirmed by the results of the free description results. Eleven participants noted only sensory terms, even though the questionnaire explicitly asked about physical and emotional well-being. Therefore, the results of these individuals were not included in the EFT evaluation.
The four samples were tested for acrylamide, amino acid spectrum, vitamin B1 (thiamine), and vitamin B9 (total folates) in a testing laboratory accredited according to ISO/IEC 17025:2018.
A linear mixed model was used to analyze the EP results. Item-related mental and physical effects served as dependent variables. The variants were modeled as fixed factors, while “person” was considered a cluster variable. The significance level was set to p < 0.05. To analyze the free descriptions, a Friedman test for paired samples was used to check whether the number of characteristics mentioned differed significantly between the treatments.
Generative artificial intelligence (GenAI) has not been used in this paper.
3. Results
3.1. Sensory Profiling
Of the four samples examined, two produced very similar results, while two gave significantly different results (Table 3). No “off notes” were detected in any of the four products. Bitterness was only slightly pronounced. Hipp oatmeal and Holle oatmeal present similar sensory profiles. The main difference lies in their appearance: Hipp oatmeal is slightly thinner than Holle oatmeal and adheres slightly more on the spoon. In terms of taste, Holle oatmeal is fluffier, and its mashed apples taste is slightly more pronounced. Both brands of oatmeal deliver low to medium cereal and nutty flavors. They taste slightly sweet and bitter, and they have thin, slippery, mushy, and fluffy textures. Bauck oatmeal porridge has a thick, sticky, slimy, compact, and not homogenous texture. It delivers a medium cereal and nutty flavor, and its taste is slightly sweet and not bitter at all. TAU® oatmeal has a homogeneous, slimy, mushy, thin, and slippery texture. It delivers medium-to-strong cereal and nutty flavors with malty and herb/hay notes. Its taste is less sweet than the other products and slightly bitter. The term herb/hay is also associated with the impression of whole-meal bread. TAU® oatmeal displays a high degree of complexity because many characteristics typical of cereal are pronounced.
3.2. Emotional Profiling
Emotional profiling using EFT revealed significant differences between the products. Effects were identified in 9 out of the 12 bipolar items and the two mean scores (Table 4) as well as in several characteristics of the free description (Table 5). Two groups can be distinguished: oatmeal from Holle and Hipp and products from TAU® and Bauck. The biggest differences were between Holle and TAU® and between Hipp and TAU®. In the two EFT mean scores (emotional and body) and 4 individual items, the oatmeal from TAU® was rated significantly more favorably than the oatmeal offered by Holle and Hipp (Table 5). Significant differences were also identified between Bauck and Holle (EFT mean score emotional and four individual items). The comparisons between Bauck and Hipp were less pronounced (EFT mean value—emotional and one item).
The free description results revealed a similar pattern to that seen in the 12 bipolar questions (Table 6). The biggest differences were between TAU® and Holle and TAU® and Hipp. The number of negatively connoted observations (TAU® mean 0, SD 0) was significantly higher for Hipp (mean 1.615, SD 1.04) and Holle (mean 2.385, SD 1.04), and the number of positively connoted observations was significantly lower than for TAU® (mean 4.08, SD 0.954; Holle mean 1, SD 0.816; Hipp mean 1.69; 0.855). The positively connoted clusters “chest”, “relaxed” and “alert” were also significantly more pronounced for TAU® than for Holle and Hipp (cluster “chest”: TAU® mean 0.692, SD 0.63; Holle mean 0, SD 0, Hipp mean 0, SD 0) (cluster “relaxed”: TAU® mean 0.692, SD 0.63; Holle mean 0, SD 0, Hipp mean 0.308, SD 0.48) (cluster “alert”: TAU® mean 1.0, SD 0.577; Holle mean 0.154, SD 0.376, Hipp mean 0.308, SD 0.48). The cluster “stabilizing” TAU® (mean 0.846, SD 0.376) differed from the same cluster for Hipp (mean 0.385, SD 0.506).
There were still relatively large contrasts between Bauck and Hipp and Bauck and Holle, namely the number of negatively connoted observations (Bauck mean 0.692, SD 0.48), the number of positively connoted observations (Bauck mean 3.08, SD 0.76), the cluster “alert” (Bauck mean 1.0, SD 0.577) and the cluster “relaxed” (Bauck mean 0.385, SD 0.506) (Table 6). TAU® was rated more favorably than Bauck in terms of the number of positively connoted observations and the cluster “chest”. Hipp and Holle differed in the number of negatively connoted observations (Table 6).
3.3. Consumer Testing – Hedonic Sensory Test
Twenty-six participants took part in the hedonic sensory test. Sensory profiling was carried out after emotional profiling was completed. The sensory consumer test questionnaire asked participants about appearance, smell, texture, aroma, taste and overall impression or willingness to buy.
There were no differences between the four products in terms of overall impression and texture/mouthfeel. The greatest effects were observed in appearance (Table 7). TAU® was rated less favorably than the three comparison products (TAU® mean 3.40, CI ±0.37; Bauck mean 1.84, CI ±0.37; Hipp mean 2.40, CI ±0.37; Holle mean 2.20, CI ±0.37). There were also differences between Bauck and TAU® in terms of smell and taste (Table 7). Bauck was rated more positively (Bauck smell mean 1.88, CI ±0.34, TAU® smell mean 2.48, CI ±0.34) (Bauck taste mean 2.04, CI ±0.48; TAU® taste mean 2.48, CI ±0.47). Only by trend (p = 0.074), the aroma of TAU® was rated more favorably than that of Holle.
3.4. Consumer Testing – Emotional Profiling
Twenty-six mothers took part in the consumer test for sensory and emotional profiling. Only the 15 participants who had recorded the effect on their physical and emotional well-being in the free description were included in the evaluation. The 11 people who had only noted taste impressions were excluded from the evaluation.
Only one among the 12 polar questions of the EFT showed significant effects, warm/cold (Table 8): The TAU® product was perceived as significantly warmer (mean 1.80, CI ±0.60) than the products from Hipp (mean 3.33, CI ± 0.61) and Holle (mean 3.07, CI ±0.61). The Bauck product (mean 2.07, CI ±0.61) was described as warmer than the Hipp product (Table 8).
The free description revealed differences in terms of the number of observations with positive connotations, the number of observations with negative connotations, and the cluster “relaxed” (Table 9). TAU® was rated more favorably than Holle and Hipp in all that three characteristics (number of positively connoted observations: TAU® mean 2.667, SD 1.05; Holle mean 0.467, SD 0.516; Hipp mean 1.40, SD 0.828) (number of negatively connoted observations: TAU® mean 0.333, SD 0.488 Holle mean 1.0, SD 0.535; Hipp mean 1.0, SD 0.704) (cluster “relaxed”: TAU® mean 0.933, SD 0.594; Holle mean 0, SD 0; Hipp mean 0.467, SD 0.516). There were no significant contrasts between Bauck and Hipp, but there were between Bauck and Holle in terms of the number of positively connoted observations and the relaxed cluster (number of positively connoted observations: Bauck mean 1.733, SD 0.799; Holle mean 0.467, SD 0.516) (cluster “relaxed”: Bauck mean 0.733, SD 0.594; Holle mean 0, SD 0). Differences in terms of the number of positively connoted observations were identified between the pairs TAU® and Bauck and Holle and Hipp. Holle and Hipp also deviated in the cluster “relaxed.”
3.5. Chemical Analysis
The chemical analysis revealed only minor differences between the products (Table 10). Overall, acrylamide levels were low, with TAU® having the highest value. The effect of supplementation appeared to be evident in vitamin B1. The values for baby products were higher than the products without supplementation The vitamin B9 content in TAU® was slightly lower compared to the other products.
4. Discussion
4.1. Infant Products Compared with Other Products
Two conventional infant food products from Hipp and Holle hardly differ, as seen in the descriptive analysis, the emotional profiling conducted by trained testers, and the consumer test. In the descriptive analysis, the two infant products by Hipp and Holle stood out above all others due to their significantly lower aroma and taste intensity compared to the products by TAU® and Bauck.
The two conventional baby food products by Hipp and Holle received a significantly lower score in emotional profiling by trained testers, especially in terms of emotional well-being (item relaxed—nervous; mean score—emotional) compared to the products by TAU® and Bauck. In the free description, more negatively connoted and fewer positive characteristics were observed overall.
In the hedonic consumer test only, the two conventional baby food products of Hipp and Holle (with the lighter flour) were preferred over the TAU® product regarding appearance. In the EP conducted by consumers, Hipp and Holle products were perceived as less warm, and positively connoted characteristics were observed much less frequently than with TAU® and Bauck products.
4.2. Flakes for Porridge Compared with Hydrothermally Processed Products
According to the NOVA classification for the degree of processing, flakes are considered minimally processed in the first stage, whereas baby food is classified as ultra-processed in the fourth stage [2]. Flakes could therefore serve as a reference for the more intensive processing of cereals. In fact, in the descriptive sensory analysis, the Bauck product clearly differed from conventional baby products; it had a more intense smell and taste and a higher score in the emotional profiling by trained observers than the baby food products. This was confirmed by the results of [21] who compared the processes of flaking, extrusion, popping, and traditional rolling for spelt and buckwheat. In the EP, the gentlest process, flaking, was rated the best.
The TAU® product, made from whole grain oat flour, has been opened using its own enzyme activity with water and heat (hydrothermally) in a complex process (see [24]) and cannot be easily classified in the NOVA system. In the descriptive analysis, TAU® showed a different character than the flakes and the most distinct cereal notes. In the EP, TAU® was rated slightly more favorably than Bauck in tests with trained observers and in consumer tests, with the differences from conventional infant products being more pronounced in these tests.
4.3. Results of Trained and Untrained Observers
The trained observers who conducted sensory profiling found considerably greater differences between the products than the consumers. This result is supported by studies that compare sensory analyses by consumer panels with those by experts [25,26,27,28], which found that trained experts were more precise in their analyses than consumers.
Working with trained panels is relatively new in EP; thus, there are few studies on the subject. Geier (2018) [23] compared groups of 60 consumers with no preparation, short preparation, and longer preparation in EFT using pairs of samples with similar sensory characteristics. A trained panel was also involved. The consumers who had been prepared for a longer period (4 hours) came to similar conclusions to the expert panel, while the unprepared consumers rated all three sample pairs differently. This illustrates the influence of training on EP as well and is consistent with research findings on body perception. Klimecki et al. (2014) [29] showed that empathy and compassion can be learned. Interestingly, in the present study, consumers came to largely consistent results with those of trained panelists (see results of the free description); only clarity was lower for consumers than for panelists.
4.4. Comparing Sensory and Emotional Profiling
Trained testers using sensory descriptive analysis and EP consistently rated the two baby products as a group and the other two products as independent. In consumer testing, the differences identified by EP were greater than those identified by sensory profiling. This confirms Prinyawiwatkul´s (2023) [30] assessment that emotional profiles and ratings may effectively differentiate products with similar sensory characteristics and hedonic ratings. In studies by [12] on milk and [31] on honey, the trained panelists found more significant product differences through EP than through sensory profiling.
4.4. Critical Review
The number of consumers did not meet ISO’s requirements for hedonic tests.
5. Conclusions
Sensory and emotional profiling revealed that intensively processed infant oat products can be clearly distinguished from less processed ones. The results were more distinct for trained observers. Among consumers, emotional profiling was more effective in product differentiation than sensory profiling. Sensory and emotional profiling are suitable for describing differently processed oat products.
Author Contributions
For research articles with several authors, a short paragraph specifying their individual contributions must be provided. The following statements should be used “Conceptualization, U.G.; methodology, U.G.; formal analysis, J.K and G.M.; investigation, J.K. and G.M.; writing, U.G.
Funding
This research was funded by ErdmannHAUSER Getreideprodukte GmbH and Demeter e.V.
Institutional Review Board Statement
Our study did not require ethical approval.
Informed Consent Statement
Informed consent was obtained from all subjects involved in the study.
Acknowledgments
We would like to thank the sensory laboratory of Döhler Sensory & Consumer Science for their excellent cooperation. We would also like to thank Demeter e.V. for their support.
Conflicts of Interest
The study was partially funded by the manufacturer of the TAU® product. The funders had no role in the design of the study; in the collection, analyses, or interpretation of data; in the writing of the manuscript; or in the decision to publish the results
Abbreviations
The following abbreviations are used in this manuscript:
| EP | Emotional profiling |
| EFT | Empathic Food Test |
References
- Medin, A.C.; Gulowsen, S.R.; Groufh-Jacobsen, S.; Berget, I.; Grini, I.S.; Varela, P. Definitions of ultra-processed foods beyond NOVA: A systematic review and evaluation. Food Nutr. Res. 2025, 69. [Google Scholar] [CrossRef] [PubMed]
- Monteiro, C.A.; Cannon, G.; Levy, R.B.; Moubarac, J.-C.; Louzada, M.L.; Rauber, F.; Khandpur, N.; Cediel, G.; Neri, D.; Martinez-Steele, E.; et al. Ultra-processed foods: What they are and how to identify them. Public Health Nutr. 2019, 22, 936–941. [Google Scholar] [CrossRef] [PubMed]
- Braesco, V.; Souchon, I.; Sauvant, P.; Haurogné, T.; Maillot, M.; Féart, C.; Darmon, N. Ultra-processed foods: How functional is the NOVA system? Eur. J. Clin. Nutr. 2022, 76, 1245–1253. [Google Scholar] [CrossRef] [PubMed]
- Davidou, S.; Christodoulou, A.; Fardet, A.; Frank, K. The holistico-reductionist Siga classification according to the degree of food processing: An evaluation of ultra-processed foods in French supermarkets. Food Funct. 2020, 11, 2026–2039. [Google Scholar] [CrossRef]
- European Commission. Commission Directive 2006/125/EC of 5 December 2006 on processed cereal-based foods and baby foods for infants and young children. Available online: https://eur-lex.europa.eu/legal-content/EN/ALL/?uri=CELEX:32006L0125 (accessed on 24 October 2025).
- Porcherot, C.; Delplanque, S.; Raviot-Derrien, S.; Le Calvé, B.; Chrea, C.; Gaudreau, N.; Cayeux, I. How do you feel when you smell this?: Optimization of a verbal measurement of odor-elicited emotions. Food Quality and Preference 2010, 21, 938–947. [Google Scholar] [CrossRef]
- Spinelli, S.; Masi, C.; Dinnella, C.; Zoboli, G.P.; Monteleone, E. How does it make you feel?: A new approach to measuring emotions in food product experience. Food Quality and Preference 2014, 37, 109–122. [Google Scholar] [CrossRef]
- King, S.C.; Meiselman, H.L.; Thomas Carr, B. Measuring emotions associated with foods: Important elements of questionnaire and test design. Food Quality and Preference 2013, 28, 8–16. [Google Scholar] [CrossRef]
- Moss, R.; Dabas, T.; Stright, A.; Caya, E.; Baxter, L.; Dolan, E.; Gorman, M.; McSweeney, M.B. The use of sugar kelp (Saccharina latissima) as a seasoning for popcorn: An investigation of consumer acceptance, sensory perception and emotional response. Food and Humanity 2024, 3, 100382. [Google Scholar] [CrossRef]
- Isabel Salazar Cobo, M.; Jager, G.; de Graaf, C.; Zandstra, E.H. Dynamic changes in hedonic and emotional responses to fruit varying in portion size. Food Quality and Preference 2022, 102, 104651. [Google Scholar] [CrossRef]
- Schouteten, J.J.; de Steur, H.; Sas, B.; de Bourdeaudhuij, I.; Gellynck, X. The effect of the research setting on the emotional and sensory profiling under blind, expected, and informed conditions: A study on premium and private label yogurt products. J. Dairy Sci. 2017, 100, 169–186. [Google Scholar] [CrossRef]
- Geier, U.; Mandt, G.; Keller, J.; Helmert, E.; Vagedes, J. Measurement of heart rate variability and emotional profiling to characterize milk quality? milk science international_2025_4 2025, 78 . [Google Scholar]
- Venter, A.; Asadi, S.Z.; Yisa Njowe, K.B.; Schmidt, M.; de Kock, H.L.; Emmambux, M.N. Effect of Microwave and Decortication on Functional, Nutritional and Sensory Properties of Sorghum. Cereal Chem 2025, 102, 829–839. [Google Scholar] [CrossRef]
- Onyeoziri, I.O.; Torres-Aguilar, P.; Hamaker, B.R.; Taylor, J.R.N.; de Kock, H.L. Descriptive sensory analysis of instant porridge from stored wholegrain and decorticated pearl millet flour cooked, stabilized and improved by using a low-cost extruder. J. Food Sci. 2021, 86, 3824–3838. [Google Scholar] [CrossRef] [PubMed]
- Adebowale, O.J.; Taylor, J.R.N.; de Kock, H.L. Stabilization of wholegrain sorghum flour and consequent potential improvement of food product sensory quality by microwave treatment of the kernels. LWT 2020, 132, 109827. [Google Scholar] [CrossRef]
- Rani, P.; Kumar, A.; Purohit, S.R.; Rao, P.S. Development of multigrain extruded flakes and their sensory analysis using fuzzy logic. Food Measure 2020, 14, 411–424. [Google Scholar] [CrossRef]
- Kebakile, M.M.; Rooney, L.W.; de Kock, H.L.; Taylor, J.R.N. Effects of Sorghum Type and Milling Process on the Sensory Characteristics of Sorghum Porridge. Cereal Chem 2008, 85, 307–313. [Google Scholar] [CrossRef]
- Cardello, A.V.; Llobell, F.; Giacalone, D.; Roigard, C.M.; Jaeger, S.R. Plant-based alternatives vs dairy milk: Consumer segments and their sensory, emotional, cognitive and situational use responses to tasted products. Food Quality and Preference 2022, 100, 104599. [Google Scholar] [CrossRef]
- Curutchet, A.; Serantes, M.; Pontet, C.; Prisco, F.; Arcia, P.; Barg, G.; Menendez, J.A.; Tárrega, A. Sensory Features Introduced by Brewery Spent Grain with Impact on Consumers' Motivations and Emotions for Fibre-Enriched Products. Foods 2021, 11. [Google Scholar] [CrossRef]
- Bartkiene, E.; Jomantaite, I.; Mockus, E.; Ruibys, R.; Baltusnikiene, A.; Santini, A.; Zokaityte, E. The Contribution of Extruded and Fermented Wheat Bran to the Quality Parameters of Wheat Bread, Including the Profile of Volatile Compounds and Their Relationship with Emotions Induced for Consumers. Foods 2021, 10. [Google Scholar] [CrossRef]
- Wohlers, J.; Stolz, P.; Geier, U. Intensive processing reduces quality of grains: A triangulation of three assessment methods. Biological Agriculture & Horticulture 2024, 40, 107–126. [Google Scholar] [CrossRef]
- Geier, U.; Büssing, A.; Kruse, P.; Greiner, R.; Buchecker, K. Development and Application of a Test for Food-Induced Emotions. PLoS One 2016, 11, e0165991. [Google Scholar] [CrossRef]
- Geier, U. Training in Self-Observation alters the Emotional Response to Products: 11th European Conference on Sensory and Consumer Research. Poster presented at the Eurosense. Eighth European Conference on Sensory and Consumer Research, Verona, Italy, 2-5 September 2018; 2018. Available online: https://www.eurosense.elsevier.com/conference-history.html.
- Bonnefoit-Jahn, C. Mit Wasser und Wärme. Journal Culinaire 2025. [Google Scholar]
- Oliver, P.; Cicerale, S.; Pang, E.; Keast, R. Comparison of Quantitative Descriptive Analysis to the Napping methodology with and without product training. Journal of Sensory Studies 2018, 33, 289. [Google Scholar] [CrossRef]
- Alexi, N.; Nanou, E.; Lazo, O.; Guerrero, L.; Grigorakis, K.; Byrne, D.V. Check-All-That-Apply (CATA) with semi-trained assessors: Sensory profiles closer to descriptive analysis or consumer elicited data? Food Quality and Preference 2018, 64, 11–20. [Google Scholar] [CrossRef]
- P. Monteiro, M.J.; A. Costa, A.I.; Franco, M.I.; Bechoff, A.; Cisse, M.; Geneviève, F.; Tomlins, K.; E. Pintado, M.M. Cross-cultural development of hibiscus tea sensory lexicons for trained and untrained panelists. Journal of Sensory Studies 2017, 32, 849. [CrossRef]
- Ares, G.; Antúnez, L.; Bruzzone, F.; Vidal, L.; Giménez, A.; Pineau, B.; Beresford, M.K.; Jin, D.; Paisley, A.G.; Chheang, S.L.; et al. Comparison of sensory product profiles generated by trained assessors and consumers using CATA questions: Four case studies with complex and/or similar samples. Food Quality and Preference 2015, 45, 75–86. [Google Scholar] [CrossRef]
- Klimecki, O.M.; Leiberg, S.; Ricard, M.; Singer, T. Differential pattern of functional brain plasticity after compassion and empathy training. Soc. Cogn. Affect. Neurosci. 2014, 9, 873–879. [Google Scholar] [CrossRef]
- Prinyawiwatkul, W. Food-Evoked Emotion, Product Acceptance, Food Preference, Food Choice and Consumption: Some New Perspectives. Foods 2023, 12. [Google Scholar] [CrossRef]
- Bundschuh, J.; Mandt, G.; Keller, J.; Meischner, T.; Brock, C.; Geier, U. Extended honey quality assessment with complementary methods enables the assessment of queen excluders in beekeeping management practices. Manuscript under revision. In Biological Agriculture & Horticulture; 2025. [Google Scholar]

Table 1.
Oat samples.
| Variant | Product | Processing | Farming method |
|---|---|---|---|
| Hipp | Hipp Bio Getreidebrei, HiPP GmbH & Co KG, 100% wholegrain oat flour with thiamin supplement | Roller drying | Organic |
| Holle | Holle Bio, Mein allererster Brei, Holle Europe GmbH, 100% wholegrain oat flour with thiamin supplement | Roller drying | Organic (Demeter) |
| Bauck | Bauck Mühle Hot Hafer Basis Porridge, Bauck GmbH, 100% Oat | Flaking | Organic (Demeter) |
| TAU® | TAU® Getreidebrei aus Hafer, ErmannHAUSER Getreideprodukte GmbH, 100% Oat | Hydrothermal grain milling | Organic (Demeter) |
Table 2.
Twelve polar items of the EFT questionnaire and their corresponding factor scales.
| Polar items | Scale | ||
|---|---|---|---|
| I feel… | Warm | Cold | - |
| Bright | Dark | 1 | |
| Light | Heavy | 2 | |
| Fresh | Exhausted | 2 | |
| I feel... | Energized | Not energized | 2 |
| Awake | Sleepy | 2 | |
| Concentrated | Distracted | 2 | |
| Relaxed | Nervous | 1 | |
| Comforting | Unwell | 1 | |
| Satisfied | Unsatisfied | 1 | |
| Balanced | Unbalanced | 1 | |
| The impact feels… | Long lasting | Short | - |
Table 3.
Results of the sensory descriptive analysis. Mean values. Letter differences indicate significant effects. Scale: 0 (“not perceptible”) to 7 (“very strong”).
Table 3.
Results of the sensory descriptive analysis. Mean values. Letter differences indicate significant effects. Scale: 0 (“not perceptible”) to 7 (“very strong”).
| Attribute | TAU® | Bauck | Hipp | Holle | |
|---|---|---|---|---|---|
| Aroma | Overall smell Cereal Nutty Herb/Hay Malty Mashed apples |
5.2 a 5.0 a 3.1 a 2.5 a 2.8 a 0.4 b |
4.2 b 4.3 b 2.8 ab 1.6 b 0.9 b 0.5 b |
3.3 c 3.6 c 2.5 b 1.2 b 0.5 c 1.6 a |
3.1 c 3.4 c 2.5 b 1.2 c 0.5 c 1.8 a |
| Taste | Overall taste Cereal Nutty Herbs/hay Malty Mashed apples Sweet Bitter |
4.9 a 4.7 a 2.5 a 2.5 a 2.4 a 0.3 c 1.6 c 1.9 a |
4.0 b 4.2 b 2.2 a 1.7 b 0.8 b 0.3 c 2.5 a 0.8 b |
3.2 c 3.5 c 2.2 a 1.2 c 0.6 b 1.3 b 2.1 b 1.7 a |
2.9 c 3.2 c 2.1 a 1.2 c 0.5 b 1.6 a 2.1 b 1.9 a |
| Appearance | White (0) -> brown (7) Adherence spoon Thin (0) -> thick (7) Fluffy (0) -> compact (7) Mushy Homogenous Quantity swollen flak Slimy |
5.9 a 4.1 b 3.4 b 4.6 b 4.6 b 4.9 b 0.3 b 2.6 b |
4.1 b 4.7 a 6.0 a 6.3 a 0.4 c 0.8 c 6.8 a 4.2 a |
1.9 c 2.4 c 2.7 c 2.1 c 6.1 a 5.7 a 0.1 c 1.1 c |
2.1 c 1.0 d 3.2 b 1.4 d 5.8 a 5.2 ab 0.1 c 0.9 c |
| Texture | Slippery Sticky Thin (0) -> thick (7) Slimy Mushy Fluffy (0) -> compact (7) |
3.2 b 4.2 a 4.1 b 3.6 a 4.3 b 4.4 b |
1.3 c 4.3 a 5.7 a 4.0 a 0.9 c 6.3 a |
5.2 a 1.5 b 2.7 c 1.2 b 6.2 a 1.7 c |
5.5 a 1.3 b 2.4 c 1.2 b 6.1 a 1.1 d |
| Mouthfeel | Covering Powdery Homogenous Quantity swollen flak |
4.6 a 2.4 a 3.9 b 0.4 b |
3.0 b 1.0 b 1.1 c 6.7 a |
2.1 c 1.4 b 5.6 a 0.1 c |
1.8 c 1.2 b 5.4 a 0.1 c |
Table 4.
Differences between the four oat products with respect to Empathic Food Test questionnaire parameters (panel of 13 trained observers).
Table 4.
Differences between the four oat products with respect to Empathic Food Test questionnaire parameters (panel of 13 trained observers).
| Parameters | Bauck* | Hipp* | Holle* | TAU®* | p-value |
|---|---|---|---|---|---|
| I feel warm (1)/cold (5) | 2.23 (±0.55) | 2.31 (±0.55) | 2.08 (±0.55) | 1.31 (±0.55) | 0.023 |
| I feel light (1)/dark (5) | 1.85 (±0.54) | 2.69 (±0.54) | 2.69 (±0.50) | 1.75 (±0.50) | 0.095 |
| I feel light (1)/heavy (5) | 2.85 (±0.54) | 2.85 (±0.76) | 2.85 (±0.90) | 2.46 (±0.54) | 0.818 |
| I feel refreshed (1)/exhausted (5) | 2.46 (±0.54) | 3.23 (±0.46) | 3.31 (±0.53) | 2.31 (±0.48) | 0.026 |
| I feel motivated (1)/unmotivated (5) | 2.38 (±0.63) | 3.08 (±0.63) | 3.00 (±0.63) | 2.08 (±0.63) | 0.049 |
| I feel awake (1) /sleepy (5) | 2.38 (±0.65) | 2.85 (±0.65) | 3.08 (±0.65) | 2.00 (±0.65) | 0.021 |
| I feel concentrated (1)/distracted (5) | 2.31 (±0.60) | 3.15 (±0.60) | 3.08 (±0.59) | 2.15 (±0.60) | 0.041 |
| I feel relaxed (1)/nervous (5) | 1.69 (±0.64) | 3.08 (±0.63) | 2.92 (±0.64) | 1.85 (±0.63) | 0.003 |
| I feel comforting (1)/unwell (5) | 2.15 (±0.67) | 3.15 (±0.67) | 3.38 (±0.67) | 1.85 (±0.66) | 0.004 |
| I feel satisfied (1)/unsatisfied (5) | 2.23 (±0.61) | 3.00 (±0.61) | 3.38 (±0.61) | 1.85 (±0.60) | 0.003 |
| I feel balanced (1)/unbalanced (5) | 2.15 (±0.72) | 3.31 (±0.71) | 3.69 (±0.71) | 1.92 (±0.71) | 0.002 |
| I feel the effect long (1)/short (5) | 2.46 (±0.49) | 2.77 (±0.48) | 2.54 (±0.48) | 2.38 (±0.49) | 0.599 |
| EFT mean score-emotional | 2.02 (±0.55) | 3.05 (±0.55) | 3.22 (±0.55) | 1.97 (±0.55) | 0.002 |
| EFT mean score-body | 2.48 (±0.47) | 3.03 (±0.4) | 3.06 (±0.47) | 2.20 (±0.47) | 0.016 |
*Values are mean (confidence interval).
Table 5.
Post hoc analysis of the analysis of pairs of variants with respect to Empathic Food Test questionnaire parameters.
Table 5.
Post hoc analysis of the analysis of pairs of variants with respect to Empathic Food Test questionnaire parameters.
| Difference | SE | p-value | |
|---|---|---|---|
| Differences between TAU® and Holle | |||
| I feel alert/tired | 1.077 | 0.355 | 0.027 |
| I feel relaxed/nervous | 1.077 | 0.429 | 0.05 |
| I feel well/unwell | 1.538 | 0.464 | 0.013 |
| I feel satisfied/unsatisfied | 1.538 | 0.417 | 0.004 |
| I feel balanced/unbalanced | 1.769 | 0.5 | 0.007 |
| EFT mean score-emotional | 12.462 | 0.384 | 0.015 |
| EFT mean score-body | 0.8615 | 0.303 | 0.044 |
| Differences between TAU® and Hipp | |||
| I feel relaxed/nervous | 1.231 | 0.429 | 0.034 |
| I feel well/unwell | 1.308 | 0.464 | 0.039 |
| I feel satisfied/unsatisfied | 1.154 | 0.417 | 0.045 |
| I feel balanced/unbalanced | 1.385 | 0.50 | 0.035 |
| EFT mean score-emotional | 10.769 | 0.384 | 0.032 |
| EFT mean score-body | 0.831 | 0.303 | 0.048 |
| Differences between Bauck and Holle | |||
| I feel relaxed/nervous | 1.231 | 0.429 | 0.016 |
| I feel well/unwell | 1.231 | 0.464 | 0.047 |
| I feel satisfied/unsatisfied | 1.154 | 0.417 | 0.045 |
| I feel balanced/unbalanced | 1.538 | 0.50 | 0.02 |
| EFT mean score-emotional | 12.000 | 0.384 | 0.035 |
| Differences between Bauck and Hipp | |||
| I feel relaxed/nervous | 1.385 | 0.429 | 0.034 |
| EFT mean score-emotional | 10.308 | 0.384 | 0.033 |
P-values in bold indicate statistical significance. SE: standard error.
Table 6.
Post hoc analysis of the analysis of pairs of variants with respect to Empathic Food Test free descriptions observations.
Table 6.
Post hoc analysis of the analysis of pairs of variants with respect to Empathic Food Test free descriptions observations.
| p-value | |||
|---|---|---|---|
| Differences between TAU® and | Holle | Hipp | |
| Total negative observations1) | <0.001 | <0.001 | |
| Total positive observations2) | <0.001 | <0.001 | |
| Cluster “chest”3) | <0.001 | <0.001 | |
| Cluster “relaxed”4) | 0.001 | n.s. | |
| Cluster “alert”5) | <0.001 | <0.001 | |
| Cluster “stabilizing”6) | n.s. | 0.028 | |
| Differences between Bauck and | Holle | Hipp | |
| Total negative observations | <0.001 | <0.001 | |
| Total positive observations | <0.001 | <0.001 | |
| Cluster “relaxed” | 0.041 | n.s. | |
| Cluster “alert” | <0.001 | <0.001 | |
| Differences between Bauck and TAU® | |||
| Total negative observations | <0.001 | ||
| Total positive observations | 0.022 | ||
| Cluster “chest” | <0.001 | ||
| Differences between Hipp and Holle | |||
| Total negative observations | 0.017 | ||
| Total positive observations | 0.048 | ||
| 1). Total of negatively connoted observations 2). Total of positively connoted observations 3). The cluster comprises the observations “chest widens”, “breath deepens”, and “embraces” 4). The cluster comprises the observations “relaxed”, “well”, and “calm” 5). The cluster comprises the observations “alert”, “concentrated”, “bright”, and “upright” 6). The cluster comprises the observations “strengthening”, “stabilizing”, and “good standing” | |||
Table 7.
Post hoc analysis of the analysis of pairs of variants with respect to hedonic sensory testing (SE: Standard error).
Table 7.
Post hoc analysis of the analysis of pairs of variants with respect to hedonic sensory testing (SE: Standard error).
| Difference | SE | p-value | |
|---|---|---|---|
| Differences between TAU® and Holle | |||
| Appearance | 1.200 | 0.264 | <0.001 |
| Differences between TAU® and Hipp | |||
| Appearance | 1.000 | 0.264 | 0.001 |
| Differences between Bauck and TAU® | |||
| Appearance | 1.560 | 0.264 | <0.001 |
| Smell | 0.60 | 0.212 | 0.036 |
| Texture/mouthfeel | 11.19 | 0.332 | 0.007 |
Table 8.
Post hoc analysis of the analysis of pairs of variants with respect to Empathic Food Test questionnaire parameters (15 untrained observers).
Table 8.
Post hoc analysis of the analysis of pairs of variants with respect to Empathic Food Test questionnaire parameters (15 untrained observers).
| Difference | SE | p-value | |
|---|---|---|---|
| Differences between TAU® and Holle | |||
| I feel warm/cold | 1.267 | 0.43 | 0.023 |
| Differences between TAU® and Hipp | |||
| I feel warm/cold | 1.533 | 0.43 | 0.004 |
| Differences between Bauck and Hipp | |||
| I feel warm/cold | 1.267 | 0.43 | 0.023 |
P-values in bold indicate statistical significance. SE: standard error.
Table 9.
Post hoc analysis of the analysis of pairs of variants with respect to Empathic Food Test free description observations (15 untrained observers).
Table 9.
Post hoc analysis of the analysis of pairs of variants with respect to Empathic Food Test free description observations (15 untrained observers).
| p-value | |||
|---|---|---|---|
| Differences between TAU® and Holle | |||
| Total negative observations1) | 0.001 | ||
| Total positive observations2) | <0.001 | ||
| Cluster “relaxed”3) | <0.001 | ||
| Differences between TAU® and Hipp | |||
| Total negative observations | <0.001 | ||
| Total positive observations | <0.001 | ||
| Cluster “relaxed” | 0.016 | ||
| Differences between Bauck and Holle | |||
| Total positive observations | <0.001 | ||
| Cluster “relaxed” | <0.001 | ||
| Differences between Bauck and TAU® | |||
| Total positive observations | 0.003 | ||
| Differences between Hipp and Holle | |||
| Total positive observations | <0.001 | ||
| Cluster “relaxed” | 0.005 | ||
| 1) Total of negatively connoted observations 2) Total of positively connoted observations 3) The cluster comprises the observations “relaxed”, “well”, and “calm” | |||
Table 10.
Chemical analysis of oat products.
| Holle | Hipp | Bauck | TAU® | |||
|---|---|---|---|---|---|---|
| Acrylamide | µg/kg | < 10 | 11 | < 10 | 21 | |
| Total fat content | g/100 g | 6.4 | 6.8 | 6.5 | 5.0 | |
| Saturated fatty acids | g/100 g | 1.2 | 1.3 | 1.1 | 0.9 | |
| Monounsaturated fatty acids | g/100 g | 2.6 | 2.7 | 2.7 | 2.0 | |
| Polyunsaturated fatty acids | g/100 g | 2.6 | 2.9 | 2.7 | 2.1 | |
| Lysine | g/100 g | <0.01 | <0.01 | <0.01 | 0.01 | |
| Vitamin B1 (thiamine) | mg/100 g | 1.05 | 1.36 | 0.310 | 0.171 | |
| Total folate (vitamin B9) | µg/100 g | 22.5 | 24.2 | 20.4 | 12.1 | |
Disclaimer/Publisher’s Note: The statements, opinions and data contained in all publications are solely those of the individual author(s) and contributor(s) and not of MDPI and/or the editor(s). MDPI and/or the editor(s) disclaim responsibility for any injury to people or property resulting from any ideas, methods, instructions or products referred to in the content. |
© 2025 by the authors. Licensee MDPI, Basel, Switzerland. This article is an open access article distributed under the terms and conditions of the Creative Commons Attribution (CC BY) license (http://creativecommons.org/licenses/by/4.0/).
Copyright: This open access article is published under a Creative Commons CC BY 4.0 license, which permit the free download, distribution, and reuse, provided that the author and preprint are cited in any reuse.


