Submitted:
03 December 2025
Posted:
04 December 2025
You are already at the latest version
Abstract
This study investigated the properties of red algae (RA) biocomposite films reinforced with natural sisal fibers and plasticized with glycerol. The polymer was extracted from locally sourced red seaweed and combined sisal fibers at varying loadings (0–45 wt%) using the doctor blading technique. Composite films were analyzed using a variety of methods to evaluate the chemical composition, thermal behavior and mechanical perfor-mance. Infrared spectroscopy confirmed the presence of kappa-carrageenan as the domi-nant polysaccharide in the RA matrix, whereas elemental analysis verified the dilution of sulfur content and enrichment of carbon with increasing fiber incorporation. Thermal analysis revealed that thermal stability increased with fiber loading, peaking at 30 wt% sisal fiber before decreasing slightly at 45 wt% due to poor fiber dispersion. Mechanical testing demonstrated an optimal balance between strength and flexibility at 30 wt% sisal fiber, where tensile strength and modulus improved increased by more than 40% com-pared to the pure RA film. Overall, the findings demonstrate that sisal fiber reinforcement enhances the structural integrity and stability of RA-based films, supporting their poten-tial as biodegradable alternatives to petroleum-based plastics.
Keywords:
red algae polymer
; sisal fibers
; biocomposite
; thermal analysis
; mechanical analysis
; κ-carrageenan
; kappa-carrageenan
; doctor blading
1. Introduction
Developing effective and sustainable alternatives to traditional petroleum plastics is one of the primary problems faced by the scientists and engineers of this generation. In recent years, researchers have investigated on red algae (RA) polysaccharides in their search for sustainable alternatives to petroleum-based materials. These biopolymers have the advantage of being renewable, carbon negative and have a simple, eco-friendly extraction process due to their water solubility [1]. RA contains thousands of species, most of which are marine, that can be readily found in oceans all over the world. Their cell walls and intercellular matrices are often composed of unique polysaccharides called sulfated galactans. One such sulfated galactan is carrageenan, a common food additive utilized for stabilization and gelling [2]. Unlike brown algae-derived biopolymers, the polymers in RA can be extracted without the need for any pH treatment,3 leading to gentler processing conditions for biopolymer creation and increasing the range of applications. For example, researchers have used RA in various fields such as nanotechnology, biomedical coatings, battery applications, adhesives and green concrete [3,4,5,6,7,8,9,10,11,12,13,14,15,16,17,18,19,20,21,22,23,24].
Despite its promising applications, the mechanical and thermal properties of RA materials are generally inferior to those of petroleum-based plastics [25]. Dang et al. [1]. recently provided a comprehensive overview of different algae-based materials. The authors demonstrated that polysaccharide properties are affected by the amount of glycolic bonds, degree of branching and functional groups. Overall, RA polymers were found to exhibit brittle tensile properties due to strong hydrogen bonding.
A common way to improve the elasticity of brittle polymers is by incorporating plasticizers. These molecules increase the space between chains, leading to enhanced material ductility, which also tends to reduce mechanical strength. Common plasticizers include glycerol, polypropylene glycol and fructose.1 Recently, Jang et al. [3] compared the effect of several different plasticizers on RA films produced by solution casting. The authors determined that fructose acted as the best plasticizer, with glycerol also providing satisfactory results. The authors also incorporated nanoclays, which increased mechanical properties relative to pure films, offsetting the mechanical loss due to plasticization.
Incorporating reinforcements such as mineral fillers or fibers is a common technique to increase tensile strength. Chopped natural fibers have been incorporated into biopolymers to improve the mechanical properties. For example, fibers such as sisal [26], kenaf [27] and chitin whiskers [28] have been added to various polymer matrices to enhance strength and thermal properties. Sisal fibers are sometimes referred to as sisal hemp and are especially favored for their good mechanical properties and low water absorption. Gudayu et al. [26] used short sisal fibers as reinforcement in PET thermoplastic injection-molded parts. With 40 wt% of sisal, they were able to improve tensile modulus of the PET by 137%. Accordingly, when used in conjunction with a plasticizer, fiber reinforcements can create a strong yet flexible composite material from an otherwise weak and brittle biopolymer.
This research aims create a series of biocomposite films by building on the works of Jang et al. [3] and Gudayu et al. [26] A solution of naturally-sourced RA and glycerol will be reinforced with chopped sisal fibers at different loading to elucidate the effect of fibers on the resulting chemical, thermal and mechanical properties. Moreover, these biocomposites will be produced using a technique called doctor blading [29], which is a processing technique commonly used in the electronics industry but is not often applied to biopolymers. The goal of this study is to examine fundamental structural property relationships in fiber-reinforced composites to facilitate their application as alternative to petroleum-plastics.
2. Materials and Methods
RA was collected from a beach in Monterey, CA. Sisal fibers were purchased from a local craft store and glycerol was obtained from Fisher Chemical.
2.2. RA Polymer Extraction
Figure 1 shows the RA preparation method. First, RA was washed with DI water to remove any large debris. The polymer was then dried and pulsed in a Mr. Coffee bullet blender to produce a course powder. Approximately 2 g of RA pieces were then added to ~125 mL of DI water and stirred on a hot plate at medium heat for 15 minutes. Afterwards, the heat was turned off, and the mixture was allowed to continue stirring overnight. The mixture was then filtered through a fine Nylon mesh bag to remove large particles and centrifuged at 5000 rpm for 10 minutes using a LAB Fish LC-8S centrifuge. The resulting supernatant was placed in a large ceramic mortar bowl and dried overnight at 60 °C in a Standard Environmental Systems EB/3 evaporating oven. Finally, the resulting dried RA polymer was then ground into a powder and stored for later use.
2.3. Sisal Fiber Preparation
Sisal fibers were prepared by first cutting the fibers with scissors into small pieces. Next, they were repeatedly processed using a KONA manual ceramic burr coffee grinder until they were a powder consistency, as shown in Figure 2.
2.4. Composite Precursor Preparation
To create the precursor solution for each film, the dried RA polymer was mixed with DI water under low heat to generate a 10 wt % solution. After a homogenous solution was formed, glycerol was added at a 50:50 mass ratio of RA polymer to plasticizer and the solution stirred at 40-50 °C for approximately 15 minutes to ensure full homogenization. The precursor solution was then allowed to sit so that any bubbles created from the mixing process could rise to the top of the mixture. Finally, the processed sisal fibers were added to the precursor and stirred gently to evenly distribute fibers without creating air bubbles.
2.5. Doctor Blading Film Preparation
Films were generated via doctor blading technique using a 20 x 20 cm glass pane as a base and 7.5 x 2.5 x 0.1 cm glass slides stacked two deep. The pieces of glass were arranged to create a rectangular enclosure approximately 7.6 x 6 x 0.2 mm (see Figure 3). The precursor was then applied to the mold by pouring the solution onto one edge of the rectangle and using the edge of an additional slide to evenly spread the composite mixture across the entire surface of the enclosure. The cast precursor was then left in a fume hood to dry overnight. Finally, the resulting dried film was removed from the mold and further dried in an Econotherm laboratory oven at approximately 60 °C for 30 minutes to an hour to remove any excess moisture.
2.6. Film Characterization
2.6.1. Chemical Characterization
The surface of each film was examined in attenuated total reflection (ATR) mode using a Thermo-Nicolet iS50 Fourier Transform Infrared (FTIR) spectrometer. OMNIC 9.0 software was used to perform data analysis.
XRF was performed on films (N=3) using a Rigaku Primus II WDXRF with a Rhodium x-ray tube source. The films were cut to a diameter of 20 mm. The instrument was operated in a vacuum atmosphere. Quantification was performed using the Fundamental Parameters standardless quantification software associated with the system. The fundamental parameters approach uses x-ray physics coupled with established sensitivity factors for pure elements. Relative accuracy by this method usually ranges from better than 5% up to ~20% for major elements. ZSX software was used for data processing.
2.6.2. Thermal Characterization
TGA analysis was performed on films (N=2) using a TA Instruments TGA5500 on ~5-10 mg of sample. Samples were heated at 10 °C/min from 30 °C to 600 °C under N2 flow, followed by air at 10 °C/min until 700 °C. Trios Software was used for data processing. DSC analysis was performed on films (N=2) using a TA Instruments Q20 on 10-20 mg of sample. Samples were heated at 10 °C/min from 30 °C to 200 °C under N2 flow.
2.6.3. Mechanical Characterization
Tensile testing on films (N=5) was conducted on an Instron tensile tester 3342 machine following the ASTM D882 standards for tensile testing of thin films less than 1.0 mm in thickness. The tests utilized a 1 kN load cell at a strain rate of 2.5 mm/minute. The samples were cut to 50 mm in length, 1 cm in width, and approximately 0.1 mm in thickness.
3. Results
3.1. Film Formation
RA films were created using a 10 wt% stock solution of RA and 50 wt% glycerol with varying concentrations of sisal fibers (see Figure 4).
3.2. Chemical Characterization
3.2.1. ATR-FTIR
ATR-FTIR was used to identify the molecular structure and confirm the type of polysaccharide present in the RA film. Figure 5 compares the FTIR spectrum of the pure RA film with a reference carrageenan spectrum from the Wiley BioRad library. The similarity between the two FTIR spectra confirms that the primary polysaccharide in the film is carrageenan. The presence of absorption peaks at 925 and 845 cm−1 indicates that this material is likely kappa-carrageenan [30]. The FTIR results also suggest that the extraction procedure preserved the sulfate ester group, as evidenced by the absorption peaks near 1210 and 1030-1070 cm−1 in Figure 5 [31,32]. Confirming the presence of a carrageenan backbone is consistent with the high content of sulfur and propensity for water absorption discussed later [33]. Finally, the intensity of the peak at 1641 cm−1 coupled with the peak at 1548 cm−1 suggest that polyamides or residual proteins were also detected in the extracted RA biopolymer [32].
Figure 6 compares FTIR spectra of biocomposite films plasticized with glycerol at different fiber loadings. Absorption peaks at 3347, 927 and 856 cm−1 and doublet peaks at 2935 and 2880 cm−1 confirm the presence of glycerol in the films. Moreover, all plasticized films exhibit similar FTIR spectra at different sisal loadings. Table 1 provides the FTIR peak assignment for the various vibrations observed in the plasticized films.
3.2.2. XRF
XRF analysis was conducted to determine the elemental composition of the RA and sisal-based composite films and the results are shown in Table 2. Sisal fibers contained high levels of oxygen (61.5 wt%) and carbon (36.8 wt%) due to their high cellulose content. The control RA film (0% sisal) also contained high oxygen content (64.5 wt%), but far less carbon (12.8 wt%) than sisal. Moreover, a much higher sulfur concentration (10.6 wt%) was detected in the pure RA film compared to sisal fiber (0.045 wt%). High sulfur content is characteristic of sulfated polysaccharides such as carrageenan. Figure 7 demonstrates that sulfur content was inversely proportional to fiber loading. Note that the 45 wt% film had a higher sulfur content than expected, likely due to inhomogeneity. These results suggest that sulfur and carbon content may provide a benchmark by which to measure fiber mixing within the sulfated carrageenan/glycerol matrix. Composite films also contained minor elements such as potassium, sodium, calcium, chlorine, and magnesium, which may be due to their marine origin.
3.3. Thermal and Mechanical Analysis
3.3.1. Thermogravimetric Analysis
TGA analysis was performed on the biocomposite films and the results are shown in Table 3 and Figure 8. For all sample except the pure sisal fiber, the most significant mass loss event occurred in the temperature range of approximately 200 to 300 °C, corresponding to the decomposition of the glycerol plasticizer and functional groups on the RA polymer chain. The second major transition around 400 °C is due to the degradation of the polymer backbone. Initially, at low fiber loadings, the first Tmax slight decreased from 227 ˚C for pure RA film to 221˚C for the 15 wt% sisal composite film. However, the 30 wt% composite film showed an increase in Tmax by more than 20 ˚C to 248 °C. At highest fiber loading of 45 wt%, the Tmax value decreases slightly (239 ˚C), remaining significantly higher than that of the pure RA film. These results confirm that proper fiber dispersion is critical for realizing an optimum balance between mechanical and thermal properties. The sisal fiber reinforces the polymer matrix, decreasing the mobility of RA chains in the composite.
TGA analysis also revealed interesting results about the volatile and residue content of the biopolymers. The pure film had the highest amount of volatiles at 9.5 wt%, whereas the composite films showed lower values ranging from 9.2 w% to 8.2 wt%. This suggests that introduction of sisal fiber suppresses water absorption in the film. With respect to residue produced at the end of the decomposition, pure sisal fiber showed the lowest value of 1.9 wt%, whereas the pure RA film was 9.2 wt %, with the composite films showing values in between. These results suggests that the high sulfur content of the RA polymer is likely contributing to the elevated residue content by producing charring species at elevated temperatures [34].
3.3.2. Differential Scanning Calorimetry (DSC)
DSC thermal analysis was conducted on biocomposite films and the results are summarized in Table 3 and Figure 9. DSC analysis shows that the heat flow corresponding to the water absorption of the composites decreased at higher fiber loadings. In fact, the 45% fiber sample value had the lowest water absorption value of the composites at 199 J/g compared to 292 J/g for pure RA film. Consistent with the TGA results, introduction of sisal fiber likely decreases hydrogen bonding, leading to decreased water absorption [35].
3.3.3. Mechanical Testing
Tensile testing was conducted to determine the effect of varying sisal fiber content on mechanical properties and the results are summarized in Table 3 and Figure 10. Attempts to generate dog bones of RA films were not successful due to the brittleness of the pure biopolymer. The plasticized RA film exhibited an ultimate tensile strength of 1.76 MPa and a strain at break of 0.67%. In contrast, the strongest composite (30 wt% fiber) increased the strength by more than 40% to 2.49 MPa, while maintaining the same elongation at break. This result indicates that the composite material exhibits significantly higher toughness compared to the pure polymer. The modulus also showed a steady increase, even for the composite with the lowest fiber loading (15 wt%) with a nearly 2-fold increase from 3.10 GPa to 5.96 GPa. This result confirms the reinforcing effect of sisal fiber, agreeing with previous studies.26 At the highest fiber loading (45 wt% sisal), the modulus increased three-fold to 15.0 GPa. However, the elongation at break was significantly lower, suggesting too much fiber loading, leading to embrittlement.
The incorporation of sisal fibers into the RA films allowed for improved mechanical and thermal properties. The thermal and mechanical data, when taken altogether, suggests that the ideal fiber loading for this set is 30 wt% sisal fiber.
4. Discussion
This study successfully investigated the effect of sisal fiber on RA composites. Composite films were created using a series of simple processes: polymer extraction, plasticization, fiber incorporation and film casting utilizing the doctor blading method. XRF characterization of the pure film revealed high sulfur content, consistent with the kappa-carrageenan species detected by FTIR. As fiber loading increased, sulfur content decreased, confirming successful incorporation of the sisal fiber into the biopolymer matrix. Compared to the pure RA film, the sisal biocomposites showed enhanced mechanical and thermal properties. DSC and TGA revealed that increasing fiber content led to decreased water absorption, ultimately resulting in reduced volatiles and char content. At very high fiber content (45 wt% sisal), poor dispersion was accompanied by lower mechanical and thermal properties. These results suggest that an optimal fiber loading is 30 wt% sisal fiber, which showed a 40% increase in strength and modulus, while maintaining the same elongation at break. Moreover, the degradation temperature also increased by 20 °C properties. Overall, these findings are promising and warrant further investigation. For example, these composites can be further optimized by applying a coating onto the fibers to enhance the matrix-fiber interface. Similarly, other plasticizers and exploring different loadings can be explored to improve mechanical properties.
Author Contributions
“Conceptualization, Y.S., J.B and N.S.; methodology and investigation Y.S., J.B and N.S.; J.B and N.S. sample preparation and characterization; data analysis: M.R.; M.R. writing—original draft preparation, M.R and Y.S. writing—review and editing, Y.S.; supervision and project administration, X.X.; funding acquisition, Y.Y. All authors have read and agreed to the published version of the manuscript.”.
Funding
This research received no external funding.
Data Availability Statement
Data supporting the results will be available upon request.
Acknowledgments
We acknowledge the assistance of Vuong Do in various characterization experiments.
Conflicts of Interest
The authors declare no conflicts of interest.
Abbreviations
The following abbreviations are used in this manuscript:
| MDPI | Multidisciplinary Digital Publishing Institute |
| DOAJ | Directory of open access journals |
| TLA | Three letter acronym |
| LD | Linear dichroism |
References
- Dang, B.-T.; Bui, X.-T.; Tran, D. P. H.; Hao Ngo, H.; Nghiem, L. D.; Hoang, T.-K.-D.; Nguyen, P.-T.; Nguyen, H. H.; Vo, T.-K.-Q.; Lin, C.; Yi Andrew Lin, K.; Varjani, S. Current Application of Algae Derivatives for Bioplastic Production: A Review. Bioresour. Technol. 2022, 347(126698), 126698. [Google Scholar] [CrossRef] [PubMed]
- Usov, A. I. Polysaccharides of the Red Algae. In Advances in Carbohydrate Chemistry and Biochemistry; Academic Press, 2011; Vol. 65, pp. pp 115–217. [Google Scholar]
- Jang, S. A.; Shin, Y. J.; Seo, Y. B.; Song, K. B. Effects of Various Plasticizers and Nanoclays on the Mechanical Properties of Red Algae Film. J. Food Sci. 2011, 76(3), N30–4. [Google Scholar] [CrossRef] [PubMed]
- Oliveira, S.; Sousa, I.; Raymundo, A.; Bengoechea, C. Three-Dimensional Printing of Red Algae Biopolymers: Effect of Locust Bean Gum on Rheology and Processability. Gels 2024, 10(3), 166. [Google Scholar] [CrossRef] [PubMed]
- Gopu, M.; Selvam, K. Polysaccharides from Marine Red Algae Amphiroa Rigida and Their Biomedical Potential: An in-Vitro Study. Biocatal. Agric. Biotechnol. 2020, 29(101769), 101769. [Google Scholar] [CrossRef]
- Kuznetsova, T. A.; Andryukov, B. G.; Besednova, N. N.; Zaporozhets, T. S.; Kalinin, A. V. Marine Algae Polysaccharides as Basis for Wound Dressings, Drug Delivery, and Tissue Engineering: A Review. J. Mar. Sci. Eng. 2020, 8(7), 481. [Google Scholar] [CrossRef]
- Lacoste, C.; El Hage, R.; Bergeret, A.; Corn, S.; Lacroix, P. Sodium Alginate Adhesives as Binders in Wood Fibers/Textile Waste Fibers Biocomposites for Building Insulation. Carbohydr. Polym. 2018, 184, 1–8. [Google Scholar] [CrossRef]
- Sahu, S.; Singh, G.; Arya, S. K. Bioplastics and Biopolymers from Algae: Manufacturing and Applications. In Value Added Products From Bioalgae Based Biorefineries: Opportunities and Challenges; Springer Nature Singapore: Singapore, 2024; pp. pp 237–258. [Google Scholar]
- Devadas, V. V.; Khoo, K. S.; Chia, W. Y.; Chew, K. W.; Munawaroh, H. S. H.; Lam, M.-K.; Lim, J.-W.; Ho, Y.-C.; Lee, K. T.; Show, P. L. Algae Biopolymer towards Sustainable Circular Economy. Bioresour. Technol. 2021, 325(124702), 124702. [Google Scholar] [CrossRef]
- Madera-Santana, T. J.; Robledo, D.; Freile-Pelegrín, Y. Physicochemical Properties of Biodegradable Polyvinyl Alcohol-Agar Films from the Red Algae Hydropuntia Cornea. Mar. Biotechnol. (NY) 2011, 13(4), 793–800. [Google Scholar] [CrossRef]
- Chen, Y. W.; Lee, H. V.; Juan, J. C.; Phang, S.-M. Production of New Cellulose Nanomaterial from Red Algae Marine Biomass Gelidium Elegans. Carbohydr. Polym. 2016, 151, 1210–1219. [Google Scholar] [CrossRef]
- Carpintero, M.; Marcet, I.; Rendueles, M.; Díaz, M. Algae as an Additive to Improve the Functional and Mechanical Properties of Protein and Polysaccharide-Based Films and Coatings. A Review of Recent Studies. Food Packag. Shelf Life 2023, 38(101128), 101128. [Google Scholar] [CrossRef]
- Alazaiza, M. Y. D.; Albahnasawi, A.; Eyvaz, M.; Al Maskari, T.; Nassani, D. E.; Abu Amr, S. S.; Abujazar, M. S. S.; Bashir, M. J. K. An Overview of Green Bioprocessing of Algae-Derived Biochar and Biopolymers: Synthesis, Preparation, and Potential Applications. Energies 2023, 16(2), 791. [Google Scholar] [CrossRef]
- Joshi, J. S.; Langwald, S. V.; Ehrmann, A.; Sabantina, L. Algae-Based Biopolymers for Batteries and Biofuel Applications in Comparison with Bacterial Biopolymers-A Review. Polymers (Basel) 2024, 16(5), 610. [Google Scholar] [CrossRef] [PubMed]
- Nagarajan, D.; Senthilkumar, G.; Chen, C.-W.; Karmegam, N.; Praburaman, L.; Kim, W.; Dong, C.-D. Sustainable Bioplastics from Seaweed Polysaccharides: A Comprehensive Review. Polym. Adv. Technol. 2024, 35(8). [Google Scholar] [CrossRef]
- Jumaidin, R.; Sapuan, S. M.; Jawaid, M.; Ishak, M. R.; Sahari, J. Seaweeds as Renewable Sources for Biopolymers and Its Composites: A Review. Curr. Anal. Chem. 2018, 14(3), 249–267. [Google Scholar] [CrossRef]
- Muthukumar, J.; Chidambaram, R. Development of Sulfated Polysaccharide-based Film Reinforced with Seaweed Biomass-derived Nanofillers. J. Appl. Polym. Sci. 2024, 141(3). [Google Scholar] [CrossRef]
- Mohammadyan-Yasouj, S. E.; Abbastabar Ahangar, H.; Ahevani Oskoei, N.; Shokravi, H.; Rahimian Koloor, S. S.; Petrů, M. Thermal Performance of Alginate Concrete Reinforced with Basalt Fiber. Crystals (Basel) 2020, 10(9), 779. [Google Scholar] [CrossRef]
- James, J.; Verma, M.; Sharma, N. Nanotechnology-Driven Improvisation of Red Algae-Derived Carrageenan for Industrial and Bio-Medical Applications. World J. Microbiol. Biotechnol. 2023, 40(1), 4. [Google Scholar] [CrossRef]
- Yushada, A.; Nurjannah, S.; Rasidi, R.; Siti, N.; Ishak, W. M. F. Mechanical Properties of Particleboard from Seaweed (Kappaphycus Alvarezii); Author(s), 2018. [Google Scholar]
- Reinforcing Effects of Seaweed Nanoparticles in Agar- Based Biopolymer Composite: Physical, Water Vapor Barrier. In Mechanical, and Biodegradable Properties.
- Hadi, A.; Nawab, A.; Alam, F.; Zehra, K. Sustainable Alginate/Aloe Vera Composite Biodegradable Films Reinforced with Carboxymethyl Cellulose and Hydroxypropyl Methylcellulose. Polym. Compos. 2022, 43(6), 3471–3480. [Google Scholar] [CrossRef]
- Dey, K.; Khan, R. A.; Chowdhury, A. M. S. Study on the Mechanical, Degradation, and Interfacial Properties of Calcium Alginate Fiber-Reinforced Polyethylene Oxide Composites. J. Thermoplast. Compos. Mater. 2012, 25(7), 807–819. [Google Scholar] [CrossRef]
- Ulrich, G. D.; Faez, R. Thermal, Mechanical and Physical Properties of Composite Films Developed from Seaweed Polysaccharides/Cellulose Nanofibers. J. Polym. Environ. 2022, 30(9), 3688–3700. [Google Scholar] [CrossRef]
- Kumari, S.; Rao, A.; Kaur, M.; Dhania, G. Petroleum-Based Plastics versus Bio-Based Plastics: A Review. Nat. Environ. Pollut. Technol. 2023, 22(3), 1111–1124. [Google Scholar] [CrossRef]
- Gudayu, A. D.; Steuernagel, L.; Meiners, D.; Woubou, A. M. Sisal Fiber Reinforced Polyethylene Terephthalate Composites; Fabrication, Characterization and Possible Application. Polym. Polym. Compos. 2022, 30, 09673911221103317. [Google Scholar] [CrossRef]
- Saad, F.U.S.M.; Salim, N.; Roslan, R. Physical and Mechanical Properties of Kenaf/Seaweed Reinforced Polypropylene Composite. Mater. Today 2022, 51, 1372–1375. [Google Scholar] [CrossRef]
- Watthanaphanit, A.; Supaphol, P.; Tamura, H.; Tokura, S.; Rujiravanit, R. Fabrication, Structure, and Properties of Chitin Whisker-Reinforced Alginate Nanocomposite Fibers. J. Appl. Polym. Sci. 2008, 110(2), 890–899. [Google Scholar] [CrossRef]
- Patil, G. C. Doctor Blade: A Promising Technique for Thin Film Coating. In Simple Chemical Methods for Thin Film Deposition; Springer Nature Singapore: Singapore, 2023; pp. pp 509–530. [Google Scholar]
- Vandanjon, L.; Burlot, A.-S.; Zamanileha, E. F.; Douzenel, P.; Ravelonandro, P. H.; Bourgougnon, N.; Bedoux, G. The Use of FTIR Spectroscopy as a Tool for the Seasonal Variation Analysis and for the Quality Control of Polysaccharides from Seaweeds. Mar. Drugs 2023, 21(9), 482. [Google Scholar] [CrossRef]
- Infrared Spectroscopy. Msu.edu. Available online: https://www2.chemistry.msu.edu/faculty/reusch/VirtTxtJml/Spectrpy/InfraRed/infrared.htm (accessed on 21 October 2025).
- Sadat, A.; Joye, I. J. Peak Fitting Applied to Fourier Transform Infrared and Raman Spectroscopic Analysis of Proteins. Appl. Sci. (Basel) 2020, 10(17), 5918. [Google Scholar] [CrossRef]
- Kokkuvayil Ramadas, B.; Rhim, J.-W.; Roy, S. Recent Progress of Carrageenan-Based Composite Films in Active and Intelligent Food Packaging Applications. Polymers (Basel) 2024, 16(7), 1001. [Google Scholar] [CrossRef]
- Jiang, G.; Xiao, Y.; Qian, Z.; Yang, Y.; Jia, P.; Song, L.; Hu, Y.; Ma, C.; Gui, Z. A Novel Phosphorus-, Nitrogen- and Sulfur-Containing Macromolecule Flame Retardant for Constructing High-Performance Epoxy Resin Composites. Chem. Eng. J. 2023, 451(137823), 137823. [Google Scholar] [CrossRef]
- Lima, P. R. L.; Santos, H. M.; Camilloto, G. P.; Cruz, R. S. Effect of Surface Biopolymeric Treatment on Sisal Fiber Properties and Fiber-Cement Bond. J. Eng. Fiber. Fabr. 2017, 12(2), 155892501701200. [Google Scholar] [CrossRef]
Figure 1.
RA solution preparation method. This figure outlines the extraction steps used to obtain RA polysaccharides, including washing, drying, blending, heating, filtering, and centrifugation. The final drying and grinding stages produce the solid polymer material used in subsequent film fabrication.
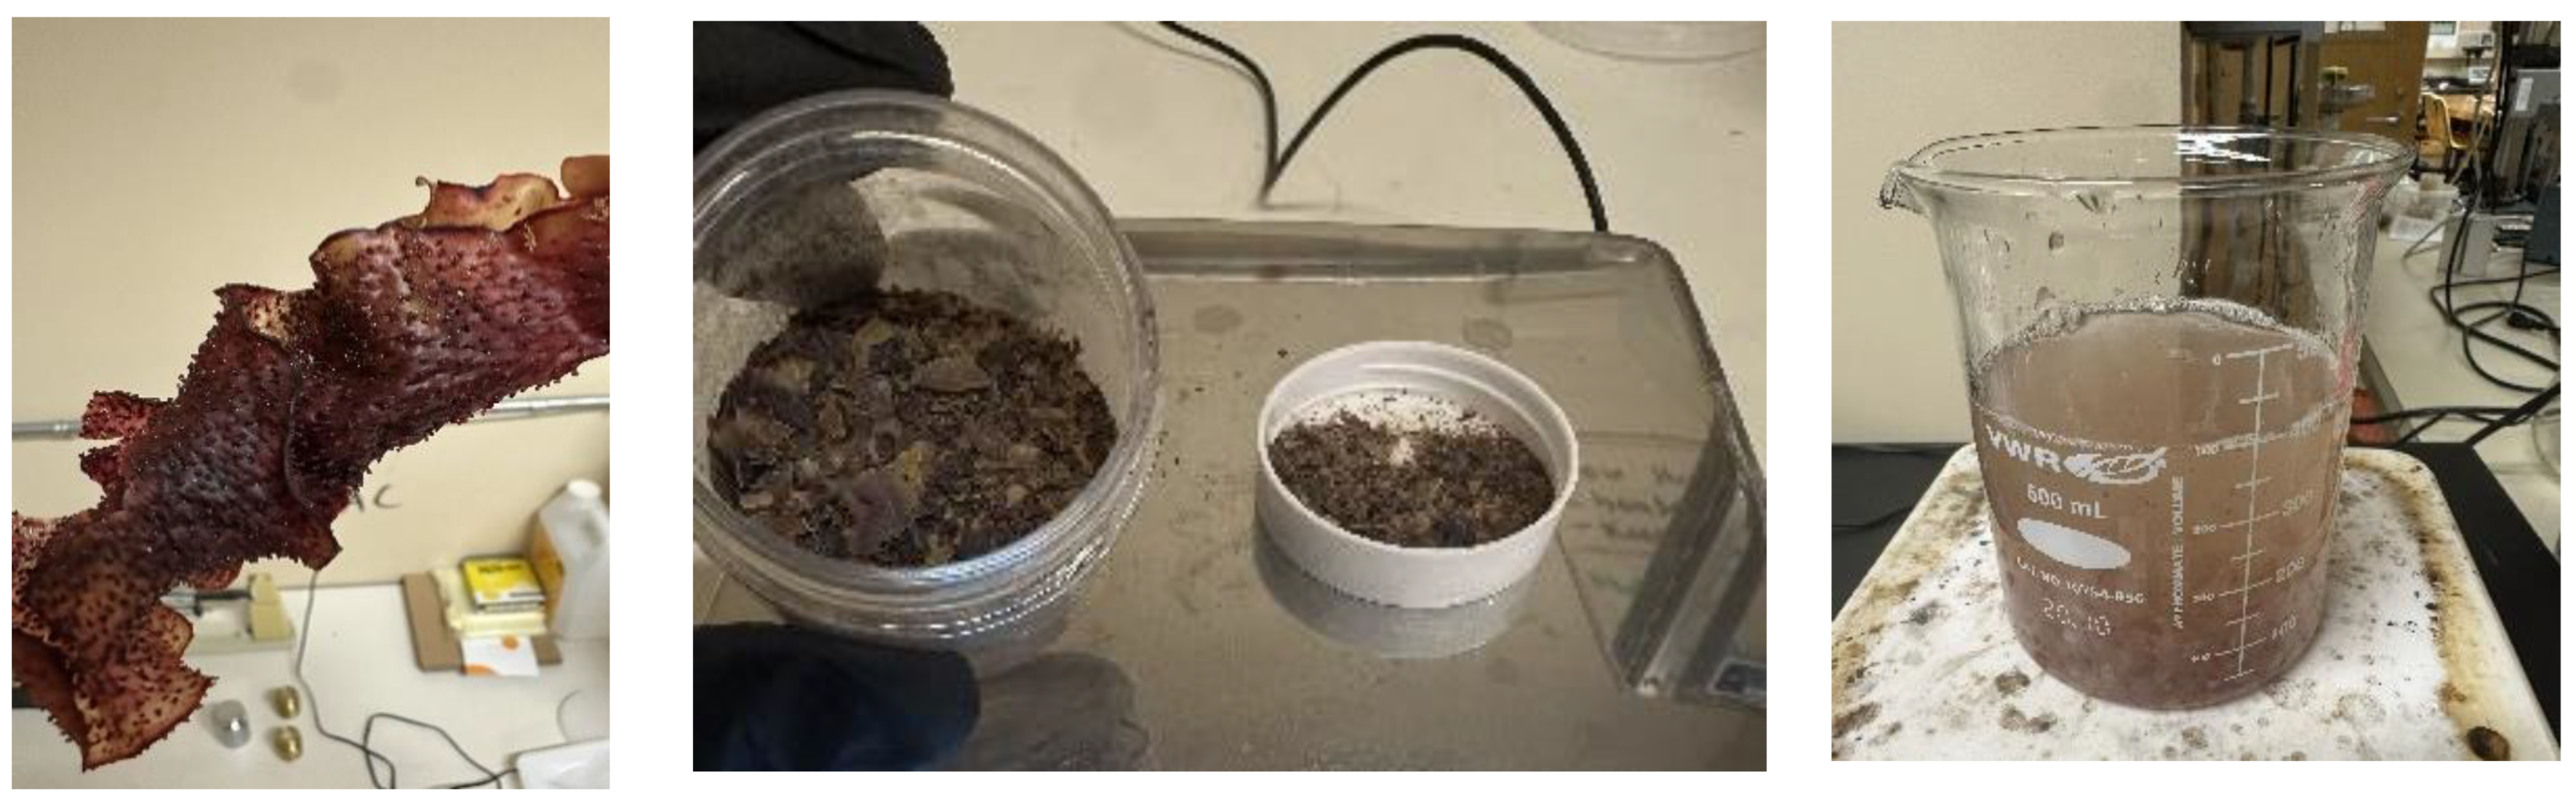
Figure 2.
The sisal fiber preparation method involves cutting raw fibers into short segments and then grinding them to a fine powder using a ceramic burr grinder. This process improves the fiber dispersion within the RA–glycerol matrix.
Figure 2.
The sisal fiber preparation method involves cutting raw fibers into short segments and then grinding them to a fine powder using a ceramic burr grinder. This process improves the fiber dispersion within the RA–glycerol matrix.
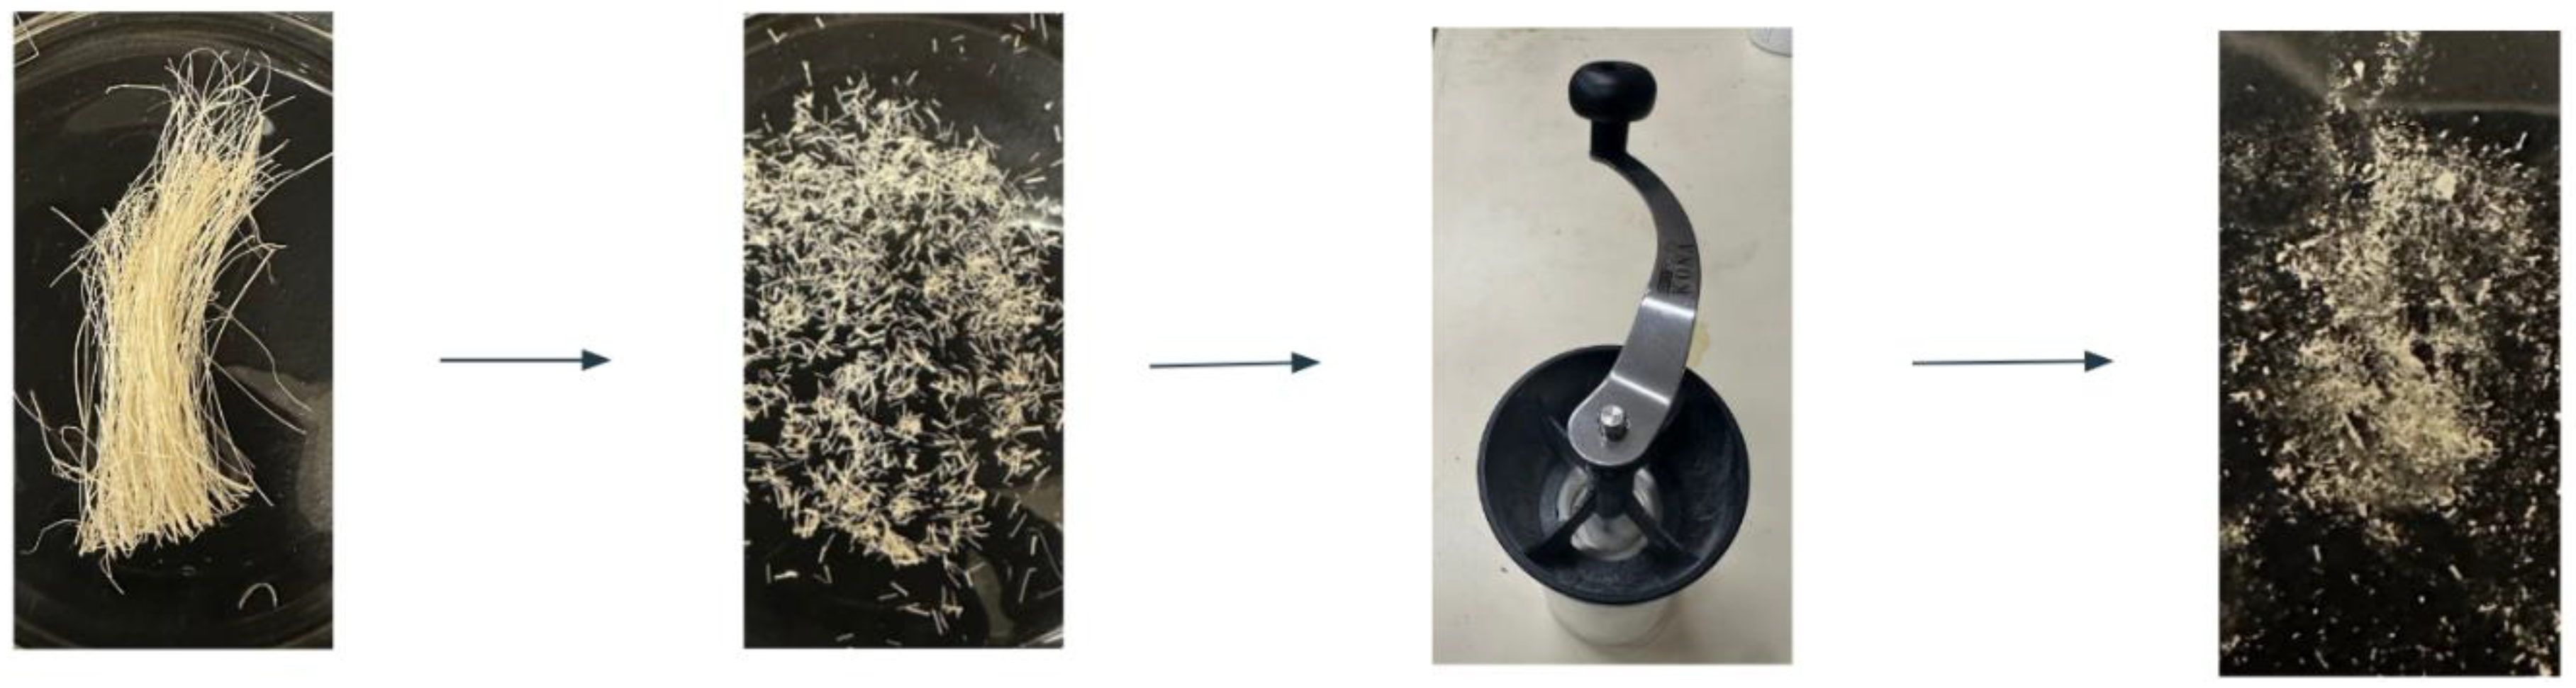
Figure 3.
Composite casting method with doctor-blading. The left image displays the wet precursor layer spread within a fixed-height glass mold using the doctor-blading technique. The right image shows the dried film, highlighting the reduction in thickness and uniform appearance after solvent evaporation.
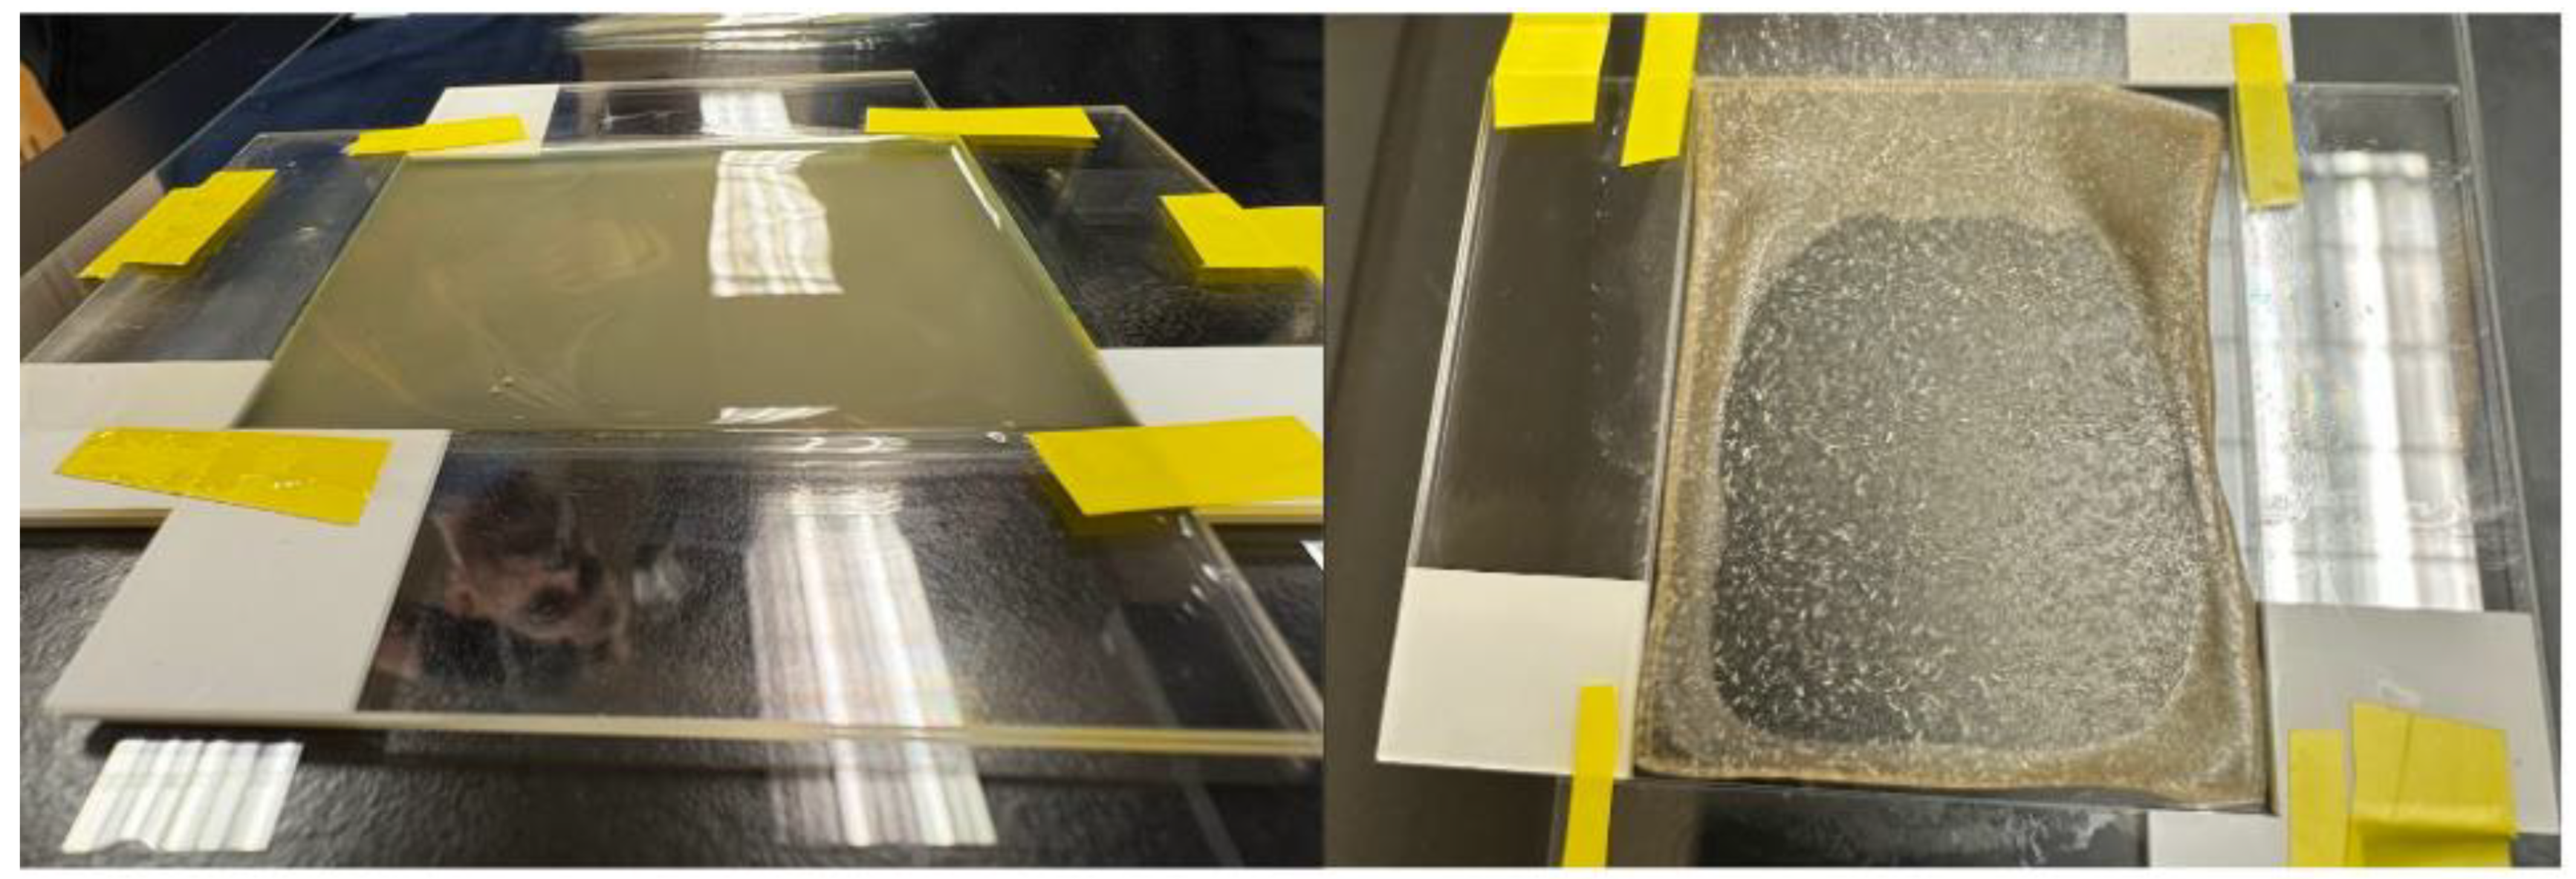
Figure 4.
Composite RA films with varying sisal fiber concentration. This figure presents films containing 0–45 wt% sisal fiber, showing a progression from transparent to increasingly opaque. The change in appearance reflects higher fiber content and reduced matrix uniformity.
Figure 4.
Composite RA films with varying sisal fiber concentration. This figure presents films containing 0–45 wt% sisal fiber, showing a progression from transparent to increasingly opaque. The change in appearance reflects higher fiber content and reduced matrix uniformity.
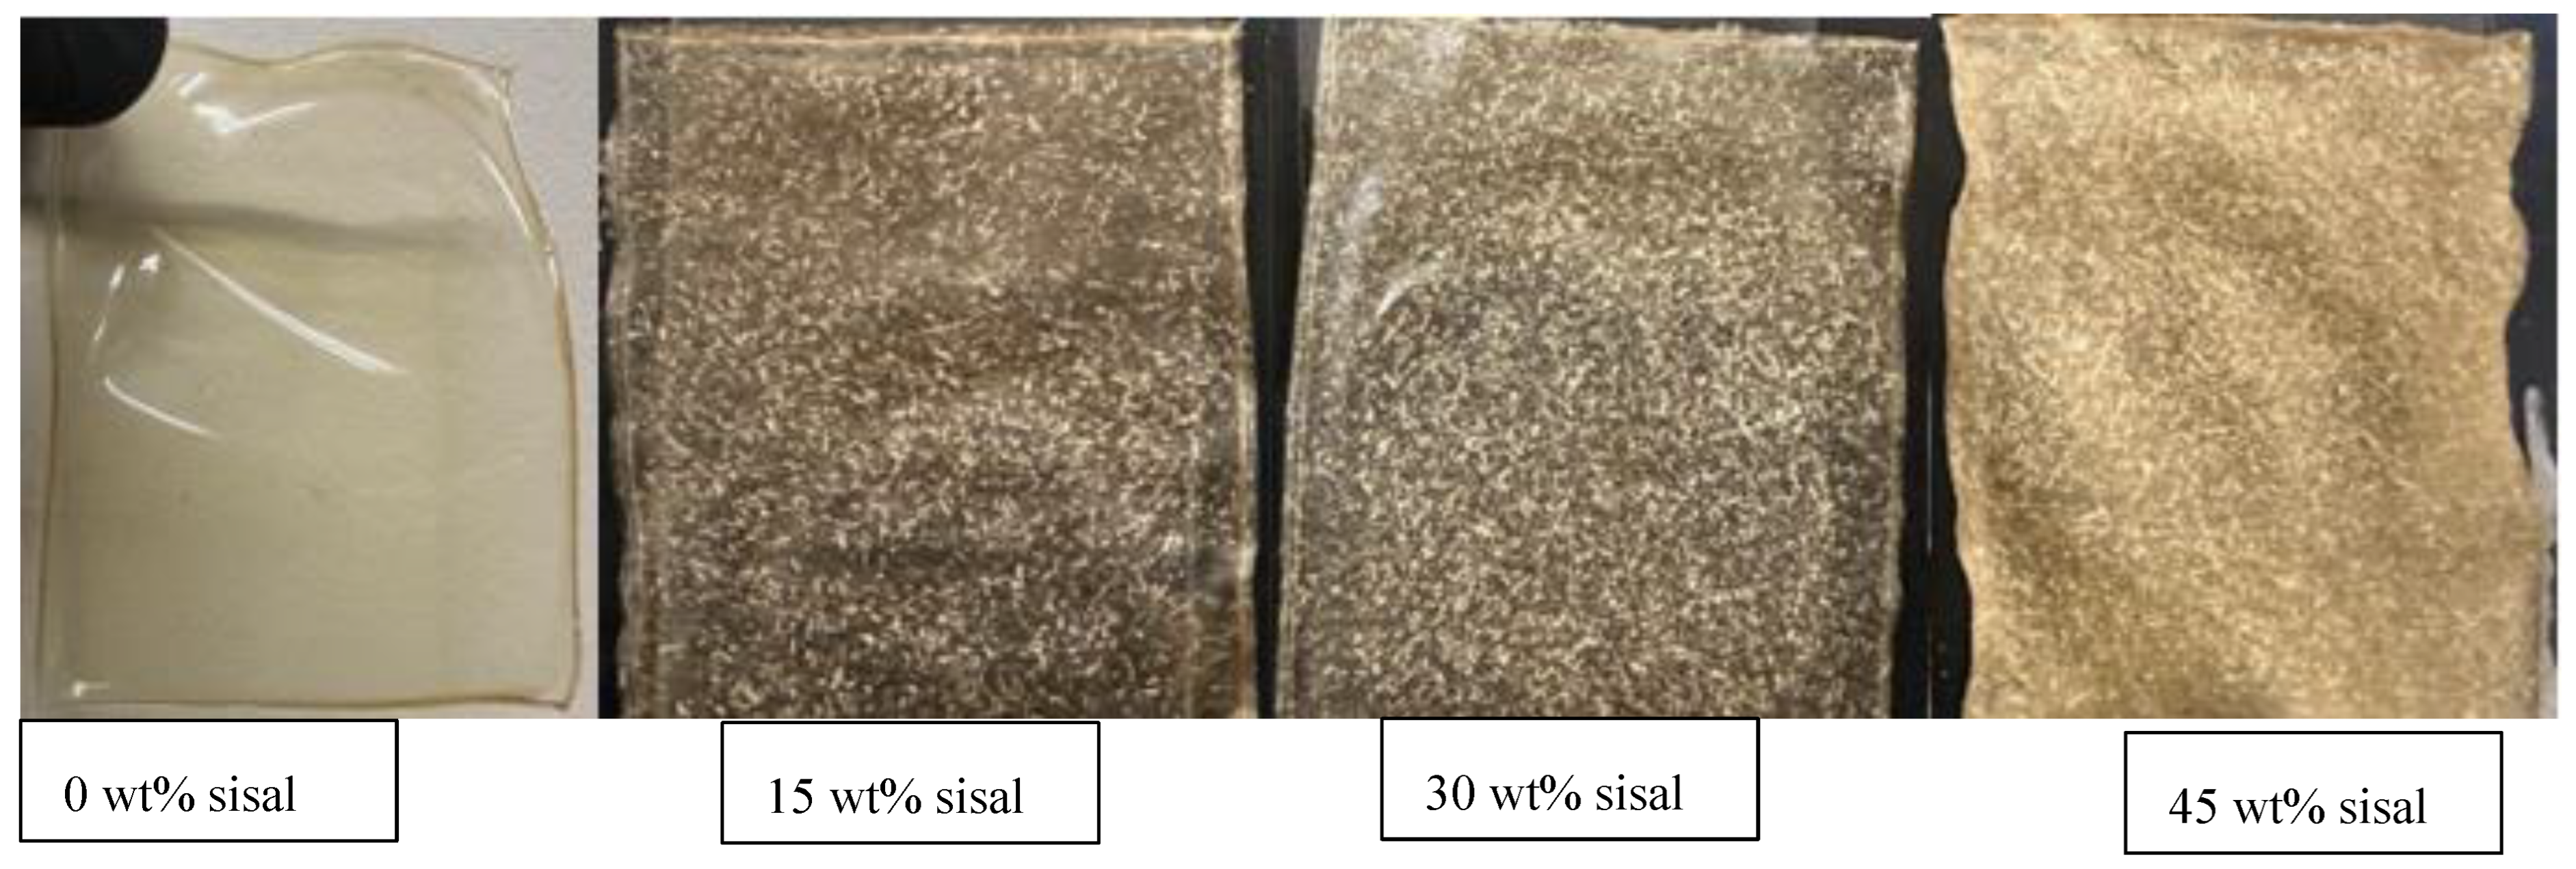
Figure 5.
FTIR comparison of pure RA film and library reference of carrageenan, showing excellent overlap. Sulfate and glycosidic peaks are strong indicators of the presence of kappa-carrageenan.
Figure 5.
FTIR comparison of pure RA film and library reference of carrageenan, showing excellent overlap. Sulfate and glycosidic peaks are strong indicators of the presence of kappa-carrageenan.
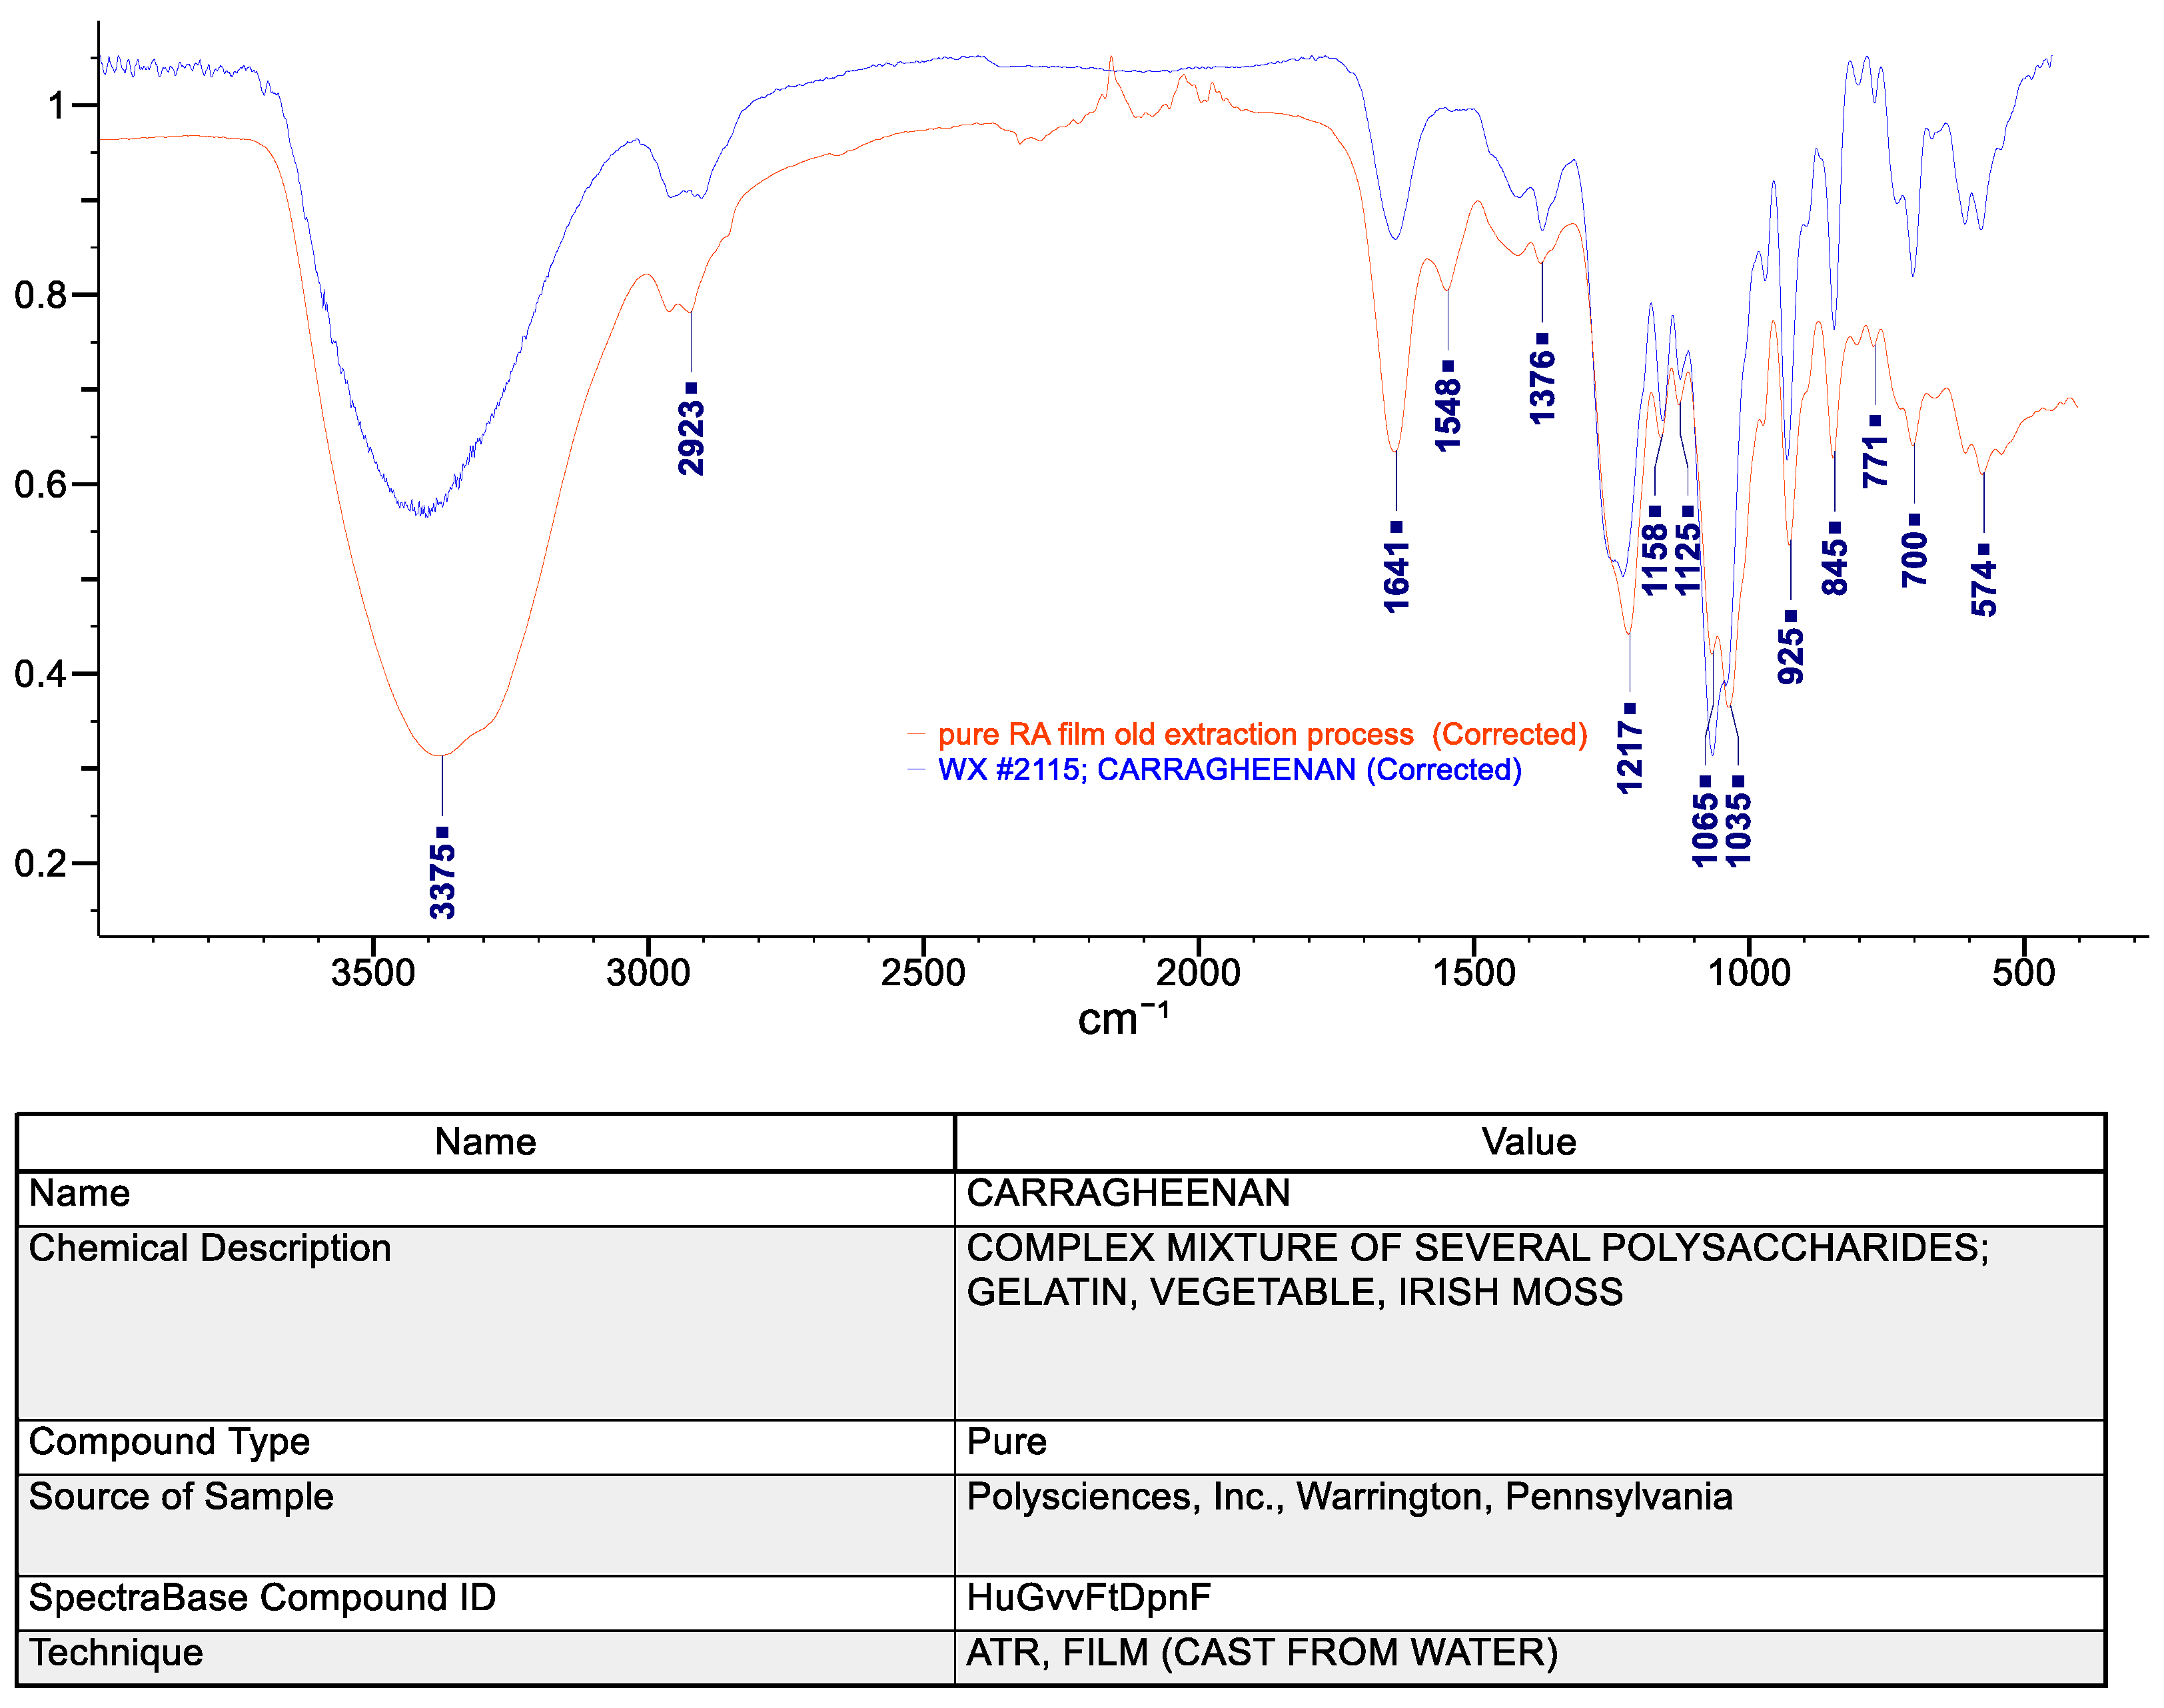
Figure 6.
FTIR spectra of glycerol, sisal and plasticized films. The figure compares pure component spectra with the composites, showing consistent glycerol-related peaks across all films. Minimal spectral variation with fiber loading indicates that sisal does not change the primary polysaccharide chemistry.
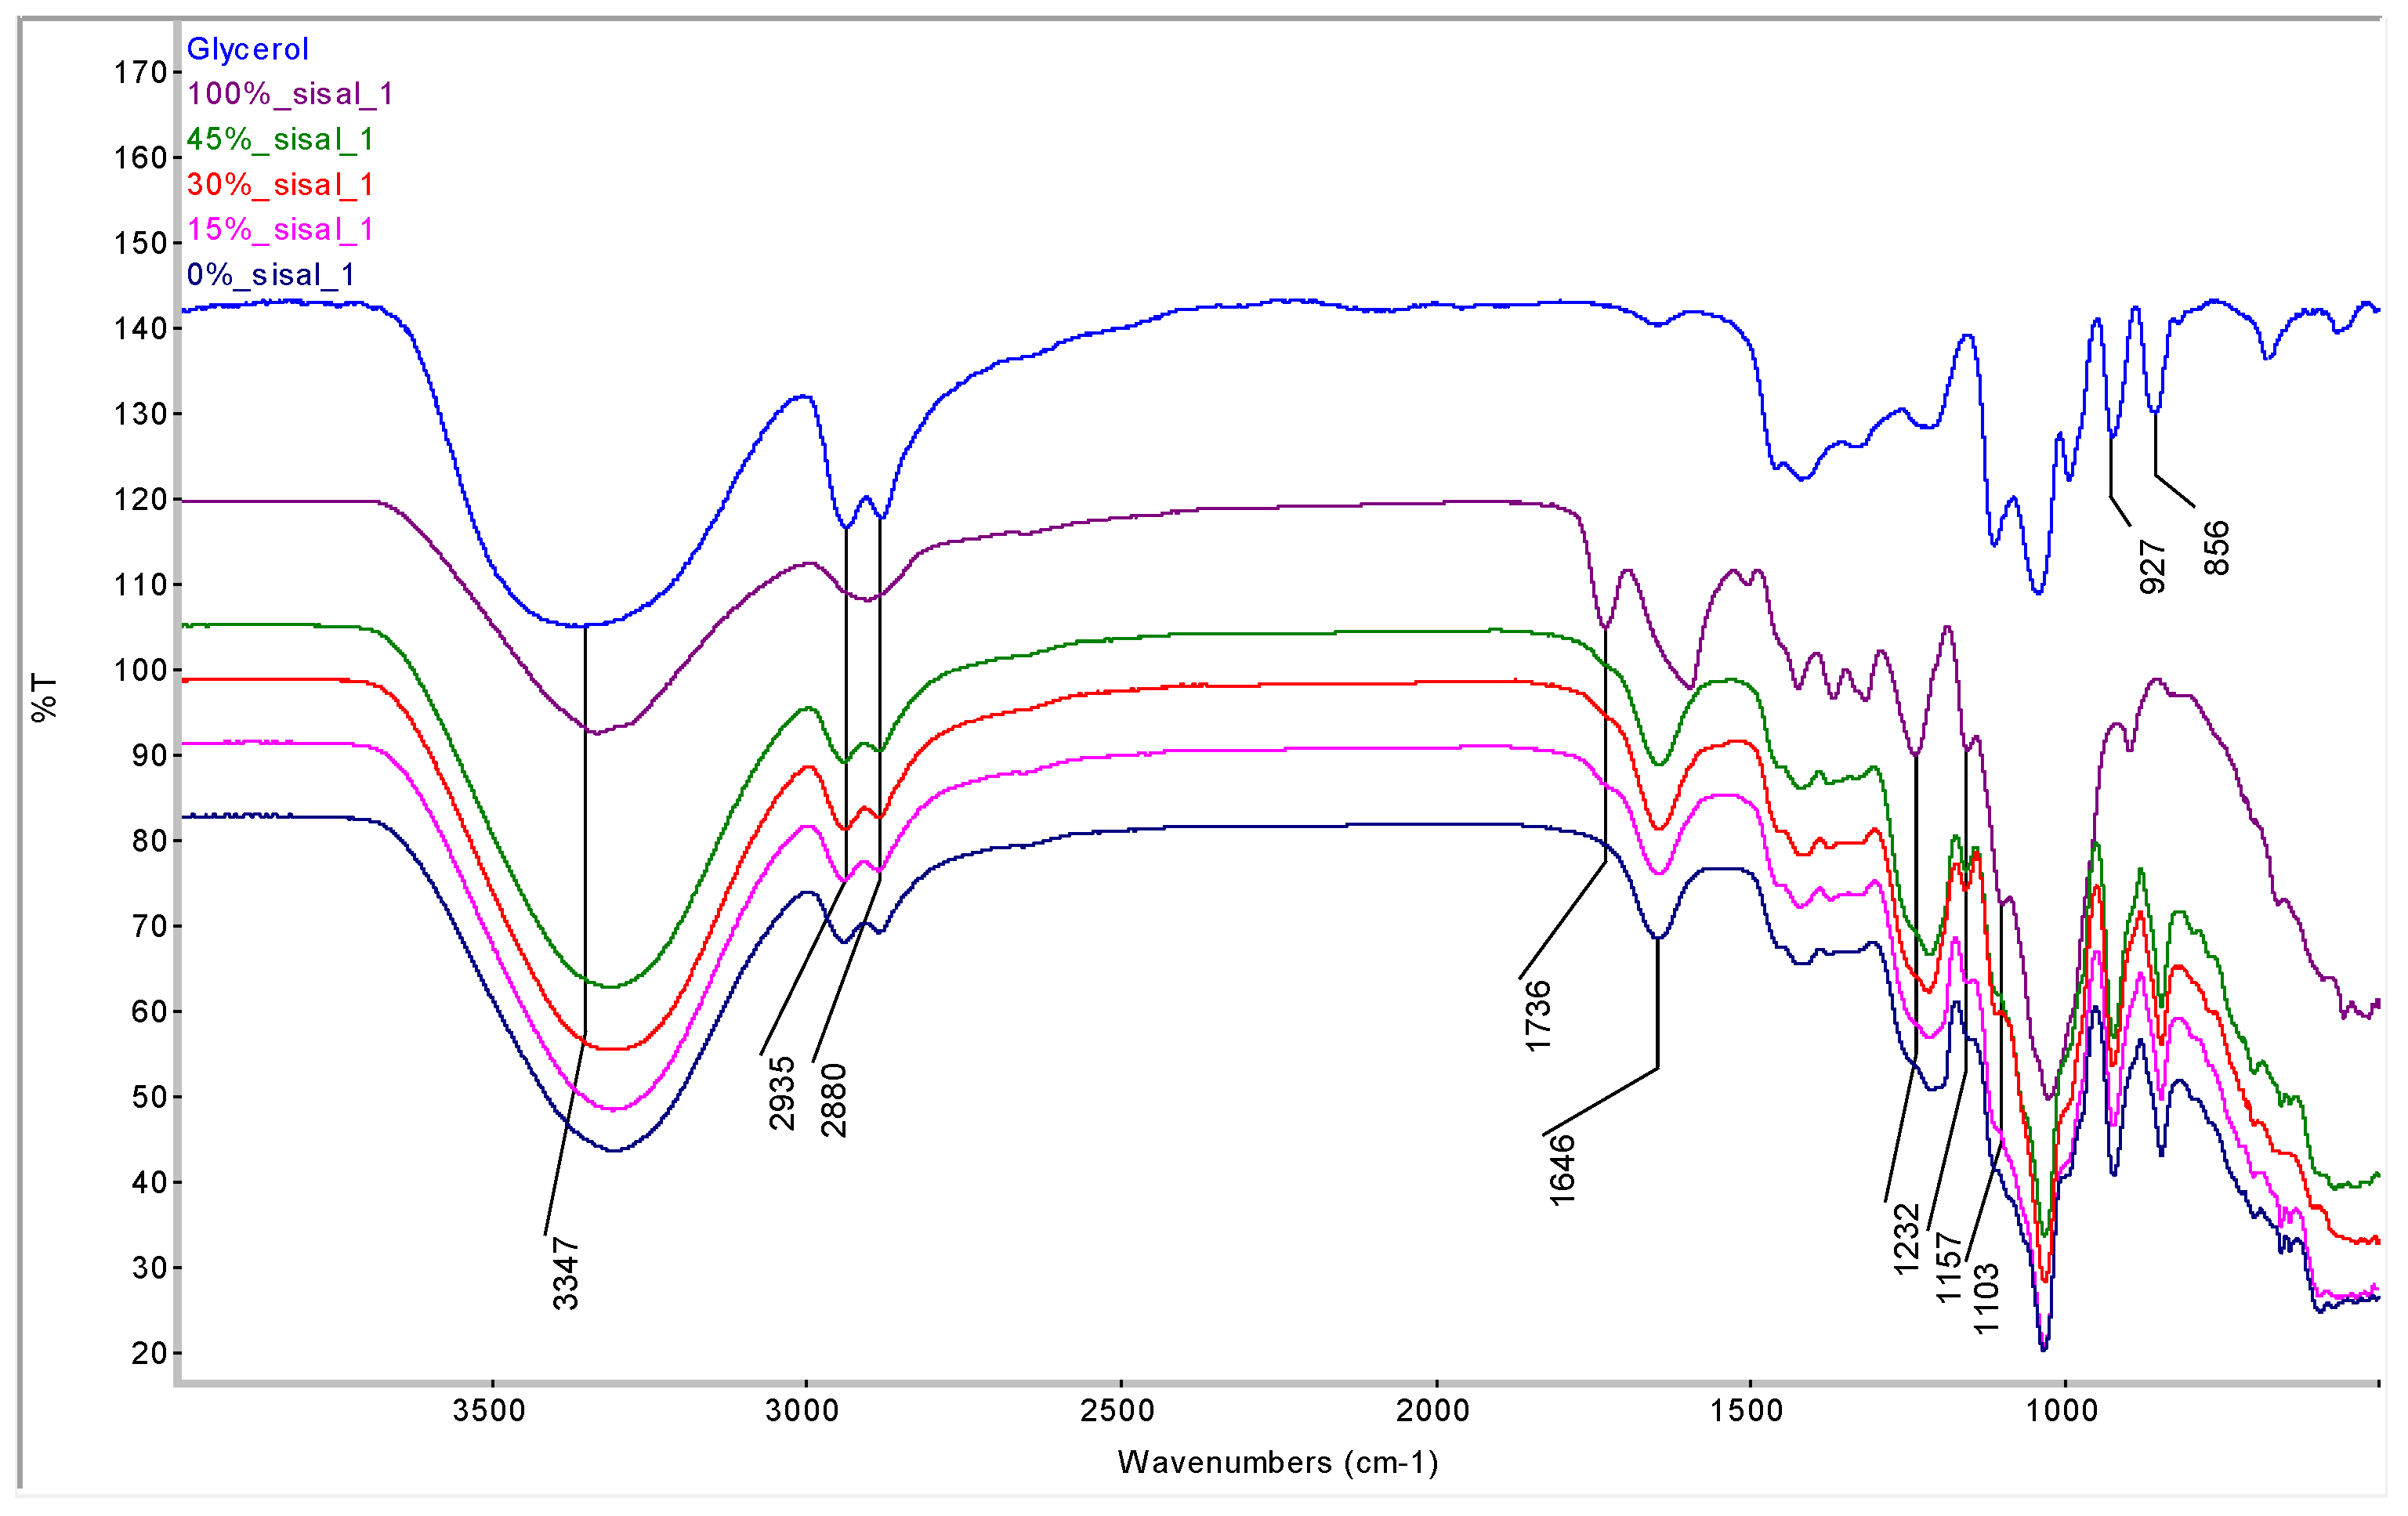
Figure 7.
Average sulfur content versus sisal fiber loading (n=3). The plot shows sulfur content decreasing with increasing fiber concentration, consistent with the dilution of the sulfated carrageenan phase. The elevated value at 45 wt% suggests inhomogeneous mixing.
Figure 7.
Average sulfur content versus sisal fiber loading (n=3). The plot shows sulfur content decreasing with increasing fiber concentration, consistent with the dilution of the sulfated carrageenan phase. The elevated value at 45 wt% suggests inhomogeneous mixing.
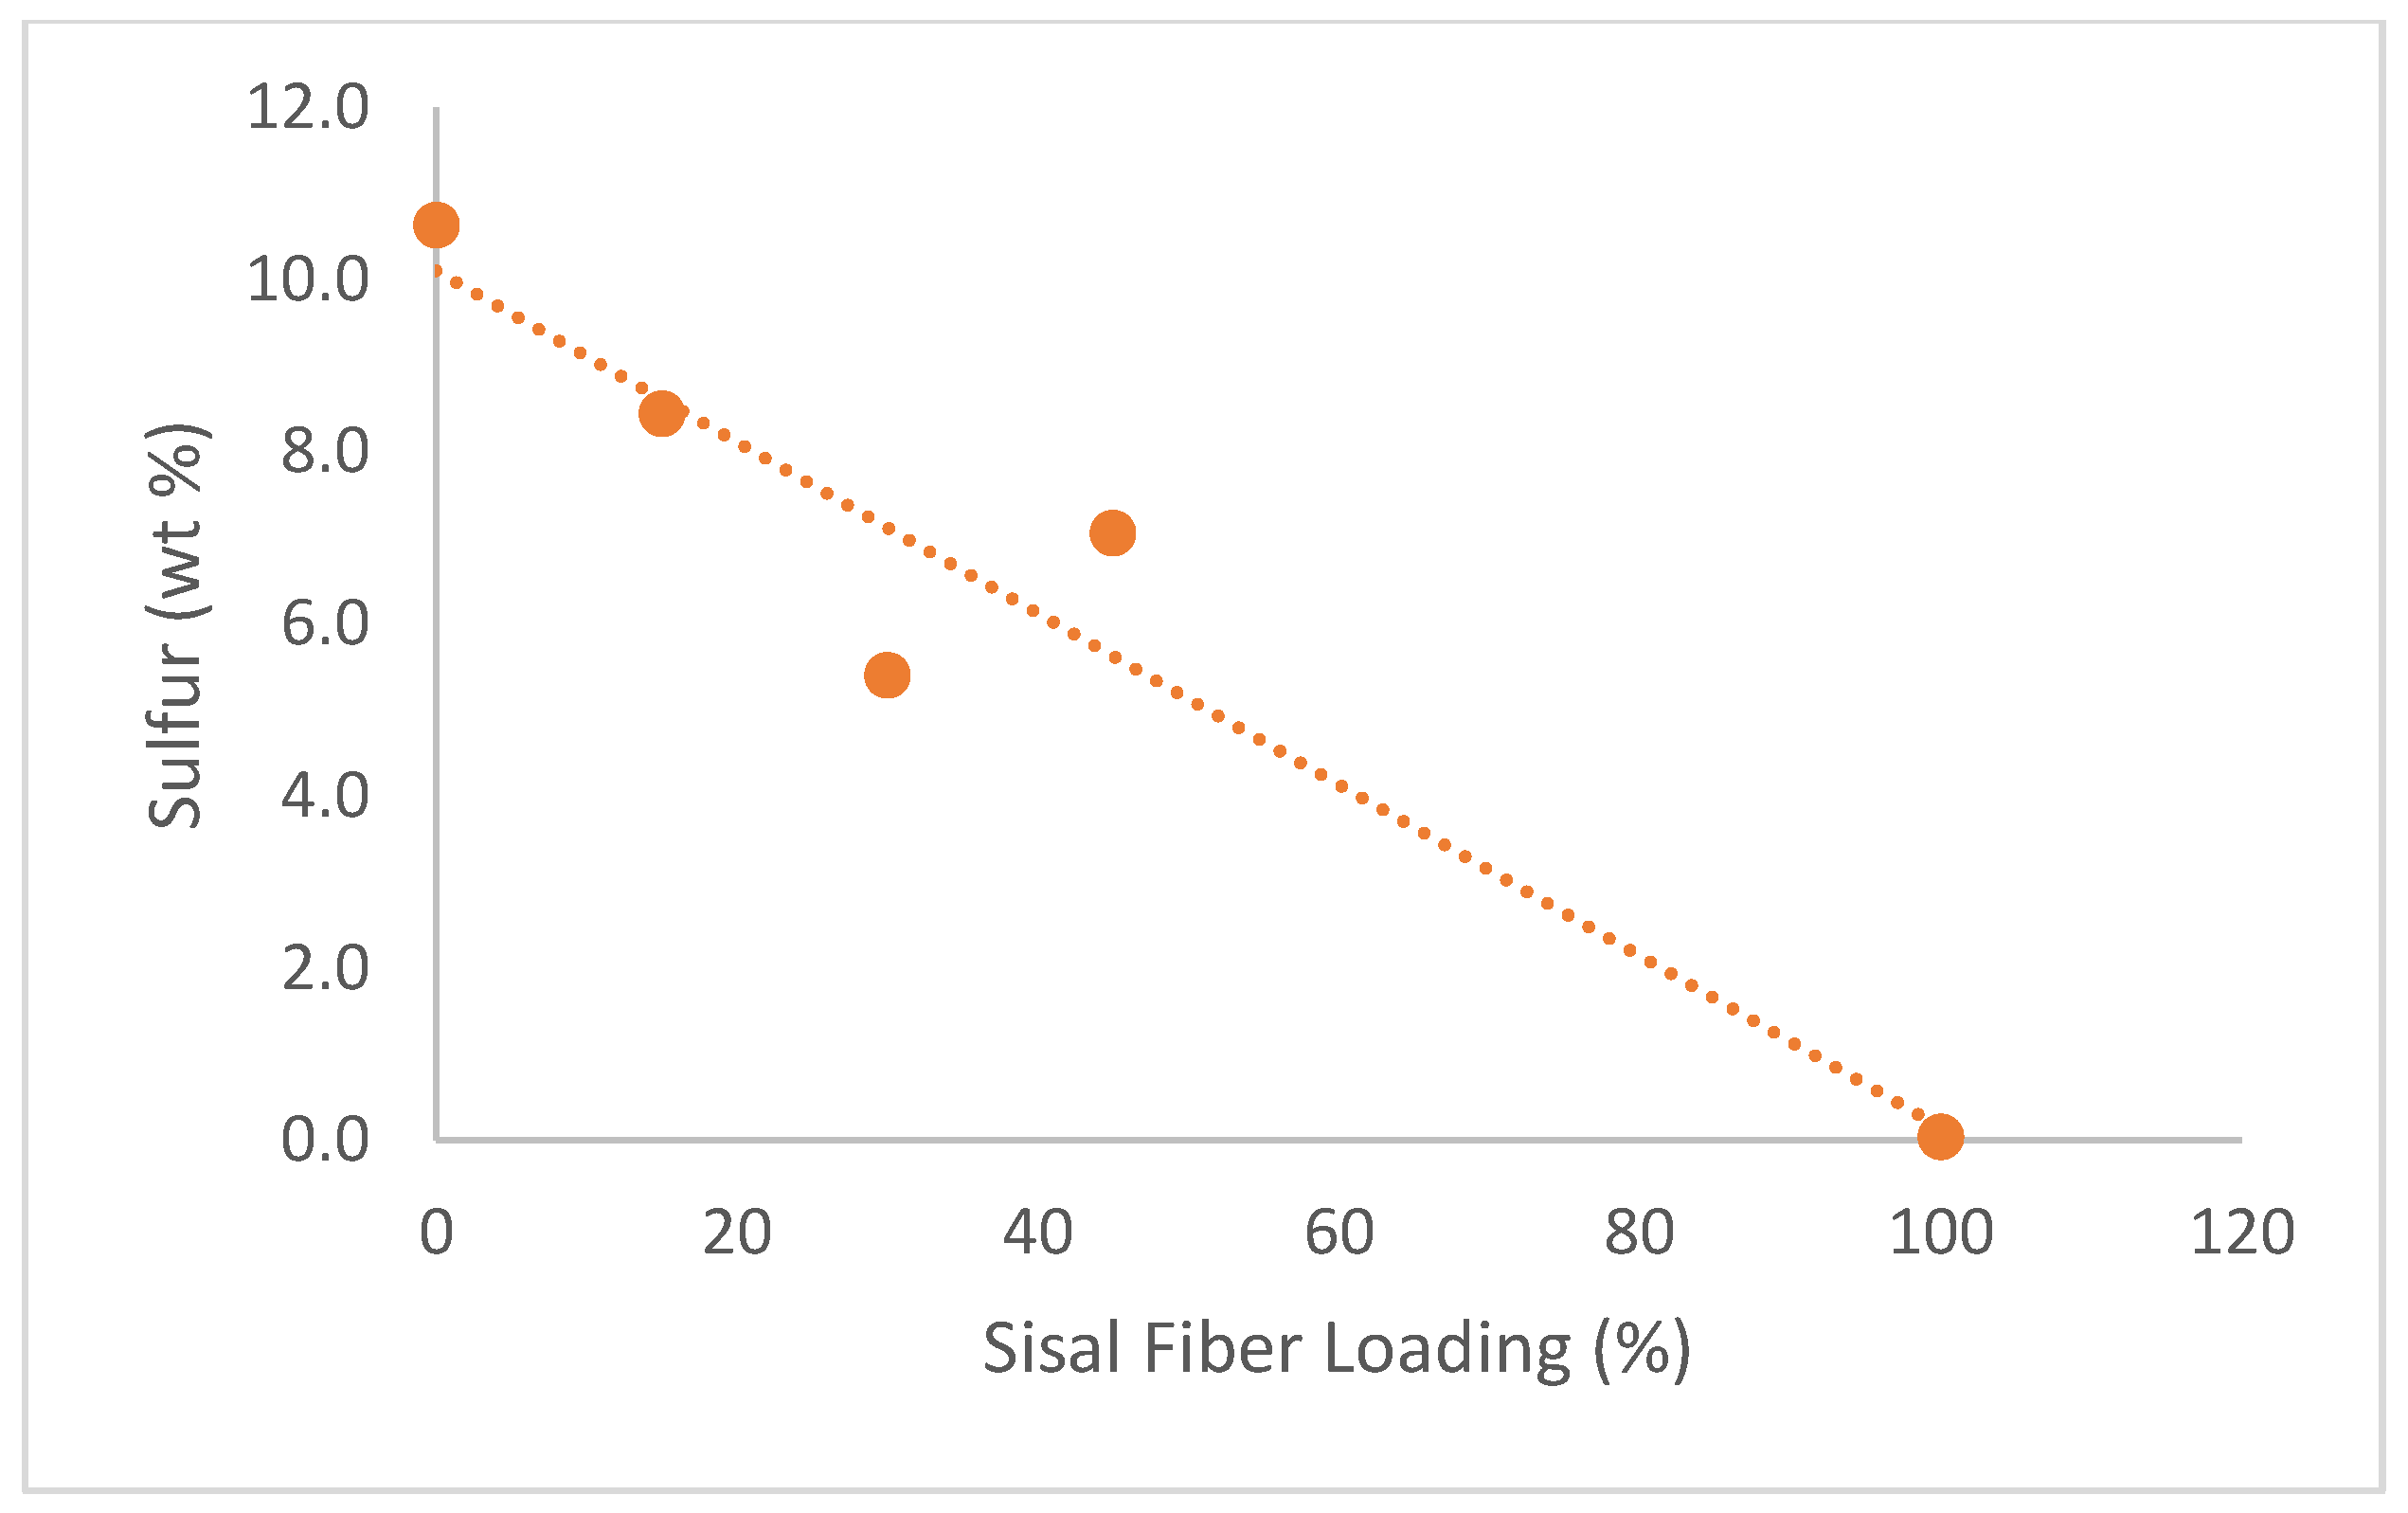
Figure 8.
TGA thermograms of plasticized film. Higher fiber loadings show increased thermal stability (n=2). TGA curves show a main decomposition event between 200–300 °C for all RA-based films, with fiber addition generally increasing thermal stability.
Figure 8.
TGA thermograms of plasticized film. Higher fiber loadings show increased thermal stability (n=2). TGA curves show a main decomposition event between 200–300 °C for all RA-based films, with fiber addition generally increasing thermal stability.
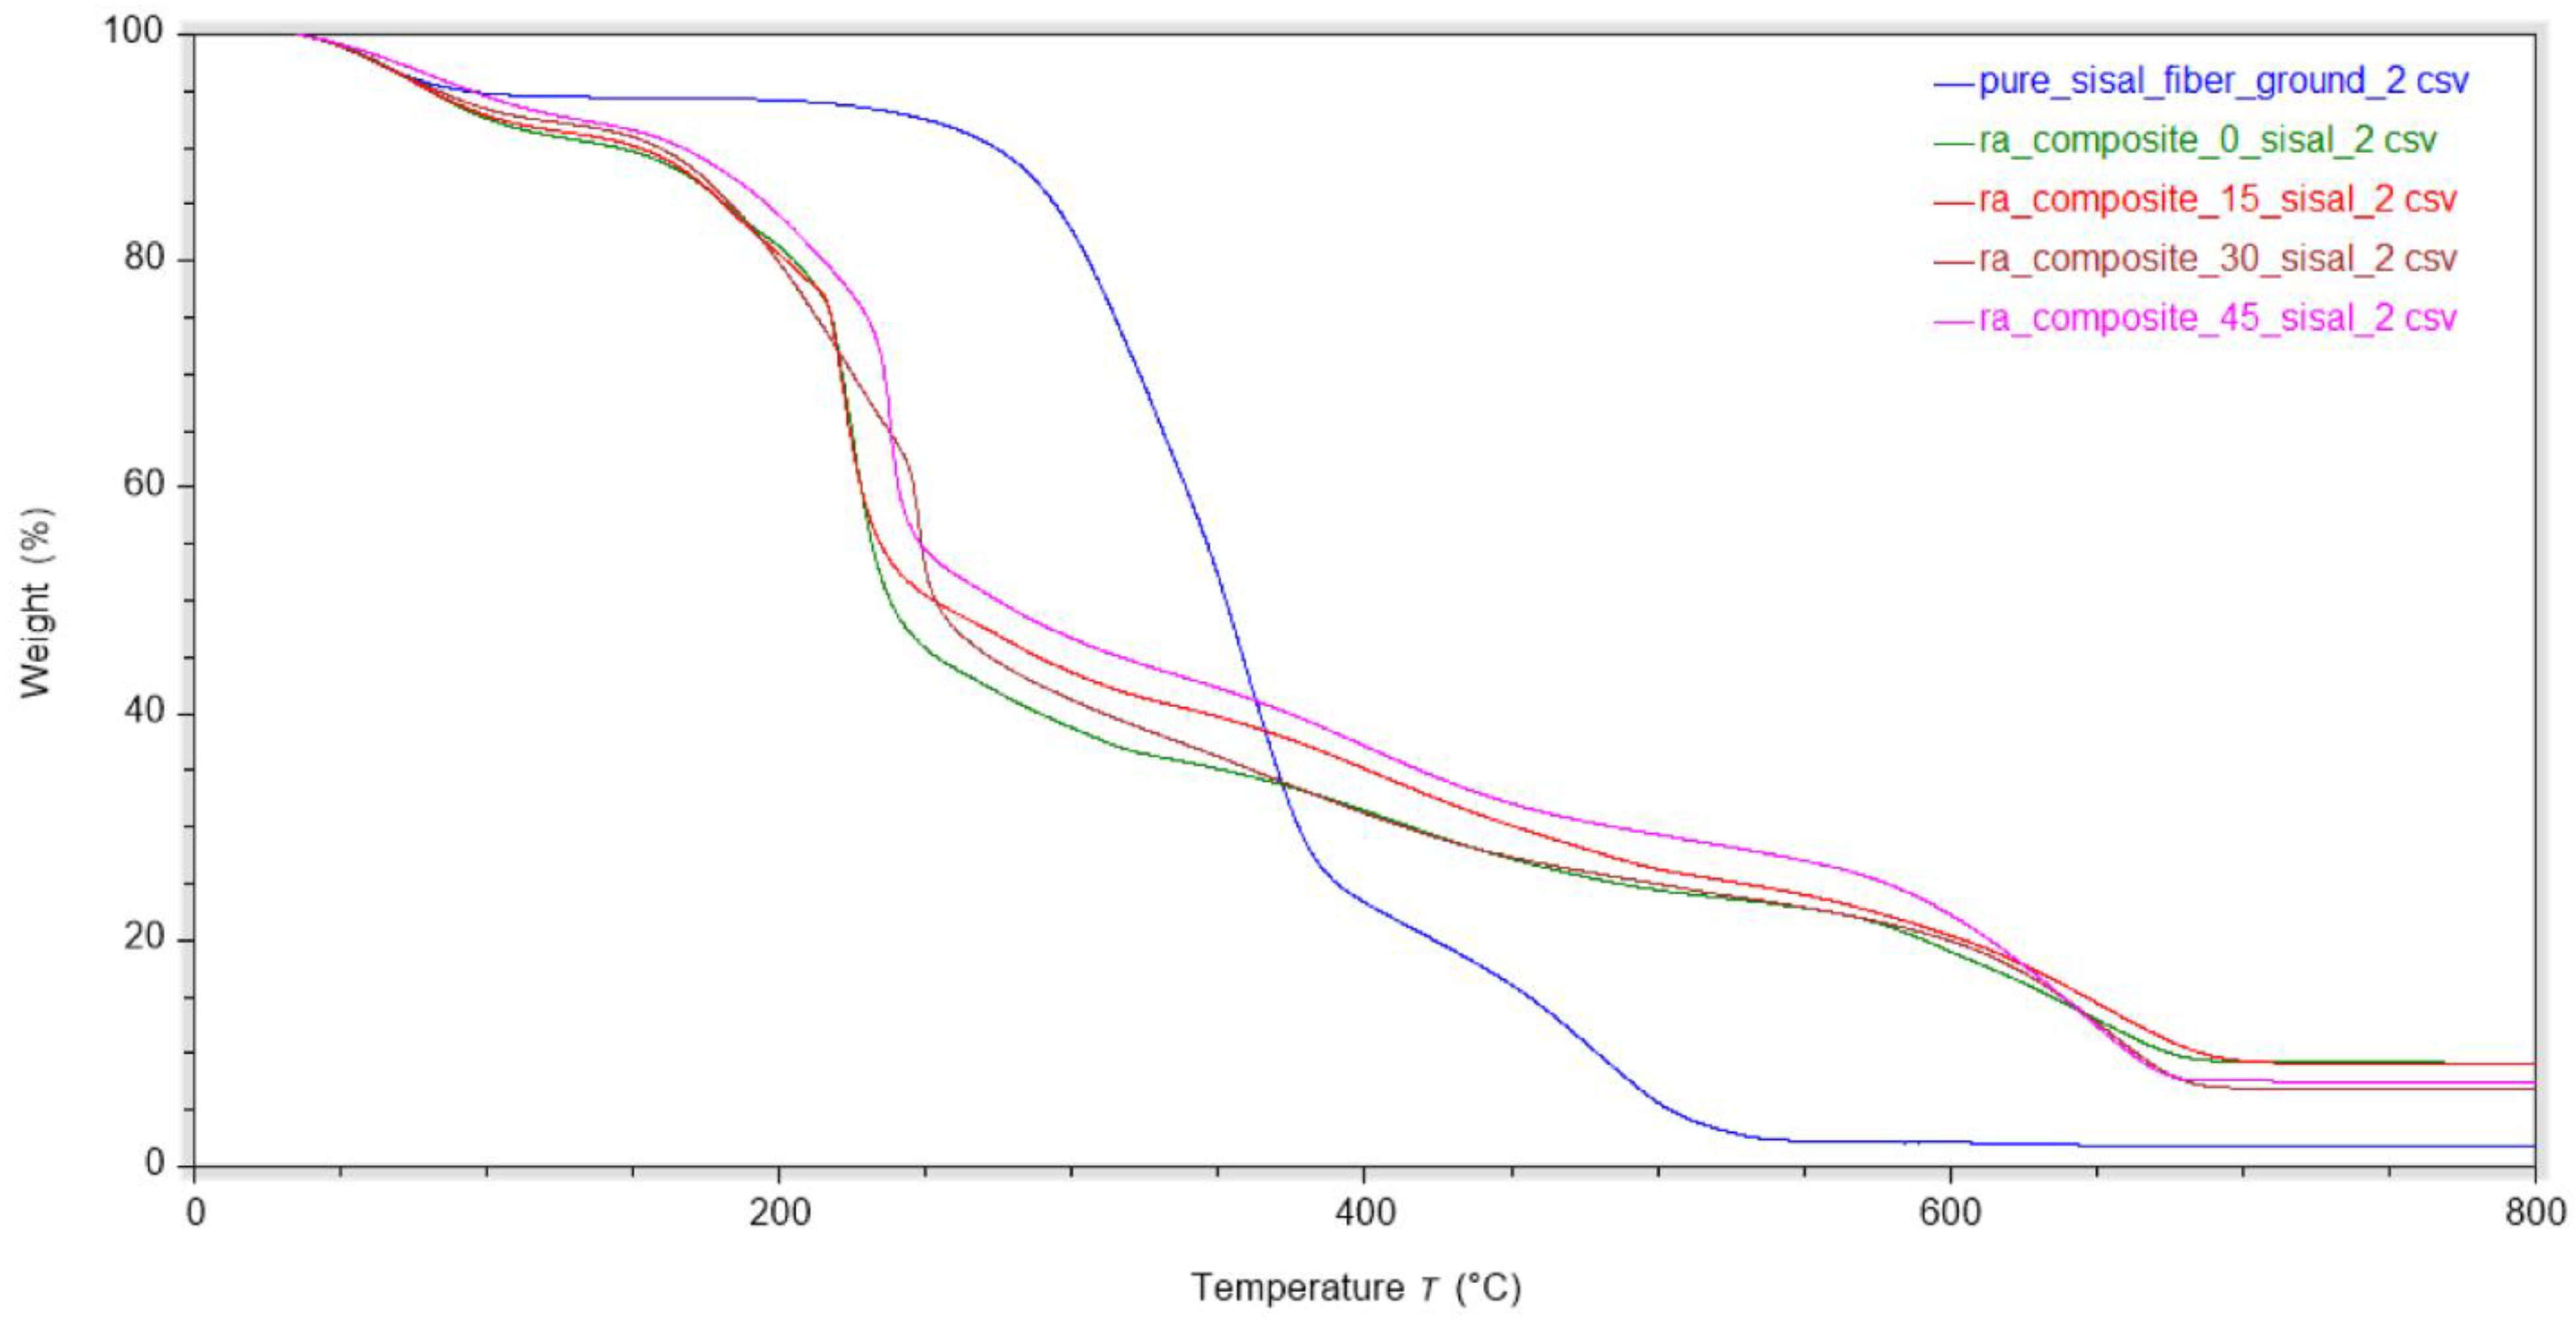
Figure 9.
DSC temperature-heat flow overlay of the varying composite concentrations (n=3). DSC results show decreasing endothermic water-loss peaks as fiber content increases, reflecting reduced moisture uptake in the composites. This trend suggests diminished hydrogen bonding within the matrix at higher fiber loadings.
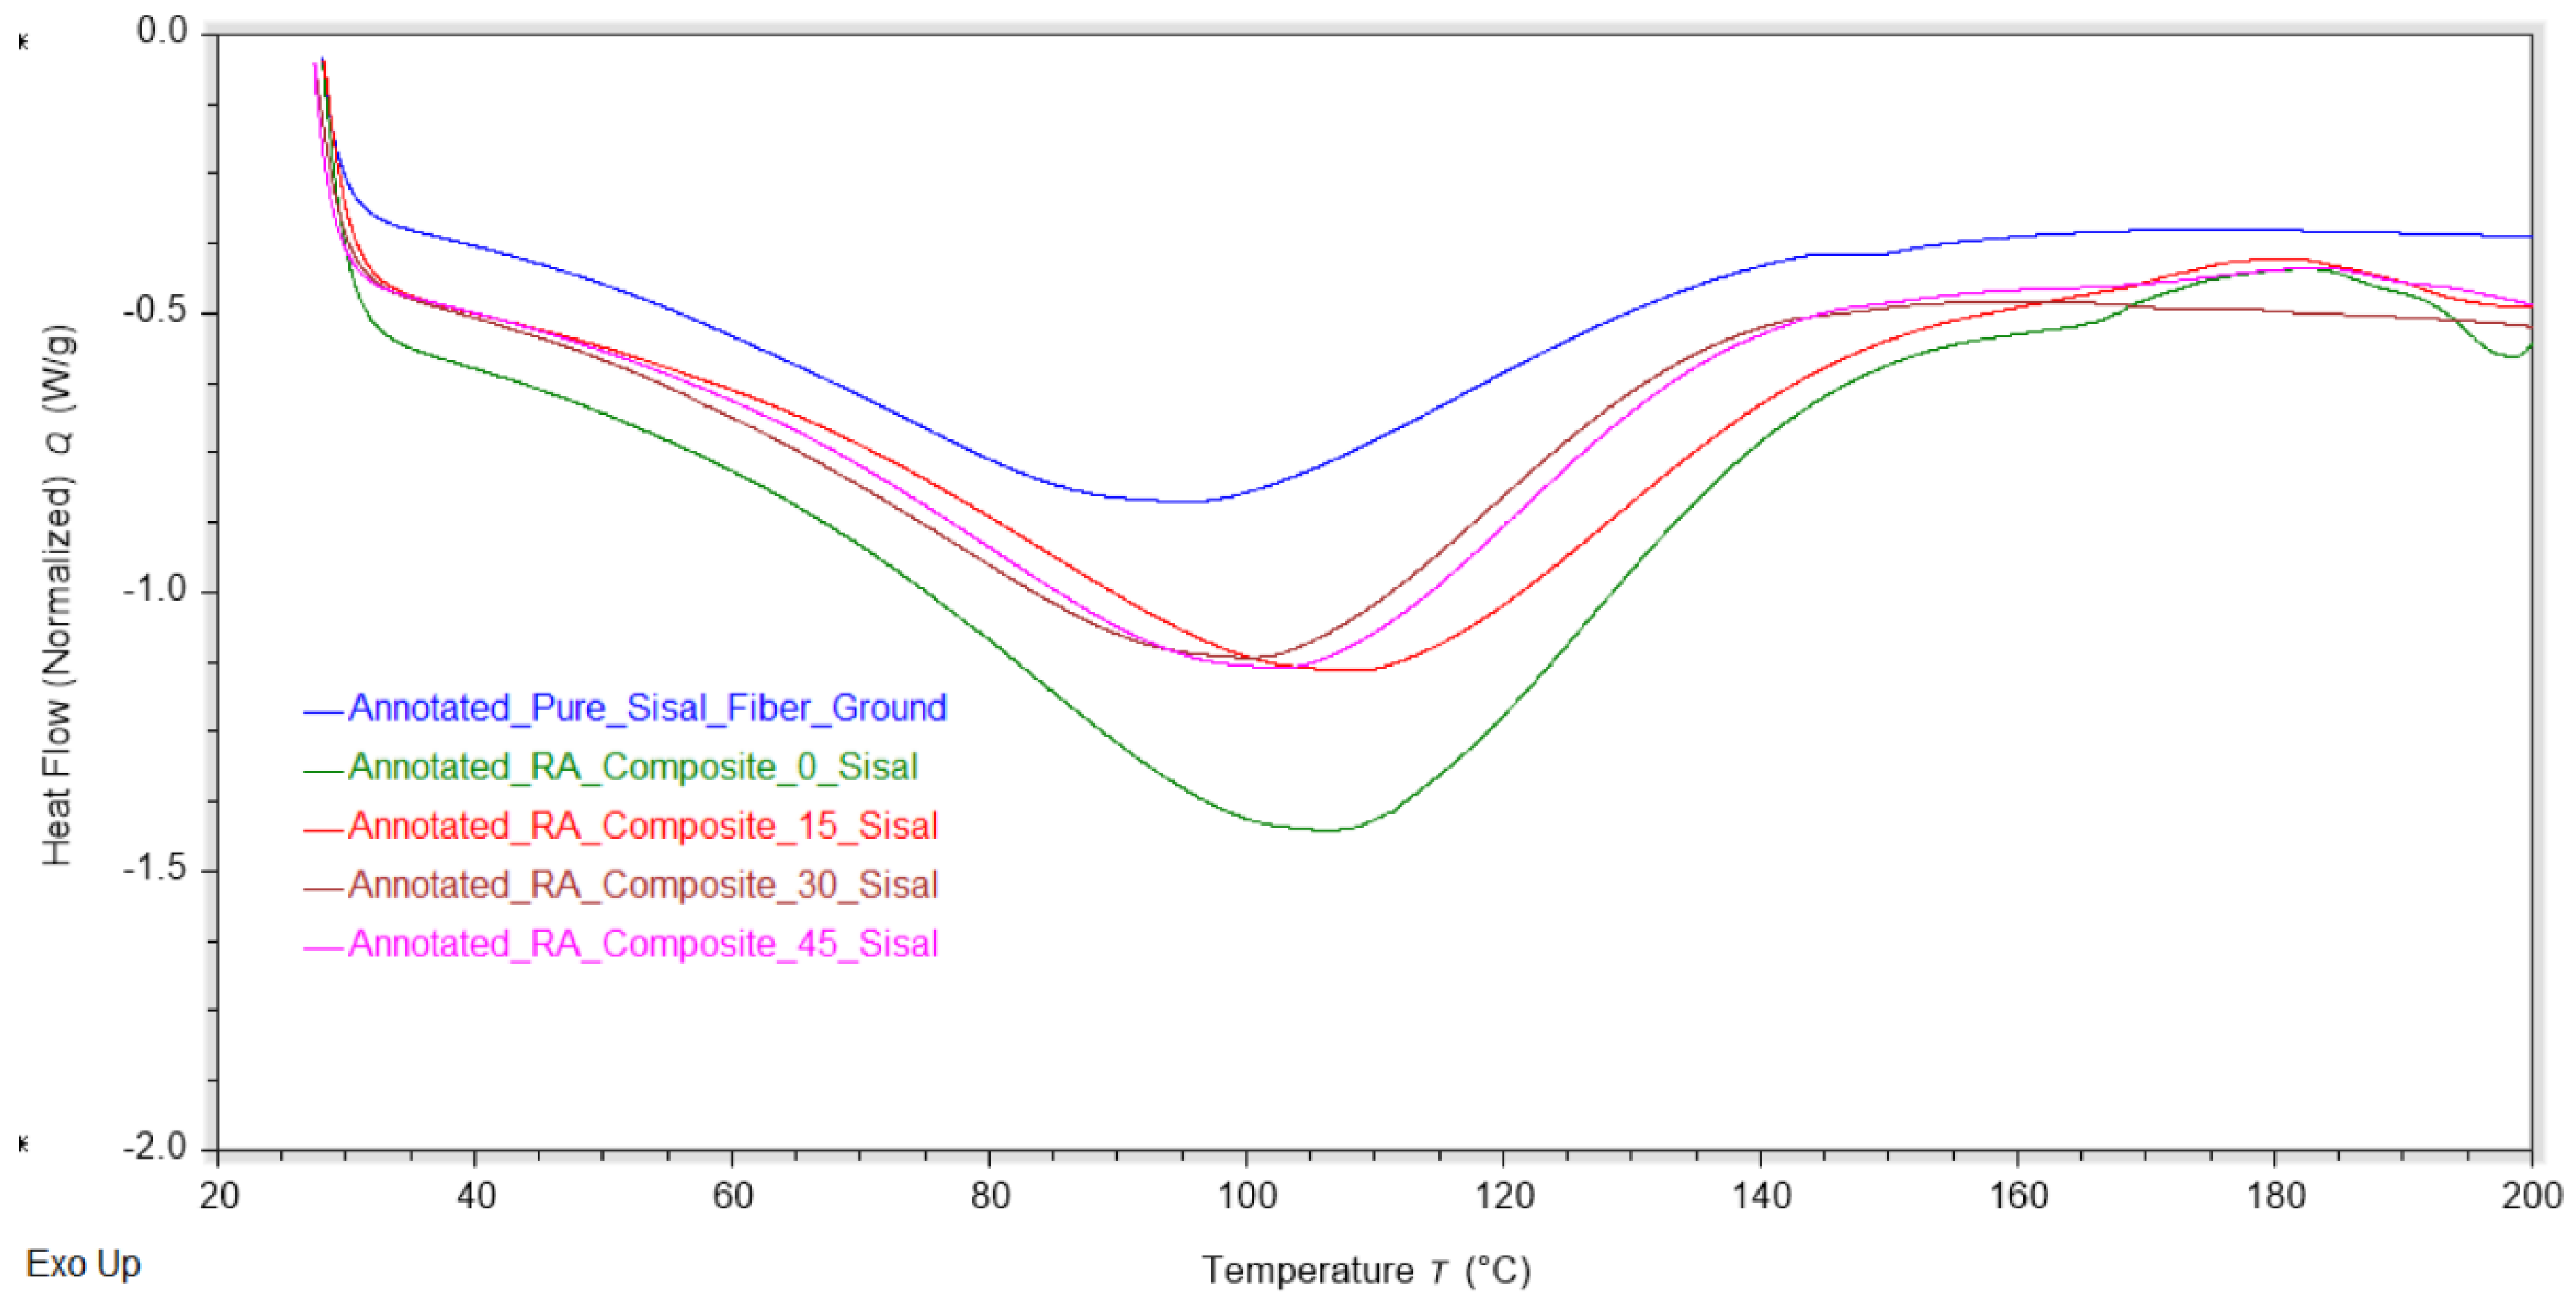
Figure 10.
Stress-strain curve averages of the varying composite concentrations (n=5). The stress–strain curves show that moderate fiber addition increases modulus and strength, while excessive loading results in embrittlement. The 30 wt% sisal composite demonstrated the most favorable balance of stiffness and ductility.
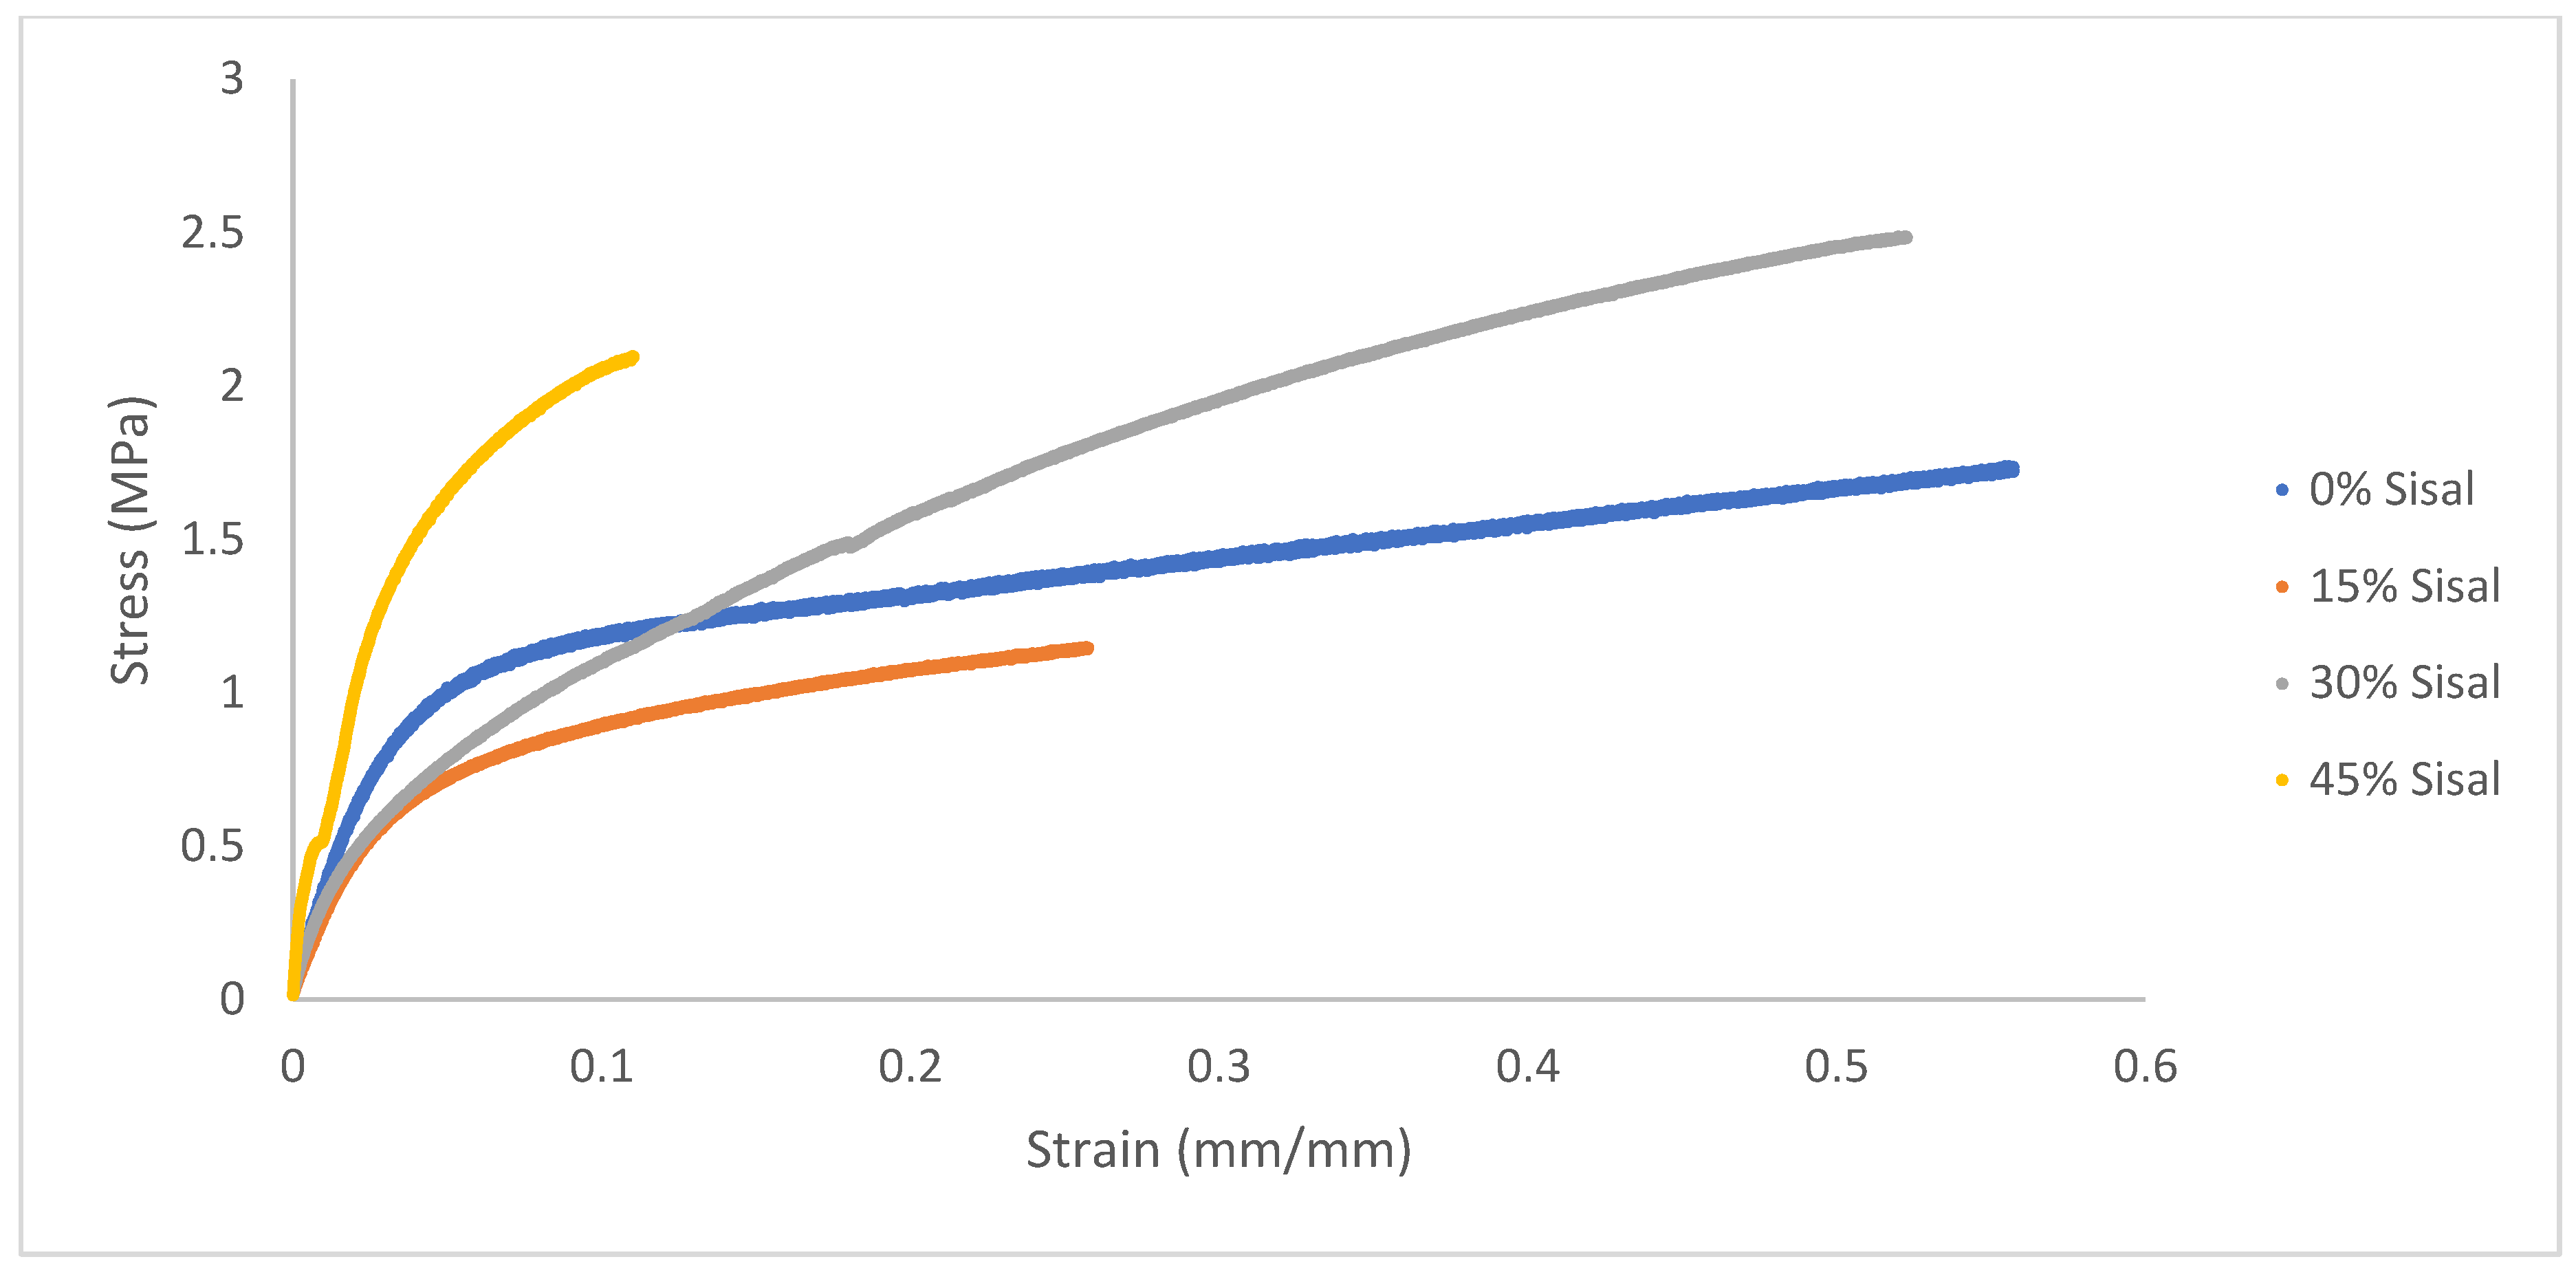

Table 1.
Functional Groups in RA Biocomposite Films.
| FTIR vibration (cm−1) | Functional Group |
|---|---|
| 3347 | O-H Stretch |
| 2935 and 2880 | C-H Stretch |
| 1736 | Ester C=O Stretch |
| 1646 | O-H Bending and/or C=O Amide I Stretch |
| 1232 | S=O Asym Stretch |
| 1157 | C-O Stretch |
| 1103 | C-O stretch |
| 927 | C-C Stretch |
| 858 | C-C Bending |
Table 2.
Compositional Analysis of RA Biocomposite films (n=3)a.
| 0 (wt %) | 15 (wt %) | 30 (wt %) | 45 (wt %) | 100 (wt %) | |
|---|---|---|---|---|---|
| C | 12.8 ± 2.5 | 19.5 ± 0.5 | 24.8 ± 0.5 | 22.5 ± 0.5 | 36.8 ± 0.62 |
| O | 64.5 ± 1.5 | 63.7 ± 0.5 | 63.8 ± 0.8 | 63.0 ± 1.1 | 61.5 ± 0.6 |
| Na | 1.89 ± 0.19 | 2.14 ± 0.03 | 1.80 ± 0.04 | 2.04 ± 0.04 | 0.053 ± 0.06 |
| Mg | 0.71 ± 0.05 | 0.85 ± 0.06 | 0.75 ± 0.05 | 0.80 ± 0.07 | 0.13 ± 0.02 |
| Al | 0.069 ± 0.038 | 0.032 ± 0.004 | 0.055 ± 0.005 | 0.062 ± 0.013 | 0.029 ± 0.018 |
| Si | 0.10 ± 0.05 | 0.048 ± 0.007 | 0.062 ± 0.006 | 0.083 ± 0.020 | 0.040 ± 0.027 |
| P | 0.12 ± 0.01 | 0.065 ± 0.005 | 0.087 ± 0.002 | 0.055 ± 0.002 | 0.034 ± 0.004 |
| S | 10.6 ± 1.5 | 8.45 ± 0.44 | 5.41 ± 0.18 | 7.06 ± 0.83 | 0.045 ± 0.005 |
| Cl | 0.41 ± 0.11 | 0.30 ± 0.011 | 0.22 ± 0.01 | 0.28 ± 0.01 | 0.036 ± 0.031 |
| K | 6.88 ± 0.96 | 4.04 ± 0.19 | 2.38 ± 0.08 | 3.31 ± 0.25 | 0.60 ± 0.04 |
| Ca | 1.84 ± 0.31 | 0.92 ± 0.11 | 0.63 ± 0.02 | 0.76 ± 0.14 | 0.76 ± 0.01 |
a Additional trace element were also detected such as bromine, strontium and trace metals but are excluded from the table for simplicity
Table 3.
Thermal and Mechanical Properties of RA Biocomposite Films.
| Fiber % | Volatiles (wt%) | Mass Loss (wt %) | Tmax (˚C) | Residue (wt%) | Desorption Enthalpy (J/g) | Desorption Temp (˚C) | Modulus (Gpa) | Strength (Mpa) | Elongation at break (mm/mm) |
|---|---|---|---|---|---|---|---|---|---|
| 0 | 9.5 ± 1.5 | 34.6 ± 1.7 | 226.6 ± 1.2 | 9.2 ± 0.1 | 292 ± 31 | 104.5 ± 3.1 | 3.10 ± 0.3 | 1.76 ± 0.1 | 0.67 ± 0.1 |
| 15 | 9.2 ± 2.1 | 30.1 ± 1.5 | 221.1 ± 0.5 | 9.1 ± 0.04 | 233 ± 16 | 111.7 ± 4.9 | 5.96 ± 0.1 | 1.26 ± 0.2 | 0.66 ± 0.1 |
| 30 | 8.2 ± 1.2 | 20.1 ± 3.2 | 247.8 ± 0.1 | 7.0 ± 0.2 | 219 ± 19 | 106.0 ± 8.9 | 4.22 ± 0.1 | 2.49 ± 0.2 | 0.63 ± 0.1 |
| 45 | 8.4 ± 0.3 | 24.3 ± 0.5 | 238.5 ± 1.1 | 7.5 ± 0.1 | 199 ± 5 | 104.7 ± 3.0 | 15.20 ± 0.2 | 2.10 ± 0.2 | 0.18 ± 0.1 |
| 100 | 4.1 ± 2.3 | 71.8 ± 1.7 | 362.5 ± 3.2 | 1.9 ± 0.04 | 153 ± 7 | 96.3 ± 1.6 | n/a | ||
Disclaimer/Publisher’s Note: The statements, opinions and data contained in all publications are solely those of the individual author(s) and contributor(s) and not of MDPI and/or the editor(s). MDPI and/or the editor(s) disclaim responsibility for any injury to people or property resulting from any ideas, methods, instructions or products referred to in the content. |
© 2025 by the authors. Licensee MDPI, Basel, Switzerland. This article is an open access article distributed under the terms and conditions of the Creative Commons Attribution (CC BY) license (http://creativecommons.org/licenses/by/4.0/).
Copyright: This open access article is published under a Creative Commons CC BY 4.0 license, which permit the free download, distribution, and reuse, provided that the author and preprint are cited in any reuse.


