Submitted:
03 December 2025
Posted:
04 December 2025
You are already at the latest version
Abstract
In regions lacking sufficient data, remote sensing (RS) offers a reliable alternative for precipitation estimation, enabling more effective drought management. This study comprehensively evaluates four commonly used RS datasets-Climate Hazards Center InfraRed Precipitation with Station data (CHIRPS), Tropical Applications of Meteorology using Satellite data (TAMSAT), Precipitation Estimation from Remotely Sensed Information using Artificial Neural Networks-Climate Data Record (PERSIANN-CDR), and Multi-Source Weighted-Ensemble Precipitation (MSWEP) against ground-based data-with respect to their performance in detecting precipitation and drought patterns in the Great Ruaha River Basin (GRRB), Tanzania (1983-2020). Statistical metrics including the Pearson correlation coefficient (r), Mean Error (ME), Root Mean Square Error (RMSE), and Bias were employed to assess the performance at daily, monthly, seasonal (wet/dry), and annual timescales. Most of the RS products exhibited lower correlations (r<0.5) at daily timestep and low RMSE, Bias and ME. Monthly performance improved substantially (r > 0.8 at most stations) particularly during wet season (r = 0.52-0.82) while annual and dry-season performance declined (r < 0.5 and r < 0.3, respectively). Performance under RMSE, Bias, and ME declined at higher timescales, particularly during wet season and annually. CHIRPS, MSWEP, and PERSIANN generally overestimated precipitation while TAMSAT consistently underestimated it. CHIRPS and MSWEP showed superior performance especially in capturing monthly precipitation patterns and major drought events in the basin. Most products struggled to detect extreme dry conditions with exception of CHIRPS and MSWEP at certain stations and periods. Based on these findings, CHIRPS and MSWEP are recommended for drought monitoring and water resource planning in the GRRB. Their appropriate use can help water managers make informed decisions, promote sustainable resource use and strengthen resilience to extreme weather events.
Keywords:
drought monitoring
; satellite products
; sustainable management
; Great Ruaha
1. Introduction
Drought remains a major challenge to water availability with serious societal and economic consequences for human beings. It is a condition that arises from prolonged period of below average precipitation (Ma et al., 2019). From precipitation deficit which is essentially meteorological drought, it can propagate to soil leading to agricultural drought and further extend to surface or groundwater reserves resulting to hydrological drought (Alahacoon & Edirisinghe, 2022; Fowé et al., 2023; Ogembo, Olala, et al., 2025). These conditions can disrupt hydrological balance and threaten ecosystem and environmental sustainability (Qiu et al., 2023). Drought can occur anywhere but its impacts vary depending on catchment climatic factors, physical attributes and human influences (Tijdeman et al., 2018; Van Lanen et al., 2013). African catchments are most vulnerable to the impacts of droughts due to rapid population growth, increased water demands, land degradation and climate change (Lombe et al., 2024). According to Wallemacq et al. (2015), droughts have affected Africa more severely than any other continent with the Emergency Events Database (EM-DAT) recording about 136 events (~41% of the global total) between 1995 and 2015, whereby 77 of these events were experienced in East Africa alone. This makes drought one of the most destructive disasters (Wang et al., 2021) underscoring the urgent need of developing effective drought monitoring strategies that can help improve early warning systems and mitigate emerging impacts.
Effective drought monitoring and prediction across spatial and temporal scales relies on consistent and reliable in-situ measurements of key drought variables such as precipitation, temperature, soil moisture and river discharge. However, such information is often absent particularly in data scarce regions like Africa (Alahacoon & Edirisinghe, 2022). This makes drought management in such regions challenging, impairing both water and drought management decisions. In response to this obstacle, remote sensing (RS) technology has emerged as an alternative method that seeks to bridge the existing data gap (AghaKouchak et al., 2015; Kumar et al., 2024). RS observation offers consistent and long-term measurements across spatial and temporal scales alongside capturing a wide range of drought variables (Başakın et al., 2024; Yue et al., 2024). This advancement has enabled researchers conduct drought assessments across complex catchments that literally suffer from data paucity.
Several researchers across the globe have utilized RS products to study drought characteristics and their impacts. These products include widely used precipitation datasets such as the Climate Hazards Center InfraRed Precipitation with Station data (CHIRPS; Funk et al., 2015), Tropical Applications of Meteorology using Satellite data (TAMSAT; Maidment et al., 2014), Precipitation Estimation from Remotely Sensed Information using Artificial Neural Networks-Climate Data Record (PERSIANN-CDR; Nguyen et al., 2019) and Multi-Source Weighted-Ensemble Precipitation (MSWEP; Beck et al., 2019). Utilization of such products both locally and globally have recently gained popularity due to their cost effectiveness and wide spatial coverage (Gao, Zhang, Ren, et al., 2018; Gebrechorkos et al., 2023; Ogembo & Akinyi Mohamed, 2023; Yang et al., 2022). Consequently, researchers have shifted their focus to utilizing such datasets to characterize drought from multiple perspectives and inform policy making.
In Tanzania, several studies have attempted to utilize RS datasets to study droughts across different locations (Makula et al., 2025; Omondi & Lin, 2023; Wambura, 2020; Wambura & Dietrich, 2020; Zuberi et al., 2022). However, most of these attempts lacked ground validation using in-situ measurements. Such an oversight has raised serious concerns about robustness, uncertainty and reliability for decision-making and sustainable water resources management particularly under increased climate uncertainty and anthropogenic influences (Mukama et al., 2024). This challenge arises because most of the RS products exhibit inherent uncertainties and random errors arising from their spatial scales as well as sensor accuracy which often result in systematic biases during prediction (AghaKouchak et al., 2015). Such biases can compromise accurate drought detection and impede effective implementation of mitigation strategies (Vernimmen et al., 2012). To overcome this obstacle, researchers are now shifting to rigorous evaluation assessments which involve in-situ measurement validation prior to their application in water or drought management (Gao, Zhang, Ren, et al., 2018). Such evaluation ensures selection of appropriate RS products that exhibit minimal biases, while accurately capturing both spatial and temporal variability of drought events (Baez-Villanueva et al., 2018). Additionally, it may guide researchers on selection of appropriate bias correction techniques for modelling purposes or related applications. One advantage of this analysis is that it may allow application of RS datasets in data scarce regions with greater degree of confidence, thus improving management strategies in those regions (Orieschnig & Cavus, 2024).
RS data may be integrated into drought indicators to investigate droughts within a region (Mukama et al., 2025). While scientists have developed numerous drought indicators in the field of science, the Standardized Precipitation Index (SPI) remains one of the widely used and strongly recommended indicators for assessing meteorological droughts (McKee et al., 1993). This is primarily due to its simplicity in terms of data requirements and its multiscale features that allow characterizing different drought types (Gumus, 2023). Moreover, its successful application in identification of historical droughts across the world remains well documented and widely recognized. A more in-depth analysis of droughts involves examining temporal continuity and intensity of dry periods. This aspect is often captured in climate indices such as the Consecutive Dry Days (CDD) developed by the Expert Team on Climate Change Detection and Indices (ETCCDI) (Ayugi et al., 2021). A combination of SPI and CDD indices provides a comprehensive understanding of drought characteristics including their persistence which is vital for sustainability of water resources under changing climate (Tibangayuka et al., 2024).
The Great Ruaha River Basin (GRRB) located in southern Tanzania has witnessed increased frequency and intensity of drought events in recent decades (WWF, 2017). These changes have been primarily attributed to high precipitation variabilities arising from climate change (Kangalawe et al., 2011; Mukama et al., 2025; Ogembo, Thiery, et al., 2025). As a result, droughts have significantly impacted key sectors such as agriculture, energy, water supply, tourism and industry (SMUWC, 2001). Despite such circumstances, drought research in the region remains limited mainly due to lack of consistent and reliable observational data such as precipitation. Although numerous precipitation RS datasets exist, studies that primarily focused on validating such products against existing in-situ measurements to support drought management are nearly non-existent.
In response to this significant research gap, the present study aims to address the challenge through the following specific objectives: (1) To rigorously evaluate accuracy of four high-resolution remote sensing precipitation products against in-situ data and assess their ability to capture temporal precipitation patterns across multiple timescales, and (2) to compare historical drought periods and extreme dry days from ground-based observations with those detected by remote sensing, and evaluate their accuracy using statistical indices. Unlike previous studies, we benchmarked multiple RS datasets using observed precipitation, SPI and CDD indices in the GRRB. The four high resolution precipitation remote sensing datasets include CHIRPS, TAMSAT, PERSIANN-CDR and MSWEP. Statistical indices used were Pearson correlation coefficient (r), Bias, Mean Error (ME) and Root Mean Square Error (RMSE).
2. Study Area and Data
2.1. Study Area
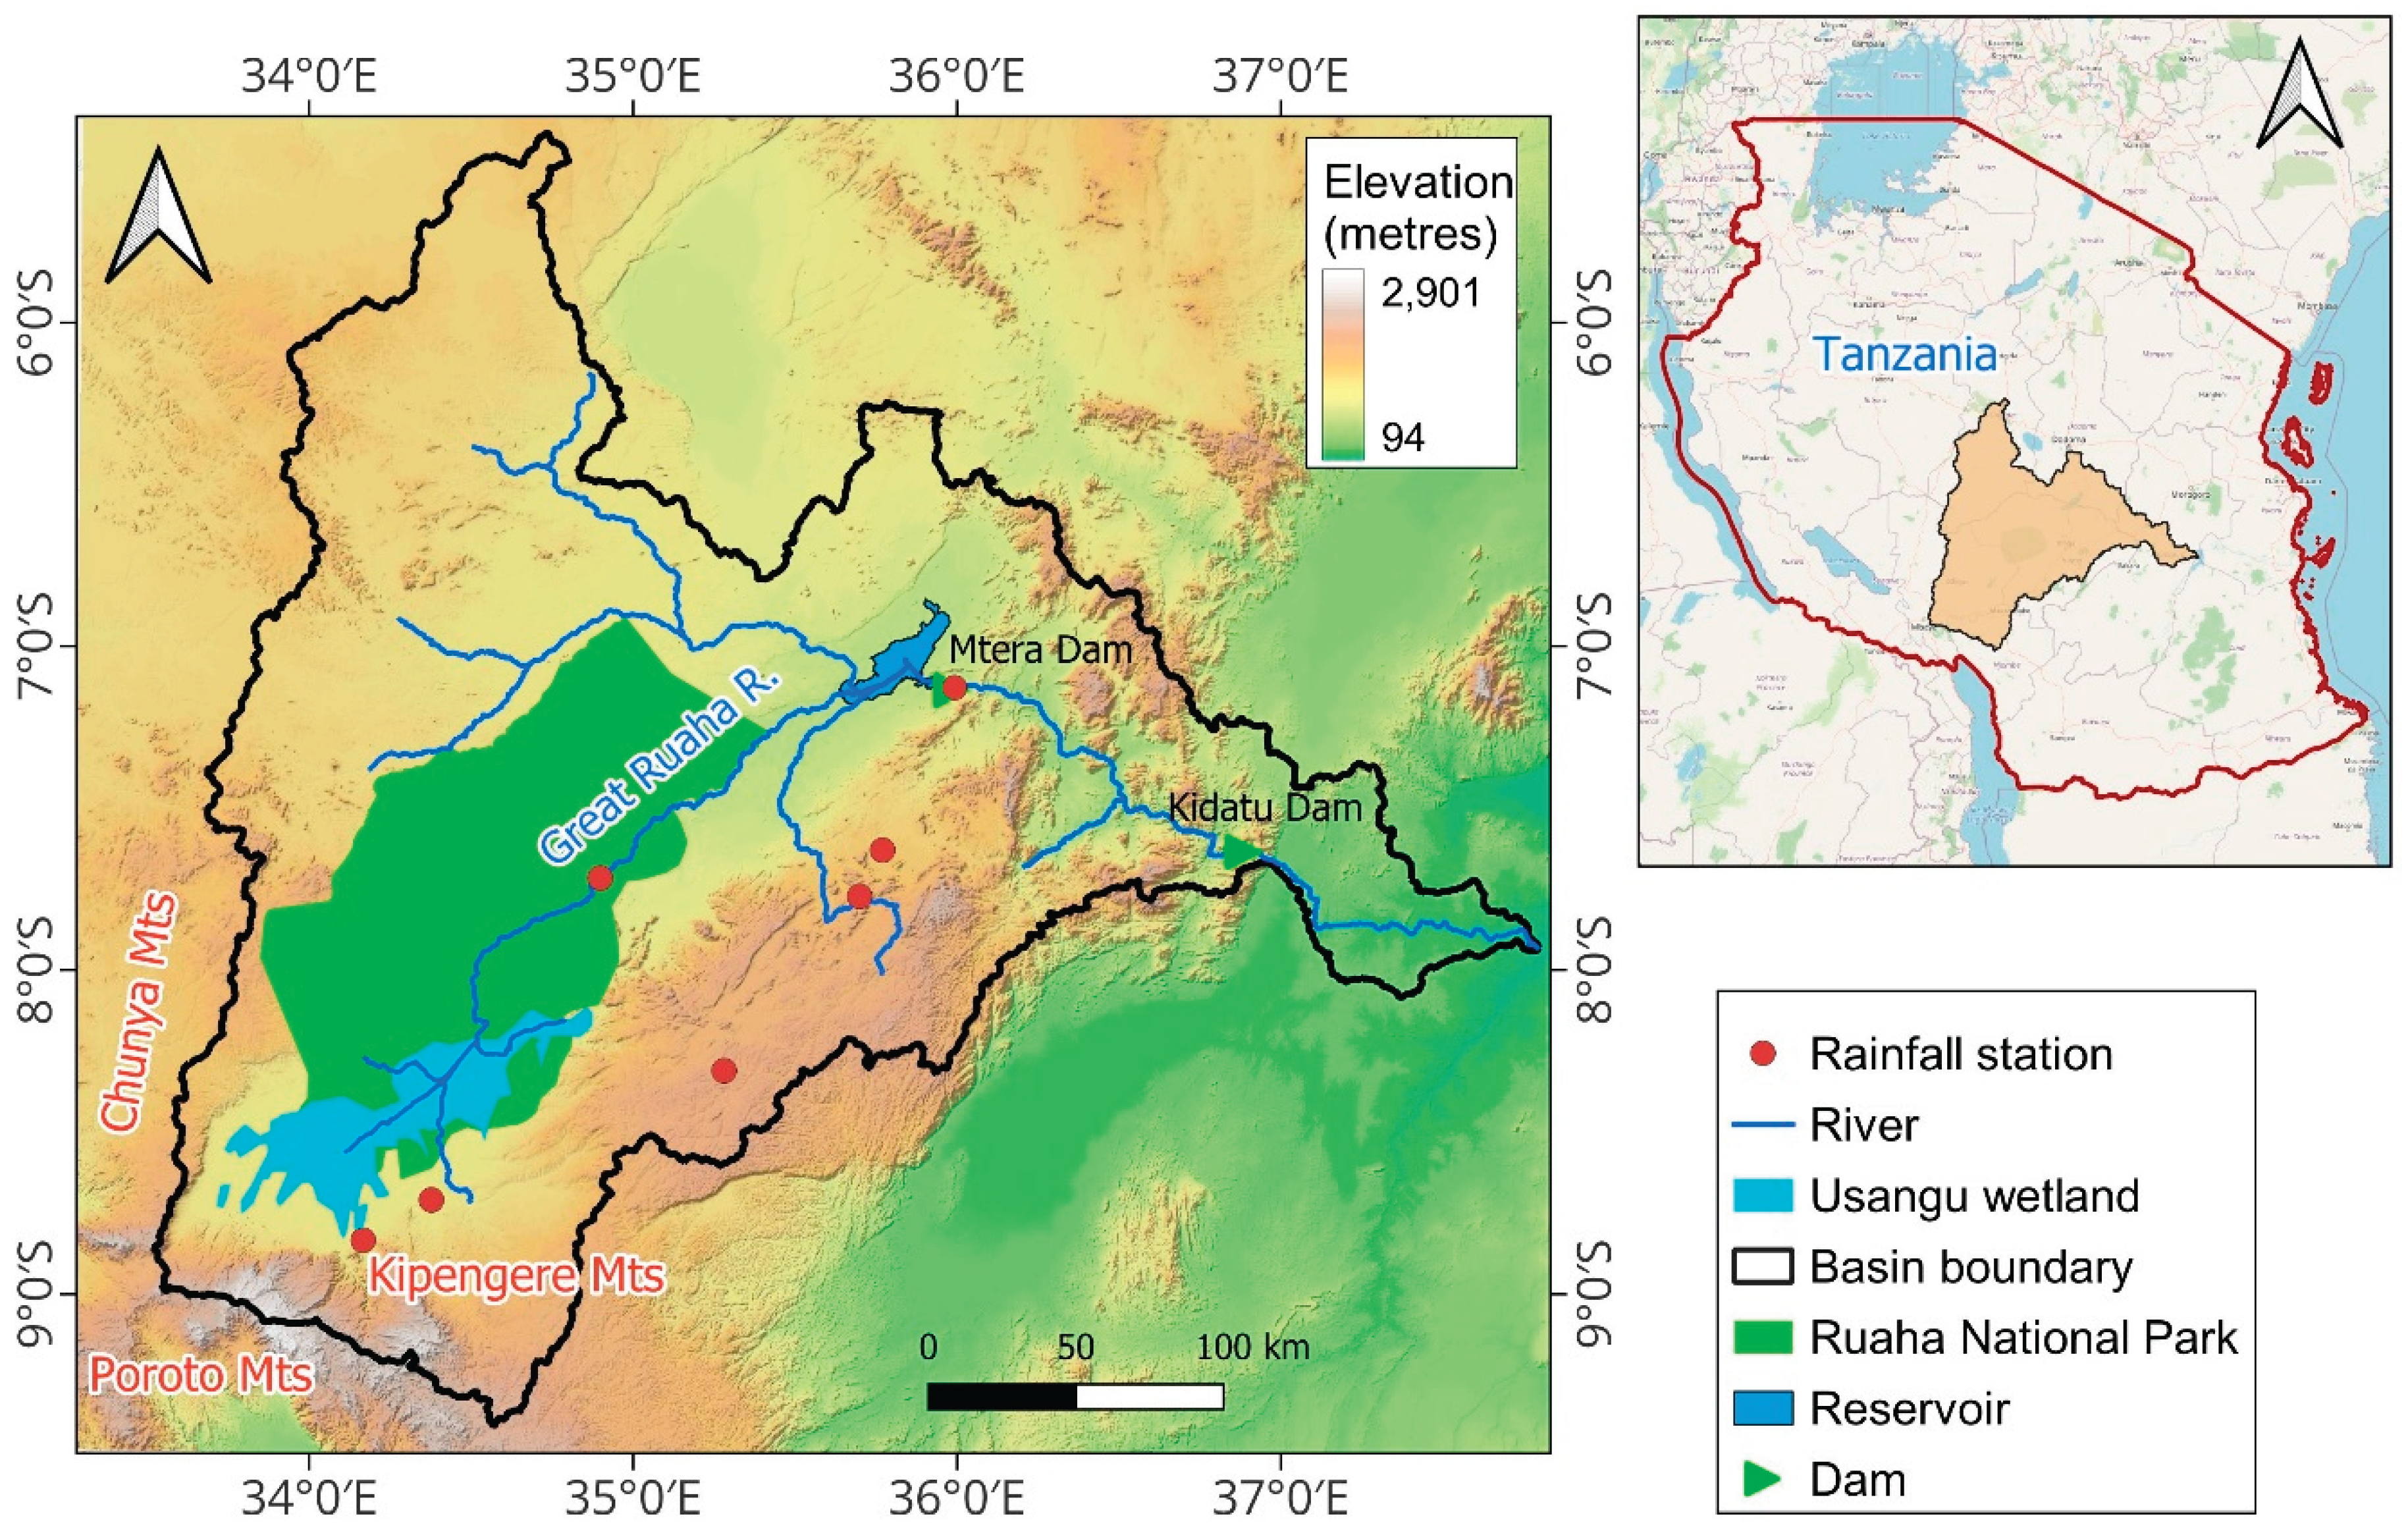
The Great Ruaha River Basin (GRRB) is located in southwestern part of Tanzania between latitudes 60 4′ and 90 41′ South and longitudes 330 40′ and 370 41′ East. It covers an area of approximately 85,554 km2 (Figure 1). The Great Ruaha River is an important tributary of Rufiji River originating from several large and small streams on slopes of Poroto Mountains and Kipengere Range, southeast of the city of Mbeya. It flows through Usangu wetlands located near the center of the catchment. The river also flows through Ruaha National Park (RNP), one of the largest national parks in Tanzania rich in biodiversity and an important hub for tourism (Twaha et al., 2024). The river further descends downstream to feed Mtera and Kidatu reservoirs which are collectively used for hydroelectric power generation in the country.
The catchment lies in tropical climatic zone and is characterized by unimodal rainfall type. Wet season begins in November and extends to May while dry season mainly occurs from June to October. Rainfall varies spatially with highlands receiving more precipitation than lowlands. On average, the basin receives between 400 to 1600 mm of rainfall annually. Climate is characterized by low humidity and high potential evaporation reaching up to 1900 mm (SMUWC, 2001). Temperature ranges from lows of around 150C to highs of 320C in October, November and December. From January to August high temperatures are around 290C while lows are around 190C (January-May) and 150C (June-September).
Majority of population practice subsistence farming and depend on rainfed agriculture for their livelihood. However, irrigated agriculture is also practiced all year round both during wet and dry seasons using abstracted river and groundwater resources (WWF, 2017). Other key economic activities include livestock keeping, fishing and tourism.
Figure 1.
Geographical location of the study area including ground-based stations selected for validation.
Figure 1.
Geographical location of the study area including ground-based stations selected for validation.
2.2. Data
2.2.1. Observed Precipitation Data
Observed precipitation data from seven rain gauge stations (Table 1) located within the basin were collected from Rufiji Basin Water Board Offices (RBWBO). Initially, 13 stations were available but due to inconsistencies in timeseries, such as significant data gaps or shorter precipitation records some stations were discarded. Table 1 consists of important information on selected stations for this study. In addition, their spatial location is presented in Figure 1. These stations were used as a benchmark in evaluating performance of remote sensing (RS) datasets in detecting precipitation and drought patterns within the study area.
2.2.2. Remote Sensing Precipitation Data
This study utilized four high resolution precipitation RS datasets to investigate their effectiveness in detecting historical droughts and rainfall patterns. It involved comparison against ground observations and evaluation of their performance using various statistical indices as described in Section 3.3. These RS products included the Climate Hazards Center InfraRed Precipitation with Station data (CHIRPS), Tropical Applications of Meteorology using Satellite data (TAMSAT), Precipitation Estimation from Remotely Sensed Information using Artificial Neural Networks - Climate Data Record (PERSIANN-CDR) and Multi-Source Weighted-Ensemble Precipitation (MSWEP). Selection of RS products was based on their resolution, applicability in drought and water management studies and relevance in African settings as demonstrated by several previous studies (Cattani et al., 2021; Goudiaby et al., 2024; Mukama et al., 2025; Wodebo et al., 2025).
CHIRPS version 2.0 is a high resolution (0.05o spatial resolution) quasi-global precipitation product produced after blending satellite observations with in-situ measurements. It contains daily, decadal and annual observations spanning from 1981 to near present. It was originally developed to support drought and environmental management. This product is available at https://www.chc.ucsb.edu/data/chirps, last accessed on 23.04.2025. TAMSAT version 3.1 is another widely used RS product offering a high spatial resolution of 0.0375o. It was derived using both satellite data and ground based observations with a temporal resolution of daily, decadal, pentadal and monthly scales. It spans from 1983 to near present specifically covering African continent. This data may be downloaded from (https://research.reading.ac.uk/tamsat/, last accessed on 23.04.2025). This data data has been designed to support famine early warning, droughts and agricultural decision support (Maidment et al., 2014).
MSWEP version 2 is a global high resolution (0.1o) precipitation product produced optimally after merging satellite data, reanalysis estimates and ground based observations. It’s available at 3-hourly, daily and monthly timescales spanning from 1979 to 2020. The data is accessible from https://www.gloh2o.org/mswep/, last accessed on 23.04.2025. One advantage of this product is that it has been comprehensively evaluated against gauge measurements across the globe (Beck et al., 2017). Additionally, it has been widely used to drive ecohydrological models, perform water resources analysis and soil moisture applications (Beck et al., 2019).
PERSIANN-CDR is another global dataset with approximately 0.25o spatial resolution developed by precipitation estimates from remote sensing information using Artificial Neural Networks (Nguyen et al., 2019). It’s available at daily, monthly and annual timescales, spanning from 1983 to 2023. This data may be accessed from https://www.ncei.noaa.gov/products/climate-data-records/precipitation-persiann, last accessed on 23.04.2025).
3. Methods
3.1. Computation of the Standardized Precipitation Index (SPI)
The Standardized Precipitation Index (SPI) developed by McKee et al. (1993) was used to compute meteorological droughts from both observed and remote sensing data at the 12-month timescale. It operates by fitting accumulated precipitation data to a gamma probability distribution using equation 1 (Mukama et al., 2025).
where: , α and β are precipitation timeseries, shape and scale parameters respectively. is the gamma function defined as with α and β being parameters of the distribution estimated by maximum likelihood method using equation (2).
where: , and A represent precipitation average, number of precipitation observations and sample statistic respectively. The cumulative probability for a given month was calculated using equation (3).
Finally, accumulated values were transformed into standardized values using equations 4 and 5 (Abramowitz & Stegun, 1965).
where: , is the probability derived from gamma distribution with constants =2.515517, =0.802853, =0.010328, =1.432788, =0.189269 and =0.001308.
3.2. Identification of Drought Characteristics
After computation of SPI, run theory approach originally developed by Yevjevich (1967) was used to derive drought characteristics particularly drought duration. A threshold of -1 was selected for characterizing drought events with a drought event defined when the index value fell below this threshold for at least two consecutive months. Drought duration was defined as the period between initiation and termination of a drought event. Detailed explanation of this method is provided in Mukama et al. (2025). Drought duration derived from RS datasets were compared with those obtained from ground observations to further assess effectiveness of RS products in capturing drought events.
3.3. Computation of Consecutive Dry Days (CDD)
To further investigate on drought conditions, the most extreme dry days in precipitation timeseries were identified using maximum annual number of Consecutive Dry Days (CDD), a climate index developed by the Expert Team on Climate Change Detection and Indices (ETCCDI) (Tibangayuka et al., 2024). In this approach, days with precipitation amount less than 1.0 mm were classified as dry. CDD was computed for all RS datasets and compared to CDD derived from observed data to assess effectiveness of these datasets in reproducing extreme dry periods. This index was chosen due to its widespread use and recommendation in drought related studies (Ayugi et al., 2021; Tibangayuka et al., 2024).
3.4. Performance Evaluation of Remote Sensing Precipitation Datasets
Timeseries comparison was conducted between observed station data and corresponding pixel values from each RS dataset (i.e., point to pixel comparison) at daily, monthly, seasonal (wet/dry) and annual timescales. For this case, rain gauge data served as reference for evaluating performance of RS datasets. This methodology has been widely used for validating RS products (Baez-Villanueva et al., 2018). Several statistical metrics including mean error (ME), root mean square error (RMSE), bias (BIAS) and Pearson correlation coefficient (r) were utilized to assess the ability of RS datasets to detect ground observed precipitation (Gao et al., 2018). RMSE, ME and BIAS were used to measure errors and bias while r was used to measure linear relationship between observed and RS datasets. Description of statistical metrics used in this study are summarized in Table 2.
Analysis (comparison) period selected in the present study was from 1983 to 2020 since most of RS products overlap with observed data at this time. Furthermore, to ensure consistency in comparison with ground observations, corresponding missing data within the RS datasets were excluded. For annual aggregation, any year with more than 60 days of missing data was excluded from comparison to ensure accuracy since the total sum in that particular year would significantly be affected by amount of missing data. For wet and dry season aggregation, a threshold of 30 days was used to exclude affected years.
denotes remote sensing precipitation; denotes mean of remote sensing precipitation; denotes observed precipitation; denotes mean of observed precipitation and denotes number of samples.
4. Results
4.1. Performance of Various RS Products in Detecting Observed Precipitation
Daily correlation coefficient (r) of remote sensing (RS) products was generally low with exception of MSWEP at Iringa Met station which achieved a Pearson correlation coefficient (r) of 0.58. For all other products and stations r values remained below the commonly accepted satisfactory threshold of 0.5 (Moriasi et al., 2015). Specifically, CHIRPS ranged from 0.24 to 0.39, MSWEP from 0.24 to 0.59, PERSIANN from 0.26 to 0.39, and TAMSAT from 0.21 to 0.44 (Figure 2a). Overall, as shown in Figure 2b, MSWEP slightly outperformed other datasets, while TAMSAT consistently reported lower correlation coefficients and higher underestimation biases relative to other products. Despite low correlation values, all products demonstrated relatively good performance in other metrics. Mean Error (ME) ranged from -0.43 to 1.30 mm, RMSE from 4.96 to 7.83 mm, and Bias from -0.41 to 1.31. Notably, CHIRPS, MSWEP and PERSIANN tended to overestimate daily precipitation across most stations whereas TAMSAT consistently underestimated it.
Figure 2.
a: Correlation heatmap at daily, monthly, wet season, dry season and annual timescales for different rain gauge stations. b: Overall distribution of correlation coefficient across various timescales.
Figure 2.
a: Correlation heatmap at daily, monthly, wet season, dry season and annual timescales for different rain gauge stations. b: Overall distribution of correlation coefficient across various timescales.
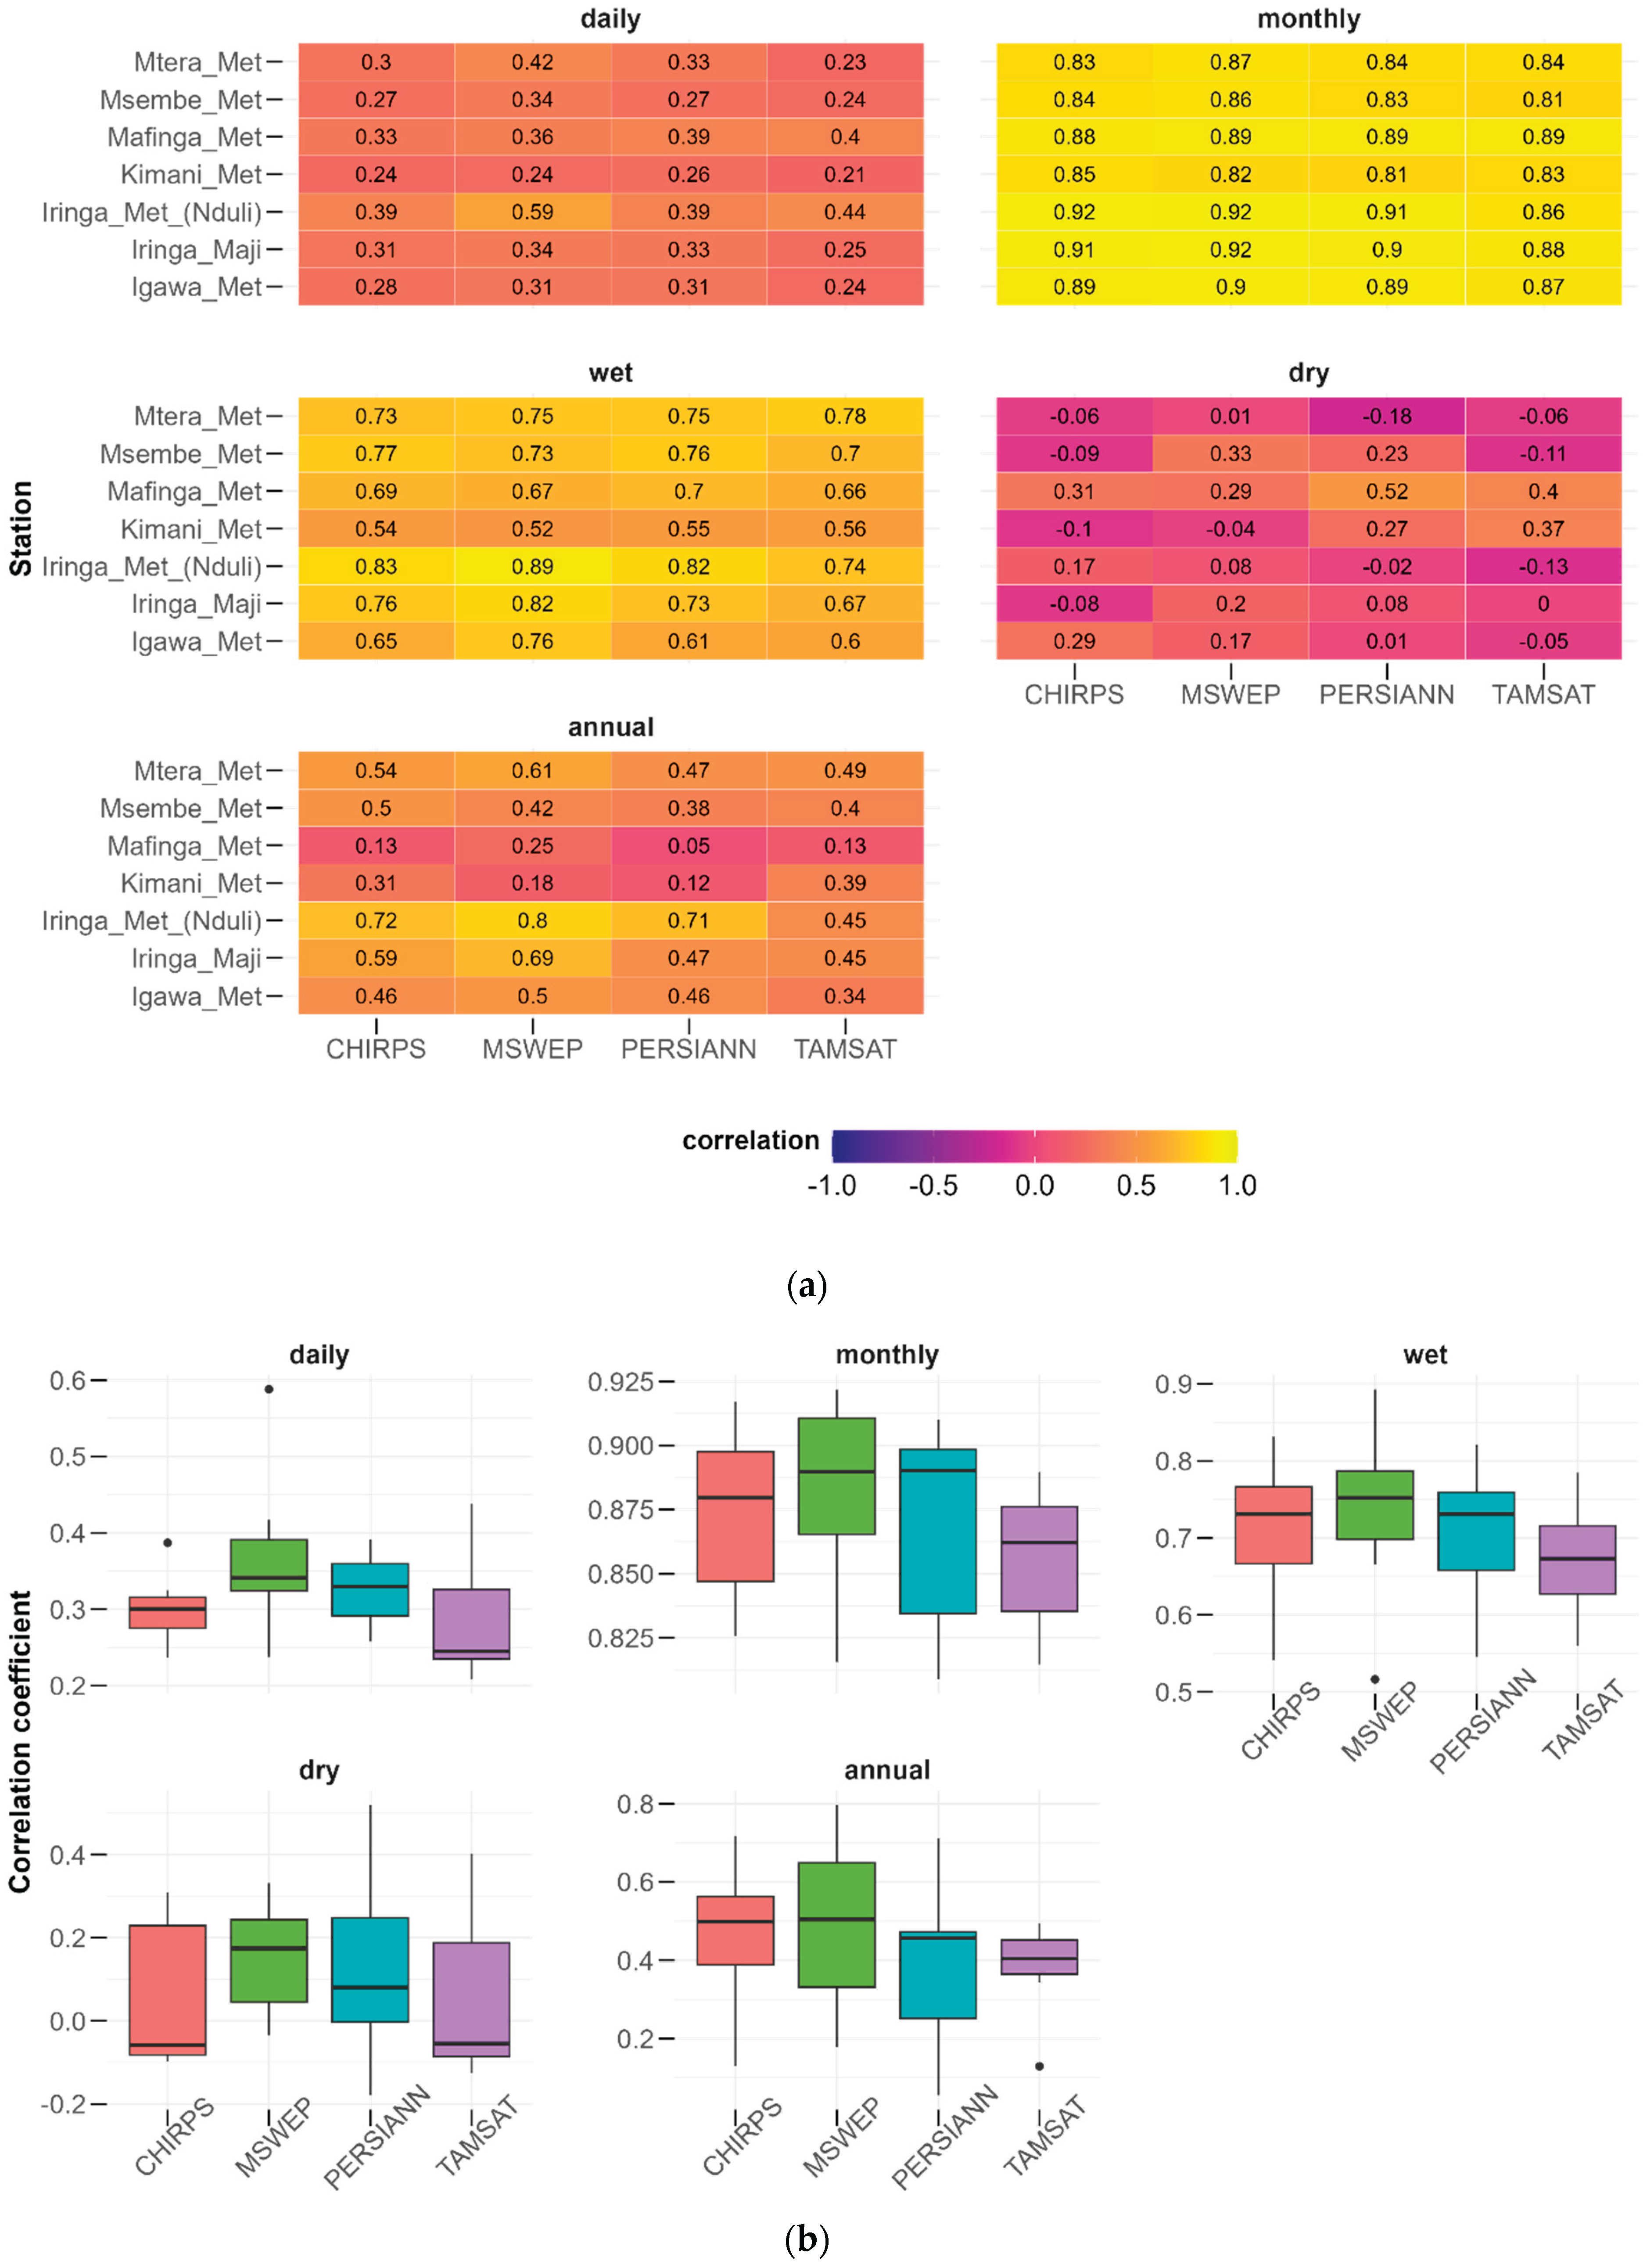
The correlation coefficient performance for majority of RS datasets improved significantly at monthly timescale. All RS products achieved an r > 0.80. Notably, Iringa Met (Nduli) and Iringa Maji stations achieved highest performances (r>0.90) in all RS datasets except for TAMSAT. In order of rank, MSWEP performed best closely followed by CHIRPS and PERSIANN and TAMSAT slightly below (Figure 2b). Performance using ME, RMSE and Bias slightly lowered compared to daily timescale. Magnitude of these metrics increased with PERSIANN dataset exhibiting pronounced positive magnitudes (reaching up to 50 mm in some cases) compared to the rest of the products (Figures 3b, 4b and 5b). Similarly, in most cases TAMSAT was found to underestimate the monthly precipitation contrary to the rest of the products.
Figure 3.
a: Mean Error (ME) heatmap at daily, monthly, wet season, dry season and annual timescales for different rain gauge stations. b: Overall distribution of mean error across various timescales.
Figure 3.
a: Mean Error (ME) heatmap at daily, monthly, wet season, dry season and annual timescales for different rain gauge stations. b: Overall distribution of mean error across various timescales.
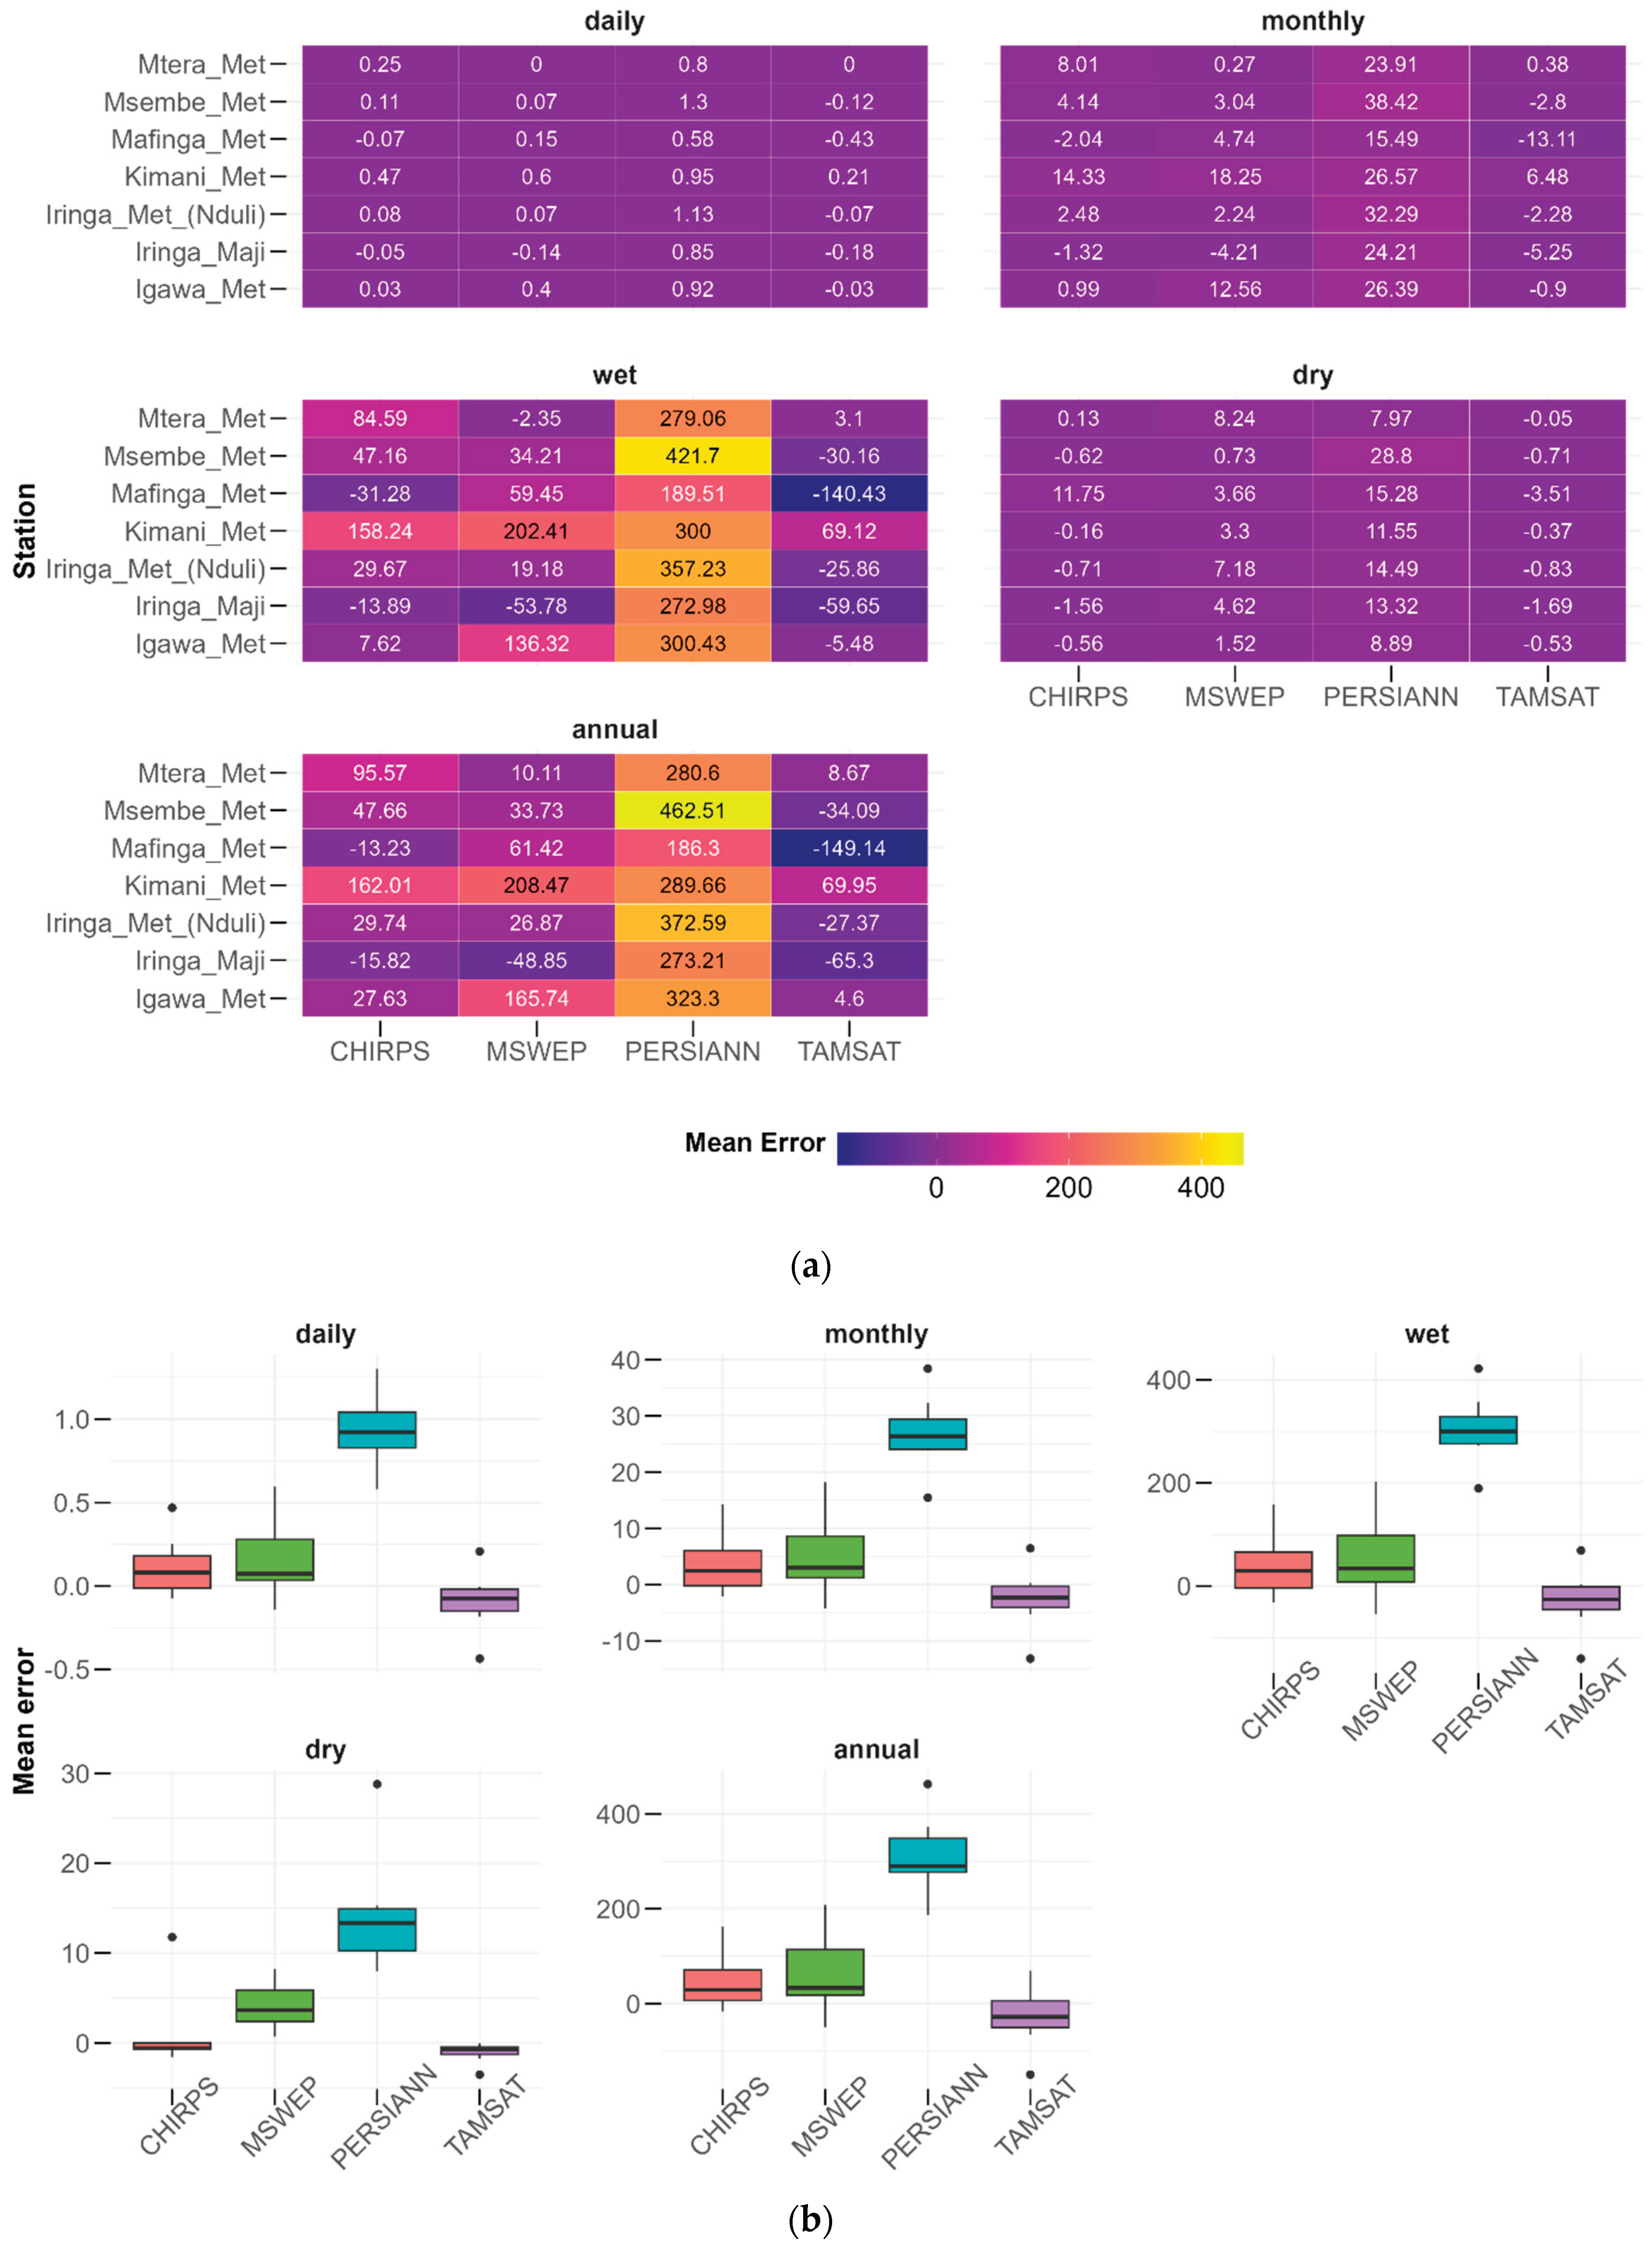
For wet season (October-May) in particular, correlation coefficient slightly lowered in most of stations as compared to monthly precipitation. However, this performance was higher compared to daily precipitation. Most stations were above 0.5 threshold. Specifically, CHIRPS performance range was 0.54 - 0.83, MSWEP was 0.52 - 0.89, PERSIANN was 0.55 - 0.82, while TAMSAT range was 0.56 - 0.78. Notably, performance was poor for other metrics such as Bias, ME and RMSE. Higher values exceeding 400 mm were encountered in this case, mostly with PERSIANN dataset while the rest hardly exceeded 200 mm.
Dry season correlation coefficient revealed weakest relationship in most of the stations compared to the rest of the timescales. Except for Mafinga Met station under PERSIANN dataset which achieved r = 0.52, the rest of the stations hardly crossed a correlation of 0.3. However, for the rest of the metrics, different RS products performed well by yielding low biases and error values. TAMSAT was found to underestimate dry season precipitation as well, while the rest of the products overestimated it with exception of CHIRPS which had a mixed Bias.
Figure 4.
a: Root mean square error (RMSE) heatmap at daily, monthly, wet season, dry season and annual timescales for different rain gauge stations. b: Overall distribution of the RMSE across various timescales.
Figure 4.
a: Root mean square error (RMSE) heatmap at daily, monthly, wet season, dry season and annual timescales for different rain gauge stations. b: Overall distribution of the RMSE across various timescales.
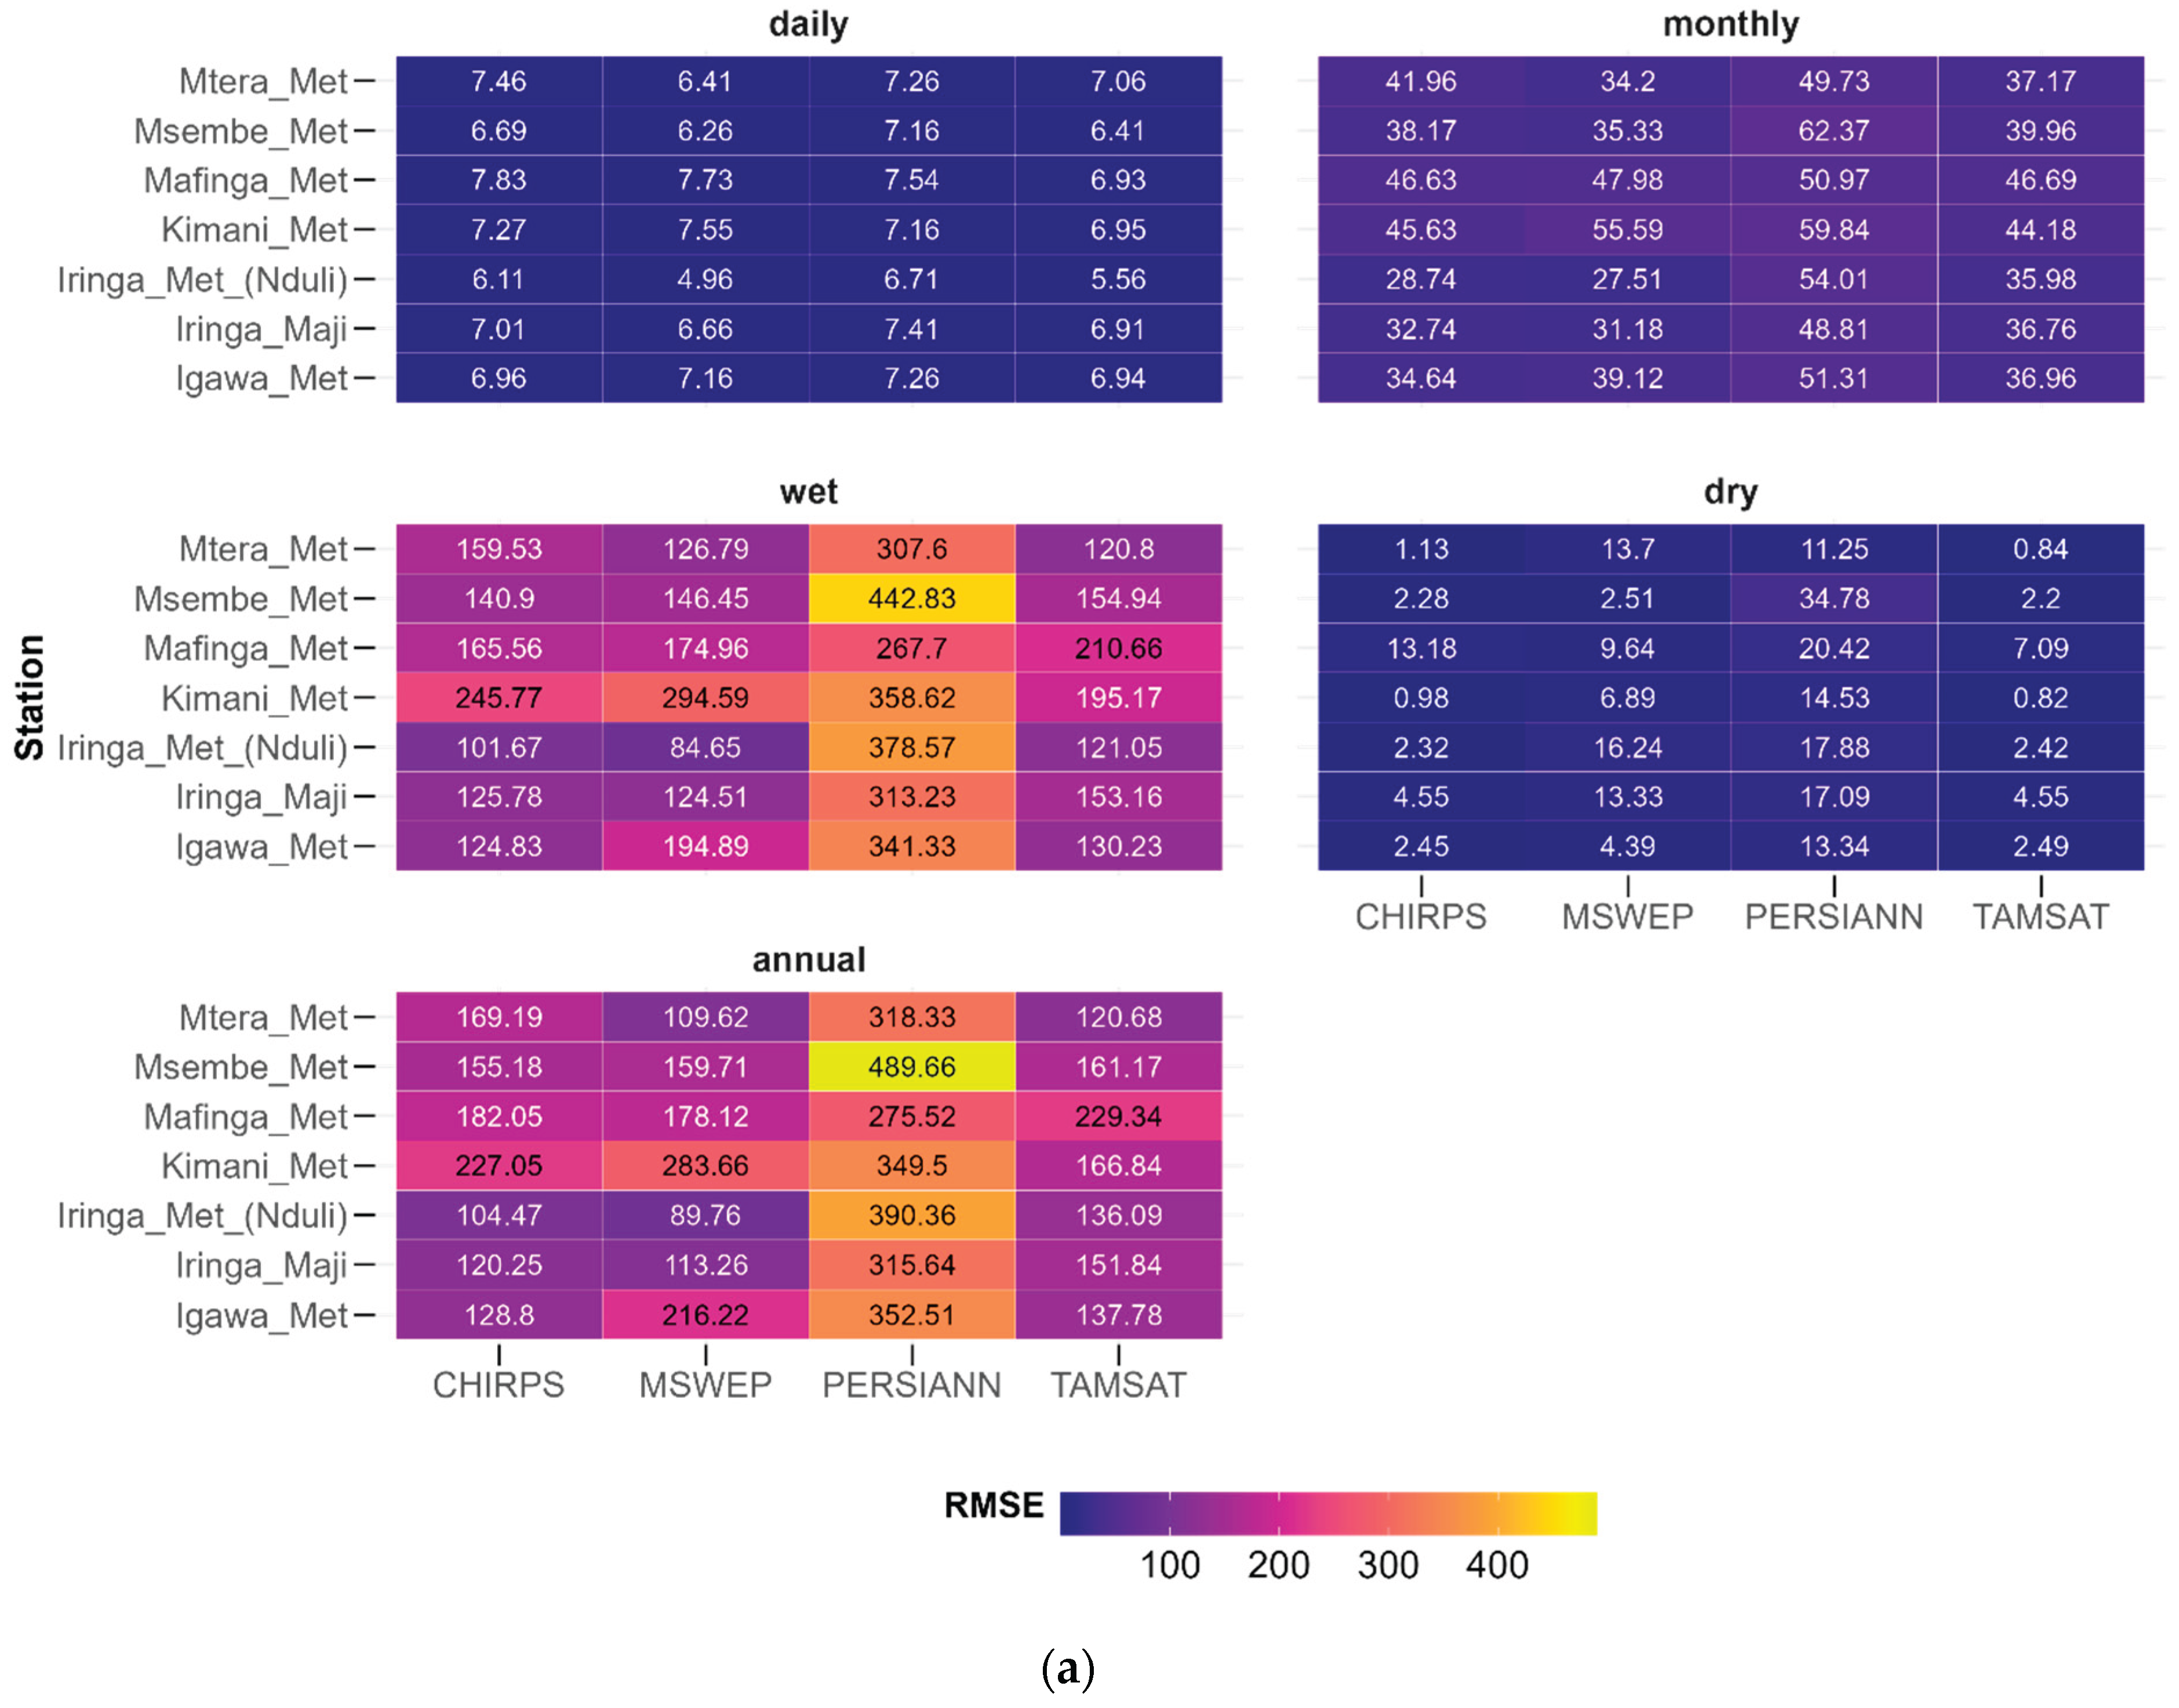
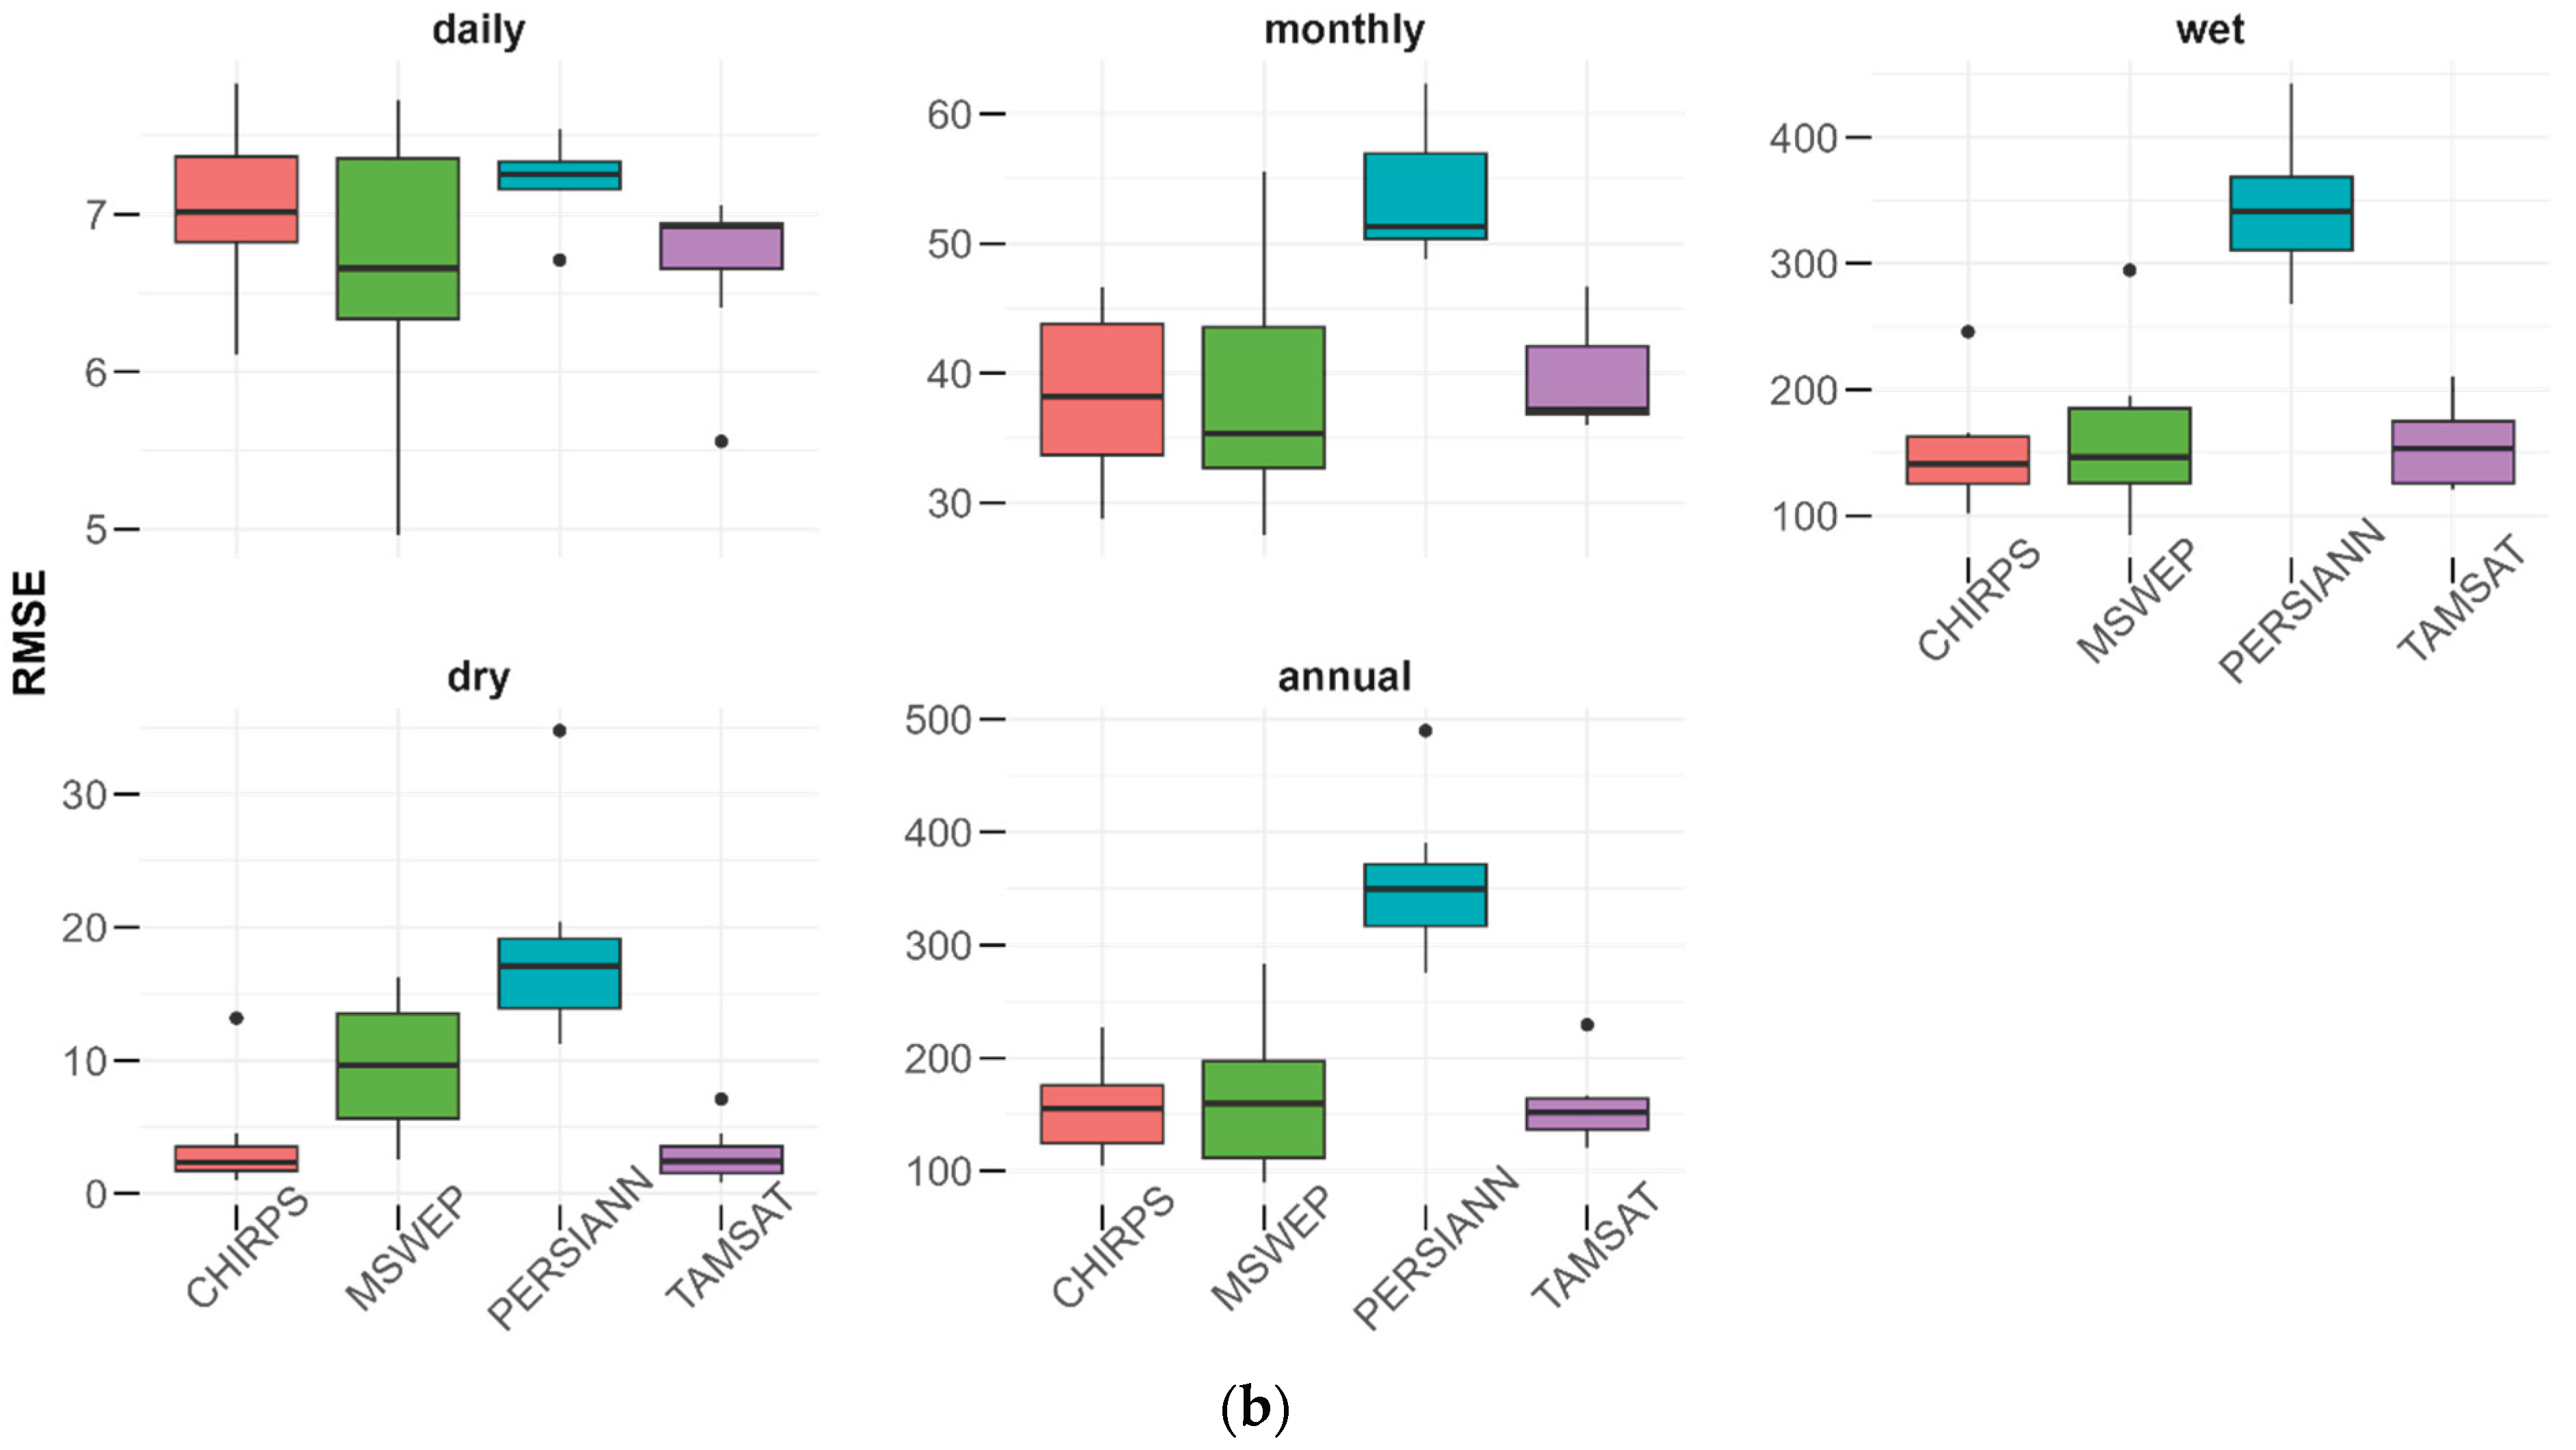
Figure 5.
a: Bias heatmap at daily, monthly, wet season, dry season and annual timescales for different rain gauge stations. b: Overall distribution of Bias across various timescales.
Figure 5.
a: Bias heatmap at daily, monthly, wet season, dry season and annual timescales for different rain gauge stations. b: Overall distribution of Bias across various timescales.
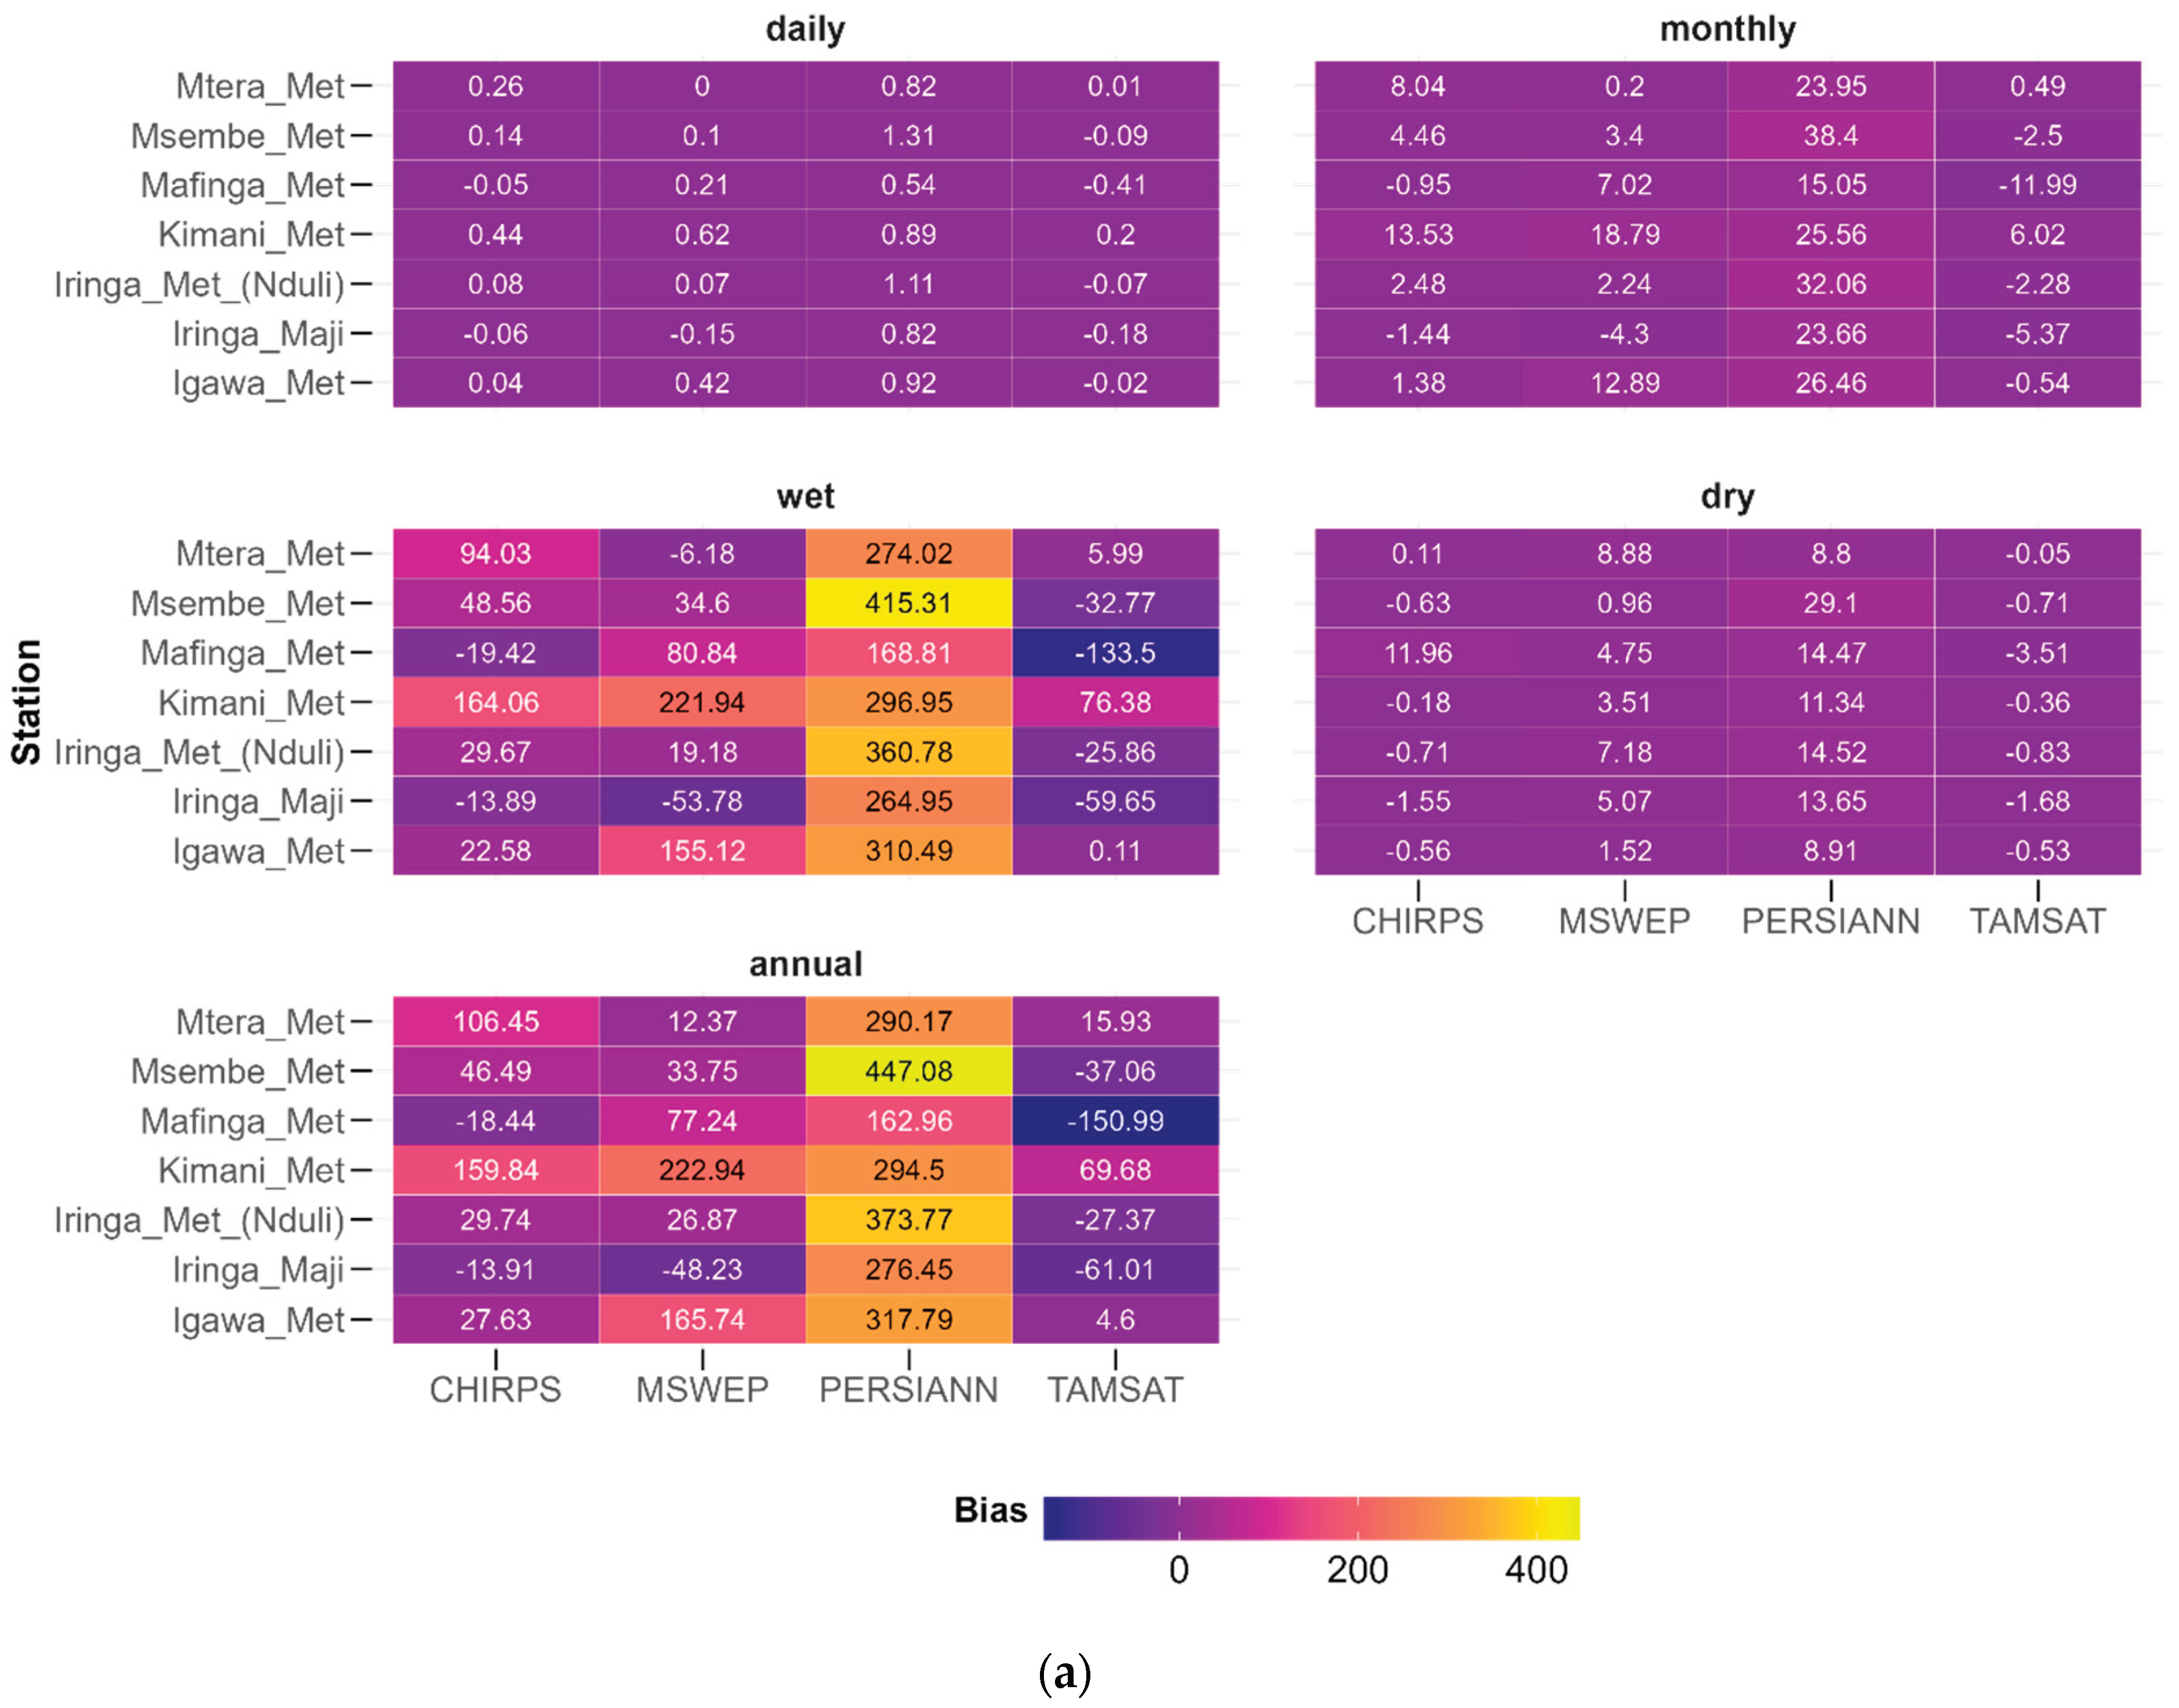
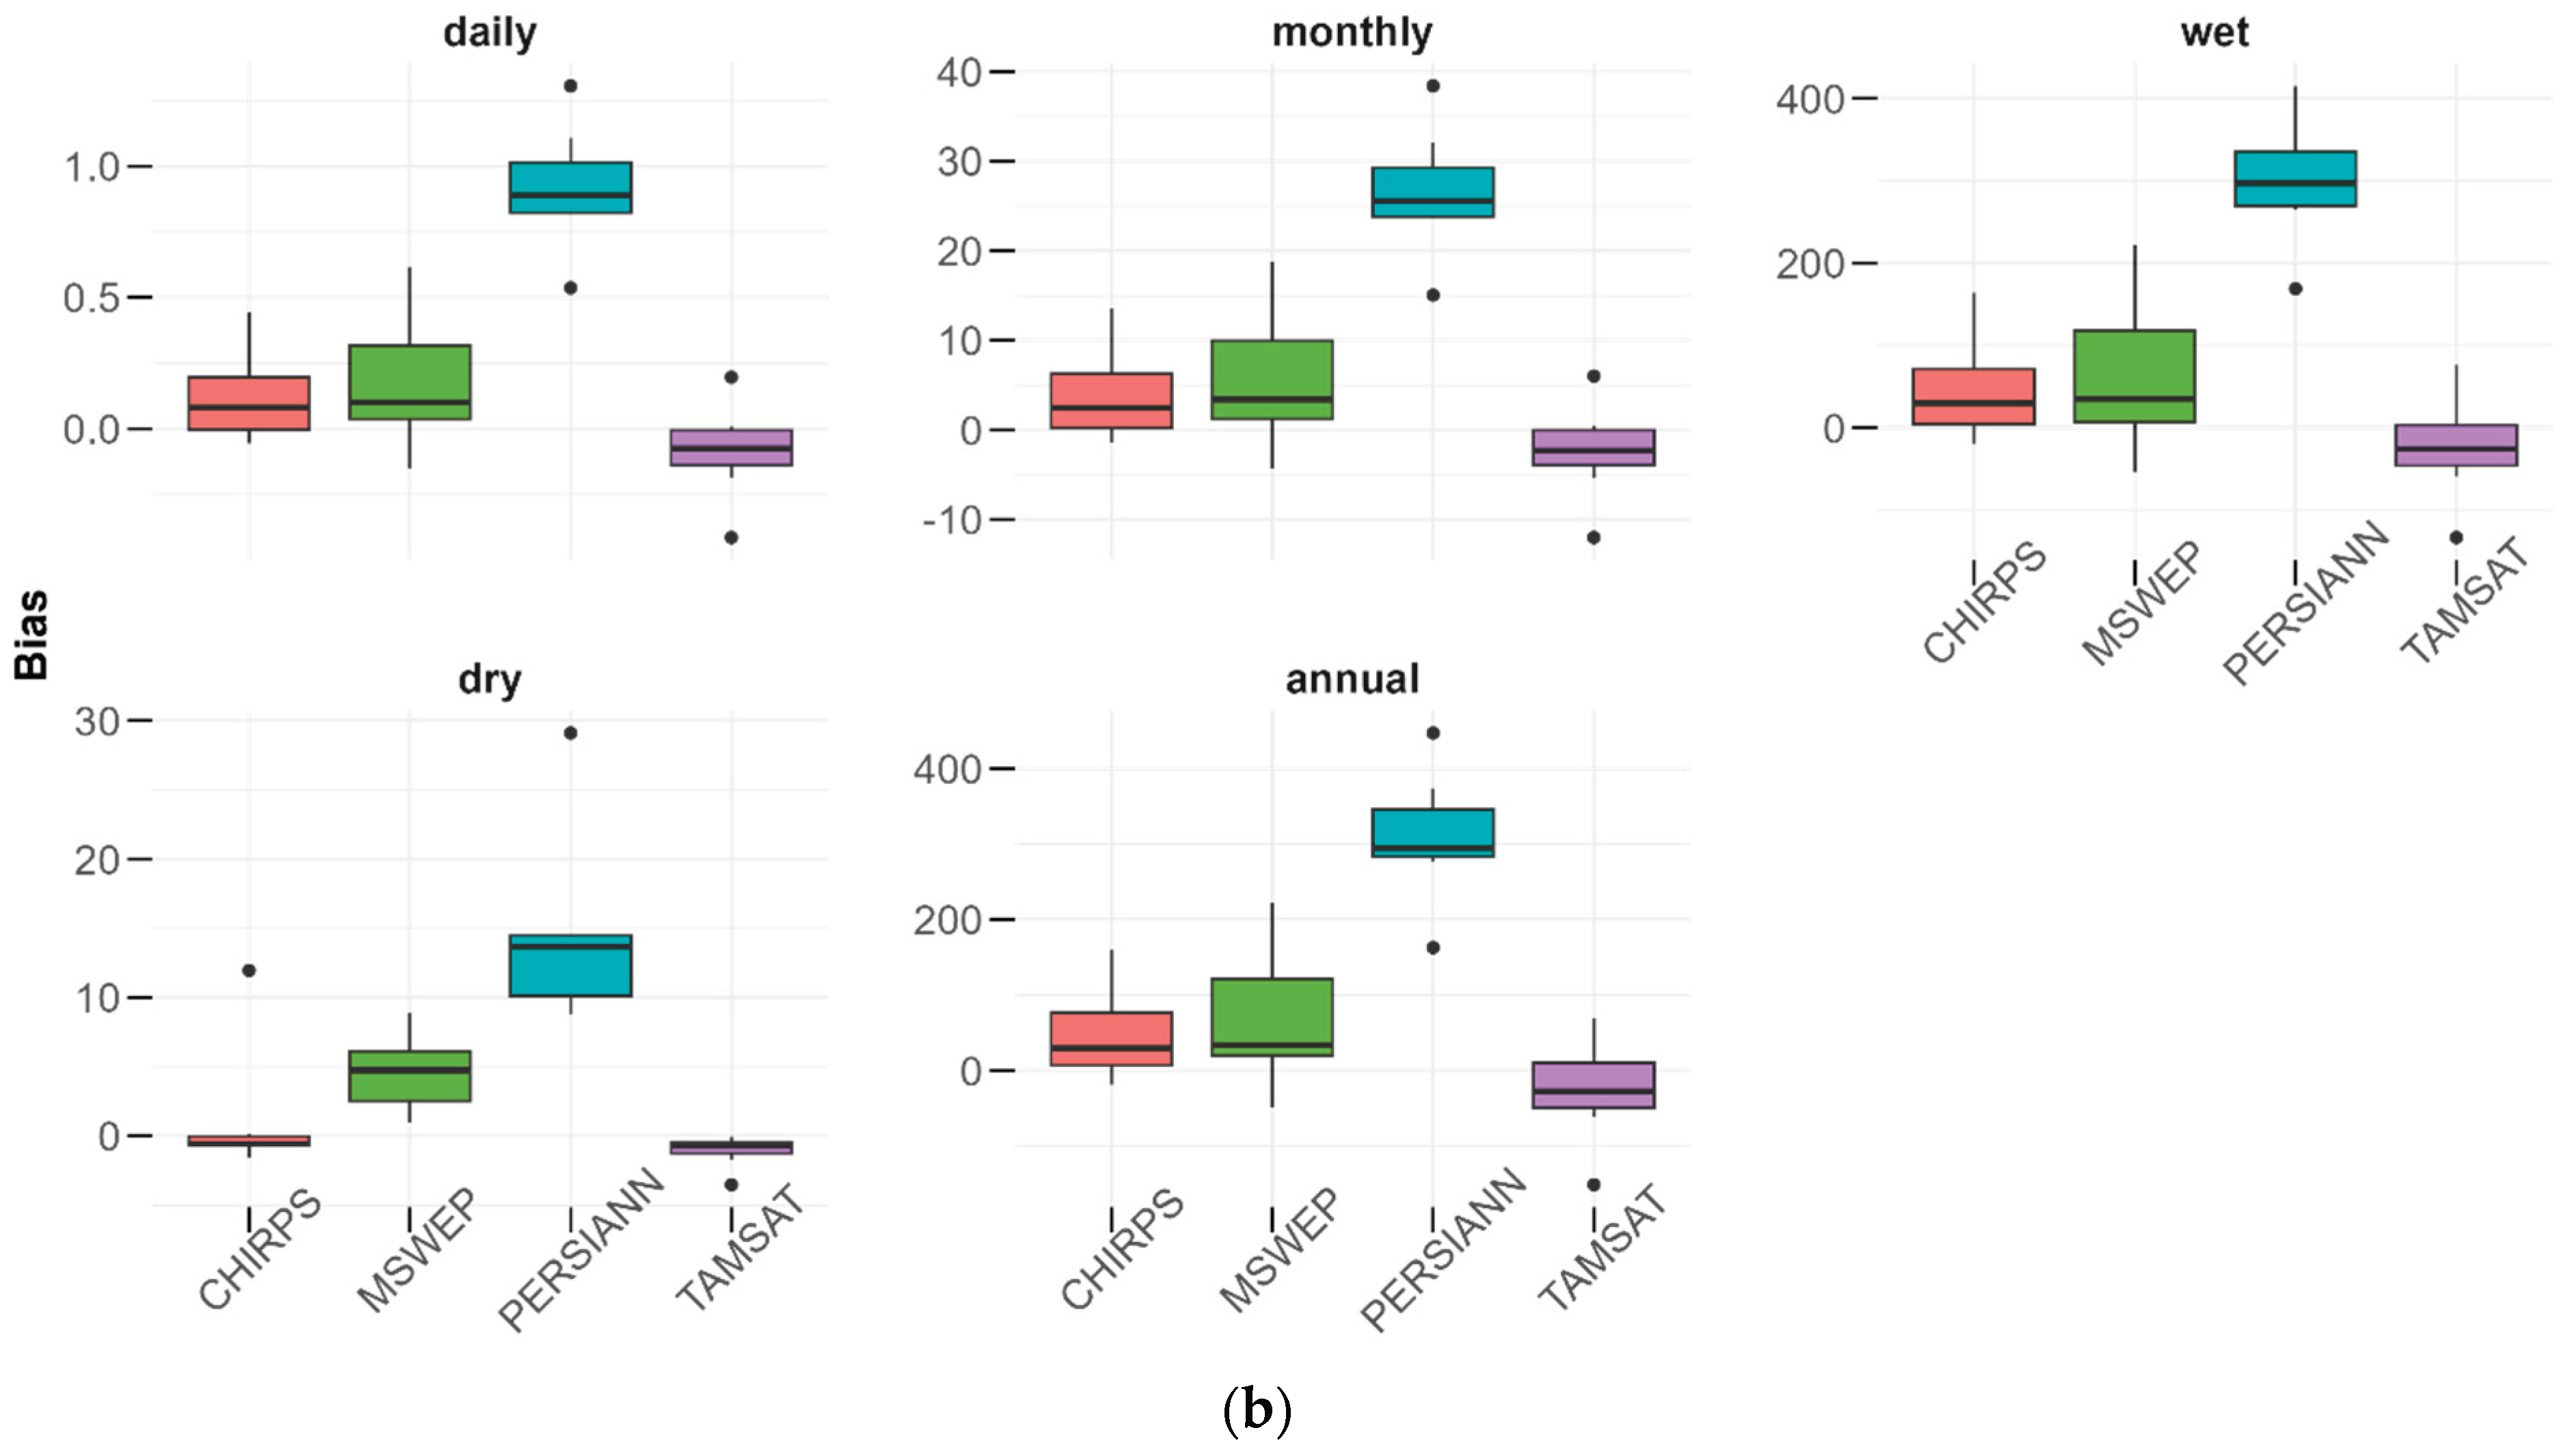
Performance under the annual timestep revealed considerable variability among the metrics. Regarding correlation coefficient, CHIRPS and MSWEP had values above 0.5 in some few stations while other products struggled. The overall finding indicates that both CHIRPS and MSWEP outperformed the rest of the products. Similarly, performance under other metrics was poor (similar to wet period) with PERSIANN dataset exhibiting high error and bias magnitudes.
In general, performance of RS products in capturing observed precipitation revealed substantial variabilities across timescales. Monthly and wet season timescales displayed best correlation values whereas dry season timescale displayed the poorest. In terms of bias and error magnitudes, the daily timescale followed by dry season timescale revealed the least magnitudes.
4.2. Temporal Comparison of RS Precipitation Products Against Ground Observations at Monthly, Seasonal and Annual Timescales
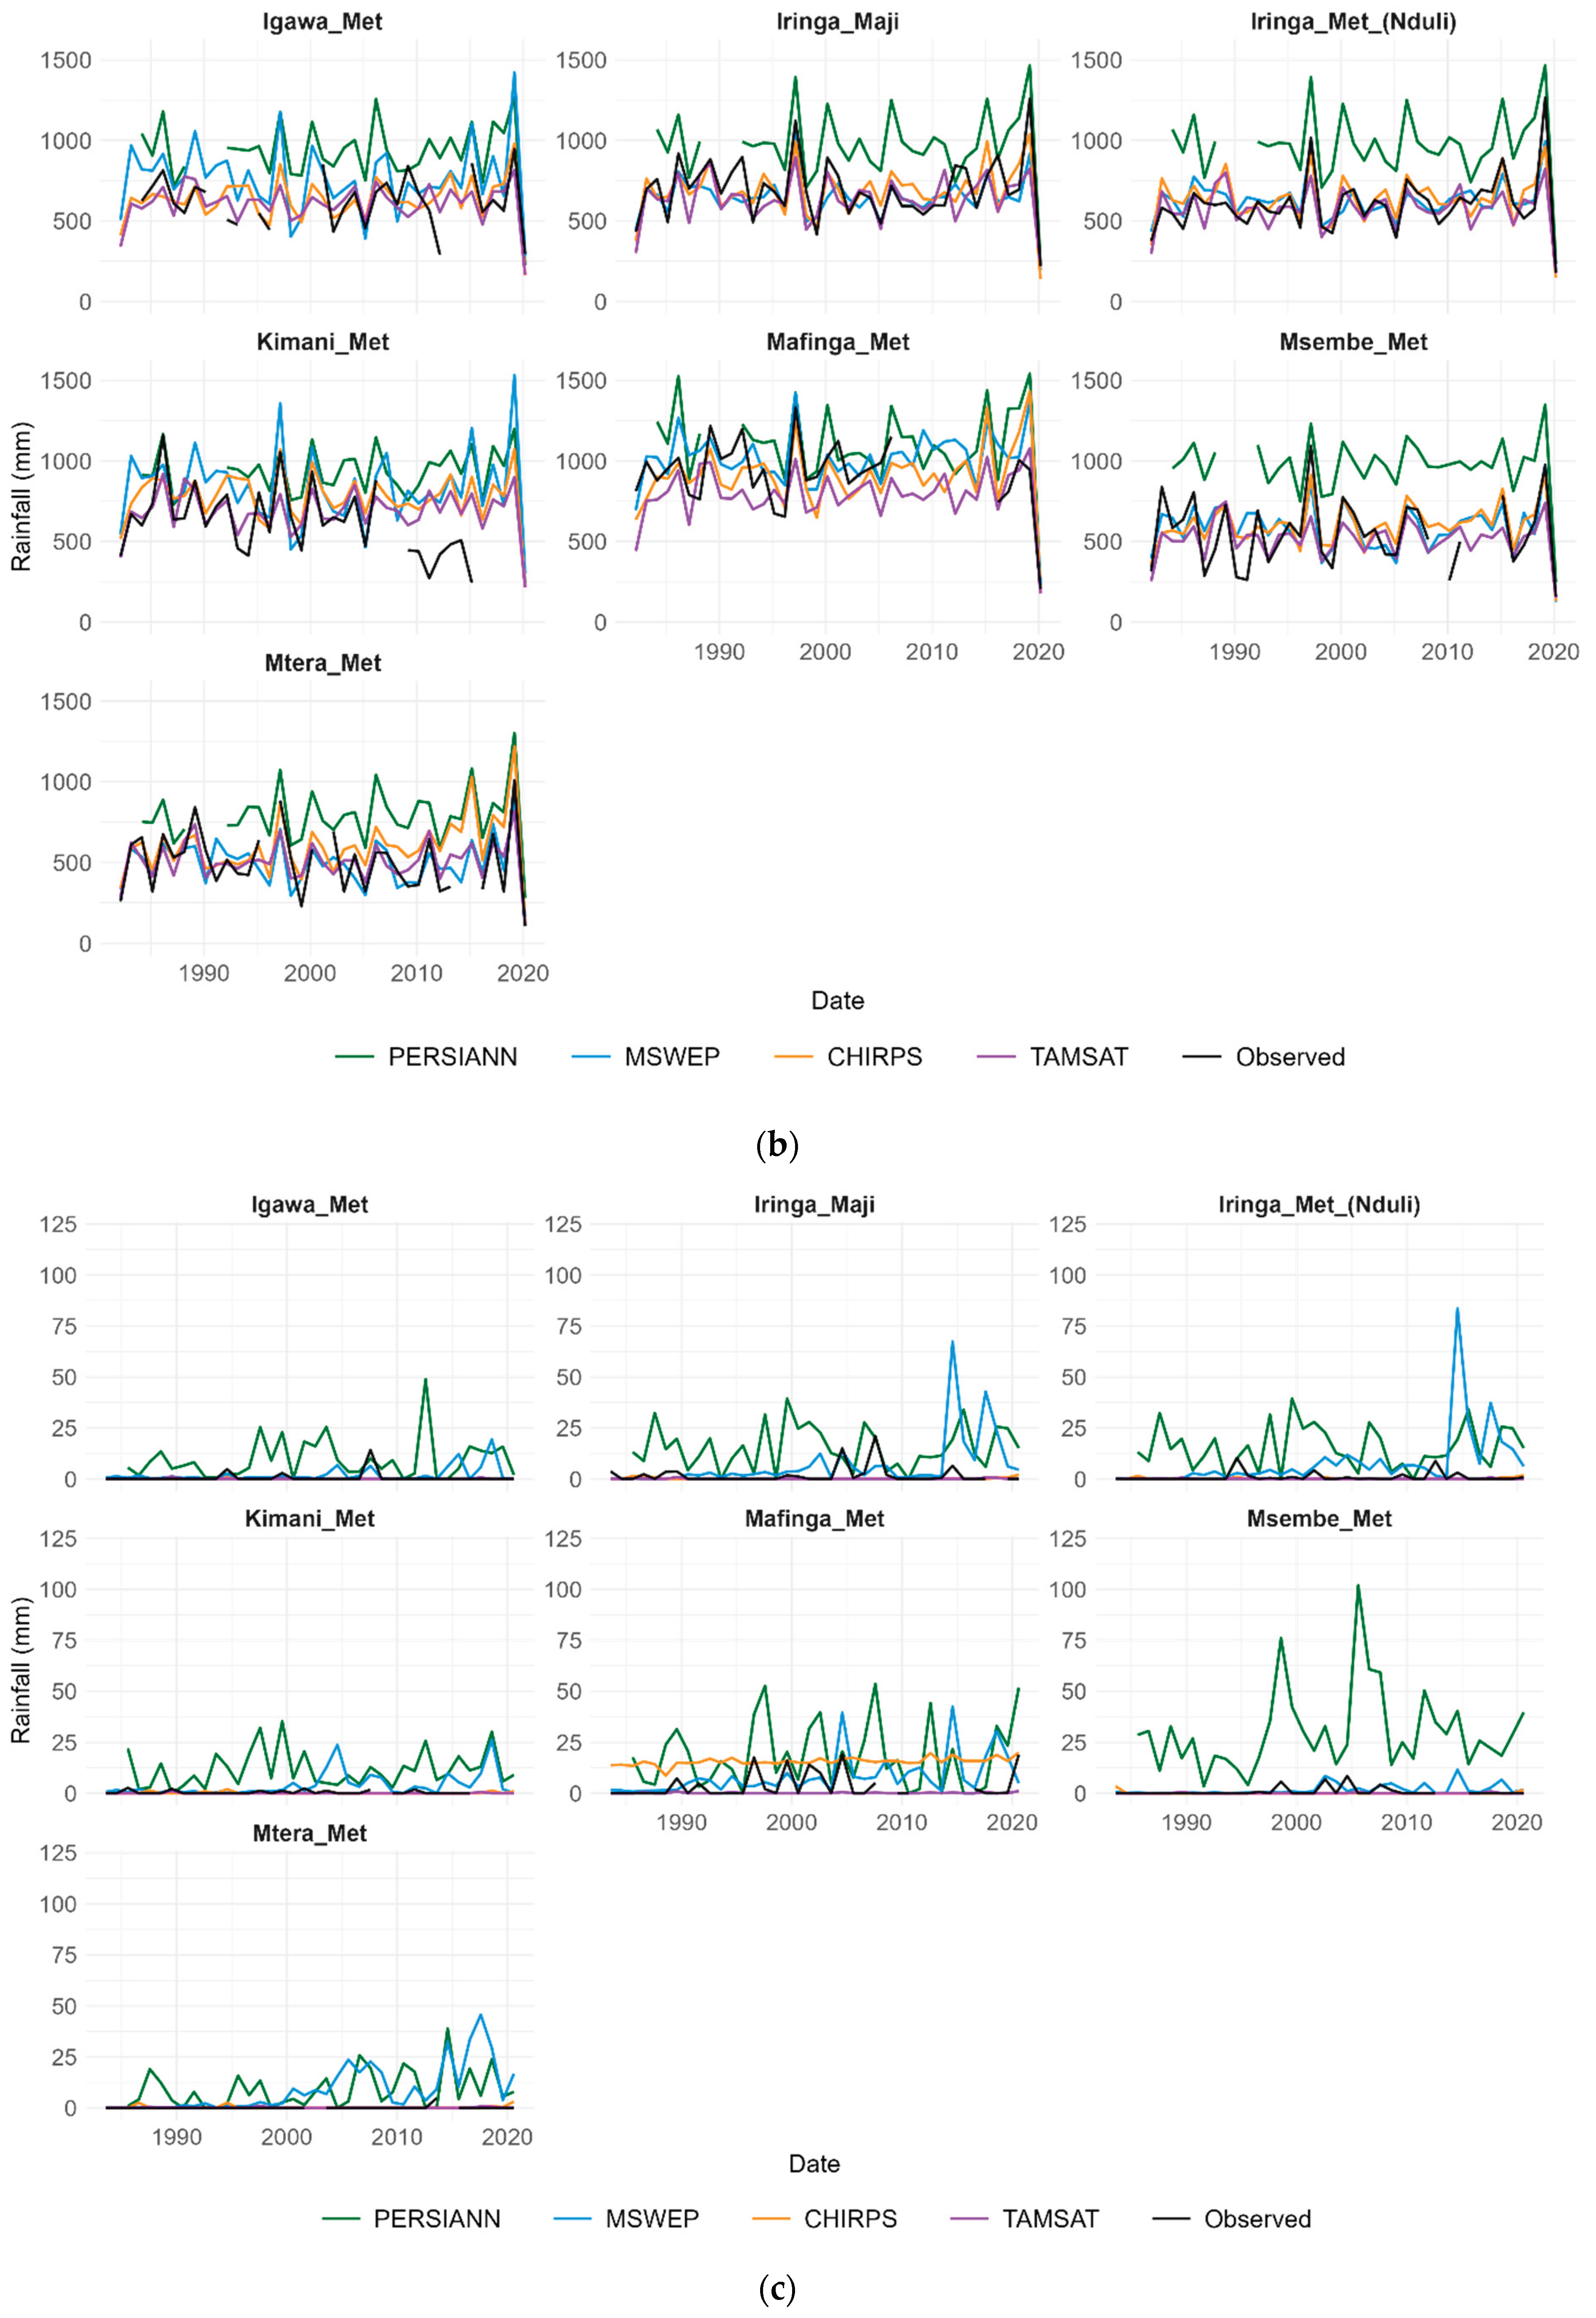
Figure 6a-d present temporal comparison of precipitation at monthly, seasonal (wet/dry) and annual timescales derived from four RS datasets and compared against observed data across seven meteorological stations in the Great Ruaha River Basin (GRRB), Tanzania. Stations include Igawa Met, Iringa Maji, Iringa Met (Nduli), Kimani Met, Mafinga Met, Msembe Met and Mtera Met representing data for approximately three decades (1983-2020). Discontinuities in line plots indicate missing data or years excluded due to excessive gaps as described in Section 3.4.
Across all stations, observed monthly precipitation displays strong seasonality characterized by sharp peaks during wet season and near zero values during dry months (Figure 6a). Most stations report monthly maxima generally in the range of 200 - 400 mm with some exceptions such as at Kimani Met and Mafinga Met stations where monthly totals occasionally exceed 450 mm in extreme months. Further investigation revealed that most satellite products reproduced seasonal patterns reasonably well though with varying levels of accuracy. PERSIANN was found to overestimate monthly precipitation particularly during peak months with some values exceeding observed peaks by more than 100 mm. This observation is especially pronounced at Igawa Met and Iringa Maji stations. MSWEP precipitation generally aligns more closely with observations though occasional overestimations are observed in high rainfall months (e.g., exceeding 400 mm at Kimani Met in recent years). CHIRPS shows reasonable agreement in seasonal structure but tends to slightly underestimate monthly rainfall, particularly during intense rainfall events. In some cases such as Mtera Met, this products tends to overestimate precipitation in recent years. On the other hand, TAMSAT consistently underestimates precipitation often fall 50-100 mm below observed values during peak months and appears less responsive to extreme events.
Wet season analysis revealed that majority of RS products could capture seasonal variabilities and precipitation trends with some degree of bias (Figure 6b). Among the satellite products, PERSIANN consistently overestimates wet season precipitation across all stations with some peak years exceeding observed values by more than 300 mm particularly at Igawa Met, Iringa Maji, Iringa Met (Nduli) and Msembe Met stations. MSWEP tends to closely follow observed trends although it also exhibits occasional positive biases particularly in high rainfall years. CHIRPS generally tracks observed data moderately well but tends to slightly underestimate totals often by about 50 - 100 mm. On the other hand, TAMSAT exhibits the most pronounced underestimation often displaying seasonal totals that are about 150 - 300 mm lower than observed values. For instance, at Kimani Met and Mafinga Met stations, TAMSAT rarely exceed 800 mm even in years when observations approach or surpass 1000 mm. Notably, some gaps or discontinuities in observed data are visible in some stations indicating potential periods of missing station records.
Dry season precipitation exhibited lower values predominantly ranging between 0 - 50 mm/year with occasional years exhibiting higher anomalies exceeding 100 mm/year notably at Msembe Met and Iringa Maji stations (Figure 6c). Both CHIRPS and TAMSAT reproduced lower dry season precipitation estimates relatively well except at Mafinga Met station that was overestimated by CHIRPS. MSWEP performed well in reproducing dry season precipitation before year 2000. However, it tends to overestimate precipitation in the period thereafter in majority of stations. In contrast, PERSIANN consistently overestimated dry season precipitation in all stations. This overestimation is especially evident at Msembe_Met, Mafinga_Met, and Iringa_Maji stations, where PERSIANN estimates dry season rainfall exceeding 50 mm in multiple years substantially higher than the observed values.
Figure 6.
a: Temporal comparison of monthly precipitation. b: Temporal comparison of wet season precipitation. c: Temporal comparison of dry season precipitation. d: Temporal comparison of annual precipitation.
Figure 6.
a: Temporal comparison of monthly precipitation. b: Temporal comparison of wet season precipitation. c: Temporal comparison of dry season precipitation. d: Temporal comparison of annual precipitation.
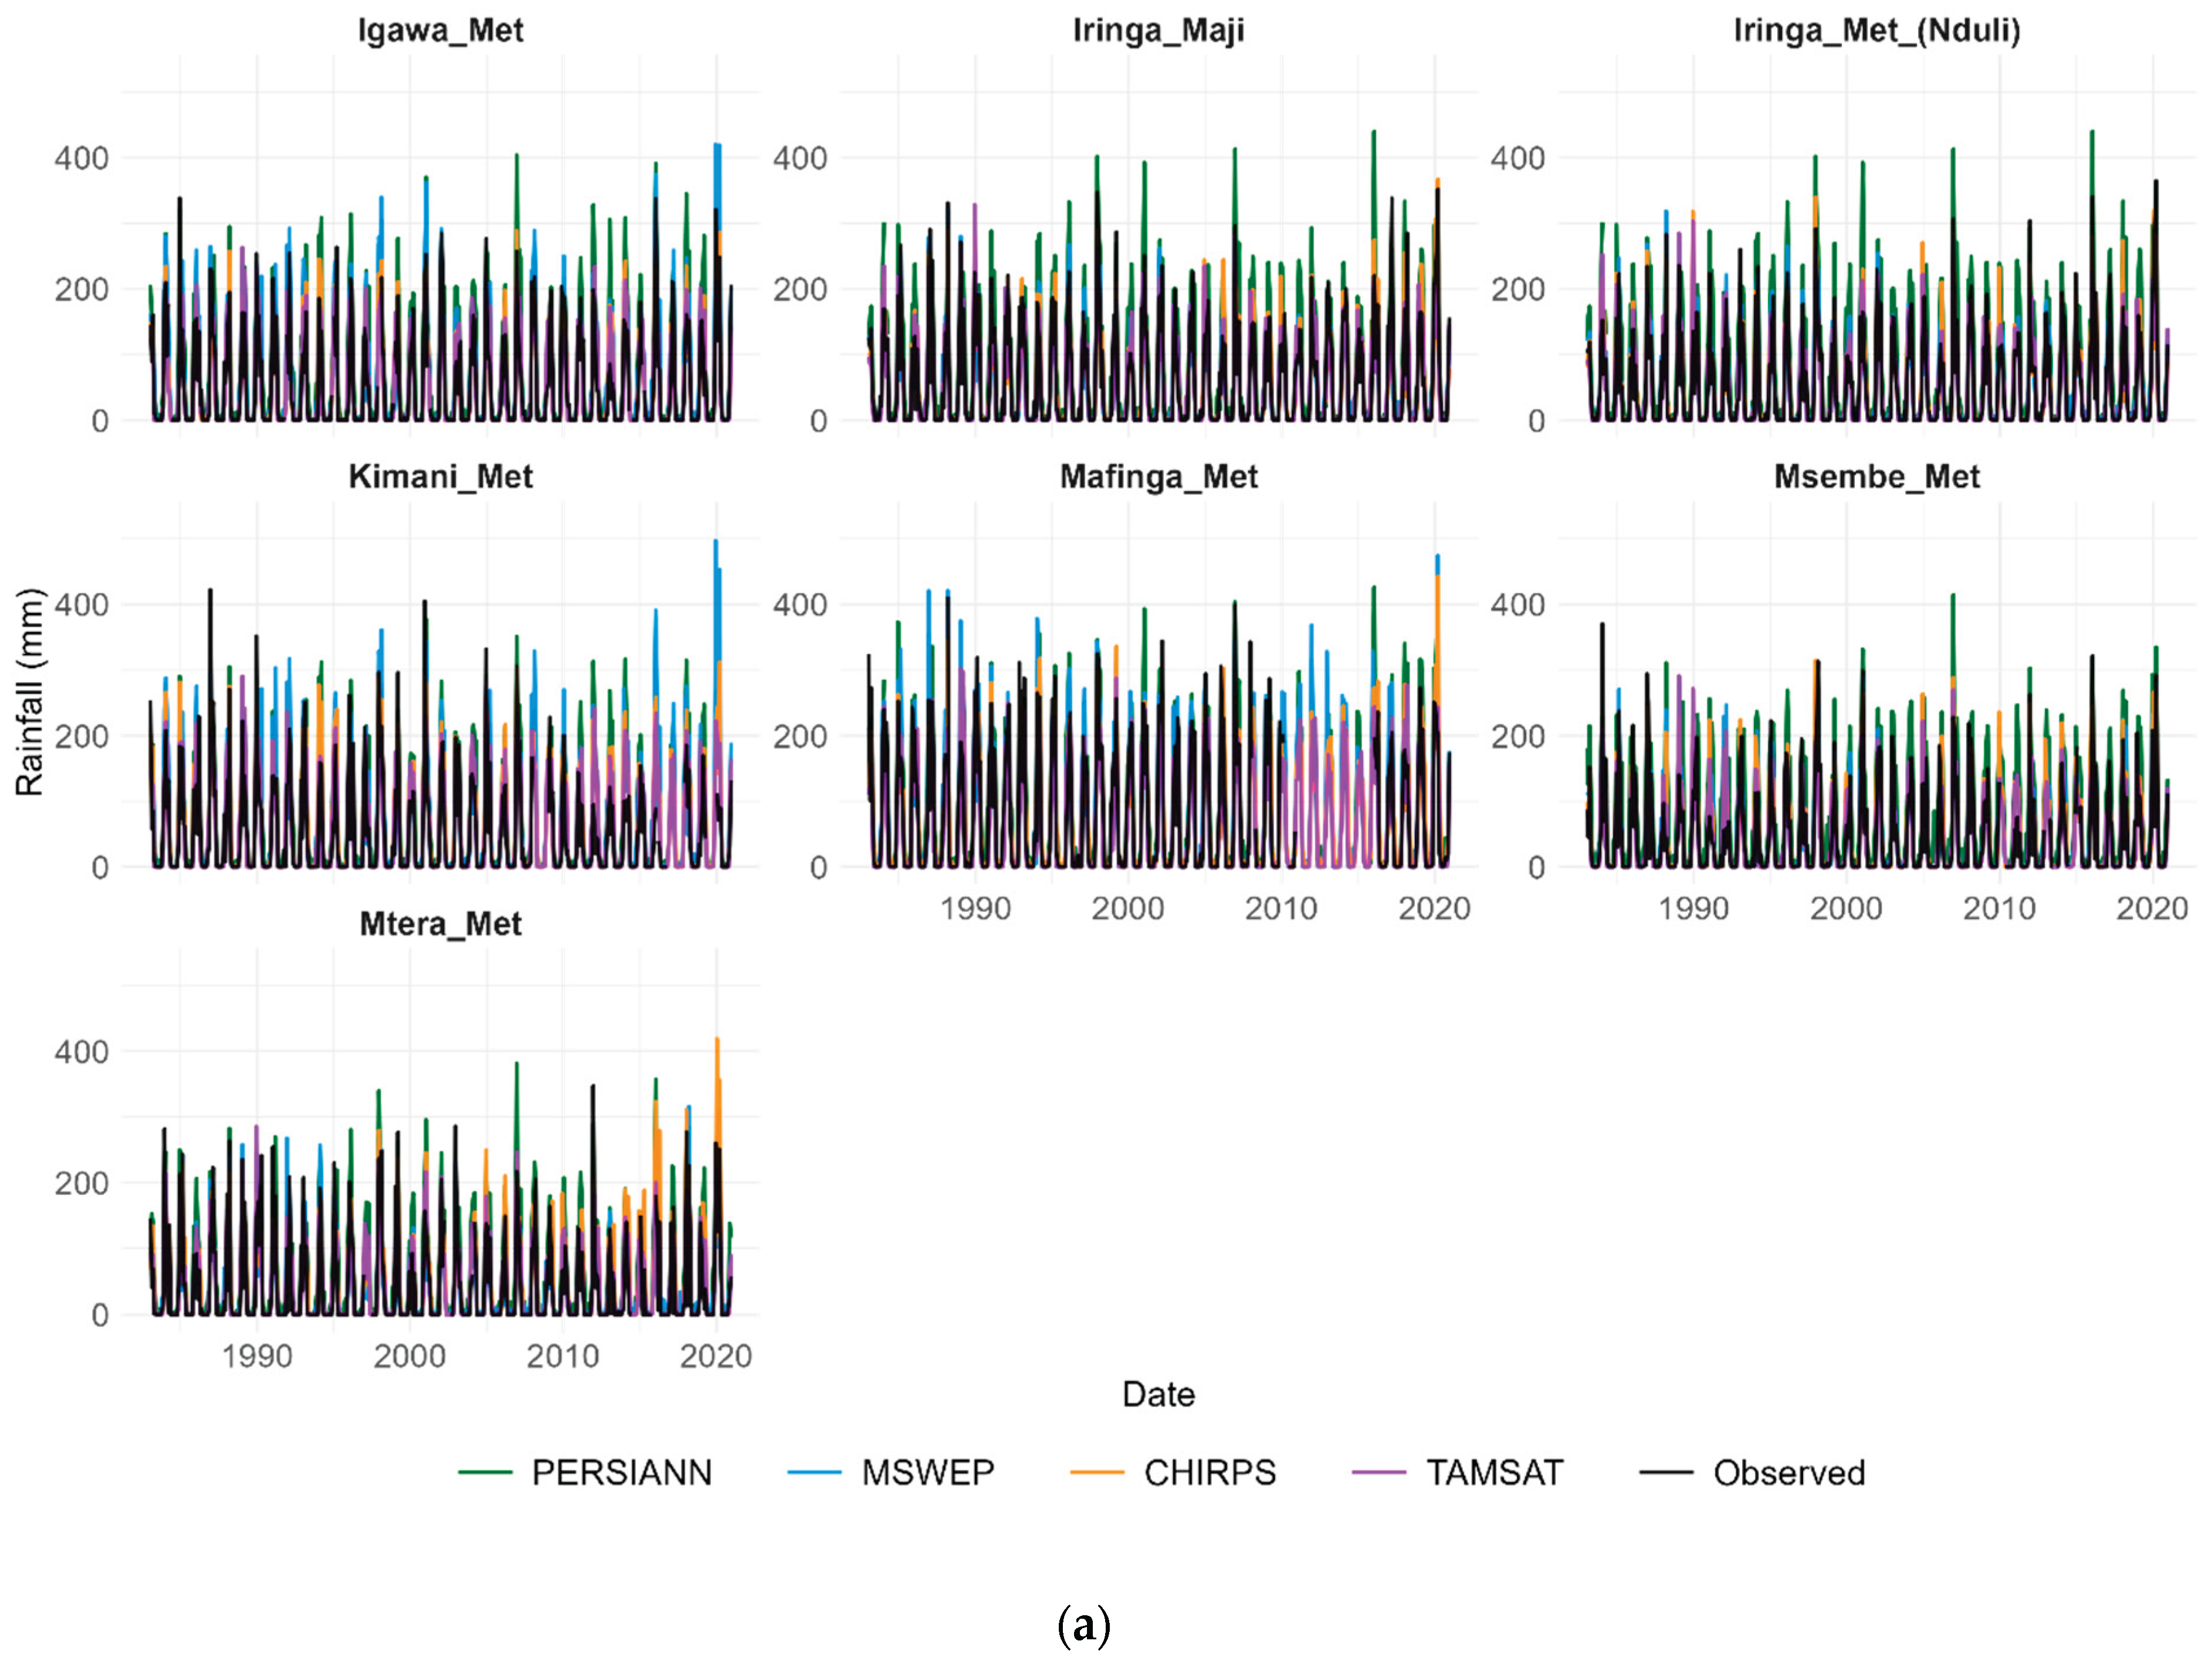
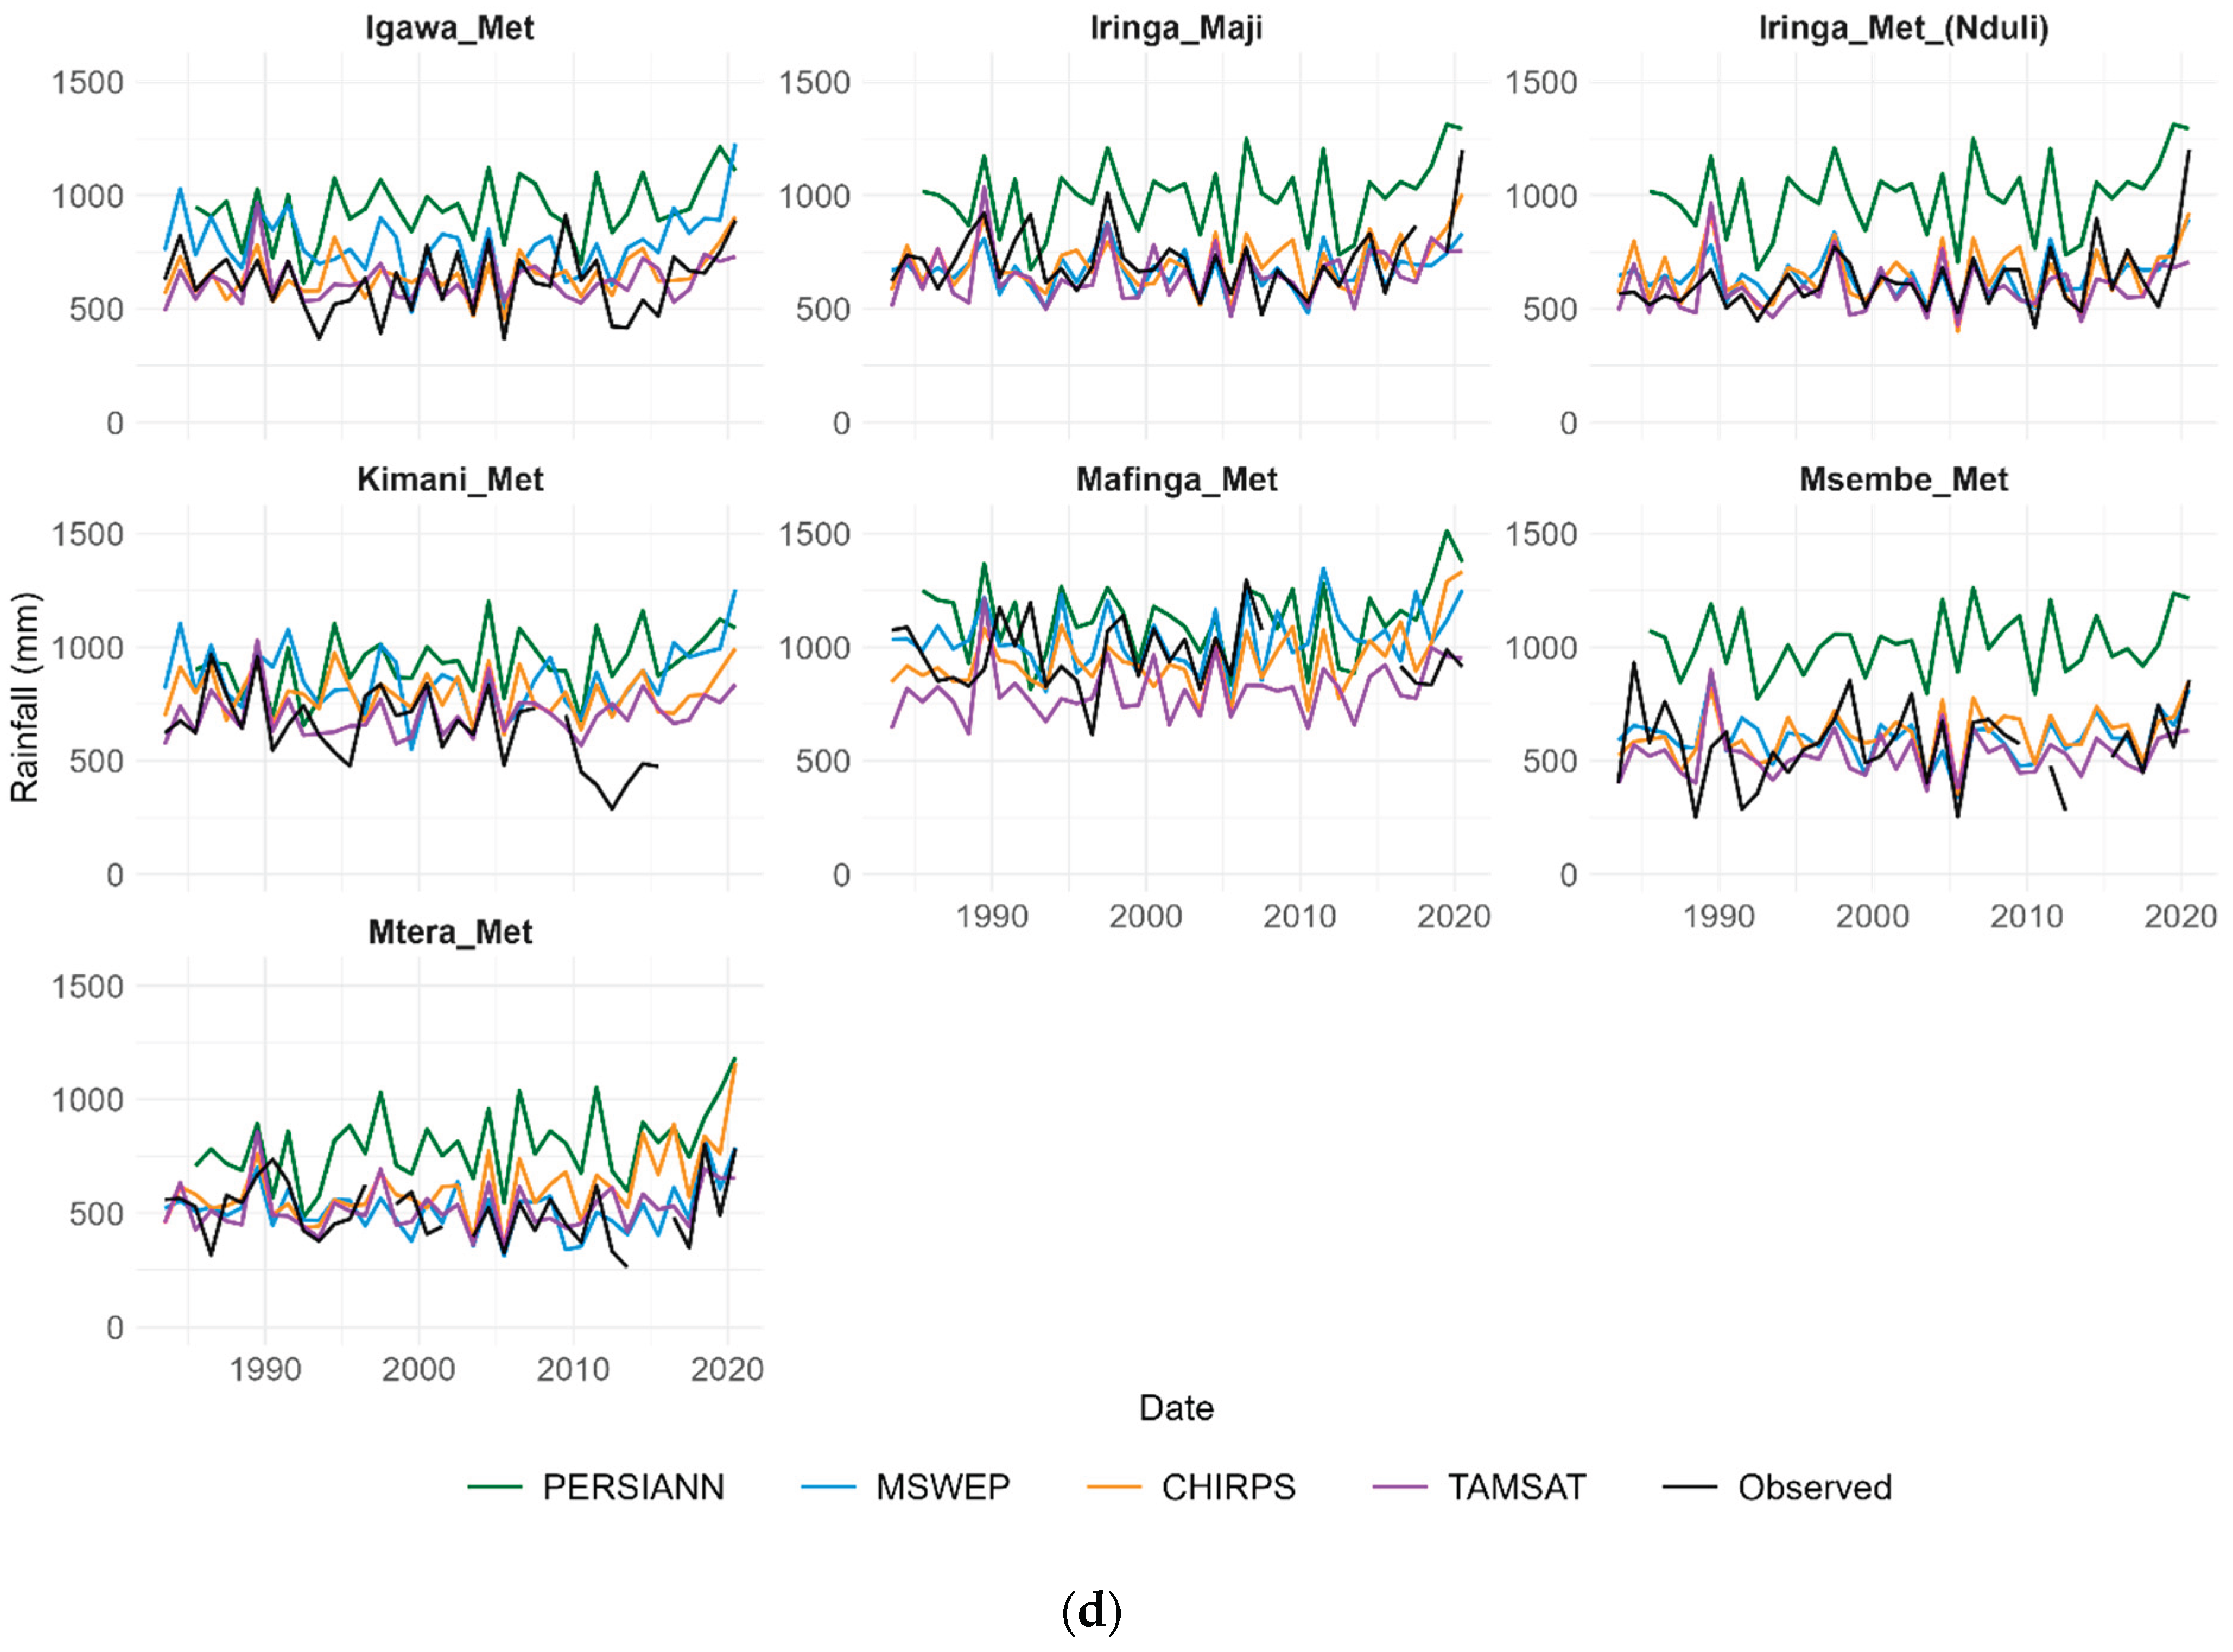
In similar manner, annual precipitation variability and trends were detected by all RS datasets with systematic biases exhibited in all datasets (Figure 6d). Again, PERSIANN dataset was observed to exhibit greater biases in all stations consistently overestimating annual precipitation relative to in-situ measurements. This was more pronounced at Iringa_Maji, Iringa_Met (Nduli), and Msembe_Met stations. MSWEP and CHIRPS generally align more closely with observed data particularly at Mafinga Met, Kimati Met and Mtera Met stations. These products appear to capture both magnitude and interannual variability of precipitation relatively well though slight under- or overestimations are observed at specific periods and stations. TAMSAT systematically underestimates precipitation across nearly all stations producing lower precipitation values compared to observations and the other RS products. Such underestimation is especially evident at wetter stations like Mafinga Met and Iringa Maji which likely reflects limitations in TAMSAT’s retrieval algorithm under higher rainfall regimes.
Overall, while all RS datasets capture the broad temporal variability and major wet years, their agreement with observed data varies significantly by station and dataset. PERSIANN shows strongest overestimation bias whereas TAMSAT consistently underrepresents rainfall totals. MSWEP and CHIRPS provide the most balanced performance though they still exhibit deviations during peak rainfall years.
4.3. Comparison of Drought Conditions Between Remote Sensing Observations and Ground Observations
Table 3 presents a comprehensive comparison between observed drought events based on SPI-12 and their representation in the four remotely sensed (RS) precipitation datasets across seven meteorological stations within the GRRB. Results demonstrate substantial variability in drought detection performance across RS datasets. In several instances, drought duration captured by RS products was either shorter or longer than observed drought duration. This in turn influenced the derived drought magnitude and intensity leading to notable discrepancies (not presented here). CHIRPS exhibited highest sensitivity detecting nearly all drought events across stations. However, cases of underestimation and overestimation were evident. For instance at Iringa Met (Nduli), CHIRPS captured an 11-months drought for the 2003-2004 event, whereas observed duration was only 2-months. Similarly, it detected the full 12-month duration for the 2005-2006 drought at most stations demonstrating strong alignment in that case.
Patterns of MSWEP drought closely resembled those CHIRPS with several overlapping events identified across stations. At Iringa Maji, for instance, this product accurately captured the full 12-month duration of the 2005-2006 drought and identified 8 out of 8 months for the 2000 event. However, discrepancies were also noted particularly at Igawa_Met where the severe 13-month drought of 2012-2013 was only partially captured (3 months) highlighting MSWEP’s limitations in some high-intensity events.
Contrarily, PERSIANN exhibited relatively lower performance failing to detect multiple drought events across most stations. Its performance was more favorable at Iringa Met (Nduli) station where it consistently detected significant portions of droughts. This included detecting all 11 months of the 1999 drought and 12 months of the 2005-2006 event. Similarly, at Msembe Met station PERSIANN captured only 7 out of 12 months of the 1988-1989 drought and 11 out of 12 months of the 2017 drought.
On the other hand, TAMSAT generally underperformed across all stations frequently failing to capture majority of events while at the same time detecting fewer drought months than observed. For example, during the 1996-1997 drought at Mafinga_Met station which lasted for about 23 months, TAMSAT failed to detect the event entirely. Even in well-detected events such as 2005-2006, TAMSAT slightly underrepresented duration in some stations. For instance, recording 11 out of 12 months at Igawa_Met station. Nevertheless, the 2005-2006 drought stands out as a major event that was consistently detected across all RS datasets at most stations, suggesting better agreement among products during certain prolonged and widespread droughts.
4.4. Temporal Representation of Consecutive Dry Days (CDD)
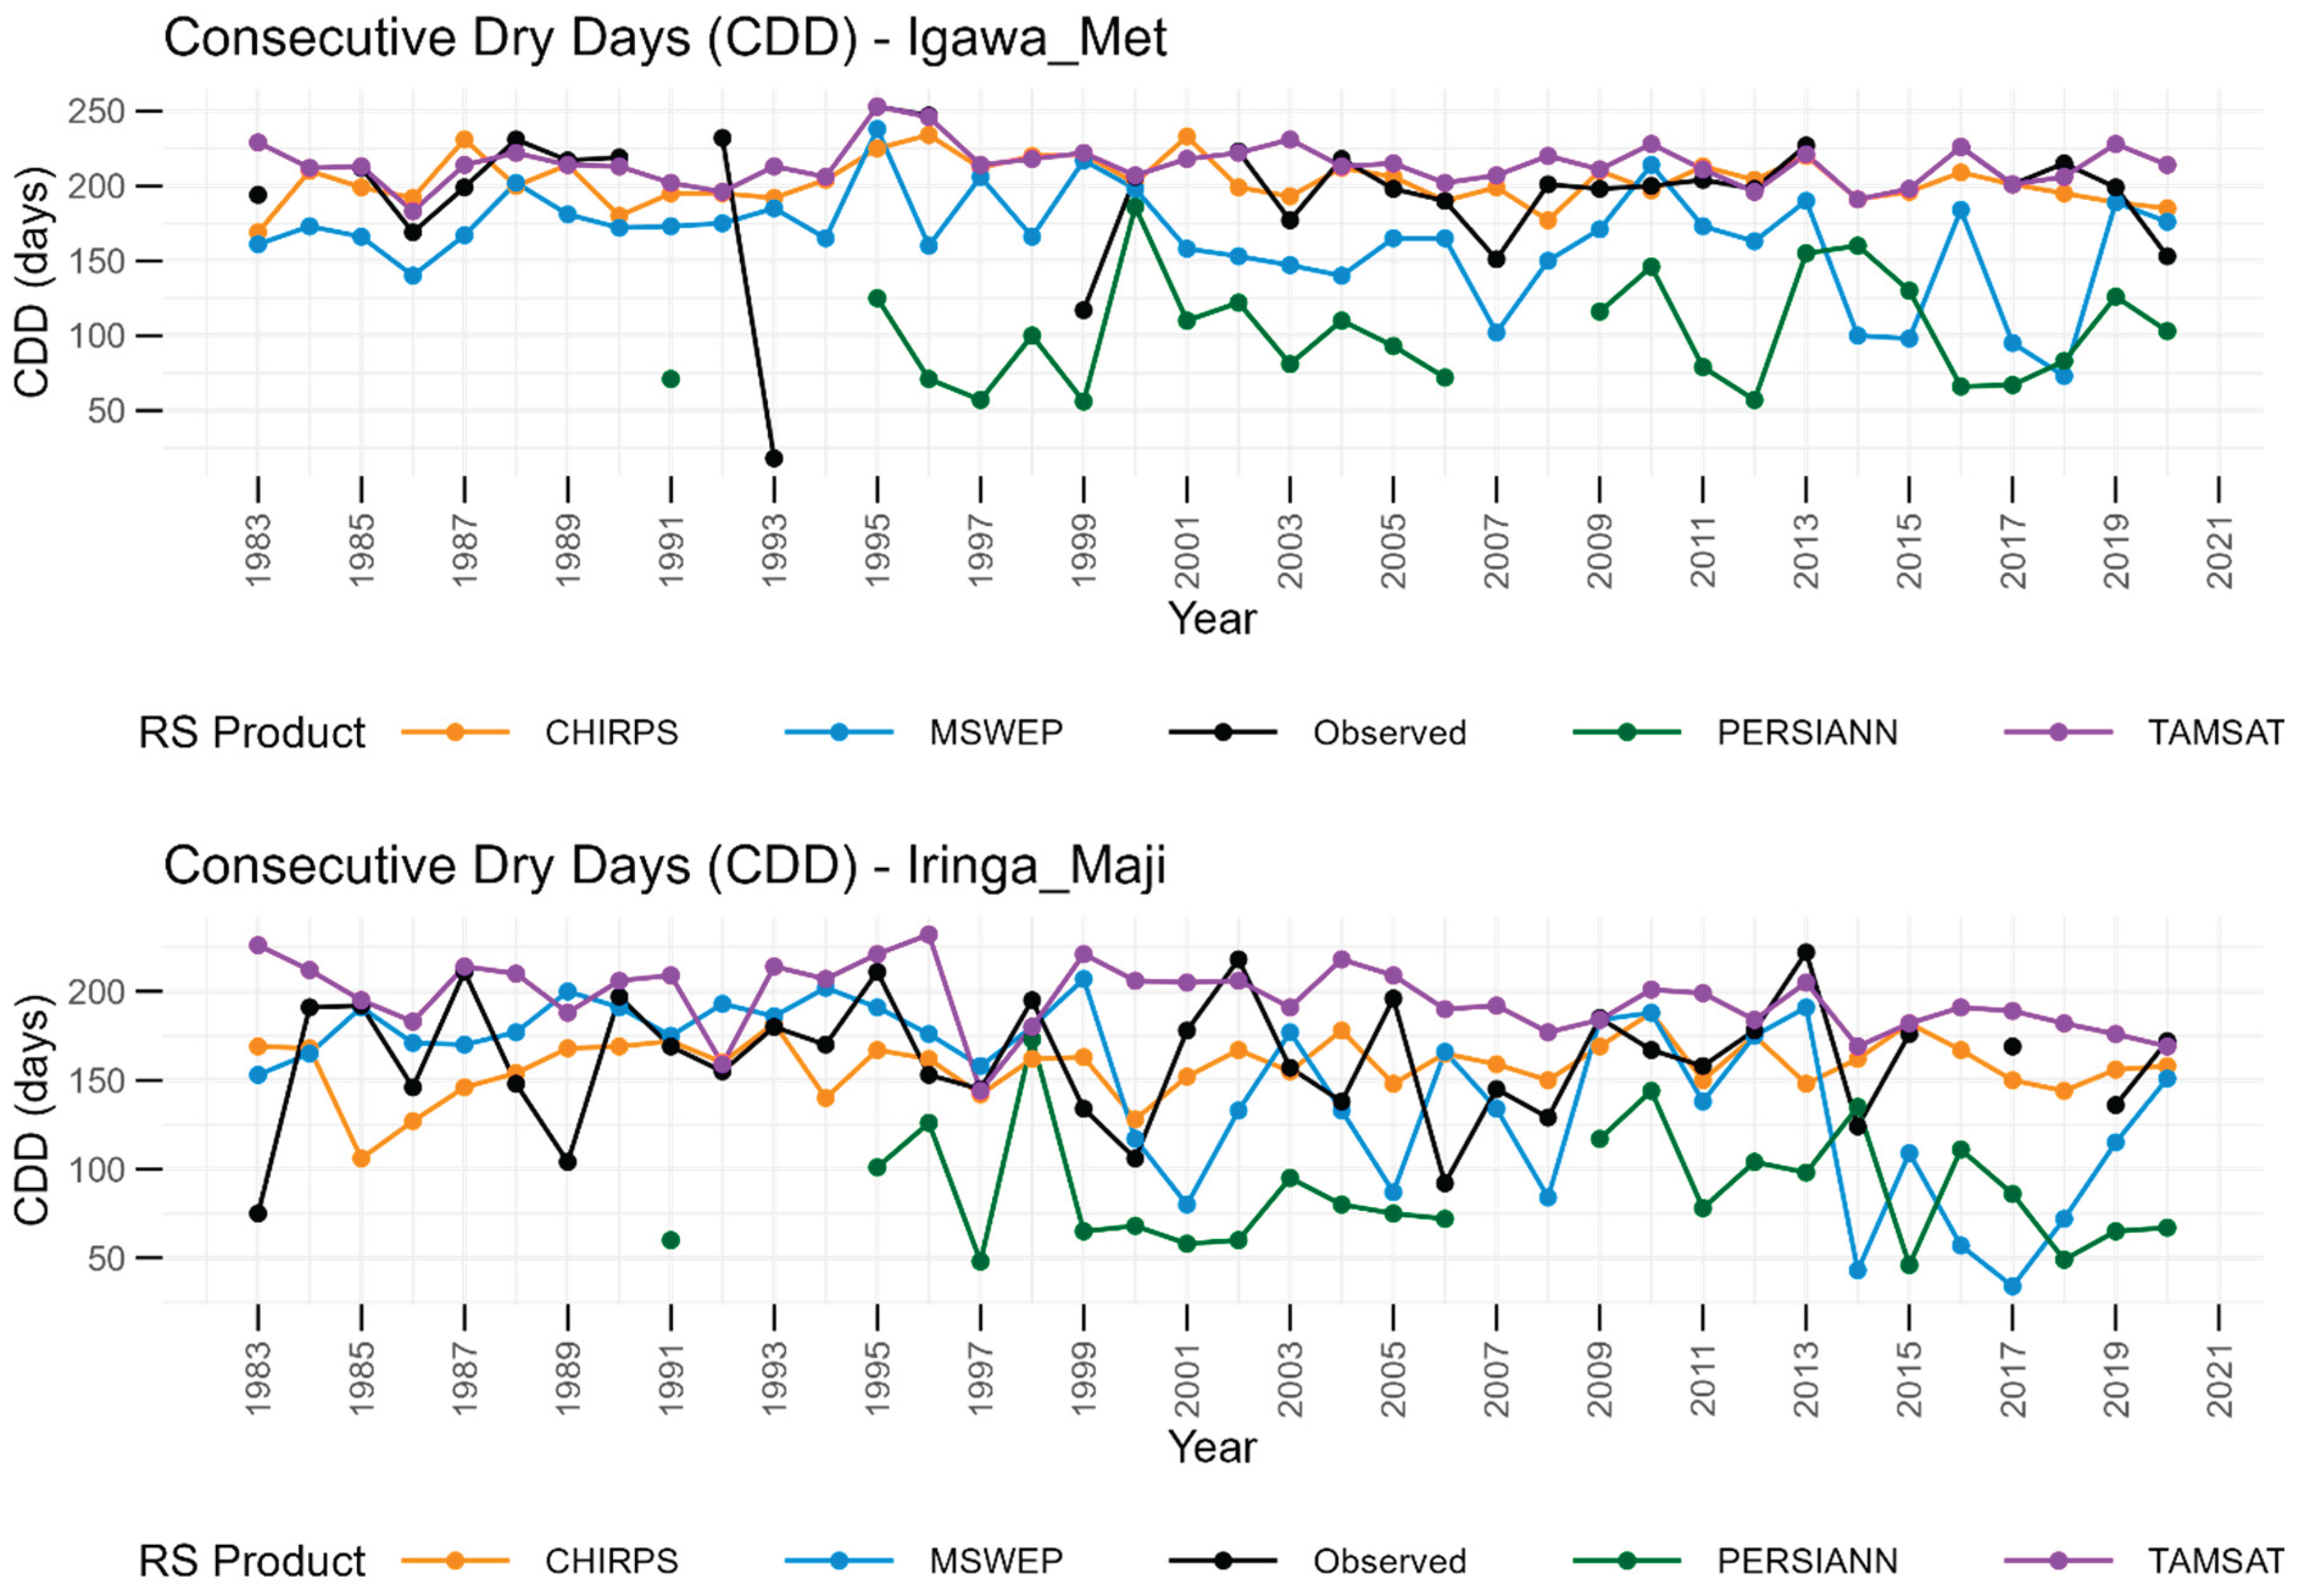
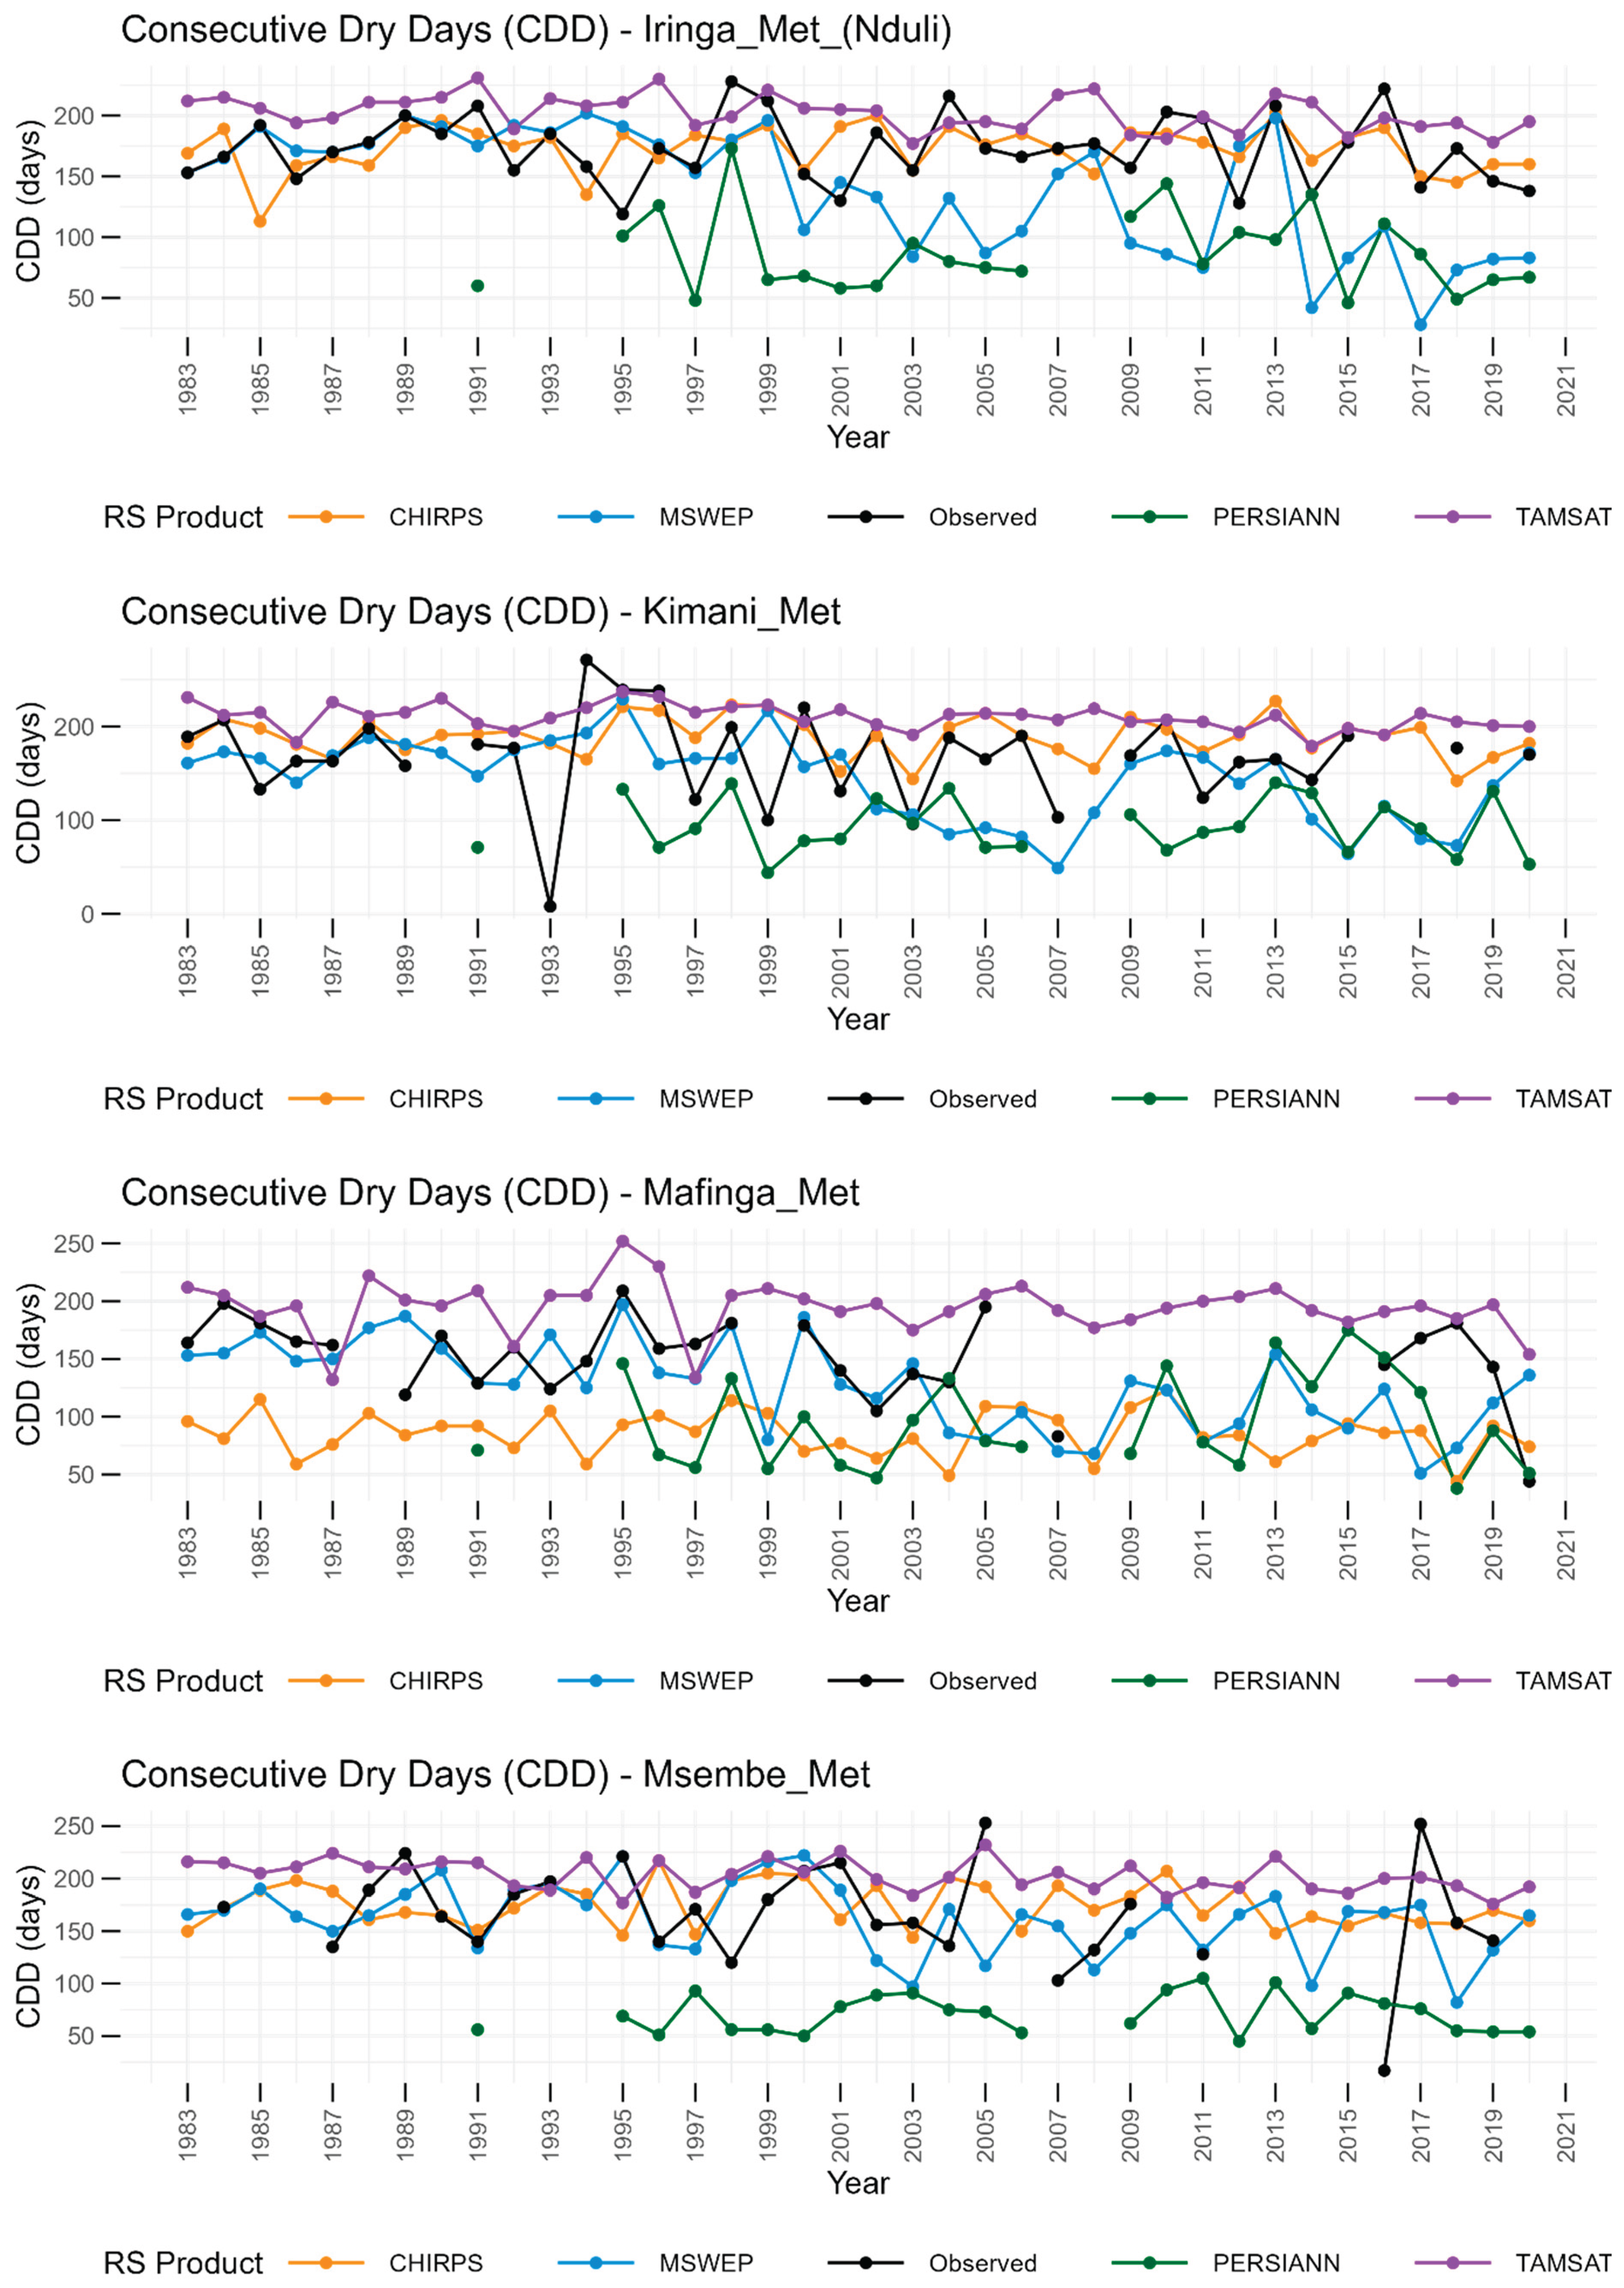
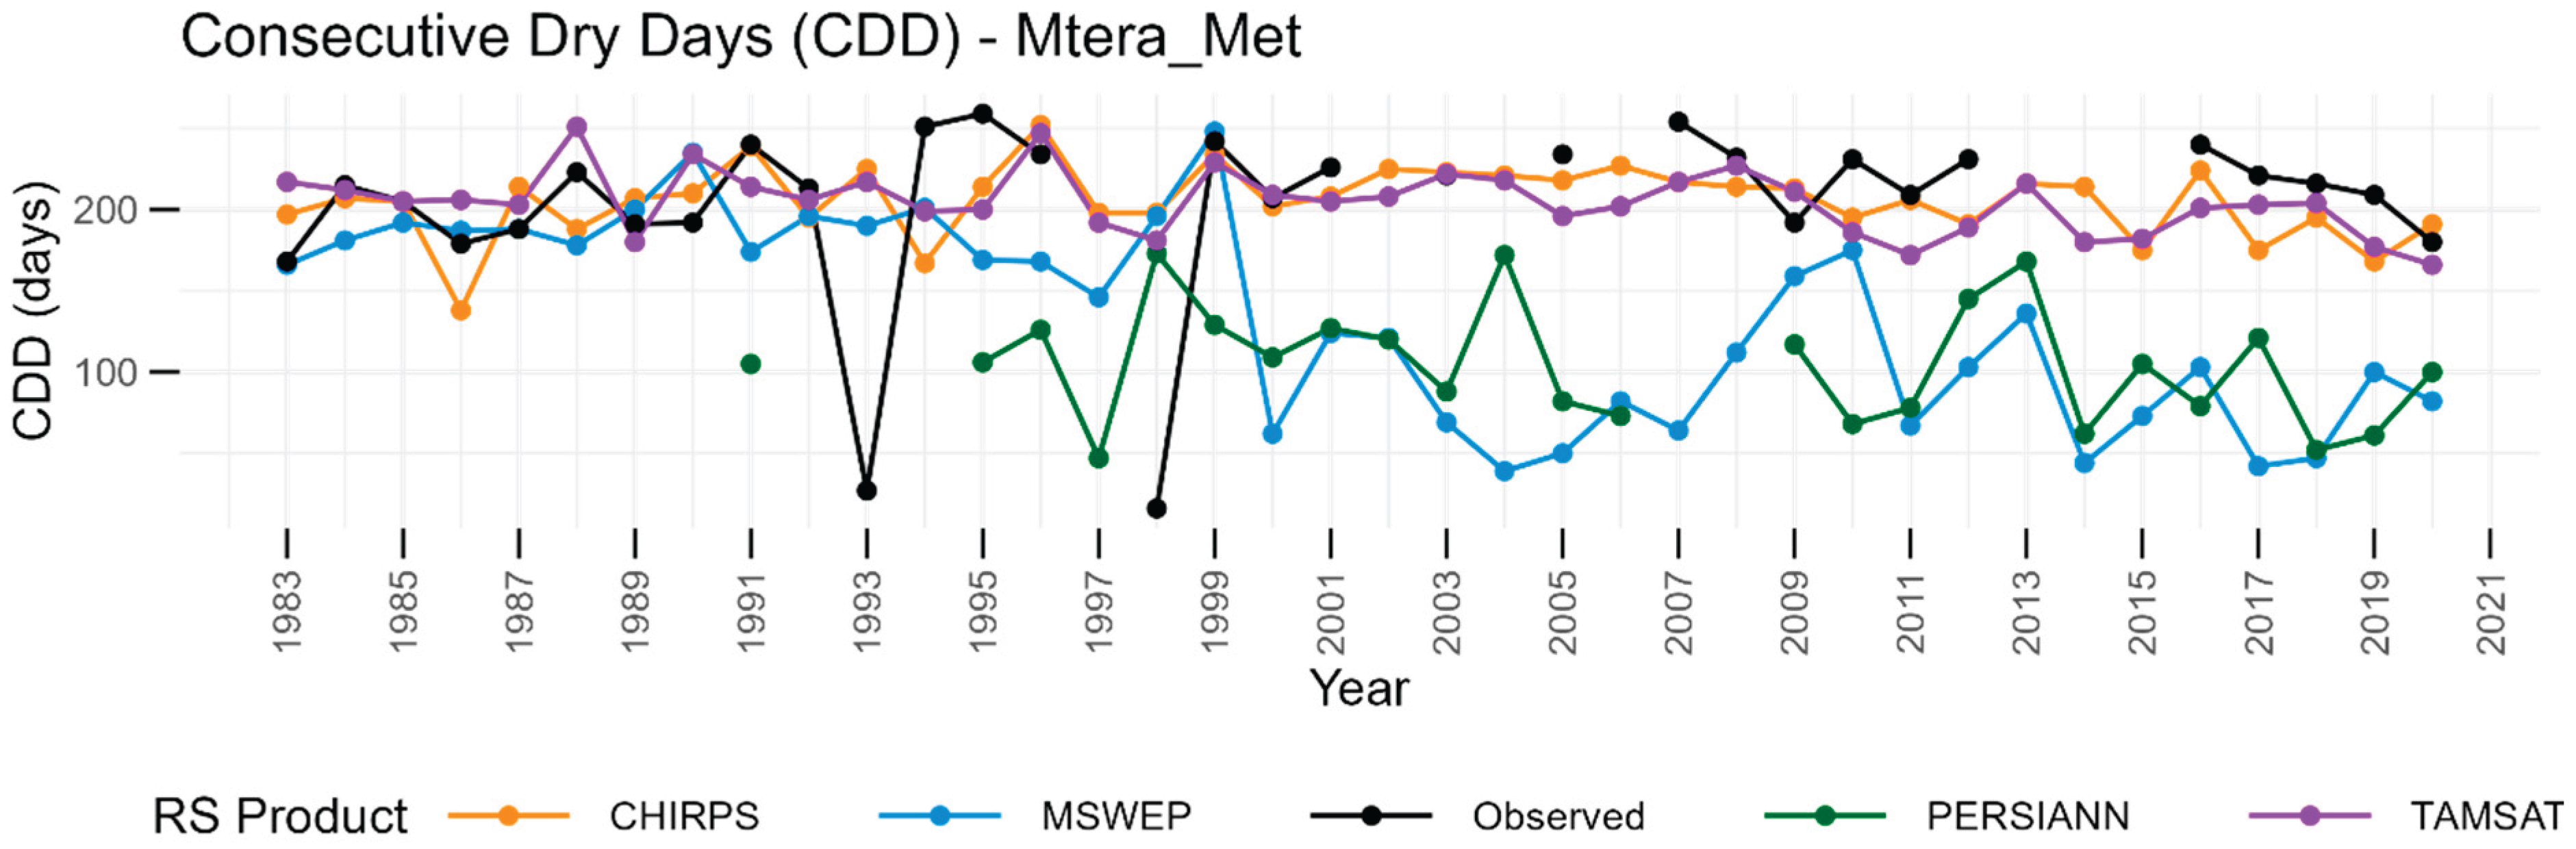
Figure 7 presents a temporal comparison of annual maximum consecutive dry days (CDD) derived from observed precipitation data and the four RS datasets. Comparison was done across seven meteorological stations for the GRRB from 1983 - 2020. In this case, observed CDD timeseries served as reference for evaluating RS products’ ability to capture prolonged dry spells, a key indicator of agricultural and hydrological drought.
CDD timeseries revealed substantial variabilities among RS datasets across stations. TAMSAT consistently estimated higher CDD values often exceeding both observed and other RS based estimates across stations. This is particularly evident at Mafinga Met station where TAMSAT frequently recorded values above 200 days contrasting sharply with observed CDD values which generally remained below that threshold. This pattern suggests a strong dry bias in TAMSAT for this region. CHIRPS on the other hand showed relatively better alignment with observed CDD trends particularly at Igawa Met, Iringa Met (Nduli) and Mtera Met stations, although discrepancies were still present. However, in some of the dry years such as in 1993, dry days were completely overestimated. Notably at Mafinga Met station, CHIRPS completely underestimated annual maximum CDD values.
MSWEP performed poorly in replicating observed CDD across majority of the stations, with the exception of Mafinga Met station during the 1983-2004 period where it closely aligned with observed trends. In most cases, MSWEP was found to underestimate CDD values. This underestimation was particularly pronounced after 2005 with notable discrepancies observed at Iringa Met (Nduli), Mafinga Met and Mtera Met stations. During this period, MSWEP frequently reported substantially lower CDD values than observed values.
PERSIANN consistently demonstrated the poorest performance among RS datasets in capturing CDD across all stations. The dataset frequently and substantially underestimated duration of dry spells failing to align with the observed temporal patterns and magnitudes. For instance, at Iringa_Met (Nduli) and Kimani_Met stations, PERSIANN often reported CDD values below 100 days even in years where observed CDD exceeded 150 or even 180 days. This discrepancy was particularly striking in the late 1990s and throughout 2000s when severe dry spells were captured in observed records but almost entirely muted in PERSIANN estimates. At Mafinga_Met for example, during the prolonged dry period of the early 1990s, observed CDD reached over 200 days while PERSIANN registered values below 100 days missing nearly half dry duration. This significant underestimation was consistent across both wet and dry years indicating a systematic bias rather than random error. Moreover, temporal trends in PERSIANN’s CDD showed limited variability compared to observed records suggesting an inability to detect interannual fluctuations in dry spell dynamics. Overall, limited sensitivity of PERSIANN to prolonged dry periods compromises its utility for drought monitoring in this region particularly for applications requiring accurate characterization of extreme dry conditions.
Figure 7.
Annual maximum number of consecutive dry days (CDD) across stations for observed and RS datasets. Discontinuities in the lines indicate years excluded in comparison due to missing data.
Figure 7.
Annual maximum number of consecutive dry days (CDD) across stations for observed and RS datasets. Discontinuities in the lines indicate years excluded in comparison due to missing data.
Evaluation of various remote sensing (RS) products based on statistical performance metrics revealed generally low correlation values indicating weak agreement with observed annual maximum consecutive dry days (CDD) across stations. TAMSAT showed the highest consistency with correlation coefficients ranging from 0.13 to 0.30, followed by CHIRPS (-0.11 to 0.33), MSWEP (-0.25 to 0.25), and PERSIANN, which had the widest and most negative range (-0.47 to 0.37) (Table 4). These low correlations underscore limited capability of all four products to fully replicate observed interannual CDD variability. All products exhibited relatively high RMSE values typically exceeding 35 days with PERSIANN recording the highest errors ranging from 73 to 128 days. Mean error (ME) varied across stations and products with both positive and negative values observed. PERSIANN again showed the most pronounced deviations. Similarly, Bias revealed both underestimation and overestimation of CDD across stations. CHIRPS generally exhibited the lowest bias values particularly at stations such as Igawa Met, Iringa Maji, Iringa Met (Nduli), and Mtera Met. In contrast, PERSIANN demonstrated the largest magnitude of bias, consistently underestimating CDD while TAMSAT displayed a positive bias indicating a tendency to overestimate dry spells. MSWEP and PERSIANN predominantly underestimated CDD whereas CHIRPS showed mixed tendencies with both under- and overestimations depending on station.
In summary, the analysis highlights that while all RS products show some limitations in capturing annual CDD extremes, TAMSAT and CHIRPS performed relatively better. However, PERSIANN consistently underperformed across all metrics indicating it is the least reliable product for CDD monitoring in the region.
5. Discussion
5.1. Discrepancies Among the Remote Sensing Datasets
A Comparative assessment of remote sensing (RS) datasets for evaluating the effectiveness of such datasets in identifying observed precipitation patterns and drought variability is crucial for sustainable water and drought management in data scarce regions. In the present study, comparison of four high resolution RS precipitation datasets - CHIRPS, MSWEP, PERSIANN, and TAMSAT with ground measurements revealed varying capabilities in identification of daily, monthly, seasonal (wet/dry), and annual precipitation patterns as well as observed drought conditions across the Great Ruaha River Basin (GRRB). These discrepancies may be attributed to several factors including data spatial resolution, calibration methodologies employed and quality of the underlying data sources integrated during product development.
Firstly, the spatial and temporal resolution plays a crucial role in determining accuracy of precipitation estimates (Yu et al., 2020). Datasets such as TAMSAT and CHIRPS offer relatively higher spatial resolutions (~0.0375° - 0.05°) which are better suited for capturing localized precipitation patterns or extreme weather events particularly in complex terrains (Nashwan et al., 2020). However, if these high-resolution datasets are based on poor-quality satellite observations or insufficient ground station input, they may still perform inadequately (Sun et al., 2018). Conversely, datasets with coarser resolution such as PERSIANN may miss localized extremes or fail to represent the heterogeneous nature of rainfall in regions like the GRRB (Javed et al., 2023). Secondly, calibration methodologies such as the integration of rain gauge data can significantly impact performance of a RS product (Gebrechorkos et al., 2024). For instance, Products such as CHIRPS and MSWEP benefit from a blend of satellite data and a large volume of ground station data which enhances their reliability in many regions (Baez-Villanueva et al., 2018; Beck et al., 2019; Funk et al., 2015; Ogembo et al., 2022).
Thirdly, underlying data sources and algorithms used in generating these products vary widely and directly influence their performance. For instance, CHIRPS dataset is based on the infrared (IR) Cold Cloud Duration (CCD) observations from geostationary satellites merged with in-situ station data (Seyama et al., 2019; Shen et al., 2020). Similarly, TAMSAT utilizes geostationary satellite thermal infrared (TIR) data to measure cloud-top temperatures and derives rainfall estimates based on CCD. These estimates are statistically calibrated and validated using ground-based gauge data to improve their accuracy (Tarnavsky et al., 2014). On the other hand, MSWEP integrates gauge-based, satellite, and reanalysis datasets to generate high resolution precipitation estimates, while PERSIANN heavily depends on machine learning algorithms to derive precipitation estimates. These technical and methodological distinctions explain why some products such as MSWEP and CHIRPS often outperform others in reproducing precipitation patterns and drought characteristics. Importantly, influence of regional climate variability, topography, and the density of in-situ stations for calibration should also not be overlooked as these contextual factors can either amplify or mitigate the impact of methodological limitations (Sun et al., 2018).
5.2. Performance of Remote Sensing Datasets in Identifying Precipitation Patterns Across Multiple Timescales
RS datasets yielded higher performance at lower temporal resolution (i.e. monthly or annual) than higher temporal resolution (i.e. daily). Notably, all RS products performed poorly in reproducing accurate daily and dry season precipitation cycles. In most cases correlation coefficient was far way below satisfactory performance of r ≥ 0.5 (Moriasi et al., 2015). Such outcome has also been reported in several past studies (Helmi & Abdelhamed, 2023; López-Bermeo et al., 2022; Mulungu & Mukama, 2023) and primarily linked to sensor limitations and retrieval algorithm inaccuracies. Moreover, similar outcomes were also reported in West Africa where most of RS products underperformed particularly during the dry season (Datti et al., 2024). In contrast, all products performed well in reproducing monthly and wet season precipitation cycles. Notably, monthly precipitation outperformed the rest by yielding highest correlation values (r>0.8). According to AghaKouchak et al. (2012), random errors in RS datasets tend to diminish when data is averaged for longer periods (such as monthly or seasonally) potentially yielding reliable precipitation estimates. This characteristic makes monthly or wet seasonal aggregations more reliable for various applications. However, in terms of bias and error statistics these products still exhibit some discrepancies across the stations, underscoring the necessity of applying bias correction techniques and multi-site validation to further enhance their reliability in drought or water resources monitoring within the basin.
Notably, CHIRPS and MSWEP products outperformed the rest of products in reproducing monthly precipitation. These findings are consistent with a previous study by Dinku et al. (2018) who validated CHIRPS dataset over East Africa (including the GRRB region) and found that it outperformed other products. Furthermore, previous studies in other locations (Al-Shamayleh et al., 2024; López-Bermeo et al., 2022; Msigwa et al., 2024; Mulungu & Mukama, 2023) found CHIRPS to perform well when aggregated to monthly or annual timescales. Similar results have been reported for the MSWEP in Lake Titicaca basin (Satgé et al., 2019), Brazil (Baez-Villanueva et al., 2018) and China (Shaowei et al., 2022; Wu et al., 2018). Higher performance of these products indicates the advantage of incorporating a large number of in-situ measurements in their frameworks (Gebrechorkos et al., 2024).
Despite exhibiting the highest spatial resolution among RS datasets, TAMSAT consistently underestimated precipitation. This finding aligns with results of Dinku et al. (2018) who reported that TAMSAT tends to underestimate precipitation in many parts of Tanzania. Similar outcomes have been reported in Southern Africa (Seyama et al., 2019). This is likely because TAMSAT employs the CCD method for rainfall estimation which is primarily suited to detecting convective rainfall (Tarnavsky et al., 2014). As a result, it tends to underestimate orographic rainfall (Sun et al., 2018) which predominates at most of analyzed stations in the GRRB. This finding underscores the importance of validating remote sensing (RS) datasets regardless of their spatial resolution as many of these products still struggle to accurately capture precipitation in regions with complex topography where rainfall is heavily influenced by orographic effects and marked by high spatiotemporal variability (Sun et al., 2018).
5.3. Performance of Remote Sensing Datasets in Identifying Drought Events and Variability
CHIRPS and MSWEP products outperformed the rest of products in identifying majority of observed drought events (Table 3). This finding aligns with results of Mukama et al. (2025) who utilized CHIRPS and found that it performed well in detecting historical droughts within the GRRB. However, for MSWEP there are no specific studies that attempted to do so. The performance these products may be partly explained by integration of ground-based rain gauge data during their calibration and bias correction processes (Gebrechorkos et al., 2024). Furthermore, CHIRPS dataset also showed some capacity to capture CDD patterns whereas other products struggled. On the other hand, most of the products with exception of CHIRPS in some cases performed poorly in identifying extreme dry days using CDD index as shown in Figure 7. Such temporal inconsistencies in identifying these extreme events were also reported in China (Lu et al., 2024), Jordan (Al-Shamayleh et al., 2024) and Iran (Zarrin & Dadashi-Roudbari, 2022). This finding underscores the necessity of validating RS products against local observations to minimize biases and errors that might compromise drought identification. Furthermore, selecting appropriate remote sensing products is essential for reliable meteo-hydrological assessments particularly in data-scarce and topographically complex regions. Doing so supports more robust early warning systems, forecasting, and modeling efforts.
6. Conclusion
This study compared and evaluated performance of four high resolution remote sensing (RS) precipitation datasets against ground-based station data from seven meteorological stations within the Great Ruaha River Basin (GRRB), Tanzania, for the period 1983-2020. Comparison was done at multiple timescales such as daily, monthly, seasonal (wet/dry) and annual timesteps. RS products had spatial resolutions varying from 0.0375o to 0.25o and included the Climate Hazards Center InfraRed Precipitation with Station data (CHIRPS), Tropical Applications of Meteorology using Satellite data (TAMSAT), Precipitation Estimation from Remotely Sensed Information using Artificial Neural Networks-Climate Data Record (PERSIANN-CDR), and Multi-Source Weighted-Ensemble Precipitation (MSWEP). Based on results, the following conclusions are drawn:
- (a)
- Evaluation of RS datasets against ground observations using statistical metrics such as Pearson correlation coefficient (r), Mean Error, Root Mean Square Error and Bias demonstrated best performance at monthly and wet season timesteps. Notably, all RS datasets showed relatively strong agreement with ground measurements at these timesteps contrary to weakest performance at daily and dry season timesteps. Therefore, for more reliable precipitation estimates using RS products, the monthly and wet season timescale assessments are recommended.
- (b)
- Comparative assessment of the four high resolution RS datasets identified CHIRPS and MSWEP datasets to be the most suitable products in identifying precipitation patterns and drought events. These products are therefore recommended for drought monitoring and water resource planning in the GRRB. In addition, these products may be extended in data scarce locations with greater degree of confidence. Nonetheless, to further minimize discrepancies and enhance reliability, bias correction should be applied whenever ground-based observations are available.
- (c)
- Most of RS products performed poorly in identifying drought events and extreme dry days with exception of CHIRPS and MSWEP in certain occasions. Specifically, for extreme weather conditions such as estimating consecutive dry days, CHIRPS product may be a better option in the absence of observed data. However, researchers are encouraged to apply bias correction techniques to improve reliability of RS datasets for extreme weather events as these datasets often struggle to capture extreme dry conditions especially in regions with high rainfall variability and complex terrain.
In conclusion, careful selection and rigorous validation of RS precipitation datasets are critical for improving drought early warning, water resource planning and climate adaptation strategies in the GRRB and similar data-scarce basins.
Data availability
Observed precipitation data for the study area is available upon request from the corresponding author. The remote sensing data used in this study are open source and freely available on respective websites. CHIRPS data may be accessed from https://www.chc.ucsb.edu/data/chirps, MSWEP data may be accessed from https://www.gloh2o.org/mswep/, TAMSAT data may be accessed from https://research.reading.ac.uk/tamsat/ and PERSIANN data from https://www.ncei.noaa.gov/products/climate-data-records/precipitation-persiann.
Funding and Acknowledgement
This project is co-funded by the European Union’s Horizon 2020 programme under the Marie Skłodowska-Curie Grant Agreement No. 101034352.
Author Contributions
V.O.: Conceptualization, Methodology, Supervision, Writing-Reviewing and Editing: E.B.M.: Conceptualization, Methodology, Writing-Reviewing and Editing, Software. E.R.: Conceptualization, Methodology, Software: G.A.: Validation, Project Administration, Visualization.
Conflicts of Interest
The authors declare no competing interests.
References
- Abramowitz, M.; Stegun, I. A. Handbook of Mathematical Functions: With Formulas, Graphs, and Mathematical Tables; Courier Corporation, 1965. [Google Scholar]
- AghaKouchak, A.; Farahmand, A.; Melton, F. S.; Teixeira, J.; Anderson, M. C.; Wardlow, B. D.; Hain, C. R. Remote sensing of drought: Progress, challenges and opportunities. Reviews of Geophysics 2015, 53(2), 452–480. [Google Scholar] [CrossRef]
- AghaKouchak, A.; Mehran, A.; Norouzi, H.; Behrangi, A. Systematic and random error components in satellite precipitation data sets. Geophysical Research Letters 2012, 39(9). [Google Scholar] [CrossRef]
- Alahacoon, N.; Edirisinghe, M. A comprehensive assessment of remote sensing and traditional based drought monitoring indices at global and regional scale. Geomatics, Natural Hazards and Risk 2022, 13(1), 762–799. [Google Scholar] [CrossRef]
- Al-Shamayleh, S.; Tan, M. L.; Samat, N.; Rahbeh, M.; Zhang, F. Performance of CHIRPS for estimating precipitation extremes in the Wala Basin, Jordan. Journal of Water and Climate Change 2024, 15(3), 1349–1363. [Google Scholar] [CrossRef]
- Ayugi, B.; Dike, V.; Ngoma, H.; Babaousmail, H.; Mumo, R.; Ongoma, V. Future Changes in Precipitation Extremes over East Africa Based on CMIP6 Models. Water 2021, 13(17), 17. [Google Scholar] [CrossRef]
- Baez-Villanueva, O. M.; Zambrano-Bigiarini, M.; Ribbe, L.; Nauditt, A.; Giraldo-Osorio, J. D.; Thinh, N. X. Temporal and spatial evaluation of satellite rainfall estimates over different regions in Latin-America. Atmospheric Research 2018, 213, 34–50. [Google Scholar] [CrossRef]
- Başakın, E. E.; Stoy, P. C.; Demirel, M. C.; Ozdogan, M.; Otkin, J. A. Combined Drought Index Using High-Resolution Hydrological Models and Explainable Artificial Intelligence Techniques in Türkiye. Remote Sensing 2024, 16(20), Article 20. [Google Scholar] [CrossRef]
- Beck, H. E.; Vergopolan, N.; Pan, M.; Levizzani, V.; van Dijk, A. I. J. M.; Weedon, G. P.; Brocca, L.; Pappenberger, F.; Huffman, G. J.; Wood, E. F. Global-scale evaluation of 22 precipitation datasets using gauge observations and hydrological modeling. Hydrology and Earth System Sciences 2017, 21(12), 6201–6217. [Google Scholar] [CrossRef]
- Beck, H. E.; Wood, E. F.; Pan, M.; Fisher, C. K.; Miralles, D. G.; van Dijk, A. I. J. M.; McVicar, T. R.; Adler, R. F. MSWEP V2 Global 3-Hourly 0.1° Precipitation: Methodology and Quantitative Assessment 2019. [CrossRef]
- Cattani, E.; Ferguglia, O.; Merino, A.; Levizzani, V. Precipitation Products’ Inter–Comparison over East and Southern Africa 1983–2017. Remote Sensing 2021, 13(21), Article 21. [Google Scholar] [CrossRef]
- Datti, A. D.; Zeng, G.; Tarnavsky, E.; Cornforth, R.; Pappenberger, F.; Abdullahi, B. A.; Onyejuruwa, A. Evaluation of Satellite-Based Rainfall Estimates against Rain Gauge Observations across Agro-Climatic Zones of Nigeria, West Africa. Remote Sensing 2024, 16(10), Article 10. [Google Scholar] [CrossRef]
- Dinku, T.; Funk, C.; Peterson, P.; Maidment, R.; Tadesse, T.; Gadain, H.; Ceccato, P. Validation of the CHIRPS satellite rainfall estimates over eastern Africa. Quarterly Journal of the Royal Meteorological Society 2018, 144(S1), 292–312. [Google Scholar] [CrossRef]
- Fowé, T.; Yonaba, R.; Mounirou, L. A.; Ouédraogo, E.; Ibrahim, B.; Niang, D.; Karambiri, H.; Yacouba, H. From meteorological to hydrological drought: A case study using standardized indices in the Nakanbe River Basin, Burkina Faso. In Natural Hazards; 2023. [Google Scholar] [CrossRef]
- Funk, C.; Peterson, P.; Landsfeld, M.; Pedreros, D.; Verdin, J.; Shukla, S.; Husak, G.; Rowland, J.; Harrison, L.; Hoell, A.; Michaelsen, J. The climate hazards infrared precipitation with stations—A new environmental record for monitoring extremes. Scientific Data 2015, 2(1), 150066. [Google Scholar] [CrossRef]
- Gao, F.; Zhang, Y.; Chen, Q.; Wang, P.; Yang, H.; Yao, Y.; Cai, W. Comparison of two long-term and high-resolution satellite precipitation datasets in Xinjiang, China. Atmospheric Research 2018, 212, 150–157. [Google Scholar] [CrossRef]
- Gao, F.; Zhang, Y.; Ren, X.; Yao, Y.; Hao, Z.; Cai, W. Evaluation of CHIRPS and its application for drought monitoring over the Haihe River Basin, China. Natural Hazards 2018, 92(1), 155–172. [Google Scholar] [CrossRef]
- Gebrechorkos, S. H.; Leyland, J.; Dadson, S. J.; Cohen, S.; Slater, L.; Wortmann, M.; Ashworth, P. J.; Bennett, G. L.; Boothroyd, R.; Cloke, H.; Delorme, P.; Griffith, H.; Hardy, R.; Hawker, L.; McLelland, S.; Neal, J.; Nicholas, A.; Tatem, A. J.; Vahidi, E.; Darby, S. E. Global-scale evaluation of precipitation datasets for hydrological modelling. Hydrology and Earth System Sciences 2024, 28(14), 3099–3118. [Google Scholar] [CrossRef]
- Gebrechorkos, S. H.; Peng, J.; Dyer, E.; Miralles, D. G.; Vicente-Serrano, S. M.; Funk, C.; Beck, H. E.; Asfaw, D. T.; Singer, M. B.; Dadson, S. J. Global high-resolution drought indices for 1981–2022. Earth System Science Data 2023, 15(12), 5449–5466. [Google Scholar] [CrossRef]
- Goudiaby, O.; Bodian, A.; Dezetter, A.; Diouf, I.; Ogilvie, A. Evaluation of Gridded Rainfall Products in Three West African Basins. Hydrology 2024, 11(6), Article 6. [Google Scholar] [CrossRef]
- Gumus, V. Evaluating the effect of the SPI and SPEI methods on drought monitoring over Turkey. Journal of Hydrology 2023, 626, 130386. [Google Scholar] [CrossRef]
- Helmi, A. M.; Abdelhamed, M. S. Evaluation of CMORPH, PERSIANN-CDR, CHIRPS V2.0, TMPA 3B42 V7, and GPM IMERG V6 Satellite Precipitation Datasets in Arabian Arid Regions. Water 2023, 15(1), Article 1. [Google Scholar] [CrossRef]
- Javed, M.; Didovets, I.; Böhner, J.; Hasson, S. U. Attributing historical streamflow changes in the Jhelum River basin to climate change. Climatic Change 2023, 176(11), 149. [Google Scholar] [CrossRef]
- Kangalawe, R.; Mwakalila, S.; Masolwa, P. Climate change impacts, local knowledge and coping strategies in the great Ruaha river catchment area, Tanzania. 2011. Available online: http://www.taccire.sua.ac.tz/handle/123456789/190.
- Kumar, V.; Sharma, K. V.; Pham, Q. B.; Srivastava, A. K.; Bogireddy, C.; Yadav, S. M. Advancements in drought using remote sensing: Assessing progress, overcoming challenges, and exploring future opportunities. Theoretical and Applied Climatology 2024, 155(6), 4251–4288. [Google Scholar] [CrossRef]
- Lombe, P.; Carvalho, E.; Rosa-Santos, P. Drought Dynamics in Sub-Saharan Africa: Impacts and Adaptation Strategies. Sustainability 2024, 16(22), 22. [Google Scholar] [CrossRef]
- López-Bermeo, C.; Montoya, R. D.; Caro-Lopera, F. J.; Díaz-García, J. A. Validation of the accuracy of the CHIRPS precipitation dataset at representing climate variability in a tropical mountainous region of South America. Physics and Chemistry of the Earth, Parts A/B/C 2022, 127, 103184. [Google Scholar] [CrossRef]
- Lu, J.; Wang, K.; Wu, G.; Ye, A.; Mao, Y. Inter-product biases in extreme precipitation duration and frequency across China. Environmental Research Letters 2024, 19(11), 114075. [Google Scholar] [CrossRef]
- Ma, F.; Luo, L.; Ye, A.; Duan, Q. Drought characteristics and propagation in the semiarid Heihe River Basin in Northwestern China. Journal of Hydrometeorology 2019, 20(1), 59–77. [Google Scholar] [CrossRef]
- Maidment, R. I.; Grimes, D.; Allan, R. P.; Tarnavsky, E.; Stringer, M.; Hewison, T.; Roebeling, R.; Black, E. The 30 year TAMSAT African Rainfall Climatology And Time series (TARCAT) data set. Journal of Geophysical Research: Atmospheres 2014, 119(18)(10), 619–10,644. [Google Scholar] [CrossRef]
- Makula, E. K.; Mangara, R. J.; Kazimili, B.; Mbigi, D.; Mtewele, Z. F.; Kebacho, L. L.; Kessy, W. P.; Limbu, P. T. S. Assessment of drought characteristics using SPEI and VHI in Tanzania and their associated climate factors. Natural Hazards 2025, 121(2), 2071–2093. [Google Scholar] [CrossRef]
- McKee, T. B.; Doesken, N. J.; Kleist, J. The relationship of drought frequency and duration to time scales. Proceedings of the 8th Conference on Applied Climatology 1993, 17(22), 179–183. Available online: https://climate.colostate.edu/pdfs/relationshipofdroughtfrequency.pdf.
- Moriasi, D. N.; Gitau, M. W.; Pai, N.; Daggupati, P. Hydrologic and water quality models: Performance measures and evaluation criteria. Transactions of the ASABE 2015, 58(6), 1763–1785. [Google Scholar] [CrossRef]
- Msigwa, A.; Makinde, A. S.; Ramoelo, A.; Komakech, H. C.; Ufoegbune, G. C. Spatial-temporal seasonal and annual rainfall trends and variability assessment in the Pangani Basin, East Africa. Physics and Chemistry of the Earth, Parts A/B/C 2024, 136, 103762. [Google Scholar] [CrossRef]
- Mukama, E. B.; Yimer, E. A.; Mbungu, W. B. B.; Dondeyne, S.; Van Griensven, A. Unravelling the Hydrologic Impact of Climate Change in the Great Ruaha River Basin, Tanzania. Environmental Research Communications. 2024. Available online: https://iopscience.iop.org/article/10.1088/2515-7620/ae1ed9/meta.
- Mukama, E. B.; Yimer, E. A.; Mbungu, W. B.; Dondeyne, S.; van Griensven, A. Evaluating the standardized and threshold based drought indices for historical drought detection in the Great Ruaha River Basin, Tanzania. In Natural Hazards; 2025. [Google Scholar] [CrossRef]
- Mulungu, D. M. M.; Mukama, E. Evaluation and modelling of accuracy of satellite-based CHIRPS rainfall data in Ruvu subbasin, Tanzania. Modeling Earth Systems and Environment 2023, 9(1), 1287–1300. [Google Scholar] [CrossRef]
- Nashwan, M. S.; Shahid, S.; Dewan, A.; Ismail, T.; Alias, N. Performance of five high resolution satellite-based precipitation products in arid region of Egypt: An evaluation. Atmospheric Research 2020, 236, 104809. [Google Scholar] [CrossRef]
- Nguyen, P.; Shearer, E. J.; Tran, H.; Ombadi, M.; Hayatbini, N.; Palacios, T.; Huynh, P.; Braithwaite, D.; Updegraff, G.; Hsu, K.; Kuligowski, B.; Logan, W. S.; Sorooshian, S. The CHRS Data Portal, an easily accessible public repository for PERSIANN global satellite precipitation data. Scientific Data 2019, 6, 180296. [Google Scholar] [CrossRef]
- Ogembo, V.; Akinyi Mohamed, G. Spectral Reflectance and Algal Bloom Monitoring of Lake Victoria Using Remote Sensing Techniques, Winum Gulf of Kenya. Earth Sciences 2023. [Google Scholar] [CrossRef]
- Ogembo, V.; Okotto, L.-G.; Manyalla, J.; Okotto-Okotto, J. Mapping Land Use Land Cover Changes from 1990 to 2020 in River Kuja Basin, Kenya. American Journal of Geographic Information System 2022, 11(1), 9–22. [Google Scholar]
- Ogembo, V.; Olala, S.; Ronoh, E.; Mukama, E.; Akinyi, G. Spatiotemporal Mapping of Seasonal Drought Dynamics in Kenya Using Remote Sensing and Combined Drought Indices for Climate Risk Planning. Review 2025. [Google Scholar] [CrossRef]
- Ogembo, V.; Thiery, W.; Pietroiusti, R.; Akurut, M.; Vanderkelen, I.; Akinyi, G. Hydroclimatic Modeling of Lake Victoria: Development of an Inland Lakes Integrated Water Balance Model with Future Climatic Risk Projections 2025. [CrossRef]
- Omondi, O. A.; Lin, Z. Trend and spatial-temporal variation of drought characteristics over equatorial East Africa during the last 120 years. Frontiers in Earth Science 2023, 10. Available online: https://www.frontiersin.org/articles/10.3389/feart.2022.1064940. [CrossRef]
- Orieschnig, C.; Cavus, Y. Spatial characterization of drought through CHIRPS and a station-based dataset in the Eastern Mediterranean. Proceedings of IAHS 2024, 385, 79–84. [Google Scholar] [CrossRef]
- Qiu, J.; Shen, Z.; Xie, H. Drought impacts on hydrology and water quality under climate change. Science of The Total Environment 2023, 858, 159854. [Google Scholar] [CrossRef]
- Satgé, F.; Ruelland, D.; Bonnet, M.-P.; Molina, J.; Pillco, R. Consistency of satellite-based precipitation products in space and over time compared with gauge observations and snow- hydrological modelling in the Lake Titicaca region. Hydrology and Earth System Sciences 2019, 23(1), 595–619. [Google Scholar] [CrossRef]
- Seyama, E. S.; Masocha, M.; Dube, T. Evaluation of TAMSAT satellite rainfall estimates for southern Africa: A comparative approach. Physics and Chemistry of the Earth, Parts A/B/C 2019, 112, 141–153. [Google Scholar] [CrossRef]
- Shaowei, N.; Jie, W.; Juliang, J.; Xiaoyan, X.; Yuliang, Z.; Fan, S.; Linlin, Z. Comprehensive evaluation of satellite-derived precipitation products considering spatial distribution difference of daily precipitation over eastern China. Journal of Hydrology: Regional Studies 2022, 44, 101242. [Google Scholar] [CrossRef]
- Shen, Z.; Yong, B.; Gourley, J. J.; Qi, W.; Lu, D.; Liu, J.; Ren, L.; Hong, Y.; Zhang, J. Recent global performance of the Climate Hazards group Infrared Precipitation (CHIRP) with Stations (CHIRPS). Journal of Hydrology 2020, 591, 125284. [Google Scholar] [CrossRef]
- SMUWC. SMUWC (Sustainable Management of the Usangu Wetland and its Catchment) [Final Project Reports]. Directorate of Water Resources, Ministry of Water, Government of Tanzania; Dar es Salaam, Tanzania, 2001; Available online: https://resources.bgs.ac.uk/sadcreports/tanzania2001smuwcusangubasinirrigation.pdf.
- Sun, Q.; Miao, C.; Duan, Q.; Ashouri, H.; Sorooshian, S.; Hsu, K.-L. A Review of Global Precipitation Data Sets: Data Sources, Estimation, and Intercomparisons. Reviews of Geophysics 2018, 56(1), 79–107. [Google Scholar] [CrossRef]
- Tarnavsky, E.; Grimes, D.; Maidment, R.; Black, E.; Allan, R. P.; Stringer, M.; Chadwick, R.; Kayitakire, F. Extension of the TAMSAT Satellite-Based Rainfall Monitoring over Africa and from 1983 to Present 2014. [CrossRef]
- Tibangayuka, N.; Mulungu, D. M. M.; Izdori, F. Future Changes in Climate Extremes: Insights from CMIP6 Model Simulations for the Kagera River Sub-basin, Tanzania. In Earth Systems and Environment; 2024. [Google Scholar] [CrossRef]
- Tijdeman, E.; Barker, L. J.; Svoboda, M. D.; Stahl, K. Natural and Human Influences on the Link Between Meteorological and Hydrological Drought Indices for a Large Set of Catchments in the Contiguous United States. Water Resources Research 2018, 54(9), 6005–6023. [Google Scholar] [CrossRef]
- Twaha, R.; Nobert, J.; Alexander, A. C.; Mulungu, D. M. M.; Senga, M. Delineating groundwater potential zones with GIS and analytic hierarchy process techniques: The case of Great Ruaha River catchment, Tanzania. Hydrogeology Journal 2024, 32(3), 785–799. [Google Scholar] [CrossRef]
- Van Lanen, H. a. J.; Wanders, N.; Tallaksen, L. M.; Van Loon, A. F. Hydrological drought across the world: Impact of climate and physical catchment structure. Hydrology and Earth System Sciences 2013, 17(5), 1715–1732. [Google Scholar] [CrossRef]
- Vernimmen, R. R. E.; Hooijer, A.; Mamenun; Aldrian, E.; van Dijk, A. I. J. M. Evaluation and bias correction of satellite rainfall data for drought monitoring in Indonesia. Hydrology and Earth System Sciences 2012, 16(1), 133–146. [Google Scholar] [CrossRef]
- Wallemacq, P.; Guha-Sapir, D.; McClean, D.; CRED; UNISDR. The Human Cost of Weather Related Disasters—1995—2015; 2015. [Google Scholar] [CrossRef]
- Wambura, F. J. Uncertainty of drought information in a data-scarce tropical river basin. Journal of Hydrology: Regional Studies 2020, 32, 100760. [Google Scholar] [CrossRef]
- Wambura, F. J.; Dietrich, O. Analysis of Agricultural Drought Using Remotely Sensed Evapotranspiration in a Data-Scarce Catchment. Water 2020, 12(4), Article 4. [Google Scholar] [CrossRef]
- Wang, Q.; Zeng, J.; Qi, J.; Zhang, X.; Zeng, Y.; Shui, W.; Xu, Z.; Zhang, R.; Wu, X.; Cong, J. A multi-scale daily SPEI dataset for drought characterization at observation stations over mainland China from 1961 to 2018. Earth System Science Data 2021, 13(2), 331–341. [Google Scholar] [CrossRef]
- Wodebo, D. Y.; Melesse, A. M.; Woldesenbet, T. A.; Mekonnen, K.; Amdihun, A.; Korecha, D.; Tedla, H. Z.; Corzo, G.; Teshome, A. Comprehensive performance evaluation of satellite-based and reanalysis rainfall estimate products in Ethiopia: For drought, flood, and water resources applications. Journal of Hydrology: Regional Studies 2025, 57, 102150. [Google Scholar] [CrossRef]
- Wu, Z.; Xu, Z.; Wang, F.; He, H.; Zhou, J.; Wu, X.; Liu, Z. Hydrologic Evaluation of Multi-Source Satellite Precipitation Products for the Upper Huaihe River Basin, China. Remote Sensing 2018, 10(6), Article 6. [Google Scholar] [CrossRef]
- WWF. Great Ruaha River Basin Climate Vulnerability and Capacity Analysis (CVCA) CARE-WWF. 2017. Available online: https://www.careevaluations.org/wp-content/uploads/CARE-WWF-Great-Ruaha-CVCA_FINAL.pdf.
- Yang, N.; Yu, H.; Lu, Y.; Zhang, Y.; Zheng, Y. Evaluating the Applicability of PERSIANN-CDR Products in Drought Monitoring: A Case Study of Long-Term Droughts over Huaihe River Basin, China. Remote Sensing 2022, 14(18), Article 18. [Google Scholar] [CrossRef]
- Yevjevich, V. M. Objective approach to definitions and investigations of continental hydrologic droughts. PhD Thesis, Colorado State University. Libraries, 1967. Available online: https://mountainscholar.org/bitstream/handle/10217/61303/HydrologyPapers_n23.pdf.
- Yu, C.; Hu, D.; Liu, M.; Wang, S.; Di, Y. Spatio-temporal accuracy evaluation of three high-resolution satellite precipitation products in China area. Atmospheric Research 2020, 241, 104952. [Google Scholar] [CrossRef]
- Yue, Z.; Mei, X.; Xu, Z.; Zhong, S. A Literature Review of Study on Remote Sensing Drought Monitoring System. 2024 12th International Conference on Agro-Geoinformatics (Agro-Geoinformatics), 2024; pp. 1–6. [Google Scholar] [CrossRef]
- Zarrin, A.; Dadashi-Roudbari, A. Evaluation of reanalysis-based, satellite-based, and “bias-correction”-based datasets for capturing extreme precipitation in Iran. Meteorology and Atmospheric Physics 2022, 134(4), 67. [Google Scholar] [CrossRef]
- Zuberi, H.; Lou, Y.; Ojara, M. Spatial-Temporal Analysis of Drought Characteristics in Tanzania from 1978 to 2018 2022, 5, 19–34. [CrossRef]

Table 1.
Metadata of observed rainfall stations used for ground validation.
| Station name | Latitude | Longitude | Period | Record length (years) | Missing data (%) |
|---|---|---|---|---|---|
| Msembe Met | -7.716 | 34.899 | 1971-2023 | 53 | 3.4 |
| Kimani met | -8.833 | 34.167 | 1963-2023 | 61 | 3.6 |
| Mafinga Met | -8.310 | 35.281 | 1964-2023 | 60 | 16.3 |
| Igawa Met | -8.709 | 34.377 | 1965-2023 | 59 | 2.57 |
| Iringa Maji Met | -7.773 | 35.699 | 1972-2023 | 52 | 1.8 |
| Iringa Met (Nduli) | -7.630 | 35.770 | 1960-2023 | 52 | 0.05 |
| Mtera Met | -7.128 | 35.992 | 1971-2023 | 53 | 3.3 |
Table 2.
Summary of statistical metrics used in this study.
| Statistical metric | Formula | Range | Best value |
| r | -1 to 1 | 1 | |
| ME | -∞ to ∞ | 0 | |
| RMSE | 0 to ∞ | 0 | |
| BIAS | BIAS = | 0 to ∞ | 0 |
Table 3.
Summary of drought characteristics using SPI-12 computed from ground observations and RS datasets. (Values in bracket represent drought periods captured by RS datasets. A tick represents a captured drought event while a cross represents uncaptured drought event).
Table 3.
Summary of drought characteristics using SPI-12 computed from ground observations and RS datasets. (Values in bracket represent drought periods captured by RS datasets. A tick represents a captured drought event while a cross represents uncaptured drought event).
| Drought event (Observed) | Drought duration (Observed) | CHIRPS | MSWEP | PERSIANN | TAMSAT |
|---|---|---|---|---|---|
| 1993 | 2 | ✖ | ✖ | ✔ (2) | ✖ |
| 1997 | 8 | ✔ (8) | ✖ | ✔ (3) | ✖ |
| 2003 | 11 | ✔ (10) | ✔ (1) | ✖ | ✔ (2) |
| 2005-2006 | 12 | ✔ (12) | ✔ (12) | ✔ (12) | ✔ (11) |
| 2012-2013 | 13 | ✔(3) | ✔ (3) | ✖ | ✖ |
| 1986 | 10 | ✖ | ✔ (8) | ✖ | ✖ |
| 1994 | 8 | ✔ (1) | ✔ (2) | ✖ | ✔ (1) |
| 2000 | 8 | ✔ (10) | ✔ (8) | ✔ (4) | ✔ (7) |
| 2003-2004 | 4 | ✔ (12) | ✔ (4) | ✖ | ✖ |
| 2005-2006 | 12 | ✔ (4) | ✔ (12) | ✔ (12) | ✔ (12) |
| 2007-2008 | 2 | ✖ | ✖ | ✖ | ✖ |
| 2010-2011 | 5 | ✔ (4) | ✔ (4) | ✔ (3) | ✔ (4) |
| 2015 | 2 | ✖ | ✖ | ✖ | ✖ |
| 1986 | 10 | ✖ | ✔ (8) | ✖ | ✖ |
| 1997 | 9 | ✔ (9) | ✖ | ✔ (4) | ✖ |
| 1999 | 7 | ✔ (11) | ✔ (11) | ✔ (11) | ✔ (11) |
| 2000 | 9 | ✔ (9) | ✔ (8) | ✔ (4) | ✖ |
| 2003-2004 | 2 | ✔ (11) | ✔ (2) | ✖ | ✖ |
| 2005-2006 | 12 | ✔ (11) | ✔ (12) | ✔ (12) | ✔ (12) |
| 2010-2011 | 5 | ✔ (3) | ✔ (4) | ✔ (3) | ✖ |
| 1995 | 9 | ✖ | ✖ | ✖ | ✖ |
| 2010-2011 | 11 | ✔ (5) | ✔ (3) | ✔ (12) | ✔ (11) |
| 2011-2012 | 29 | ✖ | ✖ | ✖ | ✖ |
| 1987 | 2 | ✖ | ✖ | ✖ | ✖ |
| 1989 | 9 | ✖ | ✖ | ✖ | ✖ |
| 1996-1997 | 23 | ✔ (10) | ✔ (10) | ✔ (7) | ✖ |
| 2003-2004 | 2 | ✔ (12) | ✔ (3) | ✖ | ✖ |
| 2017 | 7 | ✔ (7) | ✖ | ✔ (9) | ✔ (7) |
| 1988-1989 | 12 | ✔ (2) | ✖ | ✔ (7) | ✔ (11) |
| 1991-1992 | 22 | ✖ | ✖ | ✖ | ✖ |
| 2000 | 7 | ✔ (7) | ✔ (8) | ✔ (8) | ✖ |
| 2003-2004 | 3 | ✔ (12) | ✔ (12) | ✔ (2) | ✔ (7) |
| 2005-2006 | 3 | ✔ (11) | ✔ (13) | ✔ (3) | ✔ (12) |
| 2011 | 9 | ✔ (2) | ✔ (1) | ✔ (2) | ✖ |
| 2017 | 2 | ✔ (9) | ✔ (12) | ✔ (11) | ✔ (11) |
| 1986 | 11 | ✔ (8) | ✖ | ✖ | ✔ (8) |
| 2000 | 9 | ✔ (9) | ✖ | ✖ | ✔ (7) |
| 2005-2006 | 12 | ✔ (4) | ✔ (12) | ✔ (11) | ✔ (12) |
| 2010 | 5 | ✔ (1) | ✔ (9) | ✖ | ✖ |
| 2011 | 2 | ✔ (2) | ✔ (10) | ✖ | ✖ |
| 2012-2014 | 14 | ✖ | ✔ (2) | ✔ (11) | ✔ (9) |
| 2017 | 9 | ✖ | ✖ | ✔ (2) | ✔ (8) |
| 2019 | 7 | ✖ | ✖ | ✖ | ✖ |
Table 4.
Performance metrics for RS datasets in detecting annual maximum number of consecutive dry days (CDD).
Table 4.
Performance metrics for RS datasets in detecting annual maximum number of consecutive dry days (CDD).
| Station | correlation | ME | RMSE | Bias | Product |
| Igawa_Met | 0.25 | 5.33 | 42.51 | 6.57 | CHIRPS |
| Iringa_Maji | 0.00 | -3.47 | 38.54 | -3.62 | CHIRPS |
| Iringa_Met_(Nduli) | 0.33 | 0.66 | 27.68 | 0.66 | CHIRPS |
| Kimani_Met | 0.29 | 22.27 | 52.22 | 20.98 | CHIRPS |
| Mafinga_Met | 0.17 | -67.56 | 76.95 | -65.45 | CHIRPS |
| Msembe_Met | -0.11 | 9.93 | 54.93 | 9.07 | CHIRPS |
| Mtera_Met | 0.07 | -0.52 | 56.07 | 0.71 | CHIRPS |
| Igawa_Met | 0.02 | -29.37 | 61.99 | -31.93 | MSWEP |
| Iringa_Maji | 0.16 | -8.25 | 51.96 | -12.93 | MSWEP |
| Iringa_Met_(Nduli) | 0.23 | -32.37 | 60.02 | -32.37 | MSWEP |
| Kimani_Met | 0.09 | -20.12 | 65.58 | -23.49 | MSWEP |
| Mafinga_Met | 0.21 | -16.59 | 48.46 | -23.84 | MSWEP |
| Msembe_Met | 0.25 | -5.44 | 53.44 | -3.99 | MSWEP |
| Mtera_Met | -0.25 | -61.87 | 108.43 | -71.31 | MSWEP |
| Igawa_Met | 0.28 | -101.89 | 109.22 | -94.75 | PERSIANN |
| Iringa_Maji | 0.16 | -76.43 | 87.18 | -74.48 | PERSIANN |
| Iringa_Met_(Nduli) | 0.19 | -84.84 | 94.13 | -84.92 | PERSIANN |
| Kimani_Met | 0.17 | -80.64 | 92.21 | -74.52 | PERSIANN |
| Mafinga_Met | 0.37 | -60.75 | 73.62 | -56.07 | PERSIANN |
| Msembe_Met | -0.08 | -94.39 | 110.28 | -94.99 | PERSIANN |
| Mtera_Met | -0.47 | -107.89 | 128.84 | -100.19 | PERSIANN |
| Igawa_Met | 0.24 | 19.47 | 46.43 | 17.67 | TAMSAT |
| Iringa_Maji | 0.13 | 34.75 | 51.05 | 34.23 | TAMSAT |
| Iringa_Met_(Nduli) | 0.25 | 29.97 | 40.66 | 29.97 | TAMSAT |
| Kimani_Met | 0.27 | 41.45 | 62.70 | 41.64 | TAMSAT |
| Mafinga_Met | 0.30 | 41.70 | 55.46 | 43.50 | TAMSAT |
| Msembe_Met | 0.16 | 38.11 | 61.30 | 37.25 | TAMSAT |
| Mtera_Met | 0.17 | 1.29 | 53.47 | 0.13 | TAMSAT |
Disclaimer/Publisher’s Note: The statements, opinions and data contained in all publications are solely those of the individual author(s) and contributor(s) and not of MDPI and/or the editor(s). MDPI and/or the editor(s) disclaim responsibility for any injury to people or property resulting from any ideas, methods, instructions or products referred to in the content. |
© 2025 by the authors. Licensee MDPI, Basel, Switzerland. This article is an open access article distributed under the terms and conditions of the Creative Commons Attribution (CC BY) license (http://creativecommons.org/licenses/by/4.0/).
Copyright: This open access article is published under a Creative Commons CC BY 4.0 license, which permit the free download, distribution, and reuse, provided that the author and preprint are cited in any reuse.


