
Submitted:
03 December 2025
Posted:
04 December 2025
You are already at the latest version
Abstract
Background/Objectives: The Notch-ADAM17 pathway is a fundamental signaling mechanism where ADAM17, a disintegrin and metalloprotease, cleaves the Notch re-ceptor after the Notch receptor binds to a ligand. Crosstalk between Notch and AD-AM17 is often altered in pathological situations. Alterations in Notch2 expression, in particular, appear to be correlated with the onset of various autoimmune diseases. In primary Sjögren's disease (pSjD), an autoimmune disorder characterized by chronic inflammation, the role of ADAM17 has been extensively explored, but a correlation with Notch2 has not yet been evaluated. Methods: To analyze the gene and protein expression of Notch2 in pSjD and a possible correlation with ADAM17 expression and with the patient’s inflammatory grade, we employed an integrated co-detection pro-tocol to analyze salivary gland tissue sections by combining in situ hybridization (ISH) with immunohistochemistry (IHC). Results: combined ISH/IHC allows us to demon-strate an increased expression of Notch2 mRNA and protein in pSjD salivary glands (SGs) biopsies, that appears correlated with an increased expression of ADAM17, both in acinar and duct cells and in infiltrating lymphocytes. Notch2/ADAM17 expression is higher in biopsies of pSjD SGs characterized by a high degree of inflammation. Con-clusion: this work demonstrates the correlated expression in pSjD SGs of ADAM17, which plays multiple roles in the pathogenesis of SjD, and Notch2, widely considered a key player in various inflammatory mechanisms, offering a starting point for future therapeutic interventions to investigate.
Keywords:
primary Sjögren’s syndrome
; Notch2
; ADAM17
; inflammation
1. Introduction
The Notch pathway is an evolutionarily preserved signaling system that modulates multifaceted activities in a plethora of molecular events, which is implicated in reorganization and regeneration of tissues and in intricate interactions with other signaling pathways [1,2]. The induction of Notch signaling occurs through a finely regulated cascade of proteolytic cleavages with subsequent triggering of downstream target genes [3,4]. Notch receptors can cooperate with Notch ligands when a ligand of the Delta/Serrate/LAG-2 family (positioned on the surface of bordering cells) binds to the extracellular domain of the Notch receptor and activates proteolytic cleavage by a member of the disintegrin and metalloprotease (ADAM) family. ADAM10 and/or ADAM17 cleavage produces a substrate for an additional cleavage, generating a Notch extracellular form of the receptor, which is a membrane-bound Notch fragment. Following, the presenilin-containing γ-secretase complex cleaves the Notch receptor, leading to the formation of the Notch intracellular domain (NICD), which is released and corresponds to the activated form of Notch. Moreover, NICD translocates to the nucleus and forms complexes with specific DNA-binding proteins (CBF1/Suppressor of Hairless/LAG-1 and Mastermind/SEL-8) and transcriptionally activates target genes [3]. A schematic representation of the interrelationship between Notch and ADAM17 is shown in Figure 1.
Notch2 is one of the four receptors (Notch1-4) commonly expressed in a variety of cancer cells, including gastric, hematological, and lung cancer. In this context, Notch2 is the main factor activating alveolar morphogenesis and maintaining airway epithelial integrity [5]. Interestingly, Notch2 enhances the activity of pathways associated with inflammation through the regulation of immunomodulatory functions by CD4+ T cells [6]. Therefore, Notch2 has been shown to be upregulated in inflammatory states that characterize diseases like rheumatoid arthritis (RA) and bacterial and viral infections [6,7,8,9]. Not surprisingly, recent evidence points to Notch2 signaling as an important player in autoimmunity, characterized by sustained and chronic inflammation [10]. Effectively, aberrant Notch2 signaling has been observed in clinical samples of patients affected by RA [11,12,13,14,15,16,17], systemic lupus erythematosus (SLE) [18,19] and systemic sclerosis [20].
Currently, a possible involvement of an altered Notch2 expression in the pathogenesis of Sjögren’s syndrome disease (SjD) has not yet been experimentally analyzed. SjD is a complex, disabling systemic autoimmune disorder affecting several tissues. Patients have, as a primary characteristic, the altered tissue organization and consequently a reduced functionality of the exocrine glands, which manifests primarily in the salivary glands (SGs) and lacrimal glands, representing the first target of inflammation [21]. Over the past decade major advances have been made in understanding the pathogenesis of primary SjD (pSjD), so called because it is not associated with secondary pathologies, and the trajectory of research is swiftly advancing, with a focused lens on the role of Notch2 in pSjD.
Most of our knowledge of the pathogenesis of SGs from pSjD patients relies on approaches using standard gene and protein analysis methods. It is crucial to unbiasedly understand the molecular changes in the SGs at the cellular level, within the tissue context. Due to the multiple benefits of both in situ hybridization (ISH) and immunohistochemistry (IHC) to detect gene and protein expression and the robustness of the RNAscope assay, in this study we employed a dual ISH-IHC protocol to combine both assays on the same biopsy specimens of SGs from pSjD expressing an increasing degree of inflammation. This method is called dual RNAscope ISH–IHC and allows to simultaneously detect mRNA and protein expression in formalin-fixed, paraffin-embedded tissue sections [22]. We analyzed Notch2 expression at both the gene and protein levels and a possible correlation with ADAM17 expression in the same biopsy specimens. The objective was to demonstrate the hypothetical correlation between Notch2 and ADAM17 expression in pSjD, which could be more detectable in patients with a high degree of inflammation of the SGs. This would lead to the identification of new therapeutic molecular targets and the discovery of new pathways that determine the loss of glandular function.
2. Materials and Methods
2.1. Patients, Clinical Specimens
A subset of consecutive labial minor salivary glands (MSGs) stained only with haematoxylin and eosin (H&E) was randomly retrieved from the archive of the Anatomical and Molecular Pathology Section, School of Medicine, University of Bari, Italy. Biopsies were performed between 2022 and the end of 2023 in individuals with a clinical suspicion of pSjD for diagnostic purposes only and after signing a written informed consent. The biopsies were fixed in formalin and paraffin (FFP) embedded. The study was approved by the local ethical review committee, and the experiments were conducted according to the tenets of the Declaration of Helsinki. Labial MSGs biopsy samples were taken from the suspected patients with SjD from the lower lip under local anaesthesia through normal mucosa, according to the explant outgrowth technique [23]. Bioptic sections of MSGs belonging to different groups of patients with several grades of inflammation were identified. The department selected 34 biopsies from which bioptic specimens belonging to the same number of patients (n=10) were chosen, excluding dubious cases (n=4). Healthy control subjects (n = 10) were analyzed for an abnormal salivary function and suspected pSjD, which resulted in a normal biopsy. The patients all had definite disease according to the revised 2002 American-European criteria [24]. All patients had the clinical symptoms of dry eyes and mouth, a positive Schirmer’s test [less than 5 mm wetting of a strip of filter paper per five minutes (min.)] and Rose Bengal staining (increased uptake of Rose Bengal dye in devitalized areas in the conjunctiva and cornea) along with the presence of at least one of the following autoantibodies: anti-Ro/SSA, anti-La/SSB, anti-nuclear antibodies and rheumatoid factor. None of the patients studied had received any glucocorticoid and/or immunosuppressive drug treatment until biopsy performance. Moreover, since assessments of FS and GC are semi-quantitative methods where the histopathological tissue architecture might differ on multiple sections taken from the same gland, a re-evaluation of the FS and GC was conducted on MSGs tissue from all pSjD patients in order to eliminate potential discrepancies. This was performed on hematoxylin-eosin-stained sections in accordance with our previous laboratory examinations of such structures. Patient stratification was carried out by stratifying the pSjD patients into three distinct groups, where each group represented a disease stage according to the degree of inflammation in their MSG using the Inflammatory severity index. Patients with low lesions (FS ≤1) were included in the first group (S1), patients with moderate lesions (FS ≥2) were included in the second group (S2), while patients displaying severe lesions and GC in the MSG tissue (FS ≥2 and GC+) were classified in the third group (S3). At the time of biopsy, the median age of subjects in the control group was 49.8 years (range 21–66), the median age of patients in the group with low focus scores was 57.7 years (range 24.6–66.9), the median age of patients in the group with intermediate focus scores was 52.4 years (range 24.8–66.7), and the median age of patients in the group with high focus scores was 52.9 years (range 38.9–70.1). The clinical characteristics of pSjD patients and healthy controls are summarized in Table 1.
2.2. Notch2 mRNA ISH Assay
RNAscope assay was performed on FFPE biopsies using RNAscope 2.5 HD Reagent Kit (RED 322350, Advanced Cell Diagnostics (ACD), Hayward, CA). Briefly, tissue sections were deparaffinized with xylene and 100% ethanol and incubated with pretreat-1 solution for 10 min., pretreat-2 for 15 min., and pretreat-3 for 30 min (Pretreatment kit 322330, ACD). The slides were then hybridized with a probe Hs-NOTCH2 (ref. 488101), positive control probe—Hs-PPIB (ref. 313901), negative control probe—DapB (ref. 310043) in the HybEZ oven (ACD) at 40 °C for 2 h. The Hs-PPIB probe for human housekeeping gene PPIB was used as a control to ensure RNA quality. After hybridizations, slides were subjected to signal amplification using HD 2.5 detection Kit, and hybridization signal was detected using a mixture of Fast- RED solutions A and B (1:60). After counterstaining with Gill’s hematoxylin, slides were dried in a 60 °C dry oven for 15 min and mounted with Glycergel Mounting Medium (Dako, C0563). Sections from each experimental group were scanned using the whole-slide morphometric analysis scanning platform Aperio Scanscope CS (Leica Biosystems, Nussloch, Germany). All the slides were scanned at the maximum available magnification (40×) and stored as digital high-resolution images on the workstation associated with the instrument. Based on the PPIB evaluation, all the cases were included in the analysis. Digital slides were evaluated with Aperio ImageScope v.11 software (Leica Biosystems, Nussloch, Germany) at 20× magnification and ten fields with an equal area were selected for the analysis at 40× magnification. The mRNA expression was assessed by Aperio RNA ISH algorithm that provides standardized quantitation of RNA ISH staining in whole slide images of FFPE tissue. This algorithm automatically quantifies the staining across whole slides, counts individual molecular signals and clusters in the cells. The obtained results are divided in 3 range: 1+ that includes cells containing 2 to 5 dots for cell; 2+ that include cells containing 6 to 20 dots for cell; 3+ that include cells containing more than 20 dots for cell. The statistical significance of differences between the mean values of the percent labeled areas between ABC and GCB tumor specimens were determined by the 2-way Anova test in GraphPad Prism 5.0 software (GraphPad software, La Jolla, CA, USA). Findings were considered significant at P values < 0.05.
2.3. Notch2 Protein IHC
Serial 3 μm sections of healthy and pSjD formalin-fixed, paraffin-embedded minor SGs tissues were used for immunohistochemical staining. Paraffin sections were deparaffinized with xylene and hydrated with a series of graded ethanol washes. After deparaffinization and dehydration, the slides were washed in phosphate-buffered saline (PBS) (pH 7.6 3 × 10 min), then immersed in EDTA buffer (0.01 M, pH 8.0) for 20 min in a water bath at 98 °C to unmask antigens. The sections were immunolabeled according to the following procedure: blockade of endogenous peroxidase by treatment with 3% hydrogen peroxide solution in water for 10 min at room temperature (RT); rinsing for 3 × 10 min in PBS, pH 7.6; preincubation in non-immune donkey serum (Dako LSAB Kit, Dako, CA, USA) for 1 h at RT; and incubation overnight at 4 °C with primary anti-Notch2 Antibody (Ab) (Cell Signaling; 1:100 dilution). The slides were washed for 3 × 10 min in PBS and then incubated with the secondary Ab (Santa Cruz Biotechnology, TX, USA) diluted 1 : 200 in PBS for 1 h at RT, rinsed for 3 × 10 min in PBS, incubated with the streptavidin-peroxidase complex (Vector Laboratories, CA, USA) for 1 h at RT, incubated with the chromogen 3,3-diaminobenzidine tetrahydrochloride (DAB) (Vector Laboratories) for 10 min at RT, then counterstained with hematoxylin (Merck Eurolab, Dietikon, Switzerland). Negative controls of the immunoreactions were performed by replacing the primary Ab with donkey serum diluted 1:10 in PBS. After the addition of the secondary Ab, no specific immunostaining was observed in the negative controls (data not shown).
2.4. ADAM17 Protein IHC
The slides used in RNAscope assay have been disassembled by incubation at 60 °C in an oven for few minutes. Afterwards, slides were washed in PBS and processed by IHC classical protocol. Sections were pre-treated with sodium citrate pH 6.1 or pH 9 (Dako Corporation, Milan, Italy) in Dako PT Link for antigen retrieval solution for 30 min at 98 °C and then incubated with rabbit polyclonal anti-ADAM17 antibody (GTX101358, GeneTex International Corporation, USA), diluted 1:250. After incubation with the relative secondary Ab (Santa Cruz Biotechnology, TX, USA) diluted 1: 200 in PBS for 1 h at RT, the streptavidin-peroxidase complex (Vector Laboratories, CA, USA) was added before the incubation with DAB for 10 min at RT. Thereafter, the sections were counterstained with Mayer hematoxylin and mounted in synthetic medium.
2.5. IHC Analysis and Quantification
The protein expression was assessed with the Positive Pixel Count algorithm embedded in the Aperio ImageScope software and reported as positivity percentage, defined as the number of positively stained pixels on the total pixels in the image. Sections from each experimental group (n.10), 10 cases per group, were scanned using the whole-slide morphometric analysis scanning platform Aperio Scanscope CS (Leica Biosystems, Nussloch, Germany). All the slides were scanned at the maximum available magnification (40×) and stored as digital high-resolution images on the workstation associated with the instrument. Digital slides were inspected with Aperio ImageScope v.11 software (Leica Biosystems, Nussloch, Germany) at 20× magnification and ten fields with an equal area were selected for the analysis at 40× magnification.
The statistical significance of differences between the mean values of the percent labeled areas between pSjD SGs specimens and control tissues was determined by the 2way Anova test in GraphPad Prism 5.0 software (GraphPad software, La Jolla, CA, USA). Findings were considered significant at P values <0.05.
2.6. Aperio Digital ISH and IHC Analysis and Quantification
Scans of stained tissue were obtained using a high-resolution digital Aperio Scanscope CS2 (Leica Biosystems, Nussloch, Germany), and an archive of the digital high-resolution images was created. Digital slides were analyzed with Aperio ImageScope v.11 software (Leica Biosystems) at 10x magnification, and ten fields with an equal area were randomly selected for analysis at 40x magnification. The expression of Notch2 mRNA and Notch 2 protein was assessed with the Positive Pixel Count algorithm embedded in Aperio ImageScope software and reported as positivity percentage, defined as the number of positively stained pixels on the total pixels in the image. This approach allows a reliable automatic estimation of the amount of staining in the tissue, in addition to offering the benefit of reducing variability associated to human error.
2.7. Statistic
Normalized data of mRNA and protein expression were processed to calculate mean values ± standard error (s.e.). Differences between parameters were evaluated using Student’s t-test. Spearman’s correlation coefficients were calculated to evaluate associations between Notch2 and ADAM17 and pSjD inflammatory grade. Differences were considered statistically significant at P < 0.05.
3. Results
3.1. SjD Histopathology of the Bioptic SGs Specimens
The glandular histopathology of the three inflammatory grades of SjD patients, low, intermediate and severe, was compared relatively to healthy subjects (Figure 2, panels A-D). The histopathological features of SGs in SjD include parenchymal and ductal changes. It was possible to see, in all the biopsies used, a decrease or even disappearance of acini, lymphocyte infiltration and proliferation of the lining cells, and formation of myoepithelial cell islands which appear to be more pronounced in the severe grade of inflammation (panel D). Furthermore, focal inflammation in SjD SGs tissue, especially in severe cases (pSjD III), is accompanied by acinar atrophy, ductal dilatation, and fibrosis. The presence of adipose tissue is noticeable, and the lobular fibrosis is also related to the severity of inflammation (arrows in the panels B-D).
3.2. Notch2 mRNA Detection in SjD SGs by ISH
RNA ISH was performed on MSGs tissue sections (healthy control and patients with low, moderate and severe lesions) to assess the presence and quantify Notch2 mRNA using RNAscope probe sets. Notch2 mRNA signal was observed in the epithelial cells of the acini and ducts, as well as in the interlobular infiltrative cells (Figure 3, A-F). To understand the relationship between the severity of the inflammatory condition of the pSjD and the number of Notch2 mRNA-positive cells in SGs biopsies, the Notch2 mRNA expression was compared across the cell types observed in the SGs tissue, correlating it with the low, moderate or severe inflammatory condition. In pSjD patients there was a statistically significant positive correlation between the grade of inflammation and the percentage of acinar and ductal epithelial cells positive for Notch2 mRNA ISH signals (Figure 3, panel E). The mean percentage of Notch2 mRNA-positive cells was 12 ± 0.93% to 86% ± 3.4% (from healthy to severe SjD) for acinar epithelial cells, and 8 ± 0.38% to 74% ± 2.3% for ductal epithelial cells (r = 0.76; P = 0.02; r = 0.91; P = 0.003, respectively); in addition, a significant correlation between Notch 2 mRNA expression in infiltrating inflammatory cells and severity of inflammation was also detected (16 ± 1.3% to 61% ± 6.7%), for infiltrating inflammatory cells from healthy to severe inflammatory grade) (r = 0.34; P = 0.23) (Figure 3, A-D). These results confirmed the presence of Notch2 transcripts in acinar, ductal epithelial cells and infiltrating inflammatory cells and that the level of Notch2 mRNA detected in the SGs correlates with the severity of the inflammatory grade and could represent an index of evolving disease (Figure 3, panels A-D).
3.3. Notch2 Protein Expression in SjD SGs Biopsies was Correlated with the Degree of Inflammation
Immunohistochemical analyses against Notch2 protein were performed, and the results of this paper were obtained from at least three repeated experiments, and the evaluation was conducted by two blinded, independent researchers. The expression level of Notch2 protein in the pSjD SGs tissue was shown in Figure 4. Notch2 protein immunoexpression had a fine speckled-punctuated pattern. In all the pSjD cases, immunostaining extended to more than 60% of ductal cells (grade III) and to more than 80% of acinar cells with moderate (grade II) or strong intensity (grade III), resulting in a “strongly positive” classification. The infiltrating cells showed a relevant positivity which was found to be correlated with the increase in the subject’s inflammatory characteristics. All healthy subjects tested as controls were Notch2 negative. A statistically significant difference was found between the pSjD low, moderate and severe grade of inflammation subgroups regarding the Notch2 immunoreactivity (P < 0.01).
As shown in Figure 4 (panels A-E), the positive Notch2 protein was predominantly located in the cell membrane and/or cytoplasmic, especially in the acinar cells. Brown granular staining was deemed as positive performance.
Spearman’s rank correlation analysis of the histological Notch2 protein expression and the inflammation grade demonstrated that there were significant differences in the distribution of Notch2 expression and inflammatory grade between healthy subjects and the SS-I-low, SS-II-moderate and SS-III-severe groups. In fact, a significant direct association between acinar cellular staining for Notch2 and the histological inflammatory grade of pSS was reported (r = 0.571 for grade I, r = 0.678 for grade II and r = 0.786 for grade III; p < 0.05). Similarly, high Notch2 expression was closely associated with a high inflammatory degree in ductal cells (r = 0.64 for grade I, r = 0.76 for grade II and r = 0.92 for grade III; p < 0.05). Similarly, investigating the expression of Notch2 in infiltrating lymphocytes in association with the patients’ inflammatory condition with Spearman’s correlation analysis, a positive correlation was also demonstrated (r = 0.345 for grade I, r = 0.402 for grade II and r = 0.715 for grade III; p < 0.001). Similarly, when the correlation between the expression of Notch mRNA and Notch protein was statistically examined, a significant positive correlation ratio was observed for each inflammatory grade (r = 0.74 for grade I, r = 0.72 for grade II and r = 0.92 for grade III; p < 0.05, p<0.05) (Figure 5).
3.4. Notch2 Expression Correlates with ADAM17 Expression in SjD SGs Tissue
To find evidence for an association between Notch2 mRNA and ADAM17 expression in MSGs of pSjD patients, some bioptic specimens, including the appropriate healthy controls (see the Materials and Methods section for details), were disassembled and used for IHC analysis. We examined the expression of ADAM17 by IHC in pSjD biopsy samples in comparison with healthy subjects. The number and the distribution of lymphocytic foci in the different pSjD SGs bioptic specimens were quantified and then classified as I, low; II, intermediate; and III, advanced, respectively, as reported in the “Materials and Methods” section. Ten biopsy specimens for each group were analyzed. Anti-human ADAM17 antibody mAb was used to evidence SGs ADAM17 expression (Figure 6, panels A-F). As shown in Figure 6, strikingly, all pSjD SGs samples revealed a positive staining for ADAM17, whereas normal tissues showed very low ADAM17 expression (p<0.01). The staining of ADAM17 protein ranged from weak to strong, moving from low to high inflammatory levels (p < 0.01), and the results clearly showed that ADAM17-positive staining was increased in those biopsies characterized by a higher inflammatory degree that are also characterized by elevated expression of Notch2 mRNA expression. As observed, in all pSjD glandular specimens, ADAM17 seems to be expressed both in acinar, ductal cells, and in infiltrating lymphocytes (Figure 6, panels A-D); interestingly, ADAM17’s expression is correlated with increased immune cell infiltration. Very important is the observation of a positive correlation between ADAM17 expression and Notch2 mRNA expression within all 30 pSjD analyzed SGs samples (r = 0.88 for grade I, r = 0.83 for grade II and r = 0.71 for grade III; p < 0.05) (Figure 6, panel G).
Importantly, ADAM17 staining also correlated with protein levels of Notch2 in SjD samples (r = 0.74 for grade I, r = 0.7 for grade II and r = 0.92 for grade III; p < 0.05) (Figure 7, panels A-C).
4. Discussion
Notch signaling is physiologically important for cell-to-cell communication and for controlling multiple cell differentiation processes during embryonic and adult life [25]. Notch2, in particular, is described to reveal activity in liver, kidney, ovary, smooth muscle, and T and B lymphocyte development [26,27].
Nevertheless, there are many controversies concerning Notch2’s role in pathological conditions, particularly in autoimmune diseases, characterized by sustained and chronic inflammation.
Conversely, the role of ADAM17 has been extensively evaluated in several autoimmune diseases, and this molecule has been shown to be located at the crossroads of various molecular pathways involved in the transcription and translation of pro-inflammatory factors. The role of ADAM17 has also been extensively evaluated in the chronic inflammatory disease SjD, the subject of the experimental project presented in this work. In SjD, ADAM17 activation has been correlated with the overexpression of inflammatory molecules responsible for sustained chronic inflammation, and implied in the generation of fibrotic tissue in the SGs [28].
Inflammation is, in fact, associated with a wide range of diseases, including asthma, arthritis, cancer, obesity, heart disease, colitis, neurological disorders, and autoimmune diseases. Detection of involved factors and analysis of their receptors, as well as investigation of the pathways activated, are critical for understanding, and subsequently, individualizing a treatment for many inflammatory diseases. In SjD, ADAM17 is able to activate the Amphiregulin/Epidermal growth factor receptor (EGFR) pathway and the VEGF-A/VEGFR2/NF-κB axis whose dysfunction may be contributory to the pathogenesis and exacerbation of SjD [29].
An in-depth analysis of the role of ADAM17 in SjD has not yet been matched, to date, by an equally comprehensive analysis of the expression of Notch2 in SjD, nor has there been investigated a possible correlation between the cellular expression of Notch2 and ADAM17 or a possible correlation between the expression of these two closely interconnected factors and the degree of inflammation observed in SGs of SjD patients.
In SjD recent research has demonstrated an increase in Notch2 mRNA expression in B cells located in the marginal zone of the SGs; Notch mRNA was also detected in the germinal centres of tonsil biopsies from patients with pSjD [30]. Elevated Notch2 and PR domain zinc finger protein 1 mRNA levels and increased B-lymphocyte maturation-induced maturation protein 1 (BLIMP-1) mRNA expression were demonstrated within clusters of transient type II B cells present in the SGs from pSjD patients [31]. Furthermore, molecular investigations performed at a clinical level have demonstrated a clear correlation between the risk of developing MALT, the main type of SGs lymphoma found in SjD patients, and mutations in the Notch2 gene [32]. This seems to support a correlation between lymphoma susceptibility and Notch activation in pSjD [33]. In addition, given the recent discovery of a lively cross-talk between Notch and Wnt signaling during organ regeneration [34], in recent years the possibility of a defective dialogue between Wnt and Notch at the basis of the onset and/or pathogenesis of SjD has been evaluated. But the most fascinating challenge is to find the key that could lead to the simultaneous activation of various inflammatory pathways, which has been demonstrated in pSjD, leading to the identification of a dysregulation of NF-κB responsible for an anomalous activation of Notch, correlated to the activation of the Hippo-mediated transduction cascade [35]. Also, a wrong communication mechanism between glandular epithelial cells and stromal cells was identified at the basis of the alteration of the structure of the SGs observed in SjD, which once again seems to be mediated by Notch activation. In fact, the expression of specific genes in stromal cells is regulated by molecules released by epithelial cells in SjD patients; notably, the release of molecules related to the Notch signaling pathway, such as Notch2/3, appears to depend on epithelial-derived MDK and SCGB3A1, which have the role of promoting transformation into fibroblasts and generating fibrosis [36].
Altered Notch signaling also appears to be involved in characteristic systemic manifestations in SjD, characterized by widespread pain probably triggered through the activation of TLR signaling [31]. Through the activation of TLR, Notch signaling determines the activation and proliferation of macrophages and dendritic cells, and the production of inflammatory cytokines, such as TNF-α and IL-1β. inhibiting the signaling pathways that involve the activation of Notch with a specific inhibitor in these patients can prevent the onset of neuropathies, confirming the involvement of Notch in the perception of pain associated with SjD [37].
Furthermore, Notch2 altered expression could be an early disease marker because increased Notch2 signaling is observed during the early, asymptomatic stages of SjD, particularly in SGs [37], and Notch2 could be involved in the inflammatory response since Notch2 signaling contributes to a sustained type 1 interferon (IFN) production, a key feature of inflammation in SjD [38].
Now, on the basis of these premises, in designing the experimental phase of this work, we asked ourselves the following question: if ADAM17 has multiple roles in the pathogenesis of SjD and Notch2 is widely considered a key player in various inflammatory mechanisms in SjD, and, in addition, ADAM17 is known to activate Notch signaling, could there be a correlated expression of these two factors in SGs of pSjD patients, and could the regulation of their expression be related to the degree of inflammation in patients?
To demonstrate a possible correlated expression between Notch2 and ADAM17, and the grade of inflammatory conditions in pSjD, we used, in this work, the combination of mRNA analysis via ISH and protein analysis via IHC in the same section; this extremely powerful technique allows us to study, in a more in-depth manner, the expression of the Notch2 gene and protein in biopsies of SjD patients with different degrees of inflammation and to evaluate a probable correlation between an increase in the expression of Notch2 and ADAM17 in SjD, overcoming inevitable limitations deriving from the use of other methods.
This methodological approach allowed us to demonstrate a clear correlated overexpression of Notch2 and ADAM17 in SGs biopsy specimens derived from pSjD patients; the expression of both factors significantly increases accordingly with the inflammatory grade in acinar cells, ductal cells, lymphocytic infiltrates, and myoepithelial cells. We hope that this further piece added through our work to the elucidation of the pathways involving ADAM17 and Notch2 may be of help in translational studies for the identification of effective therapies for pSjD.
Author Contributions
all authors were involved in drafting the article or revising it critically for important intellectual content, and all authors approved the final version for publication. Conceived and designed the experiments: M. Sisto and S.Lisi. Performed the experiments: R.Tamma and M. De Giogis. Analyzed the data: M. Sisto, S.Lisi and R. Tamma. Contributed reagents/materials/analysis tools: G. Ingravallo, M.Della Mura, J. Sorino, E. Cascardi. Wrote the paper: M. Sisto and S.Lisi. Performed a critical reading of the manuscript: D. Ribatti. All authors have read and agreed to the published version of the manuscript.
Funding
this research received no external funding.
Institutional Review Board Statement
not applicable.
Informed Consent Statement
not applicable.
Conflicts of Interest
the authors declare no conflict of interest.
References
- Parambath, S.; Selvraj, N.R.; Venugopal, P.; Aradhya, R. Notch Signaling: An Emerging Paradigm in the Pathogenesis of Reproductive Disorders and Diverse Pathological Conditions. Int. J. Mol. Sci. 2024, 25, 5423. [Google Scholar] [CrossRef]
- Sachan, N.; Sharma, V.; Mutsuddi, M.; Mukherjee, A. Notch signalling: multifaceted role in development and disease. FEBS J. 2024, 291, 3030–3059. [Google Scholar] [CrossRef] [PubMed]
- Bray, S.J. Notch signalling: a simple pathway becomes complex. Nat. Rev. Mol. Cell Biol. 2006, 7, 678–689. [Google Scholar] [CrossRef] [PubMed]
- Condorelli, A.G.; El Hachem, M.; Zambruno, G.; Nystrom, A.; Candi, E.; Castiglia, D. Notching up knowledge on molecular mechanisms of skin fibrosis: focus on the multifaceted Notch signalling pathway. J. Biomed. Sci. 2021, 28, 36. [Google Scholar] [CrossRef] [PubMed]
- Tsao, P.N.; Matsuoka, C.; Wei, S.C.; Sato, A.; Sato, S.; Hasegawa, K.; Chen, H.K.; Ling, T.Y.; Mori, M.; Cardoso, W.V.; Morimoto, M. Epithelial Notch signaling regulates lung alveolar morphogenesis and airway epithelial integrity. Proc. Natl. Acad. Sci. U S A. 2016, 113, 8242–8247. [Google Scholar] [CrossRef]
- Bae, S.E.; Park, S.H.; Kim, C.Y.; Lee, C.R.; Lee, C.; Payumo, R.M.; Kim, S.Y.; Sim, K.Y.; Kim, H.J.; Seo, H.; Koh, S.J.; Hong, S.; Park, S.G. Notch2-expressing CD4+ T cells attain immunoregulatory functions during autoimmune inflammation. Cell Mol. Immunol. 2025, 22, 1077–1092. [Google Scholar] [CrossRef]
- Fan, H.M.; Qiao, Y.L.; Liu, Y.; Xu, S.; Ni, H.F.; Jiao, W.E.; Tao, Z.Z.; Chen, S.M. Long-term consequences of regulatory T-cell-specific knockout of Notch2 in immune homeostasis. Int. Immunopharmacol. 2023, 124, 111069. [Google Scholar] [CrossRef]
- Quillard, T.; Devallière, J.; Coupel, S.; Charreau, B. Interestingly, Inflammation dysregulates Notch signaling in endothelial cells (implication of Notch2 and Notch4 to endothelial dysfunction. Biochem. Pharmacol. 2010, 80, 2032–2041. [Google Scholar] [CrossRef]
- Liu, F.; Wang, S. Molecular cues for development and regeneration of salivary glands. Histol. Histopathol. 2014, 29, 305–312. [Google Scholar]
- Siebel, C.; Lendahl, U. Notch Signaling in Development, Tissue Homeostasis, and Disease. Physiol Rev. 2017 97, 1235–1294. [CrossRef]
- Nakazawa, M.; Ishii, H.; Nakamura, H.; Yoshino, S.I.; Fukamizu, A.; Nishioka, K.; Nakajima, T. NFkappaB2 (p52) promoter activation via Notch signaling pathway in rheumatoid synoviocytes. Int. J. Mol. Med. 2001, 7, 31–35. [Google Scholar] [CrossRef]
- Ando, K.; Kanazawa, S.; Tetsuka, T.; Ohta, S.; Jiang, X.; Tada, T.; Kobayashi, M.; Matsui, N.; Okamoto, T. Induction of Notch signaling by tumor necrosis factor in rheumatoid synovial fibroblasts. Oncogene. 2003, 2003 22, 7796–7803. [Google Scholar] [CrossRef]
- Jiao, Z.; Wang, W.; Guo, M.; Zhang, T.; Chen, L.; Wang, Y.; You, H.; Li, J. Expression analysis of Notch-related molecules in peripheral blood T helper cells of patients with rheumatoid arthritis. Scand. J. Rheumatol. 2010, 39, 26–32. [Google Scholar] [CrossRef]
- Yabe, Y.; Matsumoto, T.; Tsurumoto, T.; Shindo, H. Immunohistological localization of Notch receptors and their ligands Delta and Jagged in synovial tissues of rheumatoid arthritis. J. Orthop. Sci. 2005, 10, 589–594. [Google Scholar] [CrossRef]
- Ishii, H.; Nakazawa, M.; Yoshino, S.; Nakamura, H.; Nishioka, K.; Nakajima, T. Expression of notch homologues in the synovium of rheumatoid arthritis and osteoarthritis patients. Rheumatol. Int. 2001, 21, 10–4. [Google Scholar] [CrossRef] [PubMed]
- Nakazawa, M.; Ishii, H.; Aono, H.; Takai, M.; Honda, T.; Aratani, S.; Fukamizu, A.; Nakamura, H.; Yoshino, S.; Kobata, T.; Nishioka, K.; Nakajima, T. Role of Notch-1 intracellular domain in activation of rheumatoid synoviocytes. Arthritis Rheum. 2001, 44, 1545–1554. [Google Scholar] [CrossRef] [PubMed]
- Park, J.S.; Kim, S.H.; Kim, K.; Jin, C.H.; Choi, K.Y.; Jang, J.; Choi, Y.; Gwon, A.R.; Baik, S.H.; Yun, U.J.; Chae, S.Y.; Lee, S.; Kang, Y.M.; Lee, K.C.; Arumugam, T.V.; Mattson, M.P.; Park, J.H.; Jo, D.G. Inhibition of notch signalling ameliorates experimental inflammatory arthritis. Ann. Rheum. Dis. 2015, 74, 267–274. [Google Scholar] [CrossRef] [PubMed]
- Murea, M.; Park, J.K.; Sharma, S.; Kato, H.; Gruenwald, A.; Niranjan, T.; Si, H.; Thomas, D.B.; Pullman, J.M.; Melamed, M.L.; Susztak, K. Expression of Notch pathway proteins correlates with albuminuria, glomerulosclerosis, and renal function. Kidney Int. 2010, 78, 514–522. [Google Scholar] [CrossRef]
- Zhang, W.; Xu, W.; Xiong, S. Blockade of Notch1 signaling alleviates murine lupus via blunting macrophage activation and M2b polarization. J. Immunol. 2010, 184, 6465–6478. [Google Scholar] [CrossRef]
- Dees, C.; Tomcik, M.; Zerr, P.; Akhmetshina, A.; Horn, A.; Palumbo, K.; Beyer, C.; Zwerina, J.; Distler, O.; Schett, G.; Distler, J.H. Notch signalling regulates fibroblast activation and collagen release in systemic sclerosis. Ann. Rheum. Dis. 2011, 70, 1304–1310. [Google Scholar] [CrossRef]
- Horai, Y.; Kurushima, S.; Shimizu, T.; Nakamura, H.; Kawakami, A. A Review of the Current Clinical Aspects of Sjögren’s Disease: Geographical Difference, Classification/Diagnostic Criteria, Recent Advancements in Diagnostic Methods, and Molecular Targeted Therapy. J. Clin. Med. 2025, 14, 5577. [Google Scholar] [CrossRef]
- Wang, F.; Flanagan, J.; Su, N.; Wang, L.C.; Bui, S.; Nielson, A.; Wu, X.; Vo, H.T.; Ma, X.J.; Luo, Y. RNAscope: a novel in situ RNA analysis platform for formalin-fixed, paraffin-embedded tissues. J. Mol. Diagn. 2012, 14, 22–29. [Google Scholar] [CrossRef]
- Sens, D. A.; Hintz, D. S.; Rudisill, M. T.; Sens, M. A.; Spicer, S.S. Explant culture of human submandibular gland epithelial cells: evidence for ductal origin. Lab. Invest. 1985, 2, 559–567. [Google Scholar]
- Shiboski, C. H.; Shiboski, S. C.; Seror, R.; Criswell, L.A.; Labetoulle, M.; Lietman, T.M.; Rasmussen, A.; Scofield, H.; Vitali, C.; Bowman, S.J.; Mariette, X. 2016 American College of Rheumatology/European League Against Rheumatism classification criteria for primary Sjögren’s syndrome: a consensus and data-driven methodology involving three international patient cohorts. Arthritis Rheumatol. 2017, 69, 35–45. [Google Scholar] [CrossRef] [PubMed]
- Kovall, R.A.; Blacklow, S.C. Mechanistic insights into Notch receptor signaling from structural and biochemical studies. Curr. Top. Dev. Biol. 2010, 92, 31–71. [Google Scholar]
- Zhou, B.; Lin, W.; Long, Y.; Yang, Y.; Zhang, H.; Wu, K.; Chu, Q. Notch signaling pathway: architecture, disease, and therapeutics. Sig Transduct Target Ther 2022, 7, 95. [Google Scholar] [CrossRef] [PubMed]
- Yakovleva, S.; Knyazeva, A.; Yunusova, A.; Allayarova, E.; Lanshakov, D.; Malashicheva, A.; Shnaider, T. Functional Divergence of NOTCH1 and NOTCH2 in Human Cerebral Organoids Reveals Receptor-Specific Roles in Early Corticogenesis. Int. J. Mol. Sci. 2025, 26, 7309. [Google Scholar] [CrossRef]
- Lisi, S.; D’Amore, M.; Sisto, M. ADAM17 at the interface between inflammation and autoimmunity. Immunol. Lett. 2014, 162, 159–156. [Google Scholar] [CrossRef]
- Sisto, M.; Lisi, S.; Lofrumento, D.D.; D‘Amore, M.; Frassanito, M.A.; Ribatti, D. Sjögren’s syndrome pathological neovascularization is regulated by VEGF-A-stimulated TACE-dependent crosstalk between VEGFR2 and NF-κB. Genes Immun, 2012, 13, 411–420. [Google Scholar] [CrossRef]
- Le Pottier, L.; Devauchelle, V.; Fautrel, A.; Daridon, C.; Saraux, A.; Youinou, P.; Pers, J.O. Ectopic germinal centers are rare in Sjogren’s syndrome salivary glands and do not exclude autoreactive B cells. J. Immunol. 2009, 182, 3540–3547. [Google Scholar] [CrossRef] [PubMed]
- Guerrier, T.; Le Pottier, L.; Devauchelle, V.; Pers, J.-O.; Jamin, C.; Youinou, P. Role of Toll-like receptors in primary Sjögren’s syndrome with a special emphasis on B-cell maturation within exocrine tissues. J. Autoimmun. 2012, 39, 69–76. [Google Scholar] [CrossRef]
- Rossi, D.; Trifonov, V.; Fangazio, M.; Bruscaggin, A.; Rasi, S.; Spina, V.; Monti, S.; Vaisitti, T.; Arruga, F.; Famà, R.; et al. The coding genome of splenic marginal zone lymphoma: Activation of NOTCH2 and other pathways regulating marginal zone development. J. Exp. Med. 2012, 209, 1537–1551. [Google Scholar] [CrossRef]
- Kuksin, C.A.; Minter, L.M. The Link between Autoimmunity and Lymphoma: Does NOTCH Signaling Play a Contributing Role? Front. Oncol. 2015, 5, 51. [Google Scholar] [CrossRef] [PubMed]
- Gao, J.; Fan, L.; Zhao, L.; Su, Y. The interaction of Notch and Wnt signaling pathways in vertebrate regeneration. Cell Regen. 2021, 10, 11. [Google Scholar] [CrossRef] [PubMed]
- Varelas, X.; Wrana, J.L. Coordinating developmental signaling: Novel roles for the Hippo pathway. Trends Cell Biol. 2012, 22, 88–96. [Google Scholar] [CrossRef] [PubMed]
- Huang, J.; Tang, J.; Zhang, C.; Liu, T.; Deng, Z.; Liu, L. Single-cell transcriptomic analysis uncovers heterogeneity in the labial gland microenvironment of primary Sjögren’s syndrome. J. Transl. Autoimmun. 2024, 9, 100248. [Google Scholar] [CrossRef]
- Vitali, C.; Dolcino, M.; Del Papa, N.; Minniti, A.; Pignataro, F.; Maglione, W.; Lunardi, C.; Puccetti, A. Gene expression profiles in primary Sjögren’s Syndrome with and without systemic manifestations. ACR Open Rheumatol. 2019, 1, 603–613. [Google Scholar] [CrossRef]
- Peck, A.B.; Nguyen, C.Q.; Ambrus, J.L., Jr. A MZB Cell Activation Profile Present in the Lacrimal Glands of Sjögren’s Syndrome-Susceptible C57BL/6.NOD-Aec1Aec2 Mice Defined by Global RNA Transcriptomic Analyses. Int. J. Mol. Sci. 2022, 23, 6106. [Google Scholar] [CrossRef]
Figure 1.
An overview of the Notch/ADAM17 signaling pathway. Representation of key events involved in activation of the Notch/ADAM17 pathway. Binding of ligands by a signal-sending cell leads the Notch receptor to a conformational change that undergoes the first proteolytic cleavage by ADAM17; subsequently, a second proteolytic cleavage by γ-secretase occurs that permits a nuclear translocation of the remaining NICD. This process leads to the association with the transcription factor CSL and transcriptional co-activator MAML to form a transcriptional activation complex. ADAM 17 (A Disintegrin And Metalloproteinase); CSL (suppressor of hairless); DLL4 (delta-like ligand 4); JAG (jagged); MAML (mastermind-like); NICD (Notch intracellular domain).
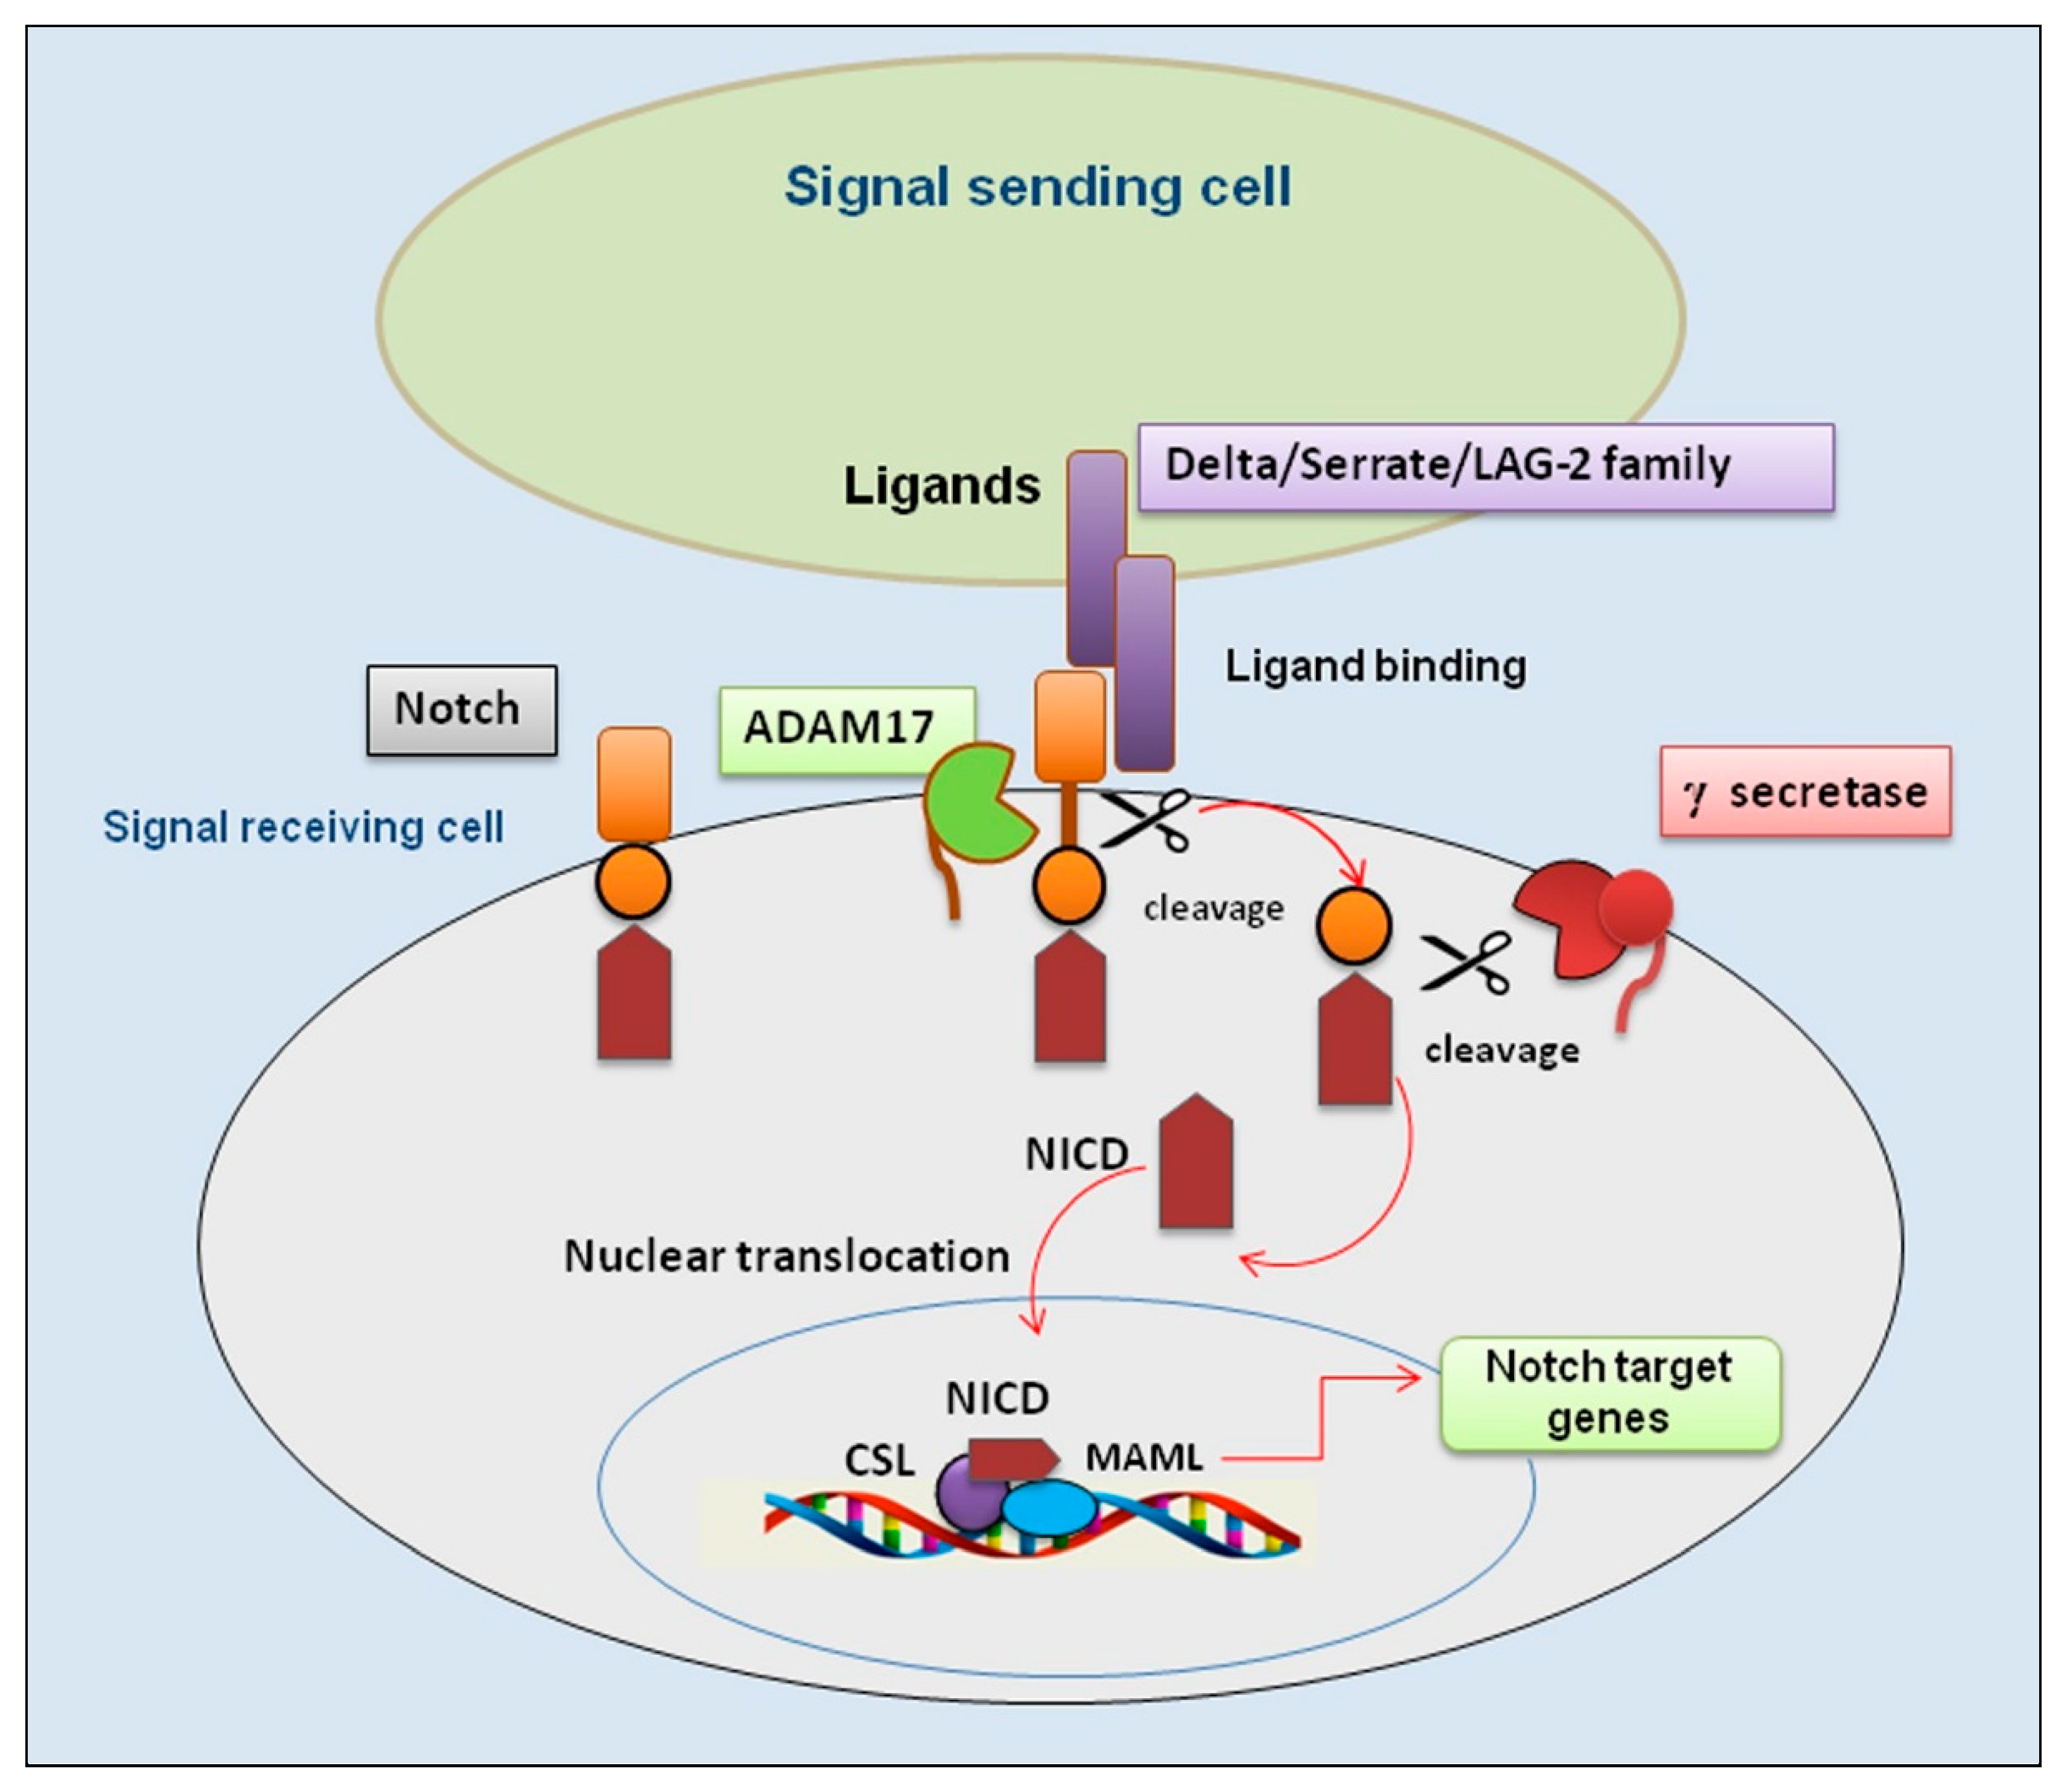
Figure 2.
Histopathological analysis of the minor salivary gland biopsies in patients with pSjD stained with hematoxylin and eosin. (A) Normal SGs tissue, (B-D) pSjD bioptic tissues with low (pSjD I), moderate (pSjD II) and severe (pSjD III) inflammatory grades. Red Arrow: focal lymphocytic sialadenitis (FLS) with perivascular or periductular aggregates of lymphocytes. Green arrows: dilated ducts of the minor SGs biopsy. Yellow arrows: interstitial fibrosis. pSjD (primary Sjögren’s disease) BAR: 20 μm.
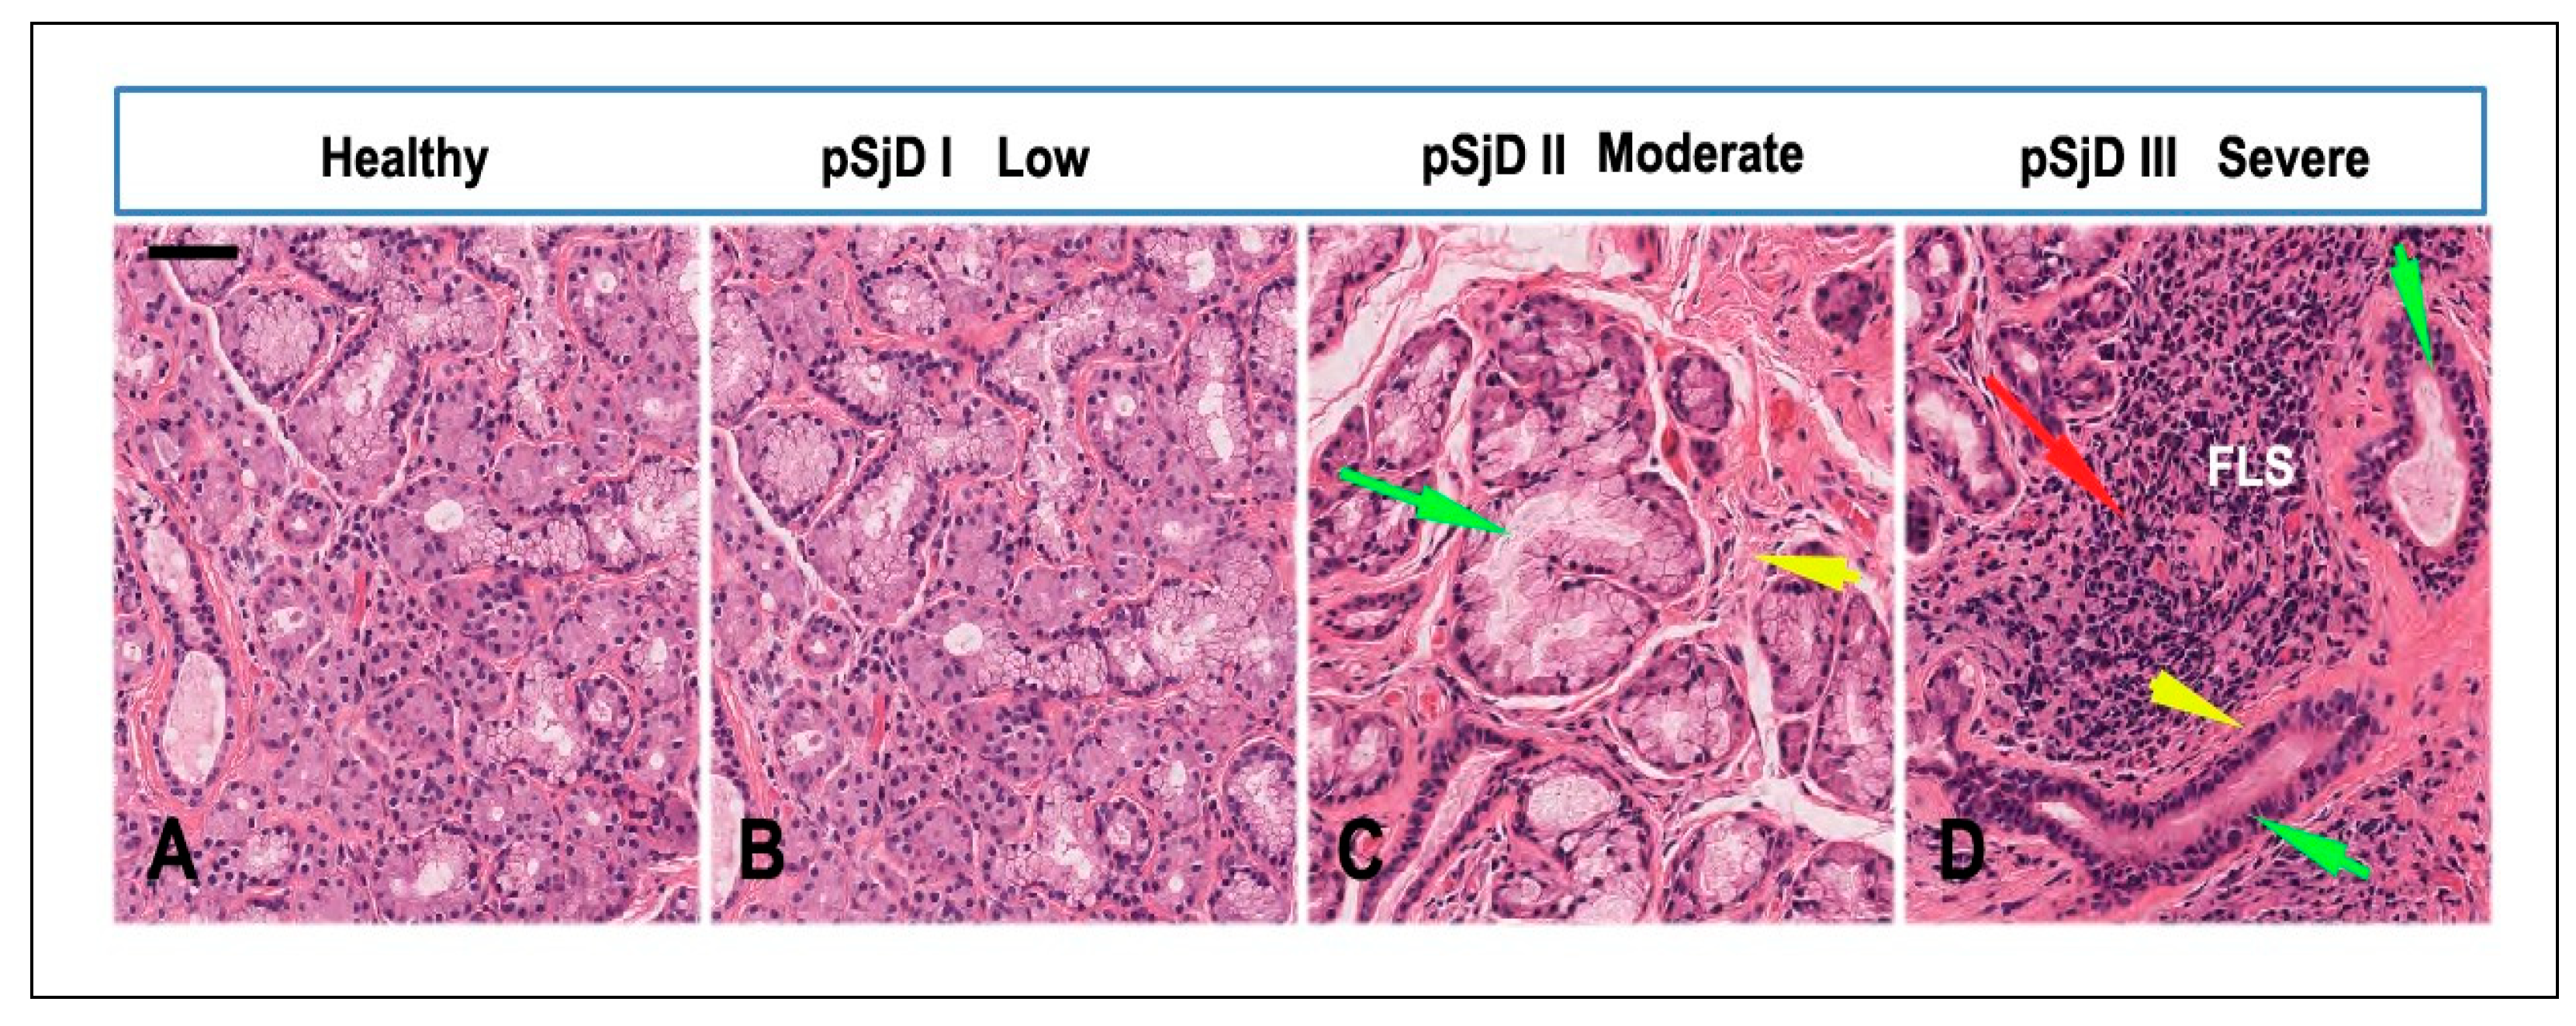
Figure 3.
RNAscope assay in situ hybridization technique was performed in order to evaluate Notch2 mRNA in pSjD SGs tissue sections of healthy control and patients with different inflammatory grades (pSjDI, pSjDII, pSjDIII) (A-D). It notes the presence of dotted positive red Notch2 mRNA signals in the epithelial cells of the acini and ducts, as well as in the interlobular infiltrative cells (B-D). Images E and F represent the magnification of acini (E) and ducts (F) of pSjD III tissues. In particular, it observes the presence of numerous clustered red dots signals in the acini, ducts and infiltrate cells in pSjD III. All images were scanned and analyzed with Aperio ImageScope instrument. Image G represents the quantitation of RNA ISH staining of Notch2 mRNA positivity in healthy and pSjD (I, II, III) expressed in terms of average of positive signal count per cell; the graph demonstrates a significant increase of Notch2 mRNA in the different inflammatory grades of pSjD (∗∗∗p < 0 01) (data represent mean ± SE of three independent experiments). BAR = 20 μm.
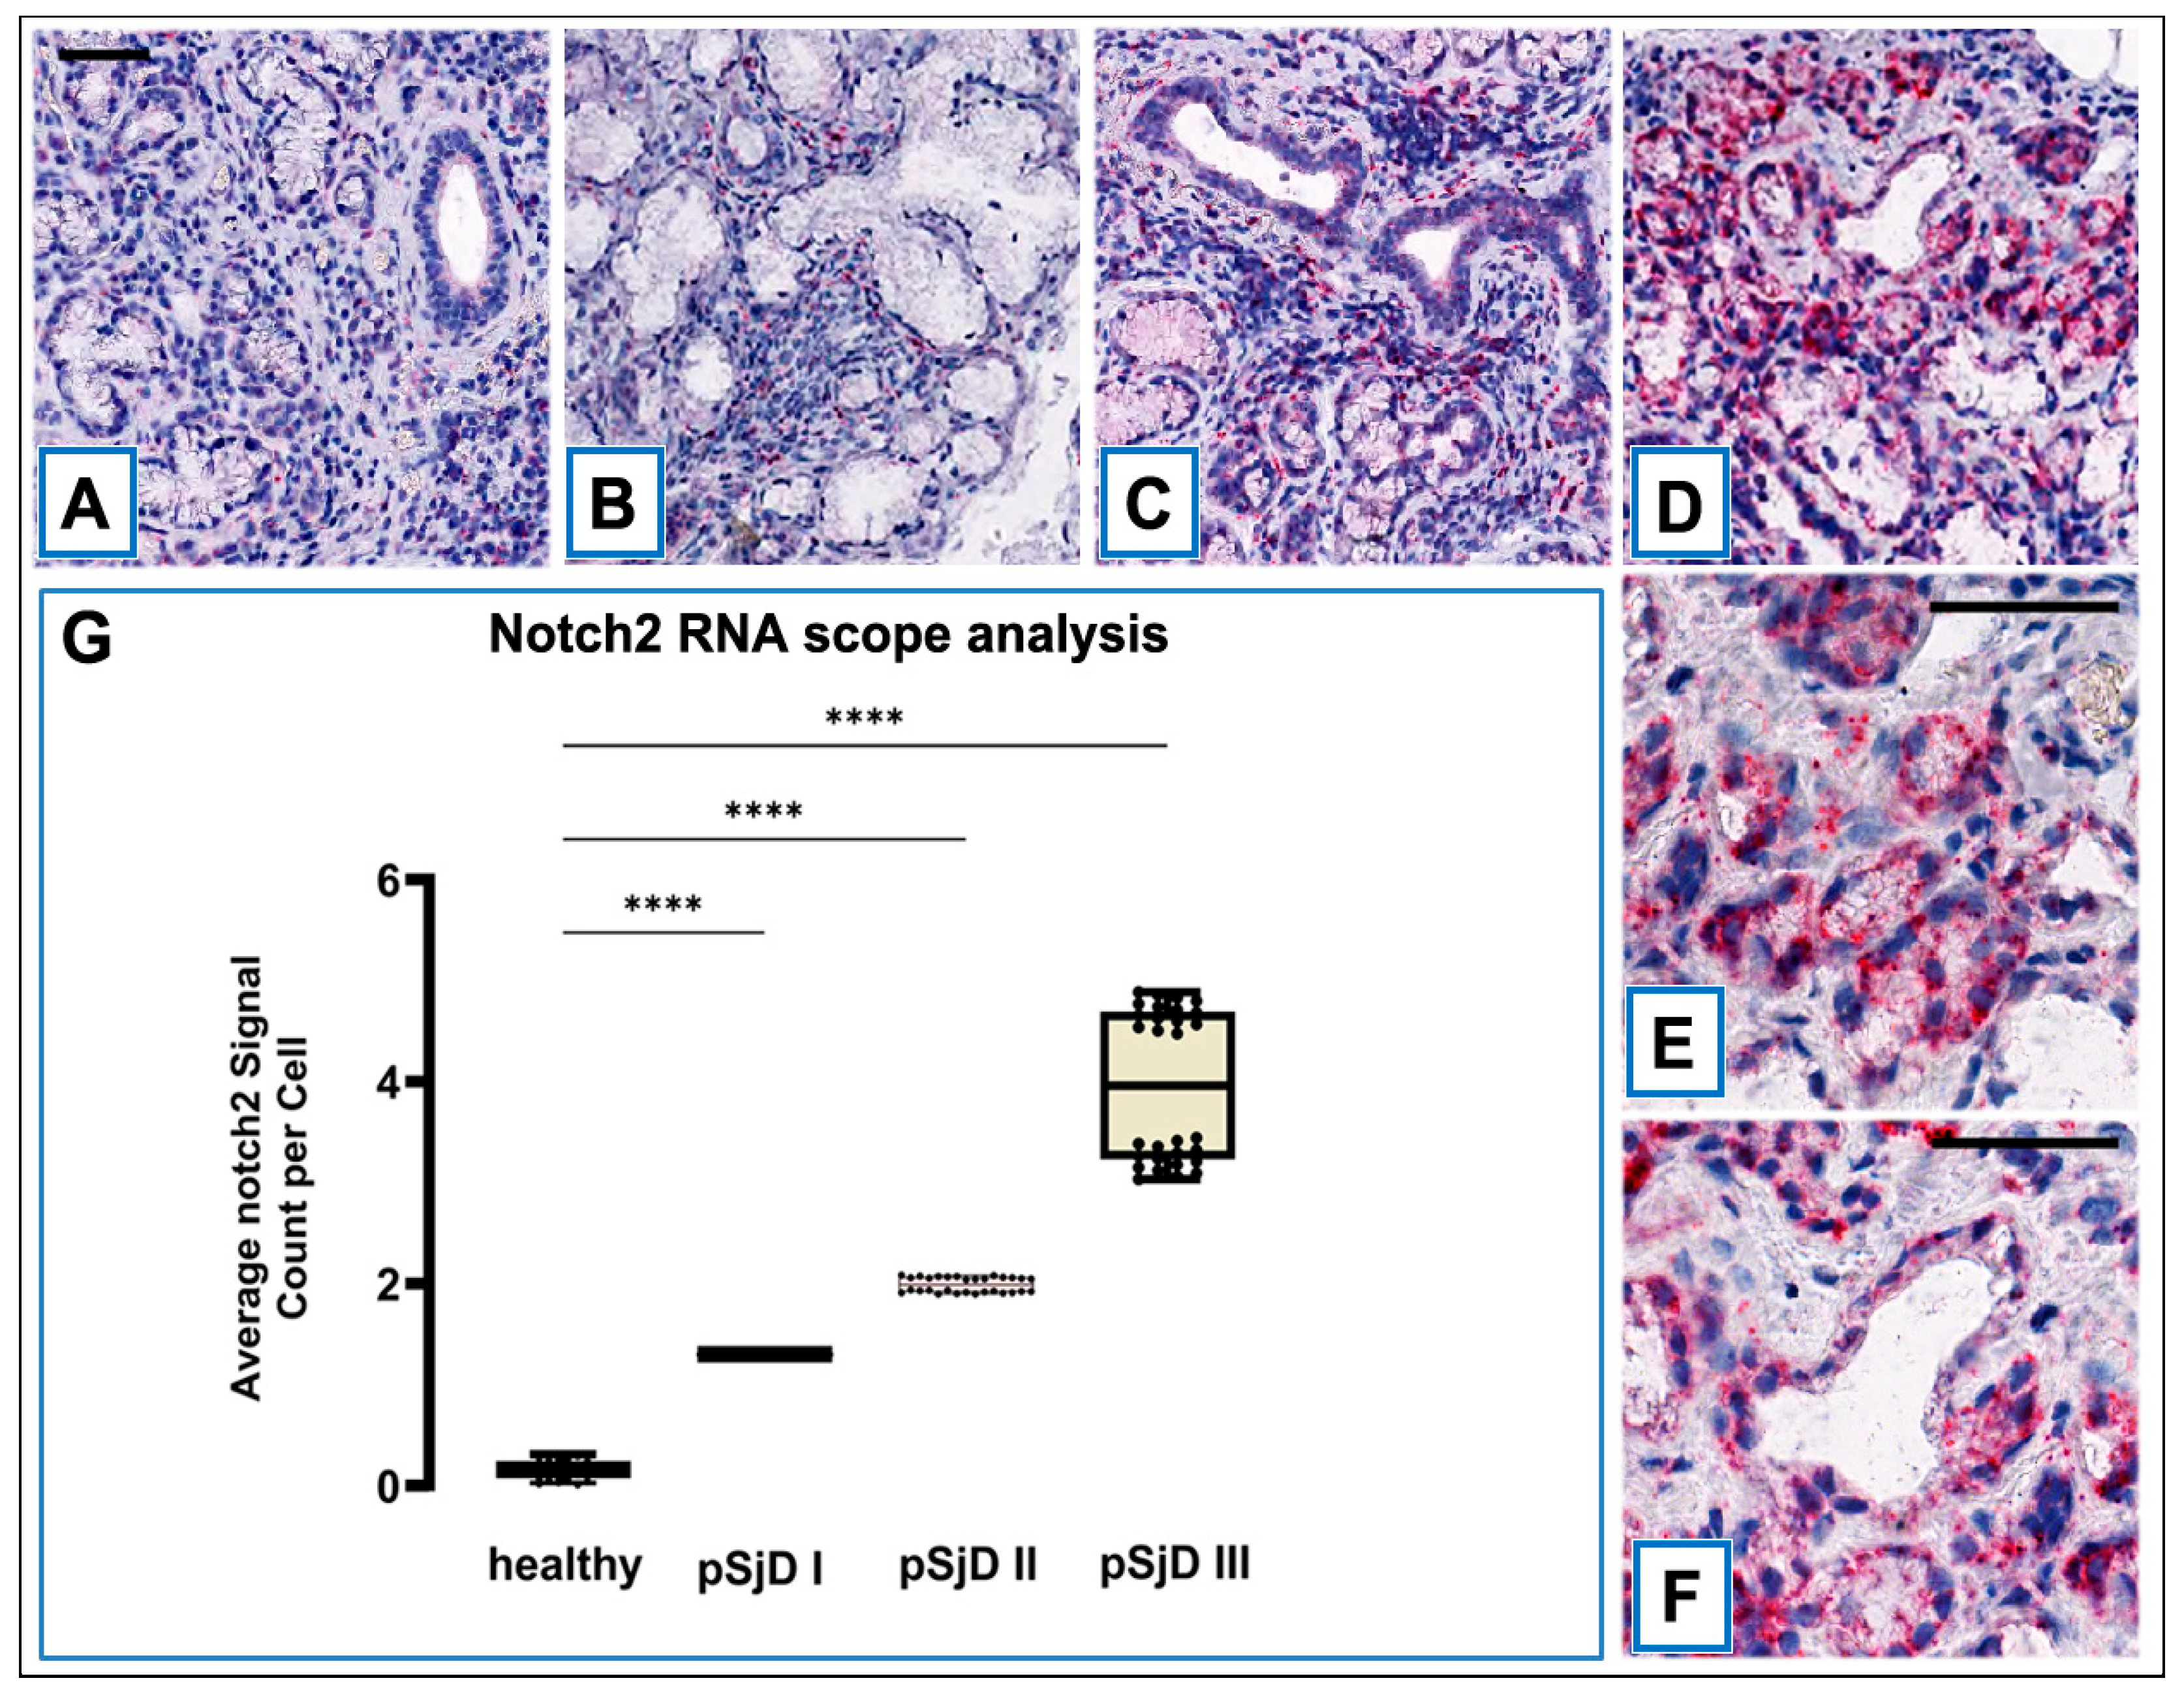
Figure 4.
Notch2 protein detection in pSjD SGs tissues. Notch2 protein was detected by immunohistochemical analysis in pSjD SGs tissue sections of healthy control (A) and patients with different inflammatory grades (pSjDI, pSjDII, pSjDIII) (B-E). MSGs from healthy and pSjD biopsies were stained with primary antibodies against Notch2 and with the HRP-conjugated secondary antibody. The slides were incubated with diamino benzidine tetrahydrochloride as a substrate and counterstained with hematoxylin stain in blue. Image E represents the magnification of acini and ducts of pSjD III tissues. All images were scanned and analyzed with Aperio ImageScope instrument. Image G represents the morphometric analysis of Notch2 protein in healthy and pSjD (I, II, III) biopsies expressed in terms of percent of signal positivity; the graph demonstrates a significant increase of Notch2 protein in variously inflammatory grades of pSjD (∗∗∗p < 0 01) (data represent mean ± SE of three independent experiments). Bar = 20 μm.
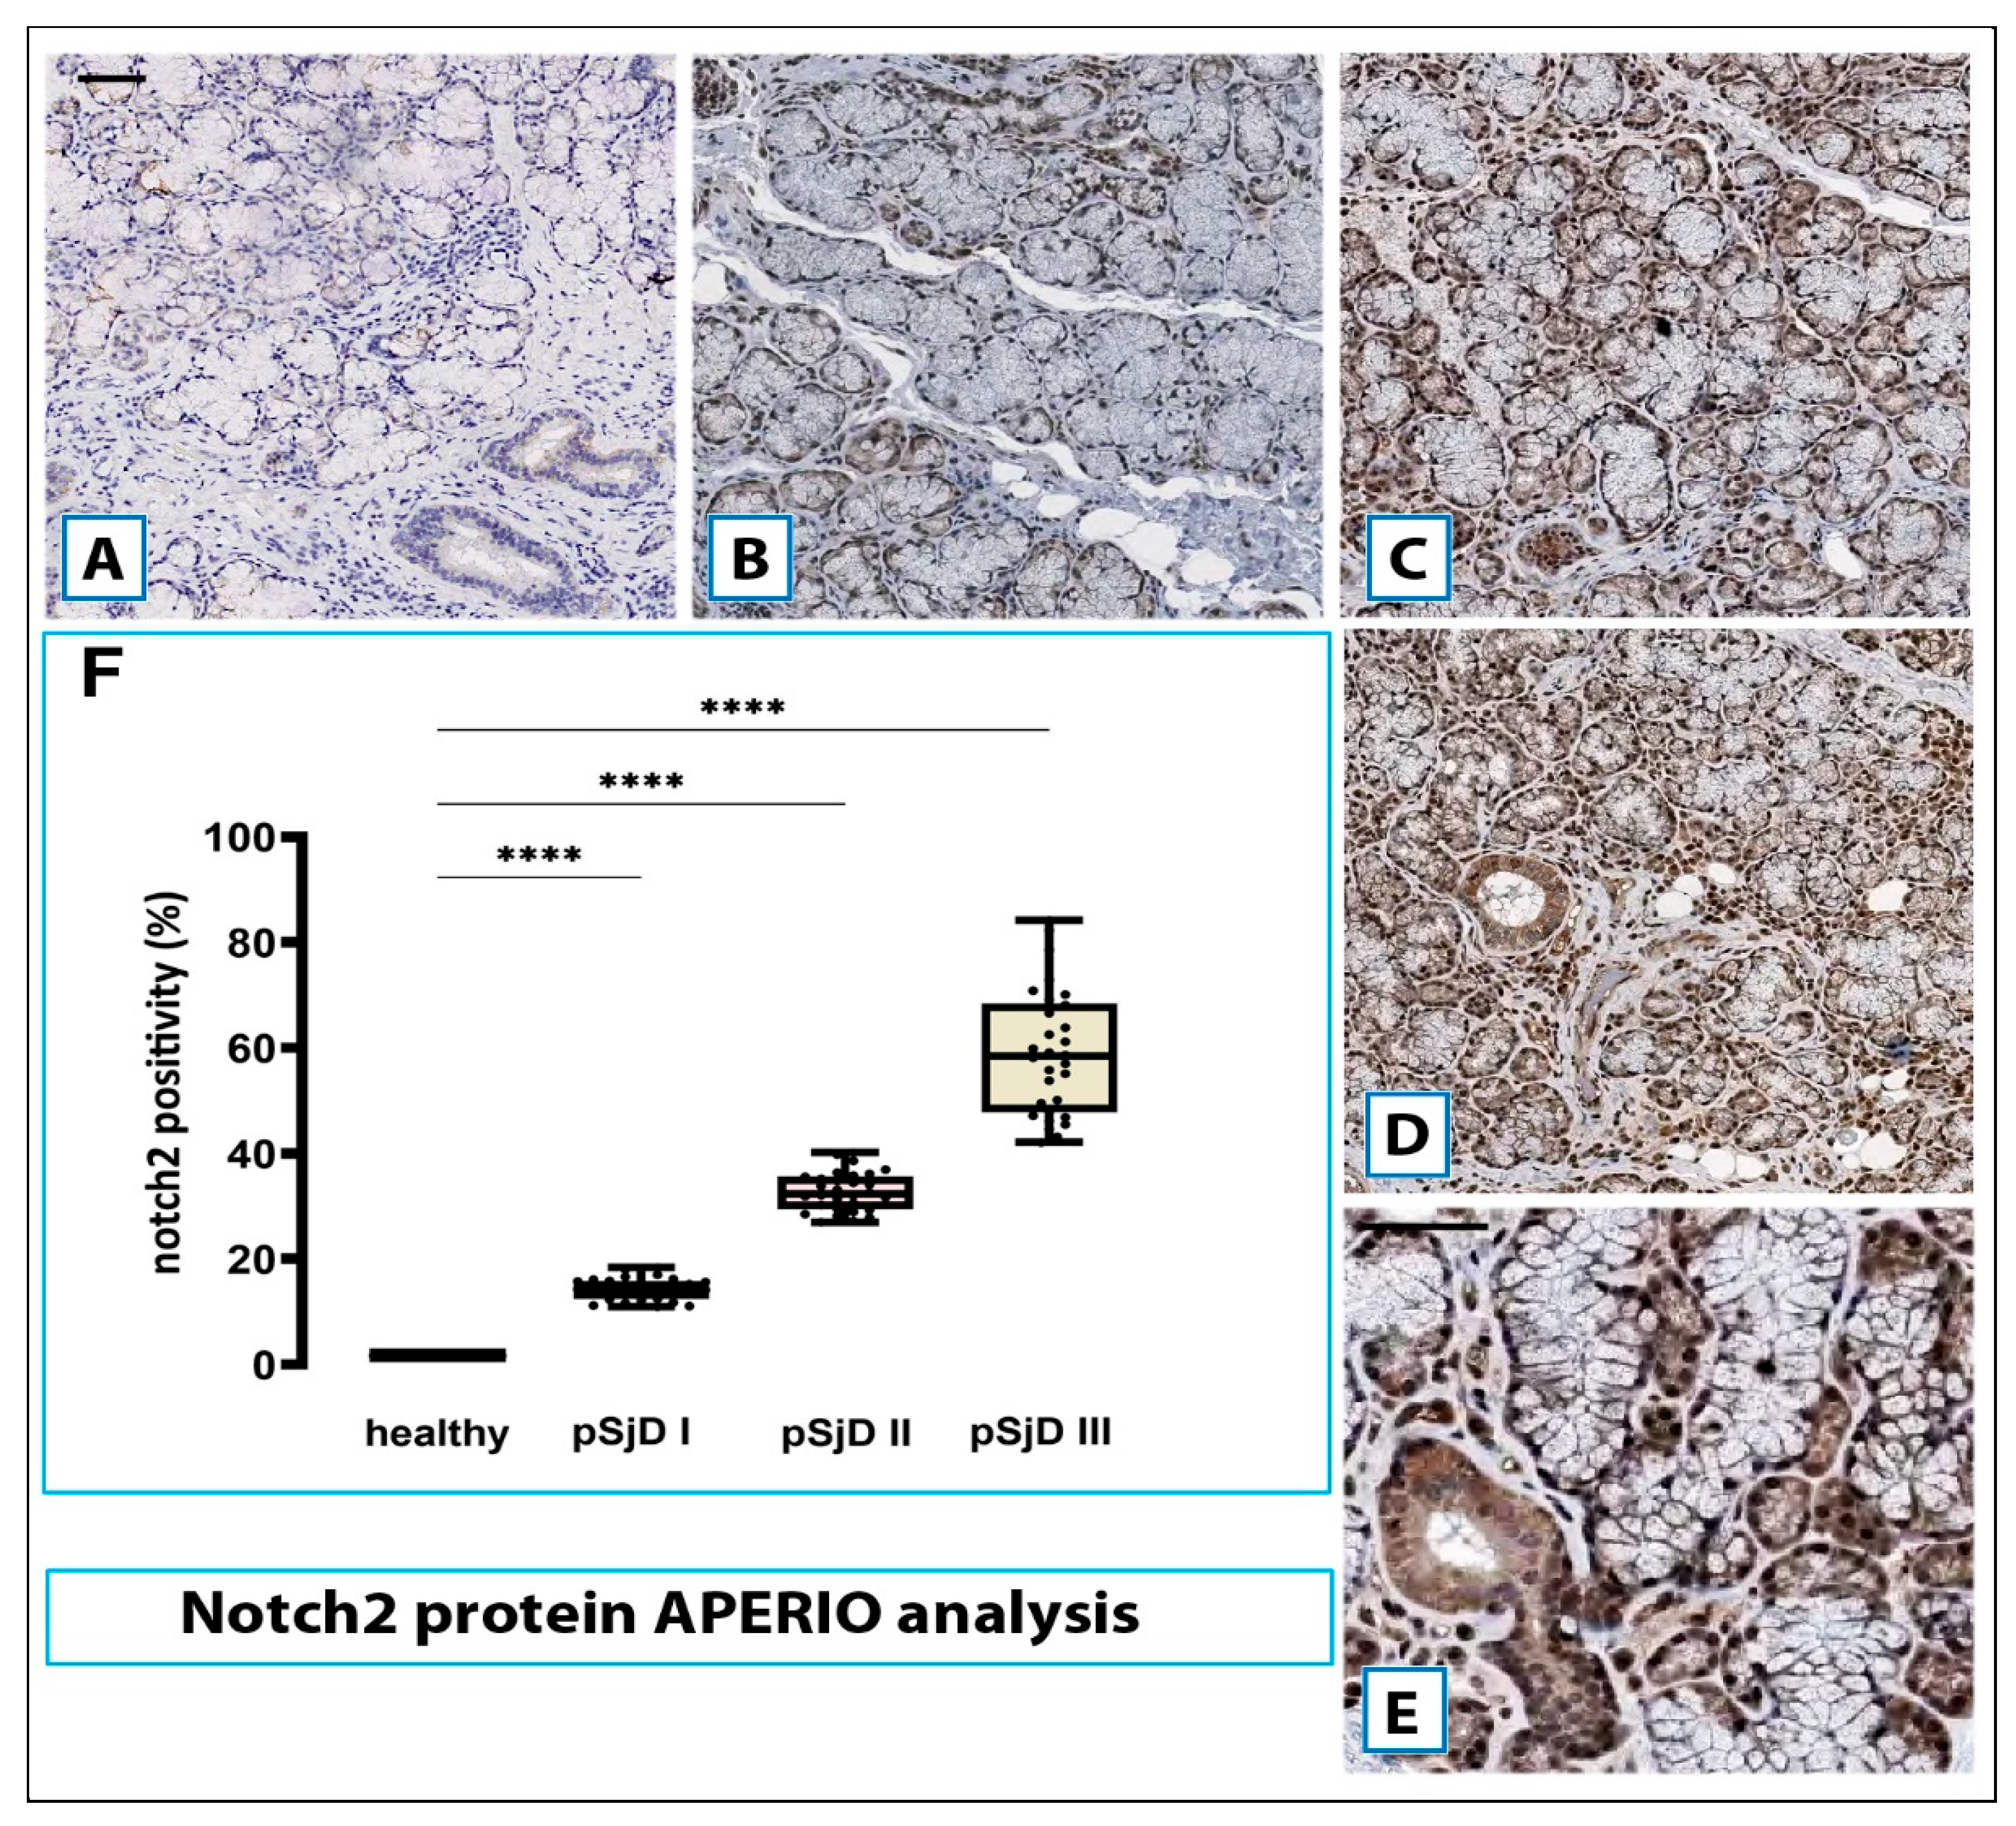
Figure 5.
Spearman correlation graph between Notch2 protein and Notch2 mRNA in different inflammatory grades of pSjD SGs tissue sections. Spearman test demonstrates a significant correlation between Notch2 protein expression and Notch2 mRNA.
Figure 5.
Spearman correlation graph between Notch2 protein and Notch2 mRNA in different inflammatory grades of pSjD SGs tissue sections. Spearman test demonstrates a significant correlation between Notch2 protein expression and Notch2 mRNA.
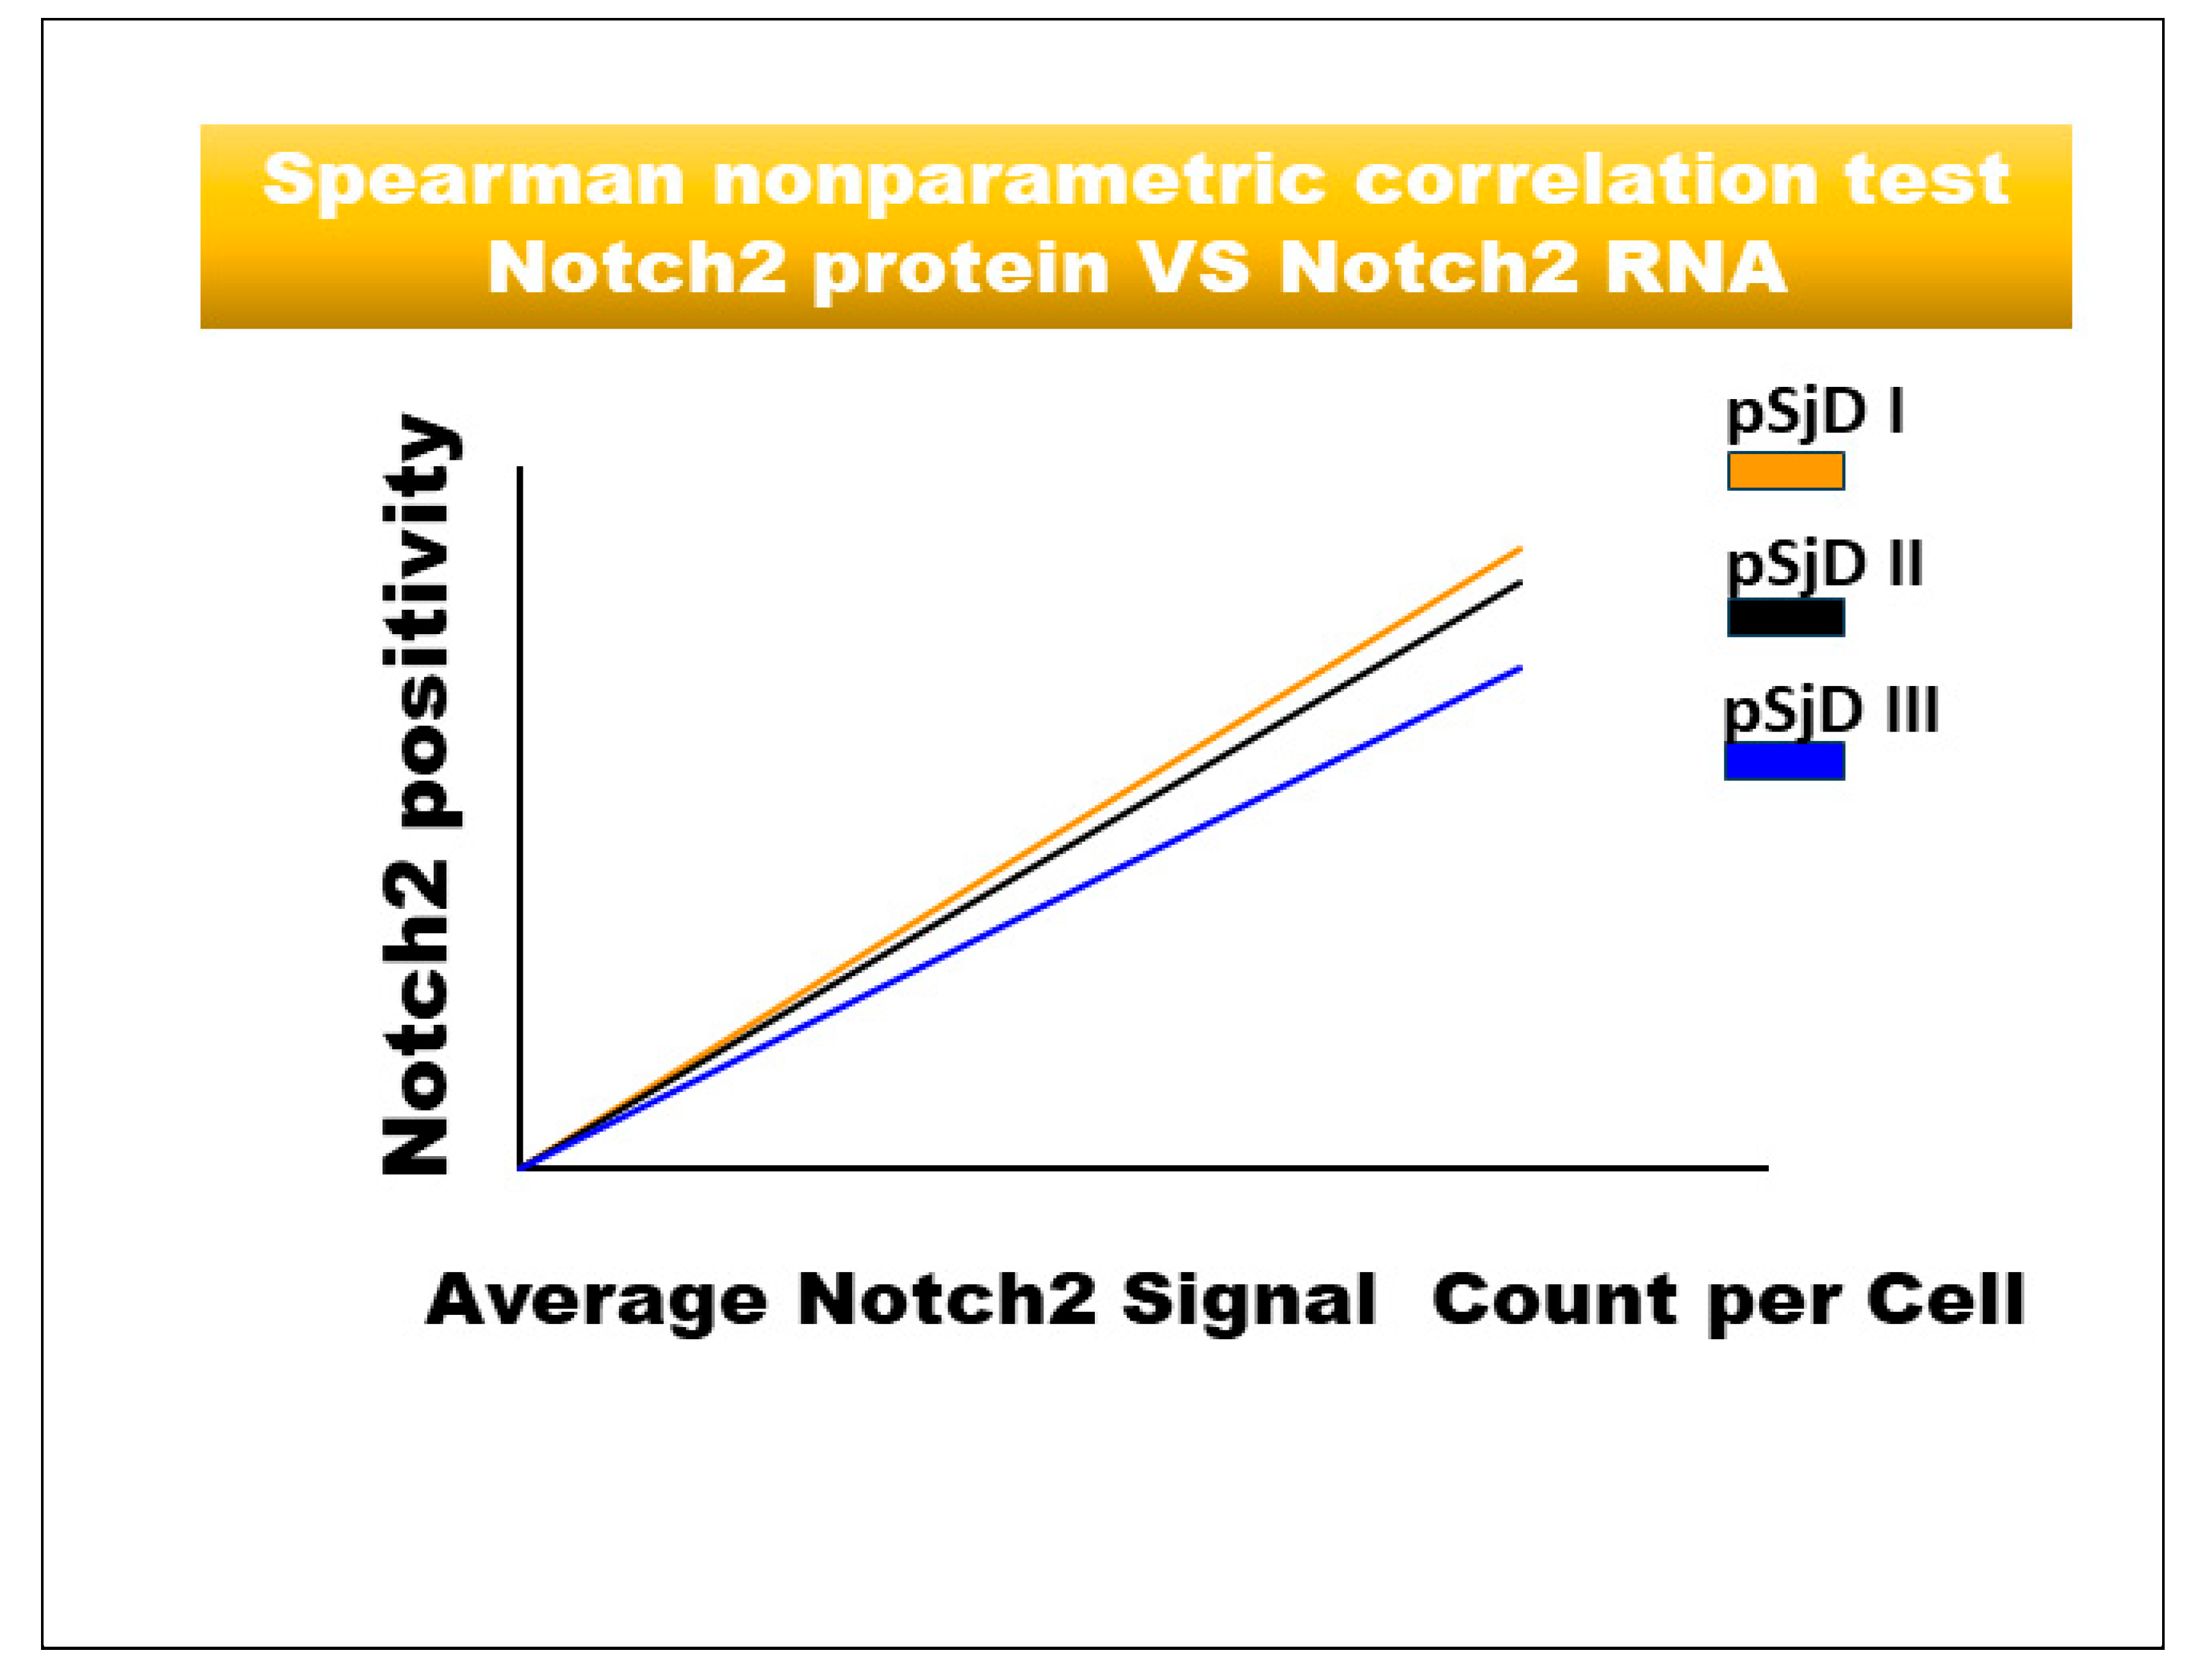
Figure 6.
Notch2 RNA scope and ADAM17 protein detection in pSjD SGs tissue sections of healthy control (A) and patients to different inflammatory grades (pSjDI, pSjDII, pSjDIII) (B-D). Images E and F represent the magnification of acini and ducts of pSjD III tissues. Notch2 mRNA was analyzed by in situ hybridization technique and ADAM17 protein was detected by immunohistochemical analysis in pSjD SGs tissue sections of healthy control (A) and patients to different inflammatory grades (pSjDI, pSjDII, pSjDIII) (B-E). Image E represents the magnification of acini and ducts of pSjD III tissues. Image G represents the graph of correlation between Notch2 mRNA and ADAM17 protein. Spearman non-parametric correlation test demonstrates a significant correlation between ADAM17 protein expression and Notch2 mRNA. All images were scanned and analyzed with Aperio ImageScope instrument. Bar = 20 μm.
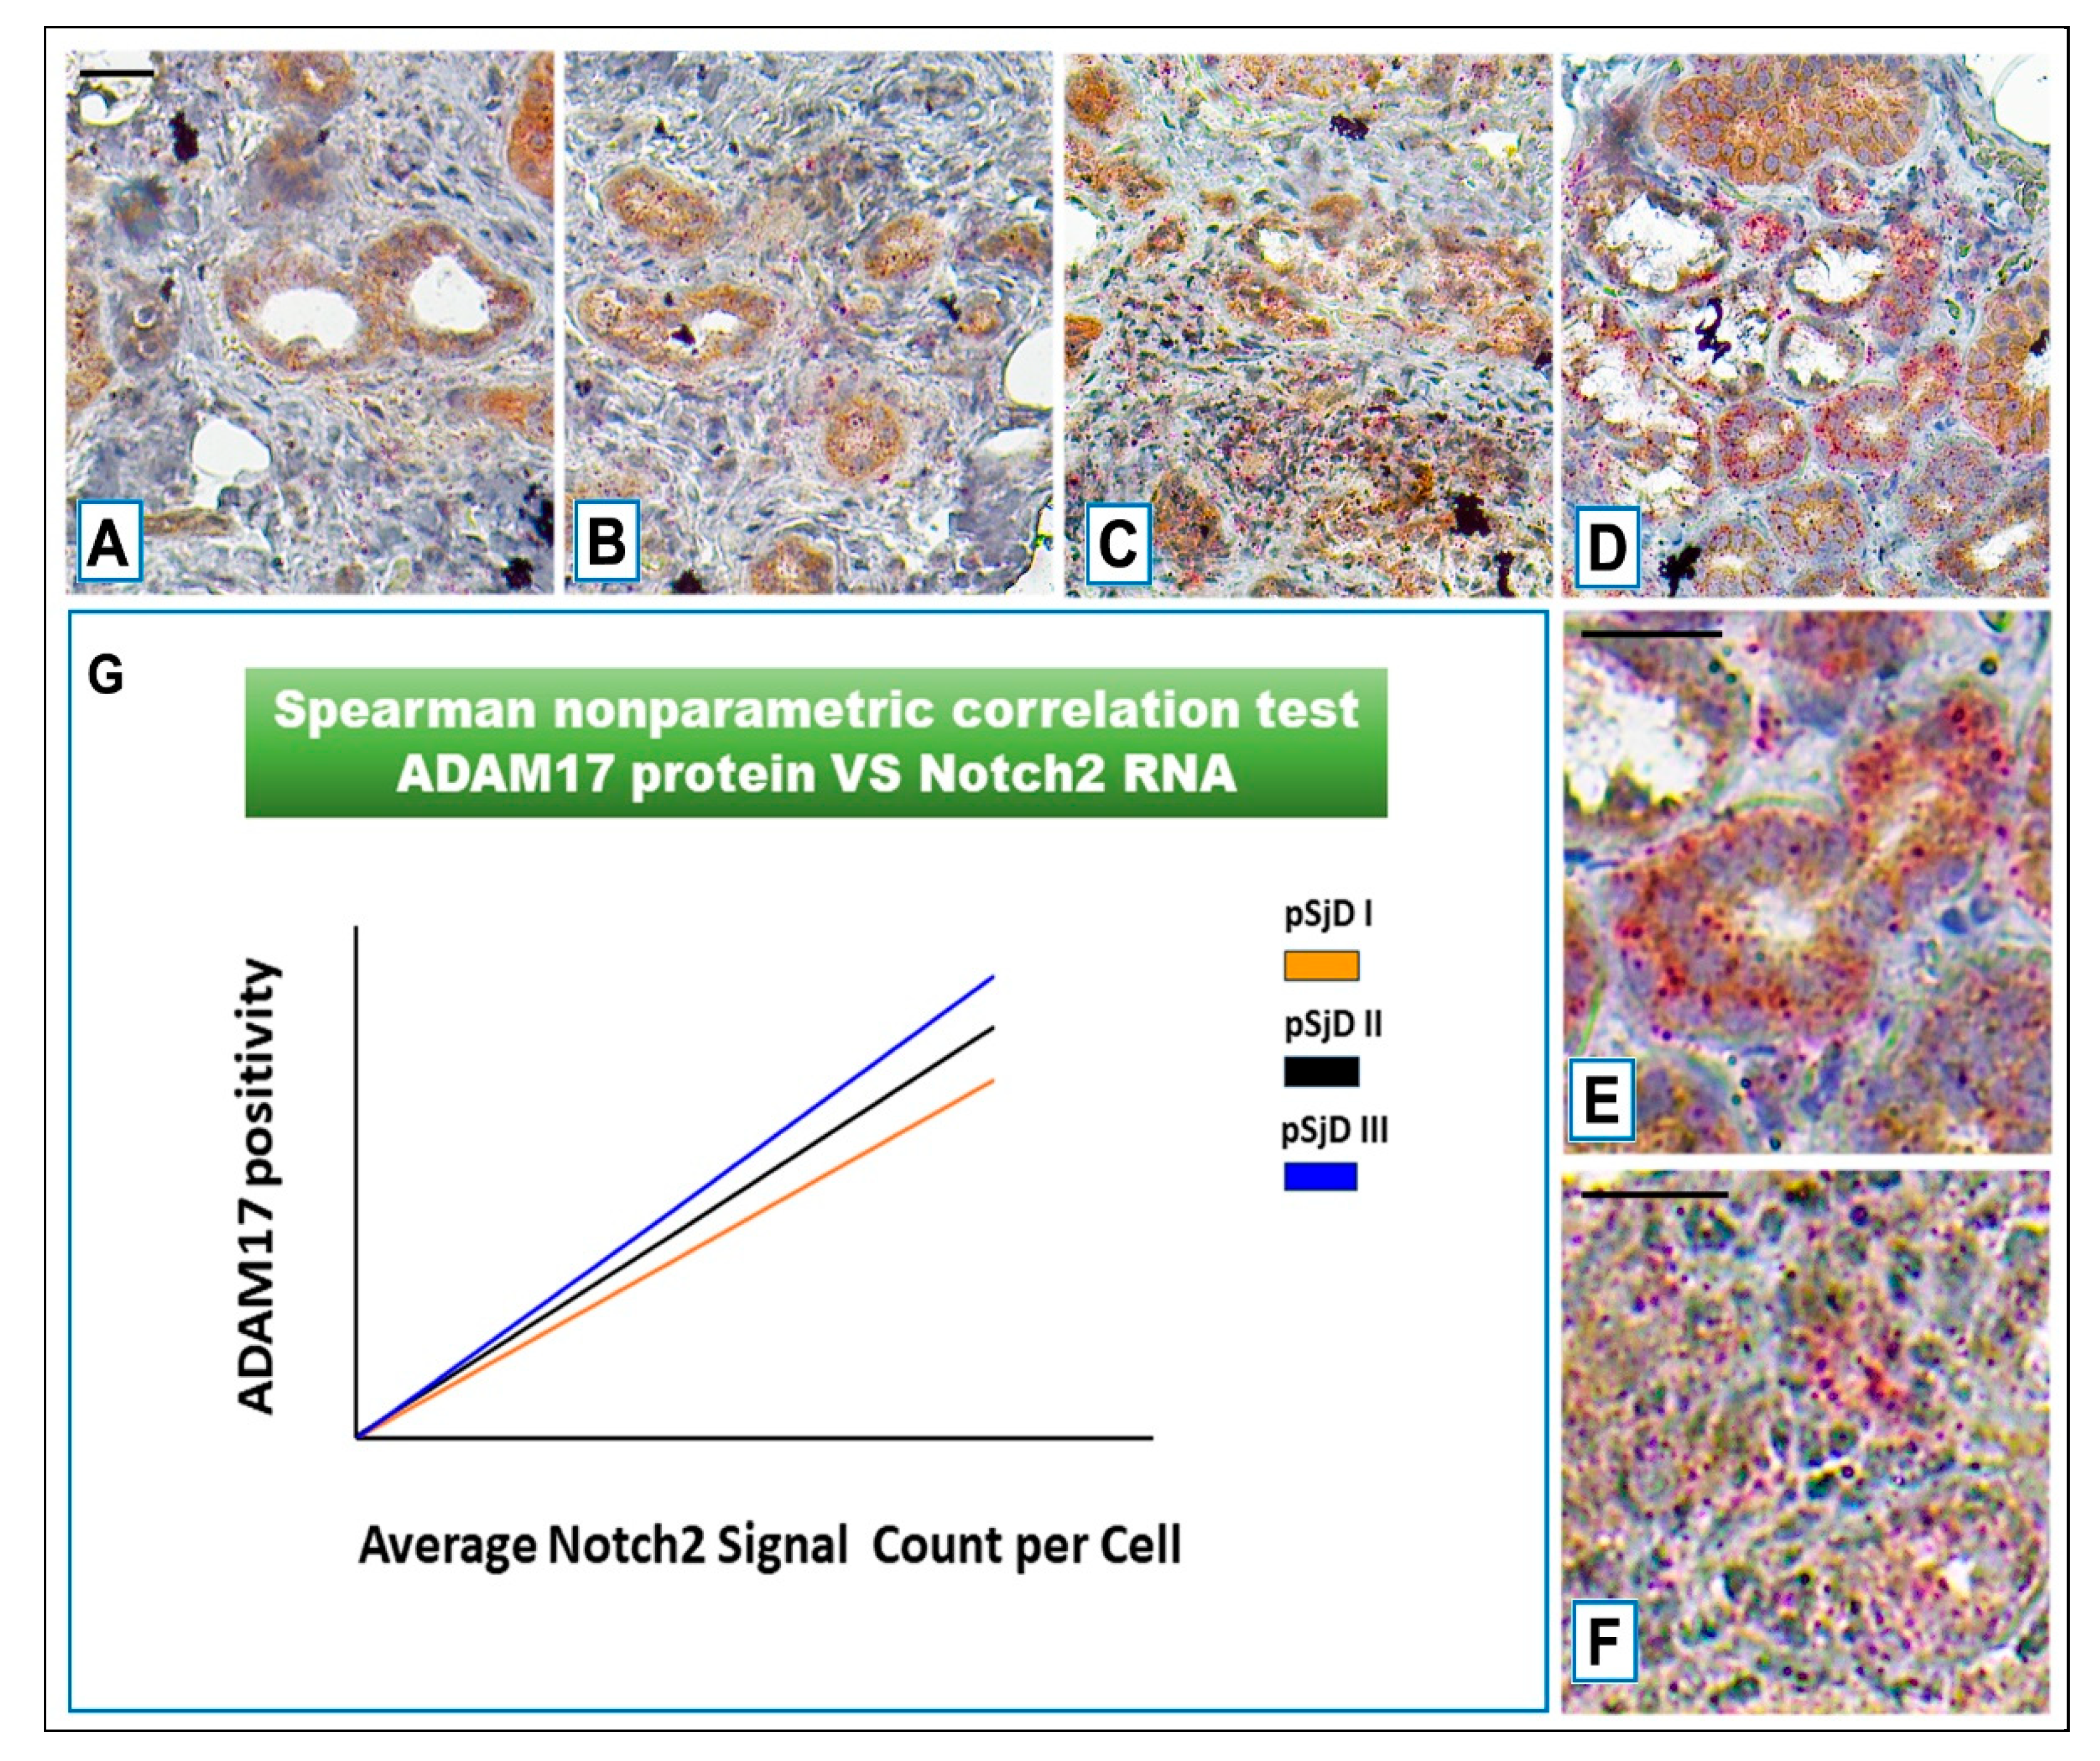
Figure 7.
IHC analysis of Notch2 protein and ADAM17 protein detection in pSjD SGs tissue sections with inflammatory grade III (A, B). Image C visualizes Spearman correlation graph between Notch2 protein and ADAM17 protein in different inflammatory grades of pSjD SGs tissue sections. Correlation test demonstrates a significant correlation between ADAM17 protein and Notch2 protein. Bar = 20 μm.
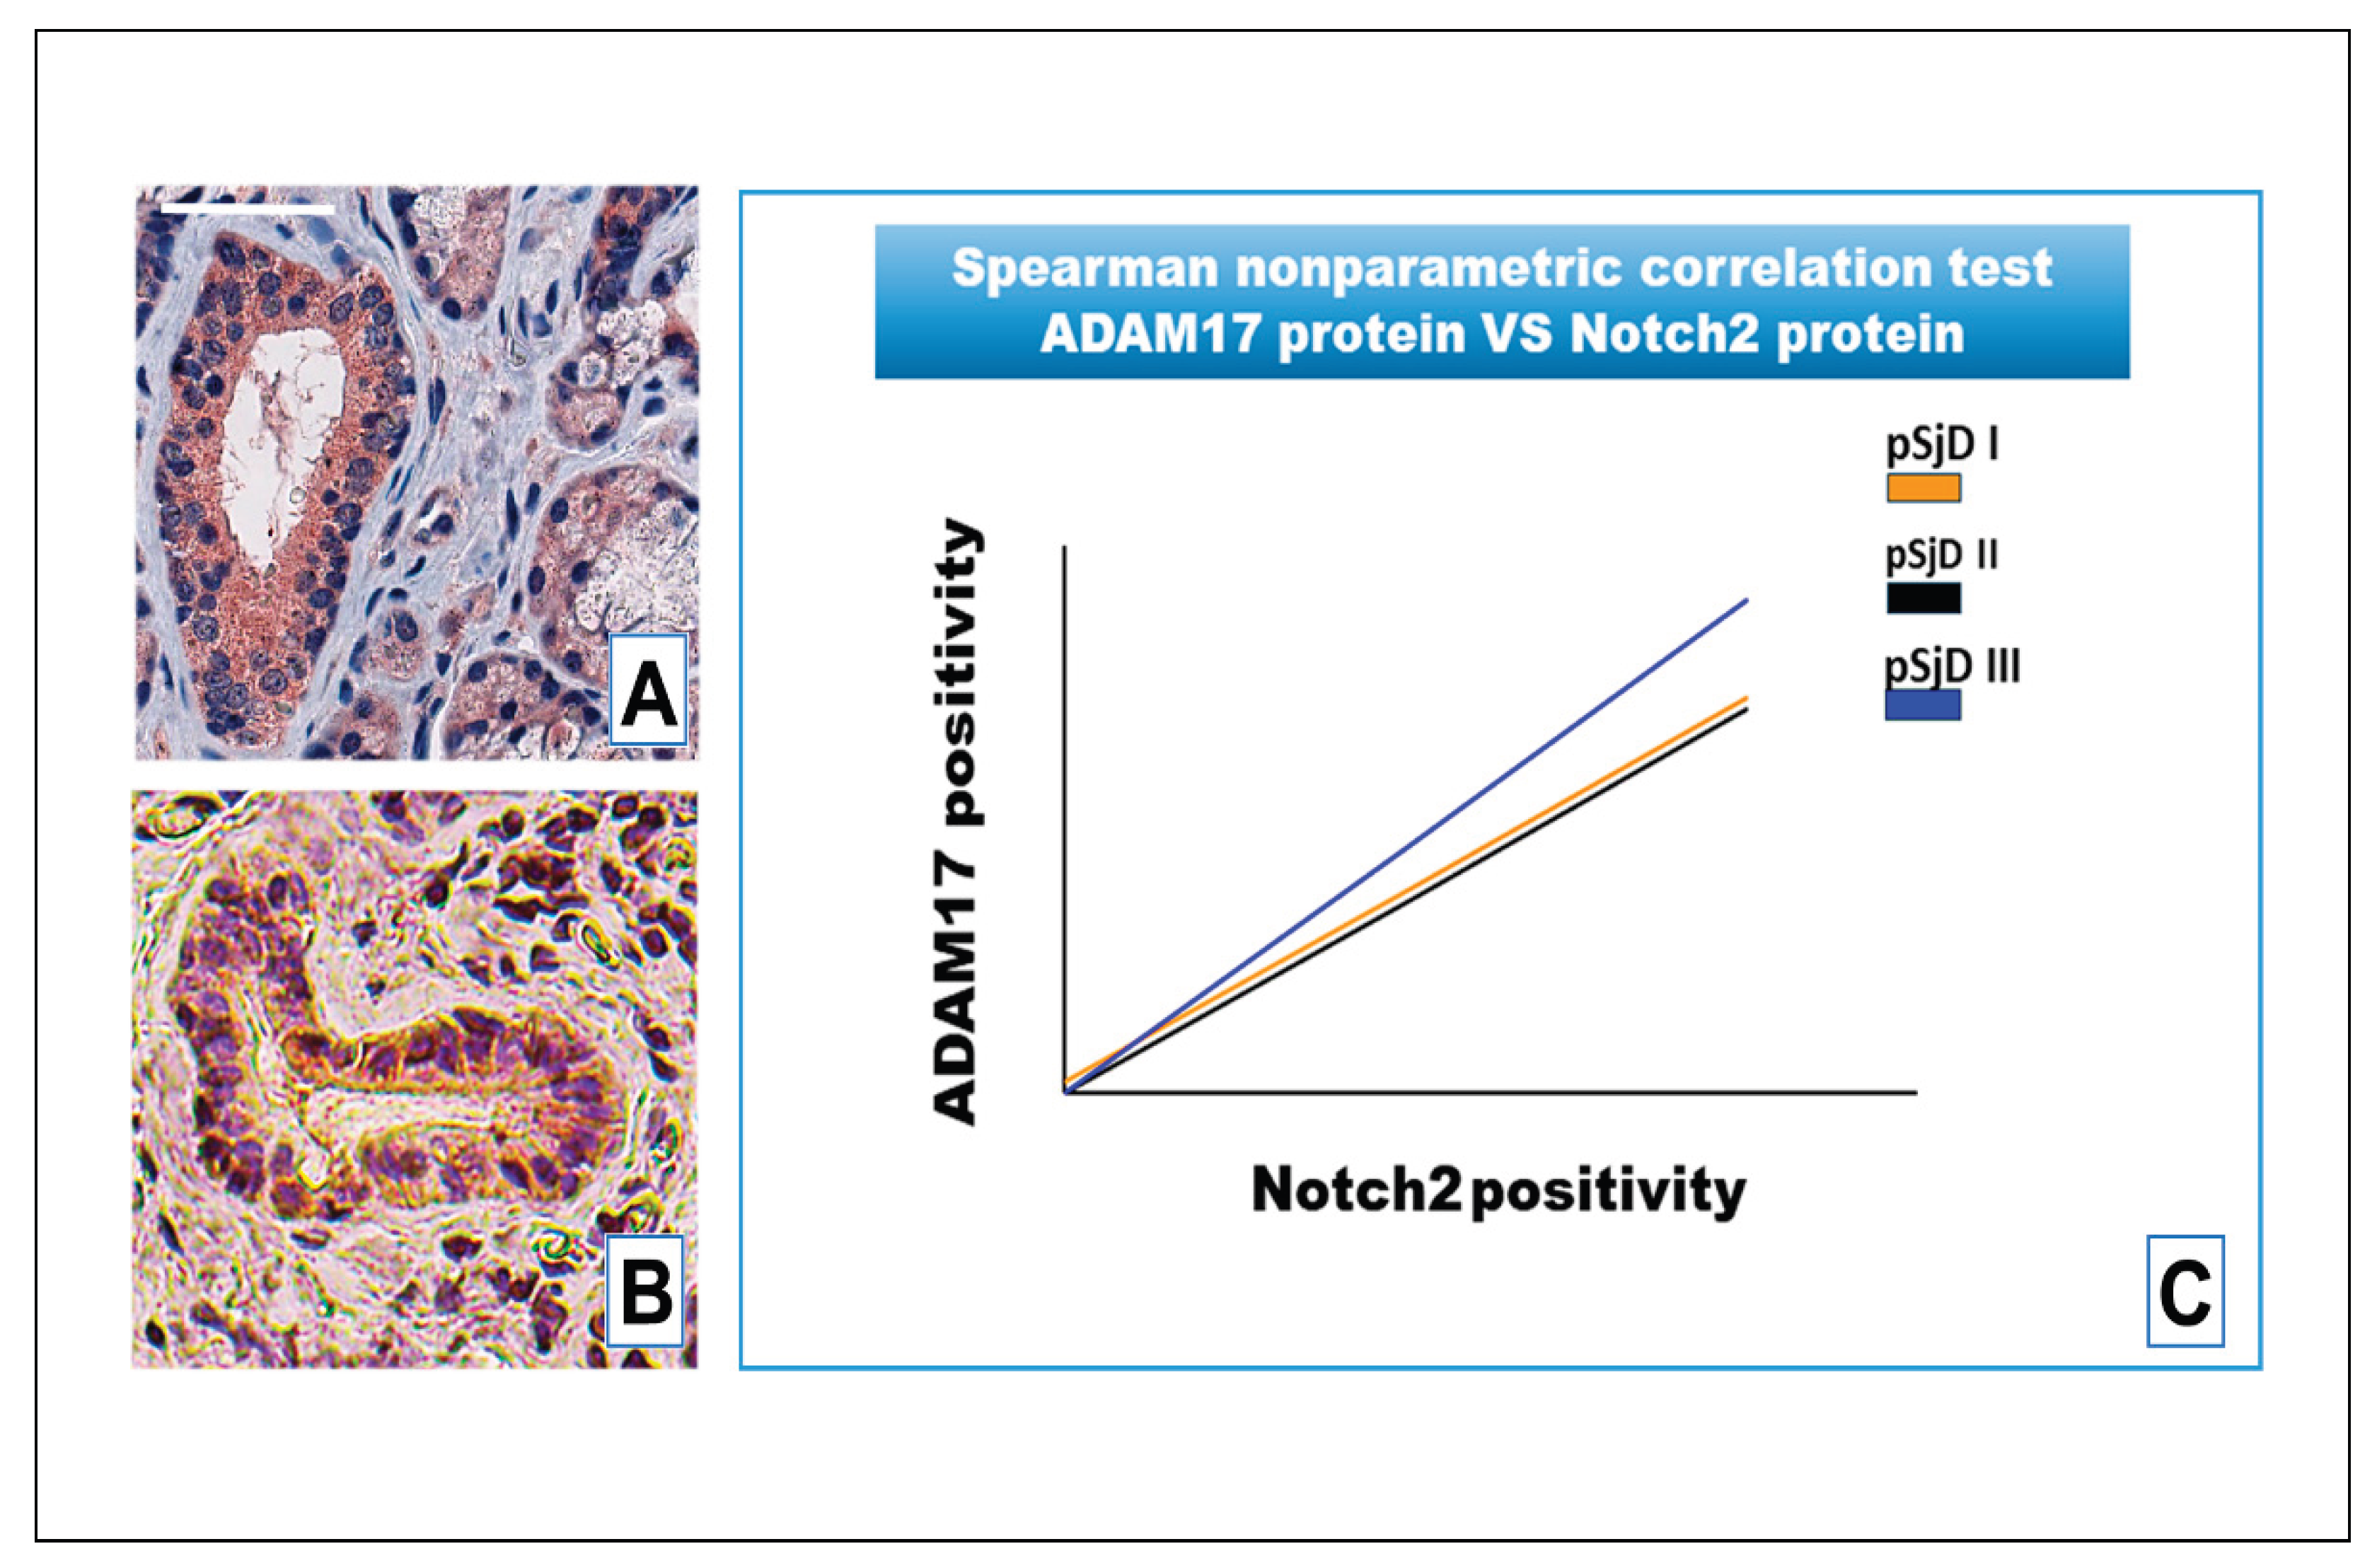

Table 1.
Main characteristics of patients with pSjD engaged in the study and relative healthy controls.
Table 1.
Main characteristics of patients with pSjD engaged in the study and relative healthy controls.
| Domain | Healthy | pSjD I | pSjD II | pSjD III |
| Age at diagnosis, years | 49.8 (range 21–66) | 57.7 (range 24.6–66.9) | 52.4 (range 24.8–66.7) | 52.9 (range 38.9–70.1) |
| Sex | female | female | female | female |
| Focus scores | negative | low lesions (FS ≤1) | moderate lesions (FS ≥2) | severe lesions FS ≥2 and GC+ |
| Anti-Ro positivity n (%) | negative | positive | positive | positive |
| Schirmer test ≤ 5 mm/5 min in at least 1 eye | negative | positive | positive | positive |
| Clinical parameters | ||||
| Unstimulated salivary flow (mL/5min) | negative | mild hypofunction (>0.7mL/min) | moderate hypofunction (0.1 to 0.7mL/min) | severe hypofunction (>0.1mL/min) |
| Rheumatoid factor | negative | positive | positive | positive |
| Anti-SSA antibody | negative | positive | positive | positive |
| Anti-SSB antibody | negative | positive | positive | positive |
| Anti-RNP antibody | negative | positive | positive | positive |
| Anti-centromere antibody | negative | negative | positive | positive |
| Anti-DNA antibody | negative | negative | negative | negative |
| Patient-reported outcomes | ||||
| Pain | negative | absence | presence | presence |
| Fatigue | negative | absence | presence | presence |
| Overall dryness | ocular and oral dryness | ocular and oral dryness | ocular and oral dryness | ocular and oral dryness |
| Systemic manifestations according to ESSDAI domains | ||||
| Glandular | normal salivary glands | unilateral salivary gland enlargement | swelling of mostly the parotid gland | swelling of mostly the parotid gland; diffuse sialectasias |
| Articular | absence of articular events | absence | arthralgia; arthritis | arthralgia; arthritis |
| Muscular | absence of muscular pains | muscle weakness | muscle weakness; myositis | myalgia; muscle weakness; myositis |
| Renal | absence | absence | absence | nephrogenic diabetes insipidus; proximal tubular acidosis; hypokalemia |
| Peripherical nervous system | absence | absence of neuronal pathological events | painful in the distal extremities; radiculoneuropathy; autonomic neuropathy | sensory ataxic neuropathy; cranial neuropathies; radiculoneuropathy; |
| Central nervous system | absence | absence of neuronal pathological events | motor or sensory deficits | spinal cord involvement cognitive dysfunction |
| Lymphadenopathy | absence | absence | splenomegaly | splenomegaly |
Disclaimer/Publisher’s Note: The statements, opinions and data contained in all publications are solely those of the individual author(s) and contributor(s) and not of MDPI and/or the editor(s). MDPI and/or the editor(s) disclaim responsibility for any injury to people or property resulting from any ideas, methods, instructions or products referred to in the content. |
© 2025 by the authors. Licensee MDPI, Basel, Switzerland. This article is an open access article distributed under the terms and conditions of the Creative Commons Attribution (CC BY) license (http://creativecommons.org/licenses/by/4.0/).
Copyright: This open access article is published under a Creative Commons CC BY 4.0 license, which permit the free download, distribution, and reuse, provided that the author and preprint are cited in any reuse.


