
Submitted:
03 December 2025
Posted:
04 December 2025
You are already at the latest version
Abstract
This study examines the working capital management efficiency of Türkiye’s forestry and logging sector over the 2009–2024 period using the index method developed by Bhattacharya (1997). The analysis utilizes sector balance sheet and income statement data published by the Central Bank of the Republic of Türkiye. Performance, utilization, and efficiency indexes were calculated to assess both the effectiveness of investments in current asset subcomponents and the degree to which these assets support sales growth. Results indicate that, despite fluctuations observed during certain years, the average values of all three indices for micro-scale, small-scale, and overall sectoral groups exceeded 1 over the study period, suggesting that enterprises in this sector generally managed their working capital efficiently. The highest index levels were reached in 2022, largely driven by a sharp increase in net sales relative to current assets. A comparison with existing research on wood products, paper, and furniture manufacturing sectors demonstrates that the forestry and logging sector exhibits relatively higher working capital efficiency, suggesting a stronger capability to maintain liquidity and support operational performance under changing economic conditions. Given the scarcity of prior research applying the index method to this sector, the study contributes new empirical evidence and demonstrates the suitability of index-based efficiency measurement for sector-level financial data. The results also suggest several implications: enterprises should reinforce cash-flow forecasting, improve monitoring of current asset subcomponents, and adopt scale-appropriate working capital policies. Policymakers may consider supporting micro- and small-scale companies through financial training initiatives and improved access to short-term credit instruments. Future research could incorporate firm-level datasets, expand coverage to medium and large enterprises, and apply alternative efficiency techniques to further validate and extend the findings.
Keywords:
index method
; financial efficiency
; forestry and logging sector
; efficiency index
; performance index
1. Introduction
Enterprises need cash and assets that can be converted into cash in the short term in order to commence operations, sustain their activities, meet their debt obligations on time, and achieve their objectives. Considering the increasing global competition, enterprises must effectively manage their working capital, also referred to as operating capital. The fundamental understanding of the working capital concept has been subjected to considerable change over the years.
Several decades ago, it was primarily regarded as an indicator of a debtor’s capacity to fulfill financial obligations in the event of liquidation. The main emphasis was placed on the extent to which current assets could be quickly converted into cash to settle outstanding debts. In this framework, a one-year period was commonly used to categorize assets and liabilities as current; e.g., current assets being those expected to be realized, and current liabilities those due, within a year. However, the perspective has gradually shifted from a liquidation-based approach to an “operating cycle” perspective, which highlights a firm’s ability to meet its short-term obligations through funds generated from ongoing business operations [1].
Consequently, one of the primary responsibilities of daily management accounting practice is the effective use of a company’s current assets and liabilities, also known as working capital management (WCM), requiring for careful consideration [2,3]. WCM is generally defined as the “management of a company’s current assets and current liability” [4]. While working capital may be regarded as the balance between current assets and current liabilities [5], WCM is mostly associated with all management decisions that impact working capital’s size and efficiency [6]. WCM refers to the effective planning and control of current assets and current liabilities, reducing the risk of inability to pay debts, and avoiding excessive investment in current assets [7].
Two primary advantages are generally attributed to effective WCM. First, it plays a crucial role in maintaining and enhancing a firm’s liquidity position. Second, it significantly contributes to the optimization and preservation of the firm’s overall value [8]. WCM encompasses daily operations or, more specifically, the process from raw materials to finished products and the collection of accounts receivable arising from sales. This process also provides cash inflows to the enterprise through sales. Enterprises with excess cash also need working capital management [9].
An important issue regarding working capital is determining the optimal amount of working capital. However, determining the optimal amount of working capital presents certain challenges. For example, determining the optimal amount is quite difficult due to many variables such as the structure of the sector in which the firm operates, its competitive strength, technological infrastructure, and credit policies [10,11]. So, the primary objective of WCM is to determine the adequate amount of working capital that will maximize the contribution to firm value. An excessive amount of working capital within assets leads to idle funds, lower returns on investments, increased liquidity, and reduced financial risk. Insufficient working capital, on the other hand, leads to reduced liquidity, lower returns on investments, disruptions in commercial activities, inability to protect against extraordinary circumstances, missed profitable investment opportunities, and increased financial risk [12,13].
The cash conversion cycle (CCC) is widely recognized as a key indicator of WCM and is frequently employed in empirical studies to assess the impact of WCM on firm profitability. The CCC represents the time span between the acquisition of raw materials and the receipt of payment for the sale of finished goods [14]. CCC consists of three main components: days of inventory outstanding, days sales outstanding and days payables outstanding. While a short CCC is positive for enterprises, this does not always indicate the effectiveness of working capital management under all circumstances [15].
When reviewing the international literature, there are a number of studies that use CCC to measure the efficiency of working capital. Some of these studies have found a negative relationship between working capital and profitability, while others have found a positive relationship. This discrepancy in the research literature makes the nature of this relationship unclear [15]. For this reason, studies measuring the efficiency of working capital using the index method developed by Bhattacharya (1997) are frequently encountered in the literature [16].
This study aims to examine the working capital management efficiency of the forestry and logging sector in Türkiye. Within this scope, using the index method developed by Bhattacharya (1997), working capital management efficiency was examined based on the balance sheet and income statement data for the 2009-2024 period for the forestry and logging sector, coded A-02, published by the Central Bank of the Republic of Türkiye (CBRT).
When the national and international literature on the subject is examined, it can be stated that studies attempting to determine the efficiency of working capital management for different sectors using the index method have become more popular in recent years. For example, in India, cement industry enterprises [17], paper industry enterprises [18], capital goods industry enterprises [19], and tea industry enterprises [20]; in Pakistan, companies in the cement sector [21] and companies operating in the textile sector [22], and in Malaysia, small and medium-sized companies [23] have been examined using the model developed by Bhattacharya (1997). Similarly, there are studies that examine the working capital management efficiency of companies operating on stock exchanges in different countries using the same method [19,24,25,26,27].
When examining studies on working capital management efficiency using the index method in Türkiye, it is observed that these studies are generally performed using examples of companies traded on the Borsa İstanbul (BIST). It can be stated that the pioneering study in this field was conducted by [28] with companies in the food sector traded on the BIST. Similarly, companies in the BIST retail trade sector [29]; the technology sector [11], the food and beverage, accommodation, and air transport sector [10], the restaurant and hotel sector [30], manufacturing sector [31], forest products, furniture, paper, and printing sector [32], and companies included in the sustainability index [33] were analyzed using the working capital efficiency index method.
Additionally, there are studies that examine the working capital efficiency of enterprises in the wood and wood products sector and the paper and paper products sector [34] and enterprises in the furniture manufacturing sector [35] on a scale basis. In general, when reviewing the literature in Türkiye, there are not any studies that aim to determine the efficiency of working capital management in the forestry and logging sector, which is the subject of this research, using the index method.
2. Materials and Methods
The primary data for this study was obtained from company accounts regularly published by the CBRT. Company accounts are produced by compiling the corporate tax returns and the attached balance sheets and income statements of individual real sector enterprises from the Revenue Administration, sector classification information from the Turkish Statistical Institute (TURKSTAT), as well as credit data from the Banks Association of Türkiye Risk Center, and aggregating these individual data by sector and scale for each reporting period. In determining the scale ranges, the criteria for the qualification and classification of small and medium-sized enterprises determined by the Ministry of Industry and Technology are used. These accounts cover a total of 17 main sectors classified based on the NACE Rev.2 economic activity classification [36].
One of these main sectors is “A-Agriculture, Forestry and Fishing” dir. Under this sector, the following sub-sectors are included:
- ➢
- 01-Crop and animal production, hunting and related service activities
- ➢
- 02-Forestry and logging
- ➢
- 03-Fishing and aquaculture
In this study, among these sub-sectors, the “Forestry and Logging” sector was selected as the subject of research. In order to conduct a longer-term analysis, the study period was set as 2009-2024. Balance sheets and income statements based on the scale of companies operating in the relevant sector during this period were obtained from the CBRT’s corporate website [37,38]. The CBRT has defined enterprise scales as micro, small, medium, and large. While data on micro and small-scale businesses in the forestry and logging sector are available for the relevant period, data on medium and large-scale enterprises are not published due to the principle that “statistics related to sectors that do not have sufficient data are not published due to statistical confidentiality principle”. Therefore, in this study, assessments are made under three subheadings: micro-scale, small-scale and the sector as a whole.
In the study, calculations were performed using the working capital efficiency index method, first developed by [16]. Bhattacharya developed the index method in question to measure and examine the efficiency of working capital management due to obstacles arising during the application of accounting ratios, such as difficulties caused by data gaps and insufficient theory [16]. In this method, performance index, utilization index, and efficiency index values are calculated to measure the efficiency of working capital.
According to [16], the performance index of working capital management (PIWCM) is first calculated using the following formula in order to measure the efficiency of working capital management:
: Sales index defined as: St / St-1,
Individual group of current assets,
N: Number of current assets group,
i=1,2,3….N
If the performance index value is greater than 1, it means that the company has invested sufficiently in its working capital sub-account items and that its working capital management performance is effective. If the performance index value is less than 1, it indicates that performance is inadequate.
In the second stage, the utilization index (UI) is calculated. UI demonstrates the company’s ability to use its current assets as a whole to increase sales. Consequently, if there is a greater increase in total current assets than a proportional increase in sales, it is said that the degree of utilization of these assets relative to sales has improved; otherwise, it has deteriorated. Therefore, this value should be greater than 1. The utilization index is calculated according to the following formula:
where, A = Current assets / Sales
In the final stage, the efficiency index (EI) value is calculated. EI is the product of both PI and UI that helps to measure the ultimate efficiency in working capital management, by multiplying the PI with UI as follow:
: Performance index of working capital management
: Utilization index of working capital management
Since the starting year in the data is 2009, the index values were first calculated for 2010, and assessments were made based on the 15-year index values for the 2010-2024 period.
3. Results and Discussion
The forestry and logging sector consists of four sub-sectors according to the classification used by the CBRT. These sectors are as follows:
- ➢
- 021-Silviculture and other forestry activities
- ➢
- 022-Logging
- ➢
- 023-Gathering of wild growing non-wood products
- ➢
- 024-Support services to forestry
Information regarding the current status of the forestry and logging sector is provided in Table 1. As of the end of 2024, there are a total of 1121 companies in this sector, the vast majority of which (86%) are micro-scale. 36% of those employed in the sector work in small-scale businesses, while 34% work in micro-scale businesses. In 2024, net sales amounted to approximately 17 billion ₺. Although there are only four large-scale companies, the sales of these four large-scale companies account for 31.5% of total sales. The same applies to total assets, with 33% of total assets belonging to these four large-scale companies. Furthermore, when examining the legal status of the companies, 611 are limited companies, 433 are cooperatives, 66 are joint-stock companies, and 9 have other statuses.
The change in the number of companies operating in the forestry and logging sector and submitting their financial statements to the CBRT between 2009 and 2024 is shown in Figure 1. It is possible to state that the number of micro-scale companies has gradually increased over the years, while the number of small-scale companies has shown a slight upward trend. The total number of companies in the sector increased by 74.3% during the relevant period. The working capital management efficiency within the scope of the study was calculated based on the financial statements of these companies.
Working Capital Management Efficiency Values of Micro-Scale Firms
When examining the performance, utilization, and efficiency index values of micro-scale companies in the forestry and logging sector for the 2010-2024 period, fluctuations in values over the years can be observed. It can be said that all index values were below 1 in 2012, 2015, 2019, 2021, and 2024. Apart from these years, the utilization index value was below 1 in 2014, 2017, and 2020, while the efficiency index was below 1 in 2020. In other years, the values were above 1 (Figure 2). PI reached its peak value in 2011 (3.42) and was also high in 2022 (2.22). Therefore, the EI value was calculated as 4.06 and 4.08, respectively, in the same years. The main reason for this situation can be attributed to the significant increase in net sales in the relevant years compared to the previous year.
The descriptive statistics of the index values for micro-scale companies are presented in Table 2. Accordingly, it is seen that the averages of the PI, UI, and EI values for these companies are higher than 1. The average PI value of 1.37 indicates that they are effective in terms of the investment policy implemented for the sub-account items of working capital. Similarly, when the average EI value (1.55) is examined, it can be stated that these enterprises manage their working capital effectively, both in terms of sub-items and as a whole. The PI value was higher than 1 in ten of the fifteen years, the UI value in seven years, and the EI value in nine years. This indicates that these companies have a certain policy, at least partially, for working capital management. According to the findings, it can be said that working capital management efficiency was weak during periods when sales declined or when the relative increase was insufficient.
Working Capital Management Efficiency Values of Small-Scale Firms
The change in the performance, utilization, and efficiency index values of small-scale companies in the forestry and logging sector over the years is shown in Figure 3. It can be seen that all three index values fluctuated over the years. In particular, since the net sales of these enterprises entered a sudden upward trend after 2021, both PI and UI values peaked, and consequently, the EI value also reached its maximum value (4.78) in 2022. On the other hand, in 2011, 2013, 2015, 2017, and 2021, all index values were below 1. It can be said that enterprises were unable to manage their working capital effectively in these years. In particular, during the 2010-2013 period, the investment policy implemented in the sub-account items of working capital was ineffective.
When examining the descriptive statistics of the index values for small-scale companies, it is observed that the average PI, UI, and EI values for the relevant period are higher than 1. The average value of PI was found to be very close to the PI value of micro-scale enterprises. The same applies to the UI and EI values. Therefore, it can be concluded that the working capital management efficiency of micro-scale and small-scale enterprises in the forestry and logging sector is very similar. In other words, companies in both groups properly managed their working capital. All three PI, UI, and EI values reached their maximum values in 2022. On the other hand, PI and EI values reached their minimum values in 2013, while the UI value reached its minimum value in 2023. The three index values were higher than 1 in eight out of fifteen years.

Table 3.
Descriptive statistics of index values for small-scale companies.
| Min | Max | Average | >1 | |
| PI | 0.77 | 3.12 | 1.38 | 8 |
| UI | 0.78 | 1.53 | 1.01 | 8 |
| EI | 0.67 | 4.78 | 1.45 | 8 |
Working Capital Management Efficiency Values of Forestry and Logging Sector in General
When examining the working capital management efficiency of all companies in the forestry and logging sector (micro, small, medium, and large-scale companies) over the years, a similar situation to that observed in micro and small-scale companies is evident. Since there are few medium and large enterprises in the sector, it is normal for a similar situation to the previous two headings to emerge for the sector as a whole. While PI and EI values fluctuate over the years, the UI value is more stable. Only in 2013, 2015, and 2021 were all three index values less than 1. In other words, it is possible to say that in these years, optimal investments were not made in current asset sub-account items and that there was an ineffective investment policy in the context of sub-account items. In 2022, all three index values reached their maximum value (Figure 4). This can be attributed to the increase in net sales far exceeding the increase in current assets during the 2021-2022 period, thus indicating the effective management of working capital.
When the sector is evaluated overall, the PI value reached a maximum of 5.39 (in 2022), a minimum of 0.67 (in 2021), and an average of 1.44. The maximum value of EI was calculated as 7.16 in the same year as PI, and the minimum value was 0.64 in the same year as PI. The difference between the maximum and minimum values of UI is closer compared to other index values (Table 4). While the PI value was greater than 1 for a total of ten years, the EI value was greater than 1 for nine years, and the UI value was greater than 1 for eight years.
When a general analysis is conducted, it is observed that the average PI, UI, and EI values for all three scale groups during the research period are greater than 1. The group with the highest average PI value is the entire sector, while the average PI values for micro and small-scale companies are very close. The average UI value was calculated to be lower than the other two index values in all three scales and showed similar values for all three scales. The EI value, which had the highest average value, also had similar values for all three scale groups. When considering maximum values, it can be seen that PI and EI values are highest in the scale encompassing the entire sector, while UI values are highest in micro-scale companies. Although companies in the forestry and logging sector experienced fluctuations during the period due to various factors, the conclusions drawn from the average values clearly show that companies in this sector are able to manage their working capital efficiently.
Since no research has been found that attempts to reveal the management efficiency of working capital in the forestry and logging sector in Türkiye and worldwide using the index method developed by [16], it is not possible to directly compare the results obtained in this study with the literature. However, there are a limited number of studies in Türkiye that use the index method for certain sectors indirectly related to forestry.
For instance, in the study conducted by [34] for the wood and wood products sector and the paper and paper products sector, the average PI, UI, and EI values for both sectors in micro-scale enterprises were found to be above 1. However, when compared to the forestry and logging sector, we can say that micro-scale enterprises in the forestry and logging sector have higher values. When comparing the average index values of micro-scale enterprises in the study conducted by [35] for the furniture manufacturing sector, it was determined that the PI and EI values were higher in our study, while the UI value was lower.
When comparing the study by [35] for small-scale enterprises, similar results are observed for micro-scale enterprises. Again, it can be said that the forestry and logging sector has higher PI and EI values. A similar comparison result applies to both the wood and wood products sector and the paper and paper products sector [34]. The PI and EI values of small-scale enterprises in the forestry and logging sector are much higher than those in both the wood and wood products sector and the paper and paper products sector.
A comparison at the sector level shows that all three index values for the forestry and logging sector are significantly higher than those for both the wood and wood products sector and the paper and paper products sector. For example, while the EI value was calculated as 1.55 in the forestry and logging sector, this value was 0.991 and 0.919 in the wood and wood products sector and the paper and paper products sector, respectively [34]. In this case, it can be said that the working capital management efficiency of the forestry and logging sector is better than that of other sectors.
In another study indirectly related to forestry, the effectiveness of working capital management in forest products, furniture, paper, and printing companies listed on the Borsa İstanbul was examined, and it was found that the average effectiveness values of these companies were generally above 1 [32]. It can be said that our research provides results similar to those for PI, UI, and EI values.
4. Conclusions
This study evaluates the working capital management efficiency in Türkiye’s forestry and logging sector using the index method proposed by Bhattacharya (1997). By calculating performance, utilization, and efficiency indices for the 2010–2024 period, the research offers a comprehensive picture of how companies in the sector manage their working capital under varying economic conditions.
The results show that micro-scale and small-scale companies, as well as the sector as a whole, generally achieved index values above 1, indicating effective working capital management throughout the period. Although some years—particularly 2012, 2015, 2019, 2021, and 2024 for micro-scale firms and 2011, 2013, 2015, 2017, and 2021 for small-scale firms—reflected weaker performance, the overall trend demonstrates that enterprises within the forestry and logging sector are, on average, able to use their working capital effectively to support operational continuity, maintain liquidity, and align current asset investments with sales performance. The significant peaks observed in 2022 suggest that sectoral dynamics, especially rapid increases in net sales, can substantially improve working capital efficiency.
A comparison with related studies in Türkiye reveals that the forestry and logging sector performs better than the wood and wood products, the paper and paper products, and furniture manufacturing sectors in terms of average index values. This indicates that enterprises in the forestry and logging sector are relatively more successful in structuring and utilizing their short-term assets to support operational continuity and financial stability.
Given the limited number of studies focusing specifically on the forestry and logging sector, the results of this research contribute important insights to the literature. Additionally, the study confirms that the index method provides a useful and applicable framework for assessing aggregated sector data.
The following recommendations can be presented within the scope of the research:
- ➢
- For a better working capital management, micro and small-scale enterprises should formalize working capital guidelines, particularly for inventory and receivables management, as these segments experience the highest fluctuations in index values. These enterprises should also prioritize accurate demand forecasting and integrate it into cash conversion planning for a better management.
- ➢
- Annual changes in specific current asset groups (e.g., inventories, trade receivables) should be regularly evaluated using internal ratio-based dashboards to detect inefficiencies early.
- ➢
- Accounting and enterprise resource planning tools can improve the reliability of data used in working capital decisions, especially for micro-scale firms.
- ➢
- Since micro-scale enterprises make up 86% of the sector, capacity-building programs focusing on working capital planning, cash flow analysis, and inventory control would raise overall sector efficiency.
- ➢
- In order to support these micro-scale enterprises in managing liquidity during periods of fluctuation, access to short-term financing instruments should be improved by the supporting institutions
- ➢
- Future studies should be realized by incorporating firm-level analyses, examining medium and large enterprises where data availability improves, or integrating alternative efficiency measurement techniques to provide a broader perspective. In this context, techniques such as DEA, panel regression, or dynamic CCC models could provide complementary insights.
- ➢
- The determinants of index fluctuations should be investigated by examining the effects of macroeconomic variables, product price cycles, export performance, or input cost changes would help explain years in which efficiency falls below 1.
Funding
This research received no external funding.
Institutional Review Board Statement
Not applicable.
Informed Consent Statement
Not applicable.
Data Availability Statement
Dataset available on request from the author.
Conflicts of Interest
The author declares no conflicts of interest.
References
- Fess, P. E. 1966. The working capital concept. The Accounting Review. 41(2): 266-270.
- Jose, M. L., Lancaster, C., and Stevens, J. L. 1996. Corporate return and cash conversion cycles. Journal of Economics and Finance. 20: 33–46. [CrossRef]
- Malmi, T., and Ikäheimo, S. 2003. Value based management practices—some evidence from the field. Management Accounting Research. 14: 235–254. [CrossRef]
- Schall, L. D., and Haley, C. W. 1991. Introduction to financial management. New York: McGraw-Hill.
- Pass, C. L., and Pike, R. H. 1984. An overview of working capital management and corporate financing. Managerial Finance. 10(3): 1-11. [CrossRef]
- Kaur, J. 2010. Working capital management in Indian tyre industry. International Research Journal of Finance and Economics. 46: 7-31.
- Eljelly, A. M. 2004. Liquidity--profitability trade off: an empirical investigation in an emerging market. International Journal of Commerce and Management. 14(2): 48-61. [CrossRef]
- Knauer, T., and Wöhrmann, A. 2013. Working capital management and firm profitability. Journal of Management Control. 24(1): 77-87. [CrossRef]
- Aydın, N., Şen, M., Berk, N. 2012. Finansal Yönetim-I, Anadolu Üniversitesi Yayını No: 2577 Açıköğretim Fakültesi Yayını No: 1547, Eskişehir.
- Günay, F. 2021. Çalışma sermayesi etkinliği ölçümünde endeks yöntemi: Borsa İstanbul yiyecek-içecek, konaklama ve havayolu ulaştırma işletmelerinde bir uygulama. Alanya Akademik Bakış. 5(3): 1411-1431. [CrossRef]
- Mazman İtik, Ü. 2021. Çalışma sermayesi etkinlik ölçümünde indeks yöntemi: Teknoloji şirketlerinde bir uygulama. OPUS International Journal of Society Researches. 18(41): 3534-3551. [CrossRef]
- Aksoy, E. E. 2013. İşletme sermayesi ihtiyacını etkileyen işletme içi faktörlerin analizi: Prais-Winsten regresyon uygulaması. Gazi Üniversitesi İktisadi ve İdari Bilimler Fakültesi Dergisi. 15(3): 73-86.
- Demirtaş, İ., and Gençtürk, M. 2022. Çalışma sermayesi yönetiminin sistematik derleme yöntemine göre incelenmesi (2002-2021). Vizyoner Dergisi. 13(36): 1287-1304. [CrossRef]
- Pratap Singh, H., and Kumar, S. 2014. Working capital management: a literature review and research agenda. Qualitative Research in Financial Markets. 6(2): 173-197. [CrossRef]
- Güler, E., Konuk, F. 2019. Çalışma sermayesi etkinlik ölçümünde alternatif bir araç: indeks yöntemi. Muhasebe ve Finansman Dergisi. (84): 35-48. [CrossRef]
- Bhattacharya, H. 1997. Total Management by Ratios, Sage Publications, New Dehli.
- Gosh, S. K., and Maji, S. P. 2004. Working capital management efficiency: A study on the Indian cement industry. The Management Accountant. 39(5): 363-372.
- Ramachandran, A., and Janakiraman, M. 2009. The relationship between working capital management efficiency and EBIT. Managing Global Transitions: International Research Journal. 7(1): 61-74.
- Kaur, H. V., and Singh, S. 2013. Managing working capital efficiency in capital goods sector in India. Global Business Review. 14(2): 343-355. [CrossRef]
- Sharma, A. K. 2019. Working capital management efficiency: a study on some selected proprietary tea estates in Jorhat District of Assam. Journal of Emerging Technologies and Innovative Research. 6(5): 169-183.
- Afza, T., and Nazir, M. S. 2011. Working capital management efficiency of cement sector of Pakistan. Journal of Economics and Behavioral studies. 2(5): 223-235.
- Shehzad, F., Kamran, A., Saba, S., Faiza, S. and Yasir, M. 2012. The relationship between working capital management efficiency and ebit : Evidence from textile sector of Pakistan. Interdisciplinary Journal of Contemporary Research in Business. 4(5): 211-224.
- Kasiran, F. W., Mohamad, N. A. and Chin, O. 2016. Working capital management efficiency: A study on the small medium enterprise in Malaysia. Procedia Economics and Finance. 35: 297-303. [CrossRef]
- Sharma, A. K. And Kumar, S. 2011. Effect of working capital management on firm profitability: Empirical evidence from India. Global Business Review. 12(1): 159-173.
- Valipour, H. and Jamshidi, A. 2012. Determining the optimal efficiency index of working capital management and its relationship with efficiency of assets in categorized industries: evidence from Tehran Stock Exchange (TSE). Advances in Management & Applied Economics. 2(2): 191-209.
- Kamau, S. M. and Basweti, K. A. 2013. The relationship between corporate governance and working capital management efficiency of firms listed at the Nairobi securities exchange. Research Journal of Finance and Accounting. 4(19): 190-199.
- Kaur, H.V. 2014. Efficient management of working capital: A study of heathcare sector in India. Management Strategies Journal, Constantin Brancoveanu University. 25(3): 53-65.
- Kandil Göker, I. E. 2018. Çalışma sermayesi yönetiminde etkinlik durumunun tespiti: BIST gıda sektörü firmaları üzerine bir araştırma. Uluslararası Yönetim Eğitim ve Ekonomik Perspektifler Dergisi. 6(3): 69-79.
- Erem Ceylan, I. 2020. Measuring efficiency of working capital management: Index method. Journal of Economics Business and Organization Research. Special Issue, 238-246.
- Günay, F. and Cokins, G. 2021. Comparative measurement of working capital efficiency for Borsa Istanbul restaurants and hotels for the COVID-19 period and previous quarters. C. Cobanoglu, V. Della Corte (Eds.), Advances in global services and retail management (pp. 1–17). USF M3 Publishing. [CrossRef]
- Kaya, E., Konuk, F., Kaya, Ö. 2022. Halka açık şirketlerin indeks yöntemi ile çalışma sermayesi etkinlik düzeylerinin tespit edilmesi. İşletme Araştırmaları Dergisi. 14 (1): 717- 733. [CrossRef]
- Ersen, N., Akyüz, K. C., Akyüz, İ. 2024. Covıd-19’un çalışma sermayesi yönetim etkinliğine etkisi: Bist orman ürünlerı, mobilya, kâğıt ve basım işletmeleri üzerine bir araştırma. Türkiye Sosyal Araştırmalar Dergisi. 28(2): 376-388. [CrossRef]
- Kandil Goker, I. E. 2020. An analysis of working capital efficiency of companies listed on sustainability index by index method. Journal of Economics, Finance and Accounting (JEFA). 7(2): 94-102. [CrossRef]
- Atılgan, A., Akyüz, İ., Akyüz, K. C., and ERSEN, N. 2024. Ölçek bazında çalışma sermayesi yönetim etkinliği: ağaç ve ağaç ürünleri ve kağıt ve kağıt ürünleri sektörü. Düzce Üniversitesi Orman Fakültesi Ormancılık Dergisi. 20(1): 121-138. [CrossRef]
- Karadeniz, E., İskenderoğlu, Ö. 2024. Mobilya imalatı sektöründe çalışma sermayesi etkinliğinin ölçek temelinde analizi. Bartın Orman Fakültesi Dergisi. 26(2): 87-97. [CrossRef]
- TCMB. 2025a. Türkiye Cumhuriyet Merkez Bankası sektör bilançoları metaveri. Access Date: 04 October 2025. Access Address: https://www3.tcmb.gov.tr/sektor/dosyalar/menu/ metadata_tr.pdf.
- TCMB. 2025b. Türkiye Cumhuriyet Merkez Bankası ormancılık ve tomrukçuluk sektör bilançoları. Access Date: 10 October 2025. Access Address: https://www3.tcmb.gov.tr/sektor/#/tr/A/02/ormancilik-ve-tomrukculuk.
- TCMB. 2025c. Türkiye Cumhuriyet Merkez Bankası sektör bilançoları arşiv. Access Date: 14 October 2025. Access Address: https://www.tcmb.gov.tr/wps/wcm/connect/ TR/TCMB+TR/Main+Menu/Istatistikler/Reel+Sektor+Istatistikleri/Sektor+Bilancolari/Arsiv/.
Figure 1.
Number of companies by year.
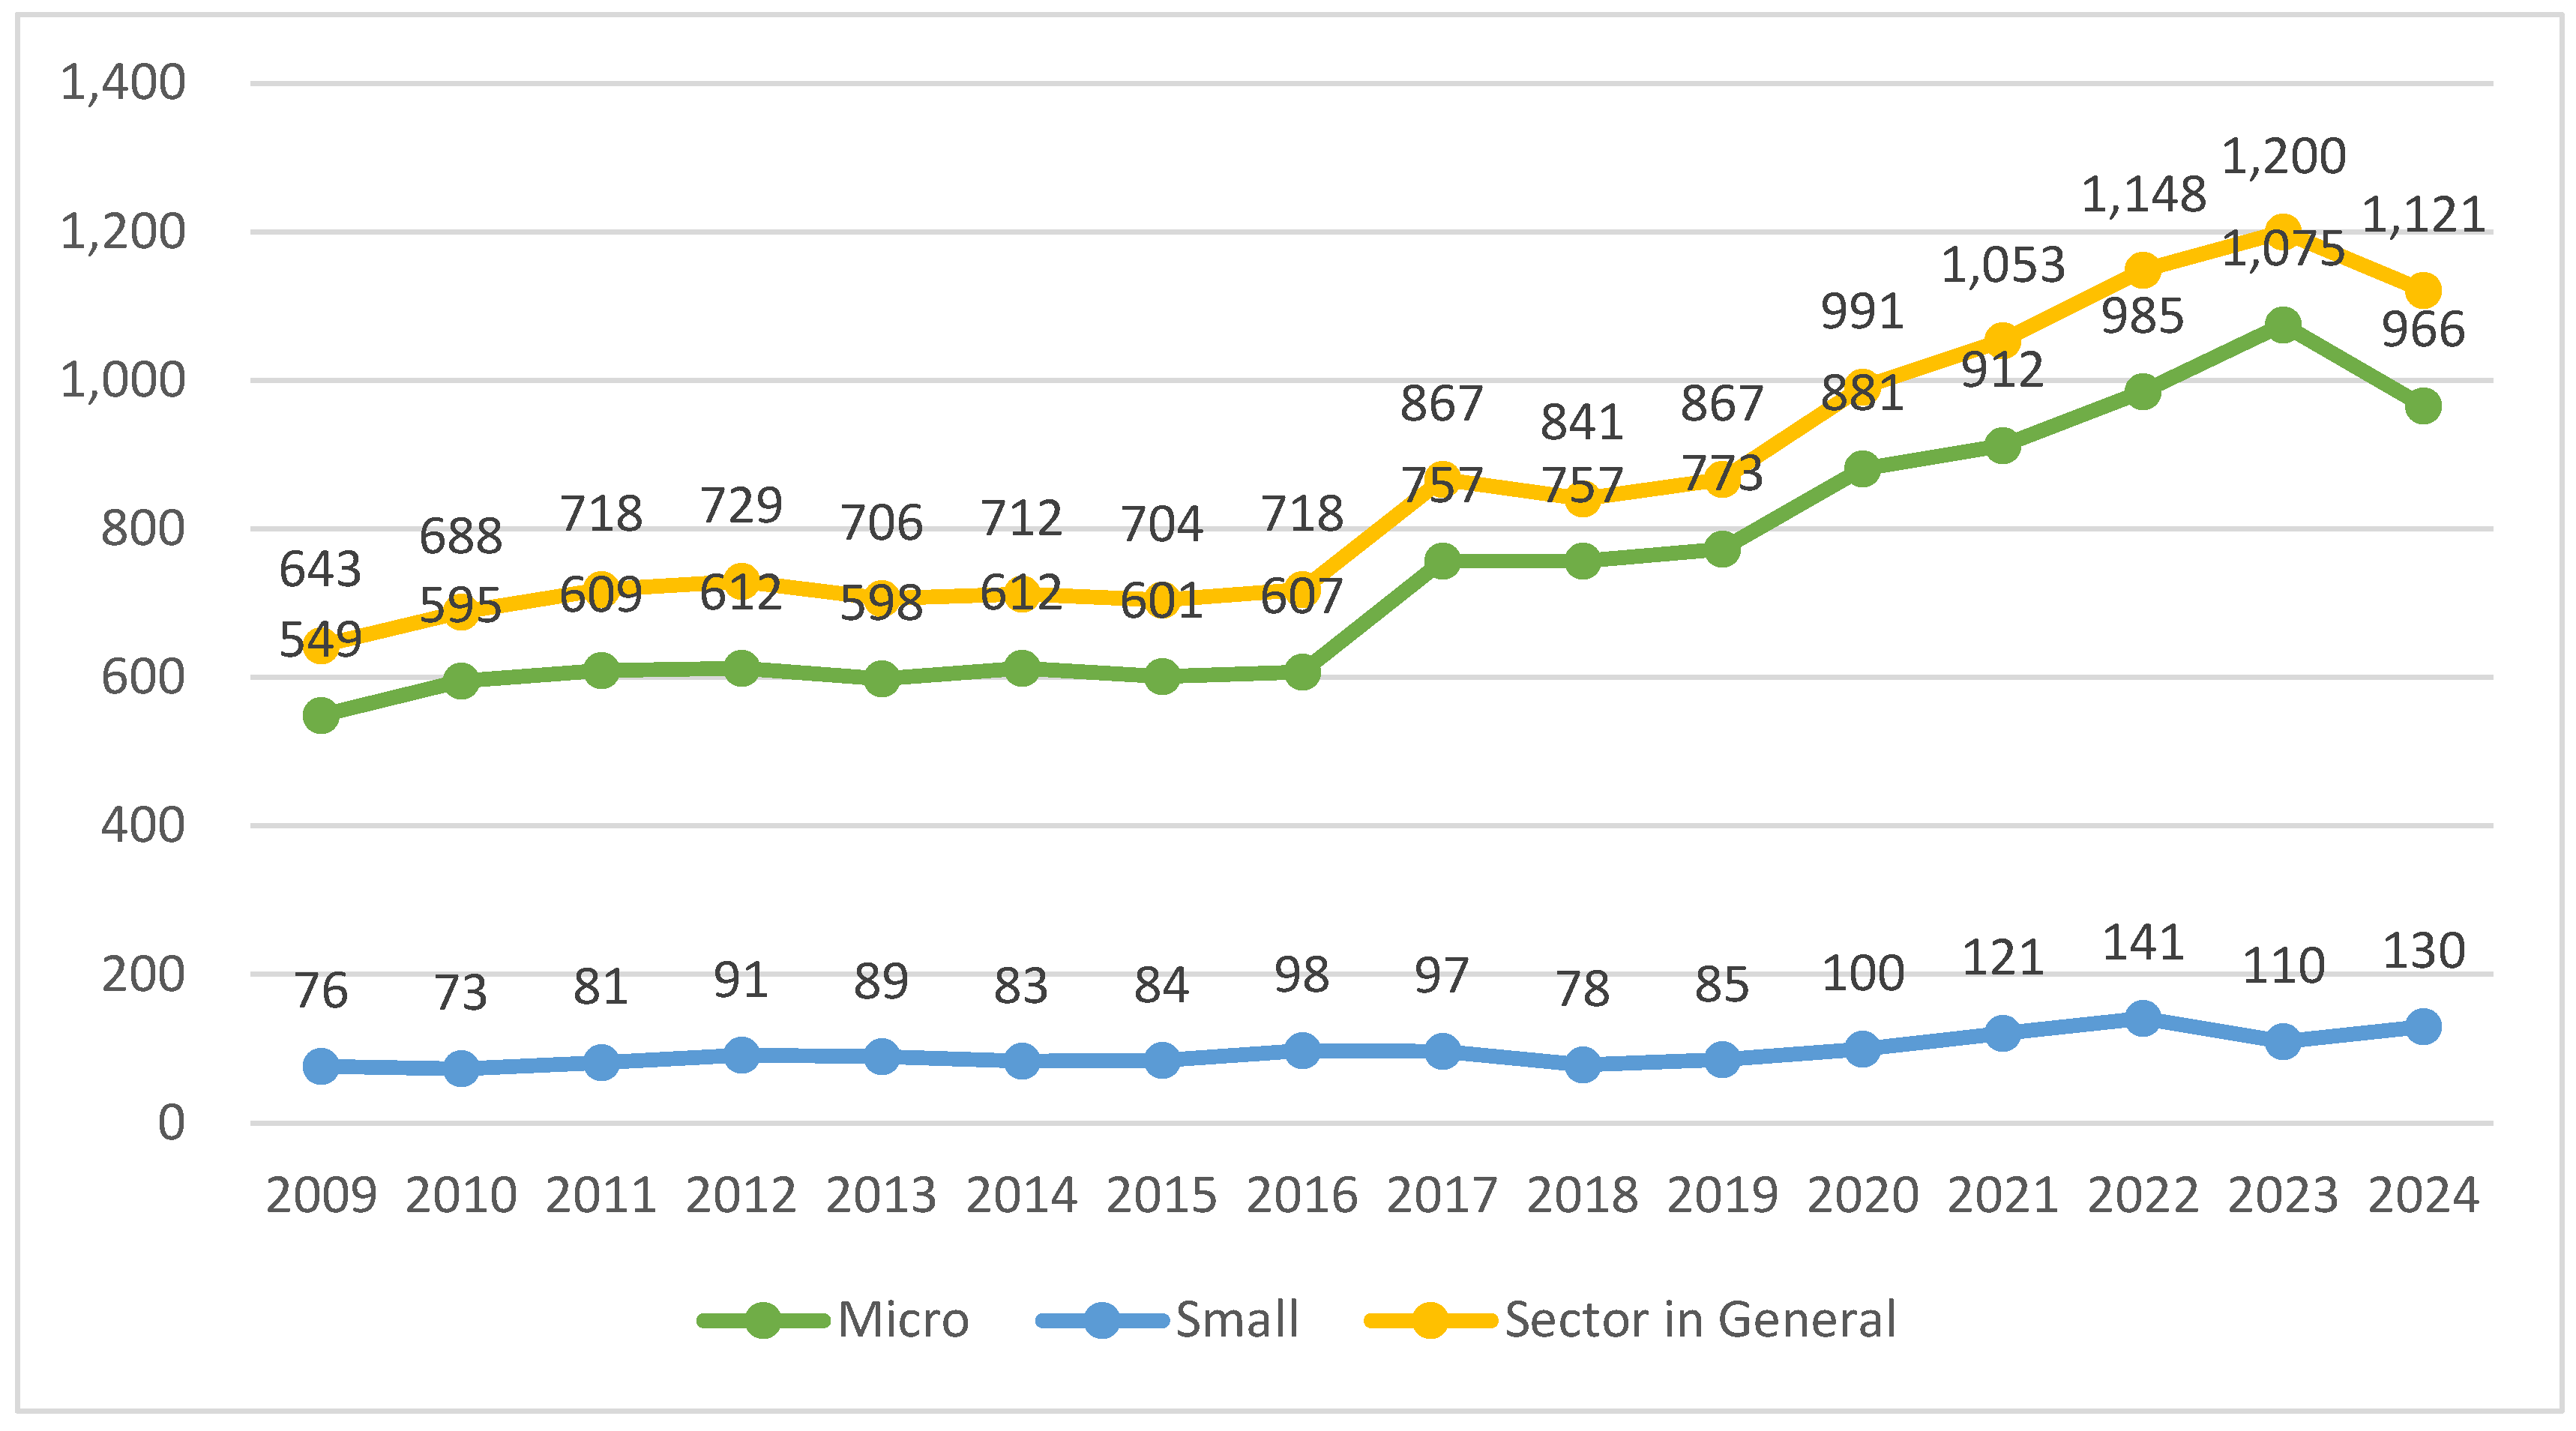
Figure 2.
Index values of micro-scale companies by year.
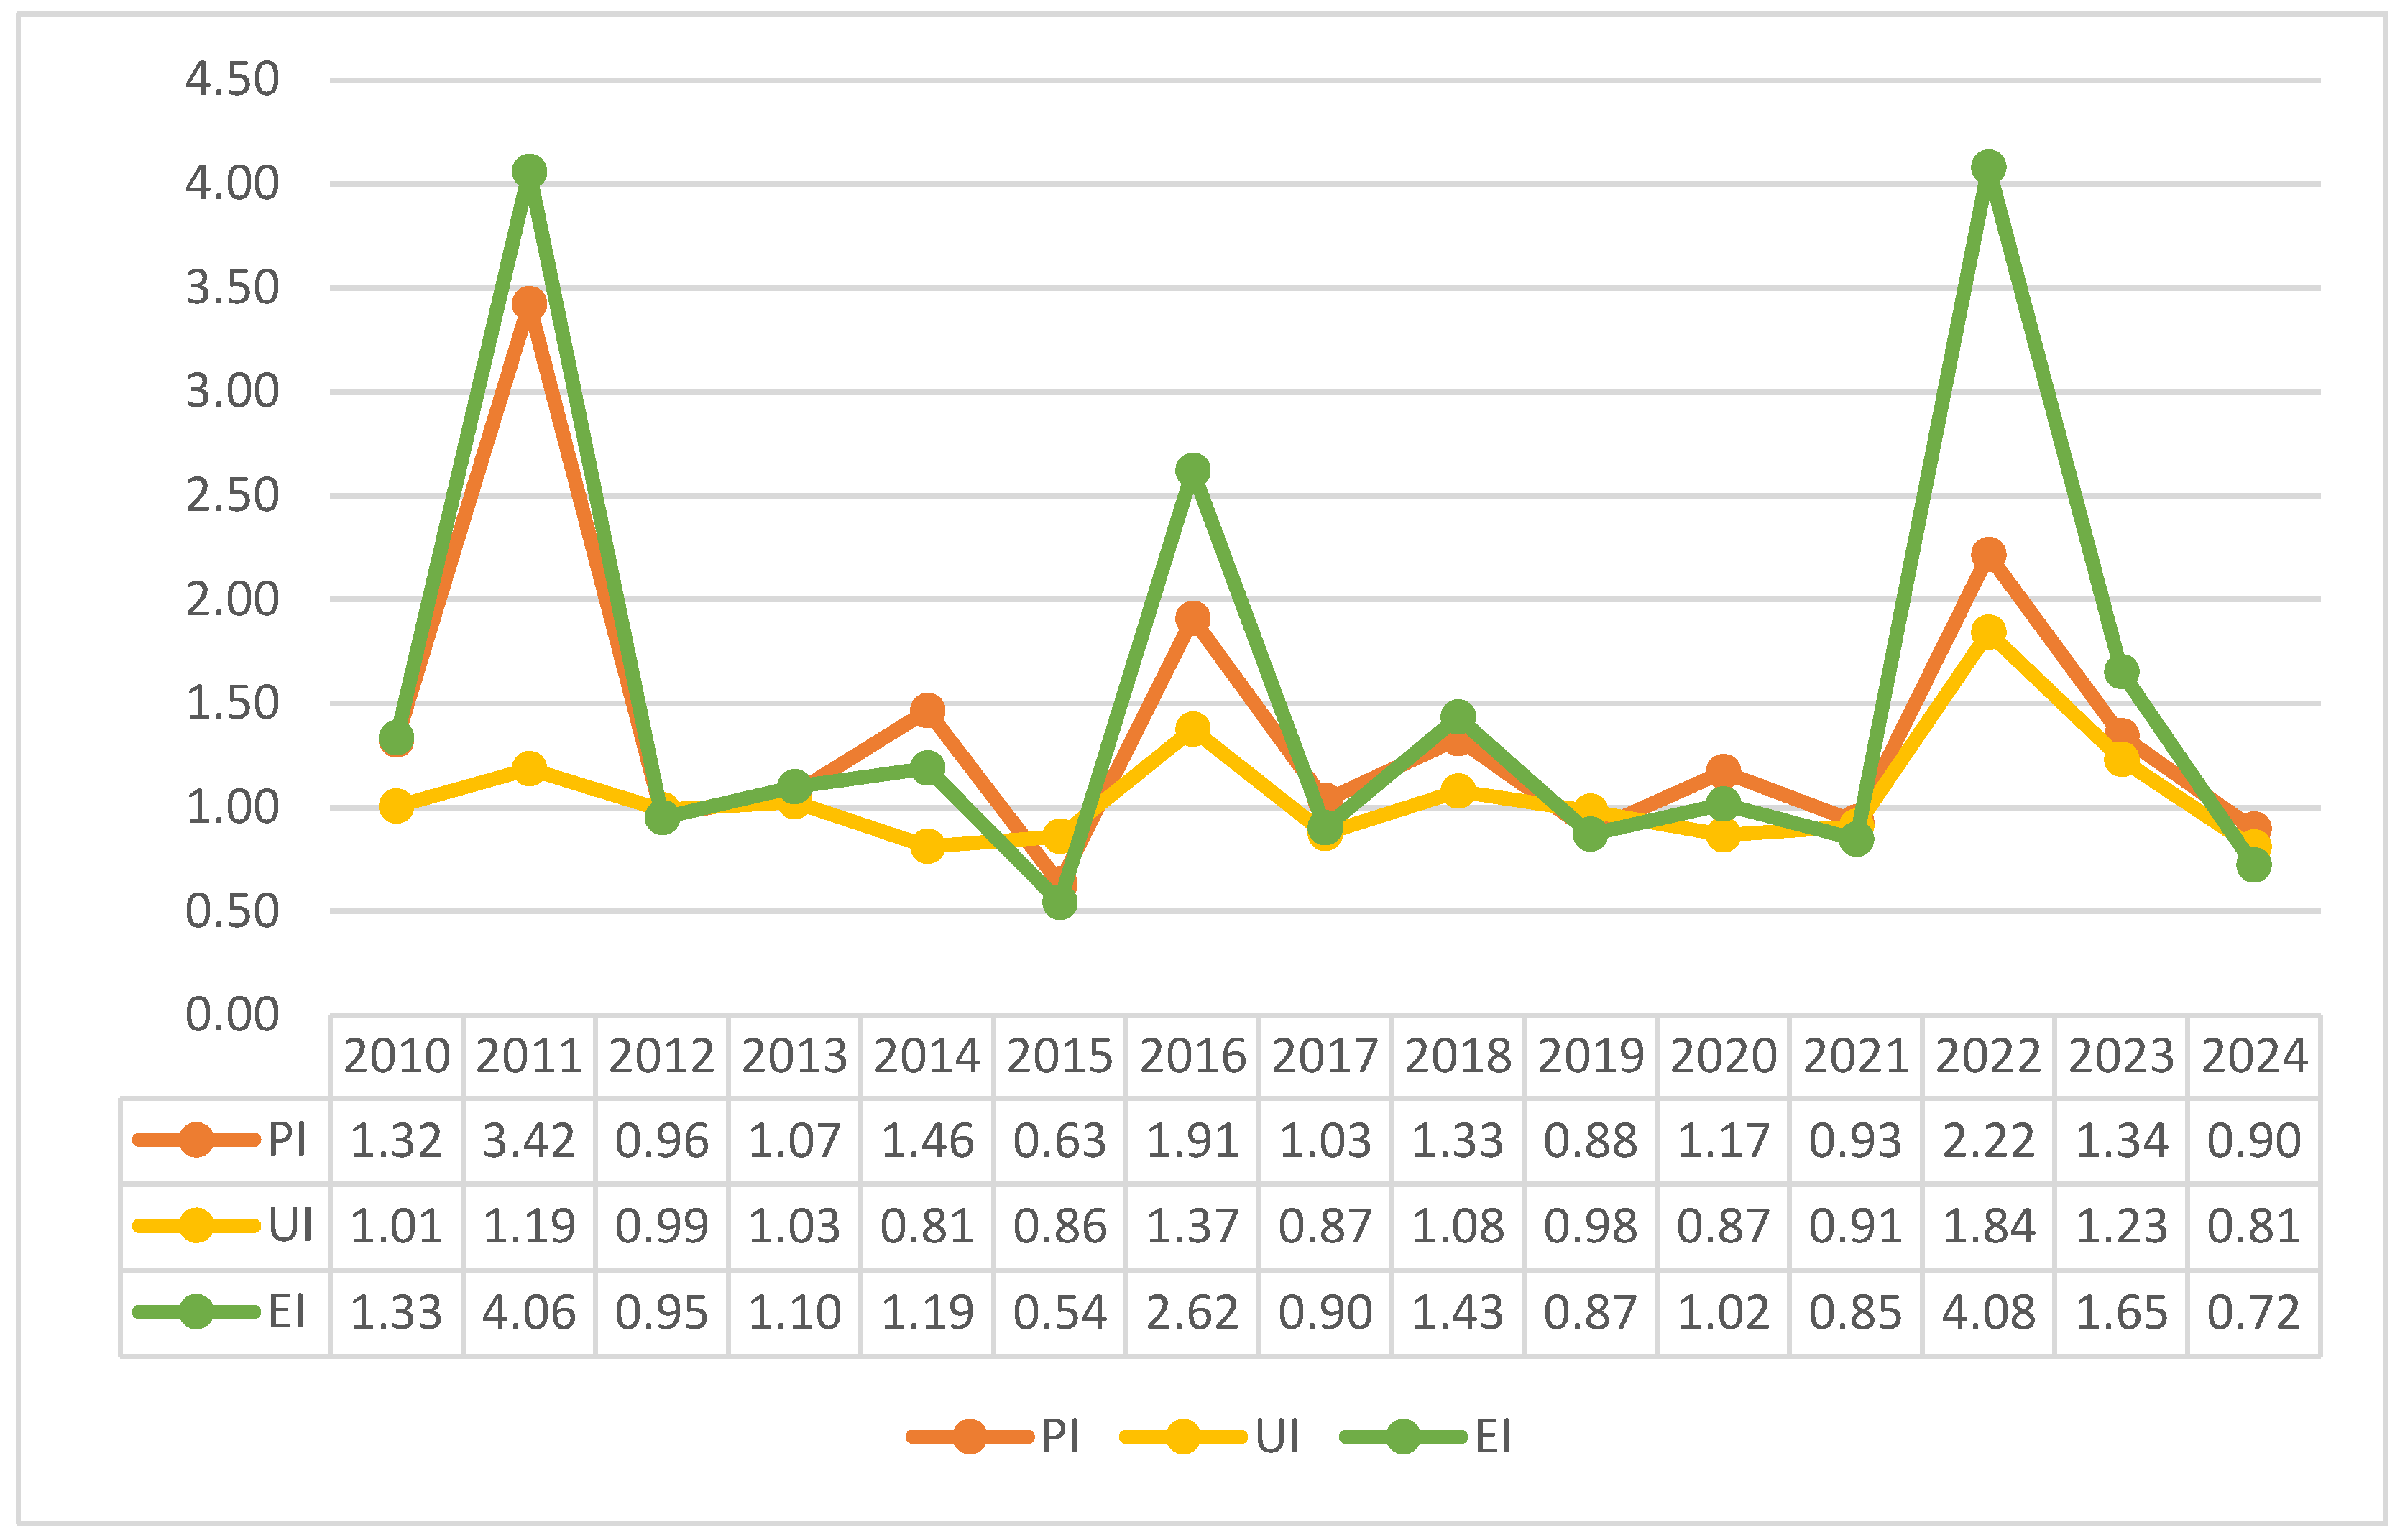
Figure 3.
Index values of small-scale companies by year.
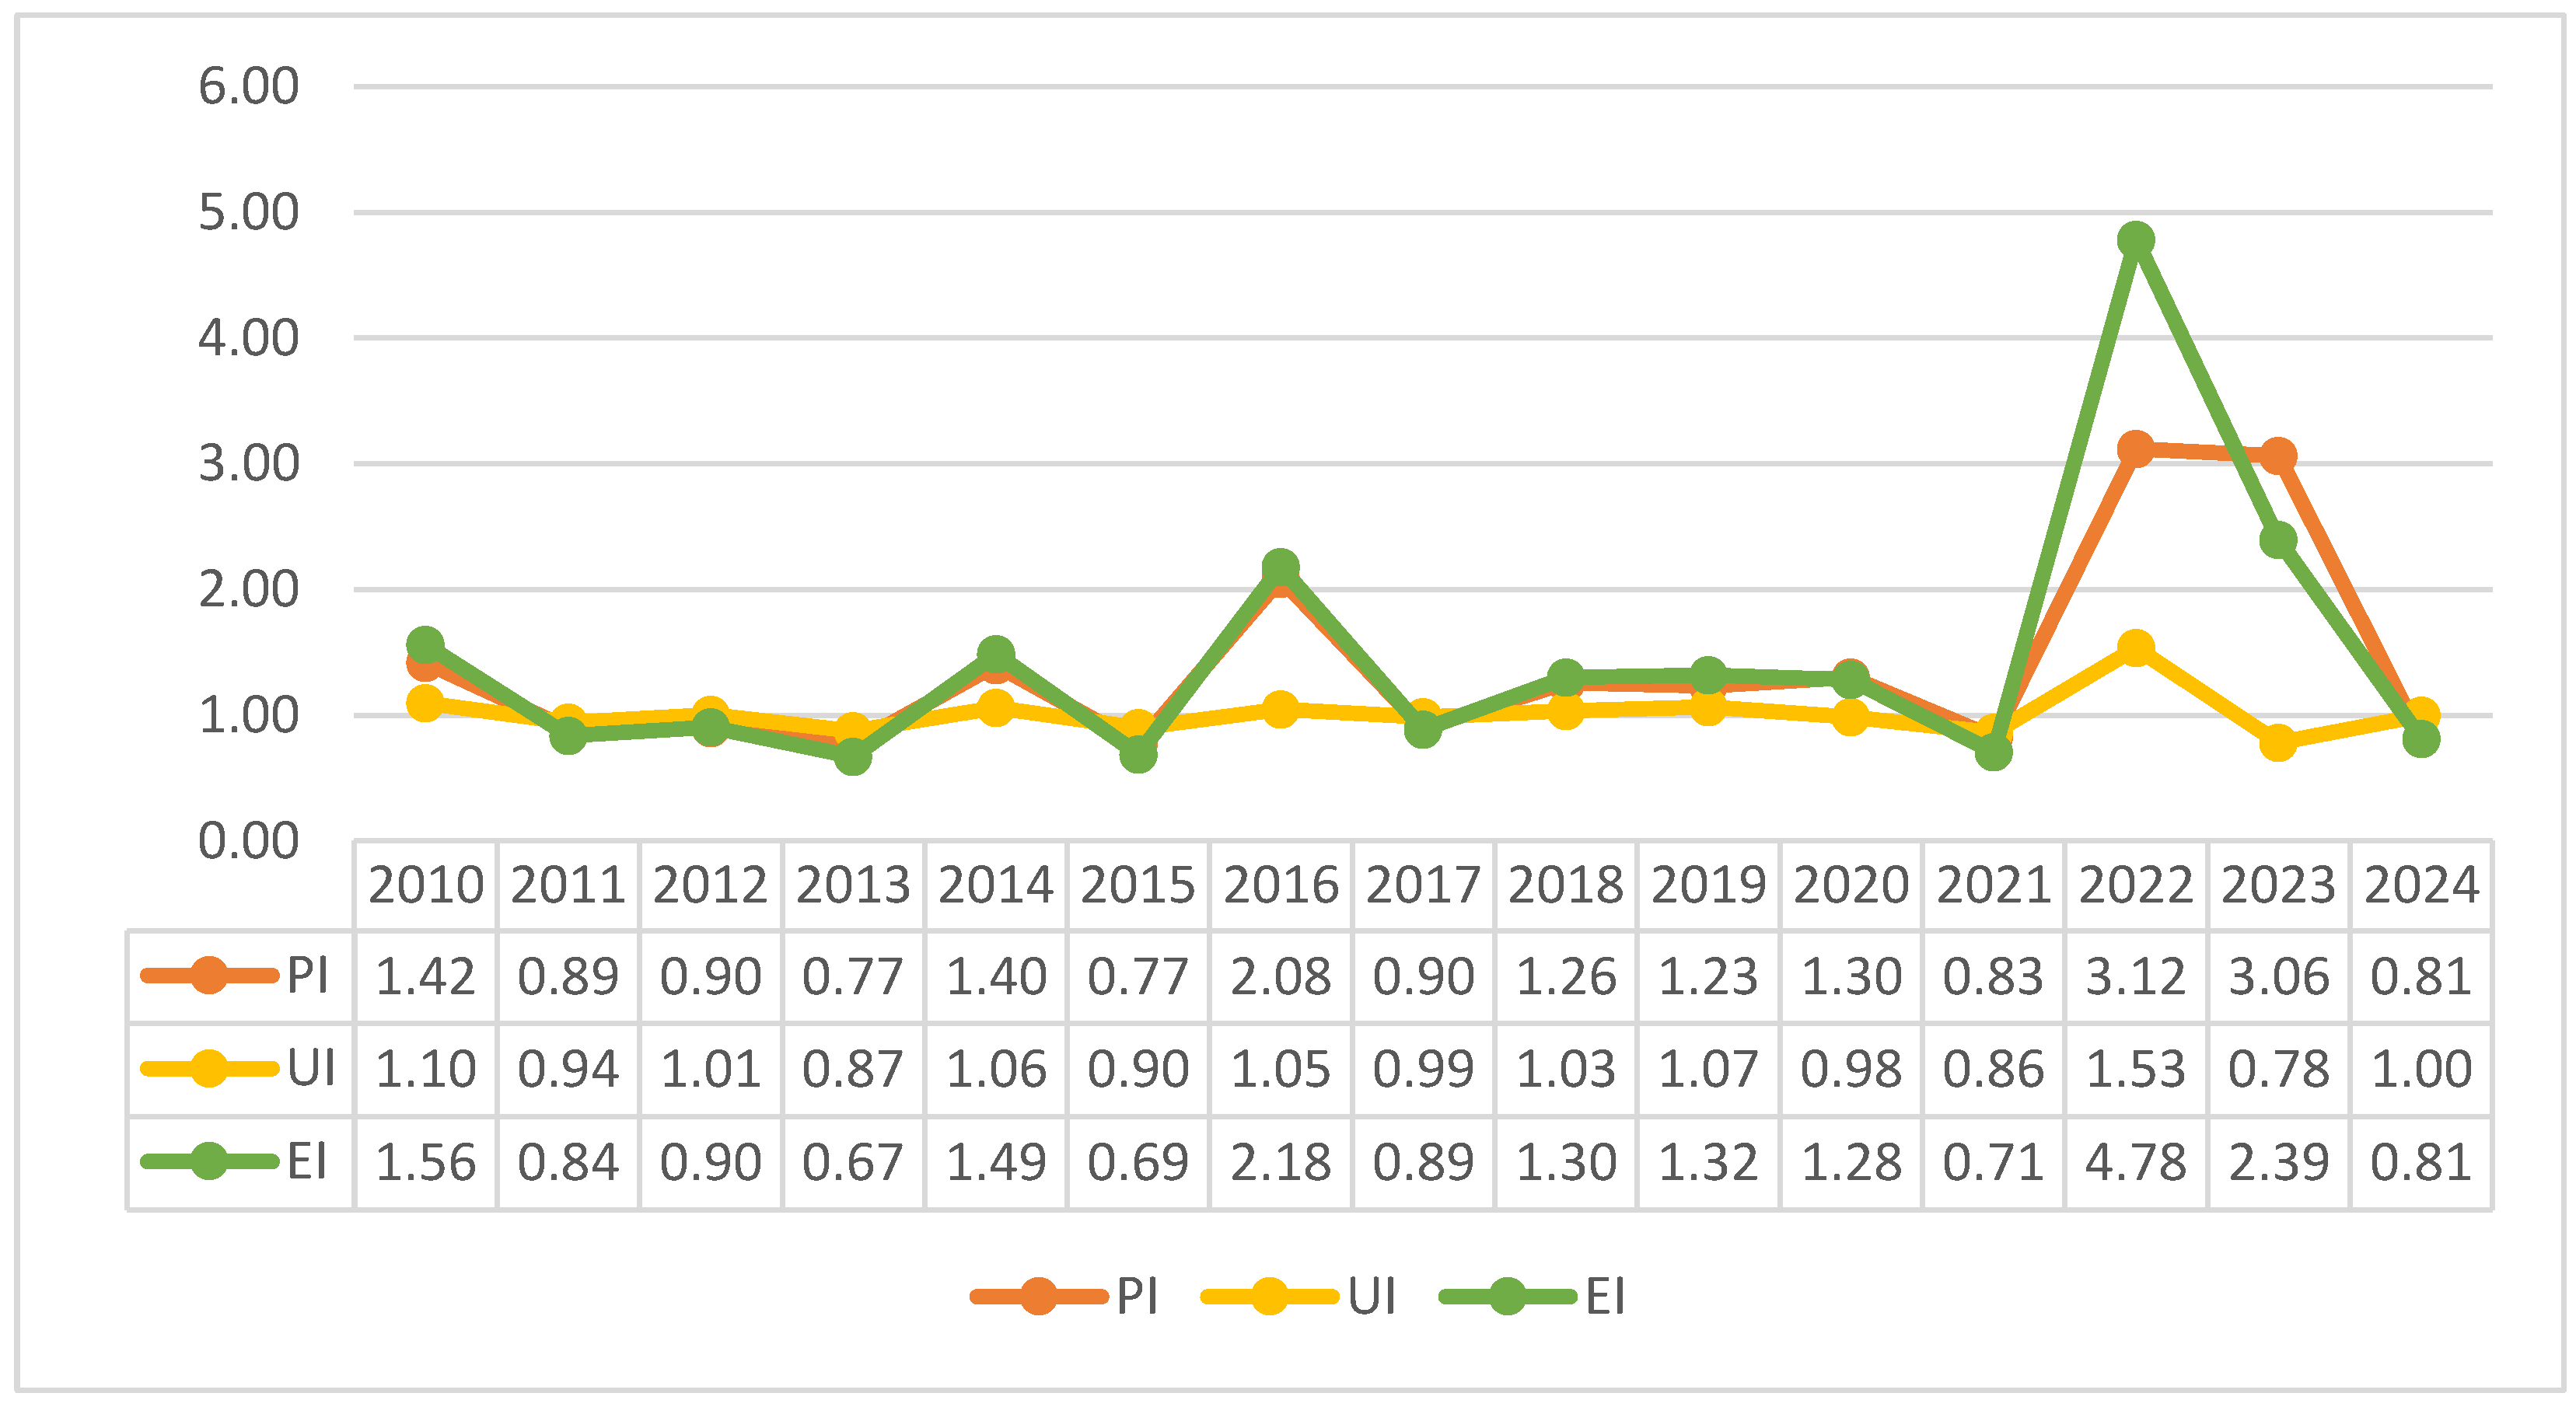
Figure 4.
Index values of the entire sector by year.
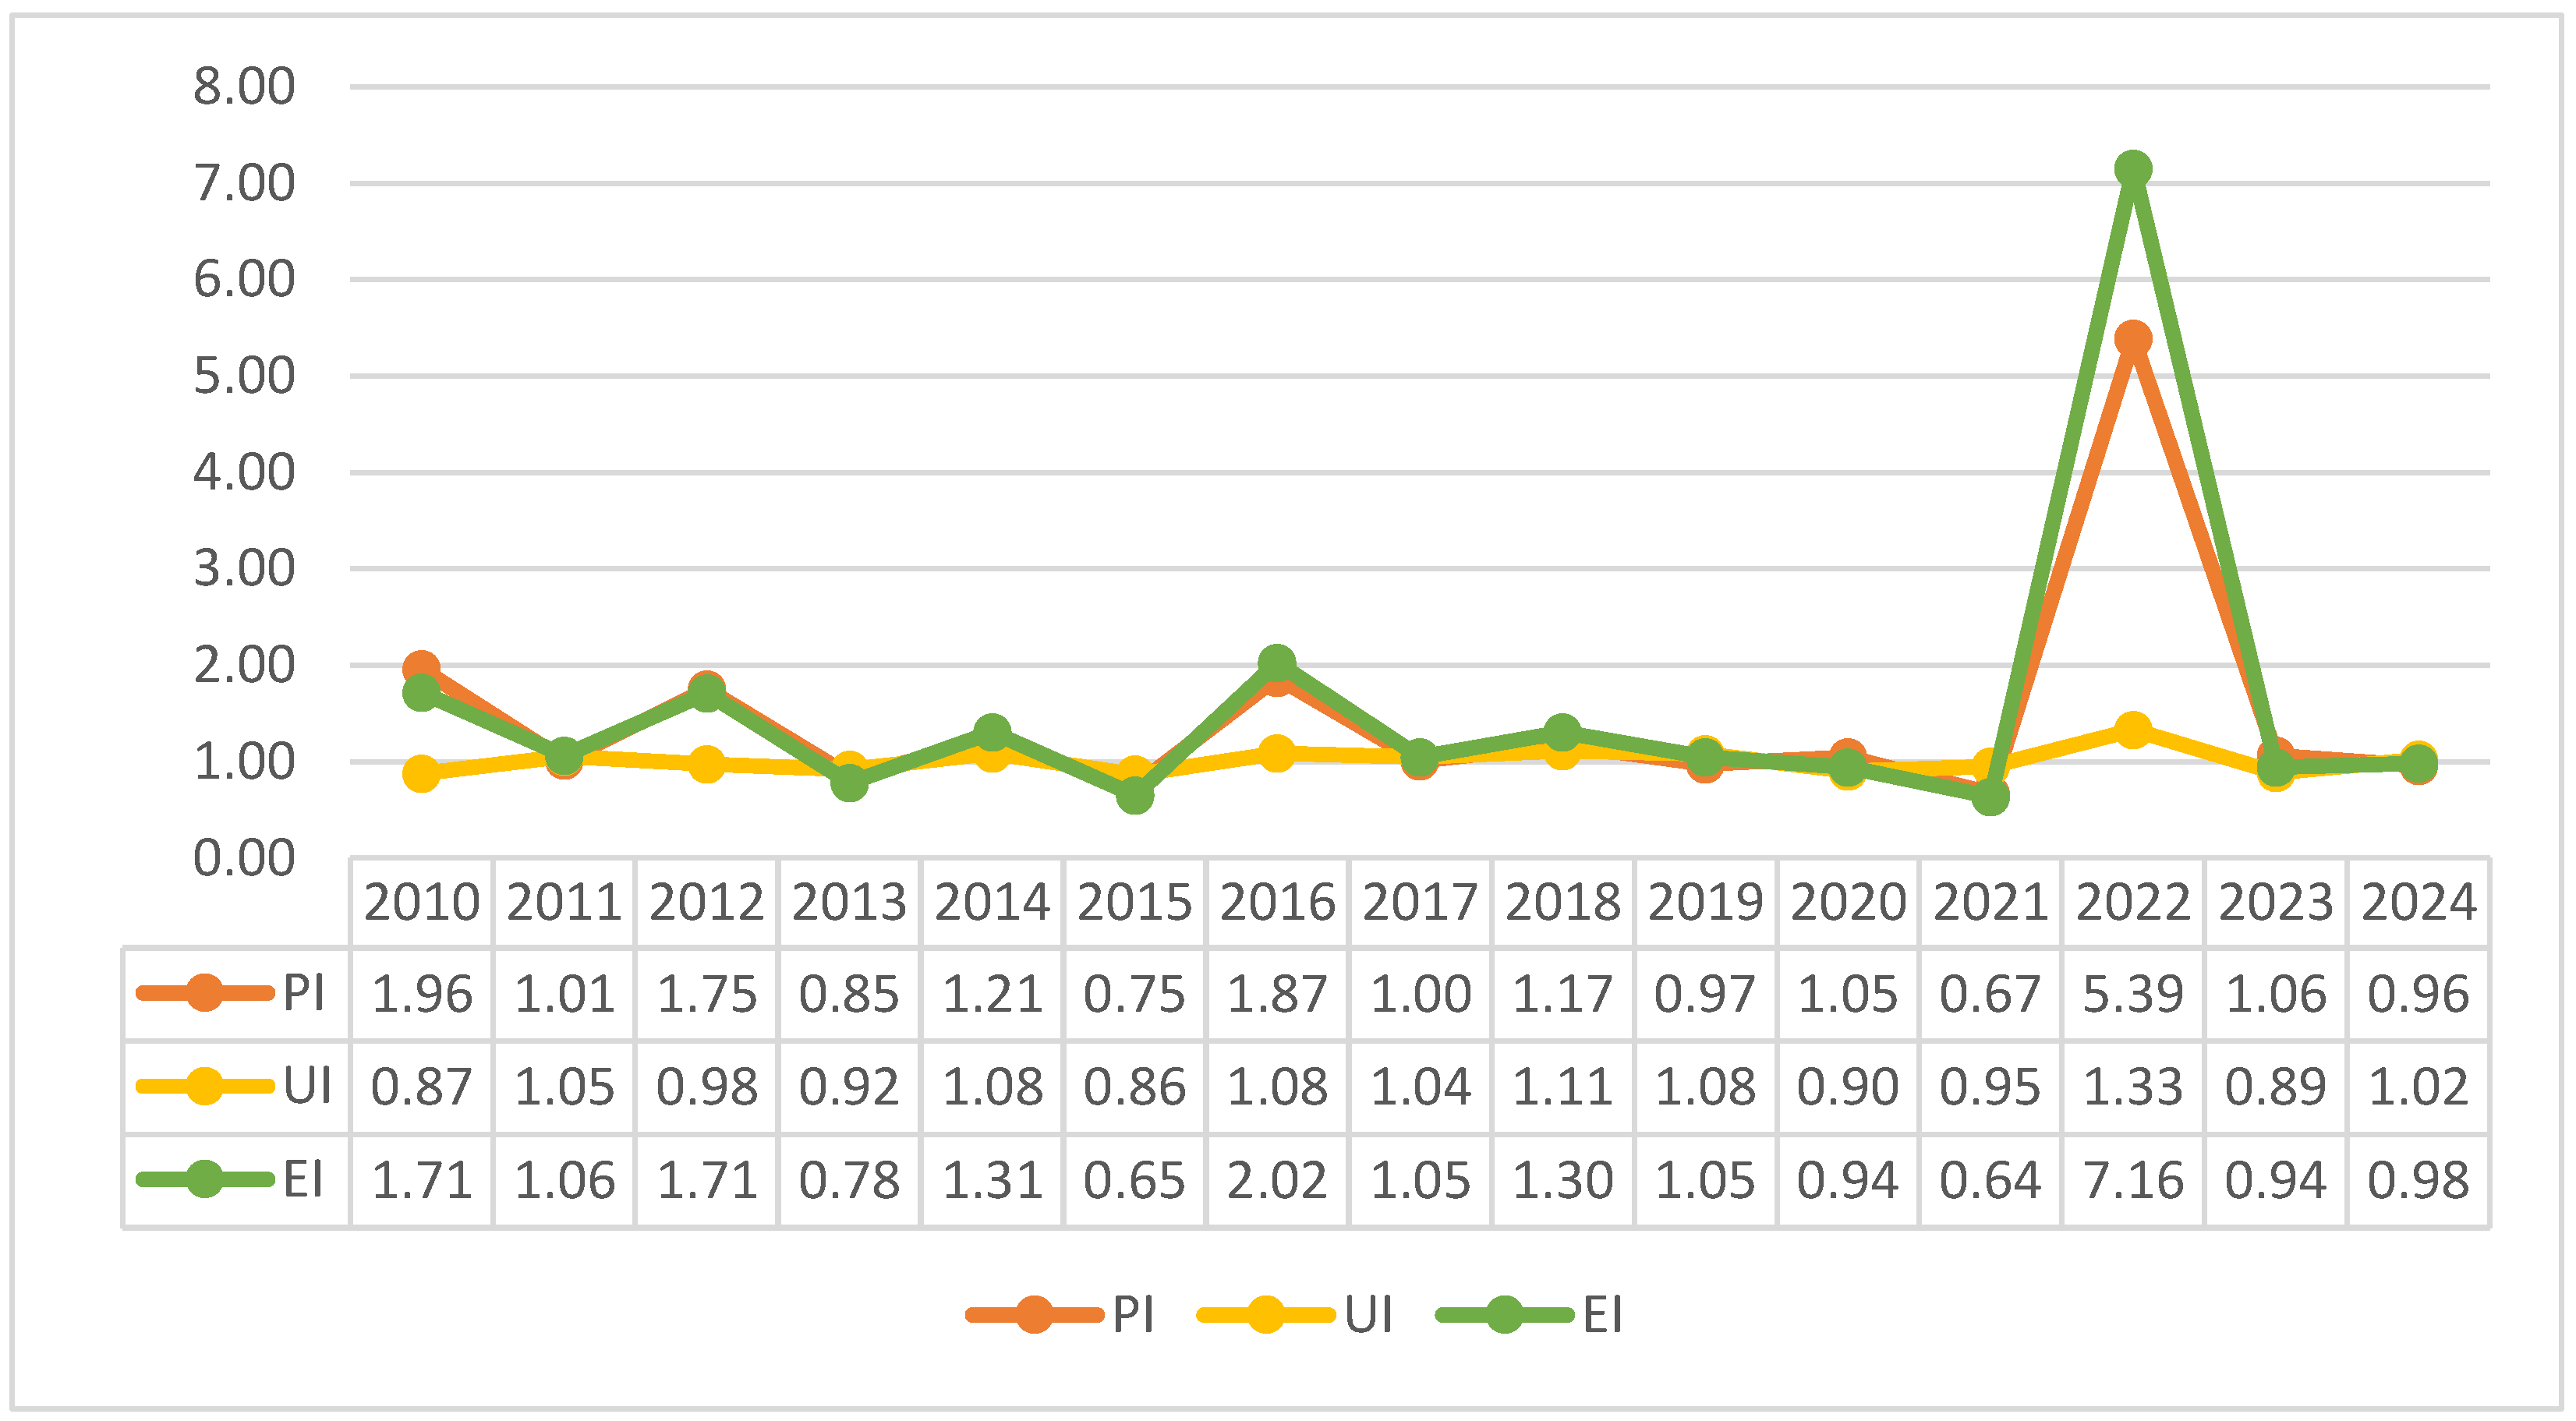
Table 1.
Information about the sector.
| Size | Companies | Number of Employees | Net Sales | Total Assets | |||
| Number | % | Thousands ₺ | % | Thousands ₺ | % | ||
| Micro | 966 | 86.2 | 1687 | 3269750.1 | 19.3 | 2371377.8 | 16.4 |
| Small | 130 | 11.6 | 1827 | 4902895.0 | 28.9 | 4024793.4 | 27.8 |
| Medium | 21 | 1.9 | 1051 | 3464043.8 | 20.4 | 3285617.9 | 22.7 |
| Large | 4 | 0.4 | 391 | 5348907.1 | 31.5 | 4772270.6 | 33.0 |
| Total | 1,121 | 100 | 4,956 | 16985596.0 | 100 | 14454059.7 | 100 |
Table 2.
Descriptive statistics of index values for micro-scale companies.
| Min | Max | Average | >1 | |
| PI | 0.63 | 3.42 | 1.37 | 10 |
| UI | 0.81 | 1.84 | 1.06 | 7 |
| EI | 0.54 | 4.08 | 1.55 | 9 |
Table 4.
Descriptive statistics for index values for the entire sector.
| Min | Max | Average | >1 | |
| PI | 0.67 | 5.39 | 1.44 | 10 |
| UI | 0.86 | 1.33 | 1.01 | 8 |
| EI | 0.64 | 7.16 | 1.55 | 9 |
Disclaimer/Publisher’s Note: The statements, opinions and data contained in all publications are solely those of the individual author(s) and contributor(s) and not of MDPI and/or the editor(s). MDPI and/or the editor(s) disclaim responsibility for any injury to people or property resulting from any ideas, methods, instructions or products referred to in the content. |
© 2025 by the authors. Licensee MDPI, Basel, Switzerland. This article is an open access article distributed under the terms and conditions of the Creative Commons Attribution (CC BY) license (http://creativecommons.org/licenses/by/4.0/).
Copyright: This open access article is published under a Creative Commons CC BY 4.0 license, which permit the free download, distribution, and reuse, provided that the author and preprint are cited in any reuse.


