
Submitted:
12 June 2024
Posted:
12 June 2024
You are already at the latest version
Abstract
This study aims to evaluate the financial performance of SOEs in Indonesia and compare it with private companies using financial ratio analysis and efficiency analysis approaches. Four construction sector SOEs were evaluated, and five private companies were compared using financial data from 2015 to 2022. The financial ratio analysis used the Peterson (2013) approach, while the efficiency analysis employed the data envelopment analysis (DEA) approach and the paired t-test. The study results show that the financial ratio performance of state-owned companies is relatively poor, with low profitability, critical liquidity, and a high debt ratio. Debt, as a source of capital in financing construction projects, makes companies face a greater debt risk. This study validates that SOEs have lower efficiency compared to private companies.
Keywords:
construction industry
; debt
; efficiency
; financial performance
; state-owned enterprises (SOEs)
1. Introduction
As a developing country, Indonesia is accelerating infrastructure development to boost the national economy. This infrastructure growth is supported by the state-owned and private-owned construction sectors (Anggraini & Febrianty, 2022). Recently, government construction companies (SOEs) in Indonesia have experienced financial difficulties since the COVID-19 pandemic. The large number of government projects has increased the operational burden of SOEs, resulting in increased debt levels. SOEs consist of four significant issuers, namely PT Adhi Karya (Persero) Tbk (ADHI), PT Housing Development (Persero) Tbk (PTPP), PT Waskita Karya (Persero) Tbk (WSKT), and PT Wijaya Karya (Persero) Tbk (WIKA).
In their operations, SOEs face challenges that negatively impact their financial performance, such as negative net income growth, high debt-to-equity ratios, and suboptimal financial ratios. This study aims to evaluate the financial condition of SOEs in Indonesia and compare them with private companies using the financial ratio analysis approach as conducted by Vibhakar et al. (2023), as well as efficiency analysis as researched by Dae-Woon & Kyung-Rai (2023). Poor financial health is a crucial aspect affecting these companies’ sustainability and their role as a critical foundation in Indonesia’s infrastructure development.
The deterioration in the condition of BUMN Karya began with the realization of investment and income, which tended to decline significantly. The realization of SOEs’ investment has declined due to the transfer of investment assets, coupled with the condition of SOEs’ net income, which experienced a drastic decline since 2018 and grew slowly from 2020 to 2022 (Figure 1). The decline in SOEs’ net income has also been exacerbated by the demands of government projects, which have increased the company’s operating expenses (Nur & Woestho, 2022).
The next obstacle is the problem of debt settlement. The high level of debt in BUMN Karya has caused the debt-to-equity ratio (DER) to increase sharply. Compared to other construction companies, SOEs have the highest DER level. Negative short-term sentiment and SOE debt restructuring plans are the main drivers of the problem (BEI, 2023). Furthermore, regarding return on assets (ROA), SOEs show lower performance than their competitors. This illustrates that the returns generated have not been effective in achieving good profitability.
In addition, the above indicates that a high level of short-term debt is the cause of the decline in the company’s financial performance. Jayiddin et al. (2017) stated that the short-term debt ratio has a significant negative relationship with the performance of construction companies in Malaysia. As is known, construction companies in Malaysia in 2010-2014 had a high debt ratio, making them more vulnerable to bankruptcy risk due to fluctuations in interest rates. In addition, Hamid et al. (2015) also stated that the debt ratio has a significant negative relationship with company profitability. Companies that use more debt cause erosion of company profits (Baharuddin et al., 2015). Especially at this time, most construction companies are too dependent on bank debt, which contains greater risk. Excessive dependence on the banking system can increase the instability of the entire financial system (Wang, 2023).
The management of corporate debt must be adjusted to the nominal debt and the income generated or the assets owned by the company, ensuring that the company can repay the debt and interest at maturity. BUMN companies, in the face of debt pressure, often restructure debt (Putri & Putri, 2024). It is essential for management always to maintain an optimal level of debt and prevent financial distress (Adhi & Alfarisi, 2019).
The impact of the COVID-19 pandemic, coupled with massive government projects, has caused SOEs to be increasingly burdened in financing their operations. Competition with private companies is also a significant challenge for SOEs. The market share of government-owned construction companies has decreased. Increasing price competition with competing companies and a lack of technical experience in some sectors have contributed to the erosion of SOEs’ market share.
The condition of SOEs that are experiencing fundamental problems must be corrected immediately, given the critical role of SOEs in achieving the government’s vision for infrastructure development to improve real sector efficiency, provide transportation facilities, support economic growth, and equitable national development (Asian Development Bank, 2020; Utomo et al., 2022). In addition, competition with other companies now competing in digitalization and technological innovation also puts pressure on SOEs. Therefore, improving operational efficiency and strengthening technical capacity are crucial for the sustainability and competitiveness of SOEs in the construction sector.
Financial challenges and problems in SOEs must be prevented with comprehensive strategies and policies. Financial evaluation applied by SOEs is a critical element in maintaining production and financing efficiency, which will increase the competitiveness of companies in the sector while enabling adaptation to the dynamics of the evolving construction business ecosystem. Strategic planning needs to be based on analyzing and mapping the sources of the company’s financial woes. This is necessary to ensure that the policies to be implemented will not miss the real focus. Therefore, evaluating the financial performance of construction SOEs is crucial.
This study will evaluate the financial performance of construction SOEs using construction financial ratio analysis according to Peterson (2013) and data envelopment analysis (DEA) efficiency analysis. In this study, private companies are also included for comparison. A paired t-test will follow the efficiency estimation results from DEA to validate that there is a difference in efficiency between SOEs and private companies. Financial data are publicly available with a sample period from 2015 to 2022. The results of this financial performance evaluation are the first step to developing improvement strategies for stakeholders.
2. Literature Review
Financial ratio analysis is used to evaluate a company’s position in the industry and other companies to assess the company’s performance over some time. This analysis is also considered helpful for measuring the performance of managers and departments and projecting future performance trends of the company for relevant stakeholders (El-Kholy & Akal, 2021). Studies on financial ratio analysis, such as those conducted by Vibhakar et al. (2023), analyzed the financial ratios of 100 construction companies in India over ten years (2008–2017) using factor analysis to classify financial ratios as important sub-factors for construction companies. Five critical financial ratio factors were identified: investor returns, business efficiency, operations management, activity efficiency and risk coverage, and asset management. In a global context, similar research is often conducted, such as in the study of Emin et al. (2007) and Chong et al. (2013).
In Indonesia, research on financial ratio analysis of construction companies was conducted by Daryanto et al. (2021) by measuring financial ratios before and during the COVID-19 pandemic using the Altman Z-Score approach. The results showed that PT PP had lower liquidity, solvency, profitability, and activity ratios during the pandemic. Research by Afriza & Daryanto (2019) examined the financial ratios of construction SOEs in Indonesia based on the reference of the Decree of the Minister of SOEs Number KEP-100/MBU/2002 and found that construction SOEs in Indonesia were in a stable and good financial condition in 2011–2015. Meanwhile, research by Muhammad and Rahadi (2023) analyzed financial ratios in construction sector SOEs and concluded that all SOEs experienced a decline in financial performance during the 2019–2021 period.
This study uses a different analytical point of view by utilizing Peterson’s financial ratio approach to measure construction companies’ good and bad financial ratios. Peterson’s (2013) financial ratios focus on several unique aspects explicitly designed for the construction industry, which differ significantly from typical accounting practices due to the unique nature of construction projects. Accounting practices in the construction industry must adapt to the specific requirements of long-term contracts, where revenue recognition is often linked to completion percentage. This is particularly important as it affects the financial reporting and health of the construction company throughout the project (Zadorozhnyi & Ometsinska, 2020).
Managing construction company finances requires a project-based approach, considering each project’s unique costs and schedules. This involves detailed cost tracking and forecasting, critical to maintaining profitability and managing cash flow effectively (Sowmya & Malisetty, 2023). The construction industry requires a specialized approach to cost accounting to handle the direct and indirect costs associated with construction projects. This is difficult because costs must be allocated to specific projects and can vary significantly between projects (Bozgulova & Adisetty, 2023). These aspects underscore the need for specialized accounting and financial management techniques in construction, comprehensively discussed in Peterson (2013), to meet the sector’s unique challenges.
In terms of efficiency analysis, this study follows Dae-Woon & Kyung-Rai (2023), who used DEA to analyze the efficiency of 520 construction firms from 2017–2021. Their findings showed significant scale-related inefficiencies, suggesting the need for these firms to reduce production factors. The concrete construction sector was much more efficient than other sectors. The COVID-19 pandemic contributed to a temporary drop in efficiency in 2020, followed by a partial recovery in 2021. The study also reported a notable decline in operating profit efficiency in 2021. The study emphasizes that specialized construction companies must improve efficiency by managing input factors more effectively, especially in light of rising raw material prices.
In the Indonesian context, recent research by Sukandar et al. (2018) on the efficiency of the construction industry in Indonesia also used DEA for the period 2010–2016. The results showed that state-owned companies were more efficient than private companies. This is due to the large number and value of projects from the government in the infrastructure sector. This study shows that companies with many projects, significant revenues (sales), and low costs are more efficient. Therefore, private firms should get more projects and larger project values, including from government projects.
In this study, financial ratio analysis and efficiency analysis were carried out on state-owned companies in the construction sector and private companies as a relative comparison, so this study is comparative to private companies in the research period. In addition, this study is also comparative with previous studies that used different research periods. In analyzing efficiency using DEA, this study continued with a different test between the efficiency of SOEs and the private sector using a paired t-test for statistically more robust validation.
3. Data Sources and Methods
3.1. Data and Research Variables
This study uses two main variables: financial ratio variables for financial ratio analysis and input-output variables for efficiency analysis (Appendix A). There are 68 observations in the financial ratio analysis from 2015 to 2022, which are obtained from the financial statements of each construction company. The population of this study is construction companies in Indonesia, with a sample consisting of nine construction companies with the largest capitalization, which includes four state-owned construction companies and five private construction companies (Appendix B). The data is taken from the annual financial statements published by each company.
3.2. Financial Ratio Analysis
The financial ratio analysis in this study uses the Peterson (2013) approach. Peterson’s approach was chosen because it provides comprehensive coverage for analyzing the company’s financial performance through various relevant financial ratios. Peterson’s financial ratios in this study include:
- Liquidity ratio: Measures a company’s ability to meet its short-term obligations. This ratio is essential to assess the health of the company’s liquidity and ensure it has enough current assets to cover its current liabilities. The liquidity ratio proxies in this study are the quick and current ratios.
- Profitability ratios Assess a company’s ability to generate profits relative to its sales, assets, and equity. This ratio measures operational efficiency and the company’s ability to provide profits to shareholders. The profitability ratio proxies in this study are gross profit margin (GPM), asset turnover (ATPM), return on assets, and return on equity (ROE).
- Debt or leverage ratio: This ratio measures a company’s capital structure, specifically how much it relies on debt to fund its assets. Understanding this ratio is essential to understanding financial risk and the company’s ability to manage its long-term obligations. The debt ratio proxies in this study are current liabilities to net working capital (CLNWR), debt to equity ratio (DER), and accounts payable to receivables ratio (APRR).
This analysis uses Benchmark financial ratios for the construction industry as a reference (Appendix C).
3.3. Efficiency Analysis
This study uses the data envelopment analysis (DEA) approach and paired t-test for efficiency analysis. DEA is a non-parametric linear programming-based method used to calculate the efficiency of a decision-making unit (DMU) by modeling the complex relationship between inputs and outputs. DEA constructs efficient bounds on the data and calculates the efficiency of each DMU relative to those bounds. DEA efficiency indicates the extent to which a DMU is ahead of its peers and represents its ability to convert many inputs into many outputs (Saini et al., 2023).
DEA uses two main models for efficiency analysis (Saini et al., 2023):
- CCR (Charnes-Cooper-Rhodes) Model: The basic DEA model that assumes Constant Return to Scale (CRS) (Charnes et al., 1978). This model is suitable when the scale of DMU operations does not affect efficiency, i.e., proportional input changes will result in proportional output changes. Assuming CRS, the CCR model calculates overall technical efficiency.
- BCC (Banker-Charnes-Cooper) Model: A model that assumes Variable Return to Scale (VRS) (Banker et al., 1984). This model is used when the scale of DMU operations affects efficiency, i.e., proportional input changes do not necessarily result in proportional output changes. The BCC model makes it possible to measure pure technical efficiency by considering different scales of operation.
This study uses the CCR model with CRS assumptions and an input-oriented approach. This model was chosen for several reasons. First, the CCR model provides a more straightforward approach to efficiency analysis, assuming that the scale of DMU operations does not affect efficiency. This aligns with the research objective of assessing the overall technical efficiency between SOEs and the private sector without considering variations in the scale of operations. Finally, the ease of implementation of the CCR model makes it easier to implement and understand, especially in the context of research involving many input and output variables, allowing for a more direct calculation of efficiency.
The input-oriented CCR model is formulated as follows:
With constraints:
Where:
- θ is the efficiency score sought.
- xij is the sum of the i-th input of DMU j.
- yrj is the sum of the rth output of DMU j.
- xio and yro is the sum of the i-th input and r-th output of the evaluated DMU.
- λj is a decision variable that shows the relative weight of DMU j.
Using this formulation, DEA compares the DMU under evaluation with a linear combination of other DMUs to determine its efficiency at converting inputs into outputs. If θ = 1, the DMU is considered efficient. If θ < 1, the DMU is considered inefficient.
Seo & Choi (2011) used DEA to analyze the efficiency of construction companies in Korea, with inputs in the form of total assets, selling and administrative expenses, and total debt, as well as outputs in the form of total revenue and operating profit. Then, Sukandar et al. (2018) used inputs in the form of construction costs per m^2 of building, capital, total operating costs, and debt, and outputs in the form of sales (revenue), EBIT, and net profit in analyzing the efficiency of construction companies in Indonesia. Debt is an input for construction companies because the total capital structure of each construction company can generally be financed through equity capital or debt capital, each of which has its advantages and disadvantages. Debt capital can be considered the cheapest source of funding, but on the other hand, debt capital that is too excessive can significantly increase the financial risk of the company (Mohammed, 2007). This study does not use debt as an input. However, debt can be reflected in the company’s total assets, where the construction company’s assets are financed by debt (Utamaningsih & Muharis, 2020).
To validate the real difference in efficiency results between state-owned and private construction companies, this study used a two-sample paired t-test. This test aims to determine whether there is a significant difference between two interrelated groups (Manfei et al., 2017).
The steps of the two-sample paired t-test are as follows:
-
Hypothesis:
- Null Hypothesis (H0): There is no difference in average efficiency between state-owned and private construction companies.
- Alternative Hypothesis (H1): There is a difference in average efficiency between state-owned and private construction companies.
- 2.
- The t-test formula:
- is the average difference of the sample pairs.
- sd is the standard deviation of the difference of the sample pairs.
- n is the number of sample pairs.
- 3.
-
Test Decision:
- If the calculated t value exceeds the critical t value, reject H0.
- If the calculated t value is less than or equal to the critical t value, fail to reject H0.
Using a two-sample paired t-test, this study was able to determine whether there is a significant difference in efficiency between state-owned and private construction companies.
4. Research Results
4.1. Liquidity Ratio
Table A4 (Appendix D) shows that all SOEs have quick ratio and current ratio values below the industry average. Compared to private companies, most SOEs have lower quick ratio values. Meanwhile, the current ratio value of SOE companies is similar to that of private companies, except for JKON.
Based on Figure 2, the majority of state-owned companies from 2015–2021 have a quick ratio and current ratio trend that tends to be negative, where the lowest quick ratio and current ratio values occur in 2020–2021. Meanwhile, in 2020–2021, the quick and current ratios in most private companies have shown a positive trend. In addition, the figure also shows that the current ratio of BUMN companies tends to be more stable than the private sector.
4.2. Profitability Ratio
Table A5 (Appendix E) shows that almost all SOEs have GPM and ROA values below the industry average. The majority of the sample of SOE construction companies have ATPM values above the industry average. Private companies’ GPM, ATPM, ROA, and ROE values (except ACST) are higher than those of state-owned companies.
Based on Figure 3, all state-owned and private companies experienced a decline in ROA and ROE in 2020. However, private companies experienced a more significant decline in ROA than SOEs. The state-owned company WSKT and the private company ACST experienced the most significant decline in ROE.
4.3. Leverage Ratio
Table A6 (Appendix F) shows that SOEs have CLNWR values above the industry average and APRR values below the industry average. Compared to the private sector, SOEs tend to have higher CLWR, DER, and APRR values than most private companies.
Based on Figure 4, from 2015–2021, state-owned companies tend to experience increased CLNWR values. On the other hand, all private companies experienced a decrease in CLNWR values from 2020 to 2021, and some continued to decline until 2022. The DER value of private companies (except ACST) tends to be more stable than SOEs. BUMN companies tend to experience an increase in DER value, where the highest DER value occurs in WSKT companies, especially in 2020. Meanwhile, the DER value of private companies tends to decrease from 2020 to 2021.
When looking at the four state-owned companies, PTPP and WIKA are mostly superior in all financial ratios during 2015–2022 (Appendix 8). WSKT excels in GPM, but with high GPM, WSKT cannot obtain high ATPM, ROA, and ROE. WSKT’s DER level is the highest among other companies. This indicates that WSKT’s debt burden erodes the GPM obtained.
4.4. Efficiency Analysis with DEA
The input value of BUMN companies, which consists of revenue cost, operating expenses, and total assets, has a higher average than the input of private companies, likewise with the output in the form of revenue generated. Input distribution data with high standard deviation and max-min values show that construction companies in Indonesia exhibit a relatively high level of diversity.

Table 1.
Description of inputs and outputs of state-owned and private construction companies.
| Input | Output | |||||||
|---|---|---|---|---|---|---|---|---|
| Cost of Revenue (Billion IDR) | Operating Expenses (Billion IDR) | Total Assets (Billion IDR) |
Revenue (Billion IDR) |
|||||
| SOE | Private | SOE | Private | SOE | Private | SOE | Private | |
| Mean | 16946 | 2423 | 1638 | 265 | 55624 | 3681 | 19737 | 2833 |
| Median | 14295 | 2227 | 1125 | 193 | 51805 | 3236 | 16325 | 2629 |
| Stand dev | 7367 | 1318 | 1332 | 169 | 29781 | 2006 | 9160 | 1555 |
| Minimum | 8415 | 226 | 395 | 93 | 16761 | 819 | 9390 | 413 |
| Maximum | 39926 | 5231 | 5433 | 786 | 124392 | 10447 | 48789 | 6040 |
Figure 5 shows the average efficiency of state-owned and private construction companies in Indonesia under Constant Return to Scale (CRS) conditions during 2015–2022. Both state-owned and private construction companies have relatively high-efficiency values. However, this efficiency value is relative to the company with the highest efficiency value, BUKK.
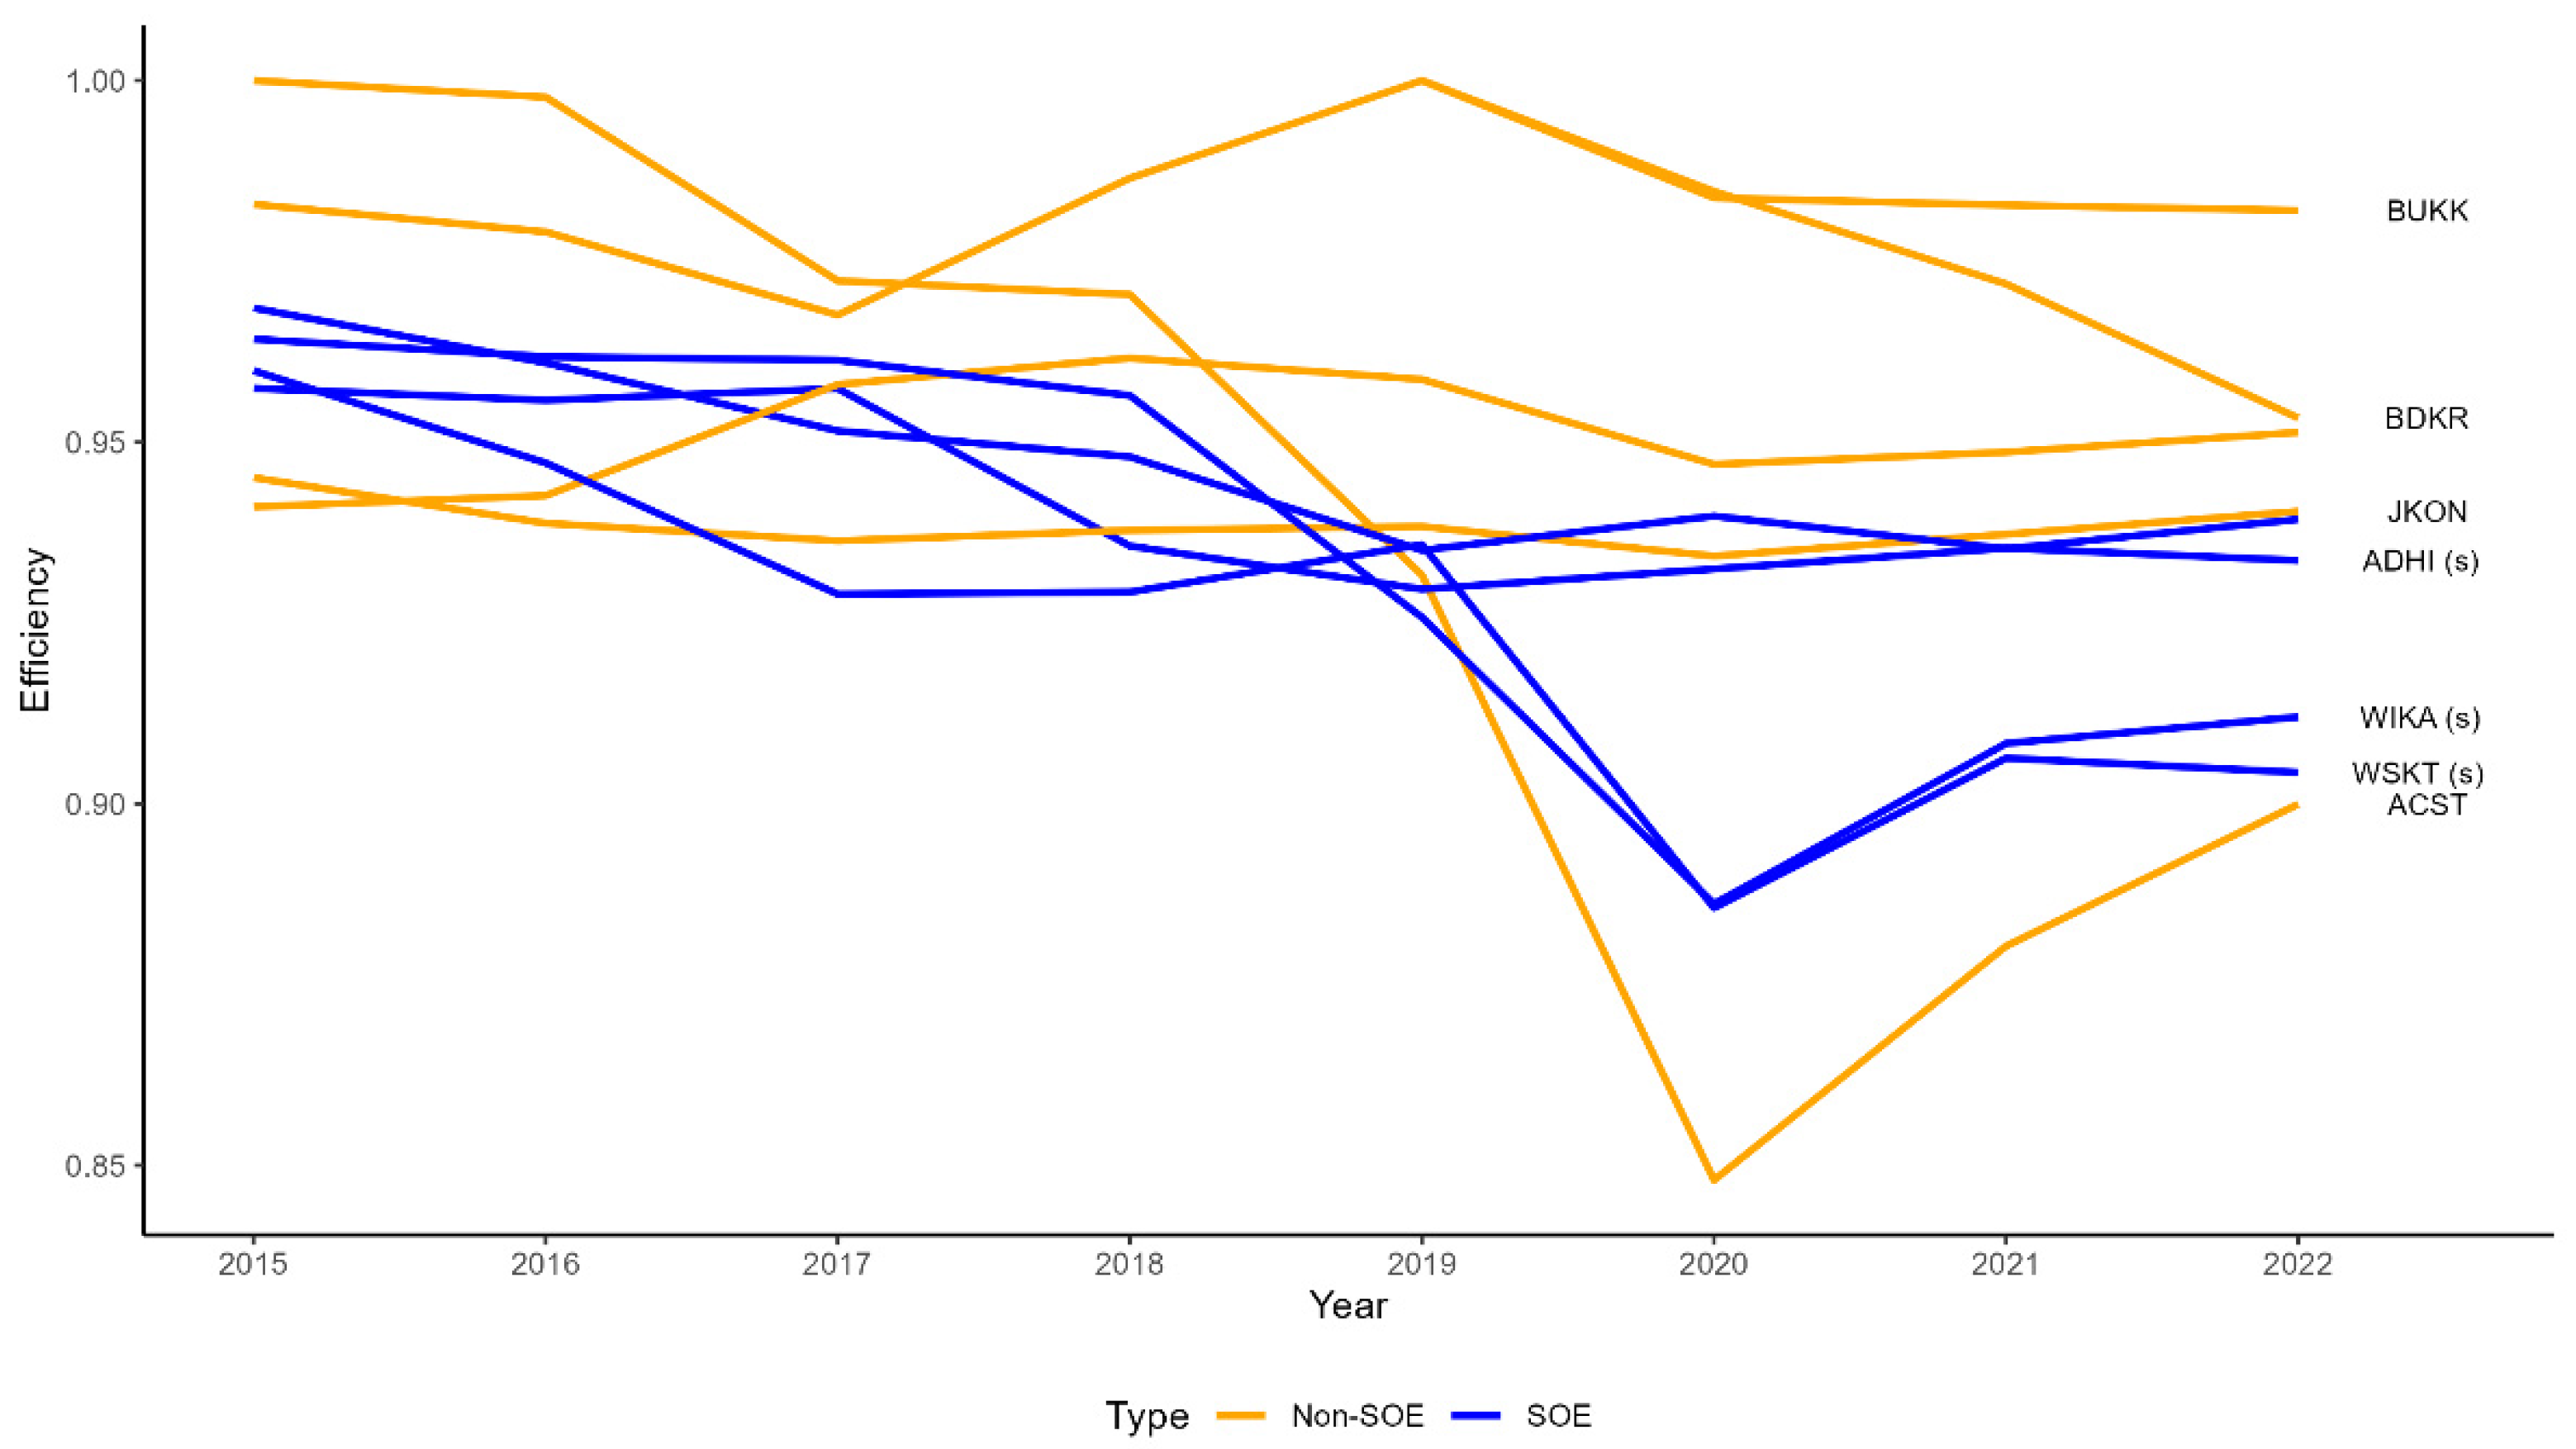
Based on Figure 6, it can be seen that private companies (except ACST) have higher efficiency than state-owned companies. State-owned companies such as WIKA and WSKT experienced a significant decline in efficiency in 2020. The same thing happened to all private companies. However, the efficiency scores of SOEs and private companies started improving in 2021. The lower efficiency of SOEs compared to the private sector is validated through the t-test with a value of $$ t = -2.701 $$ and $$ p\text{-value} = 0.008916 $$, meaning there is enough evidence to reject the null hypothesis or there is a significant difference in the efficiency of the two groups.
5. Discussion and Conclusion
The performance of financial ratios of state-owned construction companies through the measurement of profitability, liquidity, and solvency (leverage) ratios based on Peterson’s (2013) construction sector financial ratio goodness measure shows that the four state-owned construction companies have poor performance. This is in line with Utamaningsih & Muharis (2020), where the evaluation of solvency and liquidity shows that BUMN companies are less able to use their debt to finance all their assets, as well as their low ability to pay their debts. State-owned construction companies have experienced a decline in financial performance, especially during the COVID-19 pandemic in Indonesia (Muhammad & Rahadi, 2023). Continuous analysis of a firm’s liquidity, profitability, capital structure, activity efficiency, profit margin, growth, and asset structure factors, as identified by Emin et al. (2007), provides sufficient information related to the relative state of the industry and each construction company concerning time and economic changes.
Low profitability in state-owned construction companies is caused by the large gap between gross profit margin and net profit margin, which is influenced by cost overruns for materials, equipment, subcontractors, and financial and administrative expenses (Utamaningsih & Muharis, 2020). High solvency indicates a significant dependence of SOE companies on debt to carry out their business activities, in contrast to private companies with lower debt levels (Sukandar et al., 2018). Too much debt than necessary can seriously increase the company’s interest costs. It can also lead to a sharp increase in the company’s financial risk. Therefore, the company’s debt burden greatly influences its financial stability (Mohammed, 2007). The more significant the portion of debt capital, the more likely the company is to experience the risk of bankruptcy (Van Horne, 1983).
Short-term loans are the leading indicator of operational funding for state-owned construction companies, leading to high loan interest expenses and eroding profitability. Short-term loans pose a greater risk to the company than long-term funding. This happens because the interest costs will fluctuate more so that the risk of inability to repay the debt is greater (Brigham & Lous, 1994). The proportion of bank debt to the total liabilities of state-owned construction companies is quite significant, such as WSKT at 56.5%, PTPP at 30.6%, and ADHI at 33.5%. In addition to loans, the companies also have trade payables to suppliers and subcontractors. Liquidity ratios close to 0 or negative indicate that state-owned construction companies are in critical cash condition. In contrast, private companies with lower DER indicate a more conservative and sustainable financial strategy in the long term (Megawati, 2023; Septian et al., 2021).
This study also shows that state-owned construction companies have a relatively low-efficiency level compared to private construction companies. The performance gap between SOEs and private companies is often attributed to inefficiencies in using inputs to produce outputs (Soetanto & Fun, 2014). Significant assets and revenue do not necessarily increase efficiency, mainly if financed by high debt (Sufian & Shah Habibullah, 2010). Nevertheless, research by Sukandar et al. (2018) revealed that state-owned construction companies are more efficient than private companies. This is due to the government’s availability of many projects of value. State-owned companies with high debt are still efficient because they have an excellent income value from government projects.
The five business segments of state-owned construction companies (infrastructure, building, energy, industry, and investment) show that efficient input allocation is essential to produce profitable outputs. However, poor performance in some business segments suggests inefficiencies in resource allocation (Utamaningsih & Muharis, 2020). For example, WIKA experienced negative profits in the investment and property segments, while ADHI experienced significant losses in the rail and infrastructure construction segments.
Overall, state-owned construction companies need more capital to finance their projects and business operations, as evidenced by high debt levels and low revenues. The government needs to find new sources of capital or financing schemes that can ease the burden on companies in managing government projects. In addition, companies should implement a focused strategy to optimize profitable business segments and carry out business transformation to avoid further losses.
Limited cash liquidity affects the selection of market segments and project investments. Factors such as technical capabilities, experience in each value chain stage, and the ability to act as a leader or supporter are also vital considerations. In the current situation, the business focus should be limited to each phase with the following strategies: 1) Accelerate the collection of receivables and strengthen liquidity through debt restructuring, accelerated collectibility, additional capital deposits, and divestment; 2) Avoid unnecessary investments; 3) Focus on asset recycling; 4) Improve project efficiency.
This study reveals the financial performance of state-owned construction companies and compares them with private construction companies using only secondary data, so the details of the analysis are only superficial. To understand the problem of SOE construction performance in more depth, it is necessary to conduct further analysis through strategic studies on all SOE construction companies. A strategic management study with primary data collection could address the shortcomings of this research and provide more comprehensive insights.
6. Summary
This study shows that state-owned construction companies in Indonesia experience poor financial performance, with low profitability, critical liquidity, and high debt ratios. Reliance on short-term debt and high-interest expenses have eroded the firms’ profitability. Unlike private companies, SOEs show lower efficiency in using assets and resources. To address these issues, the government and companies must seek innovative capital solutions and implement strategies to focus on profitable business segments. Business transformation is also needed to improve SOE construction companies’ efficiency and financial performance.
Appendix A
Table A1.
List of variables used.
| No. | Variables |
|---|---|
| Financial Ratio Variables | |
| 1 | Quick Ratio (QR) |
| 2 | Current Ratio (CR) |
| 3 | Gross Profit Margin (GPM) |
| 4 | After Tax Profit Margin Ratio (ATPM) |
| 5 | Return on Asset (ROA) |
| 6 | Return on Equity (ROE) |
| 7 | Current Liabilities to Net Worth Ratio (CLNWR) |
| 8 | Debt to Equity Ratio (DER) |
| 9 | Account Payable to Revenue Ratio (APRR) |
| Input-Output Variables | |
| 1 | Revenue (Output) |
| 2 | Operating Expenses (Input) |
| 3 | Cost of Revenue (Input) |
| 4 | Total Assets (Input) |
Appendix B
Table A2.
Sample list of construction companies.
| Company | Description |
|---|---|
| ACST | PT Acset Indonusa Tbk |
| ADHI(s) | PT Adhi Karya (Persero) Tbk |
| BDKR | PT Berdikari Pondasi Perkasa Tbk |
| BUKK | PT Bukaka Teknik Utama Tbk |
| JKON | PT Jaya Konstruksi Manggala Pratama Tbk |
| PTPP(s) | PT Housing Development (Persero) Tbk |
| TOTL | PT Total Bangun Persada Tbk |
| WIKA(s) | PT Wijaya Karya (Persero) Tbk |
| WSKT (s) | PT Waskita Karya (Persero) Tbk |
Appendix C
Table A3.
Benchmark financial ratios.
| No. | Ratio | Industry Average | Range |
|---|---|---|---|
| 1 | Quick Ratio (QR) | 1.2 | 0.6–1.9 |
| 2 | Current Ratio (CR) | 1.5 | 1.2–2.8 |
| 3 | Gross Profit Margin (GPM) | 16% | |
| 4 | After Tax Profit Margin Ratio (ATPM) | 1.9% | 0.5%–8.1% |
| 5 | Return on Asset (ROA) | 5.6% | 1.5%–21% |
| 6 | Return on Equity (ROE) | 15.1% | 4.2%–53% |
| 7 | Current Liabilities to Net Worth Ratio (CLNWR) | 123% | 38%–259% |
| 8 | Debt to Equity Ratio (DER) | 140% | 50%–280% |
| 9 | Account Payable to Revenue Ratio (APRR) | 8.2% | 3.1%–13.3% |
Appendix D
Table A4.
Average liquidity ratio of state-owned and private construction companies.
| Liquidity Ratio | ||||
|---|---|---|---|---|
| Company | Quick Ratio | Benchmark | Current Ratio | Benchmark |
| ACST | 0.26 | Average:1,2 Range: 0.6-1.9 |
1.23 | Average:1.5 Range: 1,2-2,8 |
| ADHI(s) | 0.36 | 1.27 | ||
| BDKR | 0.98 | 1.24 | ||
| BUKK | 0.5 | 1.22 | ||
| JKON | 0.9 | 1.68 | ||
| PTPP(s) | 0.56 | 1.32 | ||
| TOTL | 0.82 | 1.39 | ||
| WIKA | 0.51 | 1.29 | ||
| WSKT | 0.33 | 1.16 | ||
Description: (s): state-owned company.
Appendix E
Table A5.
Average profitability ratio of state-owned and private construction companies.
| Profitability Ratio | ||||||||
|---|---|---|---|---|---|---|---|---|
| Company | GPM | Benhc-mark | ATPM | Benhcmark | ROA | Benchmark | ROE | Benchmark |
| ACST | -0.1 | Average: 16% | -27 | Average: 1,9% Range: 1,5%-8,1% |
-8.28 | Average: 5,6% Range: 1,5%-21% |
-99.44 | Average: 15,1% Range: 4,2%-53% |
| ADHI(s) | 13.73 | 2.62 | 1.48 | 6.5 | ||||
| BDKR | 46.18 | 14.05 | 5.62 | 10.61 | ||||
| BUKK | 16.95 | 8.79 | 8.59 | 16.74 | ||||
| JKON | 15.96 | 4.1 | 4.61 | 8.66 | ||||
| PTPP(s) | 14.16 | 3.96 | 2.31 | 9.63 | ||||
| TOTL | 14.3 | 6.92 | 5.68 | 17.08 | ||||
| WIKA(s) | 11.31 | 3.92 | 2.28 | 8.42 | ||||
| WSKT (s) | 14.84 | -4.07 | 1.02 | -3.64 | ||||
Description: (s): state-owned company.
Appendix F
Table A6.
Average leverage ratio of state-owned and private construction companies.
| Leverage Ratio | ||||||
|---|---|---|---|---|---|---|
| Company | CLNWR | Benchmark | DER | Benchmark | APRR | Benchmark |
| ACST | 7.09 | Average: 1,23 Range: 0.38–2.59 |
265.98 | Average: 140% Range: 5%-280% |
0.53 | Average: 0.082 Range: 0.031-0.133 |
| ADHI(s) | 3.37 | 130.2 | 0.73 | |||
| BDKR | 0.59 | 50.62 | 0.05 | |||
| BUKK | 0.76 | 34.83 | 0.1 | |||
| JKON | 0.63 | 23.13 | 0.07 | |||
| PTPP(s) | 1.84 | 97.7 | 0.75 | |||
| TOTL | 1.61 | 1.15 | 0.07 | |||
| WIKA(s) | 1.87 | 106.04 | 0.5 | |||
| WSKT (s) | 2.12 | 283.22 | 0.45 | |||
Description: (s): state-owned company.
References
- Adhi, H.; Alfarisi, M.F. Analysis of Factors Affecting Capital Structure/Leverage of Waskita Karya. ECONOMICA: Journal of Economic and Economic Education. 2019; 8, 46–50.
- Afriza, E.S.D.; Daryanto, W.M. Measuring and Comparing the Financial Performance of Construction Industry: An Indonesia Experience. International Journal of Business Economics and Law. 2019; Volume 19.
- Anggraini, P.; Febrianty, F. Analysis of the Company’s Financial Performance Using the Du Pont System in the Building Construction Sub-Sector on the Indonesia Stock Exchange. International Journal of Multidisciplinary Sciences and Arts 2022, 1. [CrossRef]
- Asian Development Bank. (2020, March). Building the Future of Quality Infrastructure. ADB Institute.
- Baharuddin, N.S.; Khamis, Z.; Mahmood WM, W.; Dollah, H. Determinants of capital structure for listed construction companies in Malaysia. Journal of Applied Finance and Banking, 2011; 1, 115.
- Banker, R.D.; Charnes, A.; Cooper, W.W. Some models for estimating technical and scale inefficiencies in data envelopment analysis. Management Science, 1984; 30, 1078–1092.
- BEI. (2023). Potential. Mergers and Mounting Debt of BUMN Karya. Https://Www.Idxchannel.Com/Market-News/Potential-Merger-and-Debt-Rising-Bumn-Karya/All.
- Bozgulova, N.A.; Adambekova, A.A. Cost Accounting in the Construction Industry. Central Asian Economic Review 2023, 6. [CrossRef]
- Brigham, E.F.; Lous, C. (1994). Garenski: Financial Management, Theory and Practice. The Dryden Press, Harcourt Brace College Publishers, New York.
- Charnes, A.; Cooper, W.W.; Rhodes, E. Measuring the efficiency of decision making units. European Journal of Operational Research, 1978; 2, 429–444.
- Chong, K.; Yap, B.; Mohamad, Z. A study on the application of factor analysis and the distributional properties of financial ratios of Malaysian companies. International Journal of Academic Research in Management (IJARM), 2013; 7.
- Dae-Woon, J.; Kyung-Rai, K. Efficiency Analysis of Specialty Construction Companies by Industry and Year Using DEA Model. Journal of the Architectural Institute of Korea 2023, 39. [CrossRef]
- Daryanto, W.M.; Iffah, M.; Mahardhika, R. Financial Performance Analysis of Construction Company Before and During Covid-19 Pandemic in Indonesia. International Journal of Business Economics and Law, 2021; 24.
- El-Kholy, A.M.; Akal, A.Y. Determining the stationary financial causes of contracting firms’ failure. International Journal of Construction Management 2021, 21. [CrossRef]
- Emin, Ö.M.; Oral, E.L.; Erdis, E.; Vural, G. Industry financial ratios-application of factor analysis in Turkish construction industry. Building and Environment 2007, 42. [CrossRef]
- Hamid, M.A.; Abdullah, A.; Kamaruzzaman, N.A. Capital structure and profitability in family and non-family firms: Malaysian evidence. Procedia Economics and Finance. 2015; Volume 31, pp. 44–55.
- Jayiddin, N.F.; Jamil, A.; Roni, S.M. Capital structure influence on construction firm performance. SHS Web of Conferences, 2017; 36, 25.
- Manfei, X.U.; Fralick, D.; Zheng, J.Z.; Wang, B.; Changyong, F. The differences and similarities between two-sample t-test and paired t-test. Shanghai Archives of Psychiatry, 2017; 29, 184.
- Megawati, N. (2023). Determinants of Capital Structure and Value of State-Owned and Non-State-Owned Construction Companies (Implementation Period of the Policy to Accelerate Infrastructure Development and the Covid-19 Pandemic Period).
- Mohammed, A.M.S. (2007). Debt capacity of construction companies in Egypt. Arab Academy for Science, Technology and Maritime Transport. College of Engineering and Technology.
- Muhammad, R.; Rahadi, R.A. Financial Performance Analysis and Financial Distress Prediction of Indonesia State-Owned Enterprises in The Construction Industry Listed on IDX Before and During Economic Crisis in the Covid-19 Pandemic Era (Period 2019—2021). International Journal of Current Science Research and Review 2023, 06. [CrossRef]
- Nur, A.P.; Woestho, C. Financial Performance Analysis Based on Financial Ratios Before and During the Covid-19 Pandemic. Journal of Development Economics STIE Muhammadiyah Palopo 2022, 8, 28. [CrossRef]
- Peterson, S.J. (2013). Construction accounting and financial management. (Vol. 2). Pearson Upper Saddle River, NJ.
- Putri, T.E.; Putri, S.A. Determinants of financial distress in construction sub-sector companies in Indonesia and Malaysia. Proceeding International Conference on Accounting and Finance, 2024; 319–334.
- Saini, A.; Truong, D.; Pan, J.Y. Airline efficiency and environmental impacts—Data envelopment analysis. International Journal of Transportation Science and Technology 2023, 12. [CrossRef]
- Seo, K.-K.; Choi, D.-Y. Efficiency analysis of construction firms using a combined AHP and DEA model. The Journal of the Korea Contents Association, 2011; 11, 302–310.
- Septian, R.; Ambat, R.E.; Yuswandono, M.; Zulpanani, A. Assessment of Financial Performance in Construction Services Business Entities. Potential: Polytechnic Civil Journal. 2021, 23, 120–127.
- Soetanto, T.V.; Fun, L.P. Performance evaluation of property and real estate companies listed on Indonesia Stock Exchange using data envelopment analysis. Journal of Management and Entrepreneurship, 2014; 16, 121–130.
- Sowmya, D.; Malisetty, A. A Study on Need of Robust Financial Management and Accounting System with Reference to Construction Industry. ComFin Research 2023, 11, 30–33. [CrossRef]
- Sufian, F.; Shah Habibullah, M. Developments in the efficiency of the Thai banking sector: a DEA approach. International Journal of Development Issues. 2010; Volume 9, pp. 226–245.
- Sukandar, B.M.; Achsani, N.A.; Sembel, R.; Sartono, B. Efficiency of Construction Companies in Indonesia. Mix: A Scientific Journal of Management 2018, 8, 628. [CrossRef]
- Utamaningsih, A.; Muharis, C. Evaluation of the Financial Performance of Bumn Construction Companies for the 2015–2018 Period. Scientific Journal of Civil Engineering 2020, 17. [CrossRef]
- Utomo, N.S.; Devi, S.S.; Siregar, H. Financial Performance Analysis of Construction State-Owned Enterprises Listed in Indonesia Stock Exchange During Covid-19. Journal of Islamic Economics and Finance, 2022; 6, 244–268.
- Van Horne, J.C. (1983). Financial management and policy. (Issue Ed. 6). Prentice-Hall, Inc.
- Vibhakar, N.N.; Tripathi, K.K.; Johari, S.; Jha, K.N. Identification of significant financial performance indicators for the Indian construction companies. International Journal of Construction Management 2023, 23, 13–23. [CrossRef]
- Wang, Z. Research on debt risk management and control of high liability enterprises. Academic Journal of Business & Management, 2023; 5, 44–50.
- Zadorozhnyi, Z.-M.; Ometsinska, I. Problematic aspects in accounting for financial performance in construction. Herald of Economics 2020, 3. [CrossRef]
Figure 1.
Net income of construction SOEs 2018–2022.
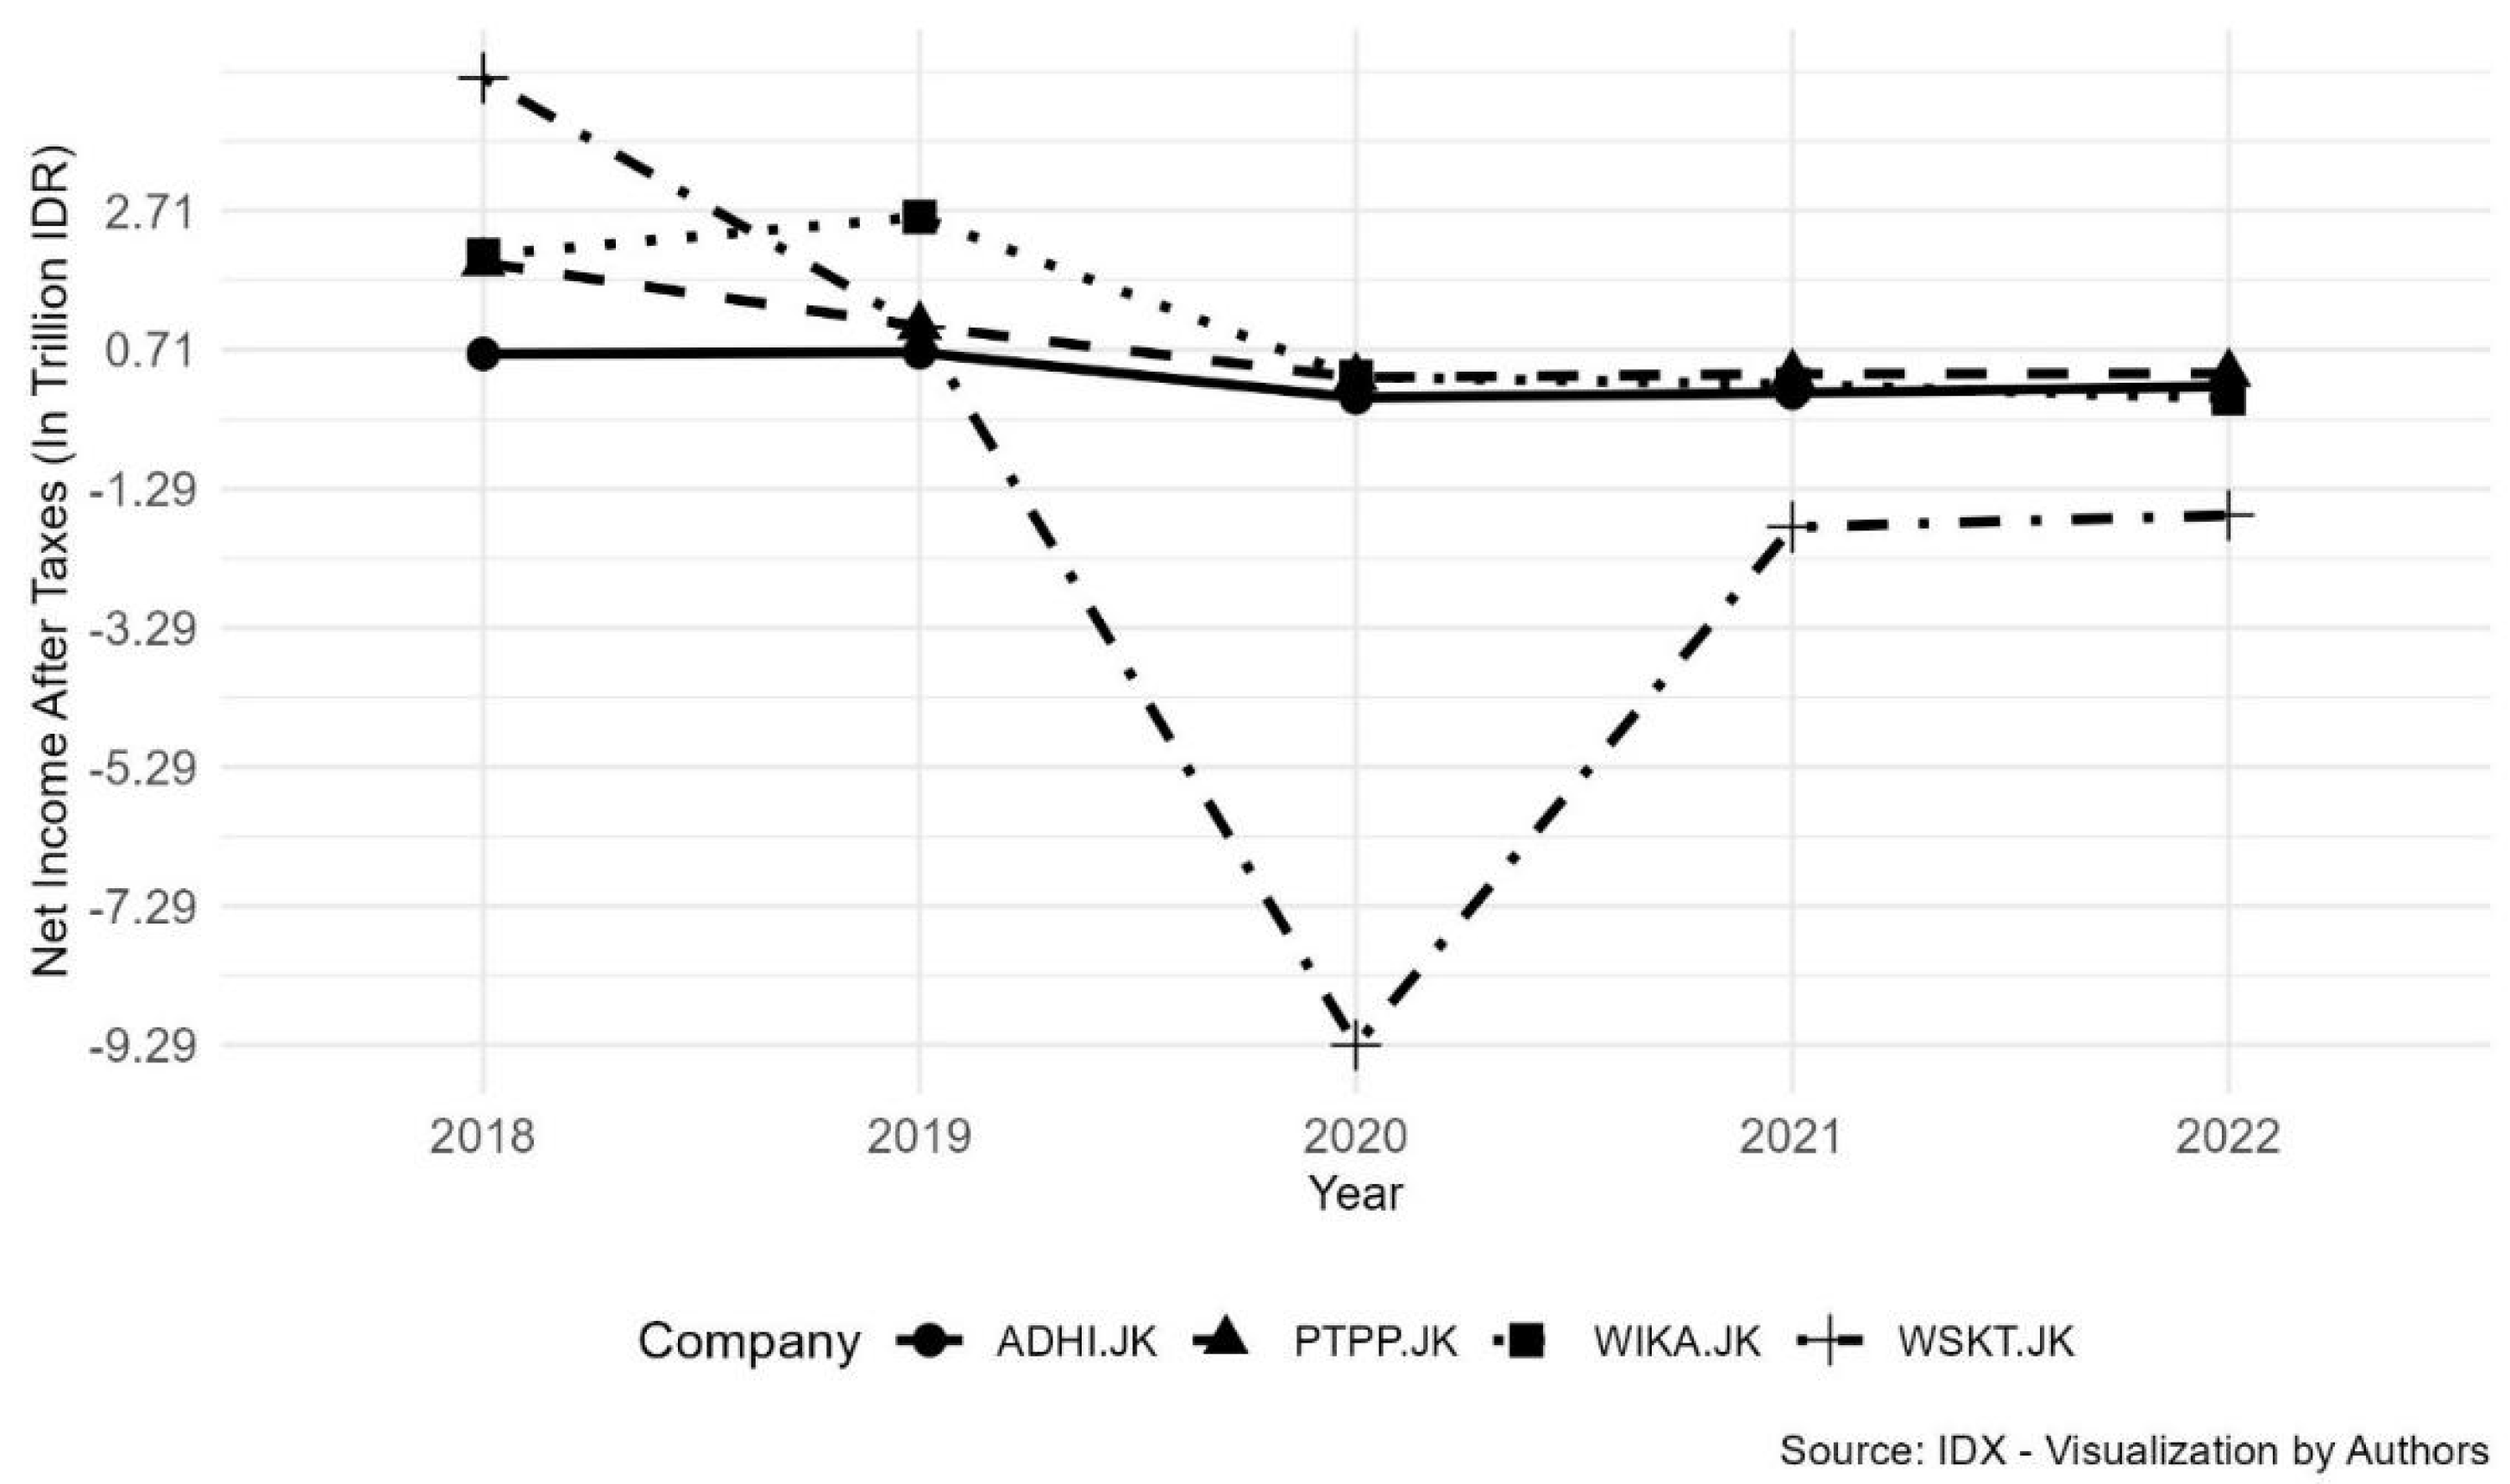
Figure 2.
(a) Quick ratio; (b) Current ratio of state-owned and private construction companies. The maximum value of the Peterson benchmark (top dot line), the average value of the Peterson benchmark (middle dot line), and the minimum value of the Peterson benchmark (bottom dot line).
Figure 2.
(a) Quick ratio; (b) Current ratio of state-owned and private construction companies. The maximum value of the Peterson benchmark (top dot line), the average value of the Peterson benchmark (middle dot line), and the minimum value of the Peterson benchmark (bottom dot line).
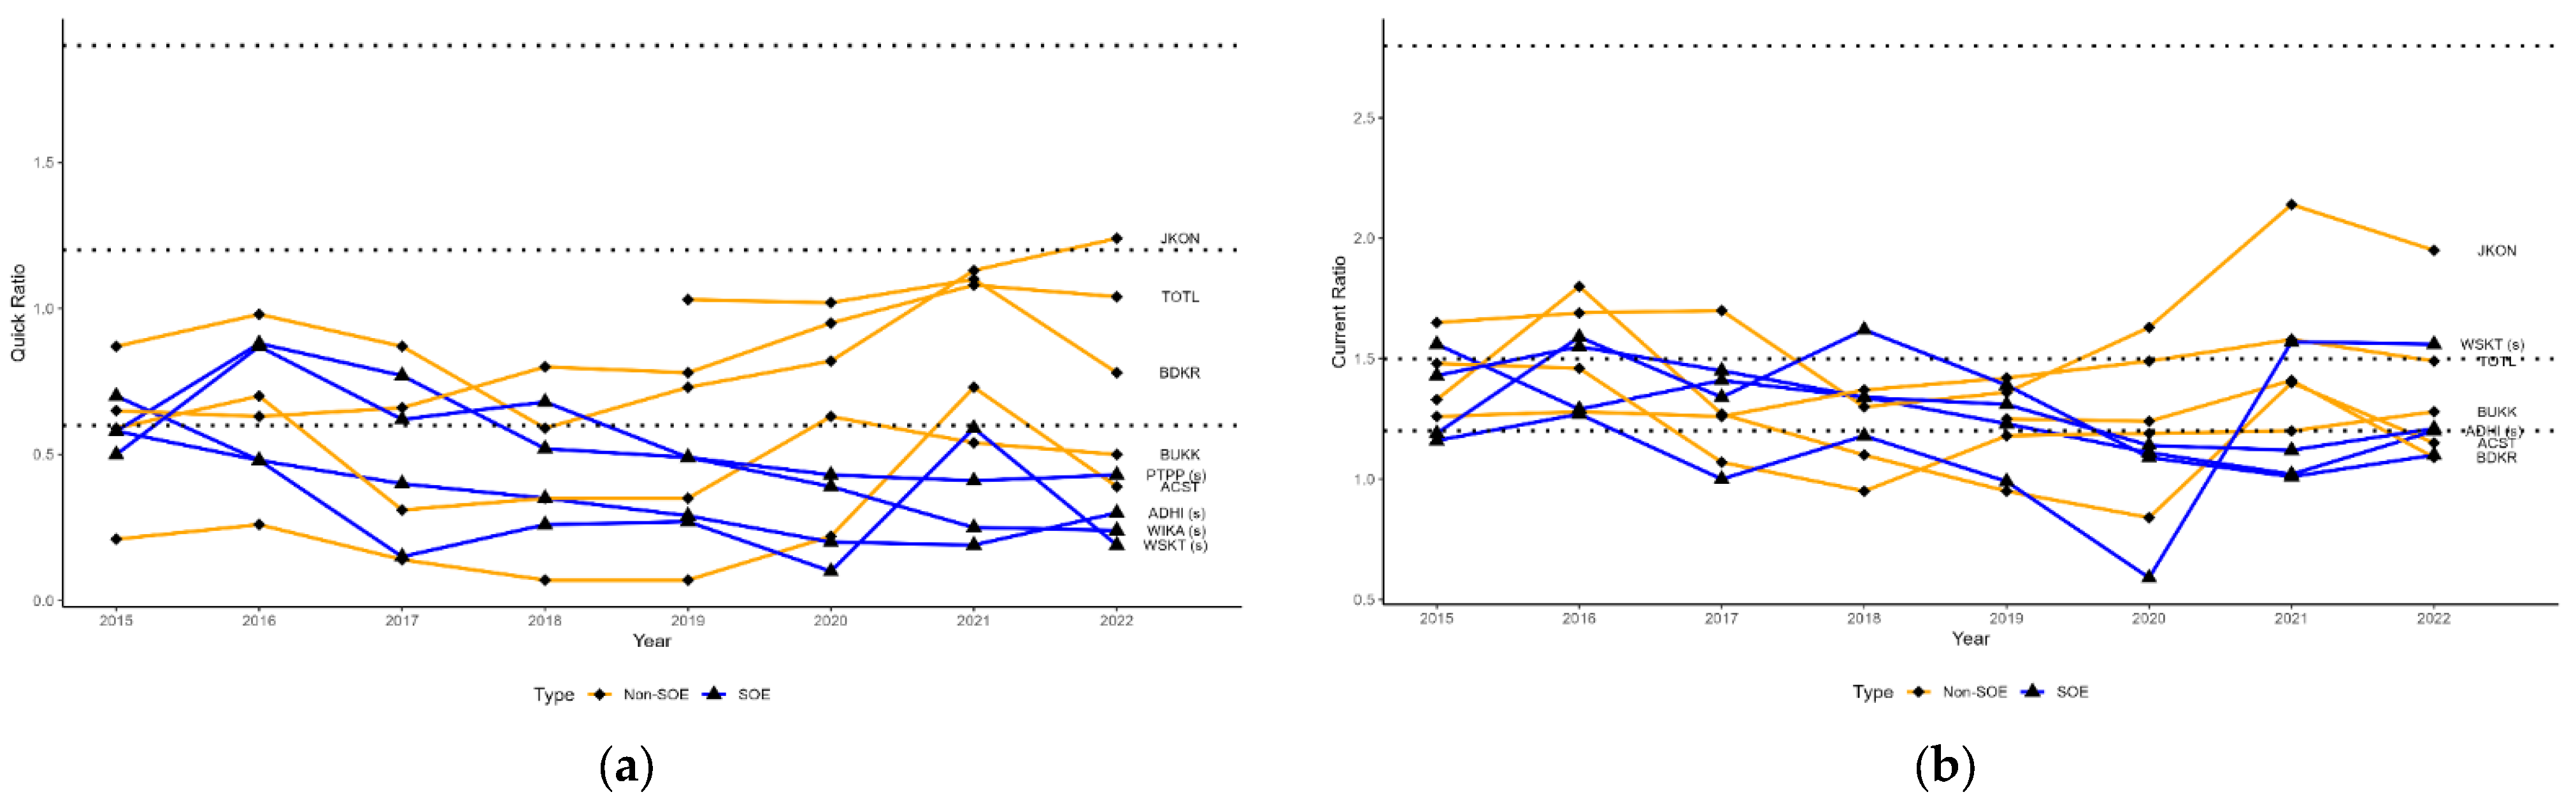
Figure 3.
(a) Trend of GPM; (b) ATPM; (c) ROA; (d) ROE of state-owned and private construction companies. The maximum value of the Peterson benchmark (top dot line), the average value of the Peterson benchmark (middle dot line), and the minimum value of the Peterson benchmark (bottom dot line).
Figure 3.
(a) Trend of GPM; (b) ATPM; (c) ROA; (d) ROE of state-owned and private construction companies. The maximum value of the Peterson benchmark (top dot line), the average value of the Peterson benchmark (middle dot line), and the minimum value of the Peterson benchmark (bottom dot line).
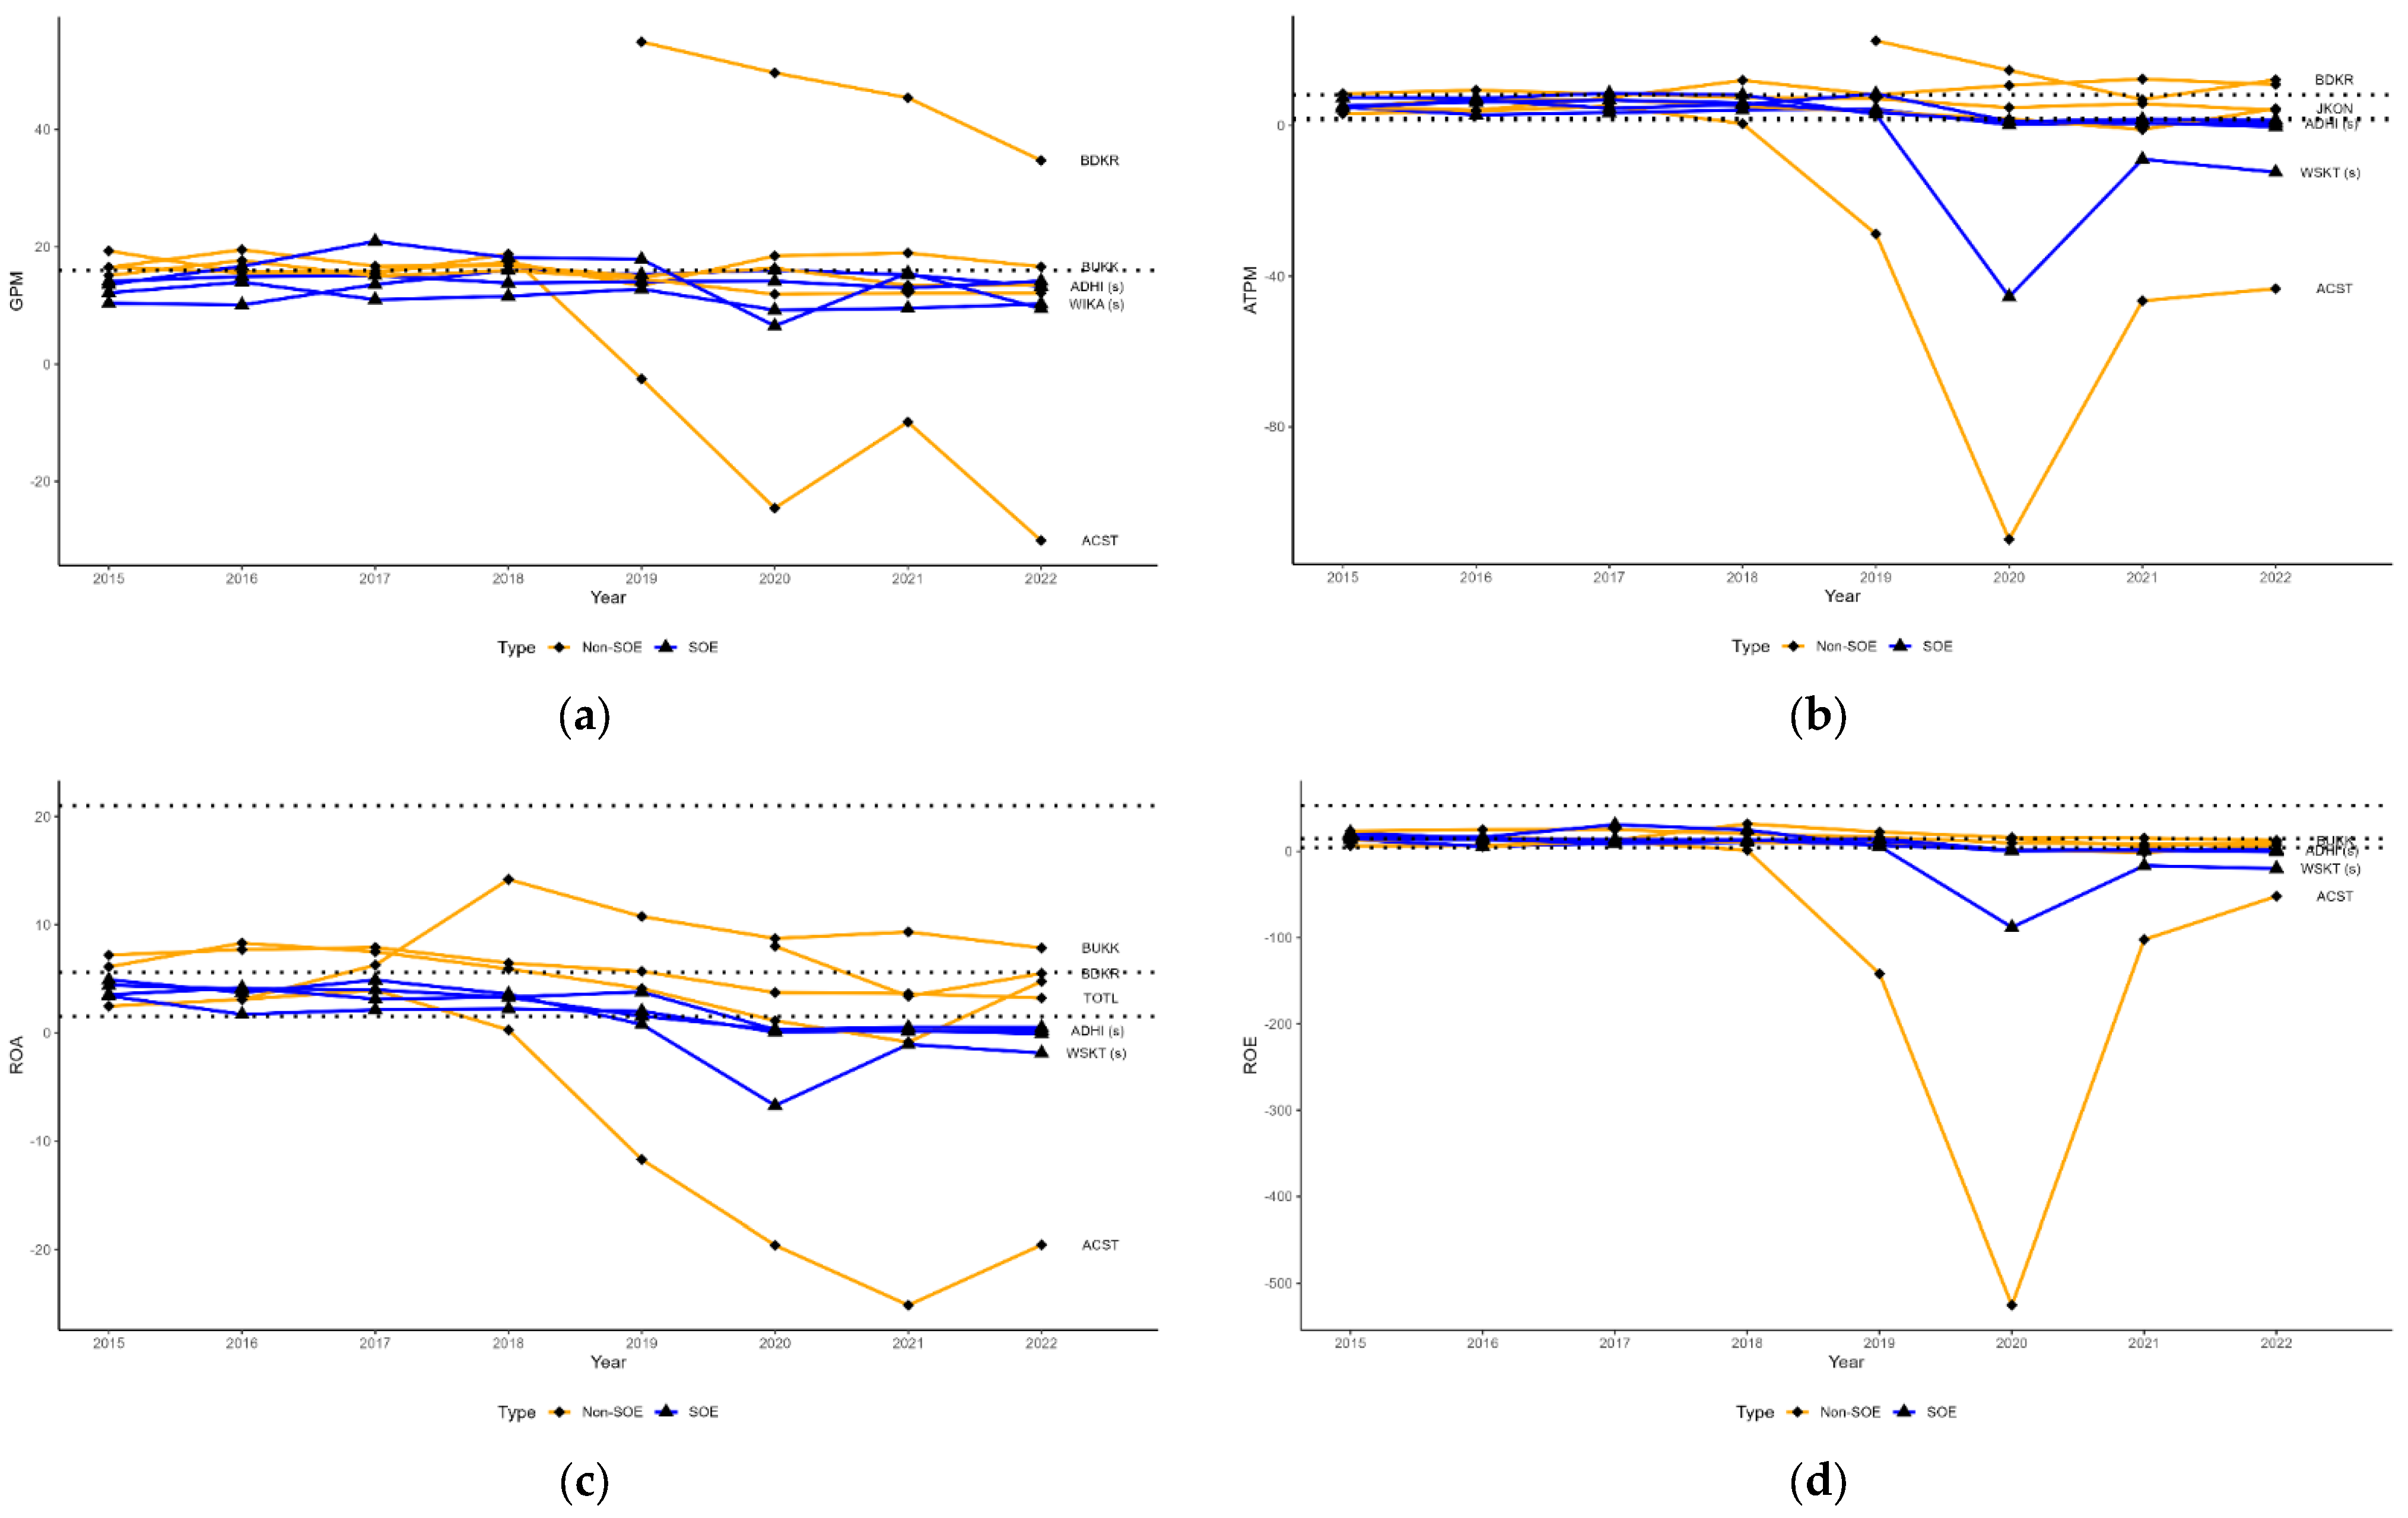
Figure 4.
(a) Trend of CLNWR; (b) DER; (c) APRR of state-owned and private construction companies. The maximum value of the Peterson benchmark (top dot line), the average value of the Peterson benchmark (middle dot line), and the minimum value of the Peterson benchmark (bottom dot line).
Figure 4.
(a) Trend of CLNWR; (b) DER; (c) APRR of state-owned and private construction companies. The maximum value of the Peterson benchmark (top dot line), the average value of the Peterson benchmark (middle dot line), and the minimum value of the Peterson benchmark (bottom dot line).
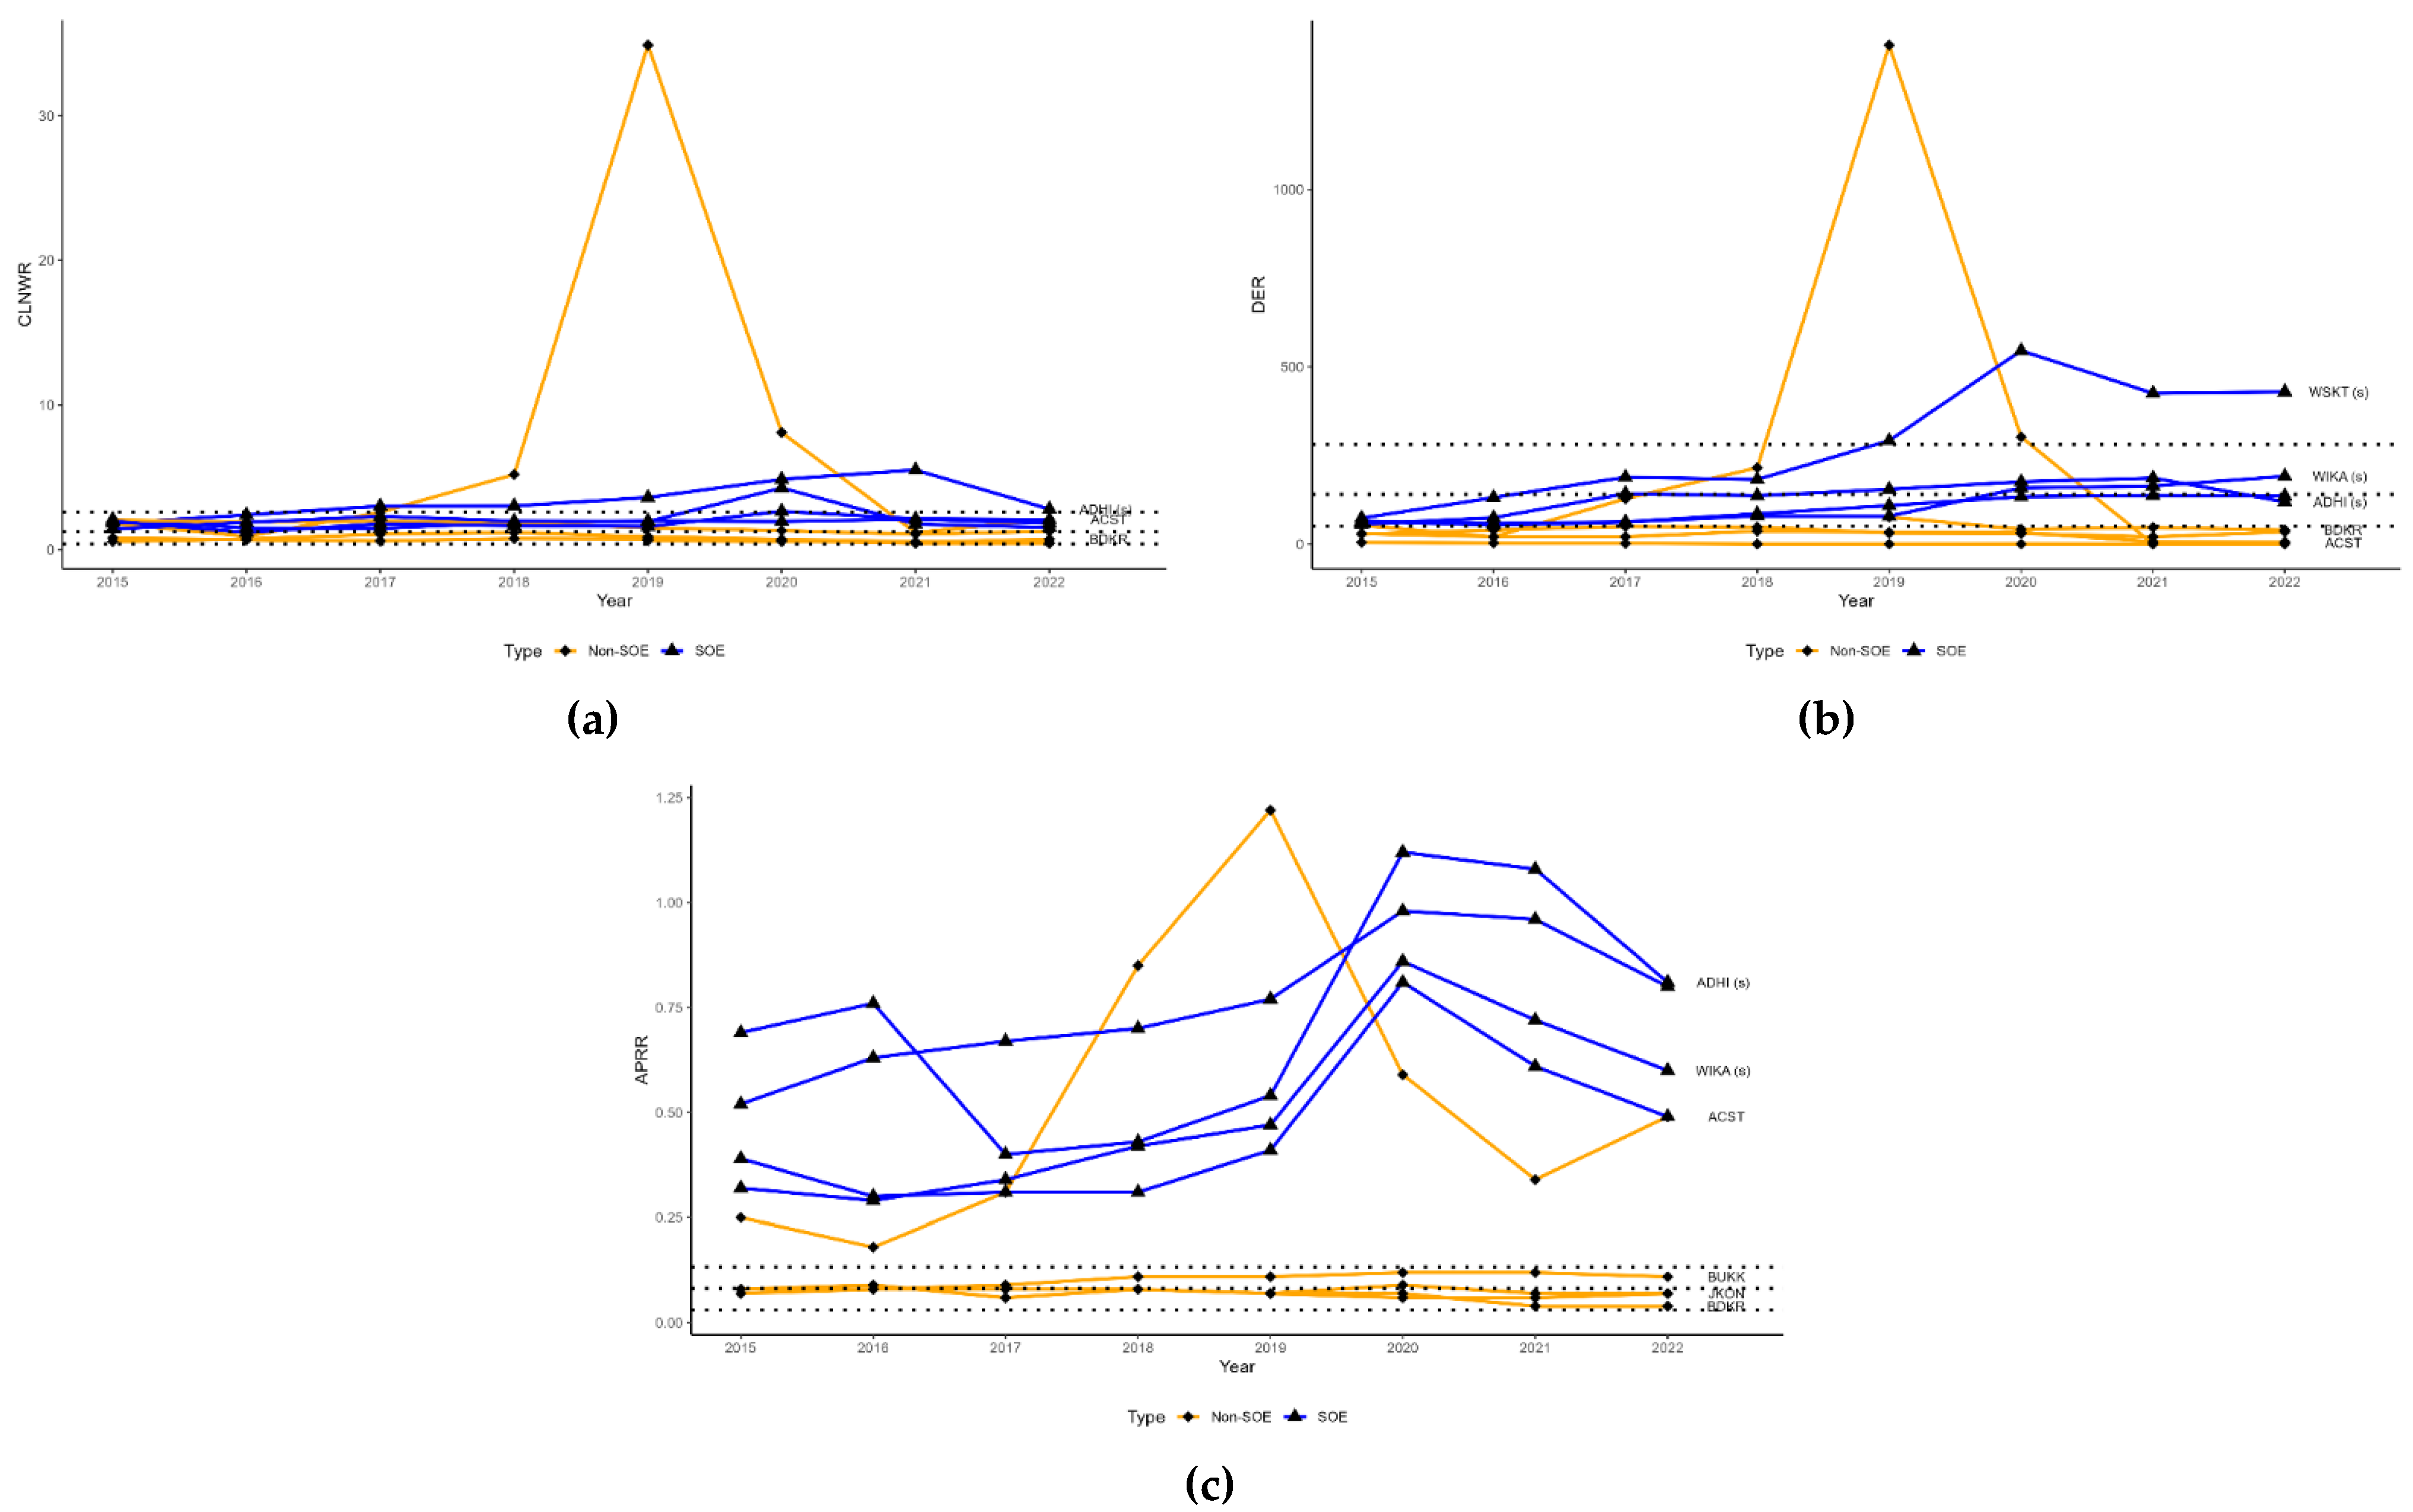
Figure 5.
The average efficiency of state-owned and private construction companies.
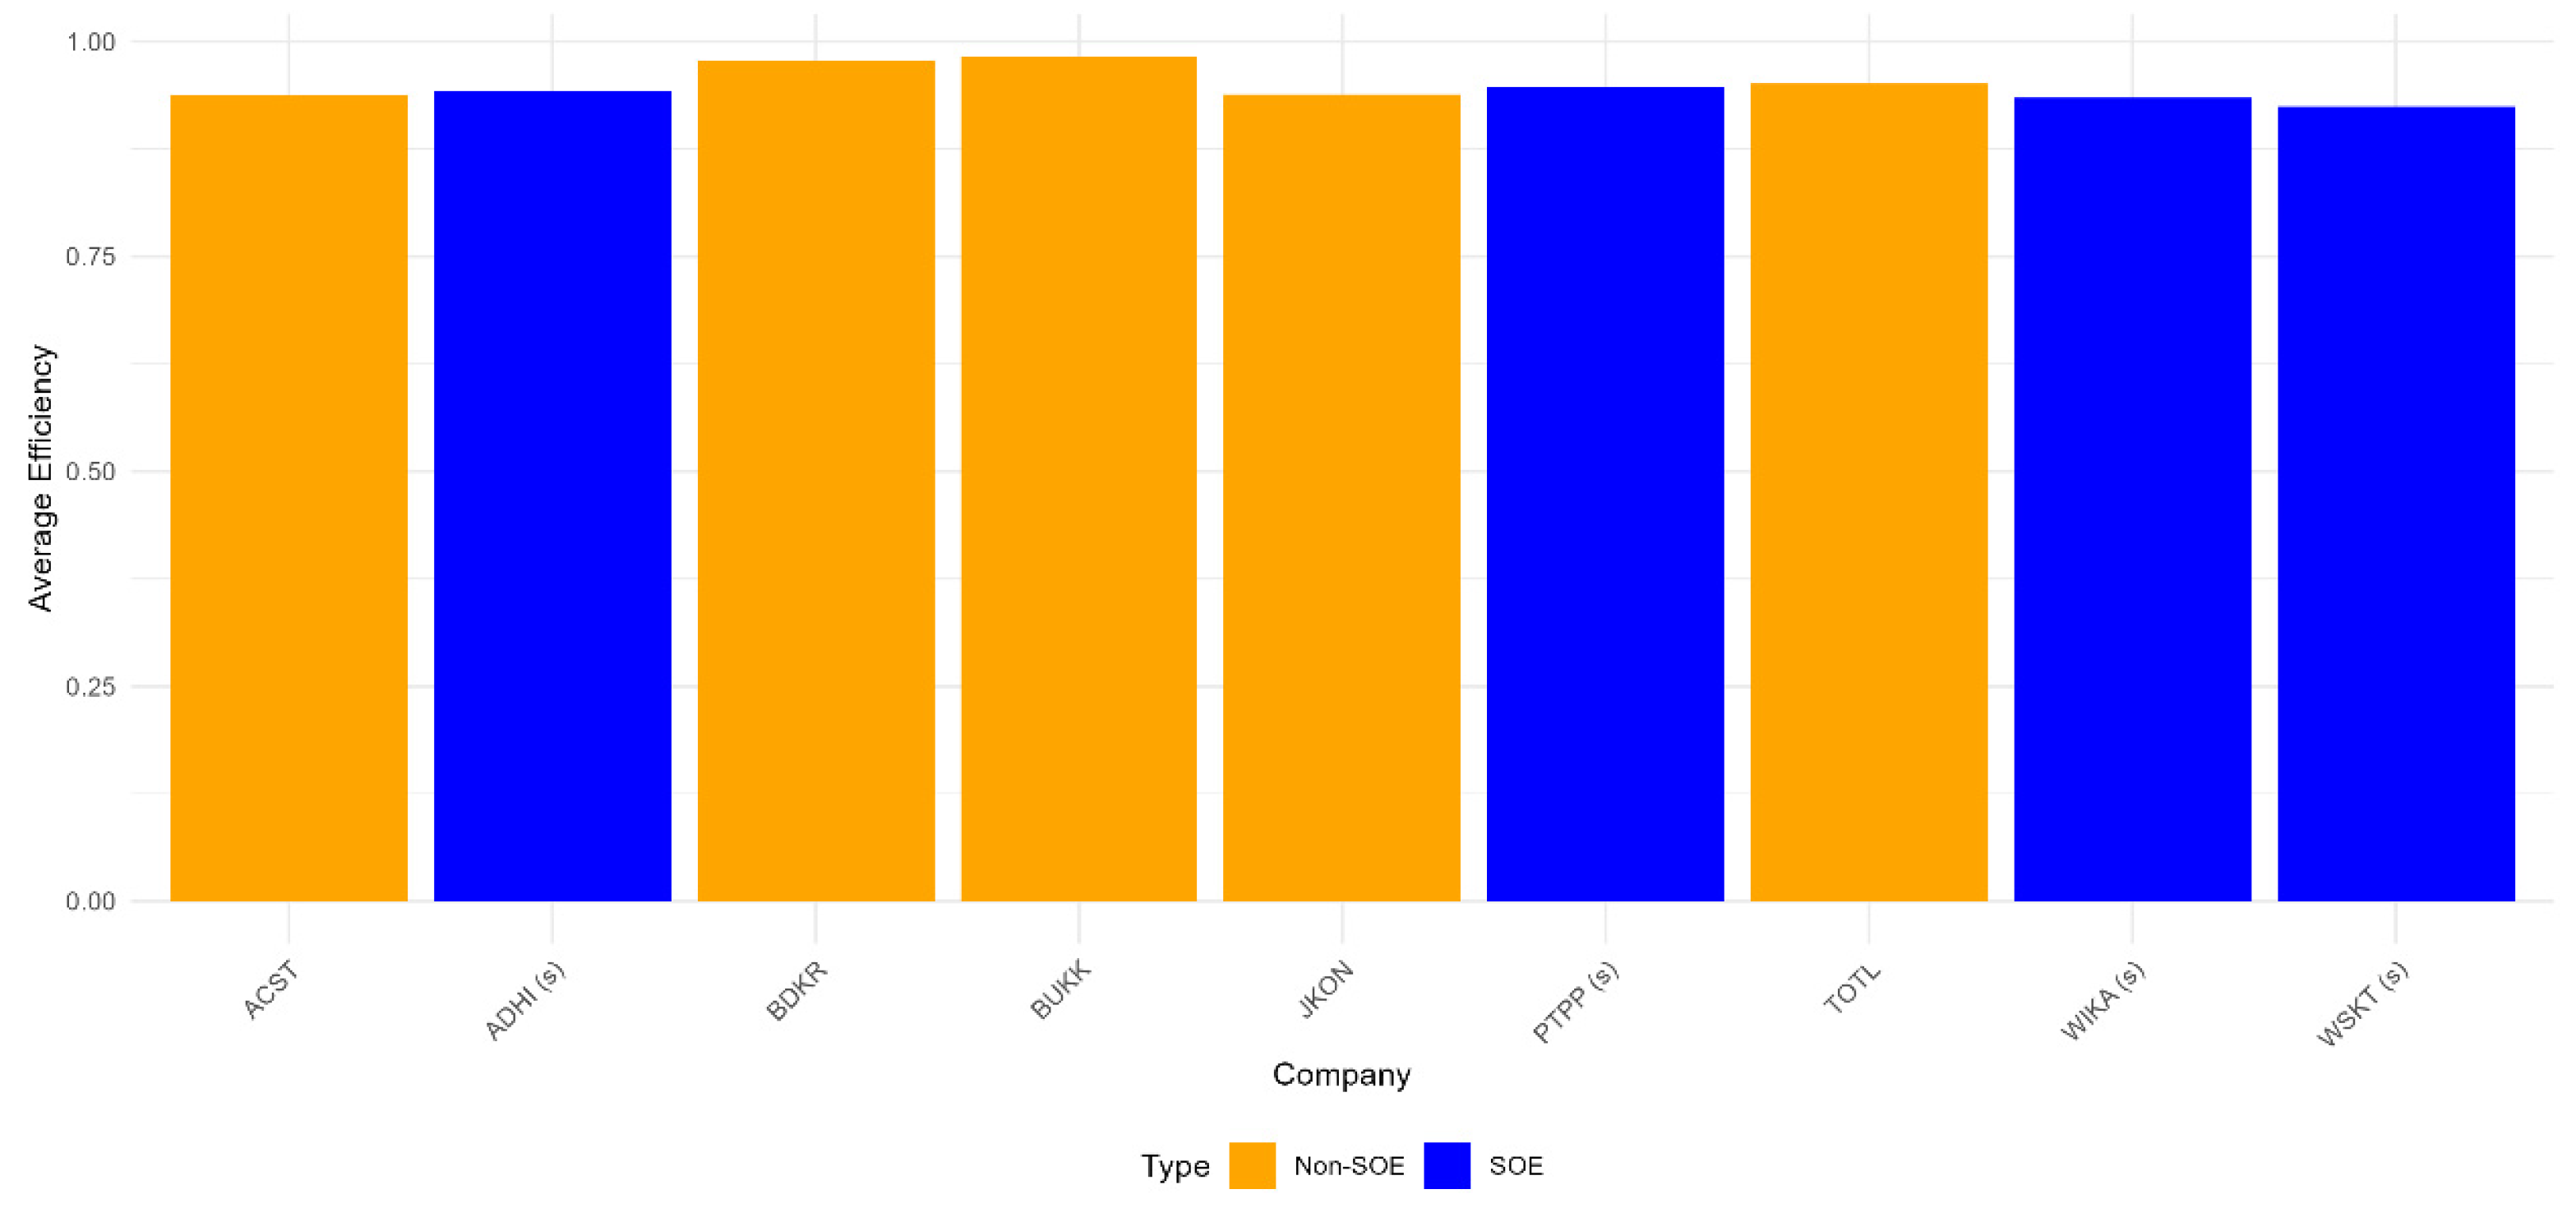
Figure 6.
Efficiency of state-owned and private construction companies.
Disclaimer/Publisher’s Note: The statements, opinions and data contained in all publications are solely those of the individual author(s) and contributor(s) and not of MDPI and/or the editor(s). MDPI and/or the editor(s) disclaim responsibility for any injury to people or property resulting from any ideas, methods, instructions or products referred to in the content. |
© 2024 by the authors. Licensee MDPI, Basel, Switzerland. This article is an open access article distributed under the terms and conditions of the Creative Commons Attribution (CC BY) license (http://creativecommons.org/licenses/by/4.0/).
Copyright: This open access article is published under a Creative Commons CC BY 4.0 license, which permit the free download, distribution, and reuse, provided that the author and preprint are cited in any reuse.


