
Submitted:
15 February 2024
Posted:
16 February 2024
You are already at the latest version
Abstract
During the 2008 financial crisis, central banks (such as the Fed) adopted quantitative easing (QE) policy to stimulate their economies and overcome severe economic and financial recessions. However, apart from stimulating the economy by issuing a substantial amount of currency to purchase long-term bonds and suppress interest rates, QE policy also contributed to a boom in the real estate and construction sectors. Therefore, this study employs Data Envelopment Analysis to measure the business performance (BP) of construction companies and explores the impact of QE policy on the BP of construction companies between 2004 and 2015 using ordinary least squares regression. Also, we examine the moderating role of debt ratio on the relationship. Focused on publicly listed construction companies in Taiwan, this research reveals three encouraging find-ings. Firstly, QE policy indeed enhanced the BP of Taiwanese construction companies. Secondly, the performance improvement of construction companies due to QE policy shows a time-diminishing trend, suggesting the importance of seizing the initial policy benefits of QE implementation. Lastly, construction companies with appropriate financial leverage may exhibit better BP. These findings can provide valuable insights for relevant government entities and de-cision-makers in the industry for policy and investment decisions.
Keywords:
Quantitative Easing Policy
; Construction Companies
; Data Envelopment Analysis
; Time Lag
; Moderator
1. Introduction
After the 2008 financial crisis, in an attempt to combat what was emerging as the most severe recession since 1937 Blinder [1] pointed out the Federal Open Market Committee (FOMC) lowered the federal funds rate to almost zero. As a result, the Federal Reserve began implementing quantitative easing (QE) policy, which involved the purchase of long-term bonds through the creation of new money. This move aimed to increase the prices of long-term bonds and lower interest rates, thereby reducing mortgage rates and supporting the real estate market [2].Mukerji, Saeed [3] proposes an expansive monetary policy by the Federal Reserve, which indirectly influences the prosperity and decline of the real estate market by impacting the savings decisions and determinations of household units.
According to the Central Bank of the Republic of China [4] report on QE policy, this policy can support asset prices, leading to an economic boost through the rise in asset prices. By directly purchasing medium and long-term assets from the private sector and setting purchase targets, the central bank can directly influence medium and long-term interest rates (and real interest rates). This effect is transmitted through various channels, including inflation expectations, wealth, credit, and exchange rates (as shown in Figure 1). As a result, stock and property prices also increase, contributing to an overall improvement in economic efficiency.
According to Cho and Rhee [5] findings, the implementation of QE policy has been aimed at supporting Asian economies by reducing financial risks and stabilizing long-term policy rates, leading to a decrease in interest rates in the region. Following the global financial crisis, asset prices, including real estate prices, have risen amid favorable liquidity conditions in certain countries. In Taiwan, for instance, the study also indicates a steady 57% increase in real estate prices from 2008 to 2012. Many studies also mention the impact of QE policy on the performance of the construction and real estate industries [6,7,8].
This study investigates the impact of QE policy on the business performance (BP) of construction and real estate development companies listed on the Taiwan Stock Exchange (TWSE). The motivation behind this research is to explore how the implementation of QE policy affects the performance of these companies.
Farrell [9] introduced the concept and method of efficiency boundary and efficiency measurement for the first time. Subsequent research built upon this idea led to the development of various methods to measure efficiency levels in production. These methods are also known as Data Envelopment Analysis (DEA). Therefore, there have been many studies in the past that have used the DEA method to measure the BP of the real estate industry.
Some studies use Real Estate Investment Trusts (REITs) as Decision Making Units (DMUs) [10,11], while others use real estate and construction companies as their research DMUs [12,13,14,15]. There are also many studies that use provinces, states, or countries as DMUs to conduct efficiency research on the real estate and construction industries [16,17,18,19].
The construction industry sector significantly impacts the gross domestic product (GDP) and socio-economic development objectives, including employment, monetary system, and inflation [20]. Taking various countries as examples, the contribution of the construction sector to their respective GDP is as follows: in Taiwan, it accounted for 3.3% in 2021 [21]; in the United States, it was 4.1% in 2019; and in the European Union, it was 9% in 2019 [22]. Therefore, the construction industry is a significant component of a country's economy and a crucial pillar for economic growth and development [23]. Hence, this study focuses on the performance of the construction industry as its research subject.
However, despite the importance of the QE policy, there is only limited research that explores its influence and importance in the construction industry before and after the 2009 financial crisis in Taiwan. What is the effect of the QE policy on the time lagging of Taiwan's construction industry performance? In addition, there is insufficient research on the implementation of debt ratio as a moderator. To begin with, this research employs the DEA method to assess the performance of construction companies from 2004 to 2015, based on financial data extracted from their reports in the Taiwan Economic Journal (TEJ). The results indicate that most companies have experienced some degree of performance growth.
Building on these findings, the study further analyzes the differences between the pre-QE period (2004-2009) and the post-QE period (2010-2015) to understand the impact of the QE policy on the performance of the construction companies. The study reveals that the implementation of the QE policy has had a more significant impact on the performance of the construction industry compared to the past. This indicates the influence of the QE policy on the industry's BP. The results of this research can serve as valuable references for policymakers and decision-makers in relevant government departments and industries while making policy decisions and investment strategies.
This study aims to provide a comprehensive investigation into the impact of QE policy on the BP of construction companies using hierarchical regression.
By offering relevant data, research conclusions, and response strategies, this study aims to serve as a resource for decision-making within the construction industry. It aims to enable companies to grasp and address the effects and potential challenges posed by QE policy, ultimately enhancing the efficiency of their BP.
2. Literature review
2.1. Data Envelopment Analysis
Farrell [9] first proposed the efficiency boundary and efficiency measurement concept and method. The method does not need to set the function form but uses the mathematical programming formula to find the efficiency boundary composed of all the most efficient production combination points to measure each relative efficiency among DMUs. Later studies began to use this to develop different methods to measure efficiency levels with production efficiency. It is roughly divided into two methods that use linear programming as a tool (for example DEA) or econometrics to estimate production efficiency.
DEA, which is a nonparametric evaluated method for relative productive efficiency among DMUs, was first introduced by Charnes, Cooper [24] called the CCR model, through the mathematical programming, integrated with the method developed by Farrell and Fieldhouse's envelope theory, and has been widely utilized in performance or productivity assessment.
Subsequently, Banker, Charnes [25] discussed that the constant returns to scale assumption is implied in the CCR model, and introduced the BCC model based on the variable returns to scale assumption, the modified model can be further separated into technical and scale efficiencies.
Tone [26] proposes a new measure of efficiency based on an input surplus and output shortage. The Slacks-Based Measure of Efficiency (SBM) is a method to measure non-radial efficiency, which complies with the unit invariant assumption and can measure the efficiency value by integrating the differential variables. Besides, the measurement is determined solely on the basis of the reference set of the DMU and is not impacted by statistics over the entire data. The new measurement closely connects with other methods proposed, e.g., the two models mentioned above. The dual side of this method can be interpreted as profit maximization, in contrast to the ratio maximization of the CCR model.
2.2. The relation between construction company efficiency and DEA
Previous studies have evaluated construction companies by several methods of DEA and the performance of various models. For example, Anderson, Fok [10] employ the BCC method, which is one of the most popular methods of DEA, to measure technical efficiency and economies of scale for publicly traded REITs as listed in the NAREIT (National Association of Real Estate Investment Trusts) from 1992 to 1996. Topuz, Darrat [11] apply the CCR and the BCC input-oriented models and cover 280 equity REITs in the US to empirically studies several aspects efficiency of REITs in the 1990s. You and Zi [14] applied DEA to measure the cost of South Korea’s efficiency, configuration efficiency, and technical efficiency differences before and after production in construction companies' crisis.
In addition, Xue, Shen [19] used the DEA-based Malmquist productivity observation method to continuously improve the efficiency of China's construction industry from 1997 to 2003. Zheng, Chau [15] use the 2009 annual financial statement of the Listed Real Estate Companies in the Chinese stock markets with the CCR、BBC and Super-Efficiency-DEA models to investigate the efficiency and performance of those companies. Wang, Chen [18] explore regional differences in China's construction industry development based on continuous DEA-Malmquist index. When they can discover factors such as pure technology, the work is more advanced efficiency, technological progress, and scale efficiency lead to improved performance. Kapelko and Oude Lansink [27] adopted the SBM model to investigate different efficiency fields of twelve real estate and construction companies in Iran in the last few years.
Moreover, Wang, Lai [13] utilize the three-stage DEA model to analyze the CSR efficiency of 55 listed construction companies from 2012 to 2016 in China. Hu and Liu [28] use the two-stage DEA model to create a tool for measuring the construction industry’s performance and showing its effectiveness and efficiency in China. Chen, Song [29] adopted the DEA data package analysis method to analyze the execution efficiency of the evolution of the performance of China's construction companies. Yang and Fang [30] apply the SBM model and the Malmquist index model to examine the green productivity of 15 real estate firms in China. Shin, Kim [31] investigate the innovative efficiency of 90 construction companies in Korea as the DMUs and the relevance between innovation efficiency and companies’ view of Occupational Safety and Health regulations using the BCC model.
Furthermore, Horta, Kapelko [32] aim to examine the dynamic in the performance of the construction industry in Portugal, and assess the reason that assists excellence and innovation within an industry by using the CCR model, which is one of the DEA methods, and also pose a new DEA method to evaluate innovation in this field. Peng Wong, Gholipour [33] used the SBM model to investigate different efficiency fields of twelve real estate and construction companies in Iran in the last few years. Yang, Fukuyama [34] studied the regional sustainability performance by the DEA method of the construction companies in 30 sample provinces in mainland China and based on these findings put forward some policy recommendations for the sustainable development of China’s construction companies. Liu, Liu [17] explore the total factor productivity (TFP) of the construction industry of 30 provinces in China by the Malmquist index, one of the DEA methods to measure efficiency, from 2007 to 2016.
Generally speaking, measure productivity or efficiency. The construction industry has shifted from appraisal to a single region, country, region to multiple companies, regions, and nations. For instance, Horta, Camanho [35] collected data from 118 construction companies in Europe, Asia, and North America from 1993 to 2005, then applied DEA and Malmquist Indicators for evaluating efficiency and changes in efficiency. This study was conducted an international benchmarking study on the construction industry and the author also found the impact of the level of efficiency in the location. However, let’s assume that if they notice the differences in technology sets between companies and focus only on location, their work will improve.
In addition, Park, Yoo [36] analyzed efficiency and productivity in Taiwan, Japanese, and Korean construction companies the Malmquist method based on DEA was adopted. Horta, Kapelko [32] aim to research how diversification and internationalization strategies impact the performance of lots of companies in the Spanish and Portuguese construction industry through the DEA model.
According to the literature, it is pointed out that DEA's method has industry judgment value and a decision-making basis for the research of the construction companies’ performance. The specific literature used DEA methodology in construction companies (see Table 1).
2.3. The effect of QE policy on performance of construction companies
After the 2008 financial crisis, in an attempt to combat what was emerging as the most severe recession since 1937-38, Blinder [1] pointed out the Federal Open Market Committee (FOMC) lowered the federal funds rate to almost zero. As a result, the Federal Reserve began implementing QE policy, which involved the purchase of long-term bonds through the creation of new money. This move aimed to increase the prices of long-term bonds and lower interest rates, thereby reducing mortgage rates and supporting the real estate market [2]. According to CBC [4], QE policy can support asset prices. Through asset price increases, the economy will be boosted; such as the direct purchase of medium- and long-term assets from the private sector and setting purchase targets to directly affect medium- and long-term interest rates (and real interest rates), and through inflation expectations channels, wealth channels, credit channels, and exchange rate channels, etc., to convey the effect of monetary policy, and therefore stock prices and movable property prices will also rise to drive economic efficiency.
Much of the previous studies aimed primarily at studying the impact of QE policy on construction or real estate industries. Xu and Chen [8] aim to investigate the effect of monetary policy through long-term borrowing interest rates, money supply, and mortgage credit conditions on the house price growth in China from 1998 Q1 to 2009 Q4. The empirical outcomes show that expansionary monetary policy accelerates the growth of real estate prices. Cho and Rhee [5] pointed out that QE policy was dedicated to economics to Ease Asian countries by reducing financial risks and stabilizing the long-term policy rate, which decreases the interest rate in this area. Since the global financial crisis, asset prices (including real estate prices) have increased in easy liquidity circumstances in some countries. In truth, the study also presents data that shows that real estate prices steadily rose by 57% in Taiwan from 2008 to 2012.
According to the IMF [37], housing prices in Asian economies such as Hong Kong, Malaysia, Singapore, and Taiwan have grown rapidly since the 2008 crisis. This evidence should support the international spillover effects of QE policy; therefore, the study infers that the QE policy will also have an impact on the promotion of Taiwan’s construction companies.
In addition, Bénétrix, Eichengreen [38] pointed out that the FOMC has sought to put downward on long-term federal interest rates and mortgage interest rates to stand up for the real estate market, by purchasing long-term government bonds. Füss and Zietz [39] explore whether the national monetary policy has extremely different impacts on the growth of real estate prices across cities. The empirical results demonstrate that real estate price boosts are associated with lower interest rates. Ho, Zhang [6] created a factor-augmented vector autoregression model to predict whether unexpected modification and uncertainty in monetary and economic policy affect the real estate, loan, and stock market in China. The analysis results reveal a remarkable increase in real estate investment due to the decrease in the US federal interest rate.
Moreover, Rosenberg [40] uses the Bayesian structural vector autoregressive model to explore the impact of monetary policy on real estate prices, including interest rate and balance sheet policies of the central bank in 30 years. The empirical results demonstrate that the interest rates and the balance sheet have a positive correlation to the real estate price in Scandinavian countries in response to expansionary monetary policy. Ryczkowski [41] studies the relevance between credit loosening and the growth of house prices in twelve developed countries. The results found that the rise of money supply and credit condition, tools for the QE policy in the US and the UK, was associated with the house price increase.
Furthermore, Miyakoshi, Li [7] pointed out that the Hong Kong REIT (H-REIT) market can formulate and promote housing prices through QE policy. The H-REIT price ranged from 100 to 600 index points during the eight years from 2008 to 2016. Corresponding to the increase in H-REIT prices, Hong Kong has also tripled from 150 to 420. Similarly, the Hong Kong stock price rose rapidly from 30,000 to 75,000. Zhang and Pan [42] developed a smooth transition vector autoregression model to study the monetary policy and economic output of the real estate market. The analysis indicated that whenever the real estate market suffers a low growth rhythm, the real estate market is successfully stimulated by the QE policy in China.
To sum up, such literature shows that the implementation of QE policy can help improve the operating performance of the construction or real estate industry. As mentioned above, QE policy can help the performance of enterprises, and some researchers mentioned that the QE policy will lead to an increase in the company's financial leverage.
According to studies by Acharya and Plantin [43], the Federal Reserve through the QE policy made its policy rate as low as possible due to the financial crisis in 2008. The results found that the financial condition of companies in the US has undergone magnificent change over the QE policy, including the remarkable rise of leverage. Alter and Elekdag [44] examine the influence on the financial leverage of a company by the financial wave in emerging markets. The results interpret that the global financial crisis caused the company’s faster financial leverage growth by QE policy, including adjusting borrowing interest rates and loosening borrowing constraints in the emerging market. Koráb, Mallek [45] test the implications of QE policy on the company’s performance in the euro area during the Corporate Sector Purchase Programme (CSPP) measure from the European Central Bank (ECB). The empirical evidence shows an increase in the leverage of the company owing to the CSPP.
A study also focuses on whether the real estate industry will have higher financial leverage due to the QE policy. Frame and Steiner [46] explore whether Mortgage REITs (MREITs) Agencies revise their financial investment in reacting to QE policy. The results pointed out that MREITs Agency increased leverage in response to QE policy to attain the return.
In the following part, some past literature has explored whether the effect of QE policy diminishes after its implementation. After the financial crisis in 2008, the U.S. Federal Reserve implemented QE policy three times. Lin, Batmunkh [47] investigate the effects of the QE policy on emerging markets. The results found that the 1st stage of the QE leads to extremely significant effects. Moreover, the study pointed out that the leverage of the QE policy reduces and diminishes over the three implementations of the policy.
Also, Hauzenberger, Pfarrhofer [48] examine the impacts of the conventional and unconventional monetary policy conducted by the ECB. The results pointed out that the transmission mechanism of the monetary system is broken when economic and financial uncertainty levels rise. Moreover, conventional monetary policy and forward guidance were comparatively less valid to overcome the financial crisis during uncertain times. Therefore, QE, an unconventional monetary policy, is more effective during this period. In other words, the QE policy is less effective when uncertainty drops.
Some literature also discusses that the effect of QE policy is very short-lived and temporal. When the Bank of Japan (BOJ) conducts its QE policy, Girardin and Moussa [49] show that the impact of the policy is short-lived only a year in stimulating outputs and prices.
In addition, Bowman, Cai [50] aim to investigate the impacts of unconventional monetary policy measures from the BOJ in stimulating bank lending. The results believed that a significantly powerful and positive impact of liquidity on lending activity, which demonstrates that the extension of liquidity flow related to the QE enhances the stream of credit. However, the size and impacts of the boost were small and short only during the first years. Martin and Milas [51] pointed out that government bond rates decreased by large-scale asset purchases, a tool of QE policy. However, the effect can be temporary, and the initial stage of QE policy is more effective than the follow-up stage.
Based on the previous research literature, numerous studies have indicated that the implementation of expansionary monetary policy, specifically QE policy, by central banks has effects that are transmitted through the monetary mechanism to the economy, thereby influencing the performance of the construction industry. Furthermore, a positive correlation has been observed between QE policy and the performance of the construction industry.
some literature argues that the impact of QE policy transmission through the monetary mechanism on economic performance diminishes over time after the policy implementation. In other words, the initial impact of QE policy on the economy is the most significant, but this impact gradually diminishes as time passes.
Additionally, some research literature suggests that the degree of impact of QE policy implementation on the economy depends on the level of financial leverage. It has been found that the overall economy experiences an increase in financial leverage following the implementation of the QE policy. This suggests that in order to further expand the magnitude of performance growth, economic entities enhance their financial leverage through borrowing, aiming to achieve better performance results from QE policy. Based on these findings, the study proposes the following three hypotheses:
H1. QE policy has a significantly positive impact on the BP of construction companies.
H2. The impact of QE policy on the BP of construction companies diminishes over time after the implementation.
H3. Debt ratio has a moderating effect on the relationship between QE policy and BP of construction companies.
3. Methodology
3.1. Research framework
Figure 2 demonstrates a conceptual research framework to discuss the relevance among such variables of Taiwanese construction companies under the implementation of the QE policy. The effect of the QE indicators on the BP; the QE, which is considered an independent variable in the framework. In this study, QE influences BP (BP) which is the dependent variable in the framework. The moderating variable of debt ratio, our main objectives of this study are to examine the relationship between QE and BP. Thus, a visual conceptual framework helps clarify the links between variables. To avoid collinearity, size and ROA are used as control variables.
3.2. Sample and data
This study investigates the 12-year financial report data of the Taiwan Economic Journal (TEJ) 44 selected data of 43 listed construction and real estate companies (Because one of the companies, Fengding-KY, was established relatively late, the data cannot be fully provided) in Taiwan. As can seen from the Appendix, we employed data from 2004 to 2015 listed Taiwan construction companies, for a total of 516 observations.
3.3. QE measurement
In this study, we follow the CBC [4] report on QE policy to measure QE. After the 2008 financial tsunami, QE was implemented. This study uses 2004-2009 as the period before the implementation of QE, represented by the variable "0", starting from 2010-2015 is the QE implementation period and is measured as the period after QE with the variable "1". To observe and examine the differences before and after QE.
3.4. BP measurement uses Dynamic SBM model
About the formulation of the Dynamic DEA approach pointed out by Tone and Tsutsui [52], Figure 3 present the dynamic processes that deal with n DMUs (p = 1, …, n) over T terms (t = 1, …, T). At each period, DMUs have o discretionary inputs (i = 1, …, o), j non-discretionary inputs (i = 1, …, j), u discretionary outputs (i = 1, …, u) and k non-discretionary outputs (i = 1, …, k). Let (i = 1,…, o), (i =1,…, j), (i =1, …, u), and (i =1, …, k) demonstrate the observed discretionary input, non-discretionary input, discretionary output and non-discretionary output values of DMU p at term t, respectively. We indicate the four class links as , , and . For the purpose of identifying them by term(t), DMU(p), and item(i), we utilize the notation (i = 1, …, ngood; p = 1, …, n; t =1, …, T) for demonstrating good link values where ngood is the number of good links up to the term T.
The production expression {}, {}, {}, {}, {}, {}, {} and {} are defined by
where Rn (t = 1,…, T) is the intensity vector to the term t with nbad, nfree, and nfix are the number of bad, free and fixed links respectively. The last limitation is related to the variable returns-to-scale assumption. If this limitation has been deleted, we have a constant returns-to-scale structure. Notice that , , , , , , and on the right are observed data while , , , , , , , and on the left are variables connected by the intensity variable .
The continuity of linking flows between terms t and t+1 can be insured by the following conditions:
where the symbol represents good, bad, free, or fix. This limitation is important to the dynamic structure, as it connects term t and term t+1.
The expressions for production of DMUq (q = 1, …, n) are as follows:
where , , , , and are slack variables demonstrating input excess, output shortfall, link shortfall, link excess, and link deviation respectively.
In evaluating the efficiency of DMUq (q = 1,…, n) assuming ({},{},{},{},{},{}) as variables, In our dynamic DEA model, we maximize relative slacks in outputs and desirable links.
The non-oriented models intend to decrease input-related factors and amplify output-related factors at the same time. As the combination of input-and output-oriented models, it defines the non-oriented efficiency measure by solving the expression below:
subject to (2) and (3), where and are weights to term t and input i which are supplied exogenously in the light of their significance and satisfy the criteria as
If each of the weights is even, then we can put and subject to (2) and (3), where is the weight to output i and satisfies the criteria:
This objective function is a stretching of the non-oriented SBM model. It deals with excesses in input resources and undesirable links as well as shortfalls in output products and desirable links in a unitary formula. The numerator is the average input efficiency and the denominator is the inverse of the average output efficiency. We define the non-oriented overall efficiency as a ratio that ranges between 0 and 1 and attains 1 when all slacks are zero. This objective function value is units-invariant.
Employ an optimal solution ({}, {}, {}, {}, {}, {})
to (4), (2) and (3), then define the non-oriented term efficiency as follows:
The definitions of the variables used in dynamic structure are described in Table 2. This study is a compilation of previous research literature that measures the efficiency of the real estate industry in a country using the DEA method. It has been observed that many studies in the literature have used operating expenses and number of employees as inputs, operating revenue as output, and total assets as carryover. The aggregation of individual variables used in previous research is summarized in Table 2. Furthermore, based on my knowledge, there is no existing research literature that has used the DEA method with market value as the output to measure the efficiency of the real estate industry. Therefore, this study collected research literature that measures other industries as a basis for adopting market value as the output. Relevant literature is also summarized in Table 2.
3.5. Debt Ratio measurement
A debt ratio measures the amount of leverage used by a company in terms of total debt to total assets. Debt ratio measurement is followed the research of Frame and Steiner [46] mentioned the impact of debt ratio on QE policy.
3.6. Control Variables
3.7. Hierarchical Regression
Following the research of Kuo, Lu [60], we apply hierarchical regression to test the effect of QE on BP. Then, we examine the moderating role of debt ratio on the relationship using the regression.
In the regression model, is the BP. The coefficients explain how BP is related to the QE core. QE is Dummy variable, we use “0” and “1” to represent before and after QE, DebtRatio is ratio of total debt to total assets and QE*DebtRatio is the cross term, SIZE is the natural logarithm of total assets, ROA is the ratio between total net income and total assets. is the error term, and i is the firm.
4. Empirical analysis
In the empirical analysis of this study, the research’s purpose is to first analyze the BP of construction companies. Secondly, to discover the impact on the BP of the construction companies before and after QE. Thirdly, to explore the results produced by comparing the effects of different time delays to understand the impact of QE policy on the performance fluctuations of construction companies to improve the reliability of this study. Lastly, whether the debt ratio of the enterprise during the QE period will be the main influencing factor in the BP of the construction companies.
4.1. Development Trend of Variables in Listed Construction Companies
This research is based on the data of 43 construction companies listed in Taiwan from 2004 to 2015. The total assets are used as carry-over variables, operating expenses, and the number of employees are used as input variables, and the company’s market value and operating income are used as output variables for analysis (Table 3) The input and output of each year are calculated separately. The number of DMUs is more than three times the input plus output variables, so it meets the DEA research conditions (cite source). Through the K-S Test (the Kolmogorov-Smirnov test is significant) (P < 0.01), it can be seen that all of the indicators are abnormally distributed. This shows that the DEA method is an authoritative research technique because DEA research applies to the abnormal allocation of data [61]. Therefore, the multiple-input and multiple-output correlation analysis is particularly suitable for this research.
The average data of each company can be found according to (Figure 4) that the indicators of various input and output variables have shown an upward trend from 2004 to 2015. In particular, the indicator of total assets is showing a high growth trend. To further understand the upward development of the construction companies in the course of the past 12 years, and to observe that the total assets have increased significantly since the implementation of QE in 2010.
In the correlation statistics, it is found that the relationship between input and output variables items has a significant level, and the significant correlation between the relationship between input and output variables is obvious, so it is inferred that the impact of input variables items on output variables items in this analysis is significant, all variables are positively correlated, showing the isotonicity of the data (see Table 4).
4.2. Analysis of performance values before and after QE
In this study, DSBM [52] non-oriented-VRS was added to verify the performance value analysis before and after QE. The performance value results for each year are shown in Table 5. In addition, using the analysis of the Windows Model, we obtained the performance values for each year from 2004 to 2015 (6).
This study found that the trend of the Dynamic DEA model has increased significantly after 2010 the overall trend is gradual upward development (Figure 5).
According to DSBM [52], that point the DEA windows model analysis and the Malmquist index usually neglect the carry-over activity between two consecutive periods, it only focuses on a single time period and independently optimizes the local area within a single period. In order to cope with the long-time point of view, the DSBM incorporates the carry-over activities into the model and allows us to measure the period-specific performance based on the long-term optimization of the entire period.
QE policy are delayed by one, two, and three years. We compared the average performance values by one-year deferred QE (before 2004-2009 and after 2010-2015), two years deferred QE (before 2004-2010 and after 2011-2015), and three years deferred QE (before 2004-2011 and after 2012-2015) in DSBM models and through K-S Test (the Kolmogorov-Smirnov test is significant) & one-way ANOVA to analyze the difference between two different groups. We found that the QE one year lagging performance has significant growth. The QE one-year lagging has a more significant effect than the QE two years lagging, but QE three years lagging has no significant. (Table 6)
According to the analysis of the one-, two- & three-year lagging periods compared, we found that the impact of QE policy on the performance of construction companies will have diminishing marginal utility benefits over time, with the passage of time when the policy is implemented, its effect will decrease its significance, which provides support for Hypothesis 2.
4.3. Moderator and the influence of control variables
QE policy impact and performance value BP. In Model 1, two control variables, including SIZE and ROA, were included in the regression to test the effects of QE and Debt Ratio on BP. The analysis results are shown in Table 7. The analysis results show that the main effect of QE can explain 5.33% of BP variation, F =14.33, p < 0.01, and Size is significantly correlated with BP (β = 0.224, p < 0.01).
In Model 2, independent variables QE, including SIZE and ROA, are included in the regression. As shown in Table 7, these two variables explain the significant variability (ΔR2 = 0.06, p < 0.1). The standardized regression weights are significant for QE (β = 0.078, p < 0.1). Therefore, Hypothesis 1 is supported.
In Model 3, a moderating variable Debt Ratio is added to the regression. As shown in Table 7, the Debt Ratio explains the insignificant variability (ΔR2 = 0.000, p = 0.633). The regression weights standardized by the Debt Ratio are not significant (β = -0.22, p =0.633).
In Model 4, the interaction of QE and Debt Ratio (i.e. QE × Debt Ratio) is added to the predictor variables. This interaction term explains a lot of unique variability in the QE policy impact and performance value BP (ΔR2 =0.013, p < 0.01). As shown in Table 7, the QE × Debt Ratio interaction is significant (β =–1.18, p < 0.01), which provides support for Hypothesis 3.
According to Table 7, after excluding the factors of SIZE and ROA, QE still has a significant explanatory power on BP (P < 0.1), and QE x Debt Ratio has a significant explanatory power on BP value (P < 0.01) under the interaction of QE x Debt Ratio. Tsai, Chen [62] point out that when the interaction has a significant effect, it can indicate that the moderator effect is significant.
The simple slope analysis results (Table 8) show that for the high Debt Ratio group, Debt Ratio has a significant explanatory power for the performance value BP (b=0.45, P < 0.01). For the low Debt Ratio group, the Debt Ratio has a significant explanatory power for the performance value BP (b=0.61, P < 0.01). This finding implies the interaction is significant [63].
Further draw the interaction diagram, as shown in Figure 6, It can be seen from the regression coefficient that the Debt Ratio high score and low group, QE has a significant and positive correlation to the BP value.
From the research results, the performance value of the high debt ratio is higher than the performance value of the low debt ratio in the initial stage, and then gradually slows down, while the performance value of the low debt ratio gradually rises; in response to the above-mentioned QE lagging effect, the marginal effect gradually weakens, the high debt ratio is in the period around QE. The effect of increasing the performance value is also weakening.
5. Conclusion
5.1. Discussion
As discussed by the IMF [37], housing prices in Asian economies have grown rapidly since the 2008 crisis. This evidence supports the international spillover effects of QE; therefore, this study infers that the QE policy will also have an impact on the promotion of Taiwan’s construction companies. The current research found that the trend of the Dynamic DEA model, the performance value results for each year has increased significantly after QE.
After the financial crisis in 2008, the U.S. Federal Reserve implemented QE policy three times. Lin, Batmunkh [47] have discussed that the 1st stage QE policy leads to extremely significant effects on emerging markets. Also pointed out that the leverage of the QE policy reduces and diminishes over the three implementations of the policy. According to the analysis of the one-, two- & three-year lagging periods compared, we found that the impact of QE policy on the performance of construction companies will have diminishing marginal utility benefits over time, with the time when the policy is implemented, its effect will decrease its significance.
Studies by Alter and Elekdag [44] examine the influence on the financial leverage of a company by the financial wave in emerging markets. The results interpret that the global financial crisis caused the company’s faster financial leverage growth by QE policy, including adjusting borrowing interest rates and loosening borrowing constraints in the emerging market. From the research results, the performance value of the high debt ratio is higher than the performance value of the low debt ratio in the initial stage, and then gradually slows down, while the performance value of the low debt ratio gradually rises; in response to the above-mentioned QE lagging effect, the marginal effect gradually weakens, the high debt ratio is in the period around QE. The effect of increasing the performance value is also weakening.
5.2. Implication
The results presented in this study show that expansionary monetary policies have a certain impact on the performance of construction industry companies in Taiwan. Based on these findings, construction companies can take advantage of this outcome when facing a new wave of QE policy in the future. They should seize this opportunity to enhance the growth of their financial performance, such as revenue or net profit.
Due to the diminishing effects of the impact, the influence of the QE policy on the financial performance of construction companies gradually decreases. Based on this conclusion, for the management decision-makers of construction companies, it is even more important to promptly capitalize on the short-term operational performance benefits brought about by the QE policy.
The impact of the QE policy is particularly significant for construction companies with financial leverage. Therefore, corporate decision-makers need to consider leveraging financial policy operations, such as borrowing from banks or issuing corporate bonds, to further amplify the contribution of QE policy to the company's performance.
5.3. Future Direction
The scope of this study is still limited to construction companies listed on the Taiwan Stock Exchange. In the future, based on the purpose and methods of this study, it is hoped that the research data will be extended to include construction companies in the Asia-Pacific region or on a global scale. In addition, the addition of two-stage DEA and more variables will further explore the issue of corporate execution, and add other control variables (such as corporate age) to explore related issues. This expansion aims to further enhance the coverage and contribution of this research topic.
Appendix
2004~2015 Listed Taiwanese construction companies’ BP

| DMU | 2004 | 2005 | 2006 | 2007 | 2008 | 2009 | 2010 | 2011 | 2012 | 2013 | 2014 | 2015 |
|---|---|---|---|---|---|---|---|---|---|---|---|---|
| On Yao | 0.075 | 0.032 | 0.059 | 0.075 | 0.069 | 0.120 | 0.151 | 0.104 | 0.033 | 0.033 | 0.168 | 0.155 |
| Huayoulian | 0.421 | 0.113 | 0.094 | 1.000 | 1.000 | 0.665 | 0.026 | 1.000 | 1.000 | 1.000 | 0.685 | 0.474 |
| Three places | 1.000 | 1.000 | 1.000 | 1.000 | 1.000 | 1.000 | 1.000 | 1.000 | 1.000 | 1.000 | 1.000 | 1.000 |
| Mingxuan | 1.000 | 1.000 | 0.393 | 0.923 | 0.665 | 0.610 | 0.611 | 0.932 | 0.717 | 0.664 | 0.735 | 0.633 |
| General | 0.058 | 0.073 | 0.026 | 0.125 | 0.221 | 0.410 | 0.363 | 0.437 | 0.310 | 0.199 | 0.315 | 0.268 |
| Baolai | 0.038 | 0.120 | 0.083 | 0.094 | 0.078 | 0.173 | 0.132 | 0.155 | 0.108 | 0.093 | 0.171 | 0.047 |
| Runlong | 0.257 | 0.397 | 0.299 | 0.282 | 0.385 | 0.255 | 0.361 | 0.382 | 0.407 | 0.121 | 0.648 | 0.446 |
| Haiyatt | 1.000 | 0.999 | 1.000 | 1.000 | 1.000 | 1.000 | 1.000 | 1.000 | 1.000 | 1.000 | 1.000 | 1.000 |
| New Meiqi | 0.948 | 0.979 | 0.989 | 0.984 | 0.871 | 0.942 | 0.495 | 0.235 | 0.177 | 0.076 | 0.175 | 0.123 |
| Guojian | 1.000 | 1.000 | 1.000 | 1.000 | 1.000 | 1.000 | 0.898 | 0.777 | 0.597 | 0.587 | 0.589 | 0.558 |
| Guo Yang | 0.146 | 0.345 | 0.474 | 0.354 | 0.363 | 0.218 | 0.437 | 0.377 | 0.354 | 1.000 | 0.317 | 0.370 |
| Too Set | 0.017 | 0.038 | 0.064 | 0.037 | 0.062 | 0.073 | 0.058 | 0.181 | 0.049 | 0.033 | 0.125 | 0.106 |
| Q- K JP | 0.320 | 0.210 | 0.197 | 0.467 | 0.222 | 0.305 | 0.301 | 0.318 | 0.463 | 0.060 | 0.017 | 0.333 |
| Edward | 0.284 | 0.300 | 0.371 | 0.194 | 0.233 | 0.240 | 0.251 | 0.227 | 0.818 | 0.251 | 0.277 | 0.238 |
| Long Bang | 1.000 | 1.000 | 1.000 | 1.000 | 1.000 | 1.000 | 1.000 | 1.000 | 1.000 | 1.000 | 1.000 | 1.000 |
| Guande | 0.305 | 0.235 | 0.239 | 0.239 | 0.289 | 0.531 | 0.502 | 0.444 | 0.249 | 0.313 | 0.372 | 0.257 |
| Capital | 1.000 | 1.000 | 1.000 | 1.000 | 0.731 | 0.897 | 0.884 | 0.839 | 1.000 | 1.000 | 1.000 | 1.000 |
| Hong Jing | 0.086 | 0.180 | 0.388 | 0.200 | 0.161 | 0.201 | 0.152 | 0.113 | 0.405 | 0.216 | 1.000 | 0.432 |
| Huangpu | 1.000 | 0.187 | 1.000 | 1.000 | 1.000 | 0.823 | 1.000 | 1.000 | 0.771 | 0.834 | 0.474 | 0.328 |
| Huajian | 0.571 | 0.162 | 0.316 | 0.661 | 0.413 | 0.484 | 0.711 | 0.632 | 0.019 | 0.172 | 0.009 | 0.758 |
| Hongsheng | 1.000 | 1.000 | 1.000 | 1.000 | 1.000 | 1.000 | 1.000 | 1.000 | 1.000 | 0.999 | 0.999 | 1.000 |
| Hongpu | 0.585 | 0.776 | 1.000 | 1.000 | 1.000 | 1.000 | 1.000 | 1.000 | 1.000 | 1.000 | 1.000 | 1.000 |
| Announcement | 0.218 | 0.159 | 1.000 | 1.000 | 1.000 | 1.000 | 1.000 | 0.714 | 0.613 | 0.486 | 0.778 | 0.690 |
| Kitai | 0.270 | 0.359 | 1.000 | 0.635 | 0.476 | 0.583 | 1.000 | 1.000 | 1.000 | 1.000 | 0.502 | 0.699 |
| Sakura BL | 1.000 | 1.000 | 1.000 | 1.000 | 1.000 | 1.000 | 1.000 | 1.000 | 1.000 | 1.000 | 1.000 | 1.000 |
| Mountain Forest | 0.141 | 0.010 | 0.018 | 0.030 | 1.000 | 1.000 | 1.000 | 1.000 | 1.000 | 1.000 | 1.000 | 0.264 |
| Hing Fu Fat | 0.373 | 0.502 | 0.491 | 0.488 | 0.766 | 1.000 | 1.000 | 1.000 | 1.000 | 0.999 | 1.000 | 1.000 |
| King Xiang | 0.407 | 0.484 | 0.663 | 0.587 | 0.999 | 1.000 | 1.000 | 1.000 | 1.000 | 1.000 | 0.714 | 0.768 |
| Nissatsu | 0.333 | 0.251 | 0.550 | 0.393 | 0.236 | 0.395 | 0.315 | 0.263 | 0.079 | 1.000 | 0.188 | 0.108 |
| Huagu | 0.381 | 1.000 | 0.997 | 1.000 | 1.000 | 1.000 | 1.000 | 1.000 | 1.000 | 0.694 | 0.768 | 0.940 |
| Scripture | 0.085 | 0.096 | 0.115 | 0.279 | 0.166 | 0.257 | 0.194 | 1.000 | 0.417 | 0.538 | 0.420 | 0.368 |
| Master | 0.048 | 0.028 | 0.023 | 0.088 | 0.119 | 0.407 | 0.408 | 0.579 | 0.572 | 0.292 | 0.360 | 0.337 |
| Rising Sun | 0.076 | 0.085 | 0.056 | 0.139 | 0.155 | 0.206 | 0.572 | 1.000 | 1.000 | 1.000 | 1.000 | 1.000 |
| Longda | 1.000 | 1.000 | 1.000 | 1.000 | 1.000 | 1.000 | 1.000 | 0.696 | 0.857 | 0.406 | 0.406 | 0.321 |
| Farglory | 1.000 | 1.000 | 1.000 | 1.000 | 1.000 | 1.000 | 1.000 | 1.000 | 1.000 | 1.000 | 1.000 | 1.000 |
| Suncheon | 0.276 | 0.365 | 0.569 | 0.427 | 0.276 | 0.359 | 0.436 | 0.462 | 0.458 | 0.255 | 0.423 | 0.463 |
| Country Forest | 0.183 | 0.289 | 0.310 | 0.544 | 0.299 | 0.483 | 0.371 | 0.324 | 0.406 | 0.231 | 0.364 | 0.260 |
| Emperor Ding | 0.388 | 0.275 | 0.249 | 0.528 | 0.486 | 0.852 | 0.519 | 0.612 | 0.399 | 0.129 | 0.433 | 0.354 |
| Changhong | 0.399 | 0.487 | 0.893 | 1.000 | 0.999 | 1.000 | 1.000 | 1.000 | 1.000 | 1.000 | 1.000 | 1.000 |
| Dali | 0.029 | 0.039 | 0.078 | 0.182 | 0.323 | 0.389 | 0.504 | 0.513 | 0.588 | 0.214 | 0.465 | 0.403 |
| Shimbaba | 0.024 | 0.015 | 0.016 | 0.028 | 0.036 | 0.023 | 0.027 | 0.150 | 0.361 | 0.152 | 0.030 | 0.213 |
| Runtaixin | 0.353 | 0.382 | 0.587 | 0.509 | 0.999 | 0.991 | 0.995 | 1.000 | 1.000 | 1.000 | 1.000 | 1.000 |
| Sanfa RE | 0.022 | 0.018 | 0.015 | 0.057 | 0.061 | 0.132 | 0.213 | 0.346 | 0.339 | 0.261 | 0.310 | 0.341 |
References
- Blinder, A.S., Quantitative easing: entrance and exit strategies. Federal Reserve Bank of St. Louis Review, 2010. 92(6): p. 465-479. [CrossRef]
- Neely, C.J. and B.W. Fawley, Four stories of quantitative easing. 2013. doi:10.20955/r.95.51-88.
- Mukerji, P., K. Saeed, and N. Tan, An examination of the influence of household financial decision making on the US housing market crisis. Systems, 2015. 3(4): p. 378-398. [CrossRef]
- CBC, Quantitative Easing Monetary Policy. 2013, Central Bank of the Republic of China (Taiwan): Taipei.
- Cho, D. and C. Rhee, Effects of quantitative easing on asia: capital flows and financial markets. Asian Development Bank Economics Working Paper Series, 2013(350). [CrossRef]
- Ho, S.W., J. Zhang, and H. Zhou, Hot money and quantitative easing: The spillover effects of US Monetary policy on the Chinese Economy. Journal of Money, Credit and Banking, 2018. 50(7): p. 1543-1569. [CrossRef]
- Miyakoshi, T., et al., The impact of quantitative easing and carry trade on the real estate market in Hong Kong. International Review of Economics & Finance, 2020. 69: p. 958-976. [CrossRef]
- Xu, X.E. and T. Chen, The effect of monetary policy on real estate price growth in China. Pacific-Basin Finance Journal, 2012. 20(1): p. 62-77. [CrossRef]
- Farrell, M.J., The measurement of productive efficiency. Journal of the Royal Statistical Society: Series A (General), 1957. 120(3): p. 253-281.
- Anderson, R.I., et al., Technical efficiency and economies of scale: A non-parametric analysis of REIT operating efficiency. European Journal of Operational Research, 2002. 139(3): p. 598-612. [CrossRef]
- Topuz, J.C., A.F. Darrat, and R.M. Shelor, Technical, allocative and scale efficiencies of REITs: An empirical inquiry. Journal of Business Finance & Accounting, 2005. 32(9-10): p. 1961-1994. [CrossRef]
- Horta, I.M., A.S. Camanho, and J.M. Da Costa, Performance assessment of construction companies: A study of factors promoting financial soundness and innovation in the industry. International Journal of Production Economics, 2012. 137(1): p. 84-93. [CrossRef]
- Wang, X., et al., Implementation efficiency of corporate social responsibility in the construction industry: A China study. International journal of environmental research and public health, 2018. 15(9): p. 2008. [CrossRef]
- You, T. and H. Zi, The economic crisis and efficiency change: evidence from the Korean construction industry. Applied Economics, 2007. 39(14): p. 1833-1842. [CrossRef]
- Zheng, X., K.-W. Chau, and E.C. Hui, Efficiency assessment of listed real estate companies: an empirical study of China. International Journal of Strategic Property Management, 2011. 15(2): p. 91-104. [CrossRef]
- Dinh, T.N., et al., The effect of quantitative easing on Asian construction firms’ performance. International Journal of Construction Management, 2023. 23(1): p. 38-47. [CrossRef]
- Liu, X.-x., et al., Productivity assessment of the real estate industry in China: a DEA-Malmquist index. Engineering, Construction and Architectural Management, 2021. [CrossRef]
- Wang, X., et al., A total factor productivity measure for the construction industry and analysis of its spatial difference: A case study in China. Construction management and economics, 2013. 31(10): p. 1059-1071. [CrossRef]
- Xue, X., et al., Measuring the productivity of the construction industry in China by using DEA-based Malmquist productivity indices. Journal of Construction engineering and Management, 2008. 134(1): p. 64-71. [CrossRef]
- Lewis, T.M., The construction industry in the economy of Trinidad & Tobago. Construction Management and Economics, 2004. 22(5): p. 541-549. [CrossRef]
- Textor, C. Contribution of the secondary sector to overall GDP of Taiwan from 2011 to 2021, by subsector. 2022.
- Musarat, M.A., W.S. Alaloul, and M. Liew, Impact of inflation rate on construction projects budget: A review. Ain Shams Engineering Journal, 2021. 12(1): p. 407-414. [CrossRef]
- Ofori, G., Nature of the construction industry, its needs and its development: A review of four decades of research. Journal of construction in developing countries, 2015. 20(2): p. 115.
- Charnes, A., W.W. Cooper, and E. Rhodes, Measuring the efficiency of decision making units. European journal of operational research, 1978. 2(6): p. 429-444. [CrossRef]
- Banker, R.D., A. Charnes, and W.W. Cooper, Some models for estimating technical and scale inefficiencies in data envelopment analysis. Management science, 1984. 30(9): p. 1078-1092. [CrossRef]
- Tone, K., A slacks-based measure of efficiency in data envelopment analysis. European journal of operational research, 2001. 130(3): p. 498-509. [CrossRef]
- Kapelko, M. and A. Oude Lansink, Technical efficiency and its determinants in the Spanish construction sector pre-and post-financial crisis. International Journal of Strategic Property Management, 2015. 19(1): p. 96-109. [CrossRef]
- Hu, X. and C. Liu, Measuring efficiency, effectiveness and overall performance in the Chinese construction industry. Engineering, Construction and Architectural Management, 2018. 25(6): p. 780-797. [CrossRef]
- Chen, K., et al., Measuring destocking performance of the Chinese real estate industry: a DEA-Malmquist approach. Socio-Economic Planning Sciences, 2020. 69: p. 100691. [CrossRef]
- Yang, Z. and H. Fang, Research on green productivity of chinese real estate companies—Based on SBM-DEA and TOBIT models. Sustainability, 2020. 12(8): p. 3122. [CrossRef]
- Shin, J., Y. Kim, and C. Kim, The perception of occupational safety and health (OSH) regulation and innovation efficiency in the construction industry: evidence from South Korea. International journal of environmental research and public health, 2021. 18(5): p. 2334. [CrossRef]
- Horta, I.M., et al., The impact of internationalization and diversification on construction industry performance. International Journal of Strategic Property Management, 2016. 20(2): p. 172-183. [CrossRef]
- Peng Wong, W., H.F. Gholipour, and E. Bazrafshan, How efficient are real estate and construction companies in Iran's close economy? International Journal of Strategic Property Management, 2012. 16(4): p. 392-413.
- Yang, G.-l., H. Fukuyama, and K. Chen, Investigating the regional sustainable performance of the Chinese real estate industry: A slack-based DEA approach. Omega, 2019. 84: p. 141-159. [CrossRef]
- Horta, I., et al., Performance trends in the construction industry worldwide: an overview of the turn of the century. Journal of productivity analysis, 2013. 39(1): p. 89-99. [CrossRef]
- Park, J.-L., et al., Comparing the efficiency and productivity of construction firms in China, Japan, and Korea using DEA and DEA-based Malmquist. Journal of Asian architecture and building engineering, 2015. 14(1): p. 57-64. [CrossRef]
- IMF, Regional Economic Outlook, April 2014, Asia and Pacific: Sustaining the Momentum: Vigilance and Reforms. 2014: INTERNATIONAL MONETARY FUND.
- Bénétrix, A.S., B. Eichengreen, and K.H. O'Rourke, How housing slumps end. Economic Policy, 2014. 27(72): p. 647-692. [CrossRef]
- Füss, R. and J. Zietz, The economic drivers of differences in house price inflation rates across MSAs. Journal of Housing Economics, 2016. 31: p. 35-53. [CrossRef]
- Rosenberg, S., The effects of conventional and unconventional monetary policy on house prices in the Scandinavian countries. Journal of Housing Economics, 2019. 46: p. 101659. [CrossRef]
- Ryczkowski, M., MONEY, CREDIT, HOUSE PRICES AND QUANTITATIVE EASING - THE WAVELET PERSPECTIVE FROM 1970 TO 2016. Journal of Business Economics and Management, 2019. 20(3): p. 546-572.
- Zhang, X. and F. Pan, Asymmetric effects of monetary policy and output shocks on the real estate market in China. Economic Modelling, 2021. 103: p. 105600. [CrossRef]
- Acharya, V.V. and G. Plantin, Monetary easing, leveraged payouts and lack of investment. 2019, National Bureau of Economic Research.
- Alter, A. and S. Elekdag, Emerging market corporate leverage and global financial conditions. Journal of Corporate Finance, 2020. 62: p. 101590. [CrossRef]
- Koráb, P., R.S. Mallek, and S. Dibooglu, Effects of quantitative easing on firm performance in the euro area. The North American Journal of Economics and Finance, 2021. 57: p. 101455. [CrossRef]
- Frame, W.S. and E. Steiner, Quantitative easing and agency MBS investment and financing choices by mortgage REITs. Real Estate Economics, 2022. 50(4): p. 931-965. [CrossRef]
- Lin, J.-Y., et al., Impact analysis of US quantitative easing policy on emerging markets. International Journal of Emerging Markets, 2018. [CrossRef]
- Hauzenberger, N., M. Pfarrhofer, and A. Stelzer, On the effectiveness of the European Central Bank’s conventional and unconventional policies under uncertainty. Journal of Economic Behavior & Organization, 2021. 191: p. 822-845. [CrossRef]
- Girardin, E. and Z. Moussa, Quantitative easing works: Lessons from the unique experience in Japan 2001–2006. Journal of International Financial Markets, Institutions and Money, 2011. 21(4): p. 461-495. [CrossRef]
- Bowman, D., et al., Quantitative easing and bank lending: evidence from Japan. 2011.
- Martin, C. and C. Milas, Quantitative easing: a sceptical survey. Oxford Review of Economic Policy, 2012. 28(4): p. 750-764. [CrossRef]
- Tone, K. and M. Tsutsui, Dynamic DEA: A slacks-based measure approach. Omega, 2010. 38(3-4): p. 145-156. [CrossRef]
- Kuo, K.-C., et al., The effect of special economic zones on governance performance and their spillover effects in Chinese provinces. Managerial and Decision Economics, 2020. 41(3): p. 446-460. [CrossRef]
- Kuo, K.C., W.M. Lu, and T.N. Dinh, Firm performance and ownership structure: Dynamic network data envelopment analysis approach. Managerial and decision economics, 2020. 41(4): p. 608-623. [CrossRef]
- Kuo, K.-C., et al. Sustainability and Corporate Performance: Moderating Role of Environmental, Social, and Governance Investments in the Transportation Sector. Sustainability, 2022. 14. [CrossRef]
- Kuo, K.-C., W.-M. Lu, and O. Ganbaatar, Sustainability and profitability efficiencies: the moderating role of corporate social responsibility. International Transactions in Operationolsal Research, 2023. 30(5): p. 2506-2527. [CrossRef]
- Lu, W.-M., W.-K. Wang, and Q.L. Kweh, Intellectual capital and performance in the Chinese life insurance industry. Omega, 2014. 42(1): p. 65-74. [CrossRef]
- Lu, W.-M., K.-C. Kuo, and T.H. Tran, Impacts of positive and negative corporate social responsibility on multinational enterprises in the global retail industry: DEA game cross-efficiency approach. Journal of the Operational Research Society, 2023. 74(4): p. 1063-1078. [CrossRef]
- Wu, W., Z. Liang, and Q. Zhang, Effects of corporate environmental responsibility strength and concern on innovation performance: The moderating role of firm visibility. Corporate Social Responsibility and Environmental Management, 2020. 27(3): p. 1487-1497. [CrossRef]
- Kuo, K.C., W.M. Lu, and O. Ganbaatar, Sustainability and profitability efficiencies: the moderating role of corporate social responsibility. International Transactions in Operational Research, 2023. 30(5): p. 2506-2527.
- Lin, F., S.-W. Lin, and W.-M. Lu, Dynamic eco-efficiency evaluation of the semiconductor industry: a sustainable development perspective. Environmental monitoring and assessment, 2019. 191: p. 1-16. [CrossRef]
- Tsai, W.-C., C.-C. Chen, and S.-F. Chiu, Exploring boundaries of the effects of applicant impression management tactics in job interviews. Journal of Management, 2005. 31(1): p. 108-125. [CrossRef]
- Aiken, L.S., S.G. West, and R.R. Reno, Multiple regression: Testing and interpreting interactions. 1991: sage.
Figure 1.
The Transmission Channels of QE policy: The Case of the United States. Source: [4].
Figure 1.
The Transmission Channels of QE policy: The Case of the United States. Source: [4].
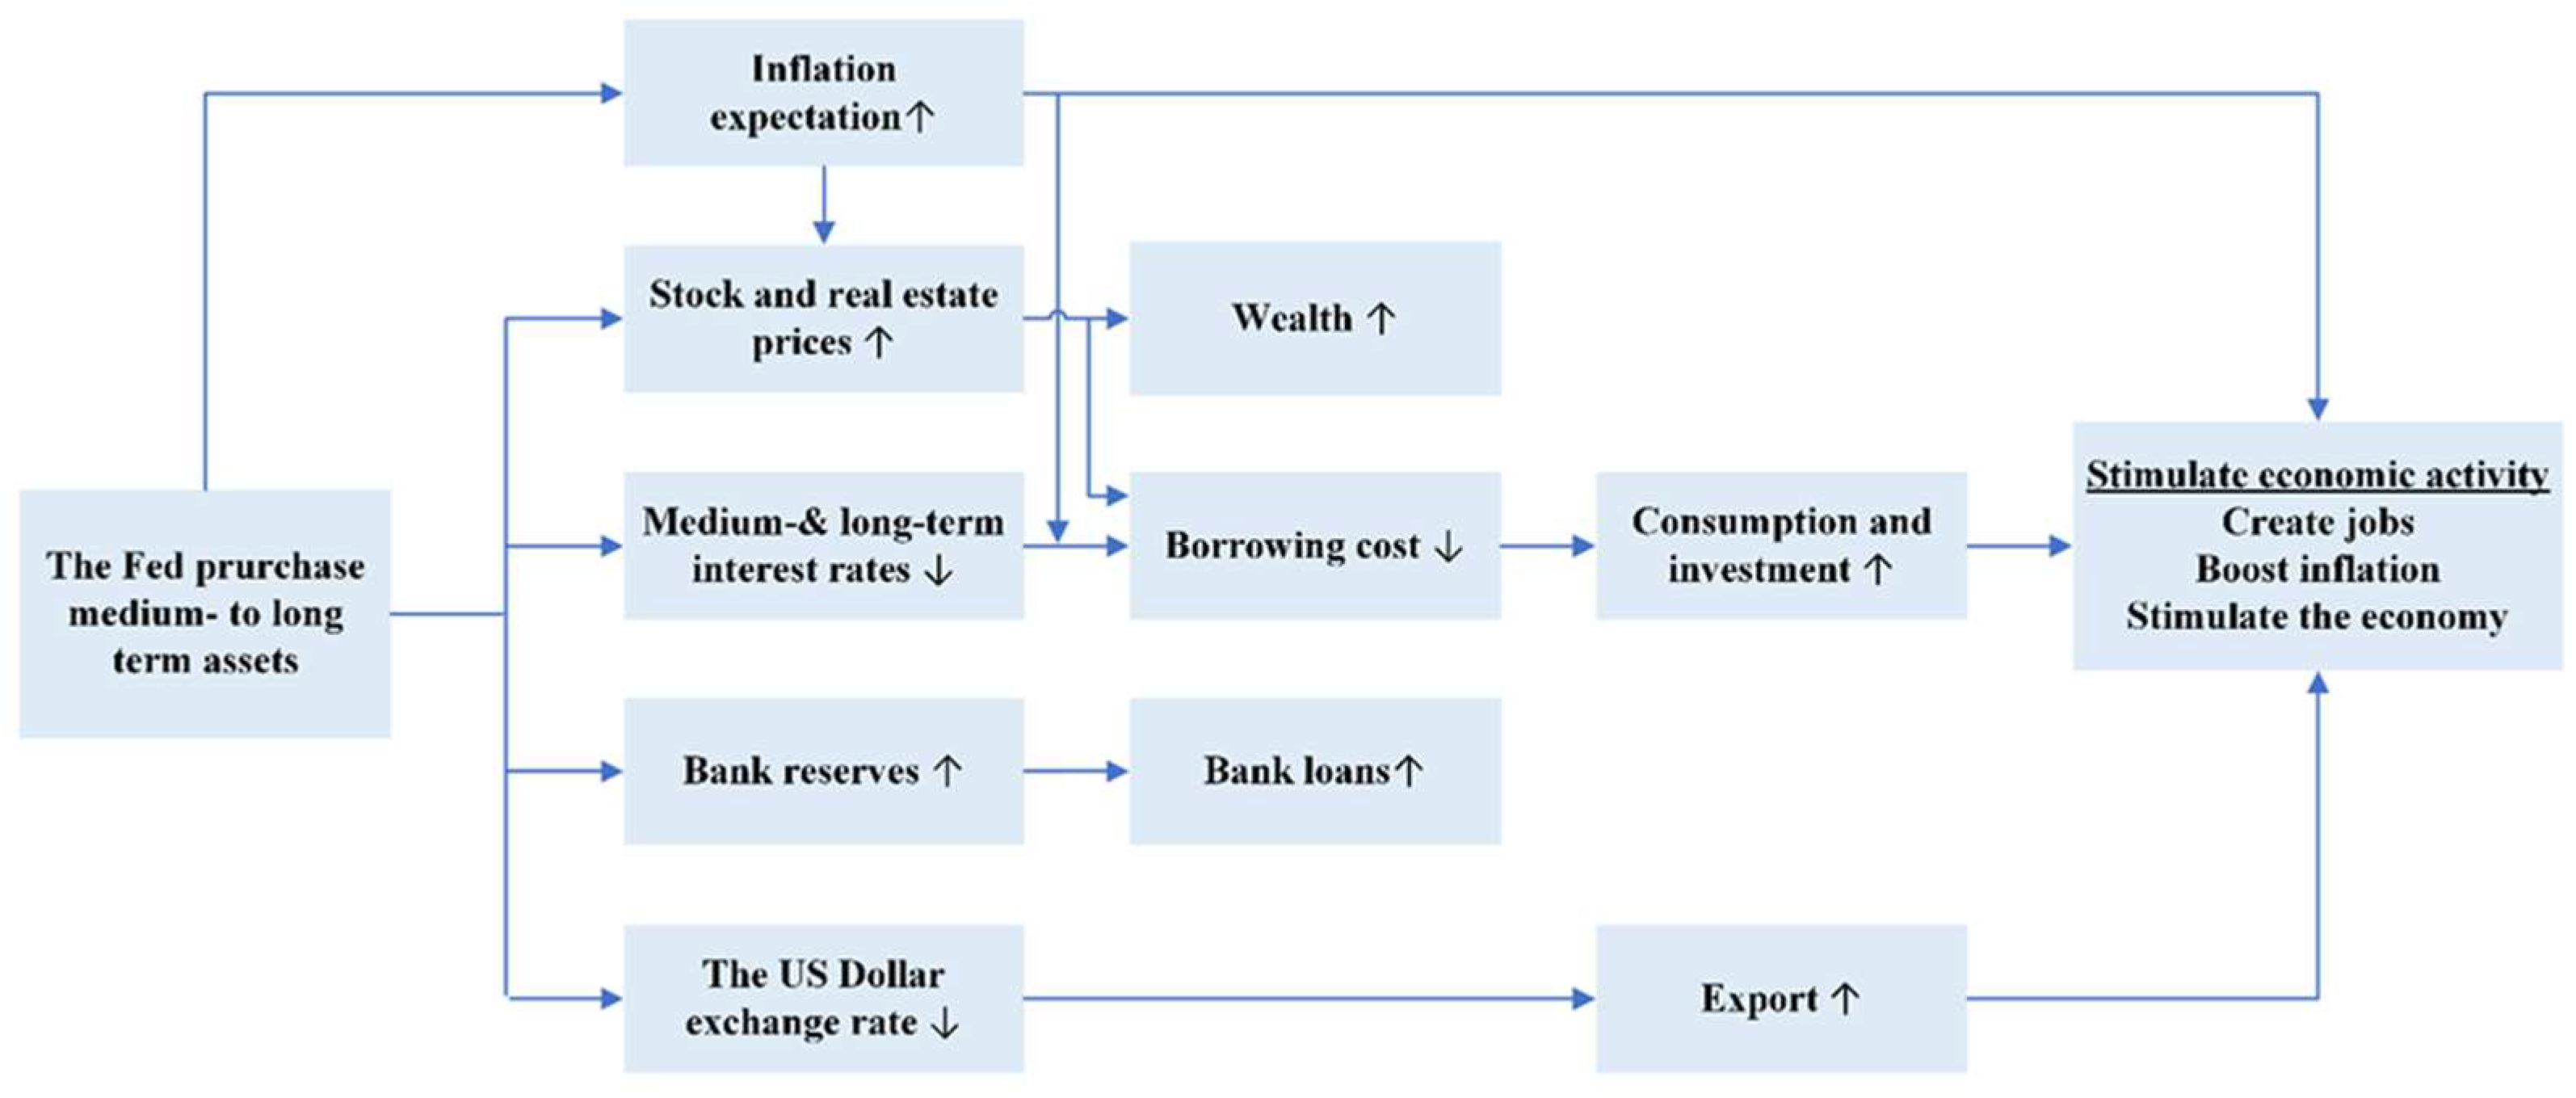
Figure 2.
Conceptual research framework.
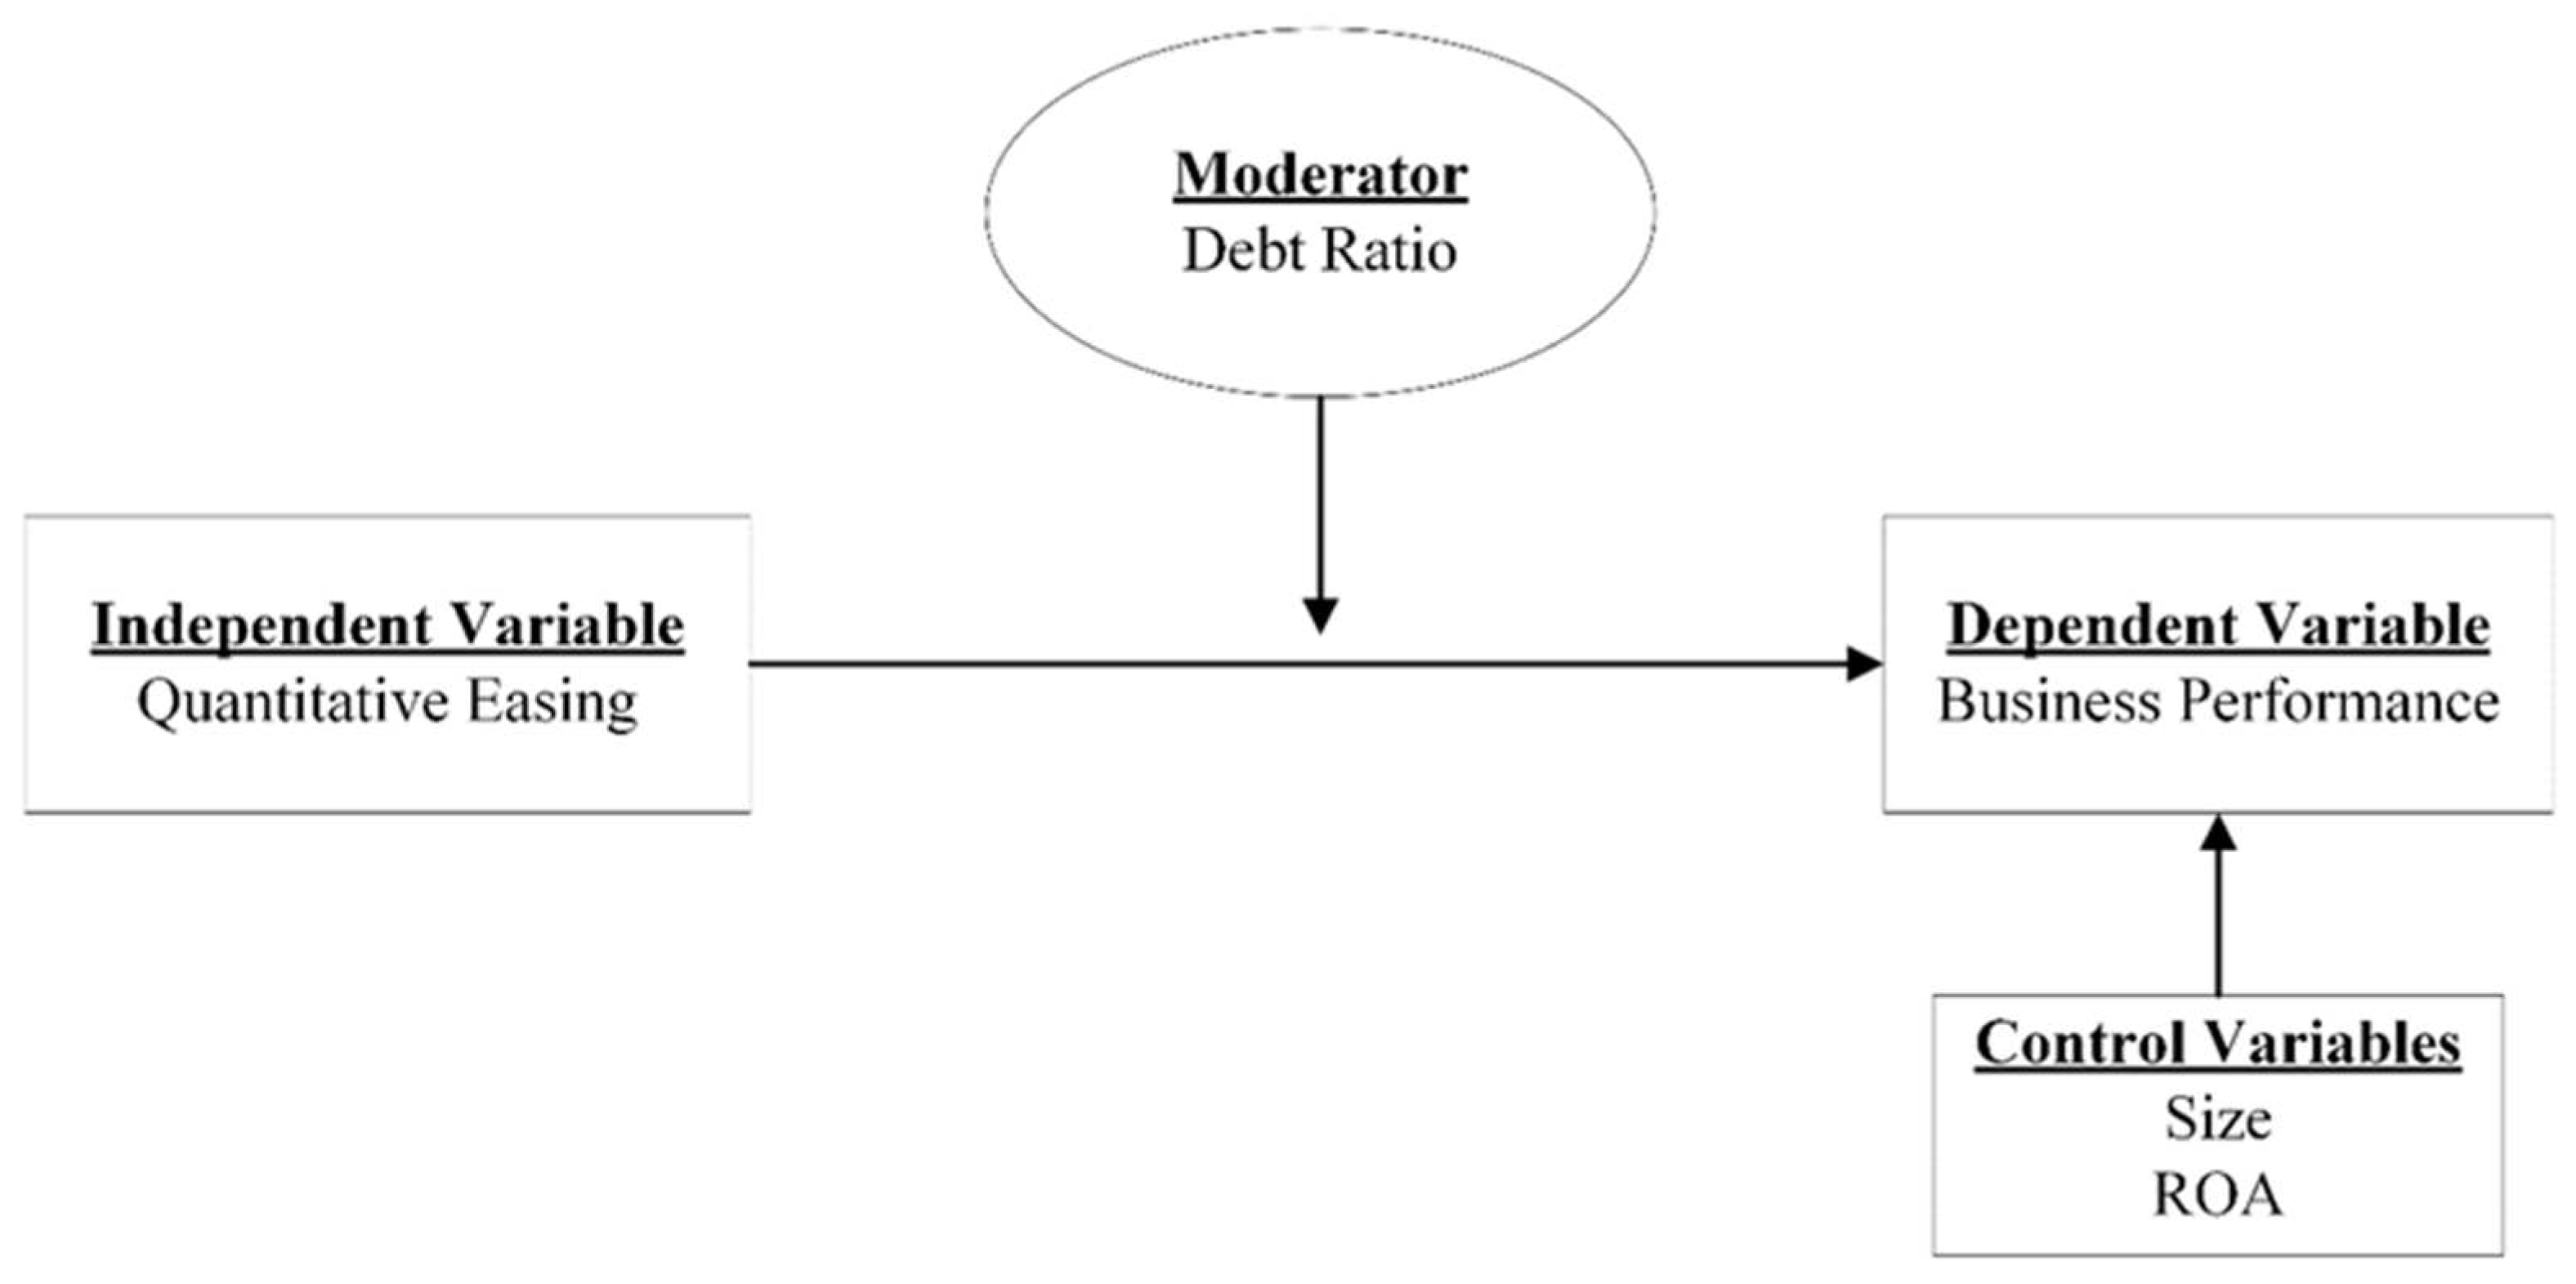
Figure 3.
Dynamic structure.
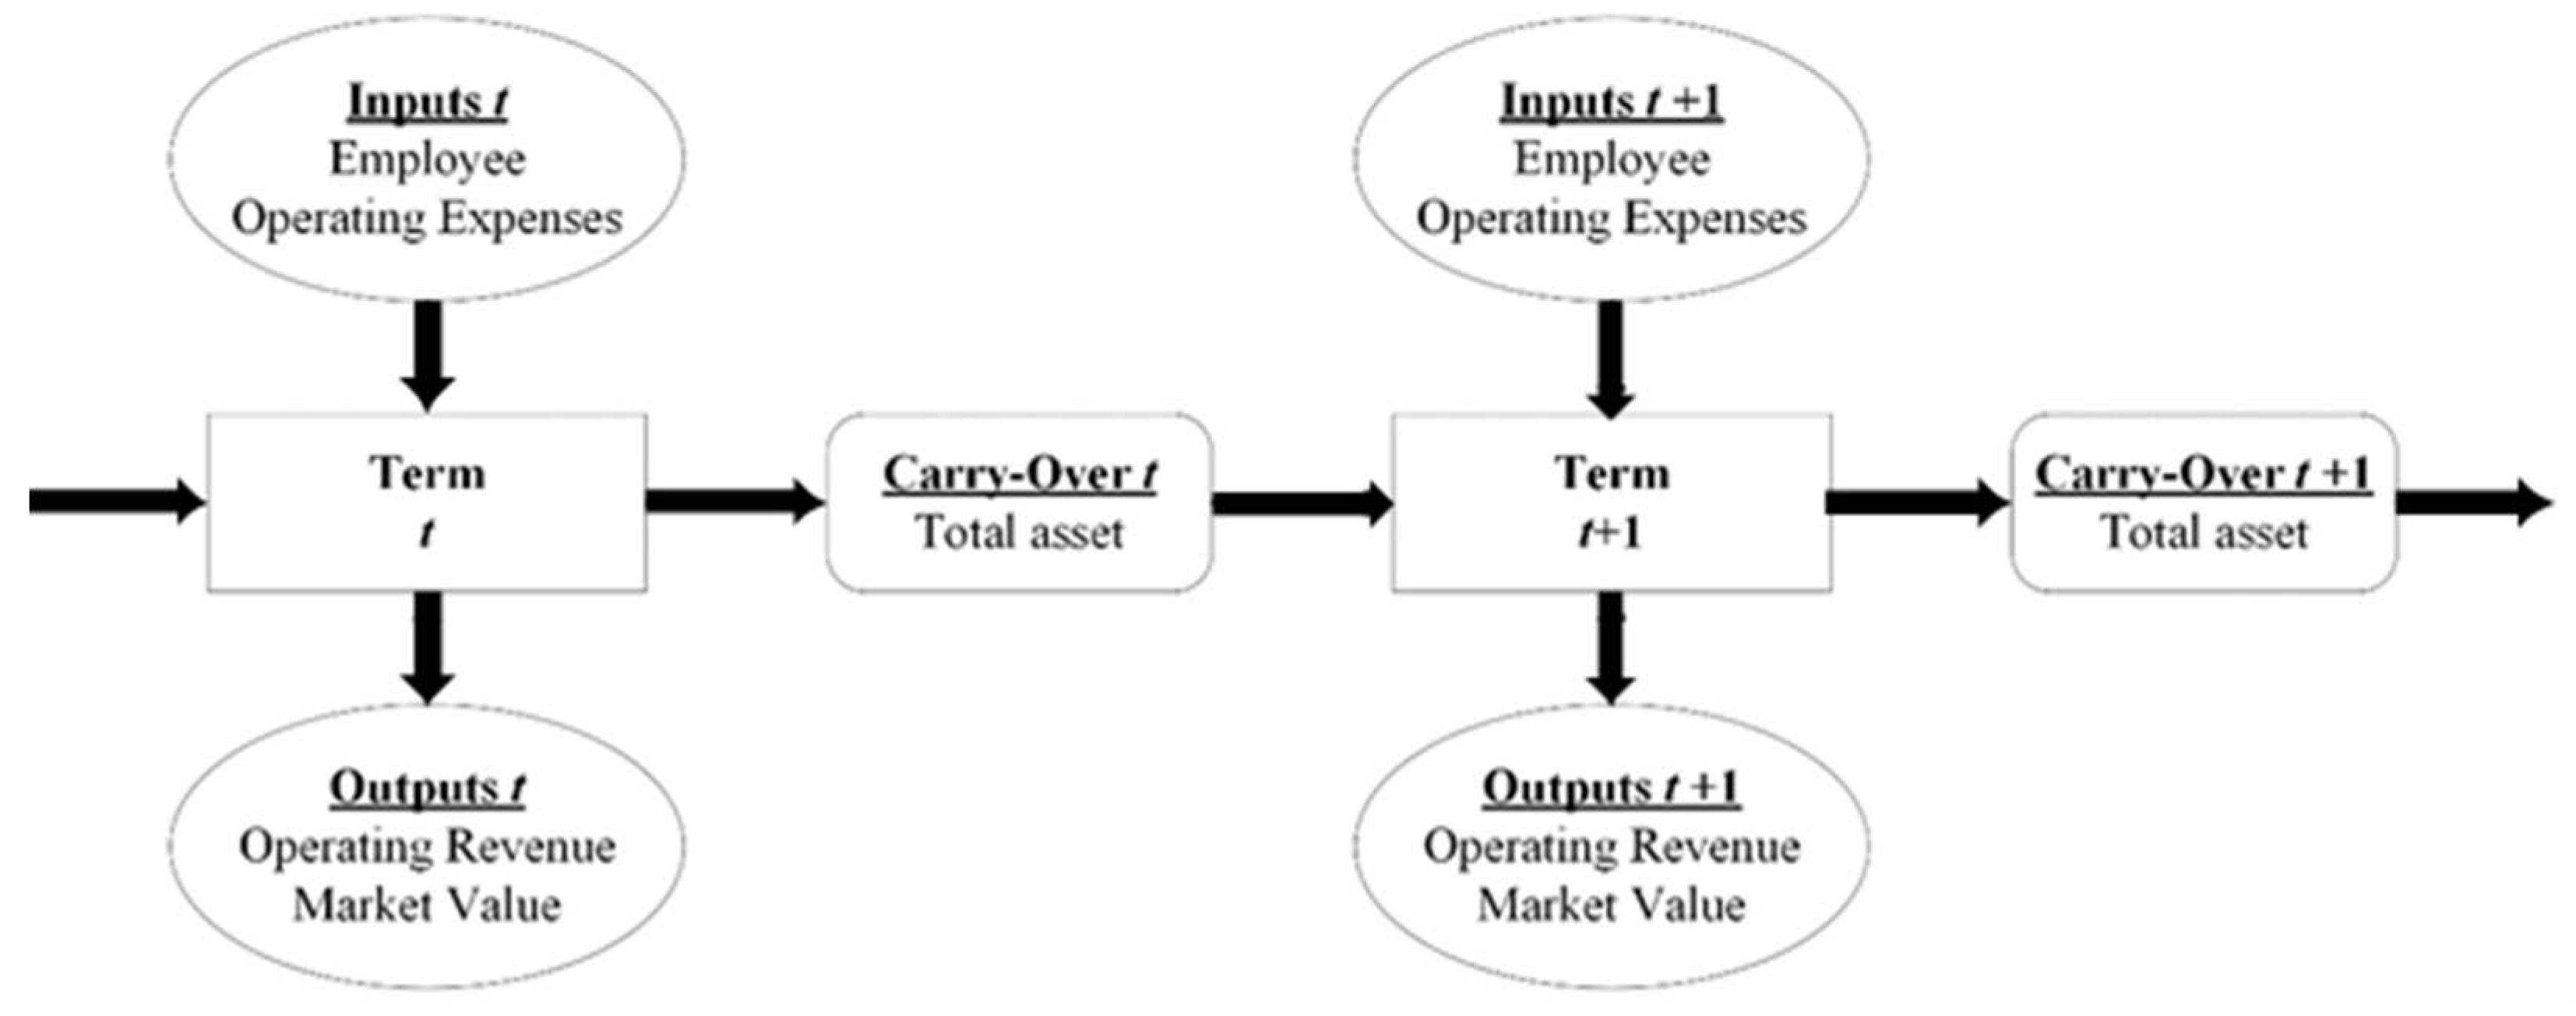
Figure 4.
2004~2015 Trend average statistics of construction companies listed companies.
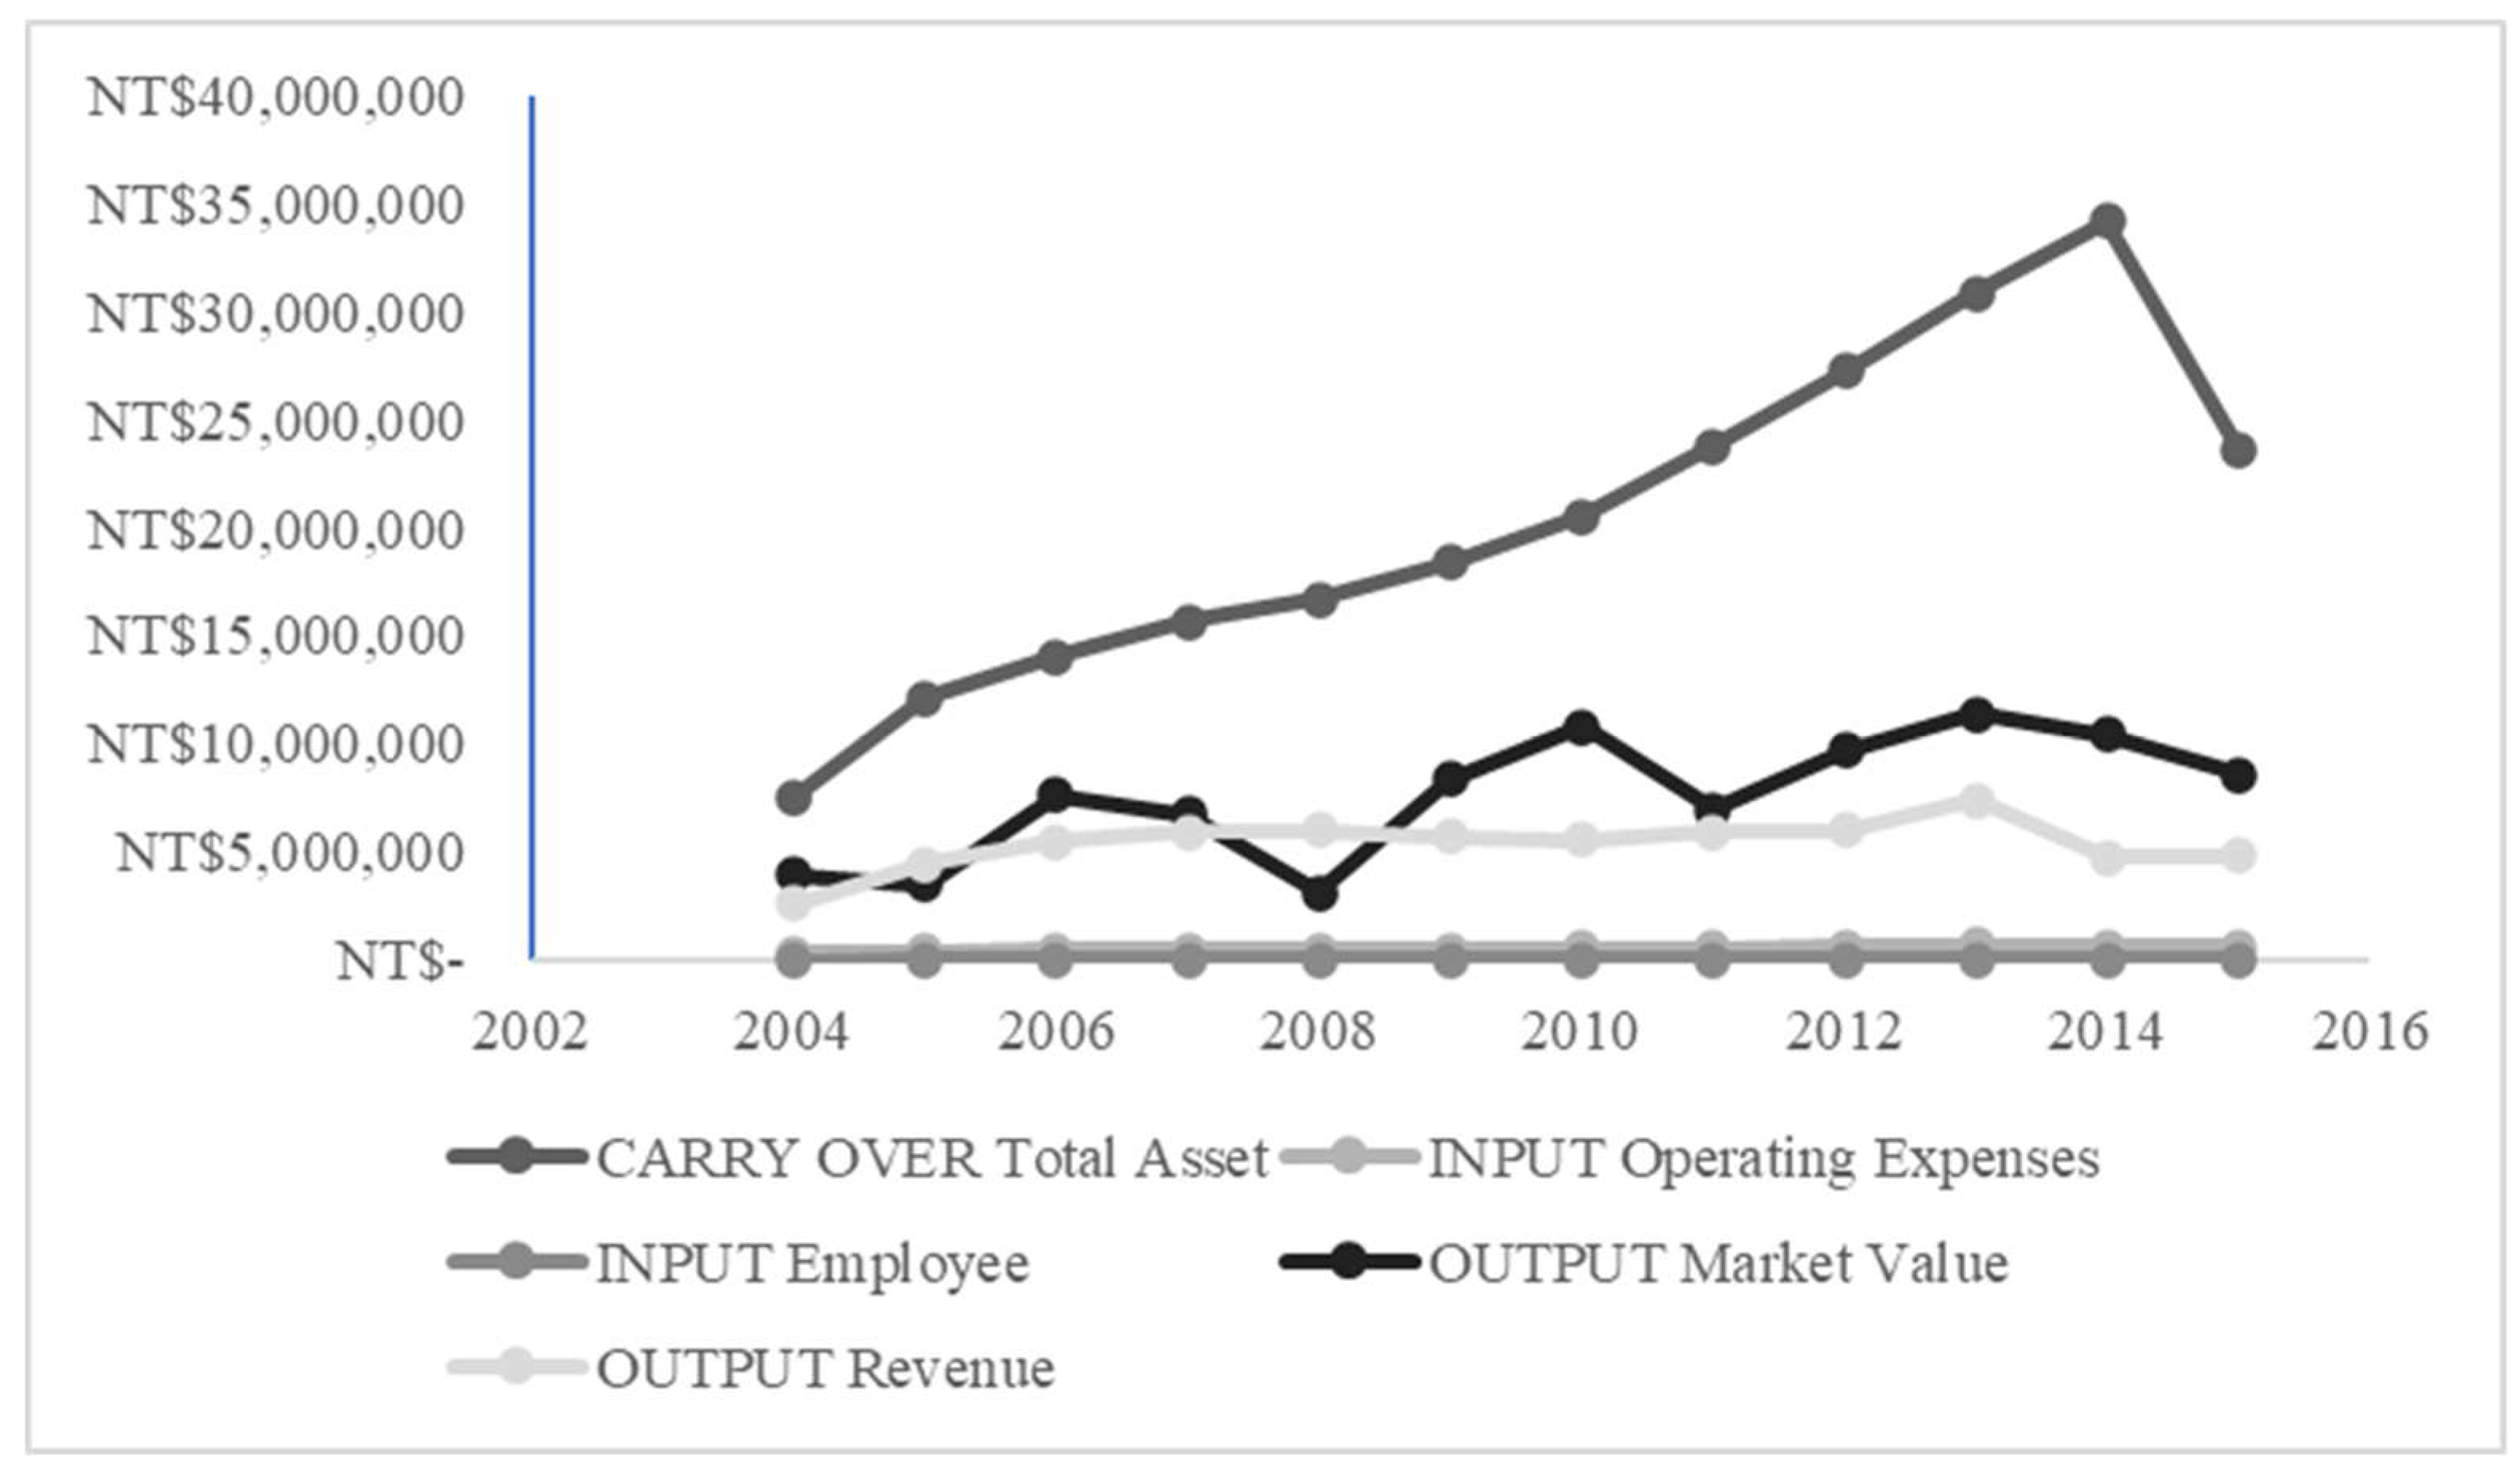
Figure 5.
DSBM’s average performance trend from 2004 to 2015.
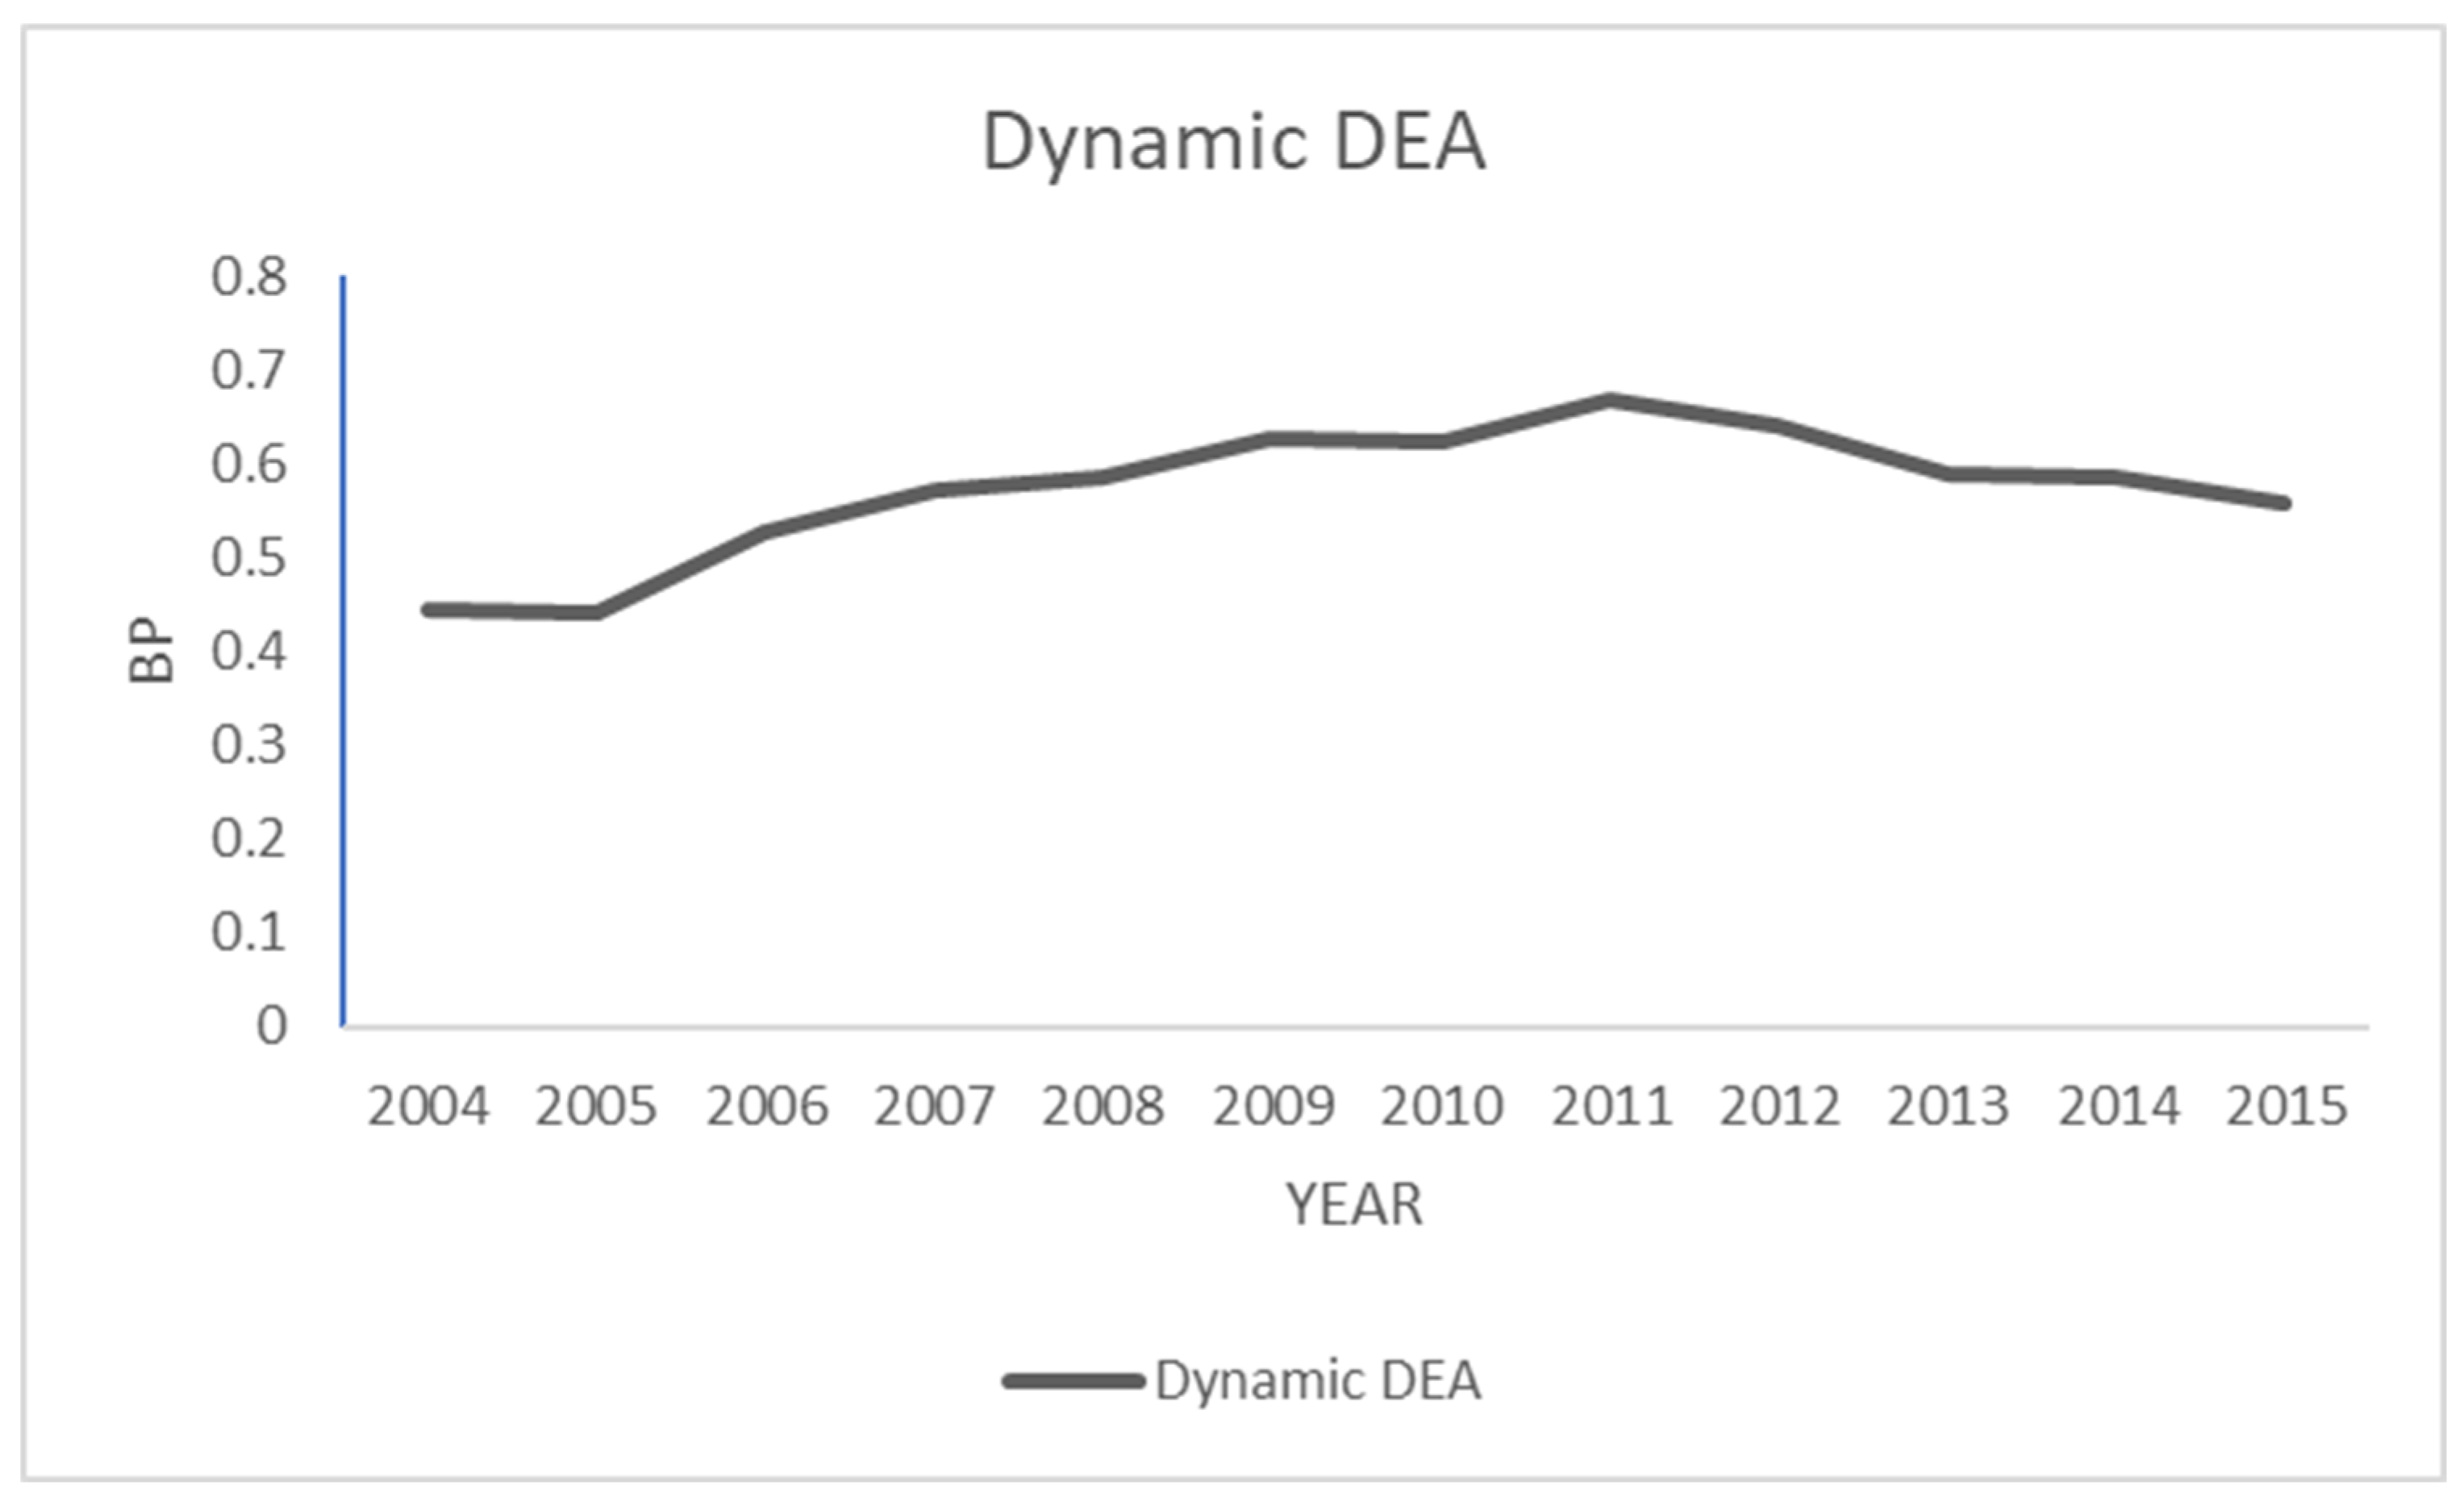
Figure 6.
Two-way interaction effects for Debt Ratio x QE’s simple slope.
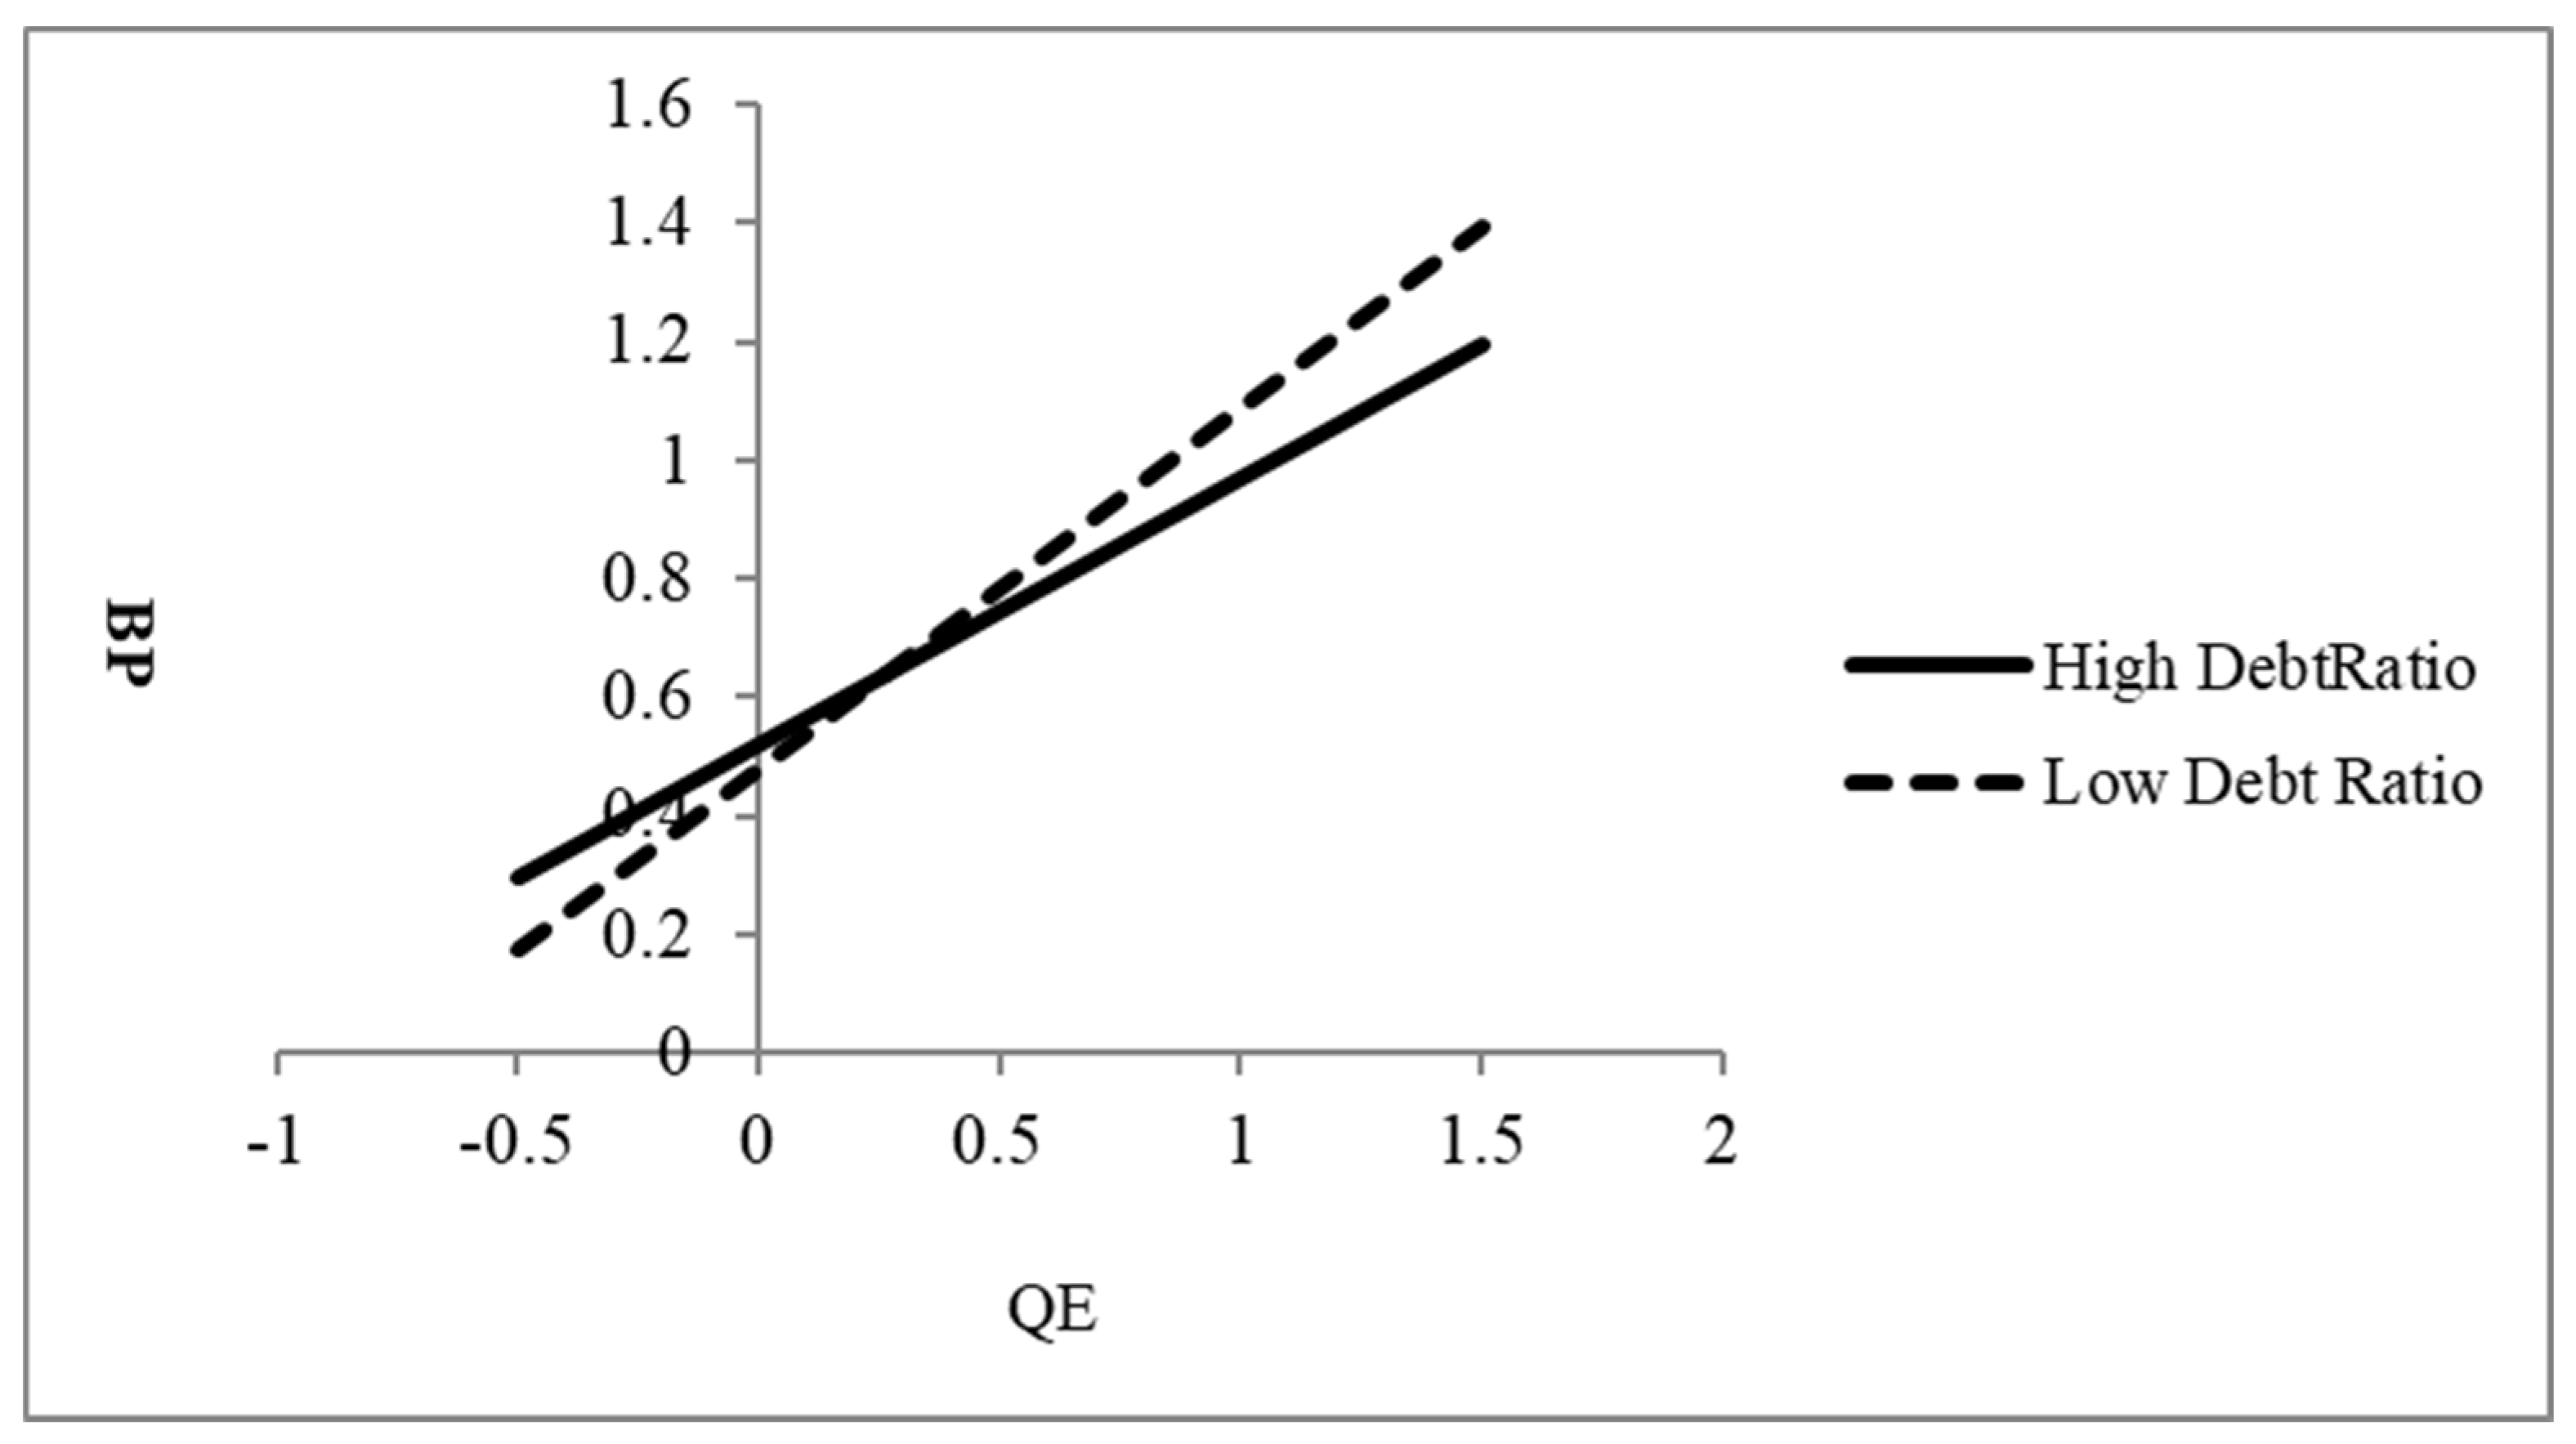
Table 1.
A summary of the methodology used for measuring the performance of construction companies in the selected literature.
Table 1.
A summary of the methodology used for measuring the performance of construction companies in the selected literature.
| Studies | The main issue addressed | Region /Country | Decision-making Units | Method |
|---|---|---|---|---|
| [10] | This study measures technical efficiency and economies of scale for REITs. | US | All REITs as listed in the NAREIT | BCC |
| [11] | This paper explores various efficiency aspects of REITs in light of their remarkable growth in the 1990s. | US | 235 equity REITs | CCR、BCC |
| [14] | This article gauges and analyses different types of efficiency for the period 1996 to 2000. | Korea | Listed construction firms | CCR |
| [19] | This paper measures the productivity changes of the Chinese construction industry from 1997 to 2003. | China | 4 regions construction industry | Malmquist index |
| [15] | This study measures the performance and efficiency of the Listed Real Estate Companies. | China | 94 listed real estate companies | CCR、BCC、Super-efficiency DEA |
| [12] | This paper is to examine trends in the performance of the construction industry and identify the factors that promote excellence and innovation in the sector. | Portugal | 110 major contractors laboring on public works | CCR |
| [33] | This paper explores various efficiency aspects of real estate and construction companies in Iran in light of their remarkable growth in recent years. | Iran | 12 real estate and construction companies | SBM |
| [35] | This paper assesses construction companies' efficiency levels, exploring in particular the effect of location and activity in the efficiency levels. | Worldwide | 118 construction companies | CCR、Malmquist index |
| [18] | The objectives are to put forward a set of systematic methodologies for selecting a productivity index, to develop a TFP measure for the construction industry. |
China | 31 Chinese provinces | Malmquist index |
| [27] | This paper estimates technical efficiency in the construction sector before and after the start of the financial crisis and examines the impact of socio-economic factors on technical efficiency. | Spain | construction industry | BCC |
| [36] | This study aims to compare the efficiency and productivity of Chinese, Japanese, and Korean construction firms between 2005 and 2011. | China、 Japan and Korea |
32 Construction firms |
Malmquist index |
| [32] | This paper investigates the impact of internationalization and diversification strategies on the financial performance of construction companies. | Spain、 Portugal |
90,875 Construction companies | CCR |
| [28] | This paper aims to develop a simultaneous measurement of overall performance and its two dimensions of efficiency and effectiveness. | China | 31 provinces | Two-stage DEA |
| [13] | This paper analyzes the CSR efficiency of construction companies from 2012 to 2016. | China | 55 listed construction companies | Three-stage DEA |
| [34] | This paper aims to investigate the regional sustainable performance of the real estate industry from 2007 to 2013. | China | 30 provinces | Three-stage network DEA |
| [29] | This paper aims to measure the evolution of the destocking performance of the Real Estate Industry. | China | 62 central cities and other regions | Malmquist index |
| [30] | This paper evaluates the green productivity of real estate companies statically and dynamically. | China | 15 real estate companies | SBM、 Malmquist index |
| [17] | This study mainly investigates the total factor productivity of the real estate industry from 2007 to 2016. | China | 30 provinces | Malmquist index |
| [31] | This study measures the innovation efficiency of construction companies and investigates the relationship between innovation efficiency and OSH regulations. | Korea | 90 construction companies | BCC |
Table 2.
Definitions of variables used in dynamic structure.
| Variables | Description | Unit | Reference |
|---|---|---|---|
| Inputs | |||
| Operating expenses | The expenses incurred through each construction company's operating activities within the statistical year. |
1,000 TWD | [10,11,15,33] |
| Employee | The human capital of each construction company within the statistical year. | Number of people | [12,13,14,15,17,18,19,28,29,30,33,34,36] |
| Outputs | |||
| Revenue | The income is received from the operating activities of each construction company within the statistical year. |
1,000 TWD | [12,14,15,17,18,27,30,31,33,34,35,36] |
| Market value | The value of each construction company within the statistical year is the total outstanding shares multiplied by the price per share. | 1,000 TWD | [53,54,55,56] |
| Carryover | |||
| Total asset | The resources controlled or owned by each construction company within the statistical year. | 1,000 TWD | [10,12,15,17,18,19,28,29,30,32,33,34,36] |
Table 3.
Annual statistics of 43 listed construction companies from 2004 to 2015.
| Year | Variable Unit | Mean | Max. | Min. | SD. | K-S test p-value |
|
|---|---|---|---|---|---|---|---|
| 2004-2015 | CARRYOVER | Total Asset | 20,399,651 | 513,765,929 | 67,456 | 49,205,101 | p<0.01 |
| INPUT | Operating Expenses | 505,458 | 4,362,085 | 8,255 | 677,382 | p<0.01 | |
| Employee | 409 | 8,777 | 6 | 1,081 | p<0.01 | ||
| OUTPUT | Market Value | 7,591,330 | 68,896,213 | 40,600 | 10,439,035 | p<0.01 | |
| Revenue | 5,375,358 | 93,388,930 | 447 | 10,610,906 | p<0.01 | ||
| 2004 | CARRYOVER | Total Asset | 7,565,555 | 30,612,058 | 357,002 | 8,066,572 | |
| INPUT | Operating Expenses | 286,164 | 1,421,472 | 24,278 | 324,750 | ||
| Employee | 165 | 1,130 | 9 | 259 | |||
| OUTPUT | Market Value | 3,931,228 | 32,467,694 | 144,400 | 5,748,799 | ||
| Revenue | 2,564,752 | 14,682,404 | 8,910 | 3,449,044 | |||
| 2005 | CARRYOVER | Total Asset | 12,099,505 | 190,832,588 | 295,297 | 29,037,141 | |
| INPUT | Operating Expenses | 371,649 | 2,113,411 | 14,589 | 497,708 | ||
| Employee | 288 | 1,788 | 7 | 498 | |||
| OUTPUT | Market Value | 3,517,519 | 24,019,468 | 116,926 | 4,684,949 | ||
| Revenue | 4,421,445 | 59,952,117 | 7,288 | 9,589,124 | |||
| 2006 | CARRYOVER | Total Asset | 14,073,131 | 217,834,482 | 333,846 | 33,196,029 | |
| INPUT | Operating Expenses | 440,388 | 2,219,759 | 20,576 | 579,230 | ||
| Employee | 320 | 2,308 | 9 | 558 | |||
| OUTPUT | Market Value | 7,613,964 | 38,762,451 | 119,799 | 9,224,576 | ||
| Revenue | 5,486,979 | 59,084,516 | 6,849 | 10,027,593 | |||
| 2007 | CARRYOVER | Total Asset | 15,668,296 | 243,932,850 | 377,687 | 37,217,774 | |
| INPUT | Operating Expenses | 471,300 | 2,429,040 | 17,486 | 587,736 | ||
| Employee | 334 | 2,364 | 9 | 599 | |||
| OUTPUT | Market Value | 6,742,407 | 55,630,640 | 102,068 | 9,801,478 | ||
| Revenue | 5,905,852 | 71,902,022 | 4,311 | 11,603,301 | |||
| 2008 | CARRYOVER | Total Asset | 16,704,320 | 256,563,380 | 565,971 | 39,304,494 | |
| INPUT | Operating Expenses | 451,394 | 2,461,484 | 18,642 | 582,777 | ||
| Employee | 451 | 7,746 | 11 | 1,245 | |||
| OUTPUT | Market Value | 3,077,756 | 16,917,873 | 51,310 | 3,785,155 | ||
| Revenue | 5,974,117 | 93,388,930 | 6,098 | 14,590,413 | |||
| 2009 | CARRYOVER | Total Asset | 18,424,987 | 298,661,093 | 314,939 | 45,762,671 | |
| INPUT | Operating Expenses | 473,080 | 2,884,978 | 17,404 | 657,306 | ||
| Employee | 470 | 8,256 | 9 | 1,325 | |||
| OUTPUT | Market Value | 8,338,648 | 50,011,916 | 56,070 | 10,521,434 | ||
| Revenue | 5,728,271 | 77,054,529 | 7,145 | 12,238,482 | |||
| 2010 | CARRYOVER | Total Asset | 20,499,210 | 332,823,105 | 260,662 | 50,962,571 | |
| INPUT | Operating Expenses | 522,998 | 2,786,296 | 15,539 | 726,323 | ||
| Employee | 463 | 8,777 | 6 | 1,386 | |||
| OUTPUT | Market Value | 10,784,411 | 55,451,066 | 67,200 | 13,403,065 | ||
| Revenue | 5,577,582 | 50,892,148 | 10,189 | 9,370,187 | |||
| 2011 | CARRYOVER | Total Asset | 23,802,942 | 363,937,987 | 233,237 | 56,101,951 | |
| INPUT | Operating Expenses | 557,832 | 2,953,826 | 11,774 | 751,909 | ||
| Employee | 473 | 7,815 | 7 | 1,266 | |||
| OUTPUT | Market Value | 6,988,937 | 36,643,068 | 48,090 | 8,818,972 | ||
| Revenue | 5,949,557 | 67,769,843 | 10,340 | 11,216,922 | |||
| 2012 | CARRYOVER | Total Asset | 27,289,835 | 421,631,217 | 67,456 | 65,125,582 | |
| INPUT | Operating Expenses | 612,433 | 4,362,085 | 13,233 | 910,910 | ||
| Employee | 473 | 7,815 | 6 | 1,266 | |||
| OUTPUT | Market Value | 9,701,175 | 59,777,575 | 40,600 | 12,334,021 | ||
| Revenue | 5,973,852 | 91,043,785 | 447 | 14,342,822 | |||
| 2013 | CARRYOVER | Total Asset | 30,907,529 | 455,509,421 | 606,556 | 70,653,851 | |
| INPUT | Operating Expenses | 691,194 | 3,793,422 | 11,489 | 844,259 | ||
| Employee | 488 | 7,815 | 6 | 1,265 | |||
| OUTPUT | Market Value | 11,370,469 | 68,896,213 | 521,272 | 13,316,573 | ||
| Revenue | 7,416,686 | 71,023,298 | 60,914 | 12,304,434 | |||
| 2014 | CARRYOVER | Total Asset | 34,193,889 | 513,765,929 | 609,515 | 79,155,427 | |
| INPUT | Operating Expenses | 590,493 | 2,927,776 | 8,255 | 701,977 | ||
| Employee | 495 | 7,815 | 6 | 1,265 | |||
| OUTPUT | Market Value | 10,454,865 | 60,105,226 | 662,599 | 12,874,811 | ||
| Revenue | 4,716,964 | 37,515,171 | 9,850 | 6,783,894 | |||
| 2015 | CARRYOVER | Total Asset | 23,566,612 | 114,195,943 | 619,937 | 26,650,414 | |
| INPUT | Operating Expenses | 596,566 | 2,989,867 | 8,795 | 741,252 | ||
| Employee | 491 | 7,815 | 11 | 1,254 | |||
| OUTPUT | Market Value | 8,574,579 | 59,707,533 | 471,091 | 11,408,340 | ||
| Revenue | 4,788,241 | 34,638,039 | 23,596 | 6,819,592 | |||
Unit: Thousand NT$ (Total Asset、Operating Expenses、Market Value、Revenue)、 Person (Employee). Data Source: TEJ database
Table 4.
Correlation coefficient among all input and output factors.
| Total Asset | Operating Expenses | Employee | Market Value | Revenue | |
|---|---|---|---|---|---|
| Total Asset | 1.000 | ||||
| Operating Expenses | 0.657** | 1.000 | |||
| Employee | 0.807** | 0.647** | 1.000 | ||
| Market Value | 0.326** | 0.617** | 0.198** | 1.000 | |
| Revenue | 0.807** | 0.795** | 0.720** | 0.400** | 1.000 |
Note: *p < 0.10; ** p < 0.05; *** p < 0.01.
Table 5.
DSBM Model 2004~2015 BP(BP).
| Year | 2004 | 2005 | 2006 | 2007 | 2008 | 2009 | Pre QE Mean | 2010 | 2011 | 2012 | 2013 | 2014 | 2015 | PostQE Mean |
|---|---|---|---|---|---|---|---|---|---|---|---|---|---|---|
| Mean | 0.445 | 0.442 | 0.526 | 0.571 | 0.585 | 0.628 | 0.535 | 0.625 | 0.670 | 0.641 | 0.589 | 0.587 | 0.559 | 0.612 |
| Max | 1.000 | 1.000 | 1.000 | 1.000 | 1.000 | 1.000 | 1.000 | 1.000 | 1.000 | 1.000 | 1.000 | 1.000 | 1.000 | 1.000 |
| Min | 0.017 | 0.010 | 0.015 | 0.028 | 0.036 | 0.023 | 0.022 | 0.026 | 0.104 | 0.019 | 0.033 | 0.009 | 0.047 | 0.040 |
| SD. | 0.375 | 0.383 | 0.399 | 0.382 | 0.384 | 0.354 | 0.380 | 0.357 | 0.336 | 0.348 | 0.391 | 0.344 | 0.333 | 0.352 |
Table 6.
One-, Two- and Three-year lagging periods to verify the performance value before and after QE.
Table 6.
One-, Two- and Three-year lagging periods to verify the performance value before and after QE.
| DSBM in different time effect | BeforeQE | After QE | BeforeQE | AfterQE | BeforeQE | AfterQE | K-S Test (Non-parametric) |
One-Way ANOVA (parametric) |
|---|---|---|---|---|---|---|---|---|
| Mean | Mean | Std. Dev. | Std. Dev. | Df | df | p-value | p-value | |
| QE One year lagging | 0.533 | 0.612 | 0.382 | 0.350 | 258 | 258 | p < .01 | p < .05 |
| QE Two years lagging | 0.546 | 0.609 | 0.380 | 0.350 | 301 | 215 | p < .05 | p < .10 |
| QE Three years lagging | 0.562 | 0.594 | 0.376 | 0.353 | 344 | 172 | p > .10 | p > .10 |
Table 7.
Prediction of BP (BP) From QE Policy.
| BP | ||||
|---|---|---|---|---|
| Variable | Model 1 | Model 2 | Model 3 | Model 4 |
| Control variables | ||||
| SIZE | 0.224*** | 0.215*** | 0.222*** | 0.245*** |
| ROA | 0.045 | 0.041 | 0.039 | 0.029 |
| Independent variable | ||||
| QE | 0.078* | 0.076* | 0.073* | |
| Moderator | ||||
| DebtRatio | -0.022 | -0.051 | ||
| Interaction term | ||||
| QE x DebtRatio | -1.18*** | |||
| R-squared |
0.053 0.053*** |
0.059 0.006* |
0.059 0.000 |
0.072 0.013*** |
| F-statistic | 14.330*** | 3.225* | 0.228 | 7.078*** |
*p < 0.10; **p < 0.05; ***p < 0.01.
Table 8.
Debt Ratio x QE Simple Slope Verification Results.
| Simple slope b | Std. Error | t-value | df | p-value | |
|---|---|---|---|---|---|
| High Debt Ratio | 0.450 | 0.046 | 9.759 | 516 | 0.000 |
| Low Debt Ratio | 0.610 | 0.045 | 13.626 | 516 | 0.000 |
Disclaimer/Publisher’s Note: The statements, opinions and data contained in all publications are solely those of the individual author(s) and contributor(s) and not of MDPI and/or the editor(s). MDPI and/or the editor(s) disclaim responsibility for any injury to people or property resulting from any ideas, methods, instructions or products referred to in the content. |
© 2024 by the authors. Licensee MDPI, Basel, Switzerland. This article is an open access article distributed under the terms and conditions of the Creative Commons Attribution (CC BY) license (https://creativecommons.org/licenses/by/4.0/).
Copyright: This open access article is published under a Creative Commons CC BY 4.0 license, which permit the free download, distribution, and reuse, provided that the author and preprint are cited in any reuse.


