Submitted:
03 December 2025
Posted:
04 December 2025
You are already at the latest version
Abstract
Improving the ride comfort of commercial vehicles is crucial for driver health and operational safety.This study focuses on optimizing the parameters of a cab suspension system to improve its vibration isolation performance. Initially, nonlinear fitting was applied to experimental data characterizing air spring stiffness and damping, which informed the development of a multi-body rigid-flexible coupled dynamic model of the suspension system; its dynamic characteristics were subsequently validated through modal analysis. Road excitation data, filtered through the chassis suspension, were collected during vehicle testing, and displacement excitations for ride comfort simulation were reconstructed using virtual iteration technology. Thereafter, an integrated ISIGHT platform, combining ADAMS and MATLAB, was employed to systematically optimize suspension parameters and key bushing stiffness via a multi-island genetic algorithm. The optimization results demonstrated significant performance improvements: on General roads, the overall weighted root-mean-square acceleration was markedly reduced with enhanced isolation efficiency; on Belgian pave roads, resonance in the cab's X-axis direction was effectively suppressed; and on Cobblestone roads, the pitch angle was successfully constrained within the design limit. This research provides an effective parameter matching methodology for performance optimization of cab suspension systems.
Keywords:
ride comfort simulation
; nonlinear optimization
; multibody dynamics
; virtual iteration technology
; cab suspension
1. Introduction
The ride comfort of commercial vehicles serves not only as a key indicator of product quality but also directly impacts drivers' physical wellbeing and long-term driving safety. As the primary system isolating drivers from road surface vibrations, the cab suspension system plays a decisive role in vehicle vibration comfort [1]. Extensive research confirms that prolonged exposure to whole-body vibration leads to driver fatigue, diminished attention, and even chronic physical damage, thereby increasing driving safety risks [2,3]. In recent years, research on cab suspension systems has evolved from traditional passive configurations towards more intelligent and adaptive solutions, including semi-active and active control strategies [4,5]. For instance, the introduction of Interference Spring Dampers (ISD) structures and fractional-order control methods has demonstrated significant potential in enhancing vibration isolation performance [6]. Concurrently, vehicle dynamics modelling techniques have evolved from simple multi-body approaches to integrated rigid-flexible coupling models, which more accurately reflect the dynamic behaviour of flexible components such as the chassis and anti-roll bars [7,8,9]. This modelling evolution is well reflected in European automotive academic research, exemplified by the systematic vehicle modelling framework proposed by Kisilowski et al. [10].
To further enhance suspension performance, researchers extensively employ optimization techniques such as Design of Experiments (DOE) and genetic algorithms, typically implemented through co-simulation platforms like ADAMS and MATLAB to systematically adjust mounting parameters and bushing stiffness [11,12,13,14,15]. Concurrently, virtual iteration techniques have emerged as a reliable method for reconstructing precise road input signals from real-vehicle measurements, thereby enhancing the credibility of simulation analyses [16,17]. Despite these advances, significant simplifications persist in numerous studies: critical suspension components such as air springs are frequently modelled as linear elements [18], despite clear evidence of their non-linear dynamic characteristics [19,20]. Such simplifications may introduce biases in dynamic predictions and limit the effectiveness of subsequent optimization. Furthermore, many existing optimization efforts focus solely on a single type of road excitation, neglecting the suspension system's stability performance under diverse real-world driving conditions.
To address these gaps, this study proposes an integrated approach for cab suspension system modelling, excitation reconstruction, and multi-condition optimization. The specific contributions are threefold: (1) Employing nonlinear fitting techniques to process experimental data on air spring stiffness and damping characteristics, thereby constructing a multibody rigid-flexible coupled dynamic model of the suspension system, whose dynamic properties are validated through modal analysis; (2) Acquiring road excitation data filtered by the chassis suspension and using virtual iteration techniques to reconstruct displacement excitation required for ride comfort simulation; (3) Within the ISIGHT-ADAMS-MATLAB integrated simulation environment, employing a multi-island genetic algorithm to systematically optimize suspension and bushing parameters across multiple road conditions. Results demonstrate significant improvements in ride comfort metrics across different road types, providing an effective parameter matching methodology for optimising cab suspension system performance.
2. Dynamics Modeling of Multi-Body Rigid–Elastic Coupling for Suspension Systems
2.1. Fitting of Experimental Data for Air Spring Dampers
The air spring damper unit serves as the core component of the prototype vehicle's cab suspension system, integrating the functions of both an air spring and a shock absorber. This study employed an MTS849 damper test rig, utilizing a hydraulic cylinder as the actuator. Test parameters were established in accordance with the QC/T 491-2018 standard, "Technical requirements and bench test methods for automotive shock absorbers" [21]. As illustrated in Figure 1, the damper unit was securely fixed to the upper and lower mounting points of the test rig using a dedicated fixture. The labels in the figure correspond to the following components: ①force sensor; ②fixture; ③air spring damper unit under test; ④hydraulic cylinder actuator.
During the testing process, the shock6.0 software system (the proprietary control and data acquisition suite of the MTS test rig) running on the control computer was used to regulate the actuator to generate vibration signals, with an effective stroke of ±50 mm. The test rig was equipped with displacement and force sensors to continuously capture and record displacement data and damping variations throughout the test. These sensor data were transmitted to the computer for further analysis. The experimental results for the front and rear suspension air spring stiffness and damping are presented in Table 1. The elastic force is defined as , where k is the stiffness coefficient and x is the displacement. The damping force is defined as , where c is the damping coefficient and is the relative velocity.
The experimental data were subsequently subjected to nonlinear fitting. The front suspension stiffness was characterized using a cubic polynomial, where the spring force Fkf of the front mount air spring is expressed as a function of its displacement x:
where A, B, and C are the fitting coefficients for the linear, quadratic, and cubic terms, respectively. The fitting results were A = 2.829, B = −1.35, and C = 0.1267. To quantitatively evaluate the goodness of fit, the coefficient of determination (R2) was employed, which measures the proportion of the variance in the dependent variable that is predictable from the independent variable(s). The obtained R2 value of 0.998 indicates excellent agreement with the experimental data. The fitted curve is shown in Figure 2a.
For the stiffness data of the rear cab mount air spring, a piecewise function fitting method was employed. In this model, the spring force is defined as a function of the displacement x. Linear fitting was applied within the typical operating range, whereas a cubic polynomial was used to characterize the behavior in the large displacement range. The piecewise function is expressed as follows:
where is the linear stiffness, is the pre-load force of the air spring, and are the critical values of the linear segment’s working range, and , , , and g are the fitting coefficients for the quadratic and cubic terms in the compression and extension travel ranges. The fitted values were = 33.37, = −108.4, = −20, = 20, = −80.75, = 15.43, = 14.37, and g = 2.896. The goodness-of-fit for the linear and nonlinear segments was quantified by R2 values of 0.992 and 0.987, respectively, demonstrating high fitting accuracy across the entire operating range. The fitted curve is shown in Figure 2b.
The damping of the air spring exhibits strong nonlinearity and asymmetry. The mathematical model for the damping force can be expressed as [22,23]:
where Fc is the damping force of the spring, is the vibration velocity of the vehicle body, c is the damping coefficient of the damper, is the asymmetry coefficient that represents the difference in damping between compression and rebound strokes, n is the damping characteristic index, and is the sign function of the velocity v.
Equation (3) was used to fit the experimental curves, yielding the mathematical models for the nonlinear damping characteristics of the front and rear suspension air springs in the cabin, as shown in Equations (4) and (5). The fitting quality was validated by R2 values of 0.994 and 0.991 for the front and rear dampers, respectively, confirming the reliability of the proposed damping models. The fitted curves are presented in Figure 2c,d.
2.2. Development of a Multi-Body Rigid–flexible Coupling Dynamics Model for the Suspension System
In the modeling of the cab suspension system, the flexible effects of key components such as the frame and the anti-roll bar have a significant influence on the system's dynamic characteristics; therefore, they must be modeled as flexible bodies to accurately characterize their continuous deformation behavior during vibration transmission. The remaining structures can be simplified as rigid bodies. For this purpose, a global coordinate system based on the frame structure was established: its origin is set at the geometric center of the frame, the zero point of the X-axis is located 1242.5 mm behind the front suspension mounting points, with the positive direction opposite to the vehicle's forward direction; the zero point of the Y-axis coincides with the longitudinal symmetry plane of the frame, with the positive direction pointing towards the driver's right side; the zero point of the Z-axis is aligned with the upper surface of the frame, with the positive direction vertically upward. The specific arrangement of this coordinate system is shown in Figure 3.
Subsequently, the frame and anti-roll bar were meshed in HyperMesh, and modal neutral file (MNF) synthesis was performed to compute their flexible modes. These flexible bodies were then imported into ADAMS/View to construct the flexible components. The cab was simplified by omitting interior components, and its essential properties, including the center of mass, rotational inertia, and mass, were defined based on experimental data. A simplified model of the cab and suspension components was created by determining the geometric, mass, and physical parameters of each component from the actual vehicle to ensure model accuracy. Motion relationships among the frame, cab, and suspension components were then established, enabling the integration of flexible and rigid bodies. Connections within the system were defined as follows: Rubber bushings were used to link the frame and suspension components, the anti-roll bar and the frame, and the anti-roll bar and the cab. The four suspension springs were connected to the cab through bushings. The rear suspension hydraulic lock was modeled using a point-line pair to simulate its connection to the cab bracket. Cylindrical pairs were applied to both ends of the suspension springs, and a sliding pair was added between the cab seat and the seat floor. The final multi-body rigid–flexible coupling dynamics model of the cab suspension system is shown in Figure 4, which provides a schematic representation of the model’s topology and connectivity.
The free modal analysis of the cab suspension system’s coupled rigid–flexible dynamic model was performed using the ADAMS/Vibration module, with the results shown in Table 1. The modal analysis revealed that the first four natural frequencies are relatively low, while the subsequent two frequencies are higher. Notably, the decoupling rate for vertical and yaw motions is high, whereas the decoupling rate for the other four modes is lower. This is primarily attributed to the influence of flexible components in the dynamic model, such as bushings, lateral dampers, and the lateral stabilizer bar. According to automotive theory, the human body is most sensitive to horizontal vibrations in the frequency range of 1–2 Hz and to vertical vibrations in the range of 4–12.5 Hz. As shown in Table 2, the suspension system exhibits a resonant region under road excitation. However, this resonance occurs in a low-speed range (12–38 km/h), calculated based on the tire excitation frequency and the suspension’s natural frequency band [24]. Within this specific low-speed regime, standard damping design is sufficient to keep vibration levels within acceptable limits, making the resonance engineeringly acceptable.
3. Virtual Iteration and Ride Comfort Simulation of the Suspension System
3.1. Principle of Virtual Iteration
Virtual iteration, as an advanced engineering technique, aims to reconstruct unknown input excitations by analyzing the measured output responses of a dynamic system. This method holds significant application value in scenarios where direct measurement of input forces or displacements is impractical or unfeasible, such as the complex excitations present at the interface between a vehicle's chassis and cab. Its core principle treats the multi-body dynamics model as a transfer system and iteratively corrects the input signals until the simulated response converges with the experimentally measured target response. The detailed procedure is as follows:
- System Identification: A multi-body system (MBS) is driven by white noise signals to obtain the system’s white noise response. From this, the transfer function matrix and its inverse matrix are computed.
- Initial Excitation Calculation: The initial guess for the excitation time history, , is derived by transforming the experimentally collected target response, into the frequency domain and multiplying it by the inverse transfer function: . This initial excitation is then applied to the MBS model in a time-domain simulation to produce a first simulated response, .
- Iterative Error Correction: The difference (error) between the simulated response and the target response is calculated. This error signal is fed back through the inverse transfer function to generate a correction term for the excitation. The excitation for the next iteration is updated accordingly. This closed-loop process can be mathematically expressed as:
The steps are repeated iteratively. With each iteration, the simulated response converges toward the measured target response . The process terminates when the error between them falls below a pre-defined acceptable tolerance, meaning the final derived excitation is an accurate representation of the actual input.
3.2. Road Sampling Test for the Prototype Vehicle
This study conducted a vehicle road sampling test at the National Automobile Quality Supervision and Inspection Center in Xiangyang City, Hubei Province, China, in accordance with the GB/T 4970-2009 ride comfort test standard for Category N vehicles [25]. The test aimed to comprehensively evaluate the ride performance of the prototype vehicle by collecting ground excitations filtered through the chassis suspension system, using general highways, Belgian pave roads, and cobblestone roads as pavement inputs. A total of nine accelerometers were installed on the prototype vehicle. Eight of these were positioned at the upper and lower ends of the front and rear air spring dampers, with the remaining one located at the vehicle floor near the driver's seat rail. Each sensor measured acceleration signals along the X, Y, and Z axes, resulting in a total of 27 data channels, as illustrated in Figure 5. Specifically, sensors A1 and A2 were mounted at the lower left and right ends of the front air spring dampers, respectively, while B1 and B2 were positioned at their corresponding upper ends. Similarly, A3 and A4 were placed at the lower left and right ends of the rear air spring dampers, with B3 and B4 at their upper ends.
The acquisition of acceleration signals requires signal acquisition equipment and dedicated signal acquisition cables. In this experiment, an LMS SCADAS data acquisition unit was used in conjunction with a computer running the LMS Test. Lab data acquisition system, as shown in Figure 6. The list of sampling equipment is provided in Table 3. During the testing process, the test driver operated the prototype vehicle on a predetermined route at a specified speed, while the operator simultaneously collected signals from the sensors installed throughout the vehicle. The test speed was set at 50 km/h, and the vehicle was loaded to its rated maximum capacity. Road conditions, weather, load, vehicle status, and passenger distribution during the test day all complied with the specifications of GB/T 4970-2009. Data were collected over three runs. After the test, the acquired signals were inspected, and the raw data were processed using nCode 11.1(64-bit) software to address common data anomalies.
3.3. Load Spectrum Solution
The input channels of the multibody dynamics model are shown in Figure 7, which include four vertical displacements at the frame longitudinal beams, two lateral displacements at the left frame longitudinal beam, and one longitudinal displacement at the second transverse beam, constituting a total of seven input channels. The output channel consists of acceleration signals at the upper end of the suspension system. Based on the input and output channels of the model, corresponding settings are configured in the FEMFAT Lab software, and the ADAMS solver is used to compute the load spectra. Virtual iteration is performed using the acceleration responses collected from the test vehicle on General roads, Belgian pave roads, and Cobblestone roads as target signals. The resulting displacement excitations for these seven input channels after iteration are shown in Figure 8 for the (a) General road, (b) Belgian road, and (c) Cobblestone road. In Figure 8, the horizontal axis represents time (s), and the vertical axis represents the iterated displacement (mm) for each channel.
3.4. Ride Comfort Evaluation Criteria
Vehicle ride comfort assessment is a complex undertaking, currently conducted through both subjective and objective methodologies. Subjective evaluation, while based on the direct perceptions of drivers and passengers, is constrained by significant individual variability, thus rendering it suitable primarily as a complementary method. In contrast, objective evaluation concentrates on the vehicle's vibration isolation capability. This approach quantifies vibration parameters and references established human comfort thresholds, thereby delivering a more scientific and universally applicable assessment when utilized with specialized analytical software.
- Weighted Root Mean Square (RMS) Acceleration
The ISO 2631-1 standard defines the significance and calculation methods for vehicle ride comfort evaluation indices. For steady-state random inputs, the weighted RMS acceleration is employed as the evaluation criterion.
Initially, the 1/3-octave band RMS acceleration is calculated using Equation (7):
where
: RMS acceleration within the 1/3-octave band centered at frequency .
: Upper and lower limit frequencies of the 1/3-octave band centered at .
: One-sided acceleration power spectral density function.
The single-axis weighted RMS acceleration is expressed as:
where
: Single-axis weighted RMS acceleration.
: Weighting coefficient for the - center frequency band.
When considering the x, y, and z axes, the total weighted RMS acceleration is given by:
where
, , : Weighting coefficients for the x, y, and z axes, respectively.
, , : Weighted RMS accelerations for the cabin seat floor in the x, y, and z directions.
- 2.
- Fourth Power Vibration Dose Value (VDV)
Using a single standard to evaluate both steady-state and transient vibration signals is inappropriate. The ISO 2631-1 standard recommends using the peak factor—the absolute ratio of the peak value of the weighted acceleration time history aw(t) to the RMS value of the weighted acceleration—to characterize vibration signals. When the peak factor exceeds 9, the vibration signal is considered transient and should be evaluated using the Vibration Dose Value (VDV).
The VDV is calculated as follows:
The total Vibration Dose Value (VDV) total is the vector sum of the frequency-weighted VDVs along the three axes:
where
VDVx, VDVy, VDVz: Vibration Dose Values for the x, y, and z axes, respectively.
Each axis has corresponding weighting coefficients applied.
- 3.
- Vibration Isolation Rate
The vibration isolation rate of the mount is a key metric for evaluating the isolation performance of the suspension system and ride comfort. Calculating the isolation rate provides a direct quantification of vibration transmission from the chassis to the cab. In this study, the mount isolation rate in a specific direction is defined as:
where
: represents the vibration isolation rate of the suspension.
,: represent the acceleration RMS values at the upper end (connected to the cab) and lower end (connected to the frame) of the mount in the j-th direction, respectively.
: denotes the mount location.
Since the stiffness of the rear mount has a less pronounced impact on cab ride comfort, the driver's seat is positioned closer to the front mount, and the vertical excitation is dominant among all input channels, this study focuses solely on the vertical (Z-direction) isolation rate of the front mount in subsequent analyses.
3.5. Suspension System Ride Comfort Simulation
Commercial vehicles predominantly operate on roadways, thus simulations for ride comfort are performed on typical road surfaces, including a standard highway, Belgian road, and cobblestone road. The simulation involves applying displacement excitations through seven input channels on the chassis and measuring the roll angle (rotation about the X-axis), pitch angle (rotation about the Y-axis), and three-dimensional acceleration signals from the seat floor of the cabin. The vehicle coordinate system is defined with the X-axis forward, Y-axis lateral, and Z-axis vertical, consistent with the global coordinate system established in Section 2.2. The results are evaluated according to the ISO 2631-1 vehicle ride comfort assessment method and the manufacturer’s design standards, with clear optimization goals to refine suspension system parameters.
- Manufacturer’s Cabin Suspension System Design Criteria for Road Testing:
- The maximum permissible side tilt angle of the cabin is <1.5°; the maximum permissible pitch angle is <1.2°.
- The front suspension’s vertical travel range for the cabin should be ≤±40 mm.
- Ride Comfort Target: On a standard road, the ride comfort data at the driver’s seat in the cabin must meet the requirement that the overall directional acceleration should be ≤0.8 m/s2 at any speed and under any operating condition.
These design criteria integrate the evaluation framework of the international standard ISO 2631-1 with the manufacturer's specific vehicle development specifications. The ride comfort target, defined as a total weighted root-mean-square acceleration ≤ 0.8 m/s², is established based on the assessment methodology outlined in ISO 2631-1. In addition, constraints on roll angle, pitch angle, and suspension travel are specified by the manufacturer to ensure vehicle stability and suspension packaging integrity under dynamic conditions. This combined approach aligns the optimization objectives with both internationally recognized evaluation procedures and practical engineering requirements.
The peak factor results from the simulations on different road surfaces are shown in Table 4. For both the standard highway and Belgian road, the peak factor for each axis direction is below 9, making it appropriate to evaluate ride comfort using the weighted acceleration root mean square (RMS). However, for the cobblestone road, the peak factors for the X and Y axes exceed 9. According to the standards, the Vibration Dose Value (VDV) should be used to assess ride comfort in such cases.
In this study, the ride comfort simulation analysis of General roads, Belgian roads, and Cobblestone roads was conducted to investigate vehicle vibration response characteristics and their impact on suspension system performance.
For General road conditions, the simulation results indicate that the vibration acceleration response is predominantly concentrated along the Z-axis, as illustrated in Figure 9a. The vibration energy is primarily concentrated within the 1–5 Hz frequency band, which overlaps with the first few natural frequencies (1–4 Hz) of the cabin-suspension-frame coupled system, suggesting the potential for resonance within this range. The calculated total weighted RMS acceleration is 0.645 m/s2, meeting the manufacturer’s ride comfort standard (≤0.8 m/s2). However, the ride quality was described as uncomfortable. Additionally, the front suspension isolation rate is only 42.3%, highlighting inadequate low-frequency vibration attenuation and the need for targeted optimization.
Under Belgian road conditions, the ride comfort simulation reveals the vehicle’s response on poor road surfaces. As shown in Figure 9b, the Z-axis acceleration exhibits a peak power spectral density (PSD) of 1.79 m2/s3 at 2.56 Hz, while the X-axis acceleration demonstrates spectral peaks in the 9–10 Hz range, with a maximum PSD of 2.03 m2/s3. The Power Spectral Density of the displacement excitation, obtained via Fourier transform, shows its dominant components in the 1–3 Hz frequency band. This low-frequency content in the temporal domain, recorded at a constant vehicle speed of 50 km/h, when combined with the system’s transfer characteristics, results in the observed high-frequency (9–10 Hz) resonant acceleration response along the X-axis, the magnitude of which exceeds the Z-axis acceleration in terms of PSD. Despite compliance with design standards for roll angle, pitch angle, and suspension travel, the total weighted RMS acceleration reaches 2.244 m/s2, rendering the ride quality highly uncomfortable and requiring further optimization. Notably, the front suspension isolation rate improves to 69.97%, demonstrating better vibration isolation for the vehicle frame and validating the adaptability of the original suspension parameters to Belgian road conditions.
For cobblestone road conditions, the simulation further underscores the critical impact of low-frequency vibrations on ride comfort. Previous research has shown that low-frequency vibrations below 10 Hz along the Z-axis significantly affect ride comfort. Consistent with these findings, this study’s results demonstrate that the peak power spectral density is concentrated in the 1–5 Hz band, aligning with the excitation’s peak frequencies, as shown in Figure 9c. This reaffirms the importance of enhancing vibration isolation performance in the low-frequency range. However, the maximum pitch angle exceeds the manufacturer’s specified range (1.53° > 1.2°), and the total weighted RMS acceleration is as high as 2.613 m/s2, classifying the ride comfort as extremely uncomfortable. Nevertheless, the front suspension isolation rate remains relatively high at 60.6%, indicating some adaptability of the original suspension parameters to cobblestone road conditions.
In summary, the ride comfort simulations for the three road conditions reveal that vibrations predominantly concentrate along the Z-axis, with insufficient low-frequency vibration attenuation and resonance phenomena occurring across different road surfaces, leading to driver discomfort. The specific results are shown in Table 5. While the front suspension isolation rate improves on certain road conditions, further optimization is required to enhance overall ride comfort and driving experience.
4. Suspension Parameter Optimization and Matching
4.1. Suspension Parameter Optimization
The optimization of the cabin suspension system is a nonlinear constrained optimization problem. The coefficients of the air spring damper fitting curves are chosen as design variables, which include:
- Front Suspension Stiffness: The first, second, and third order coefficients (A, B, and C) of the fitting curve for the front suspension stiffness, as described by Equation (1).
- Rear Suspension Stiffness: The slope of the linear segment (k), the second-order coefficients (d, f), and the third-order coefficients (e, g) of the fitting curve for the rear suspension stiffness, as described by Equation (2).
- Damping Coefficients: The damping coefficients (c) for both the front and rear suspension dampers, along with the asymmetry coefficient () and the damping characteristic exponent (n) for the dampers, as described by Equation (3).
In total, there are 14 design variables. During the optimization process, the values of these design variables fluctuate within ±30% of the baseline values. The specific value ranges for each design variable are shown in Table 6.
The constraint conditions are given by the manufacturer’s design standards, which include the following requirements:
- The side tilt angle must be less than 1.5°.
- The pitch angle must be less than 1.2°.
- The suspension travel must remain within ±40 mm.
Based on the ride comfort simulation results, suspension parameter optimization was carried out for three different road surfaces. According to the automotive ride comfort evaluation standards:
For General roads and Belgian roads, the objective is to minimize the weighted acceleration RMS as the optimization target. The objective function is expressed as Equation (13).
For transient vibrations on Cobblestone roads, the vibration dose value (VDV) is selected as the optimization target. The objective function is also expressed as Equation (14).
Thereby the mathematical model for optimal matching of cab suspension system parameters is:
where represent the side tilt and pitch angle of the cabin, respectively. correspond to the suspension travel for the front-left, front-right, rear-left, and rear-right positions, respectively.
It is noteworthy that the optimization conducted in this study aims to identify the ideal passive characteristics for the suspension components. The shock absorbers in the current system are passive and non-adjustable. Therefore, the optimized stiffness and damping curves serve as precise design targets for manufacturing custom components in subsequent prototype development. For future research aimed at achieving adaptive performance, these optimal curves could provide valuable reference for the control logic of a semi-active suspension system.
Suspension parameter optimization was performed using an ISIGHT-integrated ADAMS platform with a multi-island genetic algorithm. As shown in Figure 10, the optimization process was implemented as follows: suspension stiffness and damping fitting equations were input through an EXCEL component, with curve characteristics modified by adjusting equation coefficients. Curve data points were then imported into the multibody model via the Data Exchange component, which loaded command files with specified absolute paths. The ADAMS solver was subsequently invoked through the OS Command component to execute ride comfort simulations. Upon simulation completion, result files were automatically generated and read by another Data Exchange component, with data transferred to MATLAB for processing. Within MATLAB, input and output variables corresponding to those in the main program were defined, including critical parameters such as roll angle, pitch angle, suspension travel, and total vibration dose value. The multi-island genetic algorithm in ISIGHT performed iterative optimization to identify the optimal combination of design variables.
The suspension stiffness and damping curves before and after optimization are shown in Figure 11. As illustrated in panels Figure 11a,b, the optimized front suspension stiffness for all three road types is reduced compared to the original stiffness, with the lowest value observed for the general highway, followed by the Belgian road, and the highest for the cobbled road. Regarding the optimized front suspension damping, the damping for the general highway is significantly lower than the baseline, while the damping curve for the Belgian road is almost identical to the baseline, and for the cobbled road, the optimized damping curve is higher than the baseline. The optimization results for front suspension stiffness and damping indicate that better road conditions favor lower stiffness and damping, whereas poorer road conditions require higher stiffness and damping to isolate vibrations transmitted from the road to the cabin, thereby maintaining cabin stability.
As seen in panels Figure 11c,d, the rear suspension stiffness values show minimal change between the optimized and original settings, suggesting that the initial stiffness curve was reasonable. For the rear suspension damping, the damping decreases for the Belgian and cobbled roads, while it increases for the general highway.
4.2. Bushing Stiffness Optimization Matching
In the cab suspension system, rubber bushings are critical components used to connect parts and isolate vibrations. For clarity, the key bushings discussed in this study and their connections are detailed in Table 7.
Based on a single-factor analysis of the bushing stiffness in various directions, the parameters with the most significant impact on seat vibration acceleration were identified and selected as design variables. The selected variables are:
- The Ry-direction rotational stiffness of Bushing 3 (connecting the rear air spring and the hydraulic lock).
- The Ry-direction rotational stiffness and Tz-direction translational stiffness of Bushing 4 (connecting the rear air spring and the rear support).
- The Rx-direction rotational stiffness of Bushing 6 (connecting the lateral damper and the rear bracket).
- The Tx-direction translational stiffness of Bushing 8 (connecting the front upper bracket and the front upper support).
These variables are named: B3Ry, B4Ry, B4Tz, B6Rx, and B8Tx. Their value ranges were set to fluctuate within ±50% of their baseline values. The bushing stiffness was then optimized for the three different road models. The optimal combinations of bushing stiffness values after optimization are presented in Table 8.
Taking the General road as an example, the optimized Z-axis acceleration and the power spectral density of each axis are shown in Figure 12. From Figure 12a, it can be seen that the peak of the Z-axis acceleration signal is significantly reduced. The acceleration signal’s power spectral density plot reveals that the optimized Z-axis power spectral density shows an overall downward trend in the 0–10 Hz range. The peak power spectral density decreases from 0.5 m2/s3 to 0.427 m2/s3, representing a 14.6% reduction. For the X-axis, the power spectral density at 2.8 Hz decreases from 0.133 m2/s3 to 0.102 m2/s3, a reduction of 23.3%. The Y-axis power spectral density increases slightly, indicating a decrease in vibration isolation capacity in the Y-axis direction. However, compared to the reduction in vibration for the X and Z axes, the increase in the Y-axis does not negatively affect ride comfort. Overall, the optimized system significantly improves ride comfort.
For the General road, as shown in Table 9, the total weighted RMS acceleration decreased from 0.645 m/s2 to 0.591 m/s2 after optimization, a reduction of 8.37%. This improvement shifted the subjective comfort rating from “quite uncomfortable” to “somewhat uncomfortable.” Additionally, the front suspension isolation rate increased from 42.3% to 50.5%, indicating enhanced vibration attenuation in the low-frequency range. The power spectral density peaks in the X- and Z-axis directions were also reduced by 23.3% and 12.8%, respectively, further validating the effectiveness of the optimization.
On the Belgian road, the optimization yielded notable improvements in ride comfort. As presented in Table 10, the power spectral density in the X-axis direction was significantly reduced by 35.14%, effectively suppressing resonance in that direction. The total weighted RMS acceleration decreased from 2.537 m/s2 to 2.454 m/s2, a 3.24% reduction. Subjectively, the driver’s comfort improved from “extremely uncomfortable” to “very uncomfortable.” These results align with previous findings that horizontal vibrations contribute more to discomfort than vertical ones, underscoring the importance of bushing parameter optimization.
For the cobblestone road, the optimization successfully brought the pitch angle within the manufacturer’s design limit, reducing it from 1.42° to 1.20°, as shown in Table 11. Although the vibration dose value (VDV) increased by 6.7%, this change remains below the 10% perceptual threshold and thus does not significantly degrade the driver’s subjective comfort. Other indicators, such as roll angle and spring deformation, also saw marginal improvements, confirming the overall robustness of the optimized suspension parameters under severe road conditions.
4.3. Validation of Optimization Results
The suspension system optimization was conducted based on a single road load spectrum. Although improvements in ride comfort were achieved through the optimization of suspension stiffness, damping, and rubber bushing stiffness, the diverse and complex operating conditions of commercial vehicles necessitate further validation of the vibration isolation performance of the optimized suspension system. To this end, various displacement excitation spectra were applied to the optimized multi-body dynamics model for verification under multiple operating conditions.
The validation of the Belgian road optimization was conducted using simulations on General road and cobblestone road conditions, with the results summarized in Table 12. For the General road scenario, metrics such as roll angle, pitch angle, and suspension travel satisfied the design requirements. The weighted root mean square (RMS) acceleration at the seat floor increased from 0.645 m/s2 to 0.686 m/s2, reflecting a 6.3% increase. This vibration change remained below the threshold of 10%, indicating no perceived difference in the driver’s subjective comfort. The increases in the power spectral density (PSD) across all axes were within 10%, and the front suspension isolation rate decreased by 2.4%, with no significant decline in ride comfort.
For the cobblestone road scenario, the pitch angle rose to 1.523°, and the spring travel increased to 39.6 mm. The weighted RMS acceleration decreased by 1.5%, while the vibration dose value (VDV) dropped by 3%, and the front suspension isolation rate improved by 1%. These changes resulted in a slight improvement in ride comfort.
Similarly, the simulation results for validating the General road optimization using Belgian road and cobblestone road conditions are presented in Table 13. Validation of the cobblestone road optimization using General road and Belgian road conditions is detailed in Table 14.
Different road conditions demand varying stiffness and damping characteristics for the suspension system. Since vehicles spend most of their time traveling on standard roads, the optimized results for the Belgian road were chosen as the most suitable suspension system configuration. This selection takes into account both the manufacturer’s design standards and the ride comfort simulation results. The Belgian road optimization not only meets the manufacturer’s design requirements but also ensures that ride comfort on standard roads does not deteriorate. Furthermore, it effectively enhances ride comfort when the vehicle operates under poorer road conditions.
5. Conclusions
This study developed and validated an integrated nonlinear optimization framework for a commercial vehicle cab suspension system, aimed at enhancing ride comfort under various road conditions. The core contributions and research findings are summarized as follows:
Based on the stiffness and damping test data of the air spring damper obtained from the MTS849 test rig according to the QC/T 491-2018 standard, a nonlinear mathematical model of the air spring was derived through curve fitting. All model coefficients of determination (R²) were > 0.987, verifying the fitting accuracy. Building upon this, a multi-body rigid-flexible coupled dynamic model of the cab suspension system was established. Modal analysis was conducted using the ADAMS/Vibration module, validating the model's dynamic characteristics, such as the natural frequency range of 0.973–7.827 Hz and a vertical motion decoupling rate of 98.26%.
Following the ISO 2631-1 standard, vehicle road sampling tests were conducted on three typical road surfaces (General road, Belgian road, and Cobblestone road) using an LMS SCADAS data acquisition system to collect road excitation data filtered through the chassis suspension. Virtual iteration technology was employed to reconstruct the displacement excitation required for ride comfort simulation. This method not only provides precise input for ride comfort simulation but also circumvents the need for complex chassis and tire modeling, addressing the challenge of simulation input when vehicle parameters are limited.
Using the ISIGHT optimization platform integrating ADAMS (Version 2019) and MATLAB (R2023a), 14 suspension parameters (stiffness and damping coefficients) and 5 key bushing stiffness values were selected as design variables. With manufacturer standards for roll angle < 1.5°and pitch angle < 1.2°, and suspension travel of ±40 mm as constraints, the optimization objectives were set as the minimization of the weighted root mean square (RMS) acceleration (for General road/Belgian road) or the Vibration Dose Value (VDV, for Cobblestone road). Nonlinear optimization was performed using the Multi-Island Genetic Algorithm, yielding significant results:
General road: The overall weighted RMS acceleration decreased by 8.37% from 0.645 m/s² to 0.591 m/s²; the front suspension isolation rate improved from 42.3% to 50.5%; subjective comfort improved from "rather uncomfortable" to "a little uncomfortable".
Belgian Road: Resonance in the X-axis was suppressed, with the power spectral density reduced by 35.14%; the overall weighted RMS acceleration decreased by 3.24% from 2.537 m/s² to 2.454 m/s²; comfort improved from "extremely uncomfortable" to "very uncomfortable".
Cobblestone Road: The pitch angle was controlled within the design limit, decreasing from 1.42°to 1.20°. Although the VDV slightly increased by 6.7%, which is below the 10% perception threshold, the overall ride comfort did not show significant deterioration.
Furthermore, the optimized parameters obtained in this study provide a fundamental benchmark and clear design specifications for the development of next-generation passive suspension components. They also lay the foundation for the future implementation of semi-active suspension systems by providing target damping curves for advanced control strategies.
Funding
This work was supported by the Special Project of Central Government for Local Science and Technology Development of Hubei Province (Grant No. 2024CSA082).
Data Availability Statement
The data supporting the findings of this study are available from the corresponding author upon reasonable request.
Conflicts of Interest
The authors declare that they have no known competing financial interests or personal relationships that could have appeared to influence the work reported in this paper.
References
- Lu, Y.; Khajepour, A.; Liu, Y.; Zhen, R. Adaptive cabin suspension systems of commercial vehicles: a review of the state-of-art and future trends. Int. J. Heavy Veh. Syst. 2022, 29, 33–47. [Google Scholar] [CrossRef]
- Bhuiyan, M.H.U.; Fard, M.; Robinson, S.R. Effects of whole-body vibration on driver drowsiness: A review. J. Saf. Res. 2022, 81, 175–189. [Google Scholar] [CrossRef] [PubMed]
- Konieczny, Ł.; Fabis, P.; Matijošius, J.; Duda, K.; Deuszkiewicz, P.; Kilikevičius, A. Analysis of the Impact of Vibrations on the Driver of a Motor Vehicle. Appl. Sci. 2025, 15, 5510. [Google Scholar] [CrossRef]
- Lu, Y.; Khajepour, A.; Soltani, A.; Li, R.; Zhen, R.; Liu, Y.; Wang, M. Gain-adaptive Skyhook-LQR: a coordinated controller for improving truck cabin dynamics. Control Eng. Pract. 2023, 130, 105365. [Google Scholar] [CrossRef]
- Lu, Y.; Zhen, R.; Liu, Y.; Zhong, J.; Sun, C.; Huang, Y.; Khajepour, A. Practical solution for attenuating industrial heavy vehicle vibration: A new gain-adaptive coordinated suspension control system. Control Eng. Pract. 2025, 154, 106125. [Google Scholar] [CrossRef]
- Shen, Y.; Li, J.; Huang, R.; Yang, X.; Chen, J.; Chen, L.; Li, M. Vibration control of vehicle ISD suspension based on the fractional-order SH-GH strategy. Mech. Syst. Signal Process. 2025, 234, 112880. [Google Scholar] [CrossRef]
- Jiang, R.; Jin, Z.; Liu, D.; Wang, D. Multi-Objective Lightweight Optimization of Parameterized Suspension Components Based on NSGA-II Algorithm Coupling with Surrogate Model. Machines 2021, 9, 107. [Google Scholar] [CrossRef]
- Sharma, S.K.; Sharma, R.C.; Choi, Y.; Lee, J. Experimental and Mathematical Study of Flexible–Rigid Rail Vehicle Riding Comfort and Safety. Appl. Sci. 2023, 13, 5252. [Google Scholar] [CrossRef]
- Mo, S.; Chen, K.; Zhang, Y.; Zhou, Y.; Lyu, L.; Yao, B.; Zhang, W. Research on rigid-flexible coupling nonlinear dynamics of light commercial vehicle considering frame flexibility. Int. J. Non-Linear Mech. 2025, 170, 104949. [Google Scholar] [CrossRef]
- Kisilowski, J.; Zalewski, J. Modeling of Road Traffic Events; Springer: Cham, Switzerland, 2022; ISBN 978-3-030-91397-7. [Google Scholar] [CrossRef]
- Țoțu, V.; Alexandru, C. Multi-Criteria Optimization of an Innovative Suspension System for Race Cars. Appl. Sci. 2021, 11, 4167. [Google Scholar] [CrossRef]
- Vahedi, A.; Jamali, A. Constraint optimization of nonlinear McPherson suspension system using genetic algorithm and ADAMS software. J. Vib. Control 2022, 28, 3140–3151. [Google Scholar] [CrossRef]
- Niu, Z.; Sun, J.; Li, Z. Assembly Variation Analysis of Incompletely Positioned Macpherson Suspension Systems Considering Vehicle Load Change. J. Mech. Des. 2021, 143, 051704. [Google Scholar] [CrossRef]
- Zhang, B.; Wang, H.; Li, Z.; Zhou, R. Dynamic modeling of torsion bar spring suspension and sensitivity analysis of K&C characteristics. J. Braz. Soc. Mech. Sci. Eng. 2023, 45, 224. [Google Scholar] [CrossRef]
- Zhang, S.; Chen, Z.; Zhang, W.; Xia, M. Research on dynamic stiffness with the high-order fractional derivative model for rubber bushing. Proc. Inst. Mech. Eng. Part D J. Automob. Eng. 2023, 237, 668–679. [Google Scholar] [CrossRef]
- Zhou, D.L.; Chang, J.L. Fatigue Analysis of a Light Truck Rear Axle Based on Virtual Iteration Method. Shock and Vibration 2022, 2022, 8598491. [Google Scholar] [CrossRef]
- Chen, W.; Zhao, J.; Yu, X.; Zeng, J.; Zhao, M. A comparative study of vehicle frame load spectrum extraction using SA-1DCNN deep learning and virtual iteration. J. Mech. Sci. Technol. 2024. [CrossRef]
- Zhao, S.; Zhang, Y.; Qu, B.; Tian, X.; Zhu, Q. Development of Static Test Equipment and a System for Lever-Loaded Air Springs. Actuators 2024, 13, 231. [Google Scholar] [CrossRef]
- Ahmad, S.S.; Bazaz, M.A.; Hussain, S. Adaptive sliding mode-based active disturbance rejection control for vehicle suspension control. Proc. Inst. Mech. Eng. Part I J. Syst. Control Eng. 2022, 236, 1523–1533. [Google Scholar] [CrossRef]
- Zhao, W.; Gu, L. RBF-Based Fractional-Order SMC Fault-Tolerant Controller for a Nonlinear Active Suspension. Machines 2024, 12, 270. [Google Scholar] [CrossRef]
- QC/T 491-2018; Automobile Shock Absorber Technique Requirements and Test Methods; National Development and Reform Commission of China: Beijing, China, 2018.
- Zhang, Y. Design and Optimization of a Semi-Active Cab Mount System for Commercial Vehicles. Master's Thesis, Wuhan University of Technology, Wuhan, China, 2020. [Google Scholar] [CrossRef]
- Zhang, X.; Sui, Z.; Li, Z. Vibration Damping Test and Nonlinear Modeling of Wheel Loader Cab. Chin. J. Constr. Mach. 2021, 19, 555–560+564. [Google Scholar] [CrossRef]
- Le, V.Q.; Zhang, J.R.; Nguyen, V.L.; Bui, V.C.; Le, X.L.; Do, T.P. Experimental modal analysis and optimal design of cab’s isolation system for a single drum vibratory roller. Vibroengineering PROCEDIA 2020, 31, 52–56. [Google Scholar] [CrossRef]
- GB/T 4970-2009; Mechanical Vibration and Shock—Evaluation of Vehicle Ride Comfort; Standard Press of China: Beijing, China, 2009.
Figure 1.
Clamped shock absorbers.
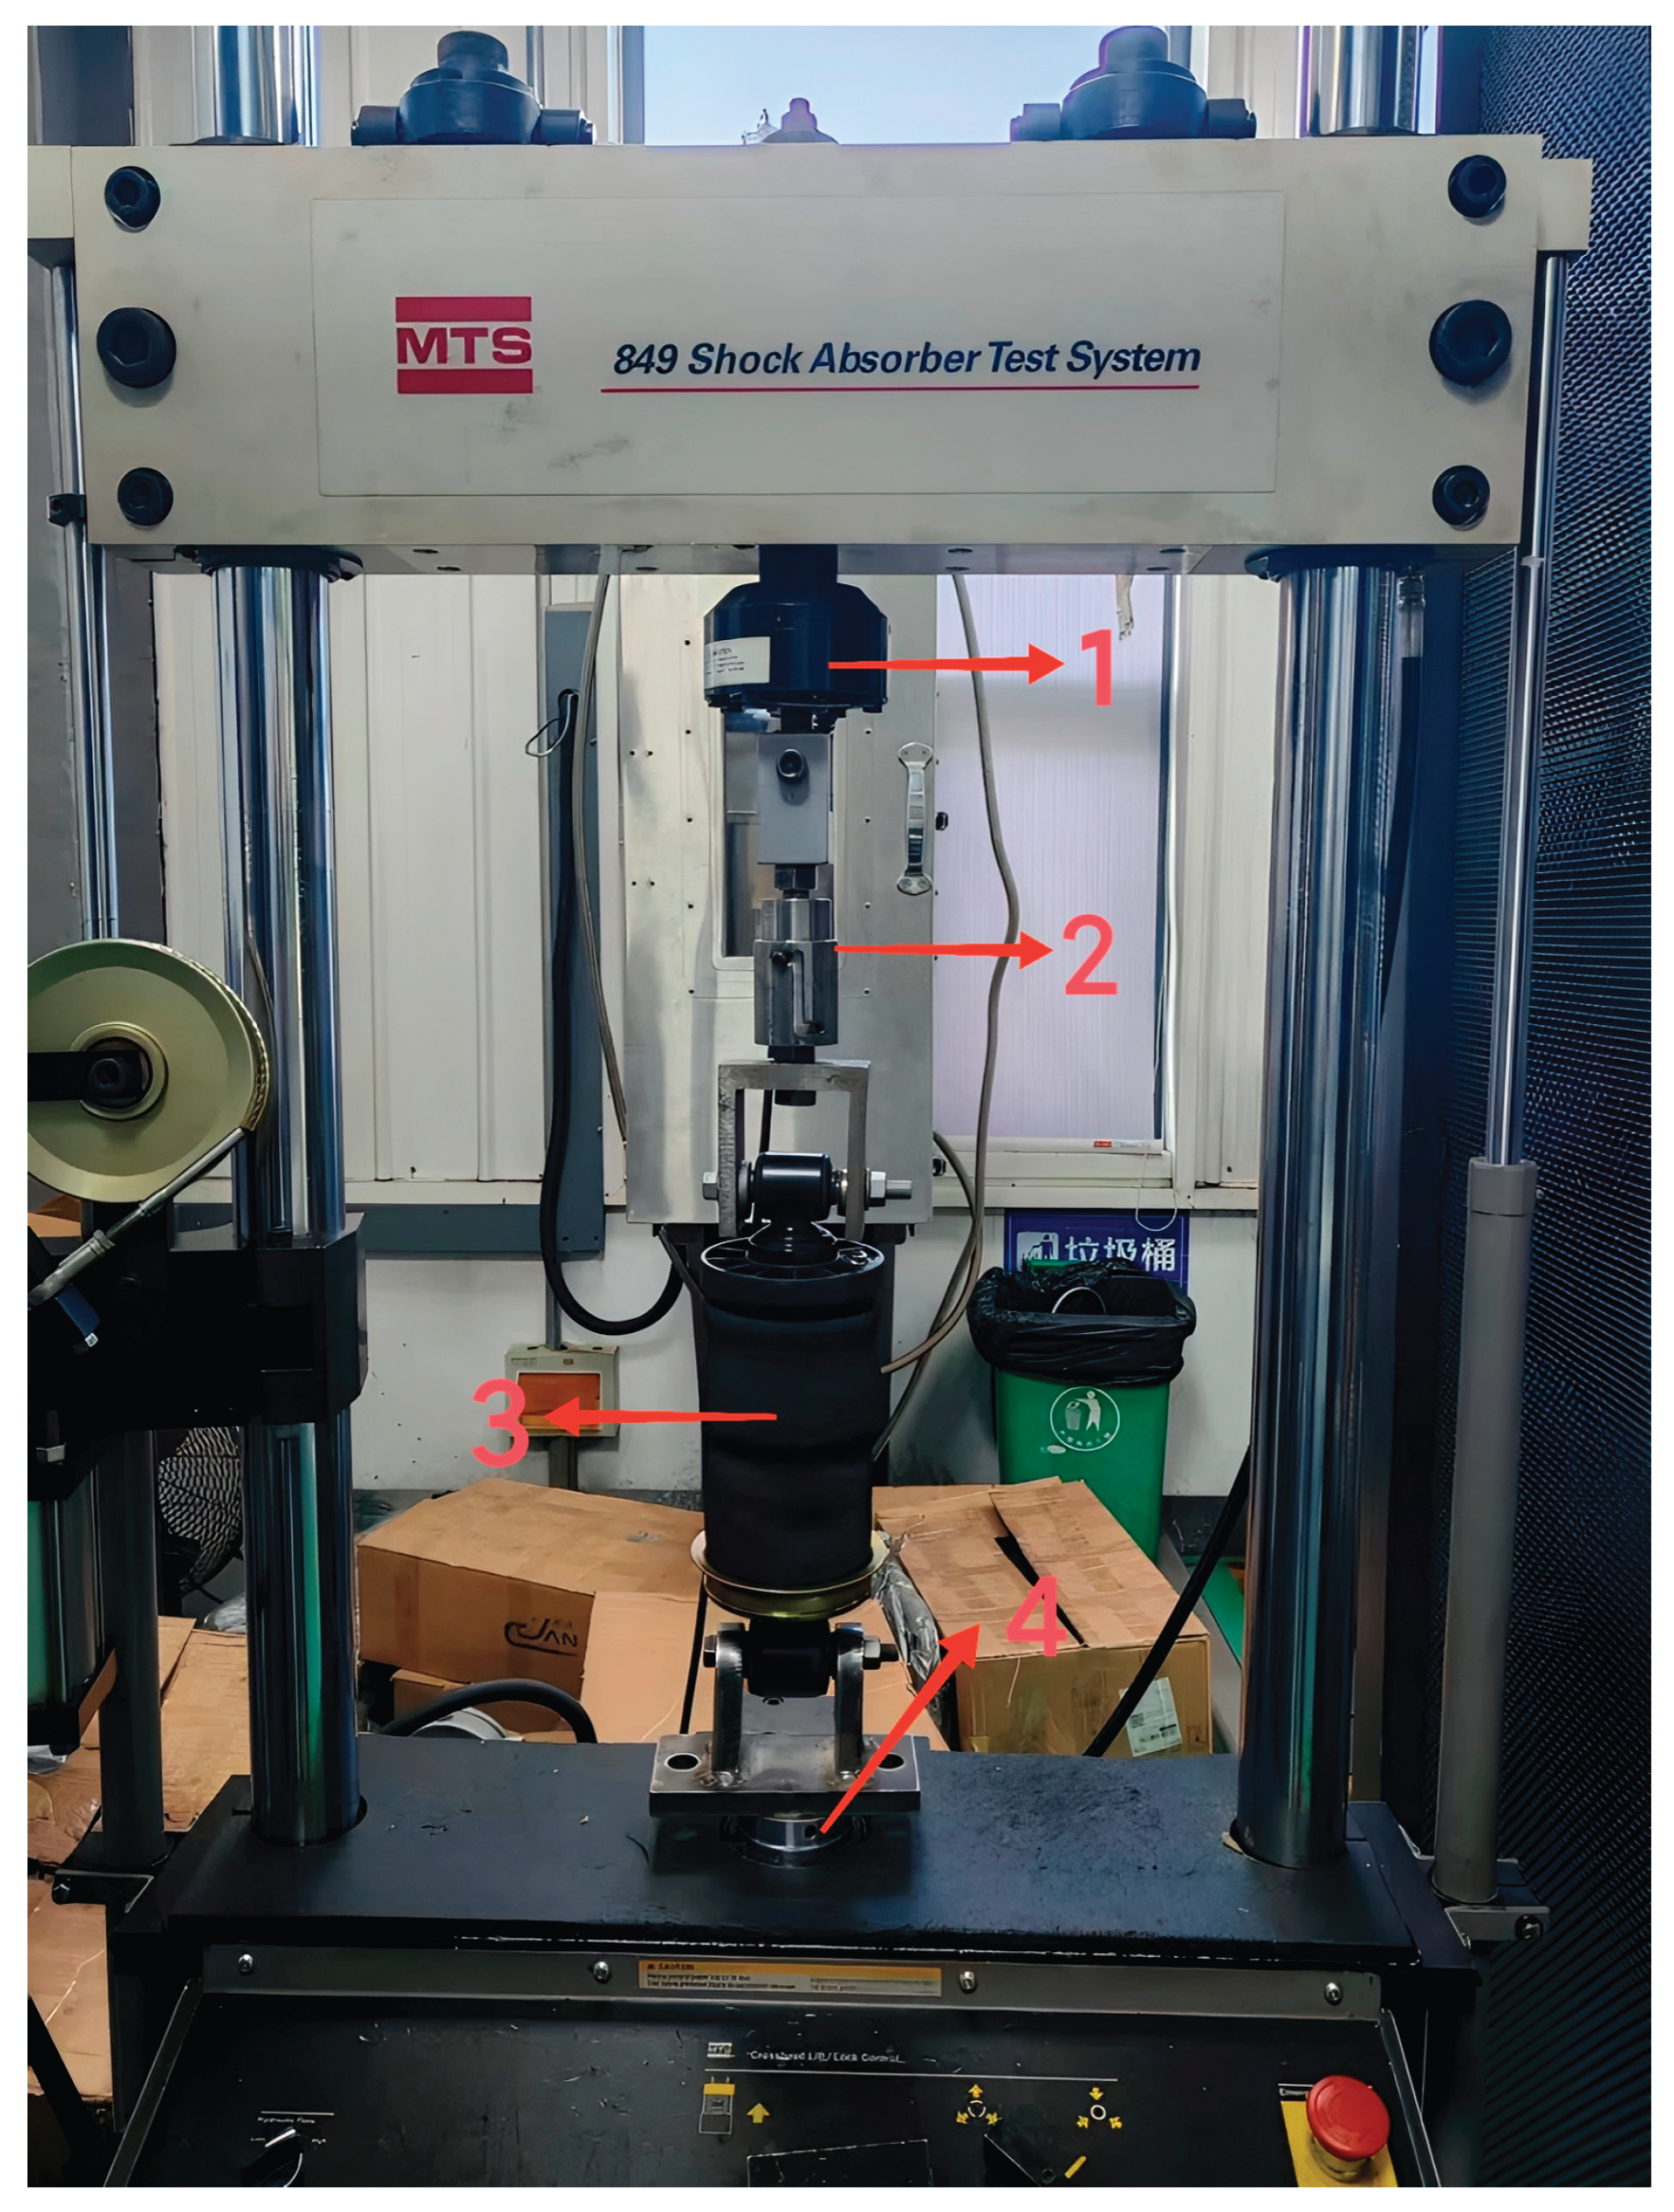
Figure 2.
Fitting Curves of Air Spring Stiffness and Damping.
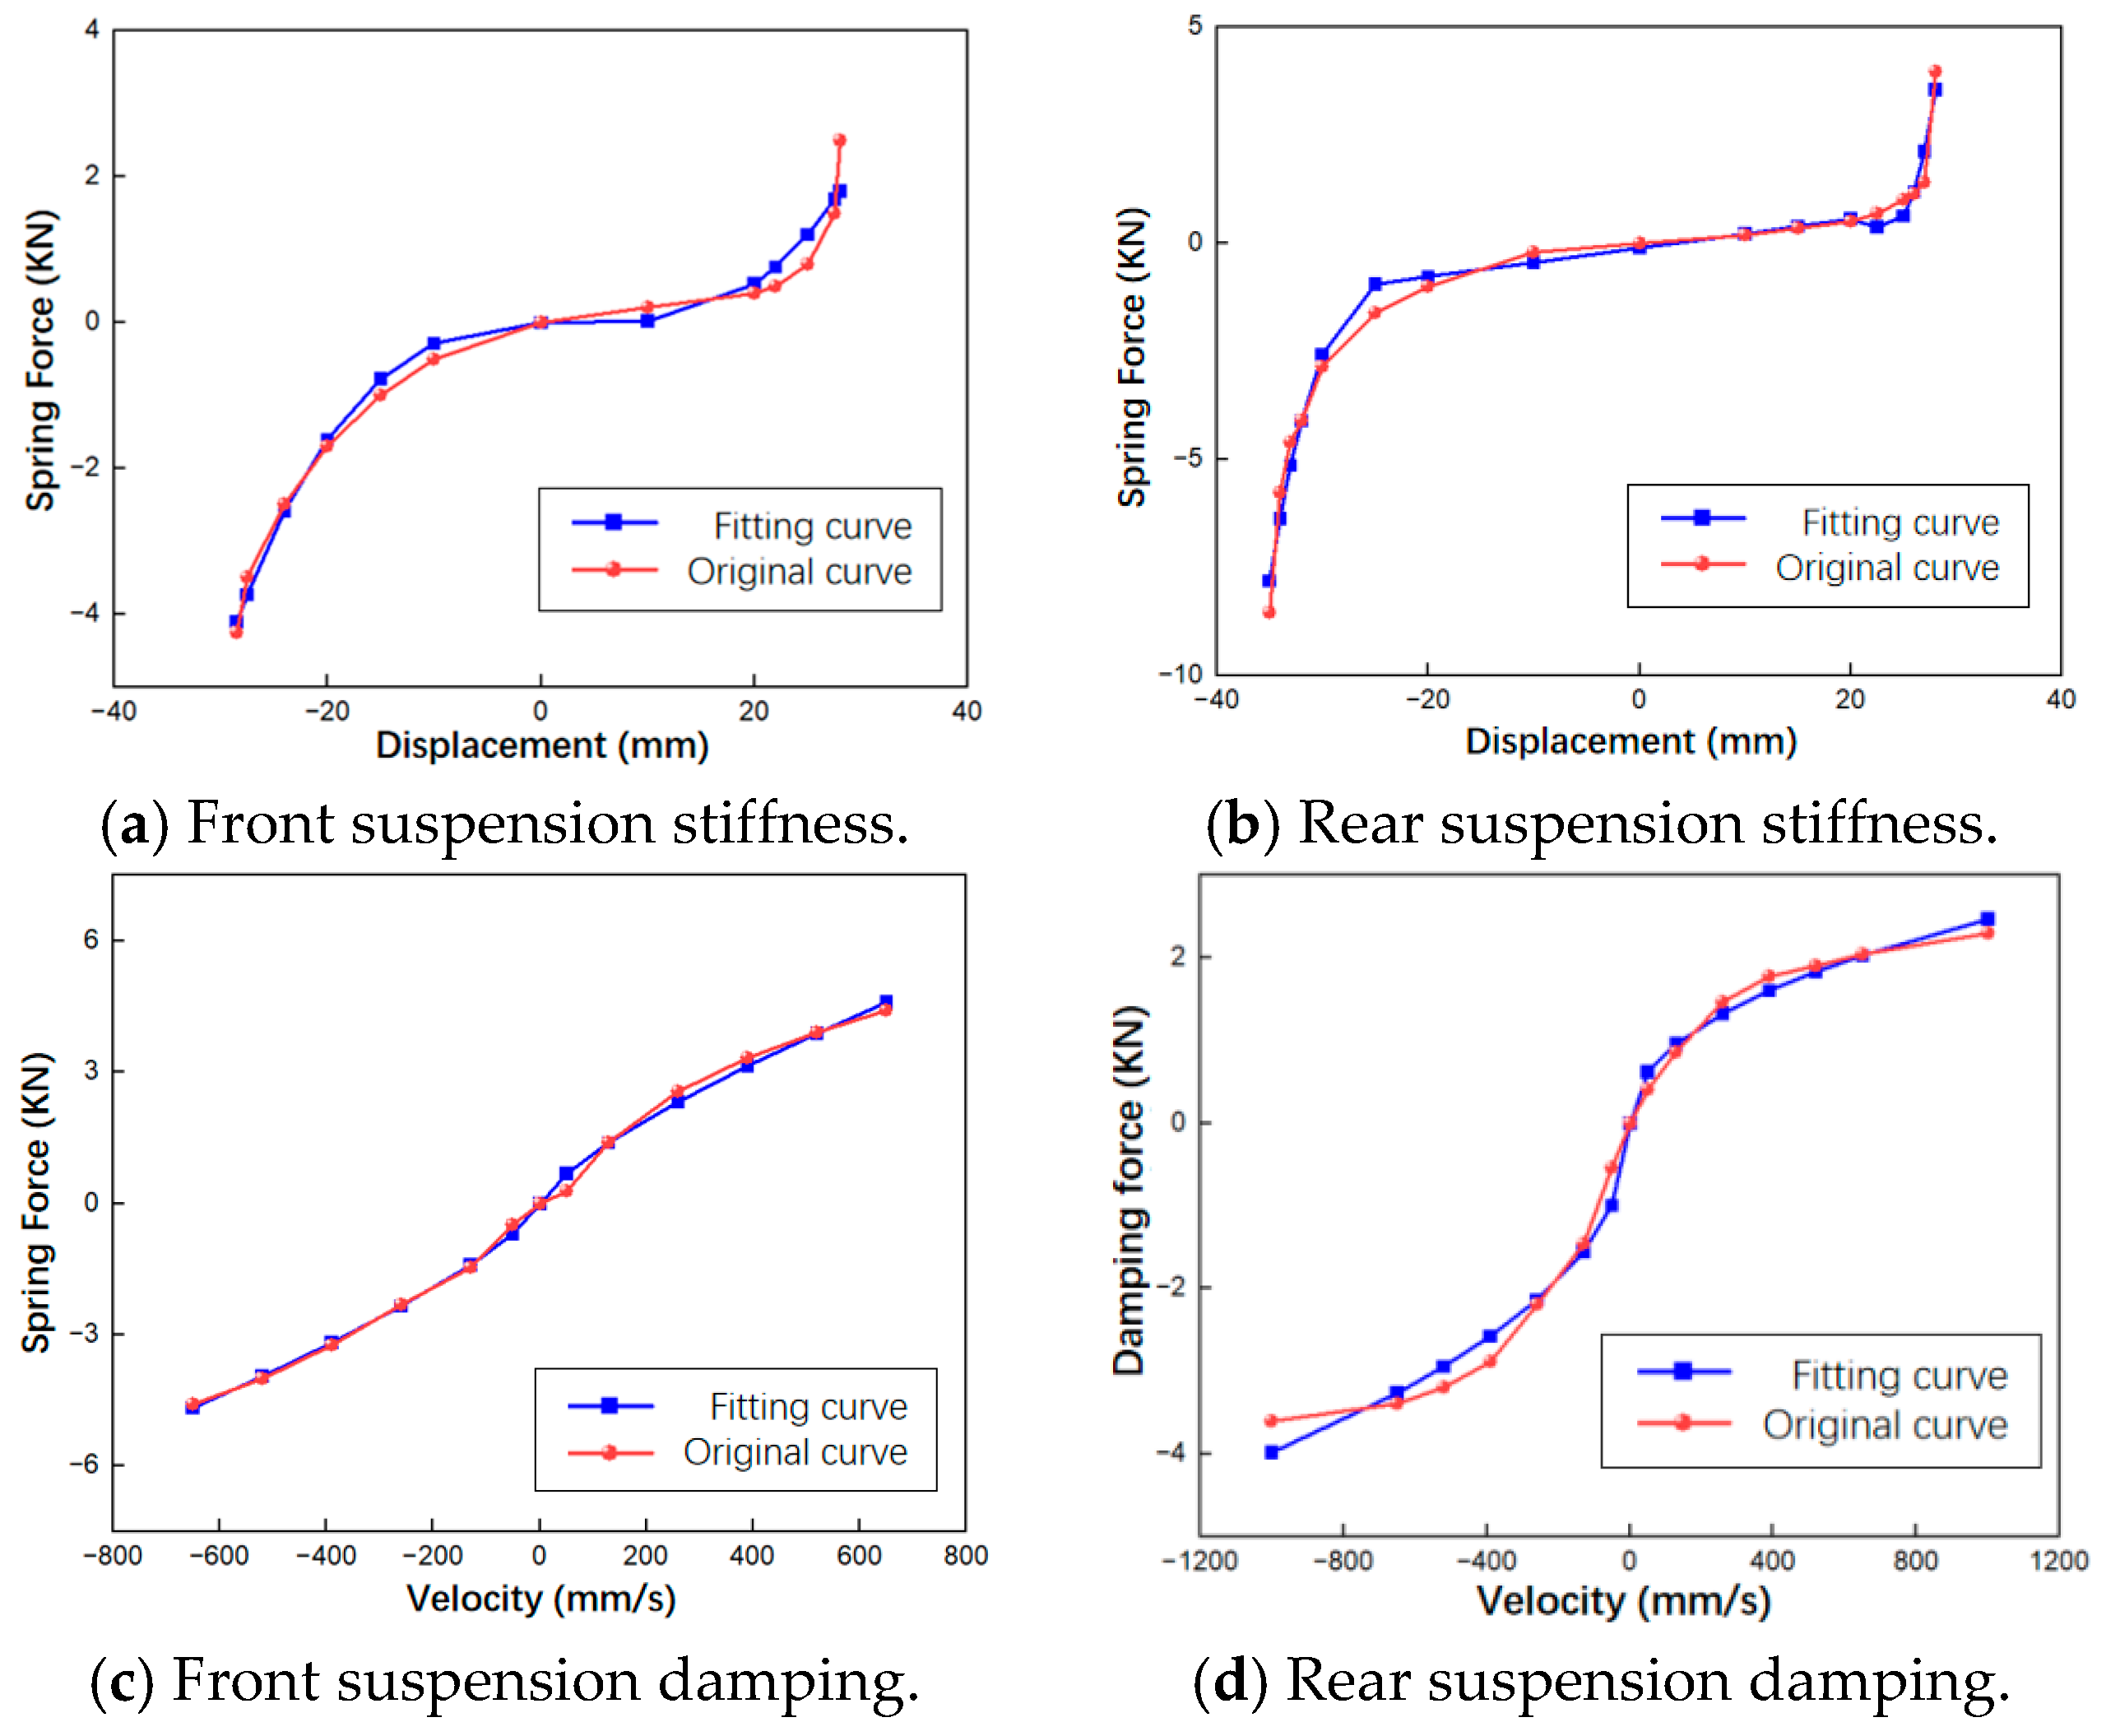
Figure 3.
Schematic diagram of the model coordinate system.
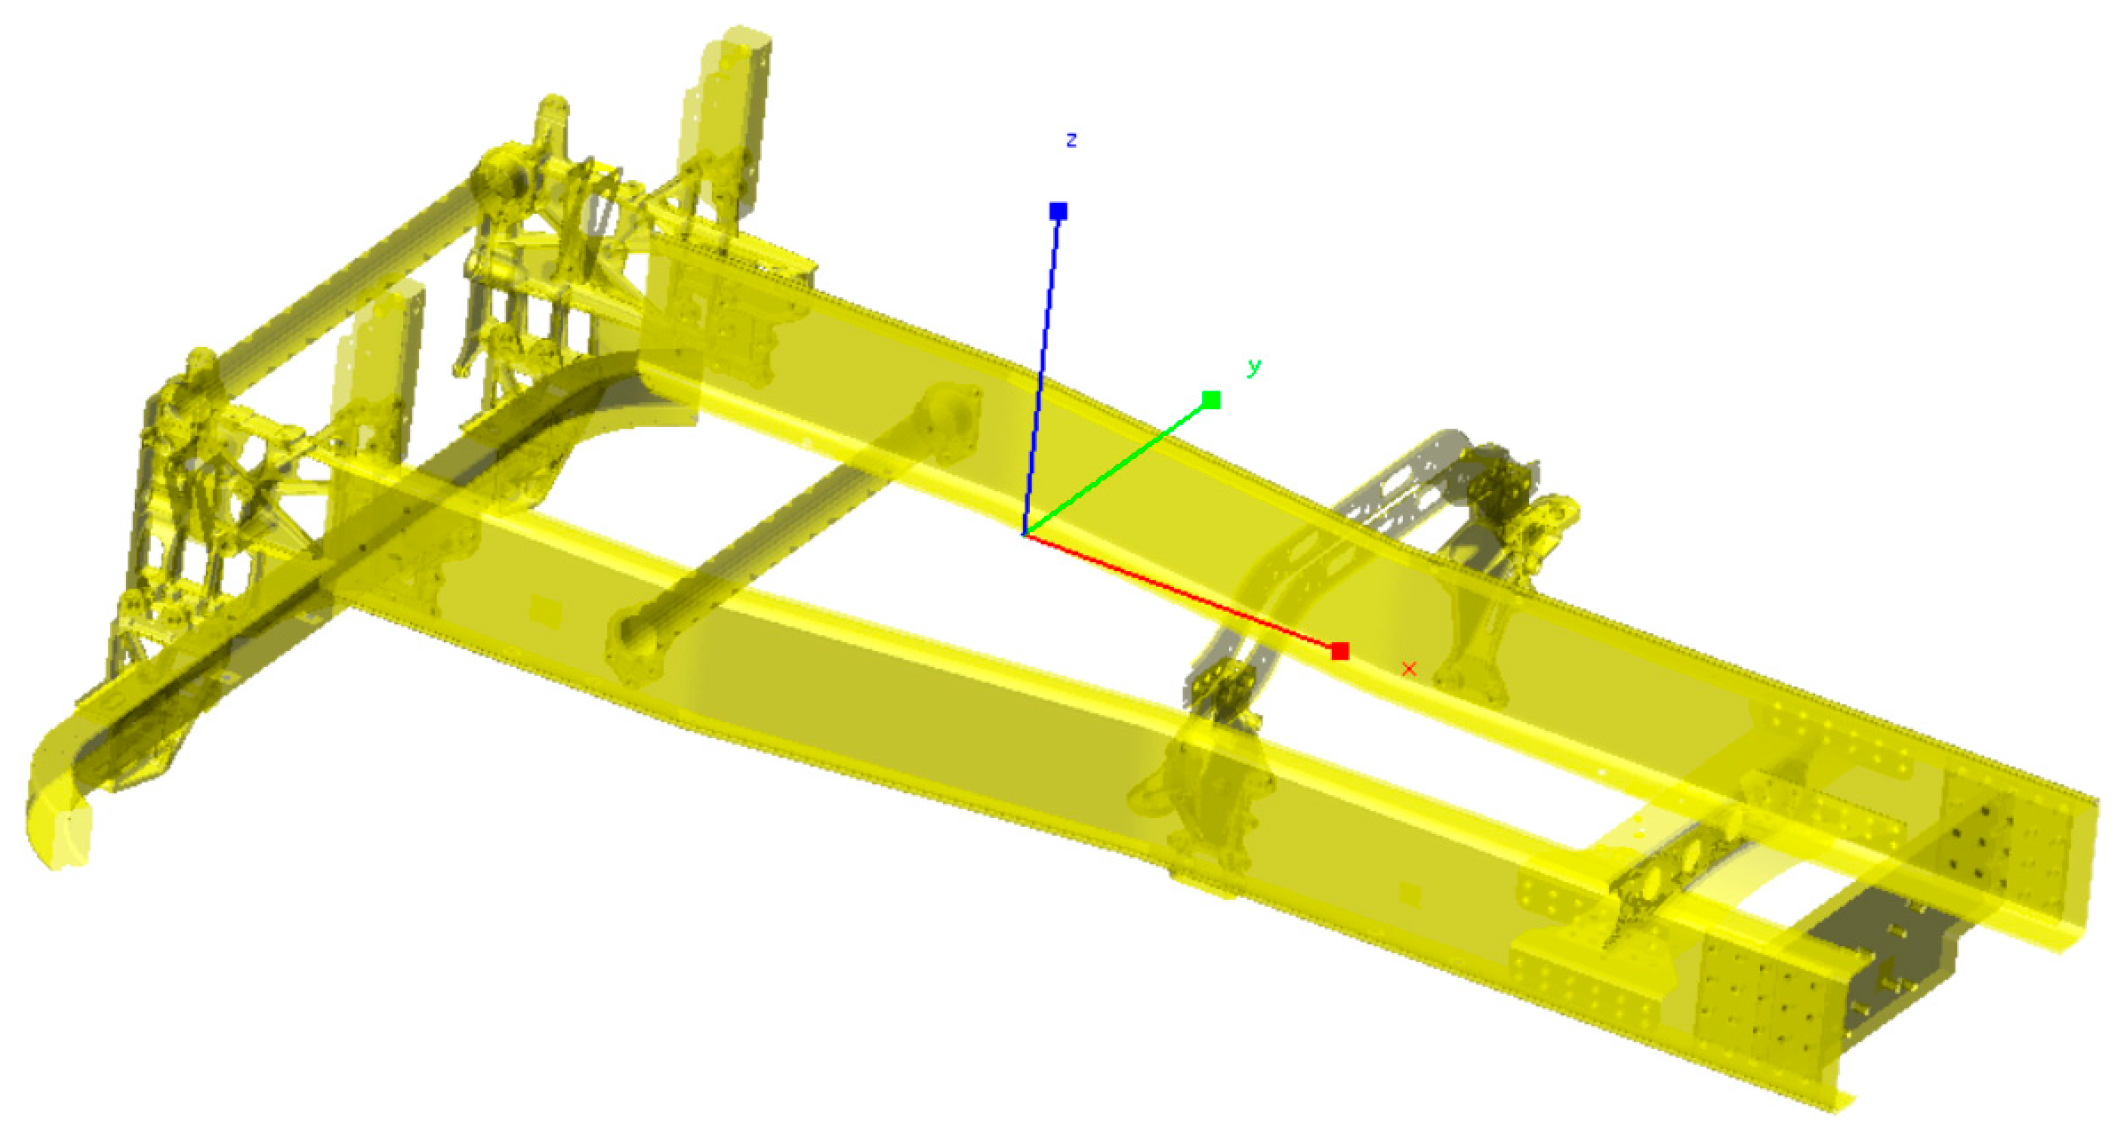
Figure 4.
Multibody Dynamic Model of the Cabin Suspension System (Schematic Diagram).
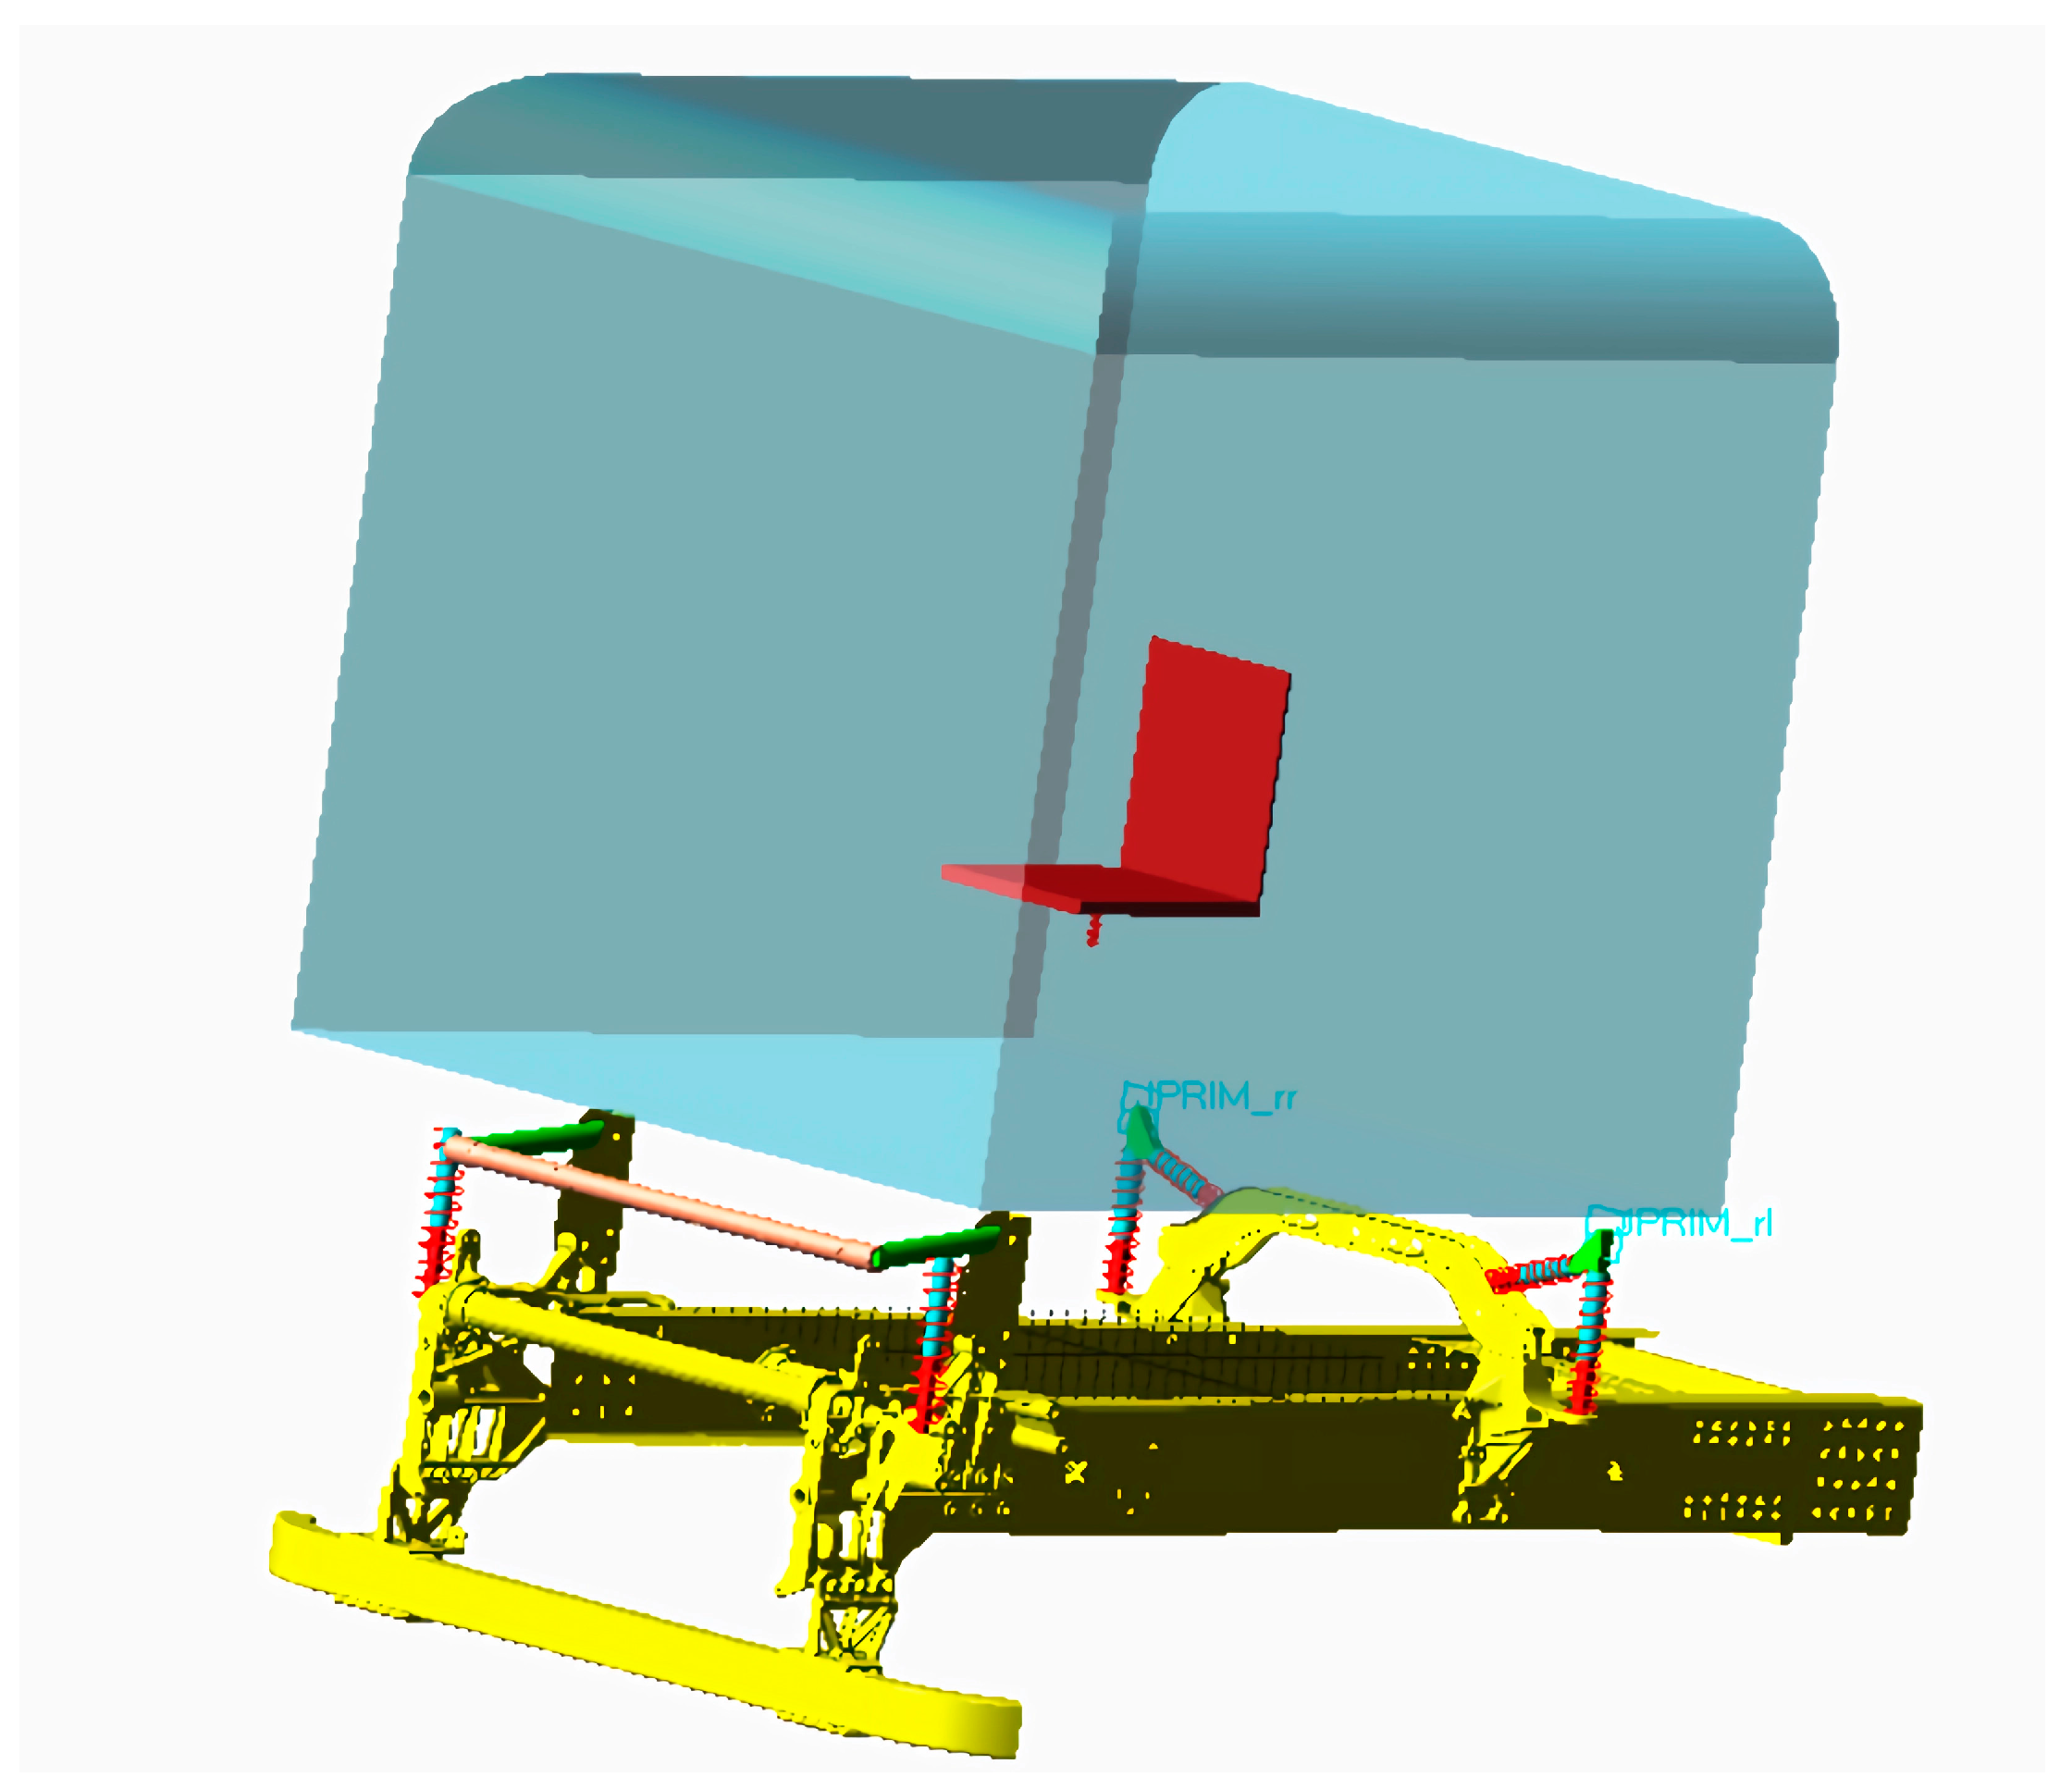
Figure 5.
Sensor Arrangement for Vehicle Road Sampling Test.
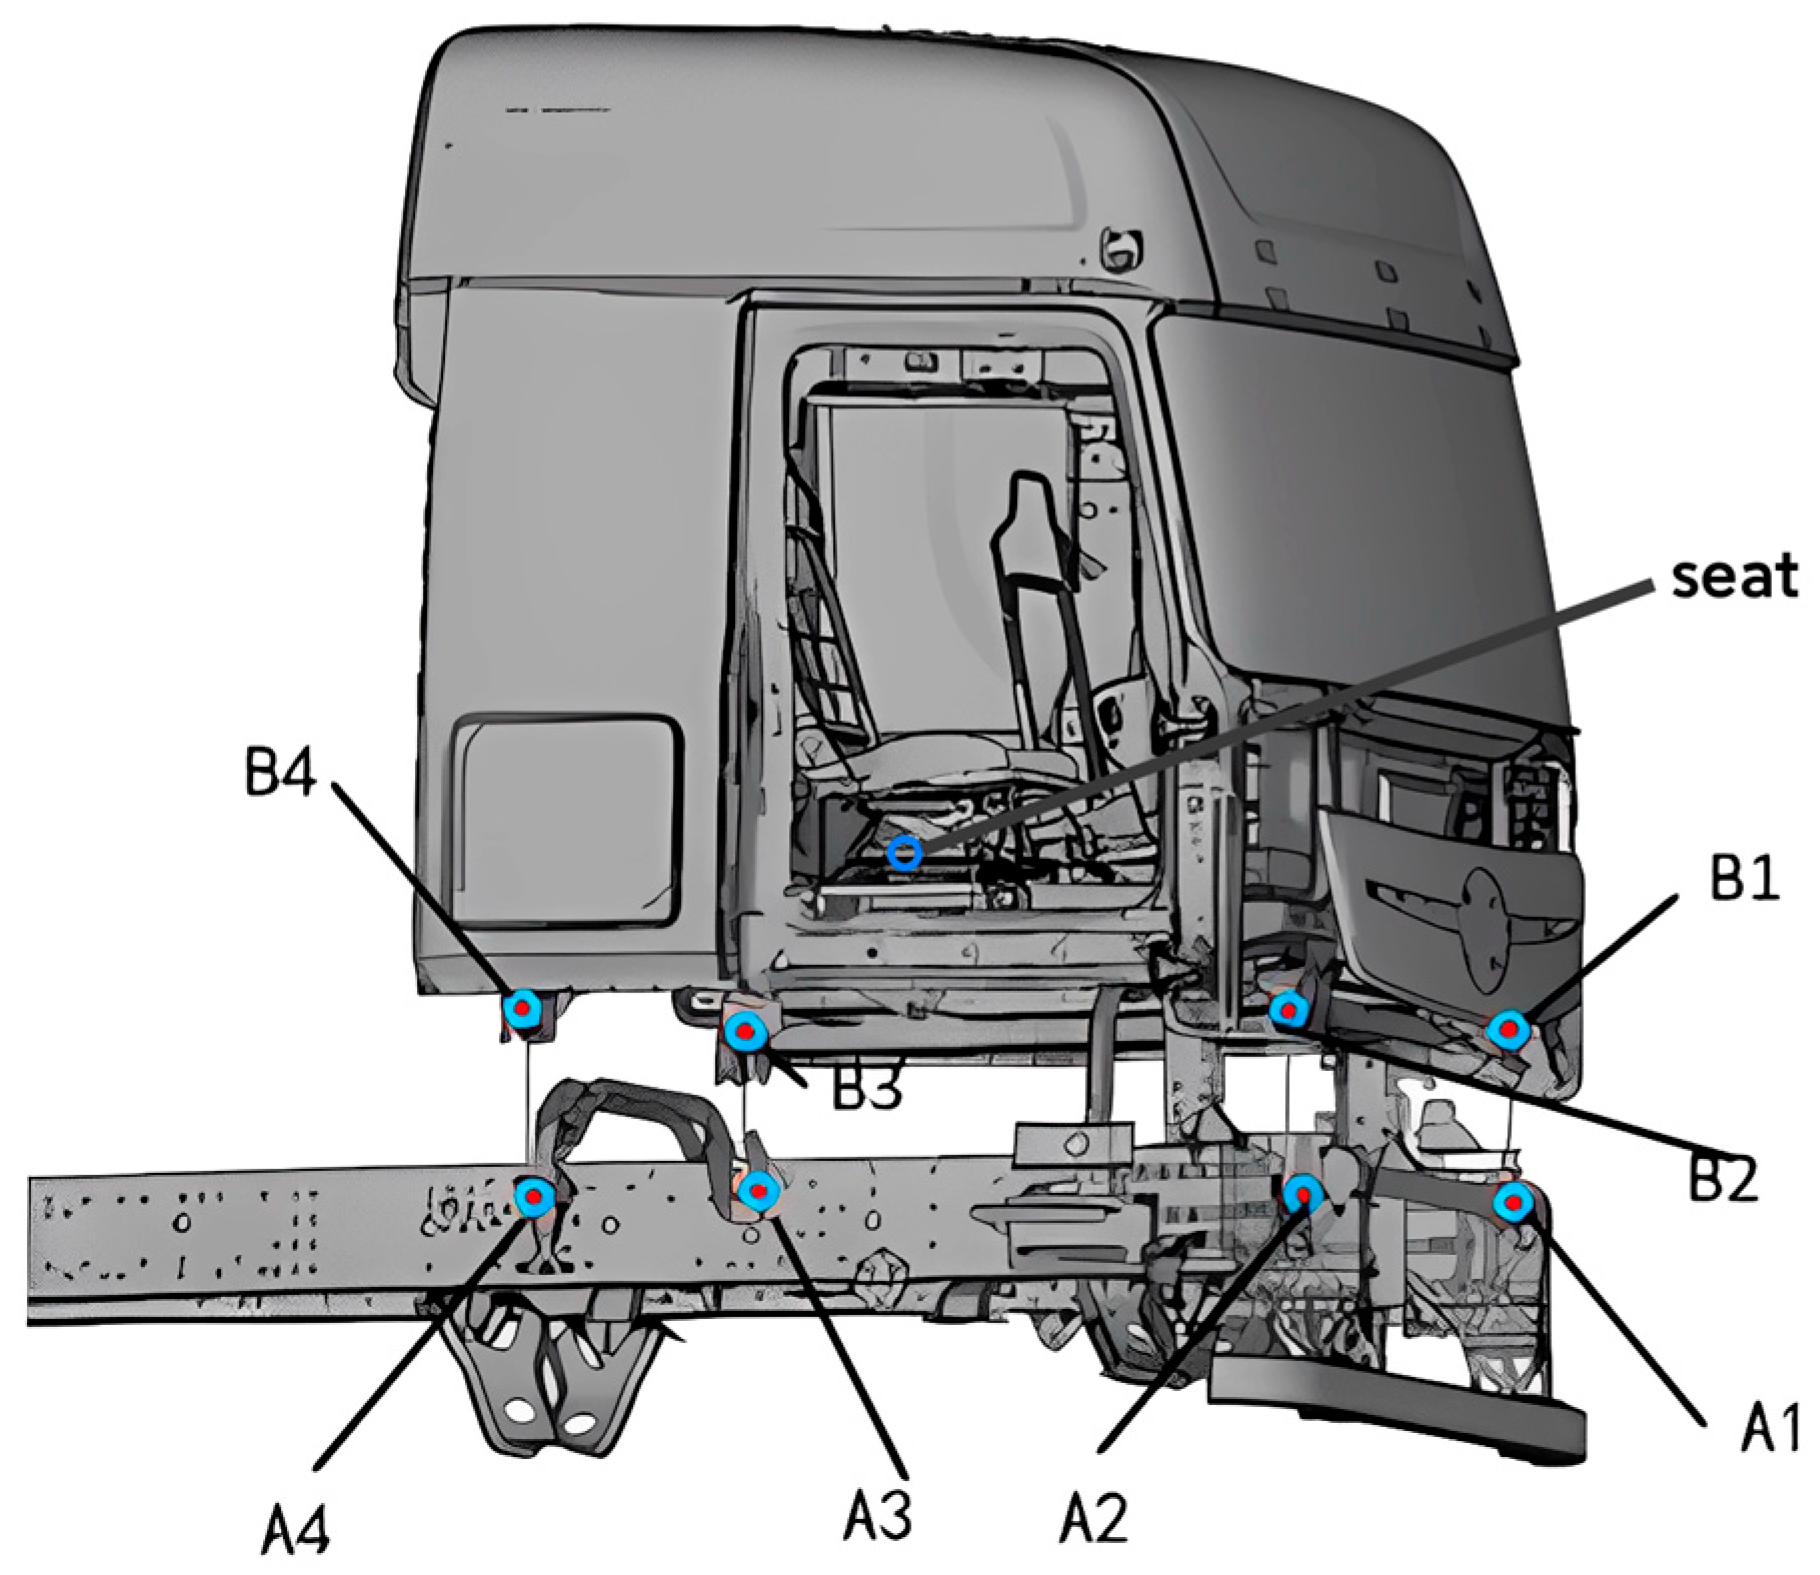
Figure 6.
LMS SCADAS Data Acquisition System.
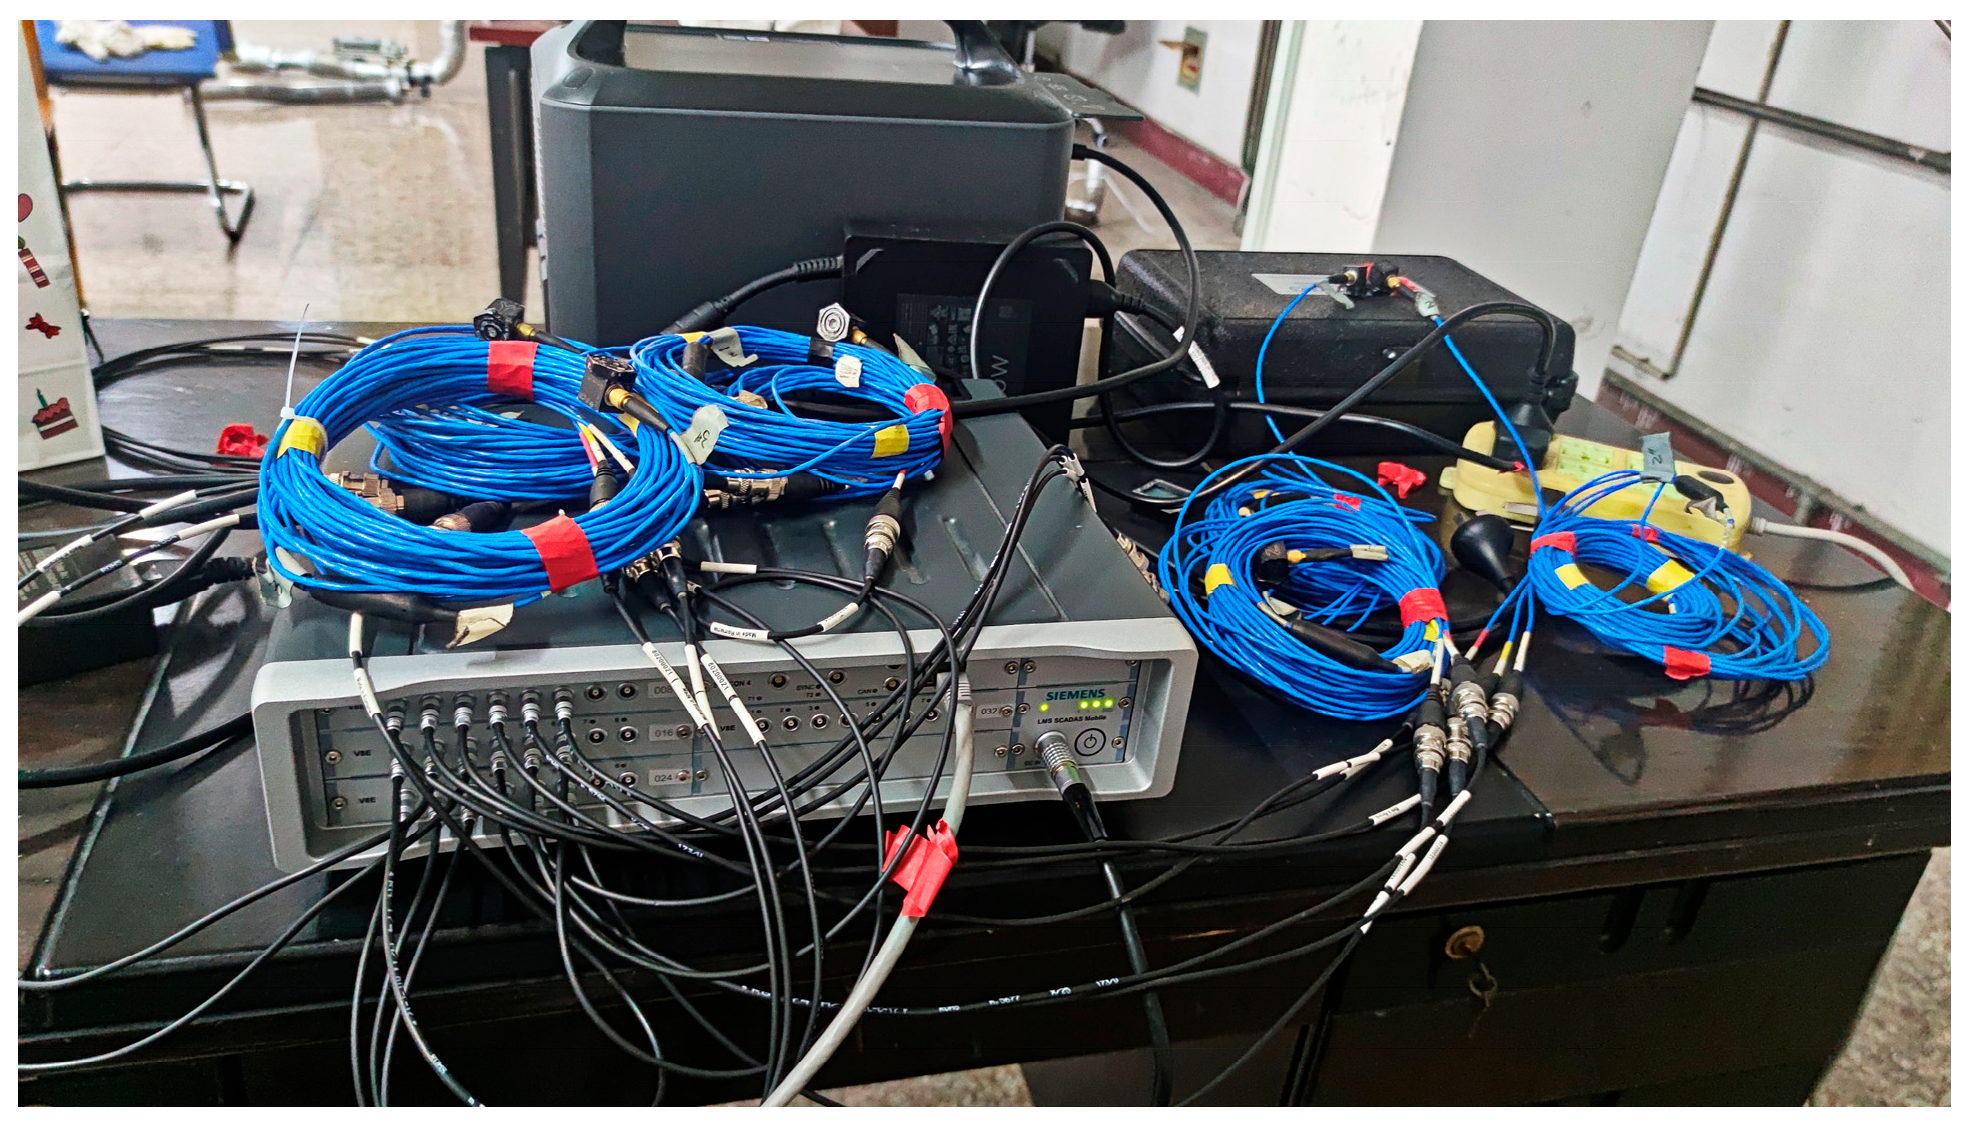
Figure 7.
Model Input Channels.
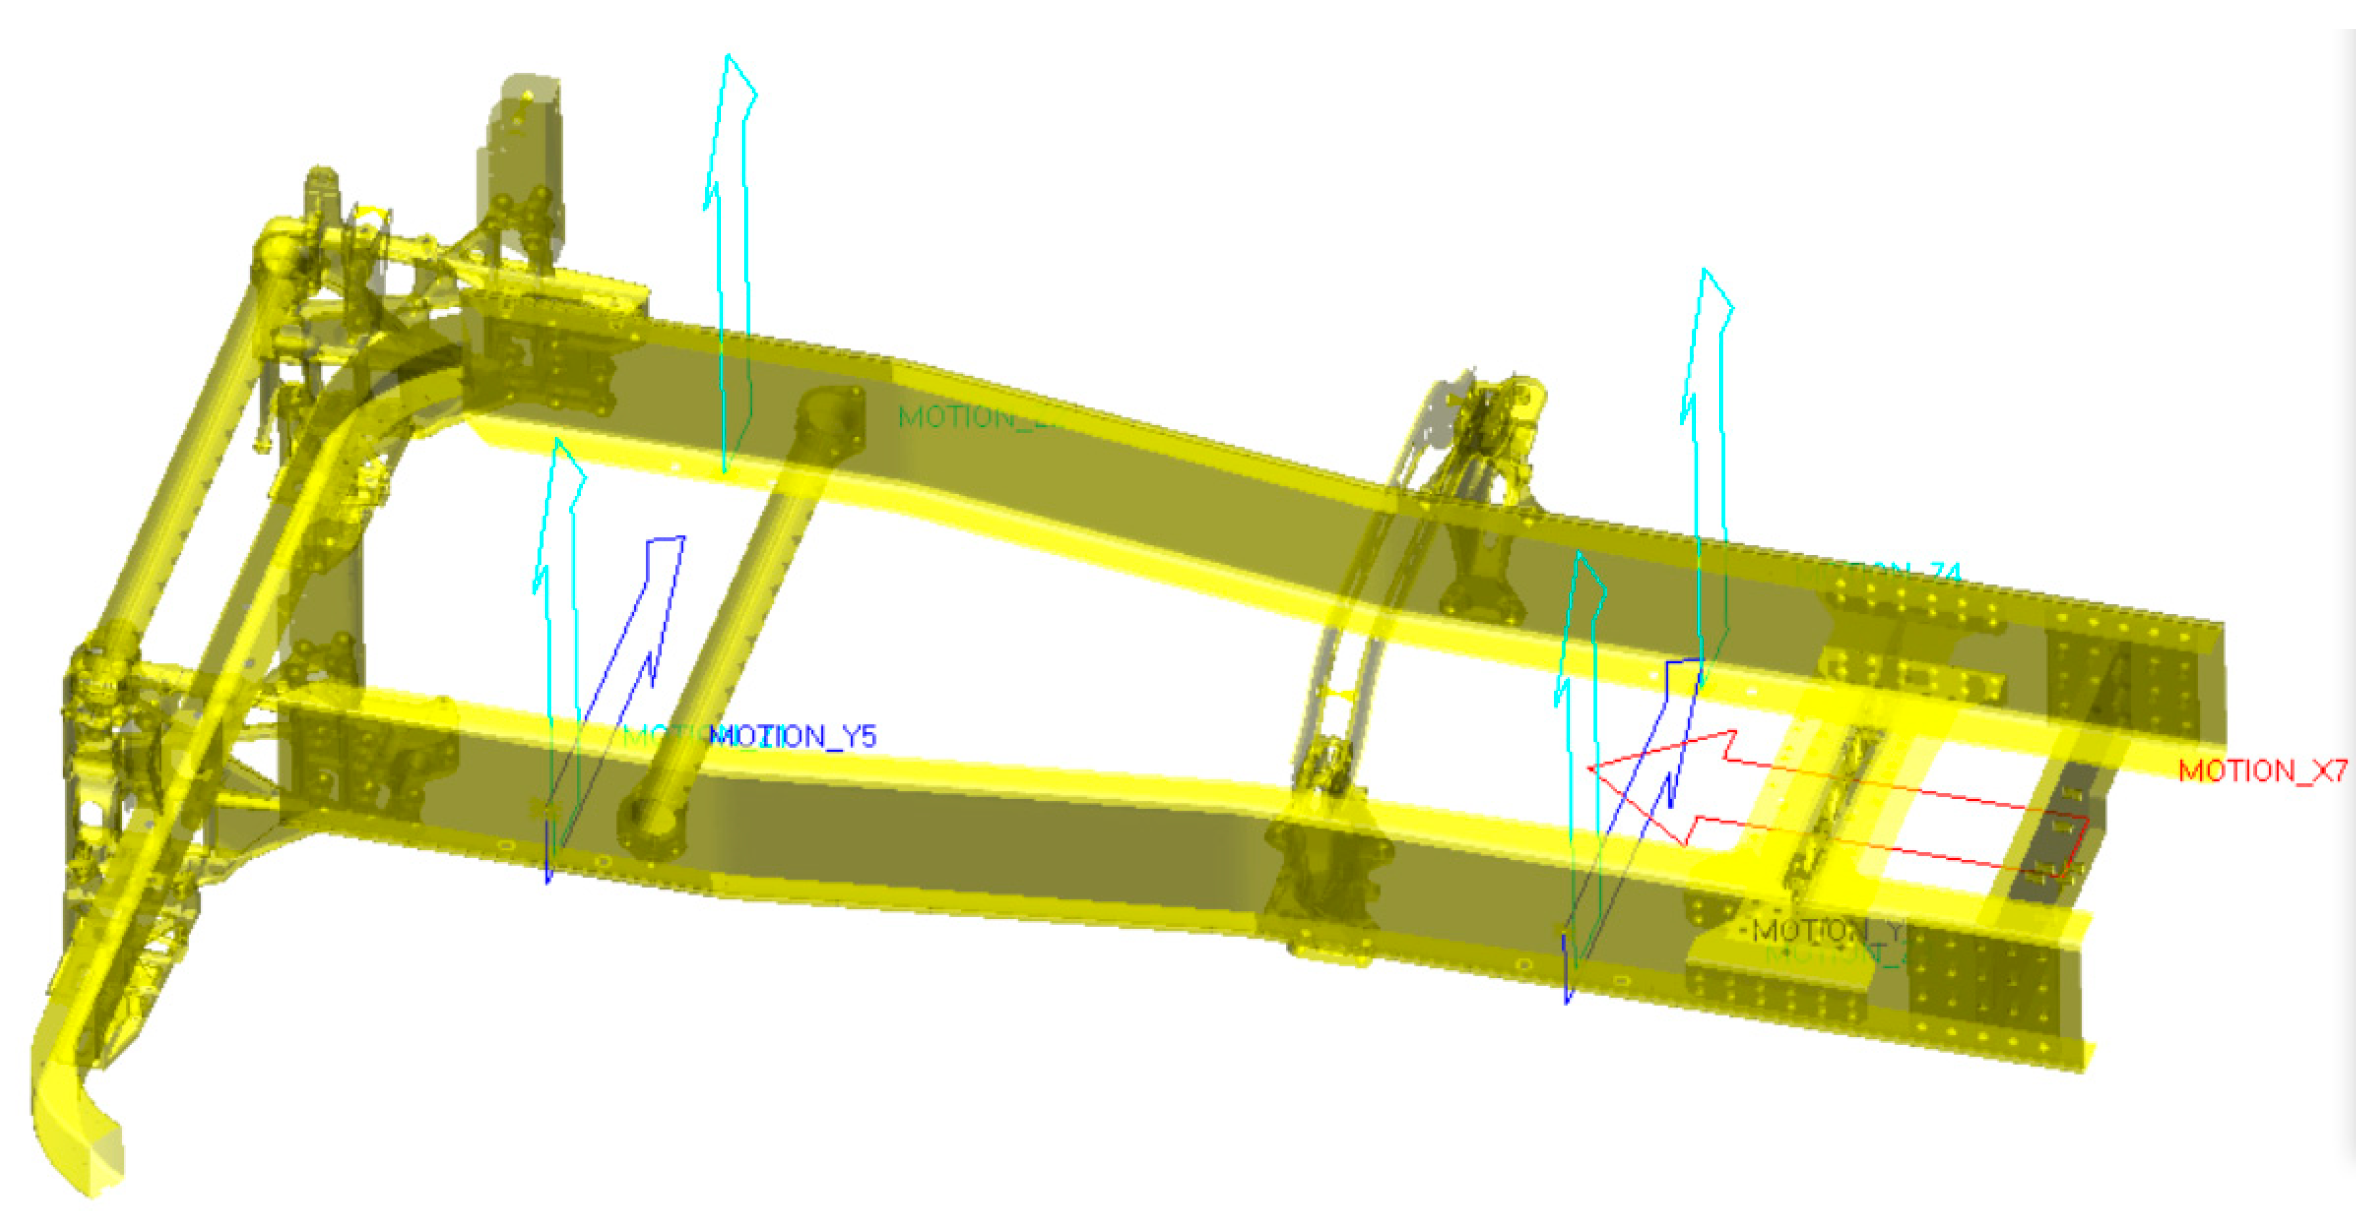
Figure 8.
Iterated displacement load spectra for different road surfaces.
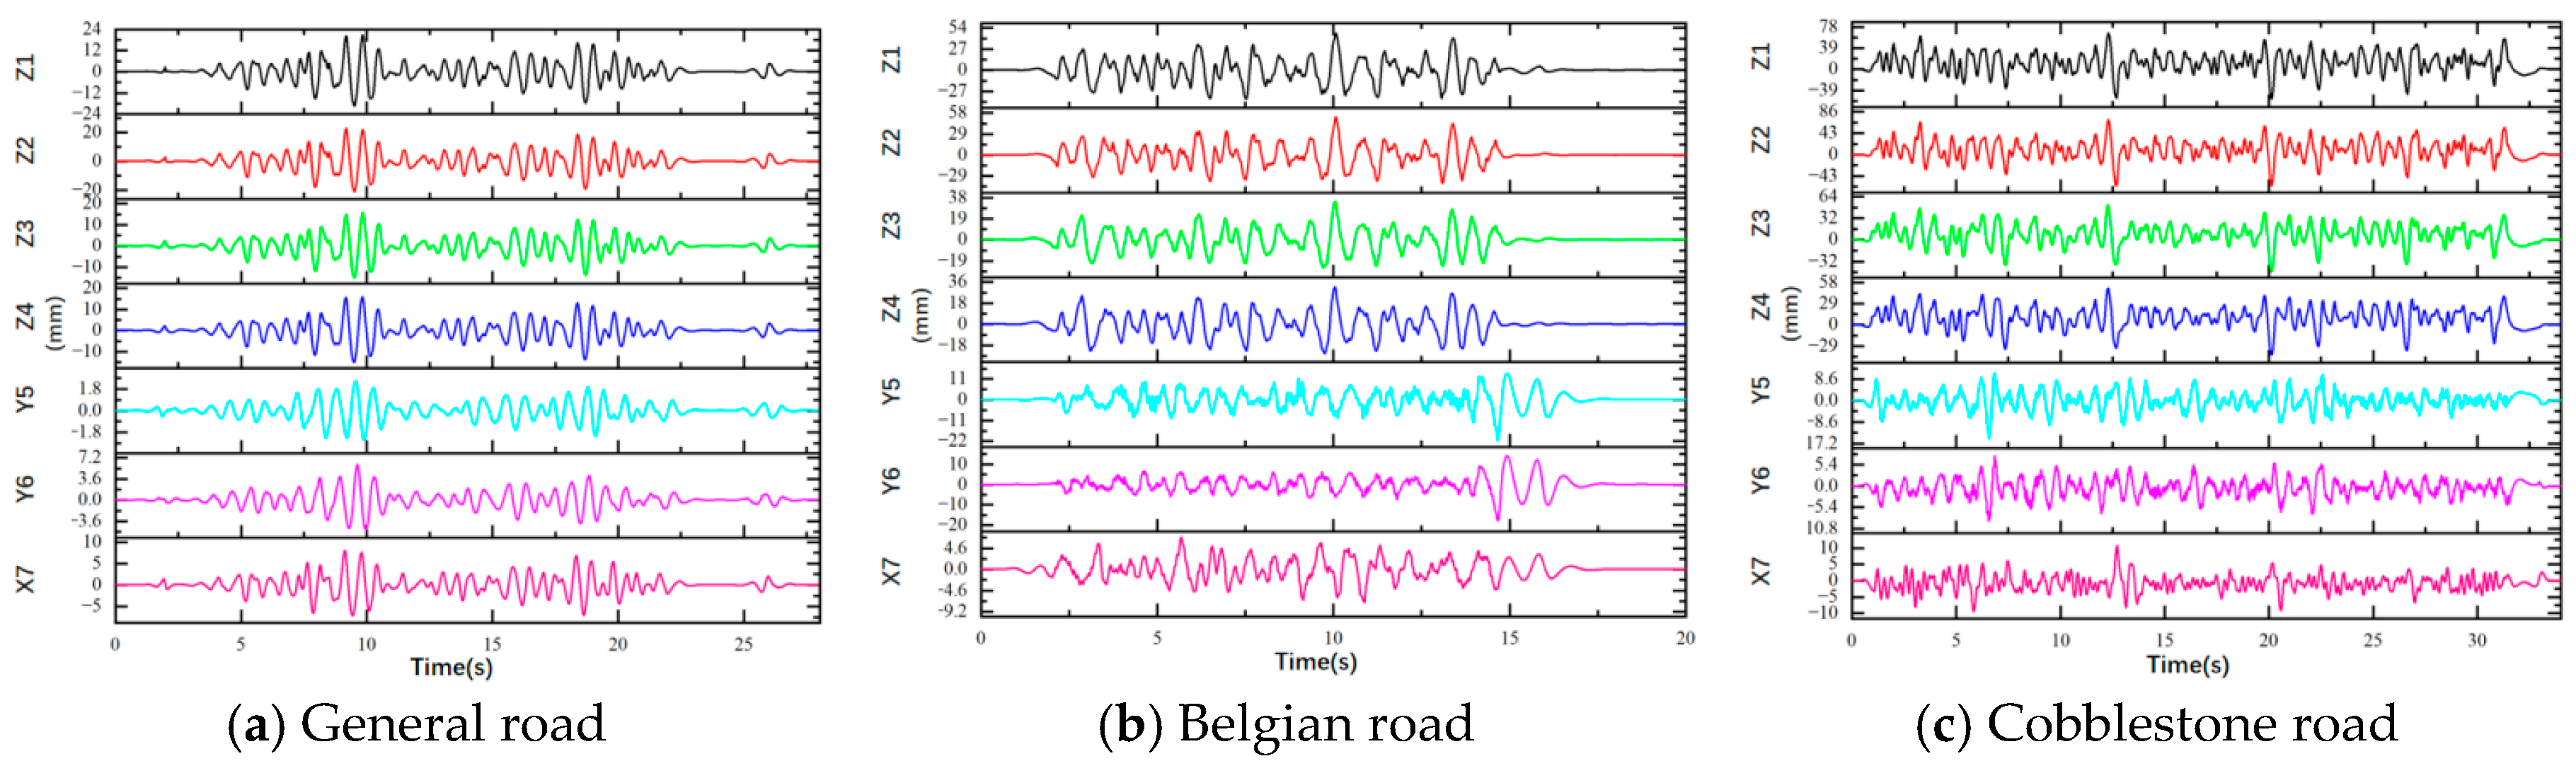
Figure 9.
Power Spectra of Three-Axis Accelerations at the Seat Floor for Different Road Surfaces.
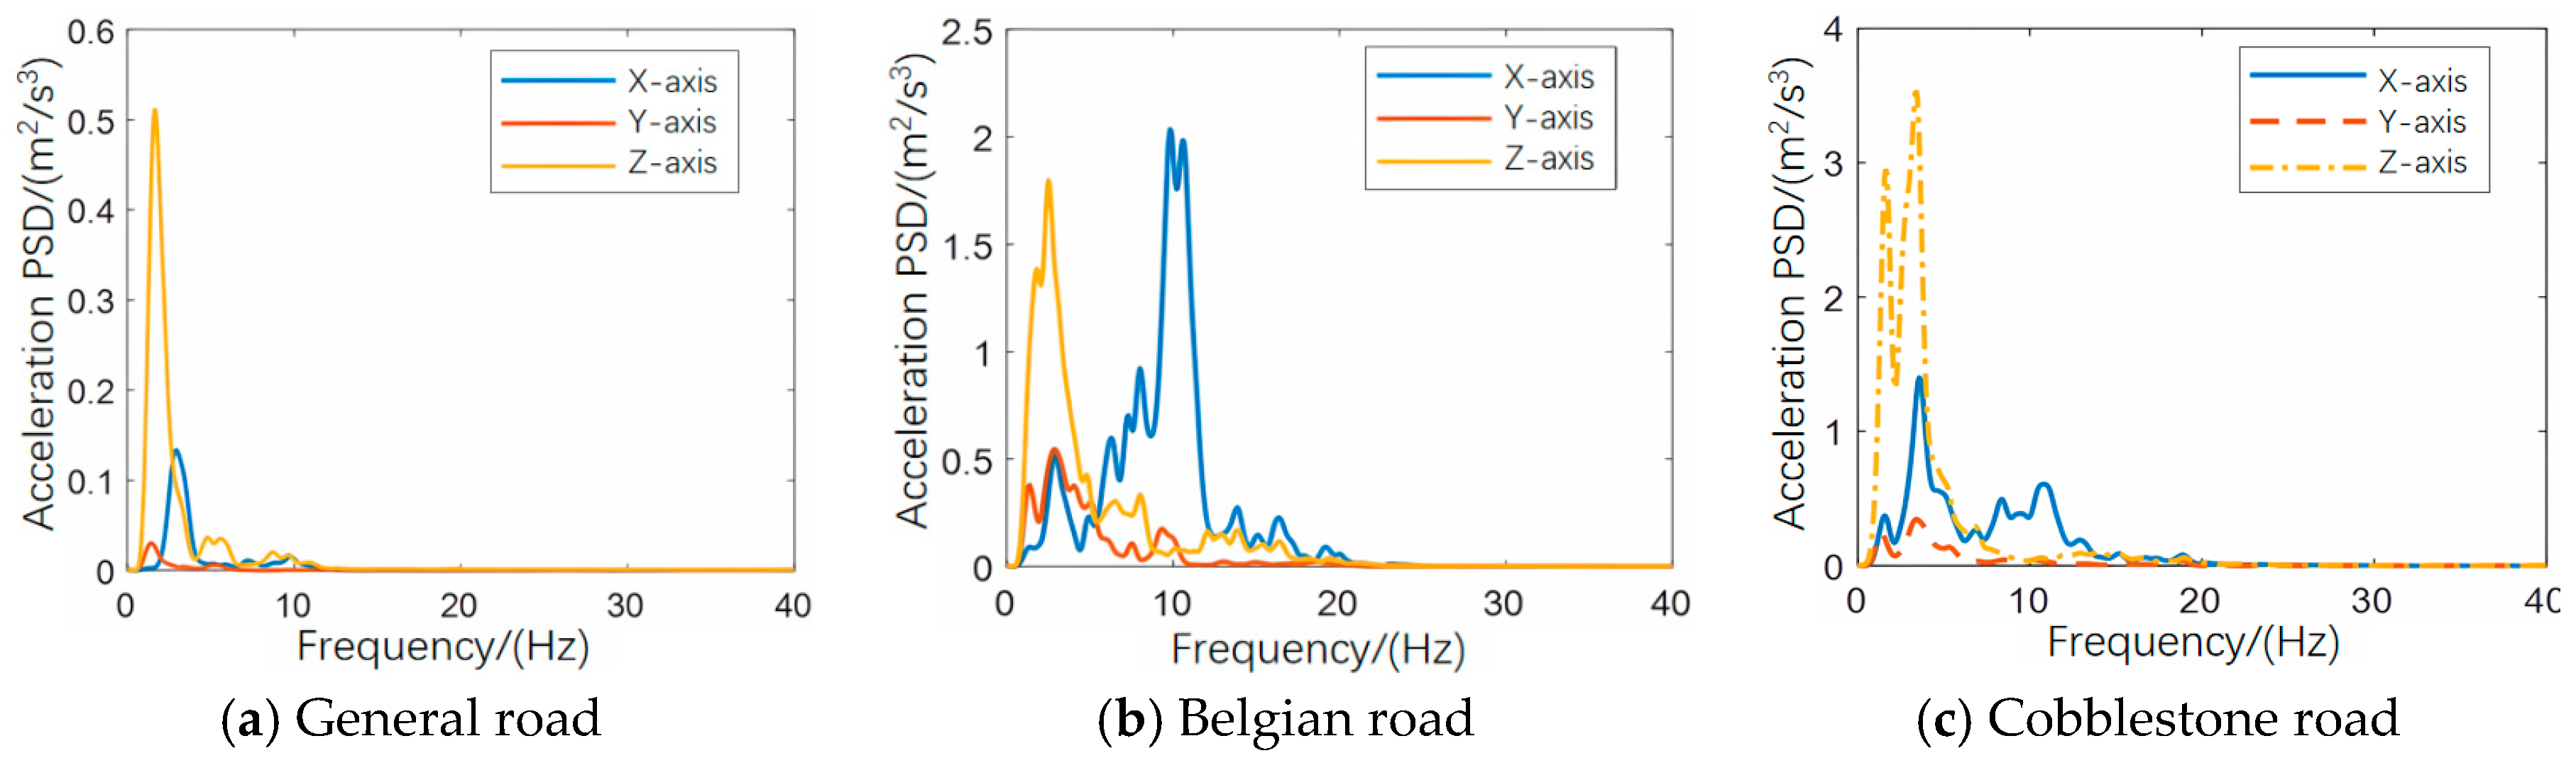
Figure 10.
optimization platform.
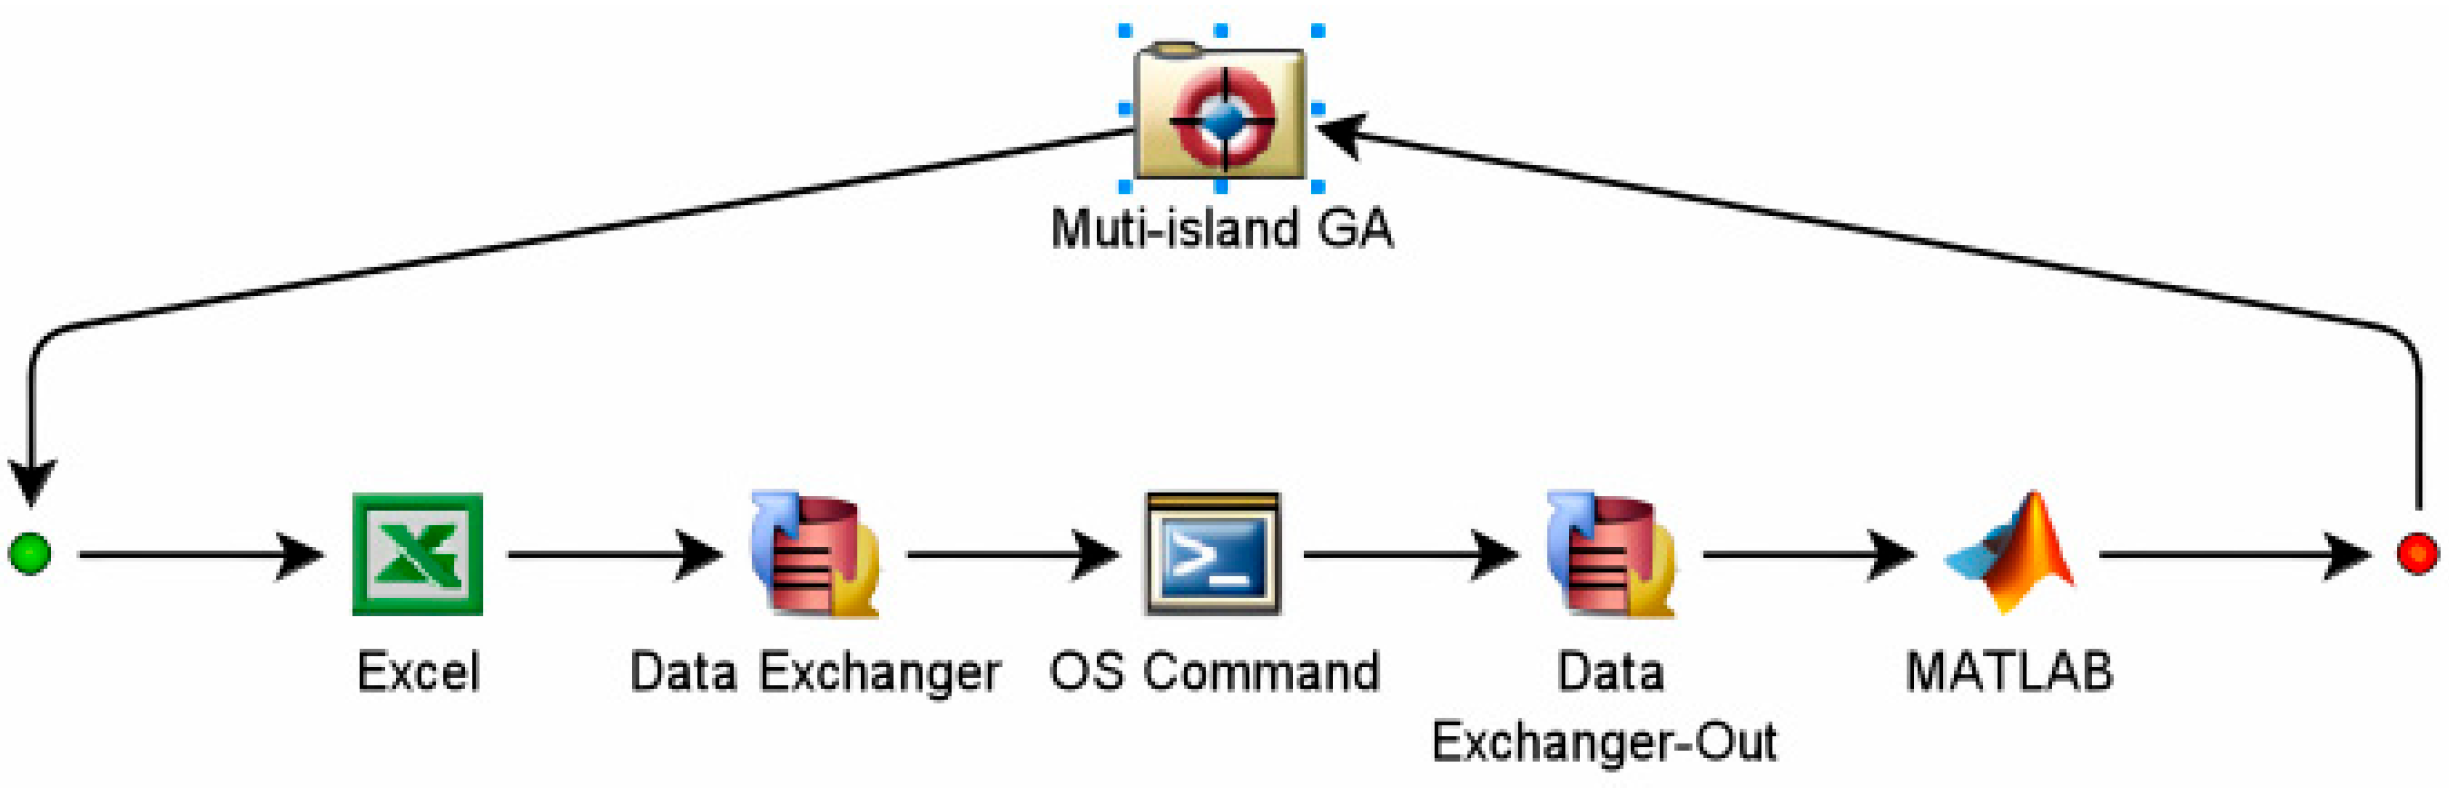
Figure 11.
Optimize the stiffness and damping curves of the front and rear mounts.
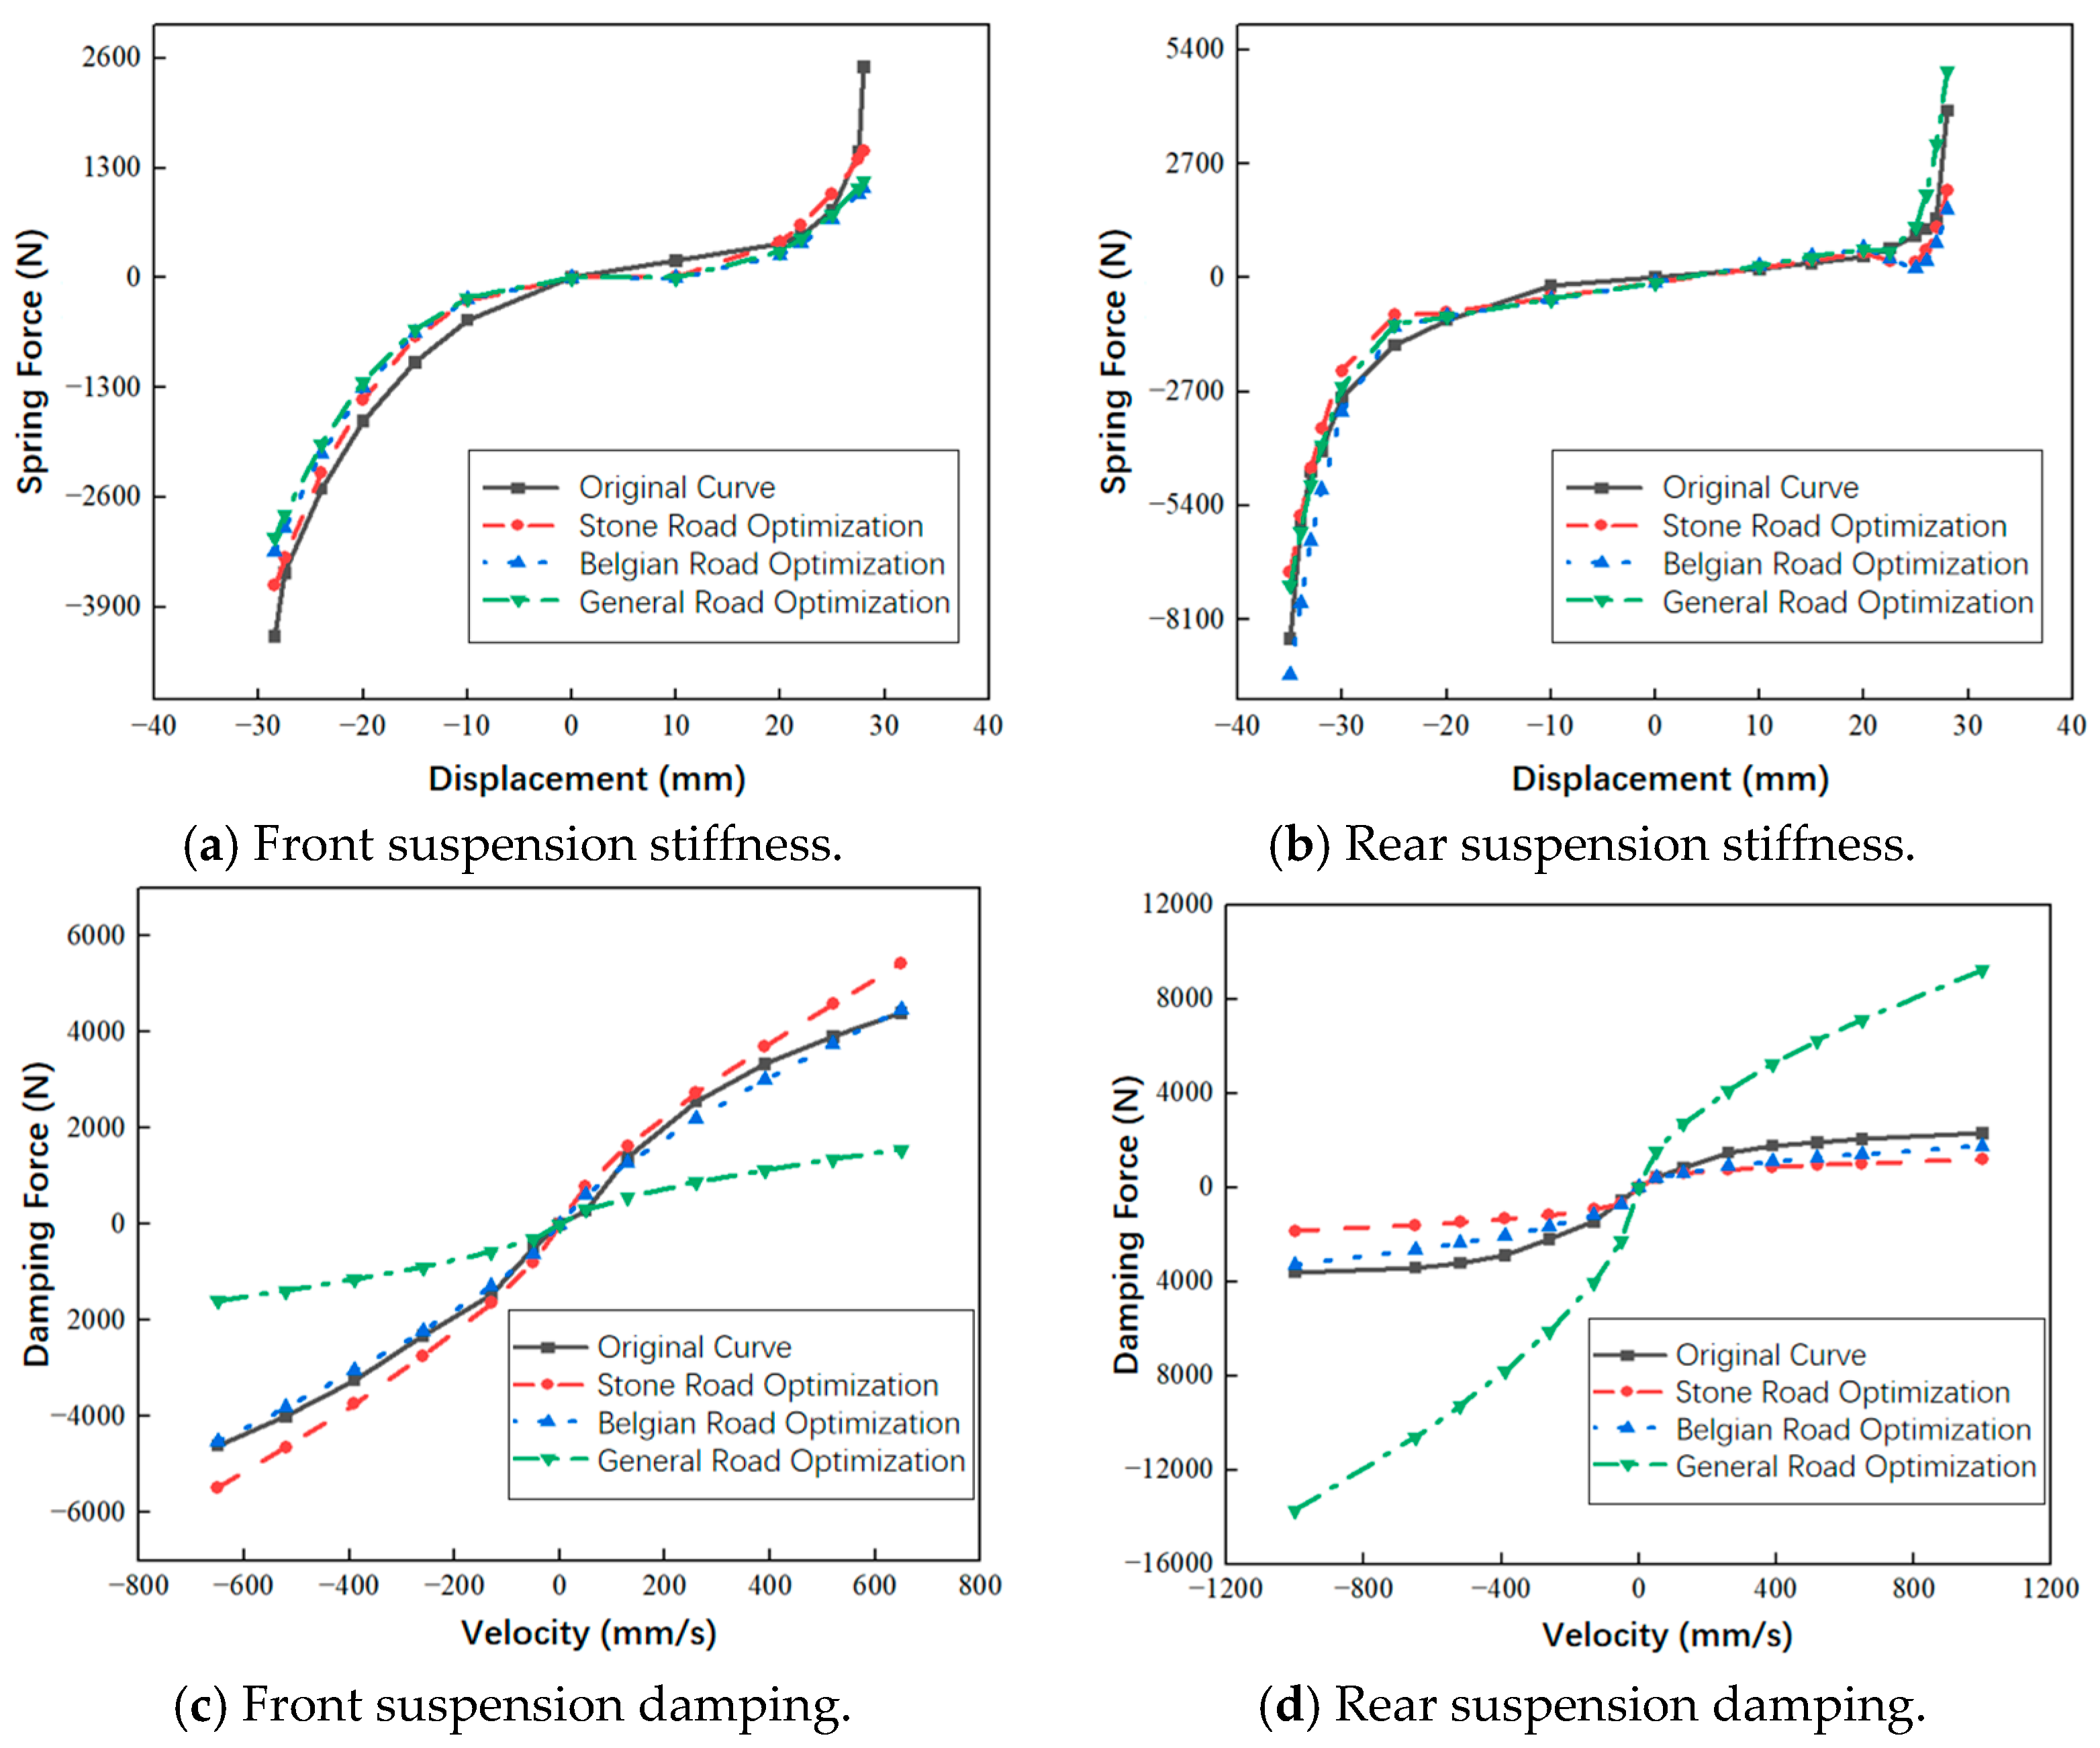
Figure 12.
Z-axis acceleration and acceleration power spectrum for each axis before and after optimization on General road.
Figure 12.
Z-axis acceleration and acceleration power spectrum for each axis before and after optimization on General road.
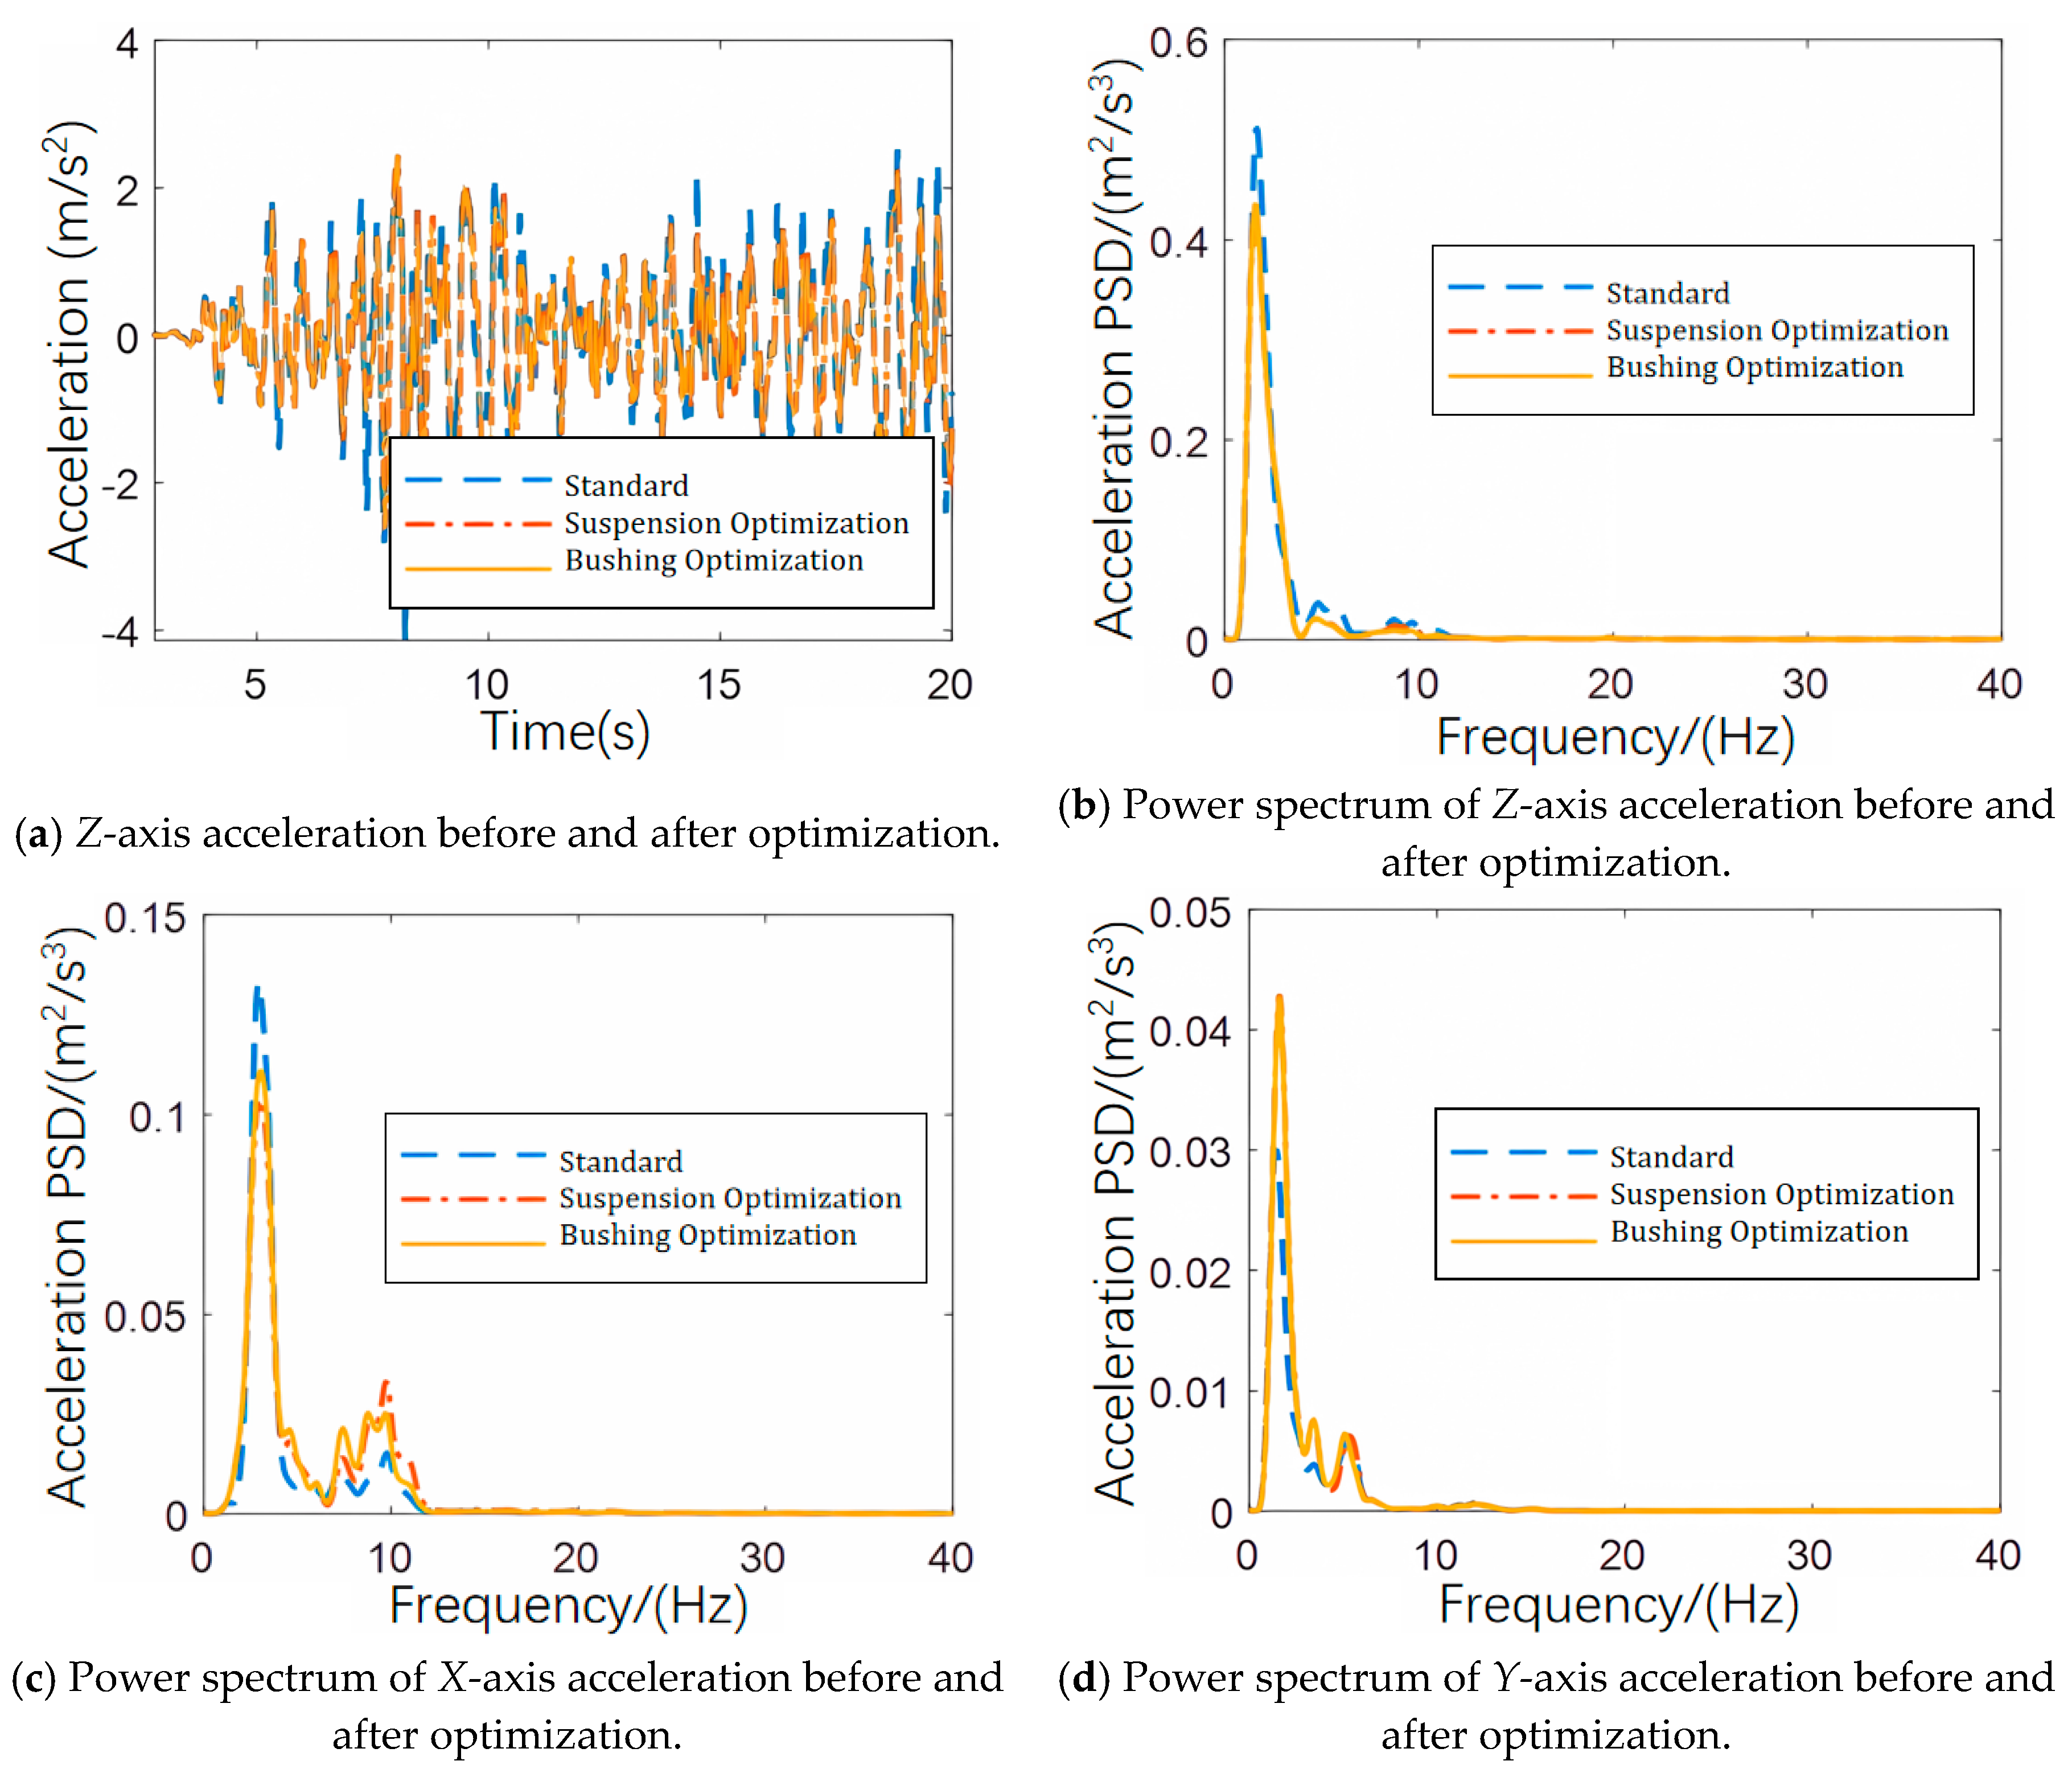

Table 1.
Stiffness and Damping Test Data of Front and Rear Air Springs.
| Front Suspension Gas Spring Stiffness Fkf | Front Suspension Gas Spring Damping Fcf | Rear Suspension Gas Spring Stiffness Fkr | Rear Suspension Gas Spring Damping Fcr | ||||
|---|---|---|---|---|---|---|---|
| Displacement (mm) |
Spring Force (N) |
Speed (mm/s) |
Damping Force (N) | Displacement (mm) |
Spring Force (N) |
Speed (mm/s) |
Damping Force (N) |
| −28.5 | −4250 | −650 | −4600 | −35 | −8550 | −1000 | −3600 |
| −27.5 | −3500 | −520 | −4000 | −32 | −4100 | −650 | −3400 |
| −24 | −2500 | −390 | −3250 | −30 | −2850 | −520 | −3200 |
| −20 | −1700 | −260 | −2320 | −25 | −1600 | −390 | −2890 |
| −15 | −1000 | −130 | −1480 | −20 | −1000 | −260 | −2200 |
| −10 | −500 | −50 | −490 | −10 | −200 | −130 | −1460 |
| 0 | 0 | 0 | 0 | 0 | 0 | −50 | −540 |
| 10 | 200 | 50 | 280 | 10 | 200 | 0 | 0 |
| 20 | 400 | 130 | 1380 | 15 | 350 | 50 | 410 |
| 22 | 500 | 260 | 2560 | 20 | 500 | 130 | 850 |
| 25 | 800 | 390 | 3330 | 22.5 | 700 | 260 | 1470 |
| 27.5 | 1500 | 520 | 3900 | 25 | 1000 | 390 | 1780 |
| 28 | 2500 | 650 | 4400 | 26 | 1150 | 520 | 1900 |
| 27 | 1400 | 650 | 2050 | ||||
| 28 | 3965 | 1000 | 2300 | ||||
Table 2.
Modal Analysis Results from ADAMS.
| Mode | Frequency (Hz) | Decoupling Rate (%) |
|---|---|---|
| Roll (Lateral Tilt) | 0.973 | 73.02 |
| Pitch | 1.316 | 71.26 |
| Vertical | 2.181 | 98.26 |
| Lateral | 7.827 | 72.27 |
Table 3.
List of experimental equipment.
| Equipment | Quantity |
|---|---|
| LMS SCADAS Data Acquisition Unit | 1 set |
| Triaxial Piezoelectric Accelerometers | 9 |
| LMS Test.Lab Data Processing Software | 1 set |
| Signal Acquisition Cables | Several |
Table 4.
Peak Factors for Simulations Under Different Road Conditions.
| Axis | Metric | General Road | Belgian Road | Cobblestone Road |
|---|---|---|---|---|
| X-Axis | Weighted RMS acceleration (m/s2) | 0.278 | 0.856 | 1.02 |
| Weighted peak acceleration (m/s2) | 1.185 | 2.852 | 11.232 | |
| Peak factor | 4.228 | 3.333 | 11.016 | |
| Y-Axis | Weighted RMS acceleration (m/s2) | 0.163 | 0.851 | 0.615 |
| Weighted peak acceleration (m/s2) | 0.544 | 3.724 | 6.229 | |
| Peak factor | 3.353 | 4.380 | 10.127 | |
| Z-Axis | Weighted RMS acceleration (m/s2) | 0.560 | 1.892 | 2.326 |
| Weighted peak acceleration (m/s2) | 3.779 | 8.501 | 9.309 | |
| Peak factor | 6.763 | 4.493 | 4 |
Table 5.
Simulation Results of Ride Comfort for Different Road Surfaces.
| Indicator | General Road | Belgian Road | Cobblestone Road |
|---|---|---|---|
| Maximum Roll Angle (°) | 0.215 | 1.128 | 1.29 |
| Maximum Pitch Angle (°) | 0.519 | 0.884 | 1.53 |
| Maximum Spring Deformation (mm) | 14.22 | 28.53 | 37.37 |
| X-axis Weighted RMS Acceleration (m/s2) | 0.278 | 0.856 | 2.613 |
| Y-axis Weighted RMS Acceleration (m/s2) | 0.163 | 0.851 | 3.215 |
| Z-axis Weighted RMS Acceleration (m/s2) | 0.5 | 1.892 | 2.05 |
| Total Weighted RMS Acceleration (m/s2) | 0.645 | 2.244 | 8.179 |
| Vibration Dose Value (VDV) total (m·s−1.75) | — | 6.9 | 9.157 |
| Front Suspension Isolation Rate (%) | 42.3% | 69.97% | 60.6% |
Table 6.
Range of values of design variables.
| Variable Name | Range | Variable Name | Range |
|---|---|---|---|
| Front suspension stiffness, 1st-order coefficient A | 1.98~3.677 | Rear suspension stiffness, rebound travel, 2nd-order coefficient g | 2~4 |
| Front suspension stiffness, 2nd-order coefficient B | −1.755~−0.945 | Front suspension damping coefficient cf | −0.3467~−0.1867 |
| Front suspension stiffness, 3rd-order coefficient C | 0.0887~0.1647 | Front suspension damping asymmetry coefficient | −180.7~−97.3 |
| Rear suspension stiffness, linear segment slope k | 23~43 | Front suspension damping characteristic exponent | 0.5217~0.9689 |
| Rear suspension stiffness, compression travel, 2nd-order coefficient d | −100~−56.526 | Rear suspension damping coefficient | −40.274~−21.686 |
| Rear suspension stiffness, compression travel, 3rd-order coefficient e | 10.8~20 | Rear suspension damping asymmetry coefficient | −5.5497~−2.9883 |
| Rear suspension stiffness, rebound travel, 2nd-order coefficient f | 10~20 | Rear suspension damping characteristic exponent | 0.3238~0.6014 |
Table 7.
Definition of Key Bushing Connections in the Suspension System.
| Bushing ID | Connecting Part A/Part B | Description |
|---|---|---|
| 1 | Cab Bracket/Front Air Spring | Connection between front suspension and cab |
| 2 | Front Lower Bracket/Front Air Spring | Connection between front suspension and frame |
| 3 | Lug/Rear Air Spring | Connection between rear air spring and hydraulic lock |
| 4 | Rear Bracket/Rear Air Spring | Connection between rear air spring and rear support |
| 5 | Lateral Damper/Lug | Connection at one end of the lateral damper |
| 6 | Lateral Damper/Rear Bracket | Connection between lateral damper and rear bracket |
| 7 | Cab/Front Upper Bracket | Connection between front upper support and cab |
| 8 | Front Upper Bracket/Front Upper Support | Connection between front upper bracket and frame |
| 9 | Front Upper Bracket/Stabilizer Bar | Connection between front upper bracket and stabilizer bar |
Table 8.
Optimal combinations of bushing stiffness.
| Bushing Parameter | B3Ry (N/°) |
B4Ry (N/°) |
B4Tz (N/mm) |
B6Rx (N/°) |
B8Tx (N/mm) |
|---|---|---|---|---|---|
| Pre-Optimization | 11,000 | 10,000 | 4500 | 8500 | 4000 |
| General Road Optimization | 13,069 | 5885 | 4498 | 5558 | 2481 |
| Belgian Road Optimization | 14,131 | 11,790 | 3549 | 6590 | 2127 |
| Cobblestone Road Optimization | 14,060 | 10,730 | 3434 | 8393 | 4651 |
Table 9.
Optimization Results for General Road.
| Index | Pre-Optimization | Suspension Parameter Optimization | Bushing Optimization |
|---|---|---|---|
| Maximum Roll Angle (°) | 0.215 | 0.178 | 0.178 |
| Maximum Pitch Angle (°) | 0.519 | 0.722 | 0.720 |
| Maximum Spring Deflection (mm) | 14.8 | 28.7 | 28.7 |
| Weighted RMS Acceleration (X-axis) (m/s2) | 0.278 | 0.274 | 0.282 |
| Weighted RMS Acceleration (Y-axis) (m/s2) | 0.163 | 0.191 | 0.190 |
| Weighted RMS Acceleration (Z-axis) (m/s2) | 0.559 | 0.491 | 0.483 |
| Total Weighted RMS Acceleration av (m/s2) | 0.645 | 0.591 | 0.591 |
| Power spectral density peak in X-axis (m2/s3) | 0.133 | 0.102 | 0.110 |
| Power spectral density peak in Y-axis (m2/s3) | 0.03 | 0.043 | 0.043 |
| Power spectral density peak in Z-axis (m2/s3) | 0.5 | 0.435 | 0.436 |
| Front Suspension Isolation Rate (%) | 42.3% | 50.5% | 51.1% |
Table 10.
Optimization Results for Belgian Road.
| Index | Pre-Optimization | Suspension Parameter Optimization | Bushing Optimization |
|---|---|---|---|
| Maximum Roll Angle (°) | 1.128 | 1.21 | 1.18 |
| Maximum Pitch Angle (°) | 0.884 | 1.187 | 1.13 |
| Maximum Spring Deflection (mm) | 28.53 | 37.78 | 37.72 |
| Weighted RMS Acceleration (X-axis) (m/s2) | 0.856 | 0.829 | 0.832 |
| Weighted RMS Acceleration (Y-axis) (m/s2) | 0.851 | 0.851 | 0.833 |
| Weighted RMS Acceleration (Z-axis) (m/s2) | 1.892 | 1.846 | 1.819 |
| Total Weighted RMS Acceleration av (m/s2) | 2.537 | 2.485 | 2.454 |
| Vibration dose value (VDV) total (m·s−1.75) | 6.902 | 6.777 | 6.72 |
| Power spectral density peak in X-axis (m2/s3) | 2.035 | 2.19 | 1.32 |
| Power spectral density peak in Y-axis (m2/s3) | 0.55 | 0.56 | 0.55 |
| Power spectral density peak in Z-axis (m2/s3) | 1.8 | 1.87 | 1.84 |
| Front Suspension Isolation Rate (%) | 69% | 71.13% | 71.4% |
Table 11.
Optimization Results for Cobblestone Road.
| Index | Pre-Optimization | Suspension Parameter Optimization | Bushing Optimization |
|---|---|---|---|
| Maximum Roll Angle (°) | 1.32 | 1.20 | 1.08 |
| Maximum Pitch Angle (°) | 1.42 | 1.21 | 1.20 |
| Maximum Spring Deflection (mm) | 37.37 | 38.5 | 35.29 |
| Weighted RMS Acceleration (X-axis) (m/s2) | 3.215 | 3.06 | 3.06 |
| Weighted RMS Acceleration (Y-axis) (m/s2) | 2.05 | 2.09 | 2.06 |
| Weighted RMS Acceleration (Z-axis) (m/s2) | 8.18 | 8.57 | 8.79 |
| Total Weighted RMS Acceleration av (m/s2) | 2.862 | 2.968 | 3.02 |
| Vibration dose value (VDV) total (m·s−1.75) | 9.16 | 9.55 | 9.76 |
| Power spectral density peak in X-axis (m2/s3) | 1.4 | 1.421 | 1.524 |
| Power spectral density peak in Y-axis (m2/s3) | 0.345 | 0.424 | 0.436 |
| Power spectral density peak in Z-axis (m2/s3) | 3.538 | 4.076 | 4.138 |
| Front Suspension Isolation Rate (%) | 60.6% | 58.7% | 58.4% |
Table 12.
Verification of Optimization Results for Belgian Road.
| Index | General Road | Cobblestone Road | ||
|---|---|---|---|---|
| Before Optimization | After Optimization | Before Optimization | After Optimization | |
| Maximum roll angle (°) | 0.215 | 0.193 | 1.316 | 1.291 |
| Maximum pitch angle (°) | 0.519 | 0.598 | 1.421 | 1.523 |
| Maximum spring deformation (mm) | 14.22 | 13.53 | 37.372 | 39.6 |
| Total weighted acceleration RMS av (m/s2) | 0.645 | 0.686 | 2.613 | 2.573 |
| Vibration dose value (VDV) total (m·s−1.75) |
—— | —— | 9.158 | 8.88 |
| Power spectral density peak in X-axis (m2/s3) | 0.133 | 0.135 | 1.40 | 1.455 |
| Power spectral density peak in Y-axis (m2/s3) | 0.03 | 0.033 | 0.345 | 0.387 |
| Power spectral density peak in Z-axis (m2/s3) | 0.511 | 0.525 | 3.539 | 3.544 |
| Front Suspension Isolation Rate (%) | 42.31% | 39.91% | 60.6% | 61.6% |
Table 13.
Verification of Optimization Results for General Road.
| Index | Belgian Road | Cobblestone Road | ||
|---|---|---|---|---|
| Before Optimization | After Optimization | Before Optimization | After Optimization | |
| Maximum roll angle (°) | 1.128 | 1.510 | 1.316 | 2.198 |
| Maximum pitch angle (°) | 0.884 | 1.949 | 1.421 | 2.403 |
| Maximum spring deformation (mm) | 28.533 | 56.14 | 37.372 | 66.023 |
| Total weighted acceleration RMS av (m/s2) | 2.244 | 3.175 | 2.613 | 3.487 |
| Vibration dose value (VDV) total (m·s−1.75) |
6.902 | 12.895 | 9.158 | 14.880 |
| Power spectral density peak in X-axis (m2/s3) | 2.035 | 2.676 | 1.40 | 1.375 |
| Power spectral density peak in Y-axis (m2/s3) | 0.547 | 1.156 | 0.345 | 1.054 |
| Power spectral density peak in Z-axis (m2/s3) | 1.799 | 4.027 | 3.539 | 4.964 |
| Front Suspension Isolation Rate (%) | 69.98% | 60.53% | 60.6% | 48.7% |
Table 14.
Verification of Optimization Results for Cobblestone Road.
| Index | General Road | Belgian Road | ||
|---|---|---|---|---|
| Before Optimization | After Optimization | Before Optimization | After Optimization | |
| Maximum roll angle (°) | 0.215 | 0.176 | 1.128 | 1.10 |
| Maximum pitch angle (°) | 0.519 | 0.577 | 0.884 | 0.867 |
| Maximum spring deformation (mm) | 14.22 | 13.53 | 28.533 | 33.3 |
| Total weighted acceleration RMS av (m/s2) | 0.645 | 0.717 | 2.244 | 2.394 |
| Vibration dose value (VDV) total (m·s−1.75) |
—— | —— | 6.902 | 7.422 |
| Power spectral density peak in X-axis (m2/s3) | 0.133 | 0.180 | 2.035 | 2.361 |
| Power spectral density peak in Y-axis (m2/s3) | 0.03 | 0.032 | 0.547 | 0.605 |
| Power spectral density peak in Z-axis (m2/s3) | 0.511 | 0.525 | 1.799 | 2.10 |
| Front Suspension Isolation Rate (%) | 42.31% | 36.53% | 69.98% | 67.9% |
Disclaimer/Publisher’s Note: The statements, opinions and data contained in all publications are solely those of the individual author(s) and contributor(s) and not of MDPI and/or the editor(s). MDPI and/or the editor(s) disclaim responsibility for any injury to people or property resulting from any ideas, methods, instructions or products referred to in the content. |
© 2025 by the authors. Licensee MDPI, Basel, Switzerland. This article is an open access article distributed under the terms and conditions of the Creative Commons Attribution (CC BY) license (http://creativecommons.org/licenses/by/4.0/).
Copyright: This open access article is published under a Creative Commons CC BY 4.0 license, which permit the free download, distribution, and reuse, provided that the author and preprint are cited in any reuse.


