
Submitted:
02 December 2025
Posted:
04 December 2025
You are already at the latest version
Abstract
Uric acid (UA), the end product of purine metabolism in humans, is a crucial biomarker closely associated with various diseases. This study developed a novel enzyme-free colorimetric sensing platform based on starch-derived nitrogen-doped biochar (NC) for the highly sensitive and selective detection of UA in human body fluids. The NC material with a high specific surface area and abundant nitrogen active sites was prepared via a two-step strategy involving hydrothermal synthesis followed by high-temperature pyrolysis, using starch and urea as raw materials. It efficiently catalyzed dissolved oxygen to generate reactive oxygen species (·O2- and 1O2) under mild conditions, which oxidized 3,3',5,5'-tetramethylbenzidine (TMB) to produce a blue-colored product (TMBox). UA reduced TMBox back to colorless TMB, resulting in a decrease in absorbance at 652 nm, enabling the quantitative detection of UA. Key reaction conditions were systematically optimized. Material characterization and mechanistic investigations confirmed the catalytic performance. The method demonstrated a wide linear range of 10-500 μmol·L-1 and a low detection limit of 4.87 μmol·L-1, along with excellent selectivity, stability, and reproducibility. Practical application in human serum and urine samples yielded results consistent with clinical reference ranges, and spike-recovery rates ranged from 95.5% to 103.6%, indicating great potential for real-sample analysis.
Keywords:
nitrogen-doped biochar
; TMB
; colorimetric assay
; uric acid
; biosensor
1. Introduction
Uric acid (UA), the end product of purine metabolism in the human body, serves as a crucial biomarker whose concentration is closely associated with the diagnosis and monitoring of various diseases[1]. Under normal physiological conditions, the concentration of uric acid in human blood is maintained within the range of 120-460 μM, while its content in urine ranges from 1.4 to 4.4 mM[2,3]. An imbalance in uric acid metabolism can lead to hyperuricemia, which is a direct causative factor for gout, kidney stones, and renal dysfunction[4]. Numerous clinical studies in recent years have also indicated a significant correlation between abnormal uric acid levels and chronic diseases such as cardiovascular diseases, metabolic syndrome, and type 2 diabetes[5,6,7]. Therefore, the development of rapid, accurate, reliable, and cost-effective methods for uric acid detection can serve as an early screening and warning tool for various human diseases.
Currently, commonly used methods for uric acid detection primarily include enzymatic methods[8,9], chromatography[10,11], electrochemical methods[12,13], capillary electrophoresis[14], fluorescence spectroscopy[15,16], and chemiluminescence methods[17,18]. The enzymatic method is the most widely used detection technique, relying on the specific catalysis of uricase on uric acid and achieving quantification by detecting the hydrogen peroxide produced or oxygen consumed during the reaction[9,19]. Although the enzymatic method offers high selectivity, the inherent drawbacks of biological enzymes—such as poor stability, high cost of preparation and purification, stringent storage requirements (e.g., low temperature, protection from light), and sensitivity to pH and temperature—limit their application in resource-limited settings[20]. Chromatographic methods, such as high-performance liquid chromatography, provide high accuracy and strong specificity but require expensive instrumentation, specialized operators, and complex sample pretreatment procedures, making them unsuitable for on-site rapid detection needs[21]. Electrochemical methods have attracted attention due to their high sensitivity, rapid response, and potential for instrument miniaturization. However, electrodes are susceptible to fouling and passivation by complex matrices in biological samples, leading to poor reproducibility, and often require complex electrode modification processes[22]. Methods like capillary electrophoresis, fluorescence spectroscopy, and chemiluminescence suffer from issues such as complicated sample pretreatment, complex detection systems, and poor selectivity.
In recent years, enzyme-free colorimetric sensing technology has shown great promise in the field of bioanalysis due to its advantages of simple operation, low cost, and the ability for semi-quantitative analysis by the naked eye[23,24,25]. These methods typically utilize materials to catalytically oxidize 3,3′,5,5′-tetramethylbenzidine (TMB), causing it to develop color, and then leverage the reducing property of the target analyte to fade the color, thereby enabling quantitative detection via UV-Vis spectrophotometry or smartphone cameras[25]. To date, researchers have developed various materials with good activity for enzyme-free uric acid detection, including noble metal nanoparticles (e.g., Au, Ag) [26,27] , metal oxides (e.g., Co₃O₄, MnO₂)[24,28], metal-organic frameworks (MOFs) [29], and polymetallic oxomolybdate[30]. However, these materials still face numerous challenges: noble metal nanomaterials are costly and prone to aggregation[31]; some metal-based materials may leach metal ions, posing risks of biotoxicity and environmental concerns[32]; and the preparation processes for most materials are relatively complex.
Among the various candidate materials, carbon-based materials, particularly doped carbon materials, have garnered significant favor due to their excellent chemical stability, high specific surface area, good biocompatibility, and tunable electronic structure[33,34]. Among these, nitrogen doping has proven to be an effective strategy for enhancing the catalytic activity of carbon materials. The introduction of nitrogen atoms can alter the electron distribution of the carbon framework, create more active sites, and enhance the interaction between the material and substrates[35,36]. Studies have shown that graphitic nitrogen and nitrogen-containing functional groups formed in nitrogen-doped carbon materials serve as effective active sites capable of participating in catalytic oxidation processes[37,38]. This provides unique advantages for constructing enzyme-free colorimetric methods for uric acid detection based on the catalytic oxidation of TMB. However, most reported nitrogen-doped carbon materials are primarily utilized as peroxidase mimics or oxidase mimics[39,40,41,42], and research on their application in enzyme-free colorimetric methods for detecting uric acid in human body fluids remains relatively scarce.
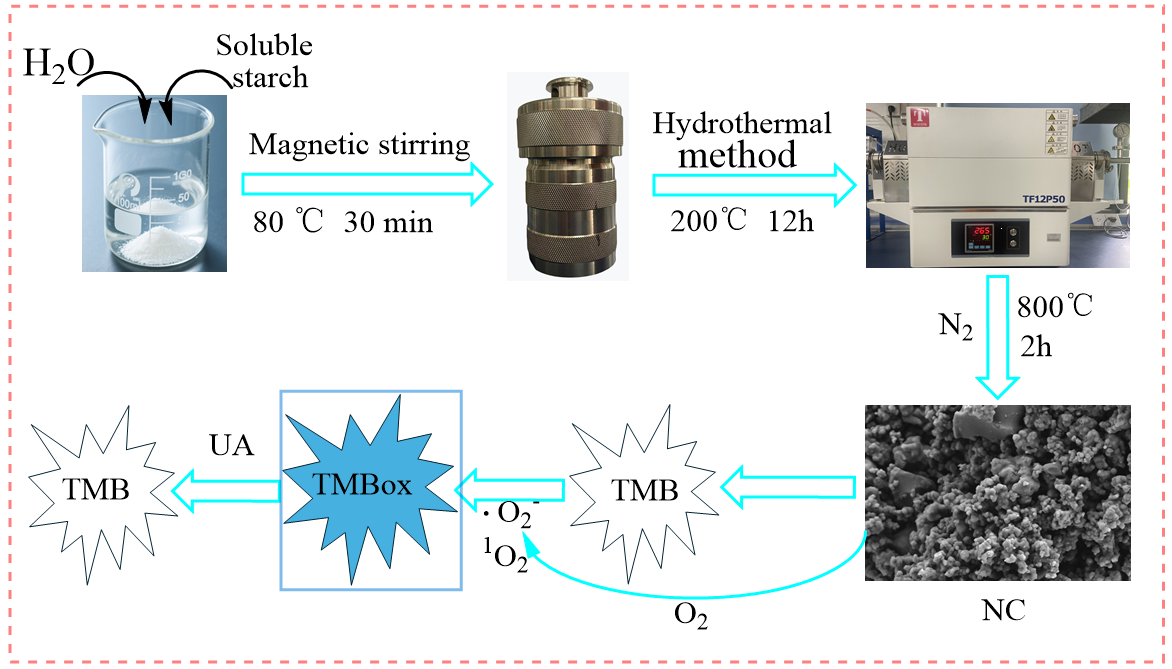
This study aims to develop a novel enzyme-free colorimetric sensing platform based on starch-derived nitrogen-doped biochar (NC) for the highly sensitive and selective detection of uric acid in human body fluids (as shown in Figure 1). Using starch and urea as green, low-cost carbon and nitrogen sources, NC with a porous structure, high specific surface area, and abundant nitrogen active sites was prepared through a two-step strategy involving hydrothermal synthesis followed by high-temperature pyrolysis. This material efficiently catalyzes the generation of ·O2- and 1O2 from dissolved oxygen under mild conditions. The ·O2- and 1O2 oxidize TMB to produce blue complex product (TMBox). Uric acid can reduce TMBox back to its colorless form, leading to a decrease in absorbance at 652 nm. The concentration of UA is subsequently determined based on this reduction in absorbance. Systematic optimization was conducted regarding the effects of reaction temperature, chromogenic agent volume, NC dosage, reaction time, and solution pH on the color development. The performance of the NC was characterized by X-ray diffraction (XRD), scanning electron microscopy (SEM), surface area and porosity analysis (BET), and X-ray photoelectron spectroscopy (XPS). We anticipate that this research will provide new insights for developing low-cost, high-performance enzyme-free biosensors and promote their practical application in clinical diagnosis and health monitoring.
2. Materials and Methods
2.1. Reagents and Instruments
Soluble starch ((C6H10O5)n), urea (Urea), acetic acid (HAc), NaH₂PO₄·2H₂O, Na₂HPO₄·12H₂O, glucose (Glu), NaOH, hydrogen peroxide, KCl, Na2CO3, ascorbic acid (AA) were purchased from Guangzhou Chemical Reagent Factory; uric acid (UA) was purchased from Shanghai McLean Biochemical Science & Technology Co., Ltd; anhydrous ethanol was purchased from Xilong Chemical Co., Ltd; cysteine (Cys), para-benzoquinone (BQ), tert-butyl alcohol (TBA), glycine (Gly), aspartic acid (Asp), tyrosine (Tyr), dopamine (DA), 3,3′,5,5′-tetramethylbenzidine (TMB), furfuryl alcohol (FFA) were purchased from Shanghai Aladdin Biochemical Technology Co., Ltd; cholesterol (Chol) was purchased from Oddfoni Biotechnology Co., Ltd; sodium acetate (NaAc) was purchased from West Asia Reagent; medium-chain triglycerides (C39H74O6, Trig) were purchased from Shanghai Yuanye Biotechnology Co., Ltd; NH4Cl, Ca(CH3COO)2·H2O were purchased from Tianjin Komeo Chemical Reagent Co. All the reagents were analytically pure, and the experimental water was deionized water.
All UV-Vis spectra were obtained by UV-2600 UV–Vis spectrophotometer (Shimadzu, Japan); IRTracer-100 FT-IR spectrometer (FT-IR, Shimadzu, Japan) was used to characterize the functional groups of NC; D8 advance X-ray diffractometer (XRD, Bruker, Germany) was used to characterize the crystalline structure of NC; the morphology of NC was observed by Supra 55 field emission scanning electron microscope (SEM, Carl Zeiss, Germany); the elemental and chemical composition of NC was measured Xray photoelectron spectroscopy (XPS, ESCALAB 250XI, Thermo); the specific surface area, pore size and pore volume of NC were characterized by Autosorb-iQ specific surface area and pore size analyzer (BET, Quantachrome, USA). The hydrothermal and pyrolysis reactions were accomplished by a 100 mL hydrothermal reactor (Xian Yichuang Co., Ltd.) and TF12P50 vacuum/atmosphere tube furnaces (Tianjin Tester Instrument Co., Ltd.), respectively. The water-bath reaction was carried out on a WE-2 water-bath constant temperature oscillator (Tianjin Honour Instrumentation Co., Ltd.).
2.2. Preparation of Starch-Based Nitrogen-Doped Biochar
Starch-based nitrogen-doped biochar was prepared by hydrothermal and pyrolysis methods as follows: 5.0 g of soluble starch and 1.0 g of urea were taken in 50 mL deionized water,and it was placed in a water bath at 80 ℃ with magnetic stirring for 30 min. Then the mixture was poured into a high-pressure hydrothermal reactor and hydrothermally reacted for 12 h in the oven at 200 ℃[38]. The solid products were washed alternately with anhydrous ethanol and deionized water until neutral, and them were dried in a vacuum oven at 80 ℃ for 5 h. Finally, them were transferred to a tube furnace, heated to 800 °C at a rate of 5 °C⋅min-1 under a nitrogen atmosphere, maintained at this temperature for 2 h, and then cooled back to room temperature. The resulting product was regarded as starch-based nitrogen-doped biochar (NC).
2.3. Colorimetric Determination of UA
35 μL of 8 mmol/L TMB solution were mixed well with 2.5 mL NaAc-HAc buffer (0.2 M, pH = 4.6) in a centrifuge tube. Then 4 mg of NC was added into the aforementioned solution, and shaken for 5 minutes in water bath at 35 ℃. The mixture was filtered through a 0.22 μm membrane after reaction, and UA standard solutions (200μL) of different concentrations were added to the filtrate, subsequently the solution was shaken for 20 min in water bath at 35 ℃. Finally, it was scanned by UV-Vis spectrometer in the range of 400-800 nm, and the absorbance at 652 nm (A652 nm) was recorded. The absorbance difference can be calculated as ΔA = (A0-An), where A0 and An represent A652 nm without and with UA, respectively.
2.4. Pretreatment of Human Serum and Urine
Human serum and urine samples were provided by three volunteers, of which serum was collected with the assistance of Zhaoqing College Hospital. The serum samples were centrifuged at 4000 rpm for 15 min, and the supernatant was used directly for the determination of UA. The urine samples were diluted 10 times with deionized water before measuring the UA content.
3. Results and Discussion
3.1. Characterization of NC
The synthesized NC samples were characterized by XRD, SEM, BET and XPS, as depicted in Figure 2 and Figure 3. In Figure 2A, two broader diffraction peaks were observed at 25.82° and 43.78°, which were indexed to the (002) and (100) planes of graphitic carbon, thereby confirming its graphitic carbon structure[43]. The diffraction peak (26.5°) of the graphitic carbon (002) crystal plane was displaced to 25.82°, indicating that the N atom had doped into the carbon network[44]. The SEM image (Figure 2B) reveals that the NC is composed of irregularly shaped particles that aggregate to form a porous morphology. The surface of the particles appears relatively smooth. The nitrogen adsorption isotherm of NC (Figure 2C) showed that NC had microporous and mesoporous structures. The Density Functional Theory (DFT) pore size distribution plots (Figure 2D) indicates that the primary pore sizes are distributed between 1.029 and 6.830 nm, with an average pore size of 1.030 nm. In addition, the specific surface area, micropore volume and total pore volume of NC were 272.861 m2·g-1, 0.049 cm3·g-1 and 0.258 cm3·g-1, respectively. The XPS spectrum (Figure 3A) of NC shows three distinct peaks at approximately 285, 401, and 533 eV, which are assigned to C 1s, N 1s, and O 1s, respectively. The C, N and O elemental contents of NC were 88.18%, 6.73% and 5.09%, respectively. The peak-fitting analysis of the C 1 s spectrum is presented in Figure 3B. The spectrum is deconvoluted into four component peaks located at binding energies of 284.65 eV (assigned to C-C/C=C), 285.40 eV (C-OH/C=N), 286.23 eV (C-O-C/C=O), and 288.12 eV (C-N)[44]. In Figure 3C, the N 1 s spectrum can be deconvoluted into four peaks, corresponding to pyridinic N (398.20 eV), pyrrolic N (399.97 eV), graphitic N (401.01 eV), and N-Oxide (404.00 eV)[45,46]. As confirmed in Figure 3D, the peaks of 531.86 eV, 532.50 eV, and 533.94 eV correspond to the C-OH, N-Oxide, and C=O peaks, respectively. XPS analyses showed that N was successfully incorporated into the carbon framework, which is consistent with the XRD results.
3.2. Feasibility of UA Colorimetric Assay
Five centrifuge tubes were prepared and labelled a-e. 2.5 mL NaAc-HAc buffer solution (0.2 M, pH=4.0) was added each centrifuge tube, and then the reagents added to it were as follows:
- Centrifuge tube a: 200 μL H2O2 (200 μmol·L-1).
- Centrifuge tube b: 200 μL H2O2 (200 μmol·L-1), 60 μL TMB (8 mmol·L-1).
- Centrifuge tube c: 60 μL TMB (8 mmol·L-1), 8 mg NC.
- Centrifuge tube d: 200 μL H2O2 (200 μmol·L-1), 60 μL TMB (8 mmol·L-1), 8 mg NC.
- Centrifuge tube e: 60 μL TMB (8 mmol·L-1), 8 mg NC.
All reagents were mixed well and all tubes were then subjected to a constant temperature reaction at 30 °C in a water bath for 5 min. Subsequently, the mixture in each tube was filtered through a 0.22 μm filter membrane. Finally, 200 μL of 1 mmol·L-1 UA was added to the filtrate in centrifuge tube e and carried out in a constant temperature reaction at 30°C in a water bath for 10 min. The UV-Vis spectra of the solutions in the range of 400-800 nm were then recorded (Figure 4), with the following observations:
- No absorption at 652 nm was observed in the H2O2 system (Figure 4a).
- The colorless solution and a minimal A652 nm were observed in the H2O2 + TMB system (Figure 4b), confirming the limited oxidizing capacity of H2O2 toward TMB.
- The addition of UA to the filtrate of the TMB + NC system resulted in a significant decrease in A652 nm and a lighter color of the solution (Figure4f). This indicates that UA could reduce blue TMBox to colorless TMB and confirms the feasibility of utilizing the reduction in A652 nm of TMBox for the colorimetric detection of UA concentration.
3.3. Optimization of Color Development Conditions and Stability
A systematic optimization of key parameters (temperature, pH, NC dosage, TMB dosage, and reaction time) was conducted to achieve optimal system color development, with the results detailed in Figure 5. As shown in Figure 5A, the A652 nm of the system was affected by the reaction temperature, with the maximum value at 35 °C in the range of 25-45 °C. This was because the catalytic activity of NC was inherently slightly low at temperatures below 35 °C, while at temperatures above 35 °C, its efficiency was impaired by a reduction in dissolved oxygen. Hence, the optimal reaction temperature was determined to be 35 °C. As confirmed in Figure 5B, the pH of the system (within the range of 3.0 to 5.4) significantly influenced the catalytic activity of NC. When the pH<4, the excessive catalytic activity of NC led to over-oxidation of TMB, causing the solution color to shift from blue-green to green and a consequent decrease in A652 nm. Conversely, when the pH>4, the A652 nm decreased significantly with increasing pH. As a result, the optimal pH was determined to be 4.6. The effect of NC dosage on the system is shown in Figure 5C. The A652 nm of the system initially increased and then decreased with the increasing amount of NC. An absorbance value greater than 1 was found to be detrimental to the linear relationship between UA concentration and A652 nm. Therefore, the optimal dosage of NC was determined to be 4 mg. In Figure 5D, the A652 nm of the system increased with the TMB dosage in the range of 30-50 μL. A volume of 35 μL was selected to prevent the absorbance from becoming excessive, which could adversely affect the detection limit for UA. The effect of reaction time on the A652 nm of system is depicted in Figure 5E. The A652 nm initially increased and then slightly decreased as the reaction time increased from 3 to 7 min. The observed decrease in A652 nm was due to over-oxidation of the TMB when reaction time exceeded 5 min. Therefore, a reaction time of 5 min was chosen as optimal.
Under optimal conditions, the A652 nm of the NC-TMB chromogenic system showed minimal change over 10 minutes, with a relative standard deviation (RSD) of less than 1.78% as shown in Figure 5F. This indicates that the reaction medium maintained good stability after the removal of NC by filtration, thus providing sufficient time for subsequent measurements without the addition of termination or stabilizing agents.
3.4. Optimization of UA Reduction Time
The influence of the UA reduction duration on ΔA is presented in Figure 6, wherein the ΔA value undergoes a rapid initial ascent within the first 10 minutes, subsequently approaching a plateau. A 20-min reduction time was ultimately adopted, equilibrating the considerations of analytical efficiency and signal stability. This allows for the capture of a substantial signal alteration while circumventing an undue prolongation of the reaction time.
3.5. Stability of NC
A comprehensive evaluation of NC stability was performed by assessing the colorimetric results from different batches and from a single batch following different storage periods, all under optimal color development conditions. In Figure 7A, minimal variation was observed in the absorbance at 652 nm (RSD=2.5%) among the color development systems of four NC batches prepared concurrently. This result indicates that the activity of different batches of NC remains consistent. Moreover, when a single batch of NC was stored for 1 to 5 weeks, the absorbance of its color development system at 652 nm showed minimal change, with an RSD of 1.4% (Figure 7B). This indicates that the activity of the NC remains stable after long-term storage. These results confirm the excellent stability of the prepared NC, demonstrating its suitability for long-term use in colorimetric detection.
3.6. Linear Response Range and Sensitivity for UA Sensing
Under optimal chromogenic conditions, 200 μL of UA solutions with varying concentrations (10-500 μmol·L-1) were added to the chromogenic system and subjected to hydrothermal treatment at 35 °C for 20 min. The UV-Vis spectra of the resulting solutions were then recorded over the wavelength range of 400-800 nm (Figure 7C). As shown in the inset of Figure 7C, the A652 nm of the system decreased progressively with increasing UA concentration, accompanied by a noticeable lightening of the solution color. A linear relationship between ΔA and UA concentration was observed across the range of 10-500 μmol·L-1 (Figure 7D). The calibration curve was fitted with the equation: ΔA=0.0009CUA+0.145 (R2=0.997). The method demonstrated high sensitivity, with a limit of detection (LOD) determined to be 4.87 μmol·L-1, calculated based on 3σ/s (where s represents the calibration curve slope and σ denotes the standard deviation from seven replicate measurements).
Method precision was evaluated using UA solutions at three concentrations (15 μmol·L-1, 50 μmol·L-1, and 200 μmol·L-1) within the linear range. Each concentration was subjected to five successive measurements and the RSDs were determined to be 2.9%, 2.5%, and 1.7%, confirming the high precision of the method.
Compared with other reported methods for UA detection, the NC enzyme-free colorimetric assay exhibits comparable analytical performance in terms of linear range, detection limit, and analysis time, as summarized in Table 1. Notably, this method operates without requiring metals, enzymes (both natural and nanozymes), or H2O2. Furthermore, the detection process is faster than enzyme-based assays, and the preparation of NC is straightforward and environmentally benign. Consequently, the NC enzyme-free colorimetric strategy demonstrates high sensitivity, low cost, rapid response, and eco-friendliness. Owing to these attributes, it represents a promising analytical platform for UA determination.
3.7. Selectivity of UA Sensing
A study was conducted on coexisting compounds in serum and urine (such as amino acids, biomolecules, and certain ions) to investigate the selectivity of the NC enzyme-free colorimetric method for UA detection. As shown in Figure 8A and 8B, the ΔA of the system was measured after the addition of 500 μmol·L-1 K+, Na+, Ca2+, Mg2+, NH₄+, Cl-, CO32-, HPO4-, H2PO4-, Gly, Asp, Tyr, Trig, Urea, Chol, Glu, 5 μmol·L-1 AA, DA, Cys, and 400 μmol·L-1 UA. The results indicated that only UA caused a significant decrease in the absorbance of the system at the aforementioned concentrations. Furthermore, when the above substances were added simultaneously with 400 μmol·L-1 UA, no interference was observed in the system's ΔA, as shown in Figure 8C and 8D. Further studies revealed that AA, DA, and Cys significantly affected the detection system only when their concentrations exceeded 10 μmol·L-1 (Figure 8E). Fortunately, given their considerably lower concentrations in serum and urine compared to UA[25], AA, DA, and Cys did not interfere with the detection, thus demonstrating the good selectivity of the developed assay.
3.8. UA Detection Mechanism
To investigate the mechanism of the NC-TMB chromogenic system, free radical scavengers including TBA, BQ, and FFA were employed to quench ·OH, ·O2-, and 1O2, respectively. Under optimal chromogenic conditions, 200 μL of TBA or FFA, or 4 mg of BQ was added to the system before the introduction of TMB. The UV-Vis spectra (Figure 8F) revealed that the absorbance at 652 nm remained nearly unchanged after the addition of TBA. In contrast, a significant reduction in absorbance at 652 nm—reaching nearly zero—was observed upon the introduction of BQ and FFA. These results indicate that ·O2- and 1O2 play a predominant role in promoting the chromogenic process. This phenomenon can be attributed to the active sites in NC, such as graphitic nitrogen and nitrogen-containing functional groups[37,38], which facilitate electron transfer to dissolved oxygen, generating ·O2-. The resulting ·O2- subsequently reacts with H⁺ to yield 1O2[51]. The operational mechanism for UA detection is depicted in Figure 1. It begins with NC catalyzing dissolved oxygen to produce ·O2- and 1O2. These species then oxidize the colorless substrate TMB to form a blue TMBox product. In the key detection step, UA acts as a reducing agent, reverting blue TMBox to its colorless state. This cascade culminates in a measurable drop in A652 nm, which directly correlates with and enables the quantification of UA concentration.
3.9. Actual Urine Sample Testing
The novel NC enzyme-free colorimetric assay was evaluated via three times parallel determinations of serum and urine samples from three healthy adult volunteers and spiked recovery experiments. As summarized in Table 2, the measured serum UA concentrations (380.70, 257.94, and 307.46 μmol·L-1) and urinary UA levels (3.22, 1.70, and 2.42 mmol·L-1) all fell within their established clinical reference ranges (120-460 μmol·L-1 and 1.4-4.4 m mol·L-1, respectively). The method validation results showed that the spiked recoveries for all samples ranged from 95.5% to 103.6%, with an RSD of less than 3%. These results indicate that the method is accurate, reliable, and highly precise for determining UA in serum and urine. For practical applications such as home-testing devices, monitoring urinary UA presents a more feasible alternative, as serum testing involves a more complex sampling procedure.
4. Conclusions
In summary, we successfully constructed an enzyme-free colorimetric sensing platform based on starch-derived nitrogen-doped biochar for the rapid, sensitive, and selective detection of uric acid. The NC material was synthesized via a green and low-cost method, exhibiting excellent catalytic activity and stability. Under optimal conditions, the assay displayed a wide linear range, a low detection limit, and strong anti-interference capability. Mechanistic studies revealed that NC catalyzes dissolved oxygen to generate ·O2- and 1O2, which drive the chromogenic reaction of TMB. UA induces a signal switch by reducing blue TMBox to colorless TMB. Accurate and reliable results from real serum and urine sample analyses validate the method's promising application potential in clinical diagnosis and health monitoring.
Funding
Please add: This work was jointly supported by Innovative Training Project (202510580016), Innovation Research Team Project of Zhaoqing University (TD202411, TD202418), the Science and Technology Innovation Guidance Project of Zhaoqing City (No. 241223110090446).
Institutional Review Board Statement
Not applicable.
Data Availability Statement
The data presented in this study are available on request from the corresponding author due to privacy.
Conflicts of Interest
The authors declare no conflicts of interest.
References
- Wang, Q.; Wen, X.; Kong, J. Recent Progress on Uric Acid Detection: A Review. Critical Reviews in Analytical Chemistry 2020, 50, 359–375. [Google Scholar] [CrossRef]
- Ma, C.; Jiang, N.; Sun, X.; Kong, L.; Liang, T.; Wei, X.; Wang, P. Progress in Optical Sensors-Based Uric Acid Detection. Biosensors and Bioelectronics 2023, 237, 115495. [Google Scholar] [CrossRef]
- Wen, S.; Arakawa, H.; Tamai, I. Uric Acid in Health and Disease: From Physiological Functions to Pathogenic Mechanisms. Pharmacology & Therapeutics 2024, 256, 108615. [Google Scholar] [CrossRef]
- Du, L.; Zong, Y.; Li, H.; Wang, Q.; Xie, L.; Yang, B.; Pang, Y.; Zhang, C.; Zhong, Z.; Gao, J. Hyperuricemia and Its Related Diseases: Mechanisms and Advances in Therapy. Sig Transduct Target Ther 2024, 9, 212. [Google Scholar] [CrossRef]
- Prabhakar, A.P.; Lopez-Candales, A. Uric Acid and Cardiovascular Diseases: A Reappraisal. Postgraduate Medicine 2024, 136, 615–623. [Google Scholar] [CrossRef]
- Copur, S.; Demiray, A.; Kanbay, M. Uric Acid in Metabolic Syndrome: Does Uric Acid Have a Definitive Role? European Journal of Internal Medicine 2022, 103, 4–12. [Google Scholar] [CrossRef]
- Hu, X.; Yang, Y.; Hu, X.; Jia, X.; Liu, H.; Wei, M.; Lyu, Z. Effects of Sodium-Glucose Cotransporter 2 Inhibitors on Serum Uric Acid in Patients with Type 2 Diabetes Mellitus: A Systematic Review and Network Meta-Analysis. Diabetes, Obesity and Metabolism 2022, 24, 228–238. [Google Scholar] [CrossRef]
- Chen, J.; Zhong, J.; Lai, J.; Peng, Z.; Lian, T.; Tang, X.; Li, P.; Qiu, P. Enhancing Catalytic Performance of Fe and Mo Co-Doped Dual Single-Atom Catalysts with Dual-Enzyme Activities for Sensitive Detection of Hydrogen Peroxide and Uric Acid. Analytica Chimica Acta 2023, 1273, 341543. [Google Scholar] [CrossRef]
- Hou, B.; Guo, X.; Zhang, Y.; Zhang, L.; Zhang, D.; Wu, Z.; Zhang, J.; Hao, Z. Rational Atomic Engineering of Prussian Blue Analogues as Peroxidase Mimetics for Colorimetric Urinalysis of Uric Acid. ACS Sustainable Chem. Eng. 2023, 11, 6211–6219. [Google Scholar] [CrossRef]
- Chen, Y.; Ji, P.; Ma, G.; Song, Z.; Tang, B.Q.; Li, T. Simultaneous Determination of Cellular Adenosine Nucleotides, Malondialdehyde, and Uric Acid Using HPLC. Biomedical Chromatography 2021, 35, e5156. [Google Scholar] [CrossRef]
- Li, X.-L.; Li, G.; Jiang, Y.-Z.; Kang, D.; Jin, C.H.; Shi, Q.; Jin, T.; Inoue, K.; Todoroki, K.; Toyo’oka, T.; et al. Human Nails Metabolite Analysis: A Rapid and Simple Method for Quantification of Uric Acid in Human Fingernail by High-Performance Liquid Chromatography with UV-Detection. Journal of Chromatography B 2015, 1002, 394–398. [Google Scholar] [CrossRef]
- Yu, P.; Zhang, J.; Zheng, T.; Wang, T. Influence of Boron Doped Level on the Electrochemical Behavior of Boron Doped Diamond Electrodes and Uric Acid Detection. Colloids and Surfaces A: Physicochemical and Engineering Aspects 2016, 494, 241–247. [Google Scholar] [CrossRef]
- Li, Y.; Lin, H.; Peng, H.; Qi, R.; Luo, C. A Glassy Carbon Electrode Modified with MoS2 Nanosheets and Poly(3,4-Ethylenedioxythiophene) for Simultaneous Electrochemical Detection of Ascorbic Acid, Dopamine and Uric Acid. Microchim Acta 2016, 183, 2517–2523. [Google Scholar] [CrossRef]
- Moravčík, O.; Dvořák, M.; Kubáň, P. Autonomous Capillary Electrophoresis Processing and Analysis of Dried Blood Spots for High-Throughput Determination of Uric Acid. Analytica Chimica Acta 2023, 1267, 341390. [Google Scholar] [CrossRef]
- Cao, D.; Luo, Y.-X.; Liu, W.-P.; Li, Y.-S.; Gao, X.-F. Enzyme-Free Fluorescence Determination of Uric Acid and Trace Hg(II) in Serum Using Si/N Doped Carbon Dots. Spectrochimica Acta Part A: Molecular and Biomolecular Spectroscopy 2021, 263, 120182. [Google Scholar] [CrossRef]
- Wu, C.; Zhu, L.; Lu, Q.; Li, H.; Zhang, Y.; Yao, S. A Dual-Signal Colorimetric and Ratiometric Fluorescent Nanoprobe for Enzymatic Determination of Uric Acid by Using Silicon Nanoparticles. Microchim Acta 2019, 186, 754. [Google Scholar] [CrossRef]
- Ji, K.; Xia, S.; Sang, X.; Zeid, A.M.; Hussain, A.; Li, J.; Xu, G. Enhanced Luminol Chemiluminescence with Oxidase-like Properties of FeOOH Nanorods for the Sensitive Detection of Uric Acid. Anal. Chem. 2023, 95, 3267–3273. [Google Scholar] [CrossRef]
- Shi, B.; Su, Y.; Duan, Y.; Chen, S.; Zuo, W. A Nanocomposite Prepared from Copper(II) and Nitrogen-Doped Graphene Quantum Dots with Peroxidase Mimicking Properties for Chemiluminescent Determination of Uric Acid. Microchim Acta 2019, 186, 397. [Google Scholar] [CrossRef]
- He, Y.; Qi, F.; Niu, X.; Zhang, W.; Zhang, X.; Pan, J. Uricase-Free on-Demand Colorimetric Biosensing of Uric Acid Enabled by Integrated CoP Nanosheet Arrays as a Monolithic Peroxidase Mimic. Analytica Chimica Acta 2018, 1021, 113–120. [Google Scholar] [CrossRef]
- Sheldon, R.A.; Pelt, S. van Enzyme Immobilisation in Biocatalysis: Why, What and How. Chem. Soc. Rev. 2013, 42, 6223–6235. [Google Scholar] [CrossRef]
- Vernerová, A.; Krčmová, L.K.; Heneberk, O.; Radochová, V.; Strouhal, O.; Kašparovský, A.; Melichar, B.; Švec, F. Chromatographic Method for the Determination of Inflammatory Biomarkers and Uric Acid in Human Saliva. Talanta 2021, 233, 122598. [Google Scholar] [CrossRef]
- Shahzad, N.; Ajmal, R.; Afzal, A. Non-Enzymatic Electrochemical Sensors for Accurate and Accessible Uric Acid Detection. J. Electrochem. Soc. 2023, 170, 097505. [Google Scholar] [CrossRef]
- Liu, L.; Liu, G.; Mu, X.; Zhao, S.; Tian, J. Simple Enzyme-Free Detection of Uric Acid by an in Situ Fluorescence and Colorimetric Method Based on Co-PBA with High Oxidase Activity. Analyst 2024, 149, 1455–1463. [Google Scholar] [CrossRef]
- Cao, J.; Xie, C.; Zeng, Y.; Wu, Y. Enzyme-Free Colorimetric Assay for the Detection of Uric Acid in Urine by Cobalt Tetroxide. Microchemical Journal 2024, 204, 111079. [Google Scholar] [CrossRef]
- Peng, Z.; Tang, X.; Xu, P.; Qiu, P. Calcium Fluoride/Manganese Dioxide Nanocomposite with Dual Enzyme-like Activities for Uric Acid Sensing: A Comparative Study of Enzyme and Nonenzyme Methods. ACS Appl. Mater. Interfaces 2024, 16, 54–65. [Google Scholar] [CrossRef]
- Qin, X.; Yuan, C.; Geng, G.; Shi, R.; Cheng, S.; Wang, Y. Enzyme-Free Colorimetric Determination of Uric Acid Based on Inhibition of Gold Nanorods Etching. Sensors and Actuators B: Chemical 2021, 333, 129638. [Google Scholar] [CrossRef]
- Amjadi, M.; Hallaj, T.; Nasirloo, E. In Situ Formation of Ag/Au Nanorods as a Platform to Design a Non-Aggregation Colorimetric Assay for Uric Acid Detection in Biological Fluids. Microchemical Journal 2020, 154, 104642. [Google Scholar] [CrossRef]
- Huang, L.; Qin, S.; Xu, Y.; Cheng, S.; Yang, J.; Wang, Y. Enzyme-Free Colorimetric Detection of Uric Acid on the Basis of MnO2 Nanosheets - Mediated Oxidation of 3, 3′, 5, 5′- Tetramethylbenzidine. Microchemical Journal 2023, 190, 108719. [Google Scholar] [CrossRef]
- Lian, T.; Chen, J.; Tang, X.; Qiu, P.; Hu, Y. Bifunctional Fe-MOF@Fe3O4NPs for Colorimetric and Ratiometric Fluorescence Detection of Uric Acid in Human Urine. Microchemical Journal 2024, 196, 109538. [Google Scholar] [CrossRef]
- Zhang, X.; He, Z.; Wang, S.; Zhang, S.; Song, D. A Pure Near-Infrared Platform with Dual-Readout Capability Employing Upconversion Fluorescence and Colorimetry for Biosensing of Uric Acid. Talanta 2025, 291, 127900. [Google Scholar] [CrossRef]
- Wang, X.; Ruditskiy, A.; Xia, Y. Rational Design and Synthesis of Noble-Metal Nanoframes for Catalytic and Photonic Applications.
- Wang, Y.-L.; Lee, Y.-H.; Chou, C.-L.; Chang, Y.-S.; Liu, W.-C.; Chiu, H.-W. Oxidative Stress and Potential Effects of Metal Nanoparticles: A Review of Biocompatibility and Toxicity Concerns. Environmental Pollution 2024, 346, 123617. [Google Scholar] [CrossRef]
- Li, B.; Ma, J.; Zhou, L.; Qiu, Y. Magnetic Microsphere to Remove Tetracycline from Water: Adsorption, H2O2 Oxidation and Regeneration. Chemical Engineering Journal 2017, 330, 191–201. [Google Scholar] [CrossRef]
- Li, X.; Jia, Y.; Zhou, M.; Su, X.; Sun, J. High-Efficiency Degradation of Organic Pollutants with Fe, N Co-Doped Biochar Catalysts via Persulfate Activation. Journal of Hazardous Materials 2020, 397, 122764. [Google Scholar] [CrossRef] [PubMed]
- Hung, C.-M.; Chen, C.-W.; Huang, C.-P.; Dong, C.-D. N-Doped Metal-Free Biochar Activation of Peroxymonosulfate for Enhancing the Degradation of Antibiotics Sulfadiazine from Aquaculture Water and Its Associated Bacterial Community Composition. Journal of Environmental Chemical Engineering 2022, 10, 107172. [Google Scholar] [CrossRef]
- Ma, C.; Wang, J.; Wang, F.; Zhu, Y.; Li, Y.; Fan, X.; Zhang, F.; Zhang, G.; Peng, W. Facile Synthesis of Iron Oxide Supported on Porous Nitrogen Doped Carbon for Catalytic Oxidation. Science of The Total Environment 2021, 785, 147296. [Google Scholar] [CrossRef]
- Xi, M.; Cui, K.; Cui, M.; Ding, Y.; Guo, Z.; Chen, Y.; Li, C.; Li, X. Enhanced Norfloxacin Degradation by Iron and Nitrogen Co-Doped Biochar: Revealing the Radical and Nonradical Co-Dominant Mechanism of Persulfate Activation. Chemical Engineering Journal 2021, 420, 129902. [Google Scholar] [CrossRef]
- Cao, J.; Dong, X.; Xie, C.; Xiao, C.; Wu, Y.; Shoulian, W. Preparation of Nitrogen-Doped Magnetic Carbon Microspheres and Their Adsorption and Degradation Properties of Tetracycline Hydrochloride. Chemical Engineering Science 2024, 300, 120564. [Google Scholar] [CrossRef]
- Hu, Y.; Gao, X.J.; Zhu, Y.; Muhammad, F.; Tan, S.; Cao, W.; Lin, S.; Jin, Z.; Gao, X.; Wei, H. Nitrogen-Doped Carbon Nanomaterials as Highly Active and Specific Peroxidase Mimics. Chem. Mater. 2018, 30, 6431–6439. [Google Scholar] [CrossRef]
- Lin, S.; Zhang, Y.; Cao, W.; Wang, X.; Qin, L.; Zhou, M.; Wei, H. Nucleobase-Mediated Synthesis of Nitrogen-Doped Carbon Nanozymes as Efficient Peroxidase Mimics. Dalton Trans. 2019, 48, 1993–1999. [Google Scholar] [CrossRef]
- Fan, K.; Xi, J.; Fan, L.; Wang, P.; Zhu, C.; Tang, Y.; Xu, X.; Liang, M.; Jiang, B.; Yan, X.; et al. In Vivo Guiding Nitrogen-Doped Carbon Nanozyme for Tumor Catalytic Therapy. Nat Commun 2018, 9, 1440. [Google Scholar] [CrossRef]
- Liu, Z.; Ge, M.; Wang, S. Nitrogen-Doped Porous Carbon Nanomaterials Synthesized Using a Magadiite Template as Efficient Peroxidase Mimics for Colorimetric Detection of Ascorbic Acid as an Antioxidant. ANAL. SCI. 2023, 39, 1727–1739. [Google Scholar] [CrossRef]
- Zhang, H.; Qiu, J.; Pang, J.; Cao, G.; Zhang, B.; Wang, L.; He, X.; Feng, X.; Ma, S.; Zhang, X.; et al. Sub-Millisecond Lithiothermal Synthesis of Graphitic Meso–Microporous Carbon. Nat Commun 2024, 15, 3491. [Google Scholar] [CrossRef]
- Mei, Y.; Xu, J.; Zhang, Y.; Li, B.; Fan, S.; Xu, H. Effect of Fe–N Modification on the Properties of Biochars and Their Adsorption Behavior on Tetracycline Removal from Aqueous Solution. Bioresource Technology 2021, 325, 124732. [Google Scholar] [CrossRef] [PubMed]
- Sheng, Z.-H.; Shao, L.; Chen, J.-J.; Bao, W.-J.; Wang, F.-B.; Xia, X.-H. Catalyst-Free Synthesis of Nitrogen-Doped Graphene via Thermal Annealing Graphite Oxide with Melamine and Its Excellent Electrocatalysis. ACS Nano 2011, 5, 4350–4358. [Google Scholar] [CrossRef]
- Gong, K.; Du, F.; Xia, Z.; Durstock, M.; Dai, L. Nitrogen-Doped Carbon Nanotube Arrays with High Electrocatalytic Activity for Oxygen Reduction. Science 2009, 323, 760–764. [Google Scholar] [CrossRef] [PubMed]
- Peng, Z.; Xiong, Y.; Liao, Z.; Zeng, M.; Zhong, J.; Tang, X.; Qiu, P. Rapid Colorimetric Detection of H2O2 in Living Cells and Its Upstream Series of Molecules Based on Oxidase-like Activity of CoMnO3 Nanofibers. Sensors and Actuators B: Chemical 2023, 382, 133540. [Google Scholar] [CrossRef]
- Xiao, Y.; Huang, N.; Wen, J.; Yang, D.; Chen, H.; Long, Y.; Zheng, H. Detecting Uric Acid Base on the Dual Inner Filter Effect Using BSA@Au Nanoclusters as Both Peroxidase Mimics and Fluorescent Reporters. Spectrochimica Acta Part A: Molecular and Biomolecular Spectroscopy 2023, 293, 122504. [Google Scholar] [CrossRef]
- Vasiliou, F.; Plessas, A.K.; Economou, A.; Thomaidis, N.; Papaefstathiou, G.S.; Kokkinos, C. Graphite Paste Sensor Modified with a Cu(II)-Complex for the Enzyme-Free Simultaneous Voltammetric Determination of Glucose and Uric Acid in Sweat. Journal of Electroanalytical Chemistry 2022, 917, 116393. [Google Scholar] [CrossRef]
- Ipekci, H.H. Holey MoS2-Based Electrochemical Sensors for Simultaneous Dopamine and Uric Acid Detection. Anal. Methods 2023, 15, 2989–2996. [Google Scholar] [CrossRef]
- Zhang, C.; Li, T.; Zhang, J.; Yan, S.; Qin, C. Degradation of P-Nitrophenol Using a Ferrous-Tripolyphosphate Complex in the Presence of Oxygen: The Key Role of Superoxide Radicals. Applied Catalysis B: Environmental 2019, 259, 118030. [Google Scholar] [CrossRef]
Figure 1.
Preparation of NC and principle of NC-TMB enzyme-free colorimetric detection of UA.
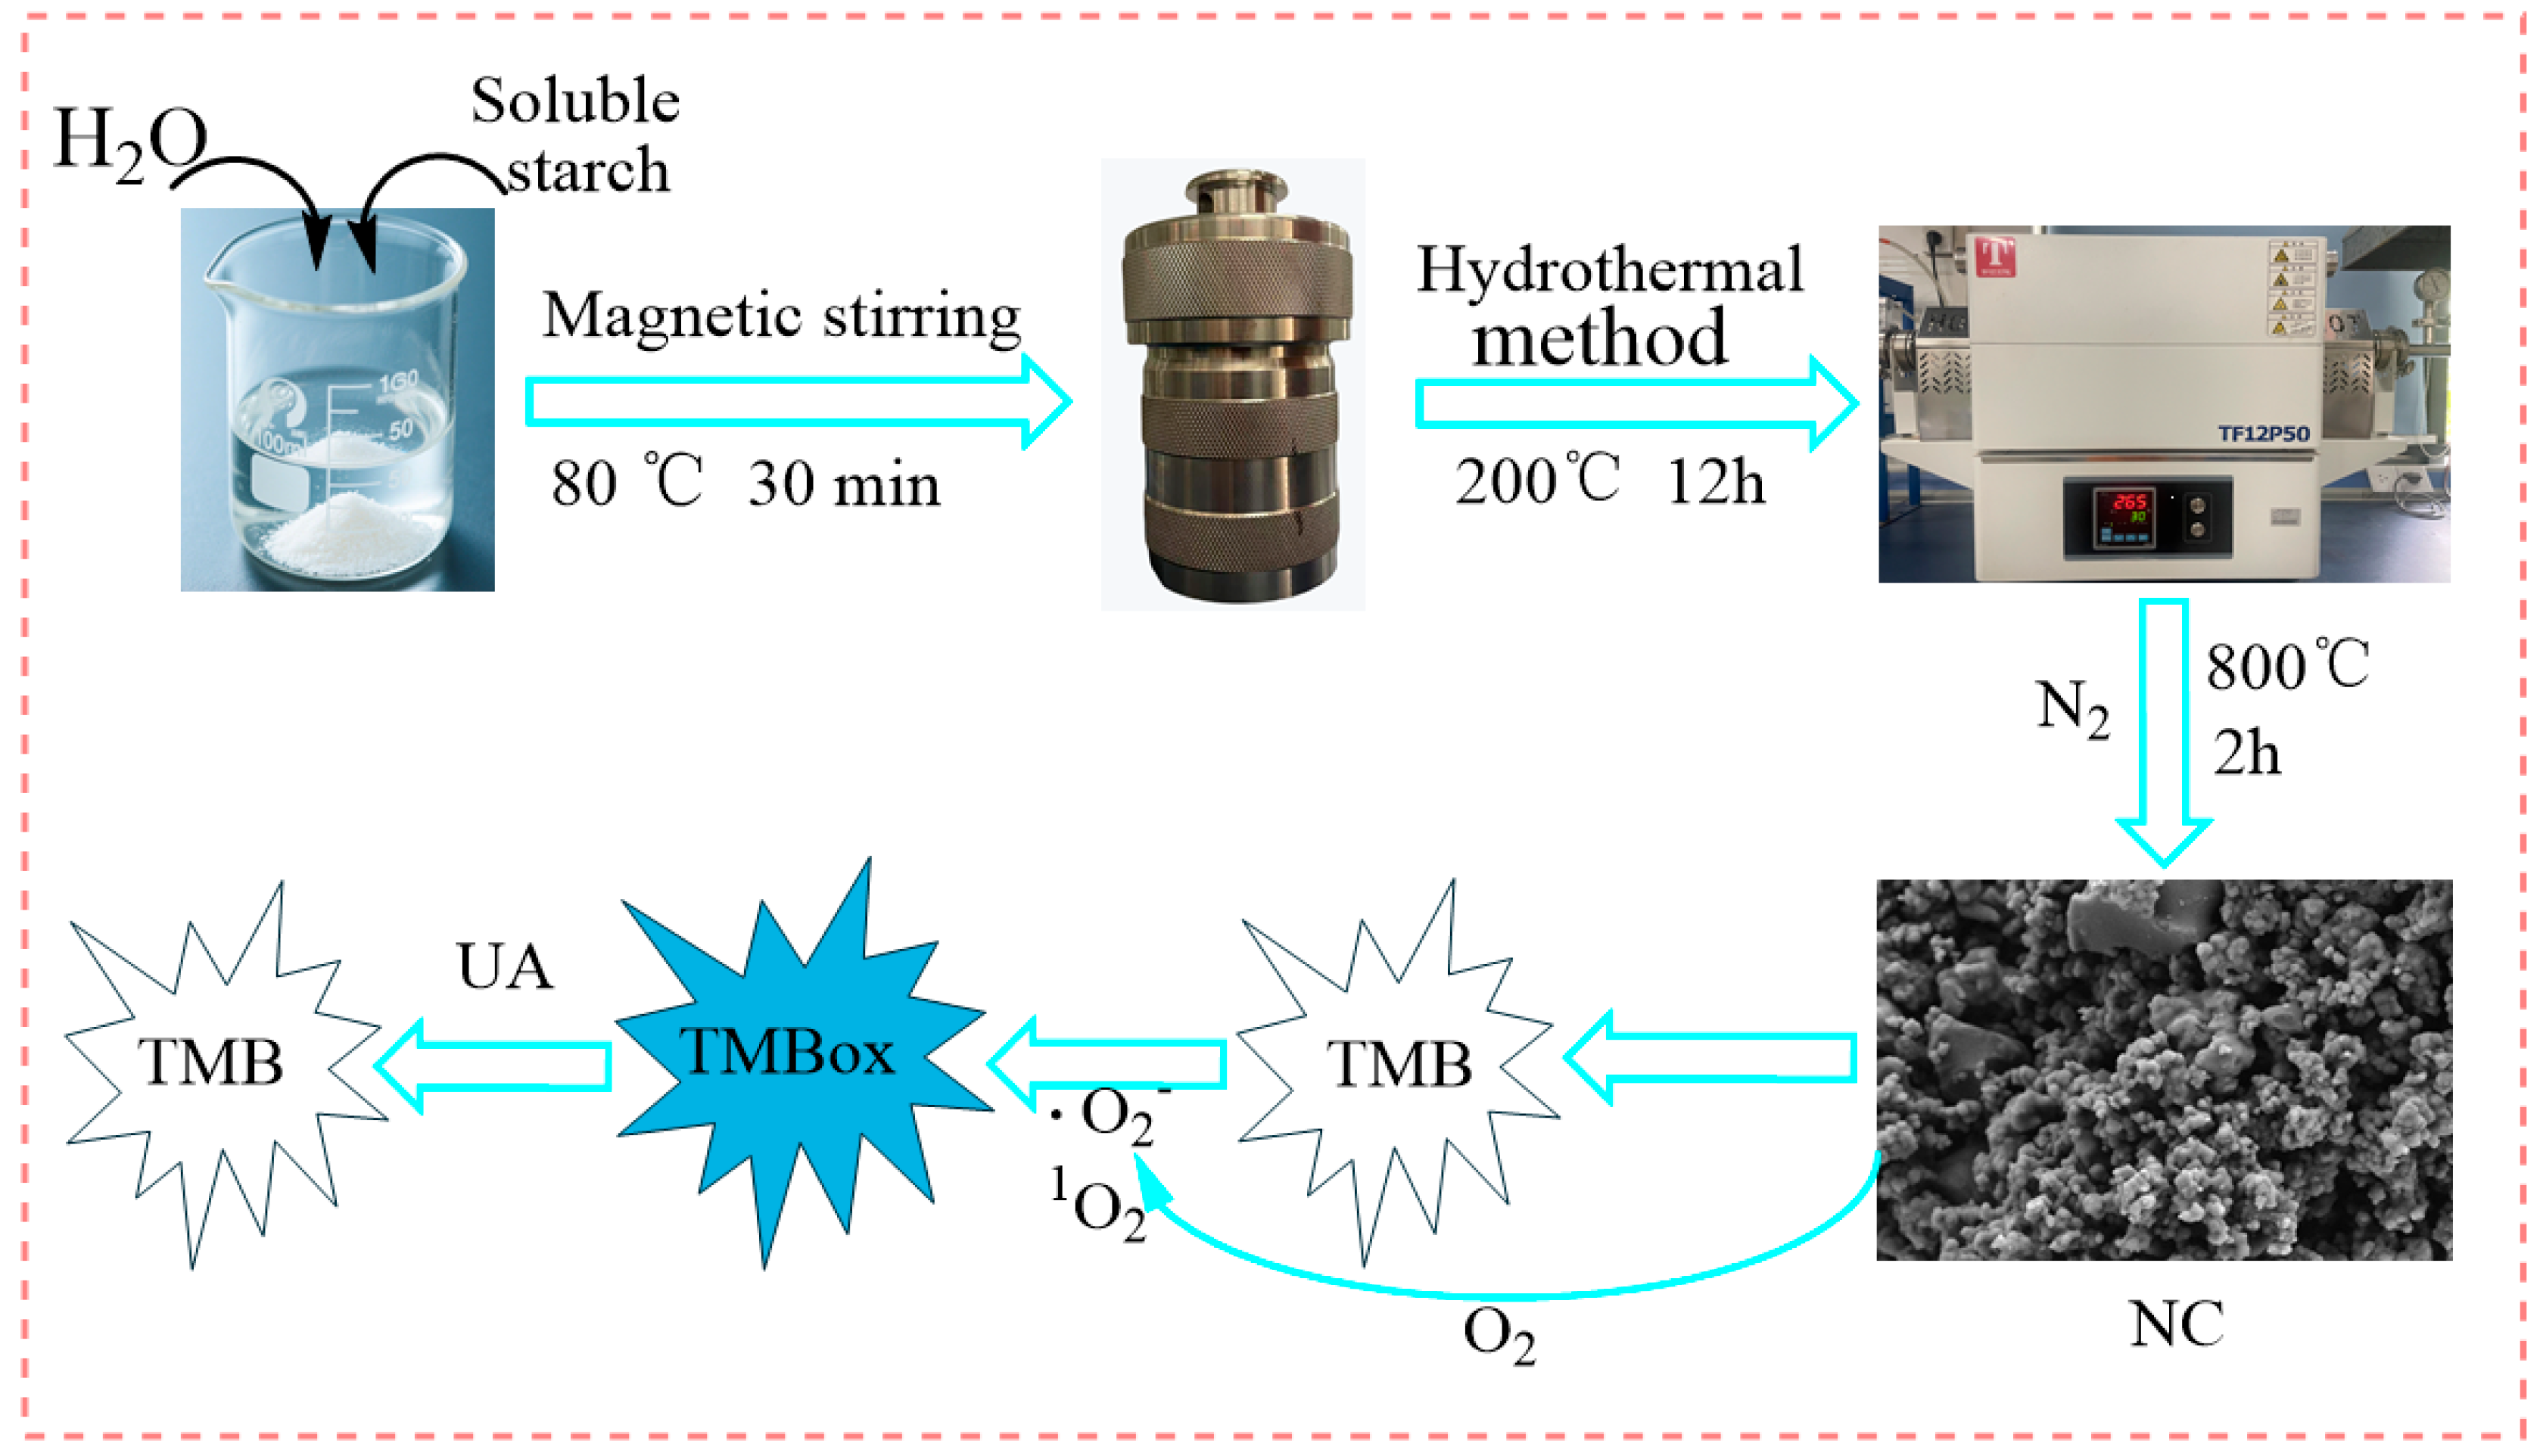
Figure 2.
(A) XRD spectra of NC; (B) SEM image of NC; (C) adsorption isotherm and (D) pore size distribution of NC.
Figure 2.
(A) XRD spectra of NC; (B) SEM image of NC; (C) adsorption isotherm and (D) pore size distribution of NC.
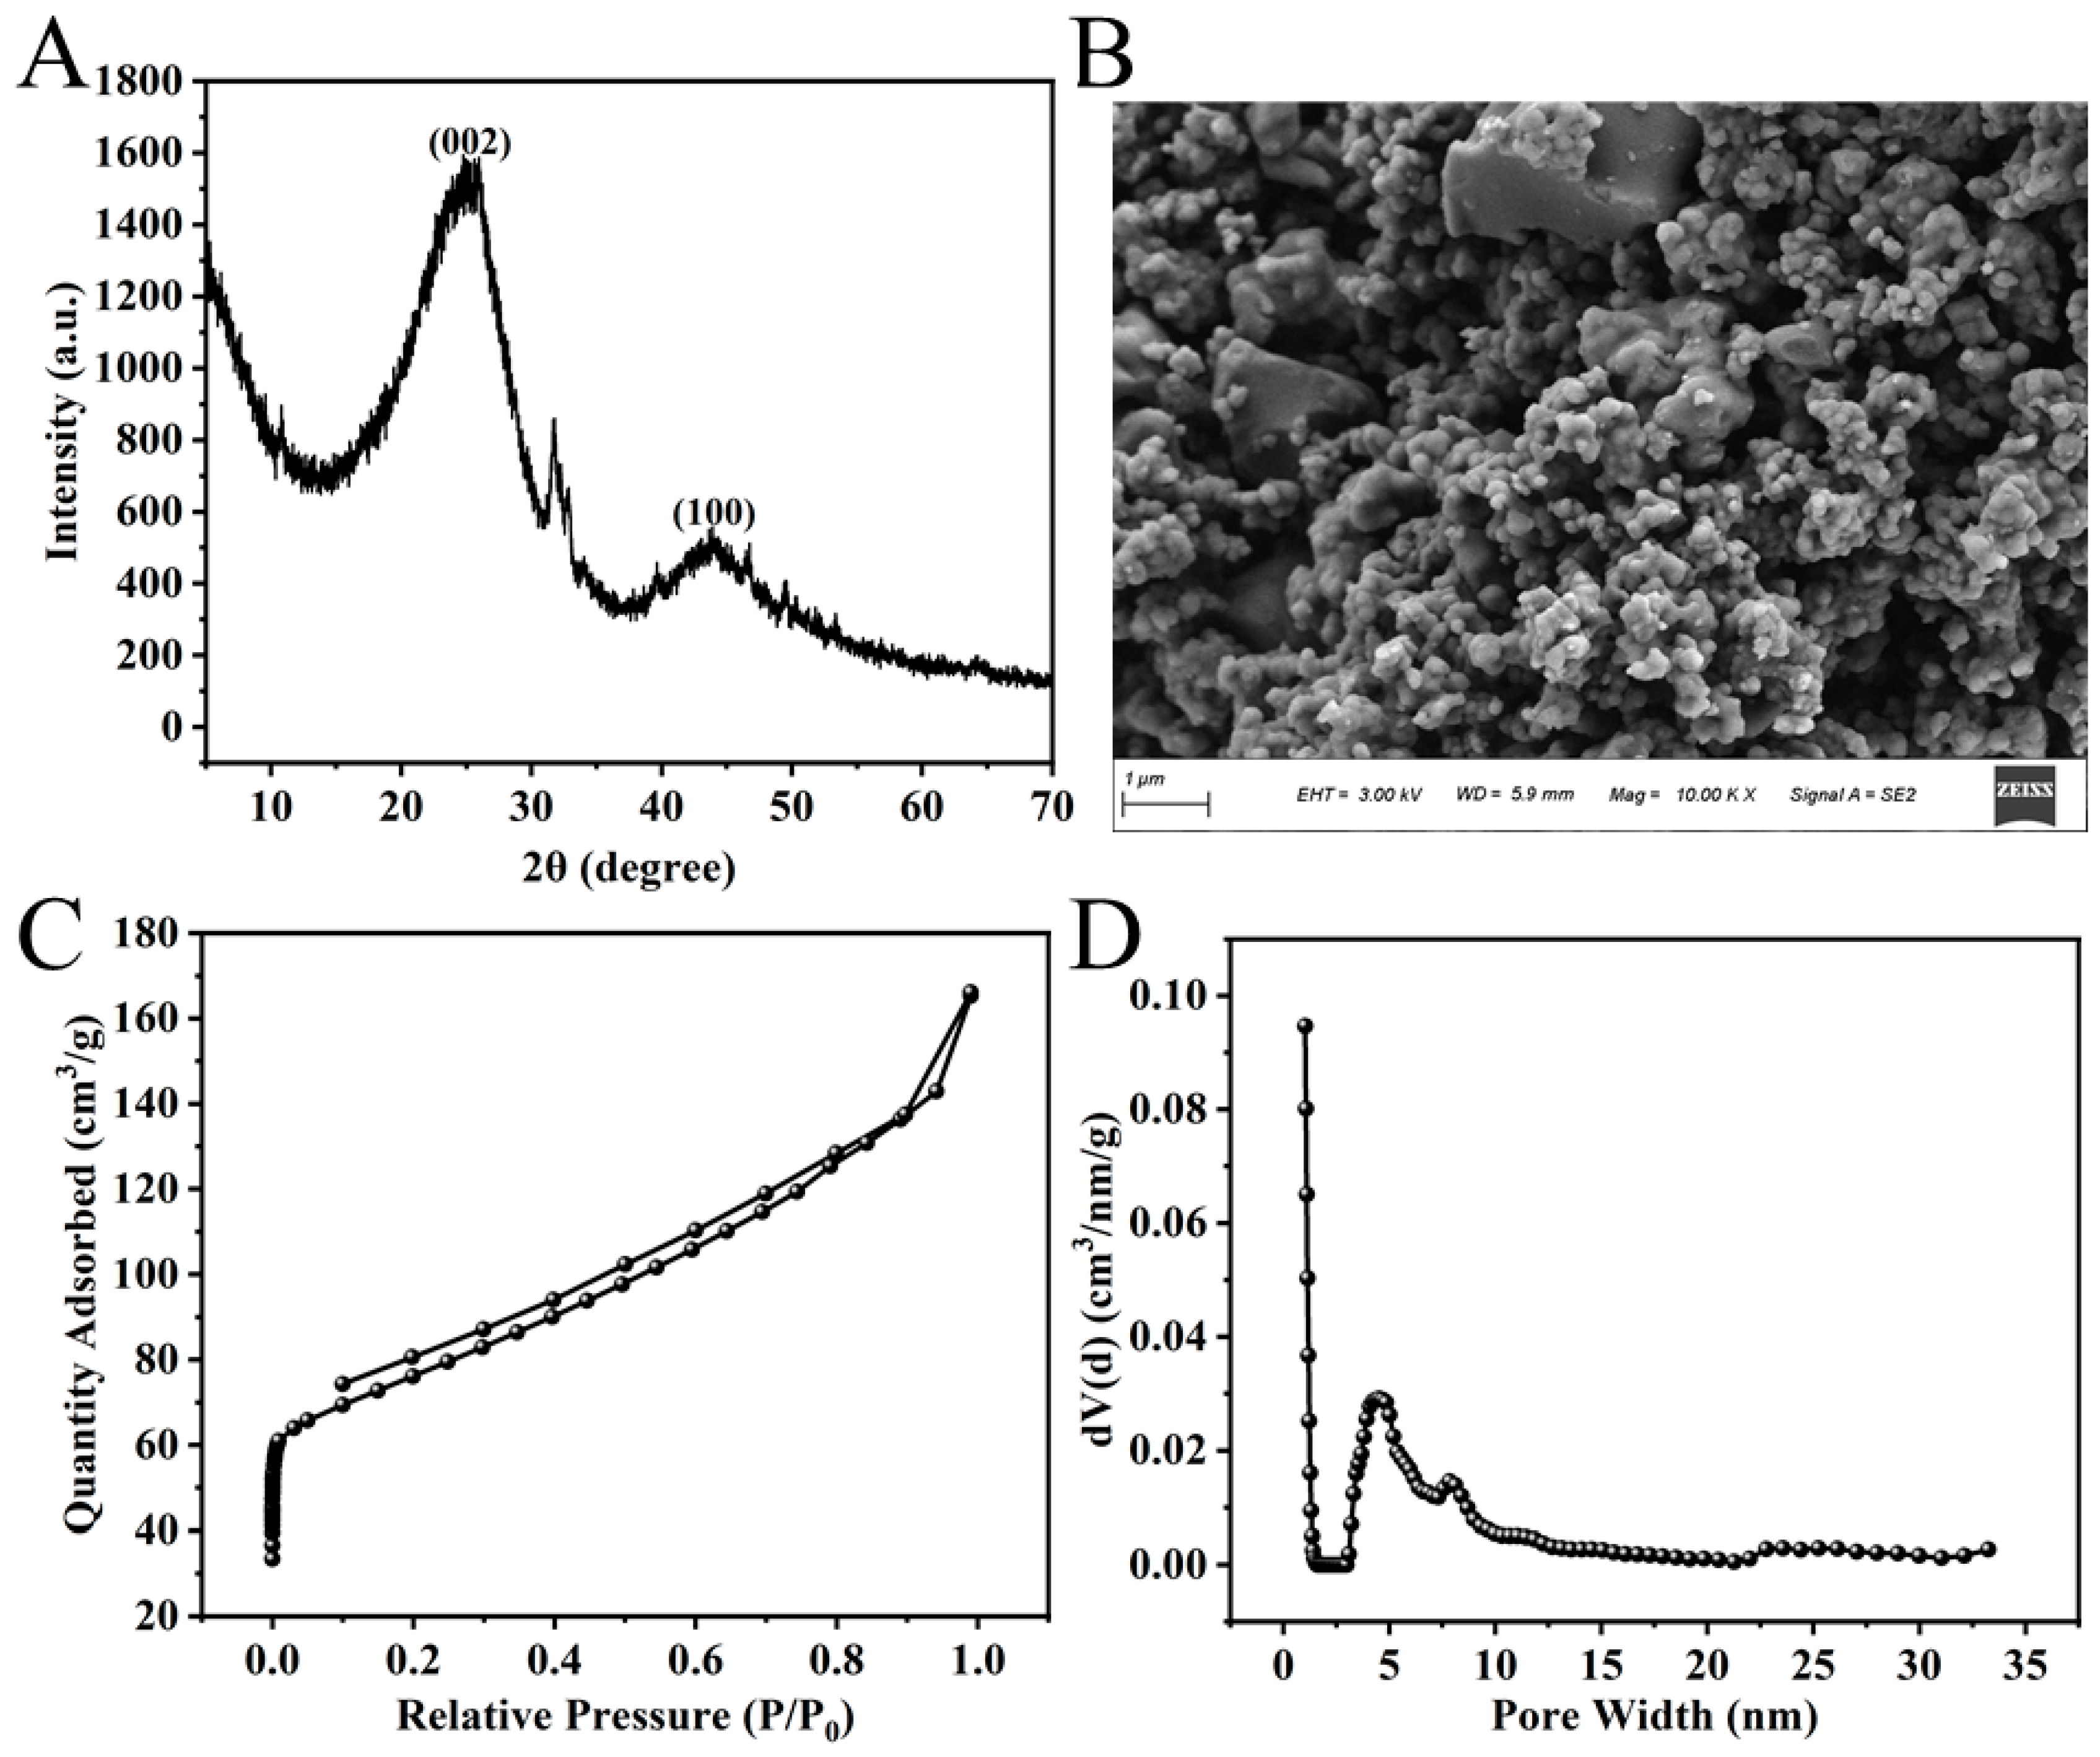
Figure 3.
(A) XPS spectra of NC; (B) C 1 s spectra of NC; (C) N 1 s spectra of NC; (D) O 1 s spectra of NC.
Figure 3.
(A) XPS spectra of NC; (B) C 1 s spectra of NC; (C) N 1 s spectra of NC; (D) O 1 s spectra of NC.
Figure 4.
UV-Vis spectra of (a) H2O2, (b) H2O2 + TMB, (c) TMB + NC, (d) H2O2 + TMB + NC, (e) TMB + NC+ UA. Inset: the photos of corresponding solutions in sunlight. Experimental conditions: 2.5 mL 0.2 M NaAc-HAc buffer (pH = 4.0), 200 μL 200 μmol·L-1 H2O2, 60 μL 8 mmol·L-1 TMB, 8 mg NC, 200 μL 1 mmol·L-1 UA).
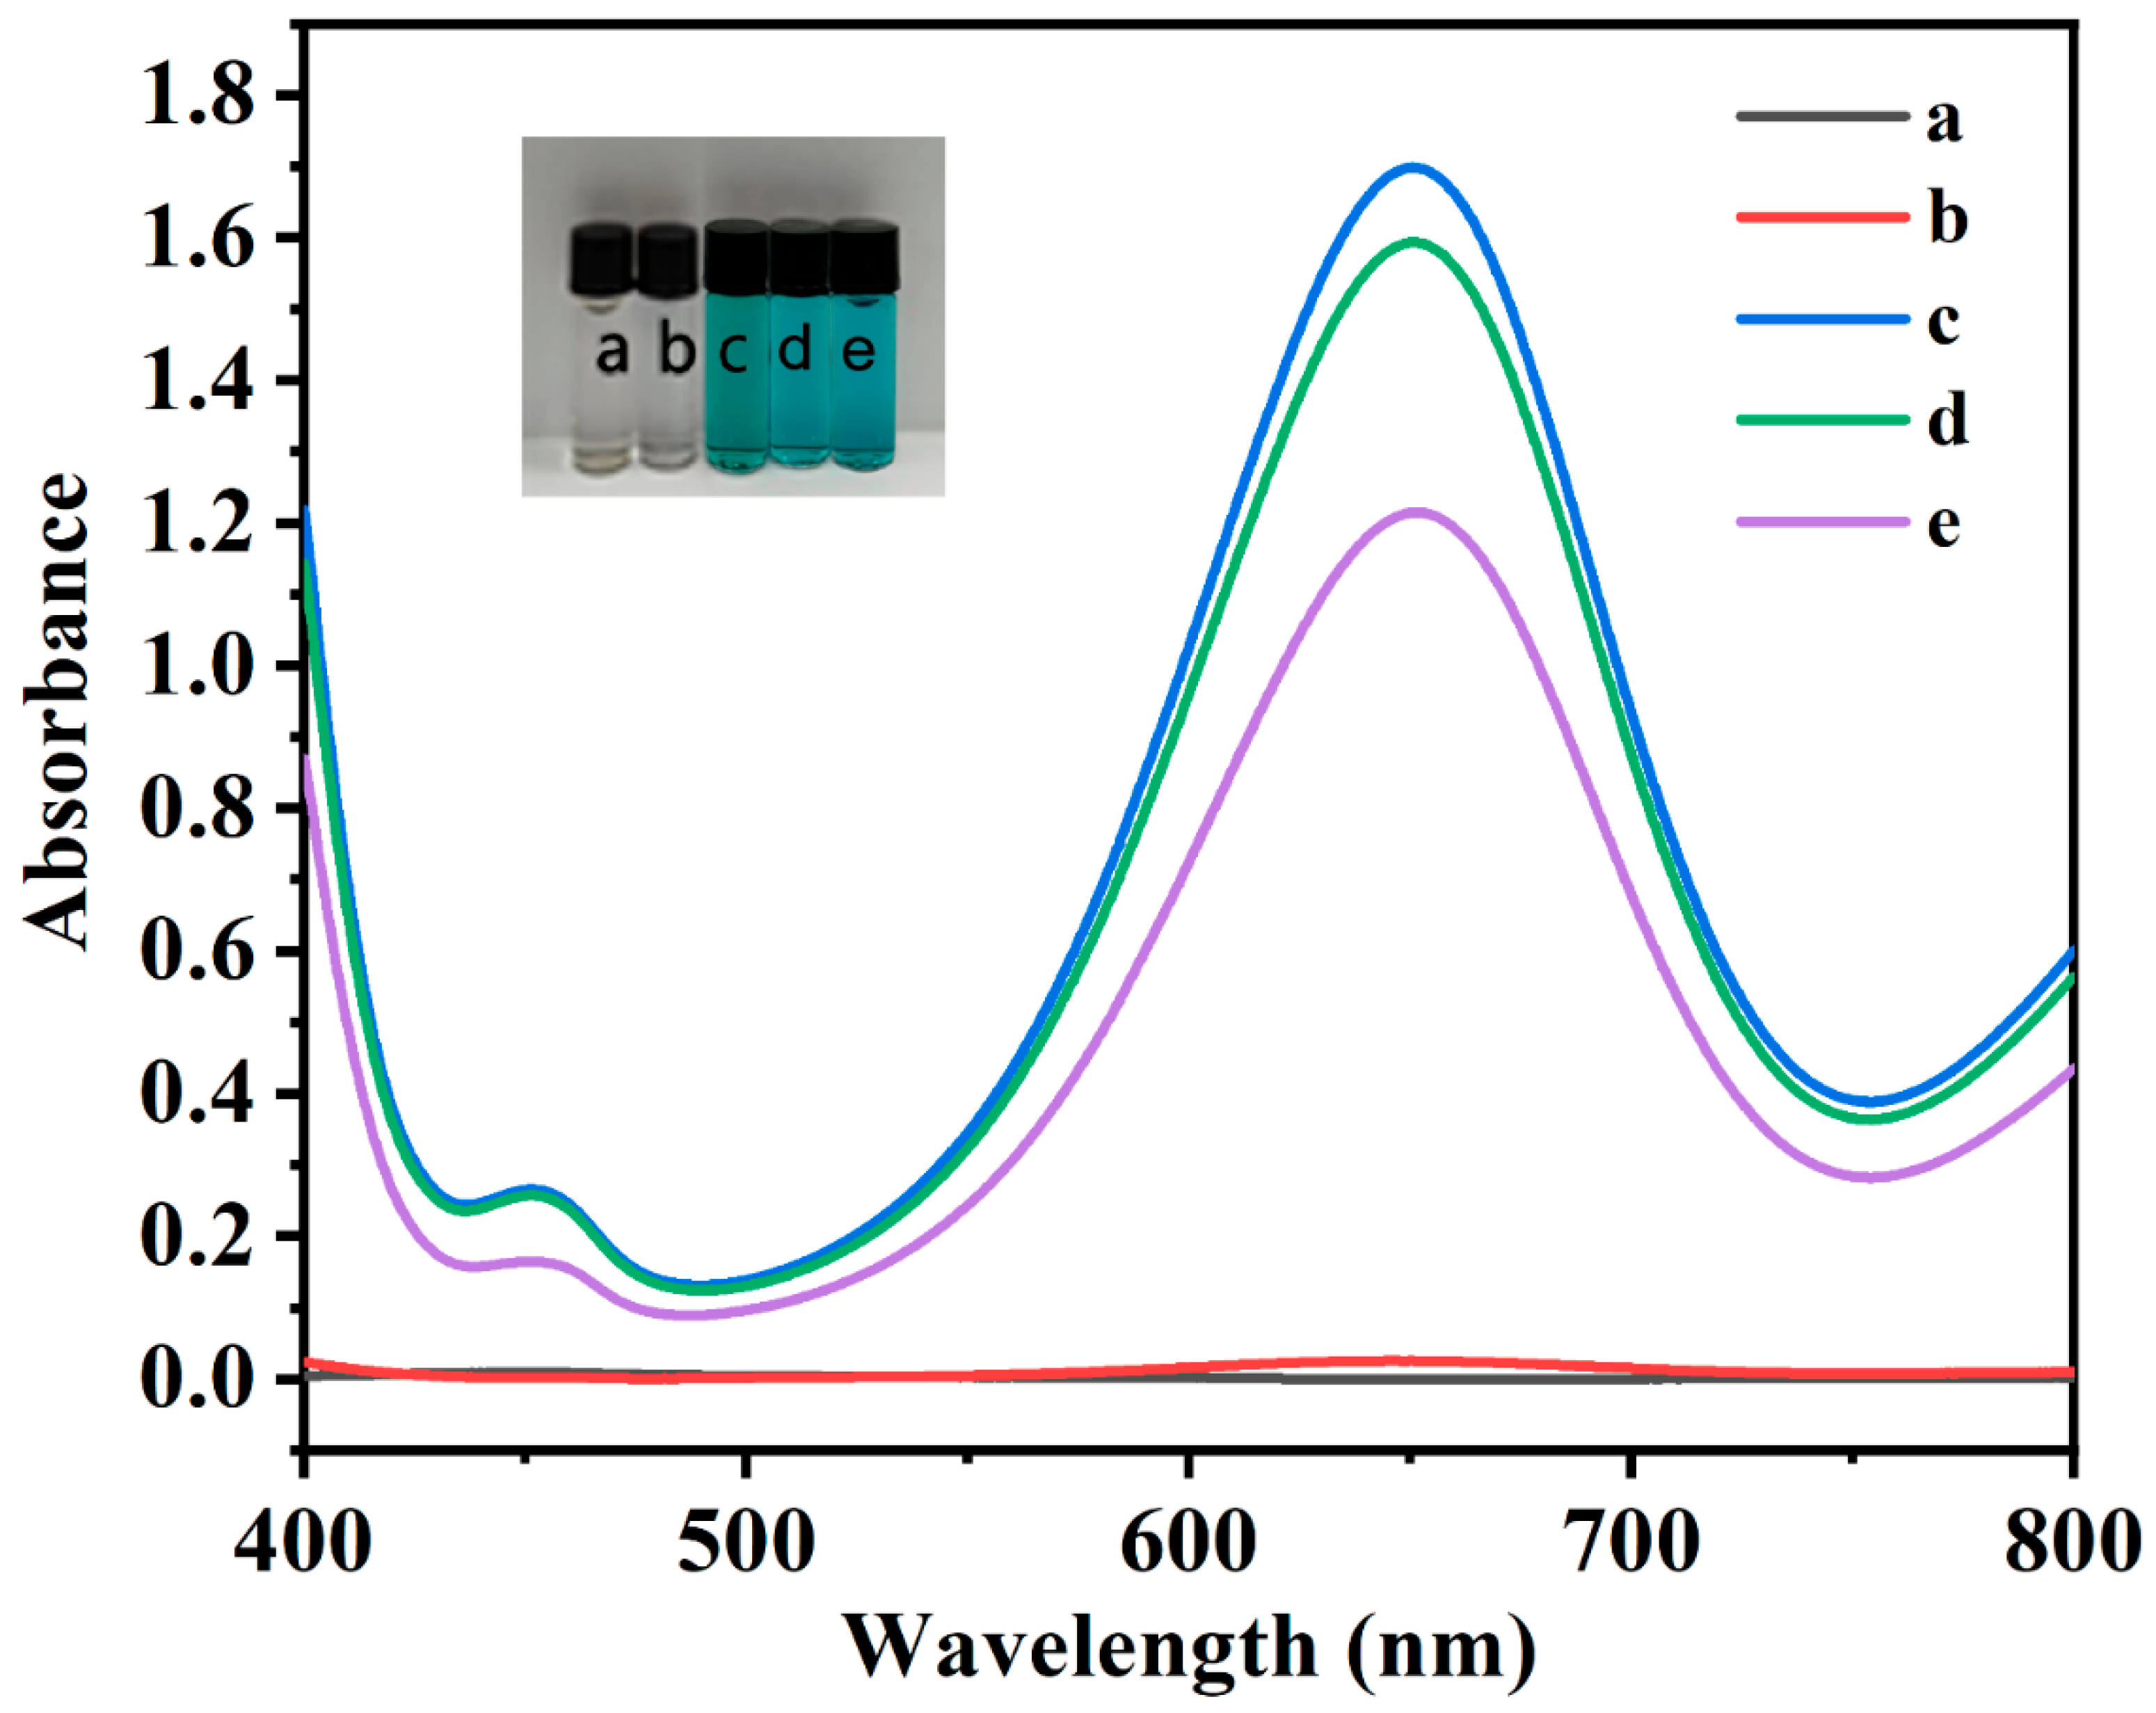
Figure 5.
The color development effect of (A) reaction temperature (2.5 mL 0.2 M NaAc-HAc buffer (pH = 5.0), 4 mg NC, 40 μL 8 mmol·L-1 TMB, 5 min), (B) reaction environment pH (4 mg NC, 40 μL 8 mmol·L-1 TMB, 35 ℃, 5 min, 2.5 mL 0.2 M NaAc-HAc buffer (pH = 3.8, 4.0, 4.6, 5.0, 5.4), (C) NC dosage (2.5 mL 0.2 M NaAc-HAc buffer (pH = 4.6), 40 μL 8 mmol·L-1 TMB, 35 ℃, 5 min), (D) TMB dosage (2.5 mL 0.2 M NaAc-HAc buffer (pH = 4.6), 4 mg NC, 35 ℃, 5 min) and (E) reaction time (2.5 mL 0.2 M NaAc-HAc buffer (pH = 4.6), 4 mg NC, 35 μL 8 mmol·L-1 TMB, 35 ℃), (F) NC-TMB color development stability (2.5 mL 0.2 M NaAc-HAc buffer (pH = 4.6), 4 mg NC, 35 μL 8 mmol·L-1 TMB, 35 ℃, 5 min). Inset: the photos of corresponding solutions in sunlight.
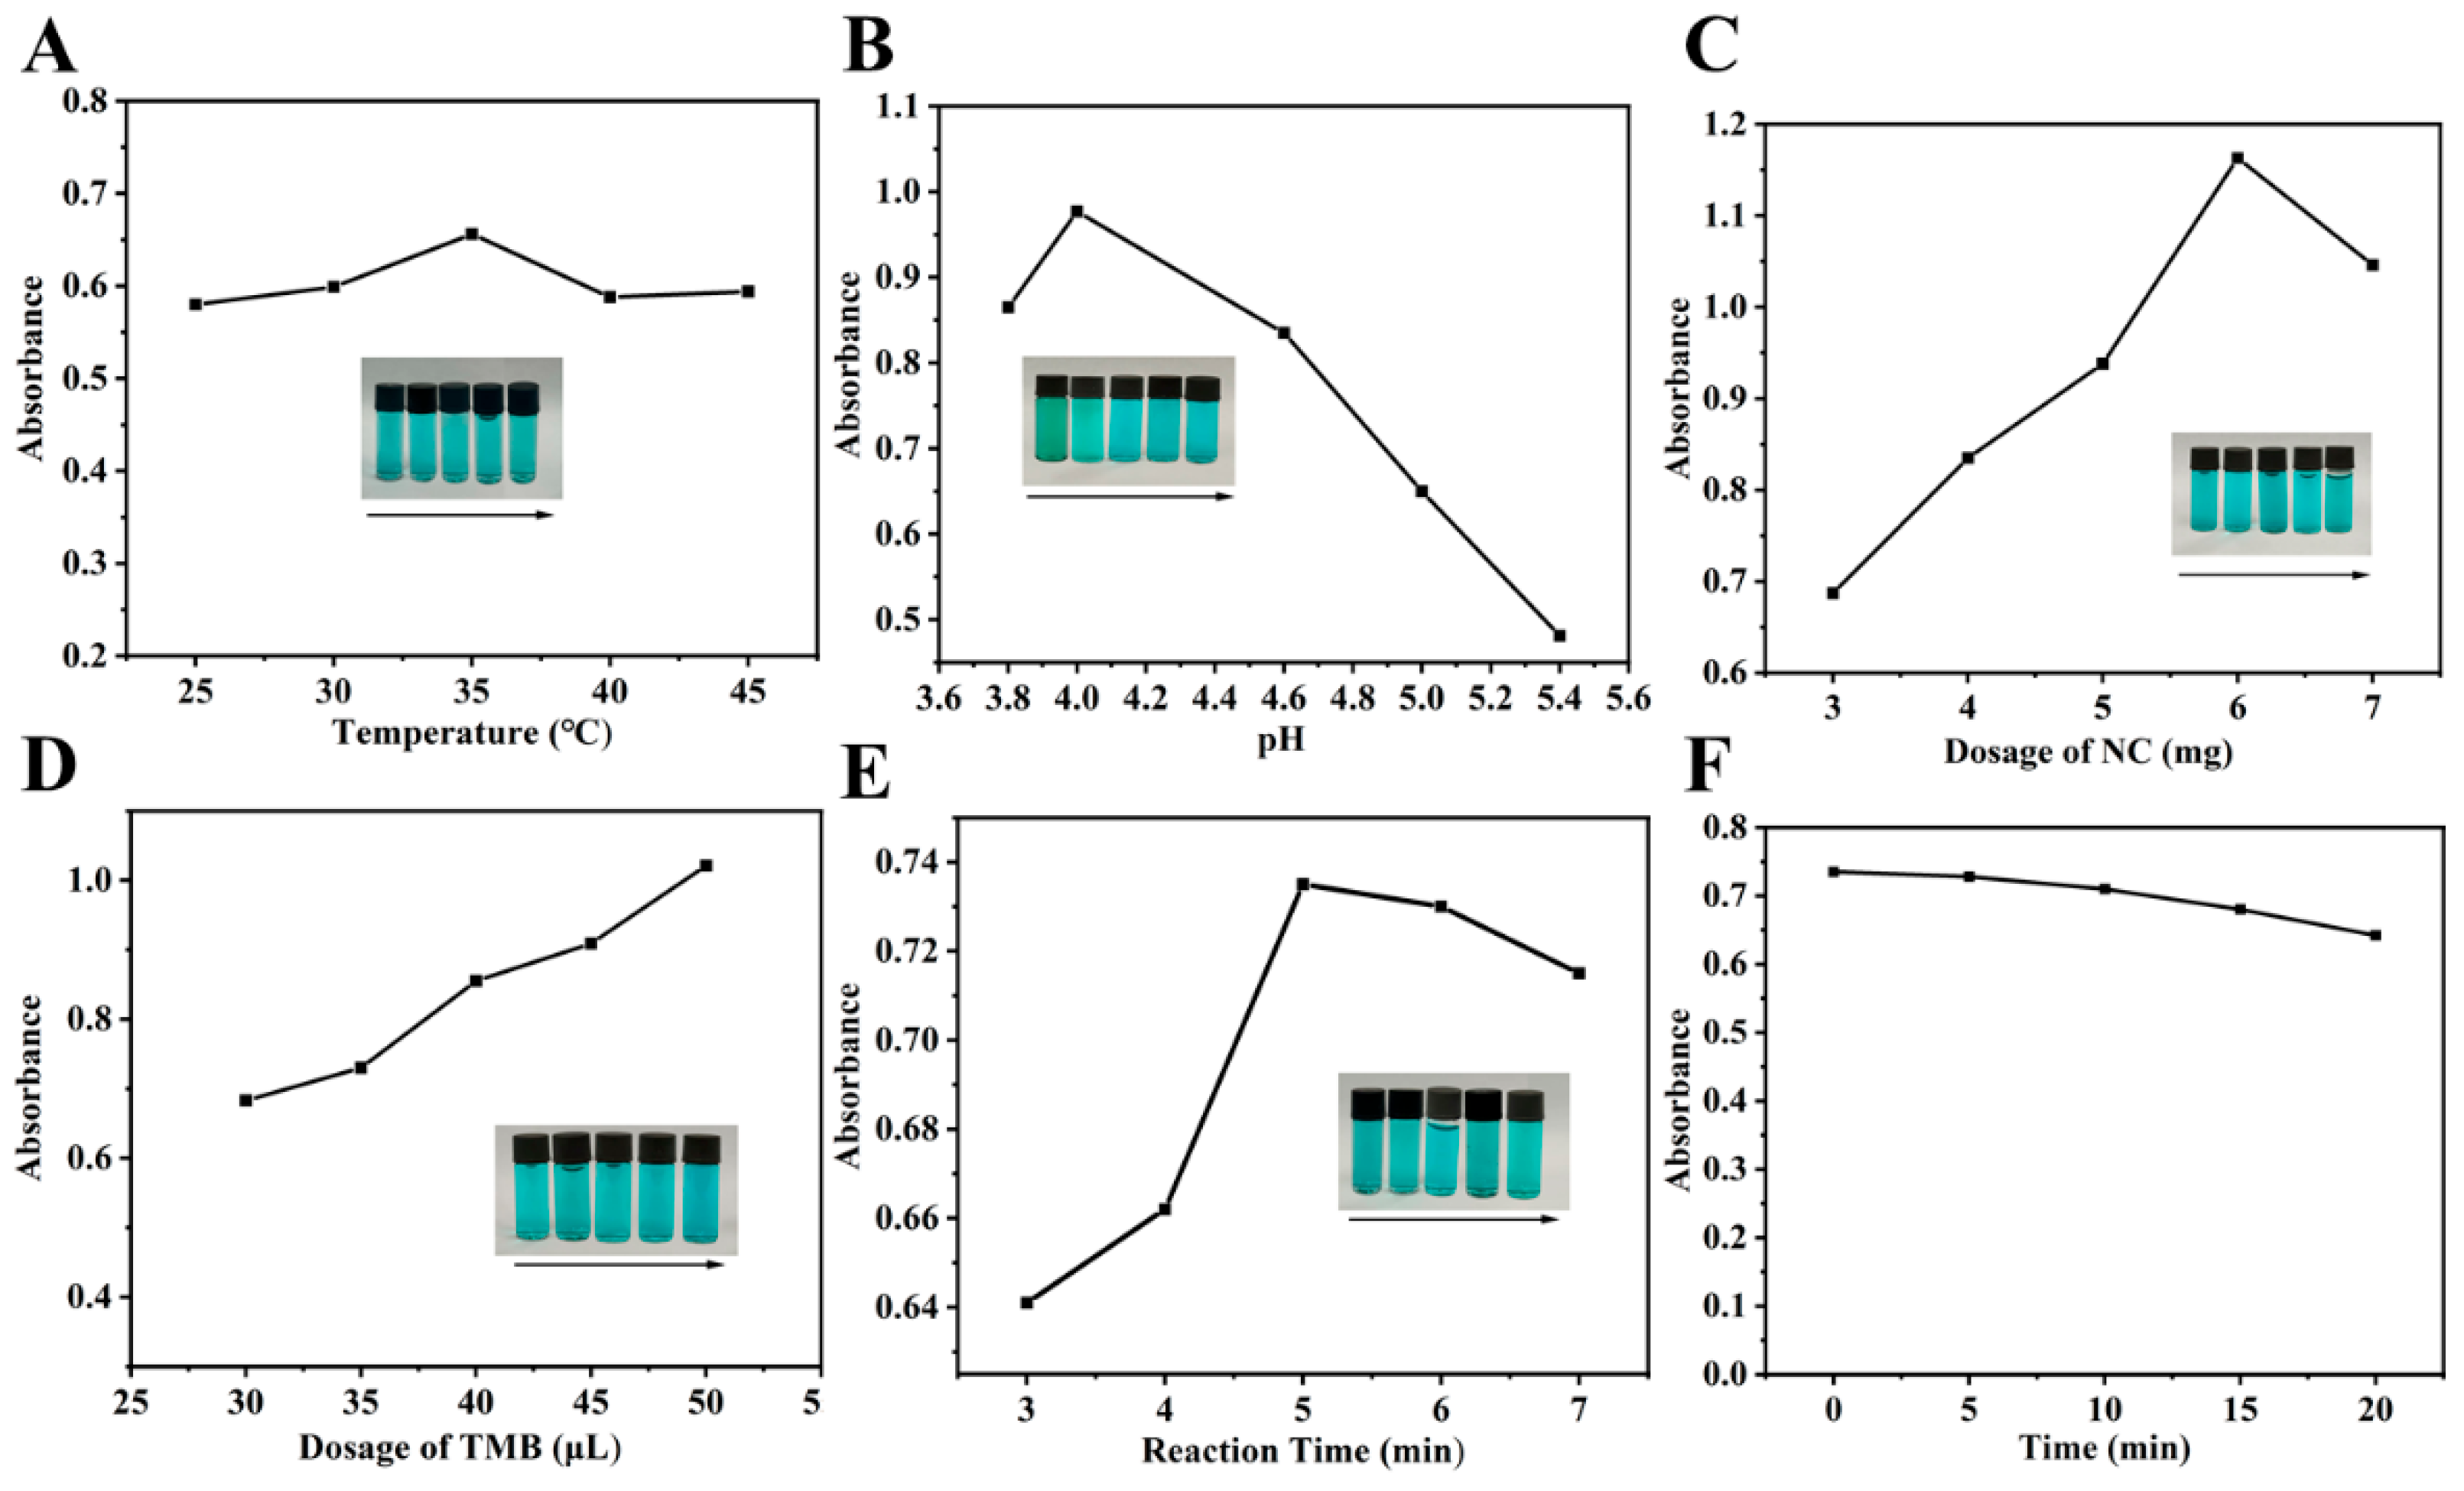
Figure 6.
The influence of the UA reduction duration on ΔA. Experimental conditions: 2.5 mL 0.2 M NaAc-HAc buffer (pH = 4.6), 35 μL 8 mmol·L-1 TMB, 4 mg NC, 35 ℃, 5 min, 200 μL 400 μmol·L-1UA.
Figure 6.
The influence of the UA reduction duration on ΔA. Experimental conditions: 2.5 mL 0.2 M NaAc-HAc buffer (pH = 4.6), 35 μL 8 mmol·L-1 TMB, 4 mg NC, 35 ℃, 5 min, 200 μL 400 μmol·L-1UA.
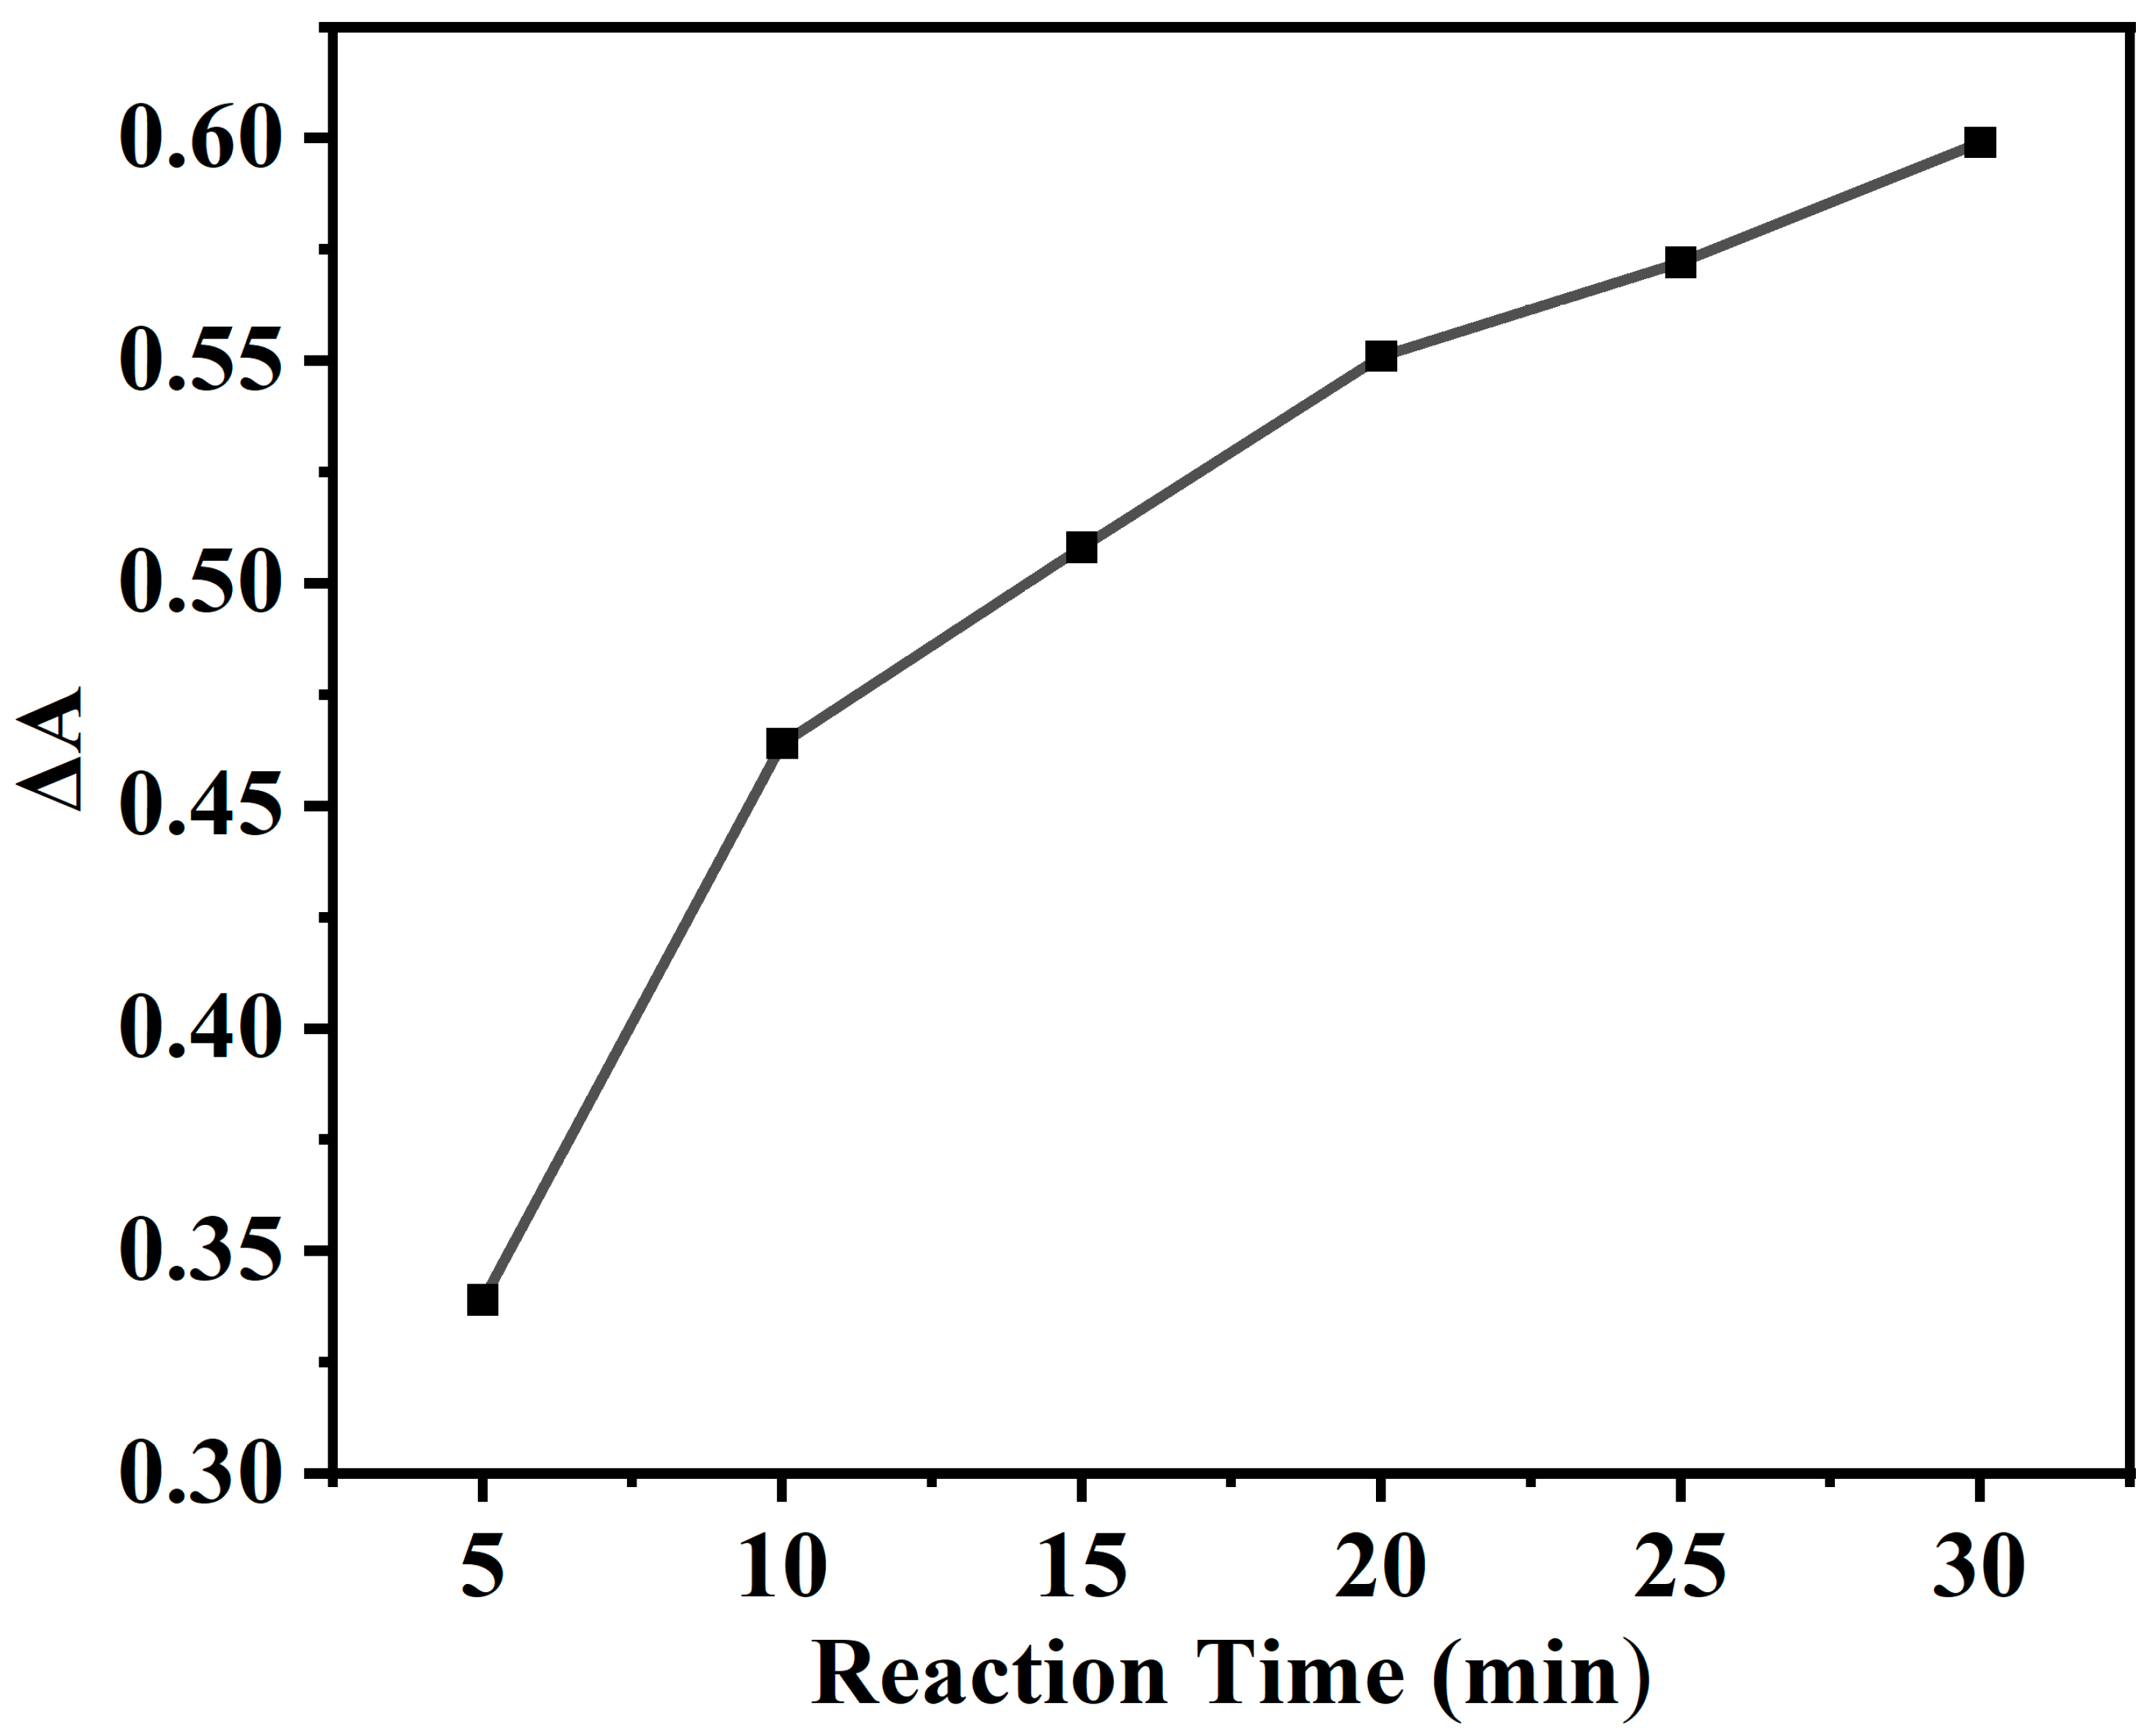
Figure 7.
Effect of different batches (A) and storage periods (B) on the stability of NC. Experimental conditions: 2.5 mL 0.2 M NaAc-HAc buffer (pH = 4.6), 35 μL 8 mmol·L-1 TMB, 4 mg NC, 35 ℃, 5 min. (C) UV–Vis spectra of TMBox solutions reduced with different concentrations of UA; (D) linear relationships of UA. Experimental conditions: 2.5 mL 0.2 M NaAc-HAc buffer (pH = 4.6), 35 μL 8 mmol·L-1 TMB, 4 mg NC, 35 ℃, 5 min, UA 10-500 μmol·L-1, 20 min.
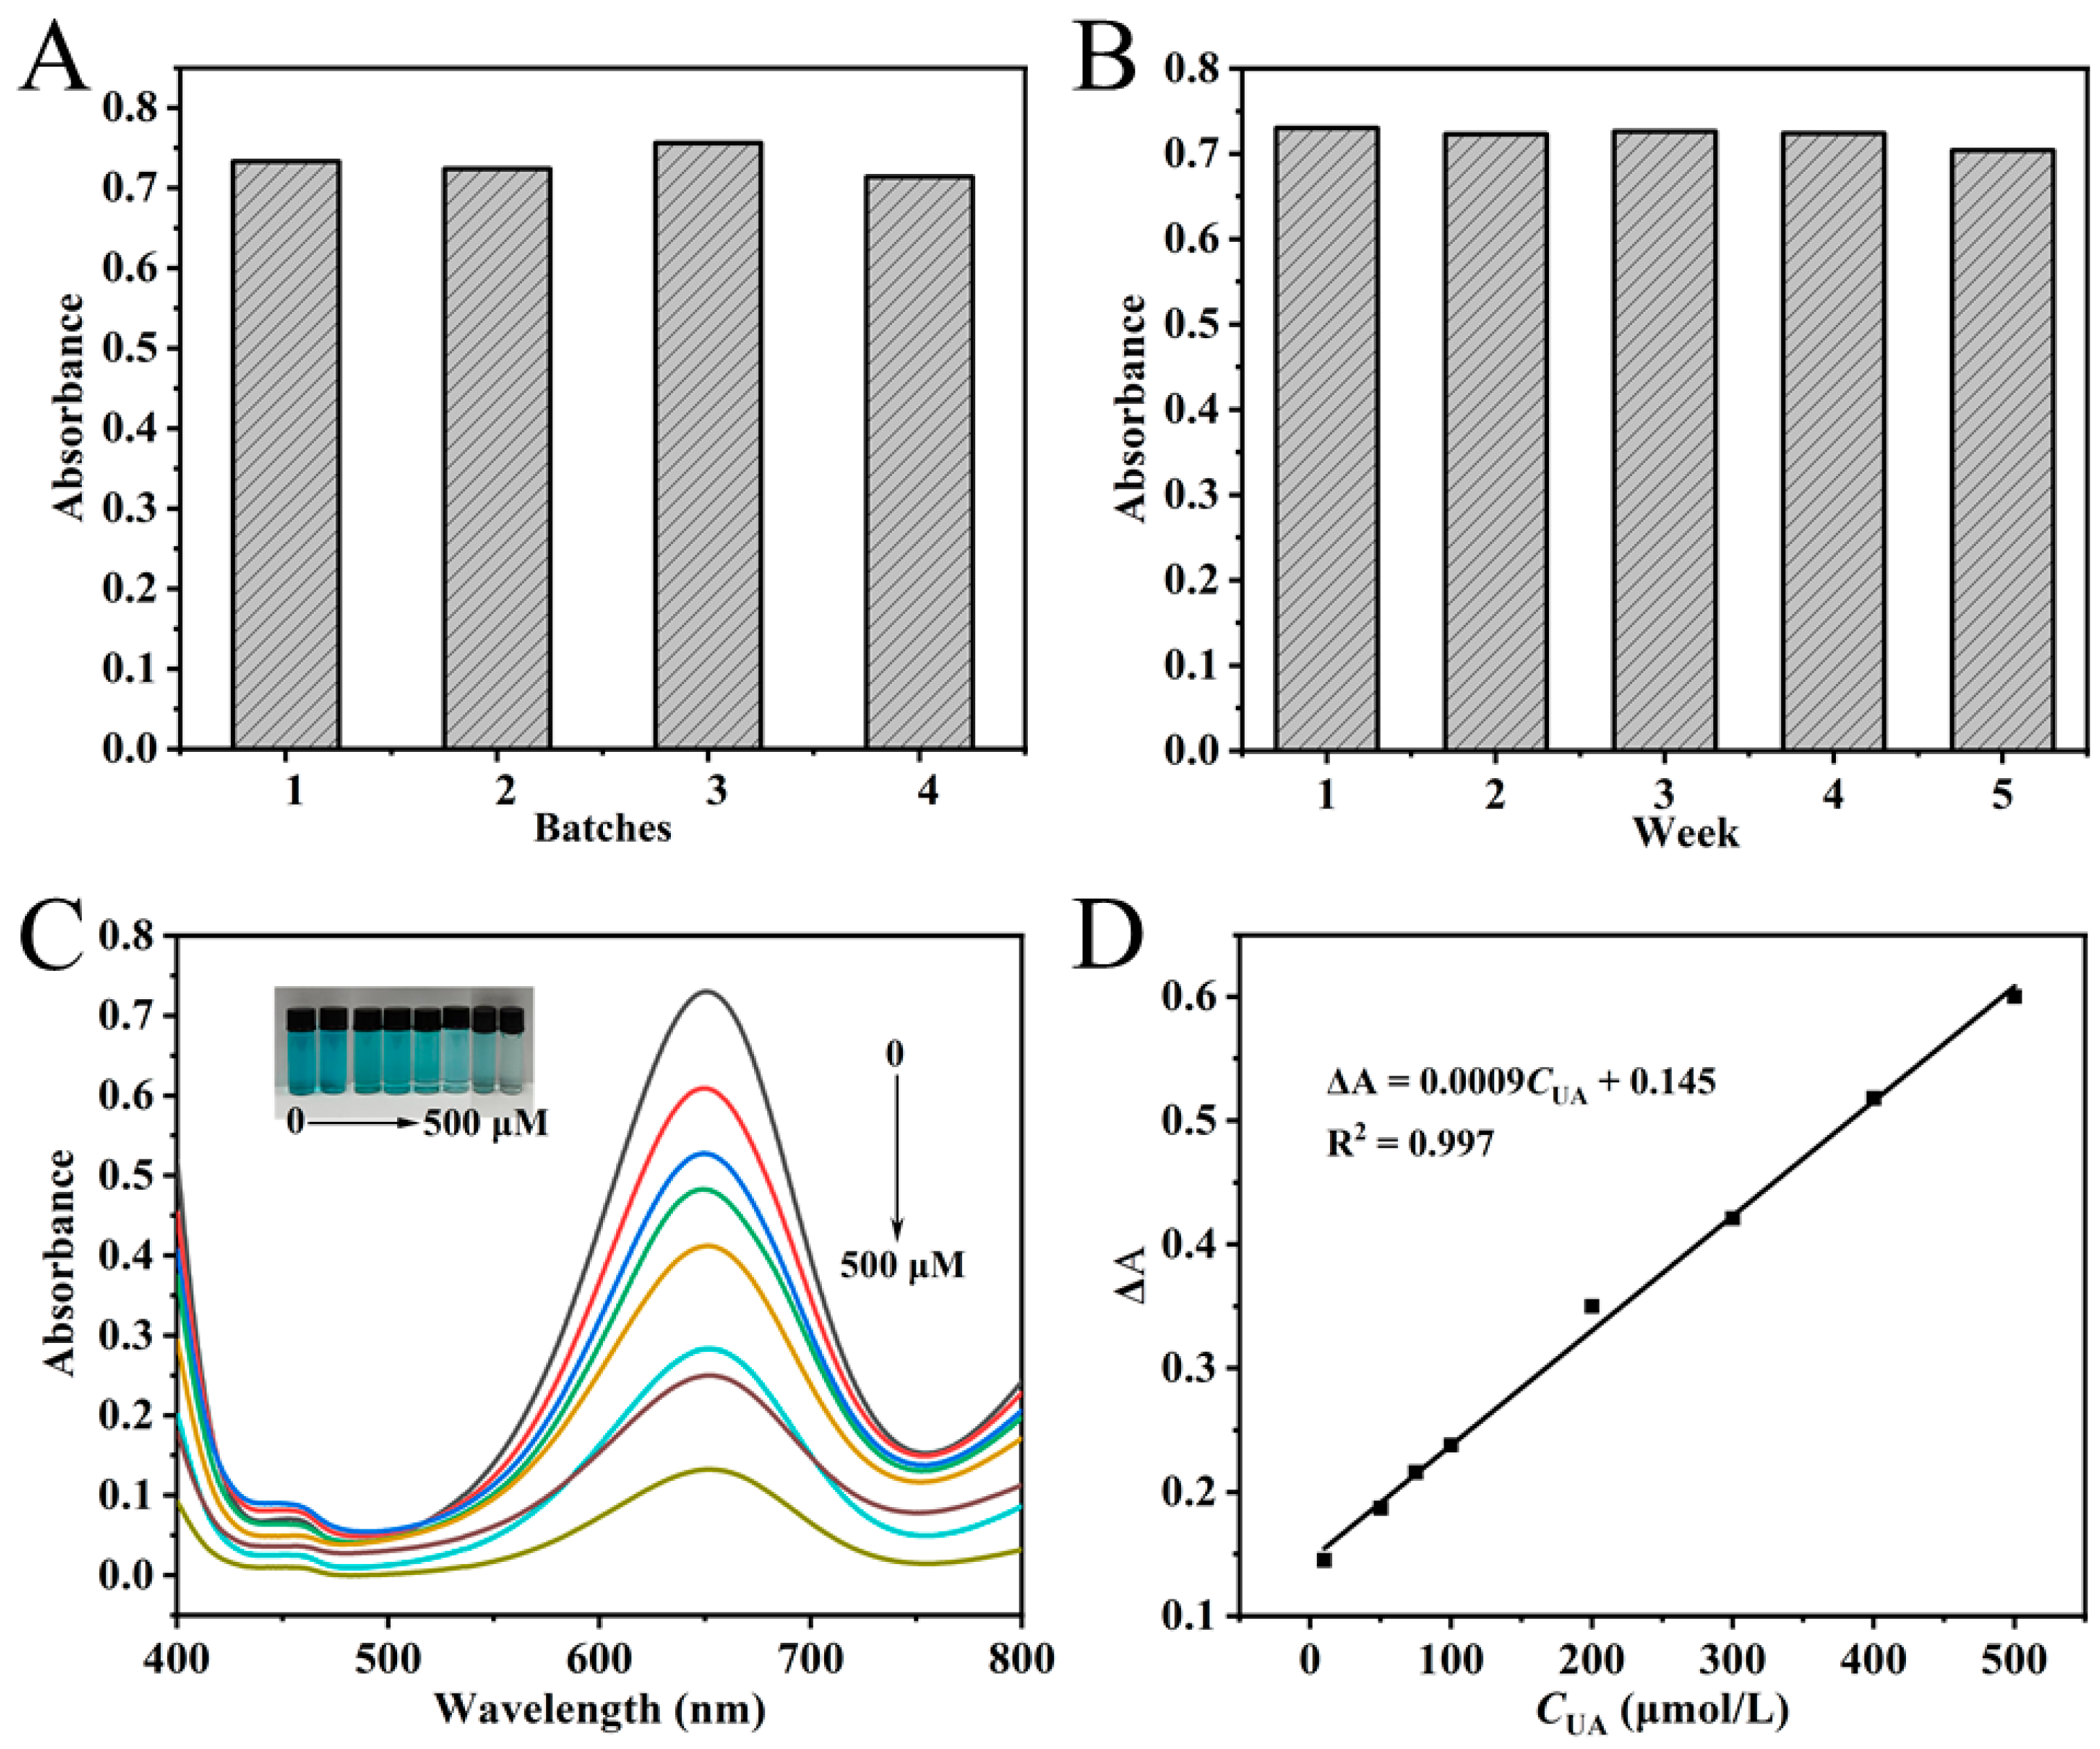
Figure 8.
(A), (B), (C) and (D) Selectivity of NC enzyme-free colorimetric method (the concentration of UA was 400 μmol·L-1, DA, AA and Cys was 5 μmol·L-1, and other interfering substances was 500 μmol·L-1). (E) Effect of different concentrations of DA, AA and Cys on the absorbance of the system. (F) Effect of TBA, BQ, FFA and UA on NC-TMB color development system. Experimental conditions: 2.5 mL 0.2 M NaAc-HAc buffer (pH = 4.6), 200 μL TBA or 200 μL FFA or 4 mg BQ, 35 μL 8 mmol·L-1 TMB, 4 mg NC, 35 ℃, 5 min.
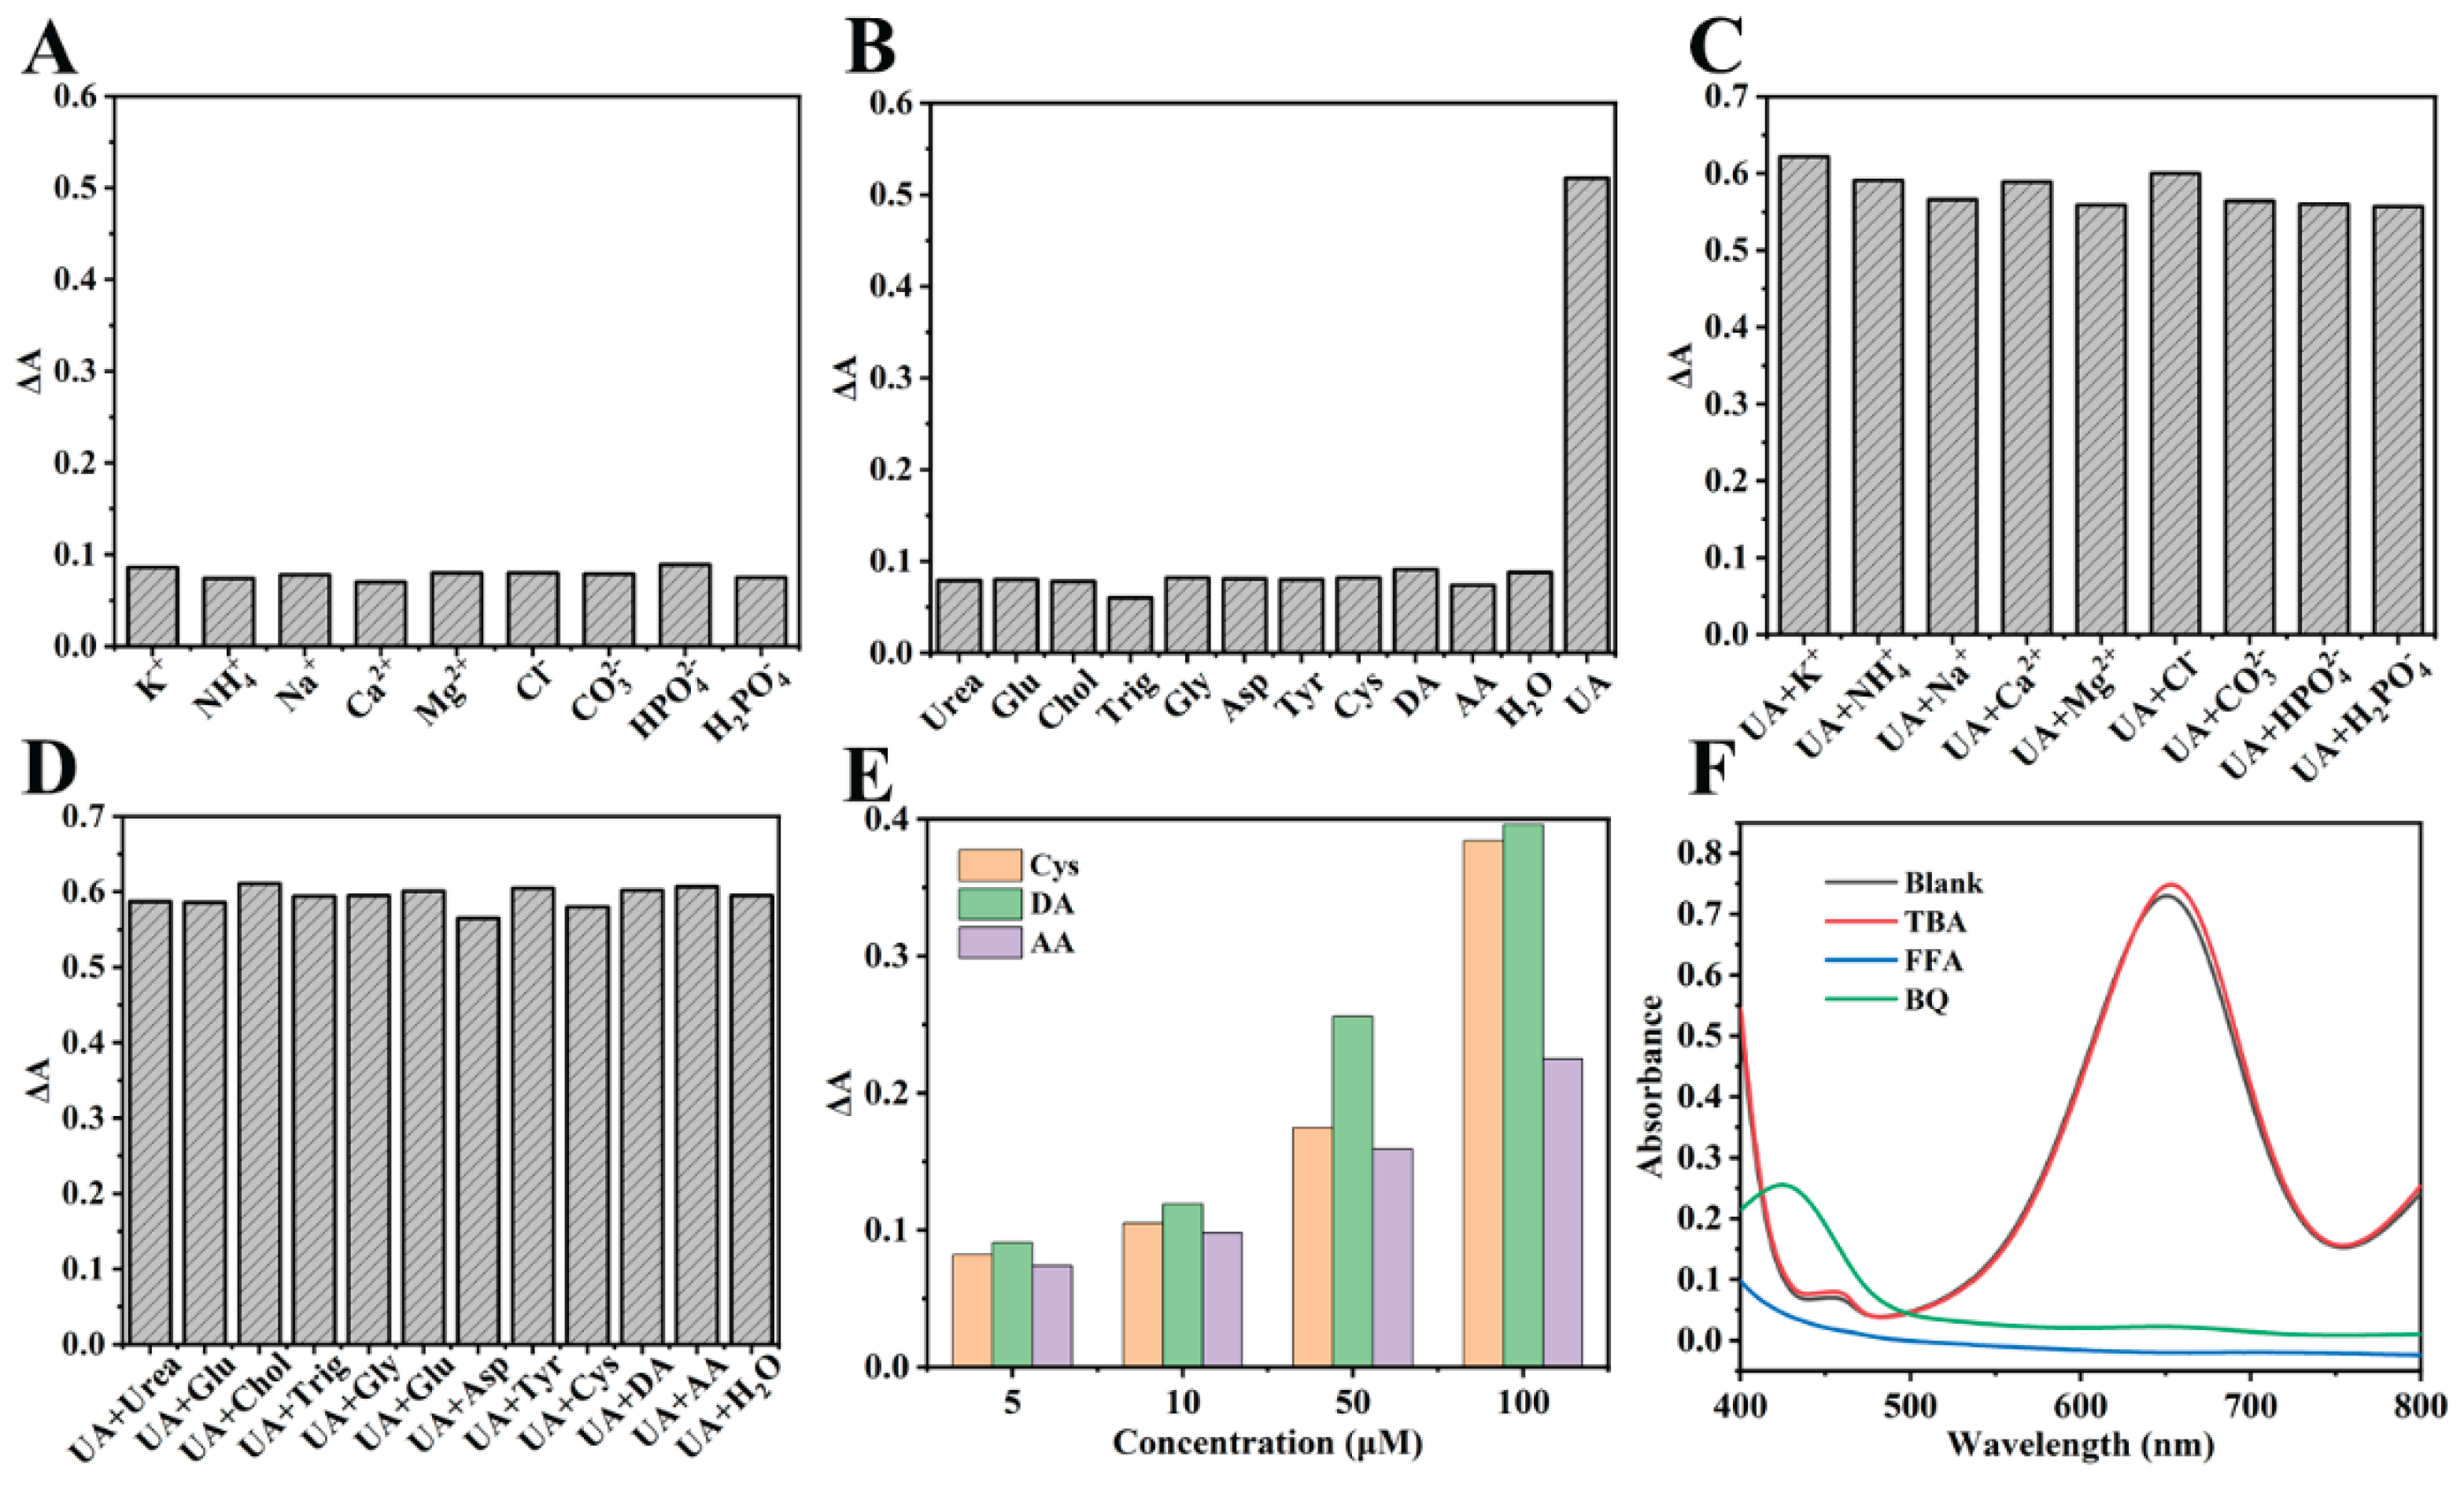

Table 1.
Comparison of the NC enzyme-free colorimetric assay and other methods for UA analysis.
| Materials | Enzyme | Linear Range (μmol·L-1) | LOD (μmol·L-1) | Detection Time (min) | References |
|---|---|---|---|---|---|
| Fe/Mo DSACs | uricase | 0.5-200 | 0.13 | 45 | [8] |
| TMB-CoP/NF | peroxidase mimic | 1-200 | 1.00 | 40 | [19] |
| CaF2/MnO2 | uricase | 0.3-70 | 0.137 | 55 | [25] |
| CoMnO3 | uricase | 0.6-200 | 0.38 | 25 | [47] |
| BSA@Au nanoclusters | uricase | 0.5-50 | 0.39 | 75 | [48] |
| CaF2/MnO2 | no enzyme | 0.1~30 | 0.039 | 3 | [25] |
| AuNRs-MnO2-KI | no enzyme | 0.8~30 30~300 |
0.76 2.04 |
15 | [26] |
| Ag/Au nanorods | no enzyme | 0.1~1.0 | 0.065 | 2 | [27] |
| MnO2 nanosheets | no enzyme | 0.5~30 | 0.21 | 20 | [28] |
| Cu(II)-complex | no enzyme | 50-500 | 4.6 | 6 | [49] |
| Holey MoS2 | no enzyme | 400-7000 | 5.62 | 0.8 | [50] |
| NC | no enzyme | 10-500 | 4.87 | 25 | This work |
Table 2.
Results of actual serum and urine sample determination and spiked recovery experiments.
| Samples | Measurement Results (μmol·L-1) | Measured Quantity Average (μmol·L-1) | Marked Quantity (μmol·L-1) | Total Amount Measured (μmol·L-1) | Recovery rate (%) | RSD (%) |
|---|---|---|---|---|---|---|
| Serum 1 | 380.25 376.36 385.49 |
380.70 | 100 | 476.20 | 95.5 | 1.20 |
| Serum 2 | 260.28 251.37 262.16 |
257.94 | 100 | 360.13 | 102.2 | 2.23 |
| Serum 3 | 302.60 308.58 303.20 |
307.46 | 100 | 406.31 | 98.9 | 1.43 |
| Urine 1 | 316.54 322.22 327.30 |
322.02 | 100 | 425.65 | 103.6 | 1.67 |
| Urine 2 | 164.44 174.44 170.03 |
169.64 | 100 | 267.78 | 98.14 | 2.95 |
| Urine 3 | 246.60 238.56 242.22 |
242.46 | 100 | 340.25 | 97.8 | 1.66 |
Disclaimer/Publisher’s Note: The statements, opinions and data contained in all publications are solely those of the individual author(s) and contributor(s) and not of MDPI and/or the editor(s). MDPI and/or the editor(s) disclaim responsibility for any injury to people or property resulting from any ideas, methods, instructions or products referred to in the content. |
© 2025 by the authors. Licensee MDPI, Basel, Switzerland. This article is an open access article distributed under the terms and conditions of the Creative Commons Attribution (CC BY) license (http://creativecommons.org/licenses/by/4.0/).
Copyright: This open access article is published under a Creative Commons CC BY 4.0 license, which permit the free download, distribution, and reuse, provided that the author and preprint are cited in any reuse.


