
Submitted:
02 December 2025
Posted:
04 December 2025
You are already at the latest version
Abstract
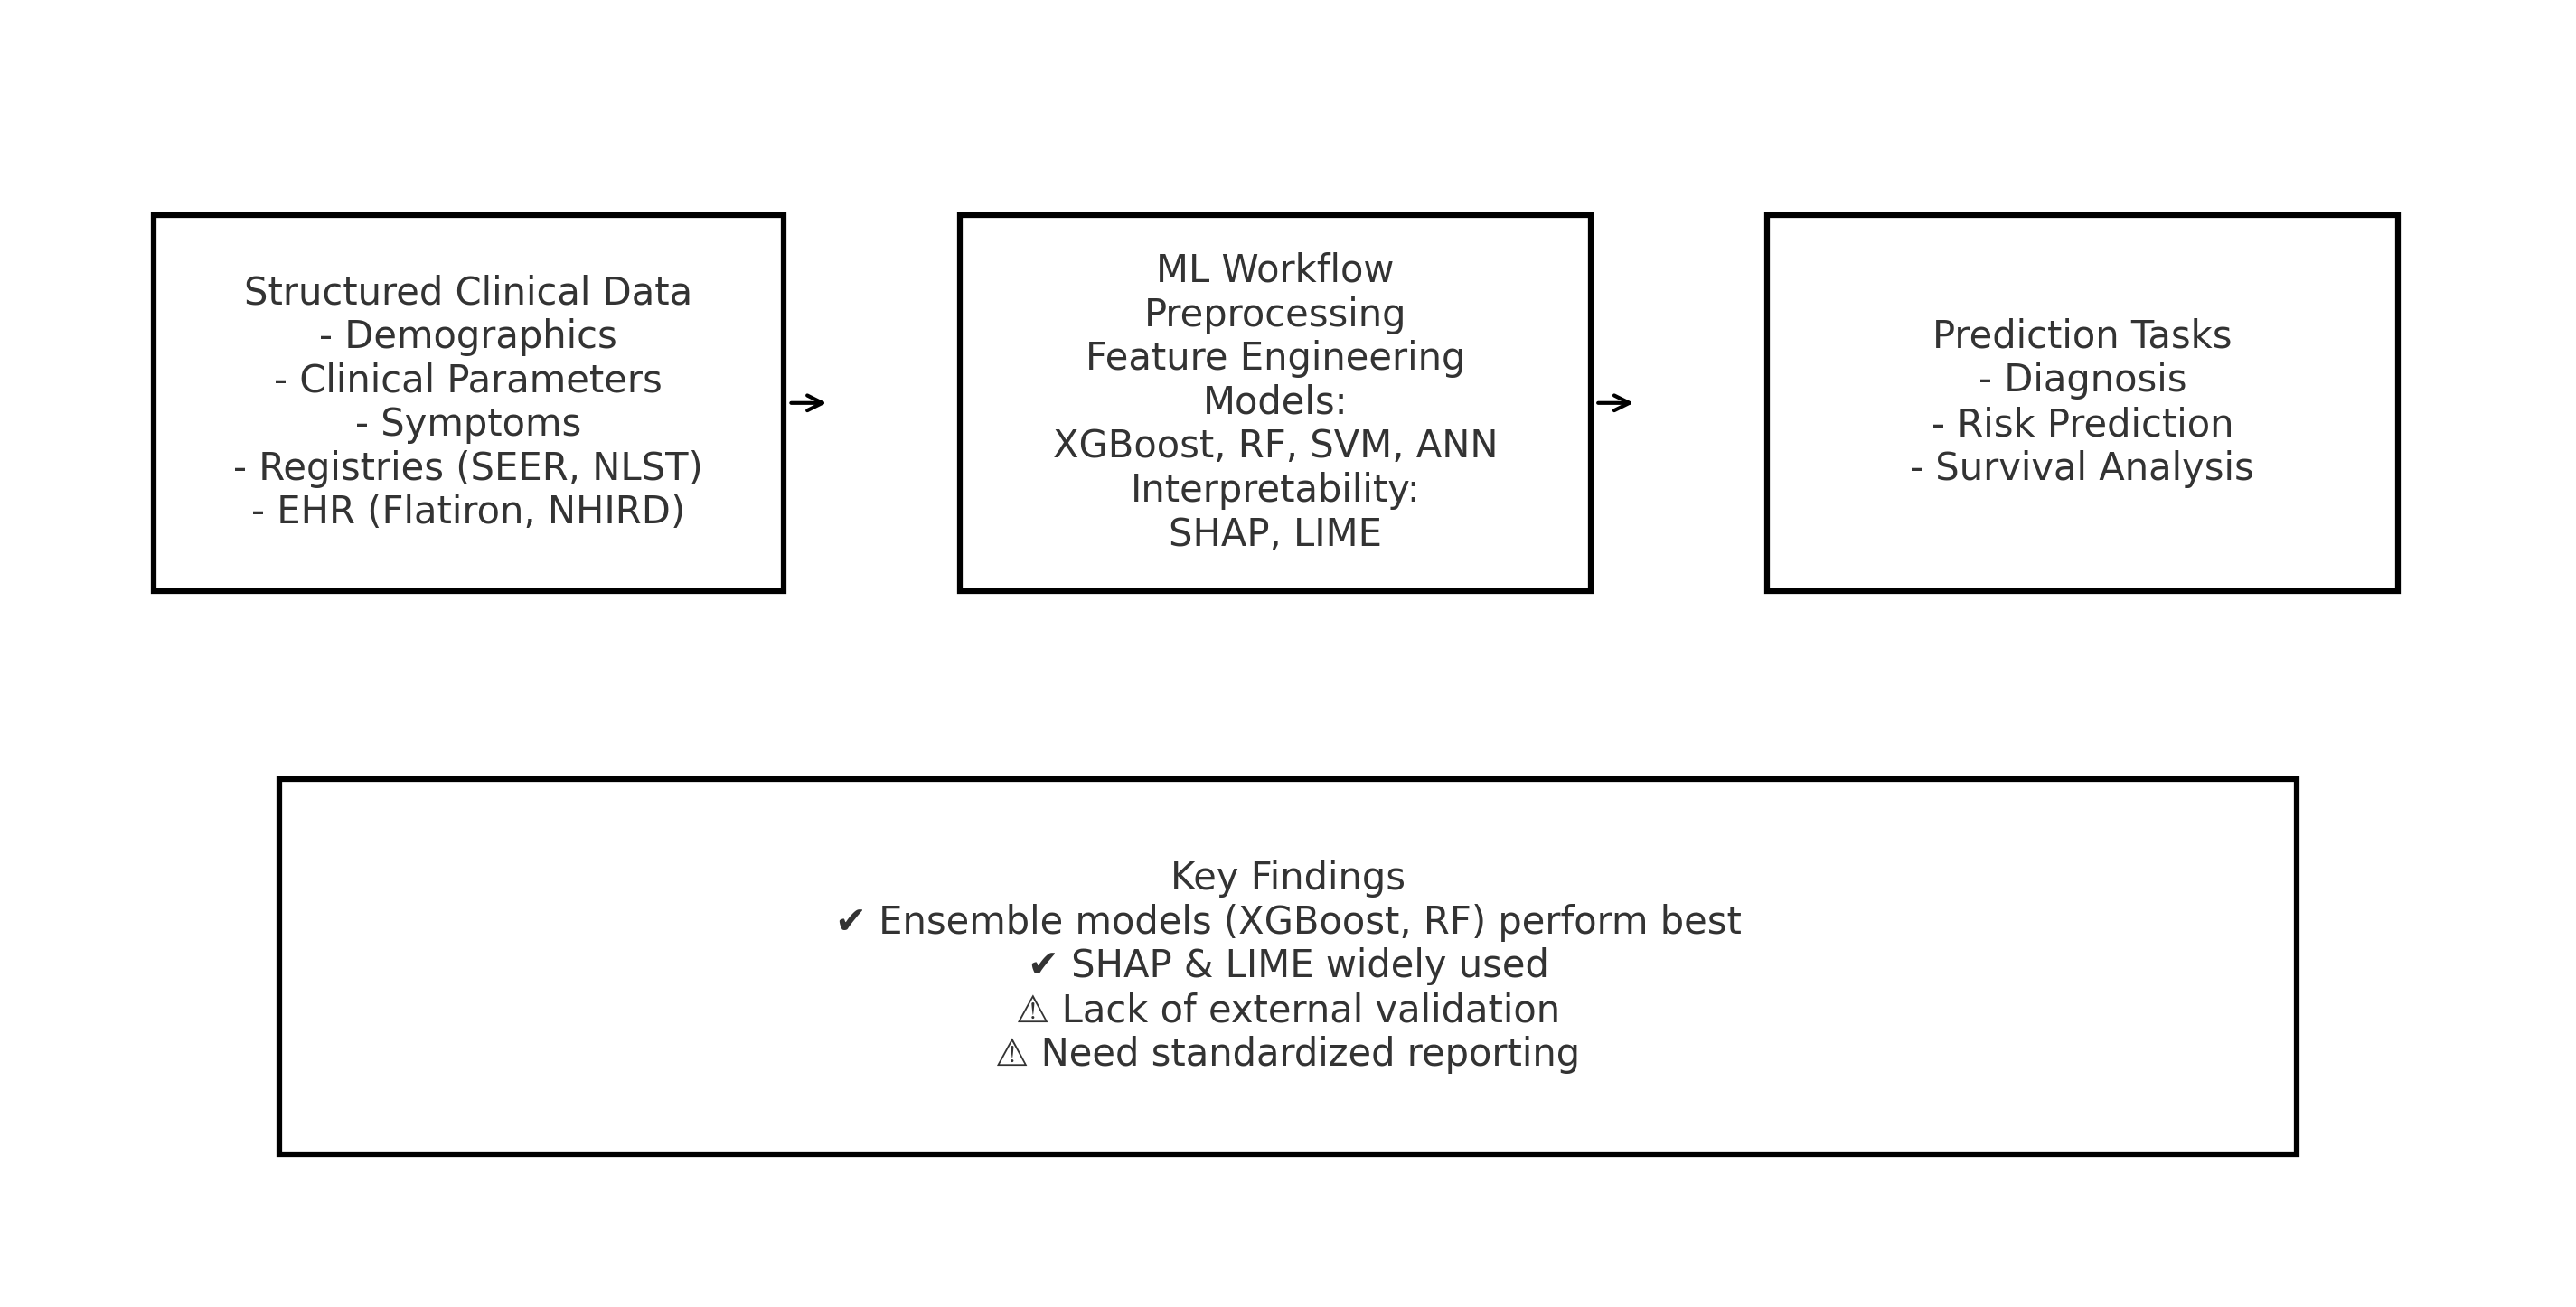
Context: Lung cancer is a leading cause of cancer-related mortality world- wide. While machine learning (ML) offers significant potential for improving prediction tasks, comprehensive reviews synthesizing its application across the full spectrum of lung cancer prediction—from diagnosis and risk to sur- vival—using structured data are scarce. Objective: This systematic review aims to comprehensively analyze ML techniques for three key lung cancer prediction tasks—diagnosis, risk assessment, and survival analysis—using structured or tabular data sources. Method: We followed the PRISMA 2020 guidelines, systematically searching five databases (PubMed, Scopus, IEEE Xplore, ACM Digital Library, Science Direct) for studies published by August 2025. From an initial 772 records, 42 studies met our inclusion criteria, which mandated the use of structured data and ML models for pre- diction. Results: Ensemble methods, particularly XGBoost and Random Forest, were the most prevalent and high-performing models across all tasks. However, performance was highly task-dependent. Key predictive features included demographics, clinical parameters, and lifestyle factors. Datasets were also task-specific: SEER and NLST for diagnosis; population registries (e.g., Danish) for risk; and SEER and TCGA for survival. Common val- idation techniques included holdout and cross-validation, with SHAP and LIME emerging as dominant interpretability tools. While many studies re- ported high performance (e.g., accuracies up to 99%), these results must be interpreted with caution due to dataset imbalances and a general lack of external validation. Conclusion: This review provides a structured syn- thesis of ML applications across the lung cancer prediction continuum. It highlights the dominance of ensemble methods and the critical importance of task-specific data and modeling. The findings reveal a pressing need for more rigorous external validation, standardized reporting, and direct com- parison to established clinical models to foster the development of robust, clinically actionable ML tools.
Keywords:
lung cancer
; prediction
; tabular data or structured data
; machine learning (ML)
; systematic literature review (SLR)
1. Introduction
Lung cancer remains a leading cause of global cancer mortality, underscoring the critical need for advanced methods to predict its onset, identify its presence, and forecast patient outcomes Siegel et al. (2023). The accurate prediction of lung cancer, encompassing diagnosis, risk assessment, and survival analysis, is a cornerstone for improving survival rates through timely screening and personalized intervention strategies. Clinical practice has long relied on traditional statistical models, such as the PLCOM2012 Tammemägi et al. (2013), Bach Bach et al. (2003), and LCRAT (Lung Cancer Risk Assessment Tool) Katki et al. (2016), which utilize risk factors like age and smoking history to stratify populations and guide screening protocols. While these models provide a solid foundation, the emergence of machine learning (ML) offers a paradigm shift, enabling the capture of complex, non-linear patterns within high-dimensional data that traditional methods may overlook.
The proliferation of Electronic Health Records (EHRs) and large-scale clinical registries has created vast repositories of structured, tabular data, including demographics, clinical parameters, and treatment histories. The application of ML to these structured datasets presents a significant opportunity to develop more accurate and personalized predictive models for the entire lung cancer care continuum Dritsas and Trigka (2022). However, the existing body of literature is fragmented. Previous review papers, such as those by Mamun et al. (2022) Mamun et al. (2022), Altuhaifa et al. (2023) Altuhaifa et al. (2023), and Juang et al. (2025) Juang et al. (2025), have provided valuable but narrow insights, often focusing on a single prediction task or including studies that are not exclusively based on ML or structured data. This fragmentation leaves a clear gap for a comprehensive synthesis that systematically analyzes ML applications across all major prediction tasks using structured data.
To address this gap, this systematic literature review (SLR) was conducted to provide a holistic overview of machine learning techniques for lung cancer prediction using structured clinical data. The specific contributions of this review are delineated as follows:
- Comprehensive Task Coverage: Unlike previous reviews, this SLR simultaneously investigates three critical prediction tasks—diagnosis, risk assessment, and survival analysis—providing a unified perspective on the ML landscape.
- Exclusive Focus on Structured Data: A strict focus is maintained on models built primarily on structured, tabular data, offering a dedicated resource for this data modality and distinguishing this work from reviews centered on medical imaging.
- Rigorous and Transparent Methodology: The review adheres to PRISMA 2020 guidelines Page et al. (2021), employing a systematic search across five major databases with tailored search strings, resulting in a robust synthesis of 42 high-quality, peer-reviewed studies.
- Task-Oriented Synthesis: A novel, task-categorized analysis of the literature is presented, detailing the specific datasets, feature sets, and ML models that are most effective for diagnosis, risk, and survival prediction, respectively.
- Critical Analysis and Future Directions: Beyond summarization, a critical appraisal of current methodologies is provided, highlighting performance trends, identifying common pitfalls such as the lack of external validation, and outlining clear pathways for future research.
Scope of this review: This review examines peer-reviewed studies that develop or evaluate machine learning models for lung cancer prediction using structured (tabular) data. The included studies are focused on three distinct tasks: (1) Diagnosis prediction – identifying the presence of lung cancer; (2) Risk prediction – estimating an individual’s future likelihood of developing lung cancer; and (3) Survival prediction – forecasting patient outcomes such as survival time or mortality. Studies that incorporate imaging-derived or genomic features are included only if these features are integrated into a structured, tabular format alongside clinical data.
The remainder of this paper is organized as follows. Section 2 reviews related works and prior reviews. Section 3 details the SLR methodology. Section 4 presents the results structured by the research questions. Section 5 provides a synthesized performance analysis. Section 6 discusses the overarching findings, limitations, and implications. Section 7 outlines the limitations of this review and proposes future work. Finally, Section 8 concludes the paper.
2. Related Works
The application of machine learning to structured clinical data for lung cancer prediction has gained substantial momentum in recent years. Primary studies have demonstrated promising results across various prediction tasks. For instance, Chandran et al. (2023) developed ML models using electronic health records to identify high-risk patients, achieving an AUC of 0.76 with LASSO logistic regression Chandran et al. (2023). Similarly, Wu et al. (2024) compared six ML models for predicting lymph node metastasis in NSCLC, finding that Generalized Linear Models performed best (AUC=0.810) Wu et al. (2024). Maurya et al. (2024) conducted a comparative analysis of twelve algorithms, reporting that K-Nearest Neighbors achieved 92.86% accuracy for lung cancer prediction Maurya et al. (2024). These studies collectively highlight the potential of ML approaches while revealing substantial heterogeneity in methodologies, datasets, and evaluation practices.
Several systematic reviews have attempted to synthesize this growing body of literature, though each exhibits specific limitations in scope or methodology. Mamun et al. (2022) focused on early-stage lung cancer prediction but included only ten studies, providing insufficient coverage of the field. Their review also lacked transparency regarding dataset availability and search methodology Mamun et al. (2022). Altuhaifa et al. (2023) exclusively addressed survival prediction using clinical data, identifying Random Forest as the predominant model across 30 studies. However, their narrow focus on survival outcomes and use of only three databases limited the review’s comprehensiveness Altuhaifa et al. (2023). Juang et al. (2025) conducted a broad examination of risk prediction models across Western and Asian populations but included numerous non-ML approaches and traditional statistical models, making it difficult to assess the specific contributions of machine learning techniques Juang et al. (2025).
Additional reviews have addressed adjacent topics while leaving the core focus unexplored. For example, Zhuan et al. (2023) systematically reviewed machine learning for radiation pneumonitis prediction in lung cancer patients, demonstrating excellent diagnostic performance (AUC=0.93) but focusing exclusively on this treatment-related complication rather than core prediction tasks Zhuan et al. (2023). Other reviews have emphasized imaging-based approaches or combined multiple data modalities without specifically addressing the unique challenges and opportunities presented by structured data analysis.
This systematic literature review addresses several critical gaps in the existing review landscape. Unlike previous works, it provides comprehensive coverage across all three major prediction tasks—diagnosis, risk assessment, and survival analysis—while maintaining an exclusive focus on structured data approaches. The review employs a rigorous methodology following PRISMA guidelines, with systematic searches across five major databases and transparent reporting of inclusion criteria. By synthesizing 42 high-quality studies, it offers robust insights into optimal datasets, feature sets, model architectures, and validation practices specific to structured data applications. Furthermore, it provides critical analysis of methodological limitations and future directions, aspects often underemphasized in previous reviews. This comprehensive approach enables a holistic understanding of the current state and future potential of ML for lung cancer prediction using structured clinical data.
3. Methodology
This systematic literature review was conducted following the PRISMA 2020 guidelines Page et al. (2021) to ensure methodological rigor and transparency. The review process encompassed research question formulation, search strategy development, study selection, quality assessment, data extraction, and synthesis.
3.1. Research Questions
Nine research questions (RQs) were formulated to comprehensively analyze the machine learning pipeline for lung cancer prediction from structured data. Table 1 presents the RQs alongside their rationale, providing a framework for the subsequent analysis.
3.2. Eligibility Criteria
Clear inclusion and exclusion criteria were established to ensure study relevance and quality. As shown in Table 2, inclusion criteria IC1, IC2, and IC3 were mandatory, focusing on lung cancer prediction relevance, structured data usage, and machine learning application.
3.3. Search Strategy
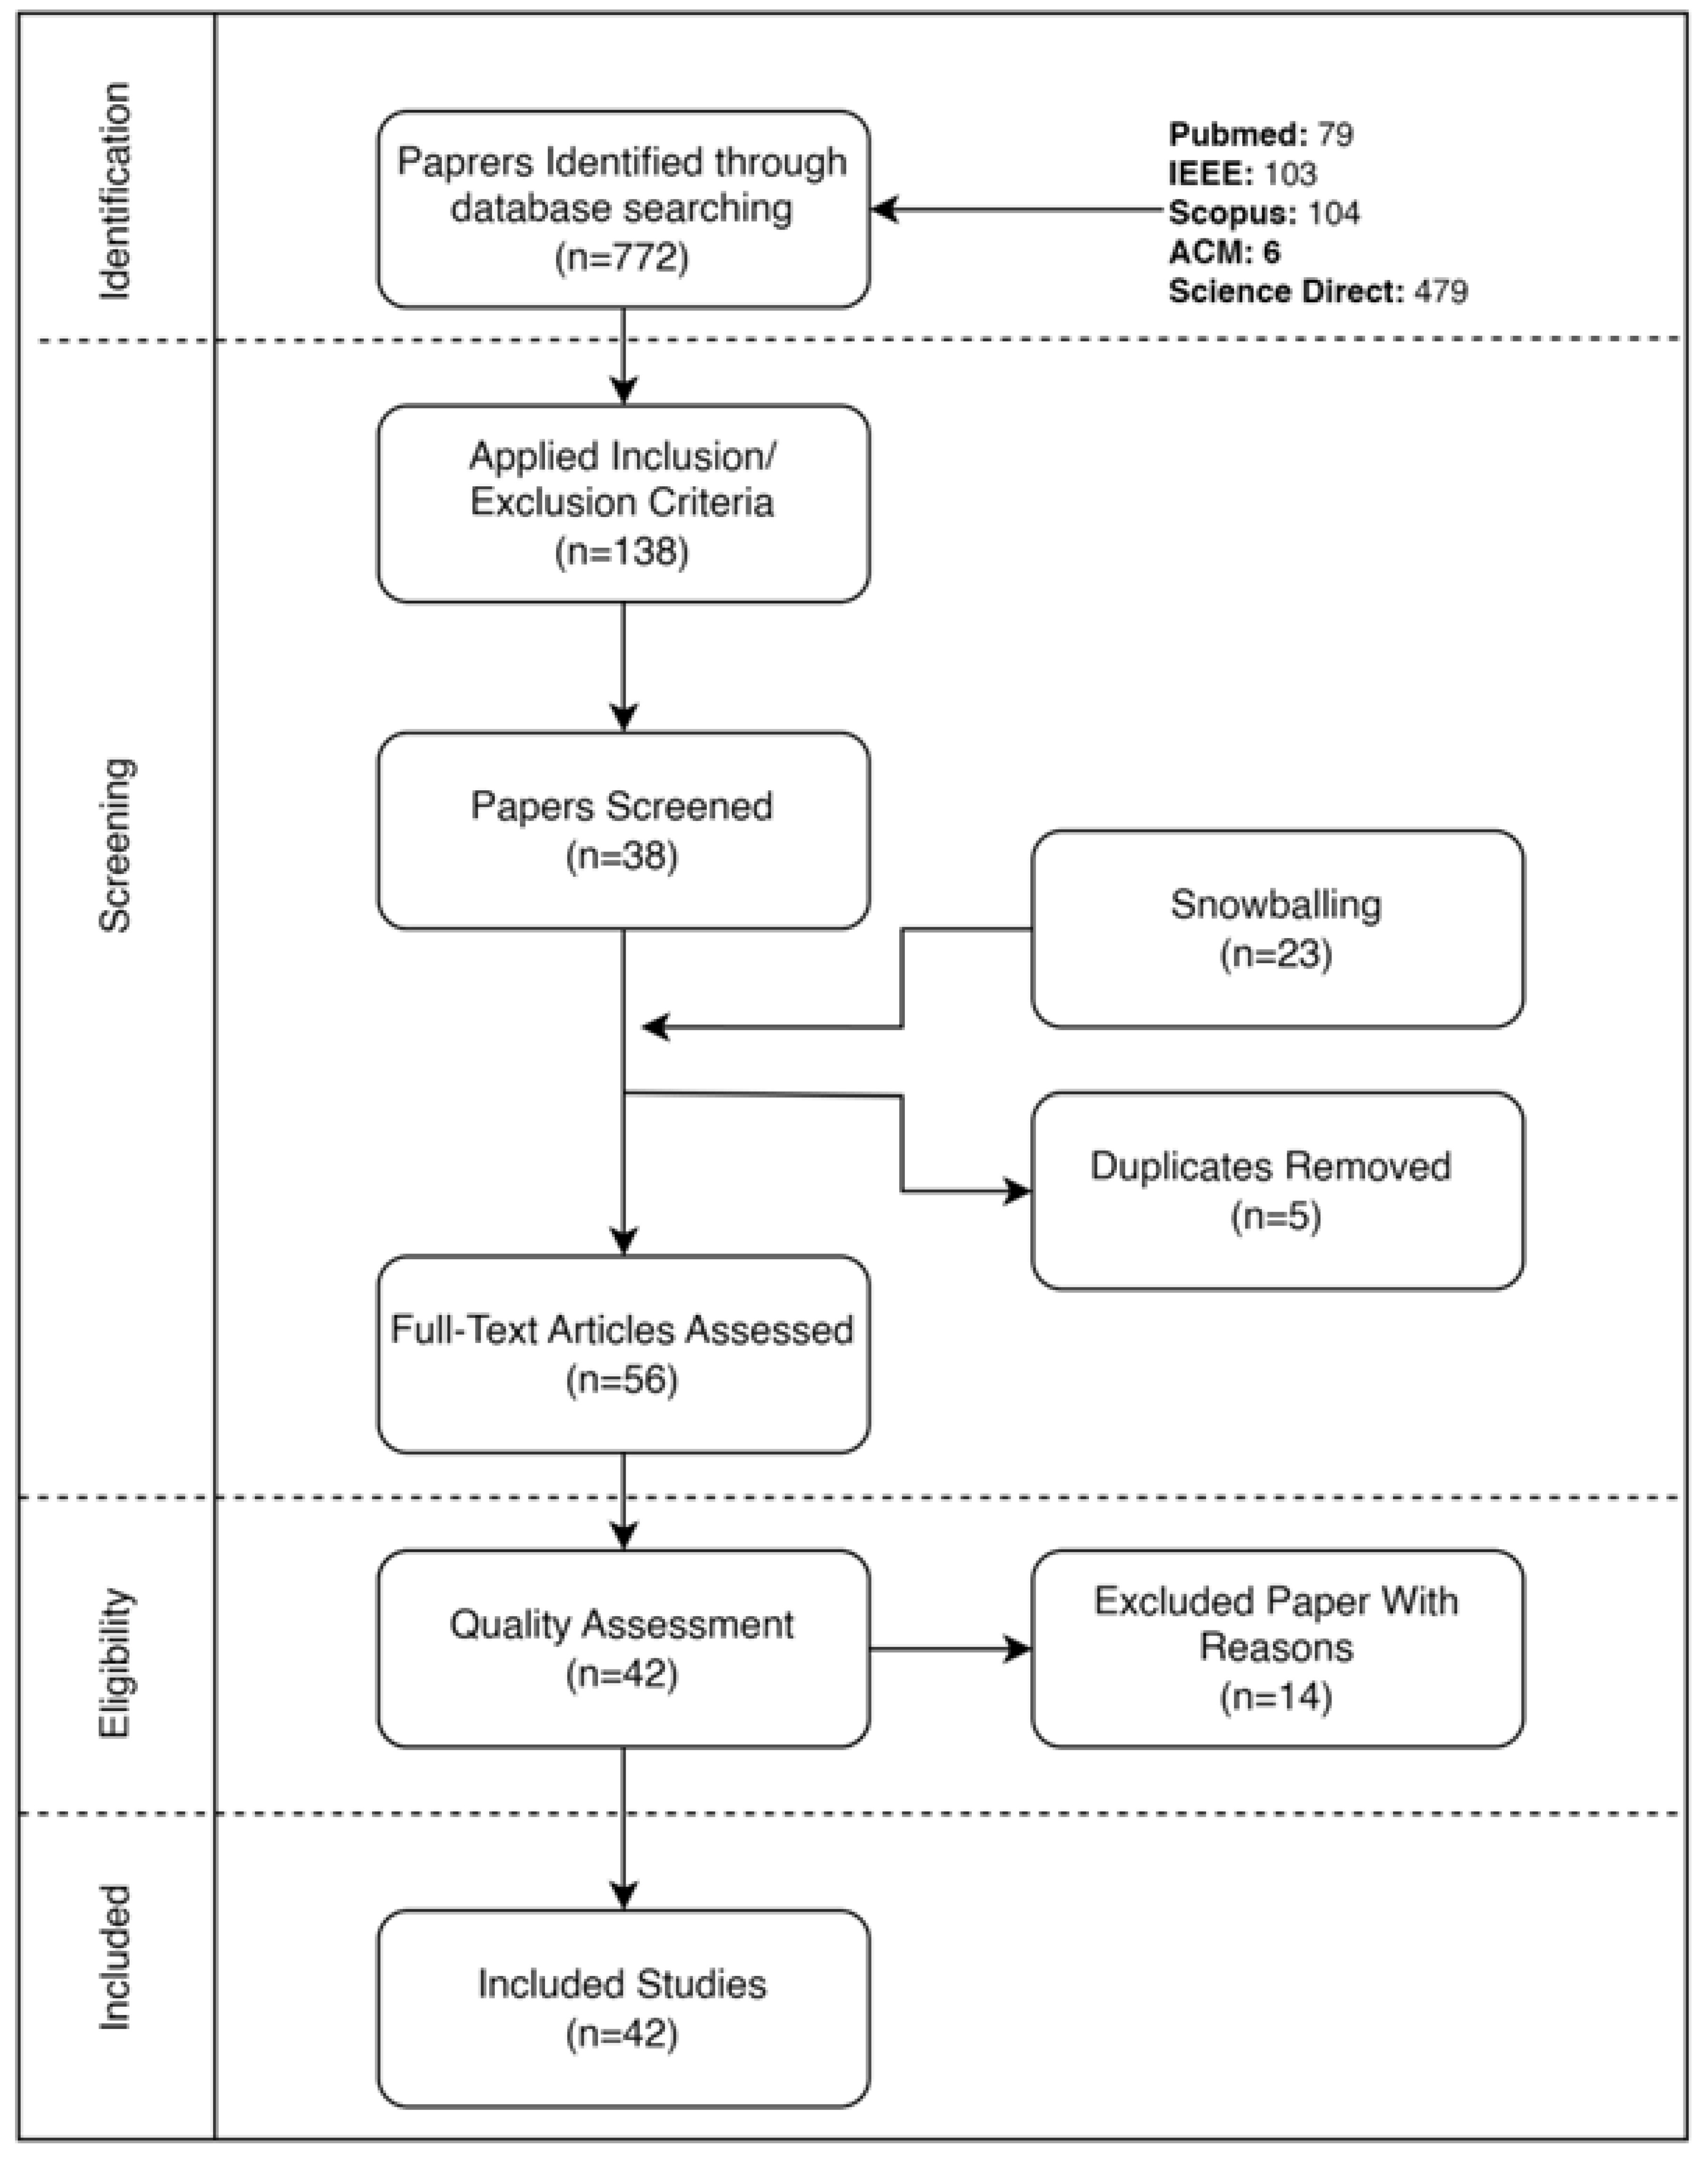
Search strategy is one of the most crucial aspects of finding relevant research papers. To make the SLR searching strategy reproducible by other researchers, the development of an appropriate search strategy using the most cited papers in the relevant field was done. First, identification of the primary papers for Lung Cancer was done. Using that as a base, keywords to be used as search strings were developed. Some of the primary keywords that were identified are: “Lung Cancer” or “Non-Small cell Lung Cancer” and “Detection” or “Prediction”. Synonyms of those words were also explored to build a suitable search string. After that, 5 publicly available databases: Pubmed, Scopus, IEEE, ACM, and Science Direct were explored. As the databases used different search methodologies, search strings were compiled for each of the databases separately. The complete process for selecting the studies is given below (PRISMA Flow Diagram), ensured transparency and reproducibility:
- The search strings were used for the retrieval of the relevant papers. A total of 772 papers were found using the initial search string.
- Inclusion/ Exclusion Criteria were applied for each of the papers and the total number of studies decreased to a total of 138 papers.
- After going through the abstract, methodology, and conclusion, several papers were removed due to being irrelevant, and ended up with 38 Papers.
- Snowballing was done on the selected papers, and the final number was 61.
- After eliminating the duplicates the total number of papers came up to 56.
- Finally, all the 56 papers were read thoroughly. Quality Assessments were applied. Resulting in the final 42 papers to be used for data extraction and synthesis process.

Table 3.
Database-wise Search Strings.
| Database Name | Search String | #Initial Papers | #Studies after IC/EC | After Screening Title/Abstract | Papers from Snowballing + QA | Duplicates Removed | Final Selection (Full-Text) |
|---|---|---|---|---|---|---|---|
| PubMed | ("Lung Cancer"[tiab] OR "Non-Small Cell Lung Cancer"[tiab] OR "lung neoplasm"[tiab] OR "pulmonary cancer"[tiab]) AND ("Detection"[tiab] OR "Prediction"[tiab] OR "Diagnosis"[tiab] OR "prognosis"[tiab] OR "early detection"[tiab] OR "risk assessment"[tiab]) AND ("ML"[tiab] OR "Machine Learning"[tiab] OR "AI"[tiab] OR "Artificial Intelligence"[tiab] OR "data mining"[tiab] OR "ensemble learning"[tiab] OR "Ensemble Stacking"[tiab] OR "Stacking"[tiab] OR "Bagging"[tiab] OR "Boosting"[tiab]) AND ("tabular data"[tiab] OR "structured data"[tiab] OR "clinical data"[tiab] OR "patient records"[tiab] OR "health records"[tiab] OR "EHR"[tiab] OR "electronic health records"[tiab]) NOT ("Image"[ti] OR "Imaging"[ti] OR "Medical Imaging"[ti] OR "histopathology"[ti] OR "segmentation"[ti] OR "MRI"[ti] OR "X-ray"[ti] OR "ultrasound"[ti] OR "CT"[ti] OR "tomography"[ti] OR "blood"[ti] OR "vitamin"[ti] OR "mechanism"[ti] OR "transmission"[ti] OR "prevention"[ti] OR "forecasting"[ti] OR clinical studies[ptype] OR Editorial[ptyp] OR Comment[ptyp] OR Case Reports[ptyp] OR "survey"[tiab] OR "case study"[ti] OR "review"[tiab] OR "preprints"[tiab]) AND English[lang] | 80 | 19 | 19 | 9 | 5 | 42 |
| IEEE | ((Lung Cancer OR Non-Small Cell Lung Cancer OR lung neoplasm OR pulmonary cancer) AND (Detection OR Prediction OR Diagnosis OR Prognosis OR Early Detection OR Risk Assessment) AND (Machine Learning OR ML OR Deep Learning OR AI OR Artificial Intelligence OR Data Mining OR Ensemble Learning OR Supervised Learning OR Decision Trees OR Random Forest OR SVM OR Logistic Regression OR Neural Networks OR Gradient Boosting OR XGBoost OR Ensemble Stacking OR Stacking OR Bagging OR Boosting) AND (Tabular Data OR Structured Data OR Clinical Data OR Electronic Health Records OR EHR OR Health Records OR Patient Records OR Patient Demographics) NOT (Image OR Imaging OR Medical Imaging OR Radiology OR Histopathology OR Segmentation OR MRI OR X-ray OR Ultrasound OR CT OR Tomography OR PET Scan OR Radiomics OR Blood OR Vitamin OR Mechanism OR Transmission OR Prevention OR Forecasting OR Trends OR Epidemiology OR Case Study OR Survey OR Review)) | 103 | 4 | 4 | – | – | – |
| Scopus | (TITLE-ABS-KEY("Lung Cancer" OR "Non-Small Cell Lung Cancer" OR "lung neoplasm" OR "pulmonary cancer")) AND (TITLE-ABS-KEY("Detection" OR "Prediction" OR "Diagnosis" OR "Prognosis" OR "Early Detection" OR "Risk Assessment")) AND (TITLE-ABS-KEY("Machine Learning" OR "ML" OR "AI" OR "Artificial Intelligence" OR "Data Mining" OR "Ensemble Learning" OR "Supervised Learning" OR "Ensemble Stacking" OR "Stacking" OR "Bagging" OR "Boosting")) AND (TITLE-ABS-KEY("Tabular Data" OR "Structured Data" OR "Clinical Data" OR "EHR" OR "Health Records" OR "Patient Records")) AND (NOT TITLE-ABS-KEY("Image" OR "Imaging" OR "Medical Imaging" OR "Radiology" OR "Histopathology" OR "Segmentation" OR "MRI" OR "X-ray" OR "Ultrasound" OR "CT" OR "Tomography" OR "PET Scan" OR "Radiomics" OR "Blood" OR "Vitamin" OR "Mechanism" OR "Transmission" OR "Prevention" OR "Forecasting" OR "Trends" OR "Epidemiology" OR "Case Study" OR "Survey" OR "Review" OR "preprints")) AND (LIMIT-TO(LANGUAGE, "English")) | 104 | 84 | 5 | – | – | – |
| ACM | ("Lung Cancer" OR "Non-Small Cell Lung Cancer" OR "lung neoplasm" OR "pulmonary cancer") AND ("Detection" OR "Prediction" OR "Diagnosis" OR "prognosis" OR "early detection" OR "risk assessment") AND ("ML" OR "Machine Learning" OR "AI" OR "Artificial Intelligence" OR "data mining" OR "ensemble learning" OR "Ensemble Stacking" OR "Stacking" OR "Bagging" OR "Boosting") AND ("tabular data" OR "structured data" OR "clinical data" OR "patient records" OR "health records" OR "EHR" OR "electronic health records") AND NOT ("Image" OR "Imaging" OR "Medical Imaging" OR "histopathology" OR "segmentation" OR "MRI" OR "X-ray" OR "ultrasound" OR "CT" OR "tomography" OR "blood" OR "vitamin" OR "mechanism" OR "transmission" OR "prevention" OR "forecasting" OR "clinical studies" OR "editorial" OR "comment" OR "case reports" OR "survey" OR "case study" OR "review" OR "preprints") | 6 | 0 | 0 | – | – | – |
| Science Direct | "Lung Cancer" AND ("Prediction" OR "Detection") AND ("Ensemble Learning" OR "Machine Learning") AND ("Tabular Data" OR "Structured Data" OR "Clinical Data") | 479 | 15 | 10 | – | – | – |
| Total | – | 772 | 138 | 38 | 9 | 5 | 42 |
Figure 1.
Search Process.
3.4. Selection Process
Selection process is a crucial step in ensuring that only the most relevant and high-quality studies are included in this review. By establishing clear evaluation criteria, we can systematically evaluate the rigor, reliability, and contribution of each paper. A two-phase selection process was employed. First, titles and abstracts were screened against eligibility criteria by two independent reviewers. Second, full-text assessment was conducted for potentially relevant studies. A quality assessment checklist (Table 4) was applied, with studies requiring a minimum score of 60% for inclusion. All 42 included studies met or exceeded this threshold.
-
Research Objective Clarity
- Does the paper have any relevance to lung cancer prediction?
-
Dataset Structure and Relevance
- Does the paper contain a clear description of the dataset used and is it structured?
-
Descriptive Methodology & Use of Machine Learning
- Does the paper clearly describe the methodology used?
- Does it include machine learning models?
-
Performance Metrics Mentioned
- Does the paper denote the performance metrics of their prescribed methodology?
-
Preprocessing Methods Described
- Does the paper contain details on feature selection and preprocessing methods used?
-
Dataset Availability and Details
- Does the paper describe the availability of the dataset (e.g., public, private)?
-
Comparisons Made
- Does the paper make comparisons with other methods/models?
-
Explainability and Interpretability Methods
- Does the paper use any Explainable AI to describe the model’s output?
-
Challenges & Limitations
- Does the paper discuss the limitations of their methodologies?
-
Recent Publication
- Did the paper publish within the last 5–7 years?
After the assessment of the papers using the Selection Process Criteria, no papers were found that scored below the benchmark that was used. The Excel sheet used for the Selection Process is uploaded online for reference in Appendix A.1.
3.5. Data Collection
A data extraction form was created with excel to complete the data collection process. Any conflicts regarding a paper were discussed and resolved. The data collection is divided into 4 sections: 1. Metadata 2. Dataset 3. Methods 4. Evaluation. Table 5 describes the details of the form used for the data collection process and their relevance to the research questions.
3.6. Data Synthesis
Both Qualitative such as Feature Selection Methods, Dimensionality Reduction Methods, Preprocessing Techniques, Interpretability Methods, Best Performing Model and Quantitative data such as Sample Size (Numerical: Count), Performance Metrics (Numerical: Accuracy, F1-score, AUC, etc.) were extracted for this SLR. The data was gathered using the tabulation method recommended by Page et al. (2021). An excel file was created for the data collection process and relevant graphs and charts were created to answer the research questions.
4. Results
RQ1: What is the status of machine learning models for the prediction of lung cancer from tabular datasets over the years?
From Figure 2, the distribution of papers over the last 5-7 years published which are relevant to lung cancer prediction is shown. It can be seen that in 2018 - 2019 (2 Papers per year). However, an upward trend can be seen in the following year, with the paper counts rising to almost double (4 Papers) in 2020, 6 in 2021, 8 in 2022, and 14 in 2024. This signifies an interest and advancement in using Machine Learning models with tabular datasets for lung cancer prediction.
The projected increase to 16 or more papers further underscores the growing emphasis on this field, suggesting continued innovation and prioritization of lung cancer prediction in academic and clinical research.
RQ2: What are the key features (attributes) used in lung cancer prediction models?
From Table 6, we can see that the key attributes used in lung cancer prediction models span diverse categories, reflecting a multifaceted approach to lung cancer diagnosis. It is observed that Demographic features and Clinical parameters are the most frequently used features, appearing in 22 and 20 studies. Lifestyle factors and symptoms are moderately presented, with each having 8 studies. Meanwhile, treatment modalities and survival/outcomes are included in 10 and 9 studies. Molecular/genetic biomarkers and imaging/diagnostics are less common but emerging. Social/Economic Factors are least represented, highlighting a potential gap in socioeconomic data integration.
RQ3: Which tabular datasets are frequently used in lung cancer prediction?
3.1. Which datasets are used for lung cancer diagnosis prediction?
RQ3 reveals a diverse array of tabular datasets used in Lung Cancer Diagnosis prediction which can be visualized from Table 7. Population-based/Registry datasets such as SEER, Danish Registers EPIC, JPHC, and large oncologic DB provide extensive datasets for lung cancer diagnosis prediction, while clinical and EHR datasets like Flatiron Health EHR, Maine HIE, WSIC, Taiwan NHIRD, CLARO, and CLARIFY provide detailed clinical patient records. In addition, Imaging and Radiology datasets such as NLST & LIDC, ACRIN NSCLC-DICOM-PET and datasets from LUNA-16 and Kaggle contribute to lung cancer diagnosis prediction significantly. The inclusion of genomic and multi-omics datasets like TCGA, GTEx, and SLCG provide molecular and datasets from specialized sources or sensors such as Synthea, eNose, Pesticide & Lung cancer, Blood nanosensor, Multi-cancer, and Multi-modal provide an innovative approach to lung cancer diagnosis prediction.
3.2. Which datasets are used for lung cancer risk prediction?
The following Table 8 categorizes the datasets used for Lung Cancer Risk Prediction. Population-based/Registry datasets, such as the Danish National Registers, EPIC (European Prospective Investigation into Cancer and Nutrition), and Japan Public Health Center Study Cohort (JPHC), are widely used due to their large-scale, long-term follow-up nature. These datasets often include extensive demographic, lifestyle, and medical history data, making them valuable for studying lung cancer risk factors at a population level.
Similarly, Clinical/EHR (Electronic Health Record) data sources, such as the Taiwan National Health Insurance Research Database (NHIRD) and the Lung Cancer Prediction Dataset, provide real-world medical records, including diagnostic codes, prescriptions, and treatment histories. Such datasets enable machine learning models to predict lung cancer risk based on patient-specific clinical features.
In contrast, Synthetic/Sensor-Based datasets, such as Synthea Synthetic Patient Data, are less commonly used in lung cancer risk prediction. This suggests a research gap where more work is needed to explore how sensor-based data (e.g., wearable devices, environmental exposure tracking) and synthetic patient simulations can contribute to early detection and risk modeling.
3.3. Which datasets are used for lung cancer survival prediction?
Table 9 describes the datasets used for Lung Cancer Survival Prediction, categorized by data type and source. The inclusion of diverse dataset types reflects the review’s scope of including studies where data is ultimately used in a structured, tabular format for machine learning analysis.
Population-Based/Registry datasets, such as SEER (Surveillance, Epidemiology, and End Results) and Large Oncologic Databases, are widely used due to their extensive collection of long-term survival outcomes, patient demographics, and treatment histories. These datasets represent the core of structured data approaches, enabling large-scale epidemiological studies on lung cancer survival rates through their comprehensive tabular format.
Clinical/EHR datasets, including CLARIFY, NHIRD, etrospective cohort from CUCH, Flatiron Health EHR, CLARO, and the Wisconsin Prognostic Lung Cancer Subdirectory, provide real-world patient records with treatment details, laboratory results, and disease progression. These datasets are crucial for developing personalized survival prediction models and align perfectly with the structured data focus of this review.
Imaging and Radiology datasets, such as ACRIN, NSCLC-DICOM-PET, warrant specific justification for inclusion. While these originate from medical imaging scans (e.g., CT, PET scans), they are included because the studies that use them typically extract quantitative, structured features (radiomics) such as texture, shape, and intensity metrics. These extracted features are then organized in tabular format alongside clinical variables, making them compatible with traditional machine learning algorithms designed for structured data.
Genomic and Multi-Omics datasets, such as TCGA (The Cancer Genome Atlas) and SLCG, provide molecular-level insights including gene expression, mutations, and epigenetic alterations. These datasets are included because they represent structured biological data that can be integrated with clinical variables in tabular format. This facilitates precision oncology approaches by linking genetic variations to lung cancer survival through machine learning models that operate on structured input.
Synthetic/Sensor-Based/Specialized datasets, such as the Pesticide & Lung Cancer dataset, are less common but provide valuable insights into environmental and occupational exposure-related risk factors. These datasets are included when the sensor data or synthetic features are represented in a structured format suitable for machine learning analysis, highlighting the need for further research on non-genetic influences on survival.
RQ4: What are the preprocessing techniques used to feed them into the models?
Table 10 categorizes the key preprocessing techniques applied in the selected studies, illustrating a comprehensive approach to preparing data for modeling. The table identifies several essential methods: encoding and transformation, normalization/standardization, missing data handling, data cleaning and filtering, data splitting and validation, and domain-specific preprocessing.
In many studies, encoding and transformation techniques are employed to convert categorical data into numerical representations, which is essential for enabling machine learning algorithms to process diverse datasets effectively. Normalization and standardization techniques are similarly crucial; they scale the data so that each feature contributes equally during model training, improving stability and convergence. These steps are particularly important when dealing with variables that differ significantly in scale.
Handling missing data is another critical preprocessing step. The studies referenced in the table apply various strategies—such as imputation or exclusion—to mitigate the effects of incomplete data, thereby reducing bias and enhancing model reliability. Equally important are data cleaning and filtering processes that remove noise, errors, and outliers, ensuring that the input data is as accurate and consistent as possible.
The table also highlights the use of data splitting and validation, where datasets are partitioned into training, validation, and testing sets. This practice is fundamental for assessing model performance and ensuring that models generalize well to new, unseen data. Lastly, domain-specific preprocessing steps have been introduced in several studies to tailor the data preparation process to the unique characteristics of the specific dataset or application domain. These customized approaches utilize expert knowledge to extract nuanced patterns that might be overlooked by more generic preprocessing techniques.
In summary, Table 10 illustrates a multifaceted preprocessing pipeline that enhances model performance by addressing different aspects of data quality and consistency. The careful combination of these techniques—from standard transformations and scaling to specialized, domain-driven adjustments—ensures that the data is robust, well-structured, and ready for effective model training. This comprehensive approach not only improves predictive accuracy but also sets the stage for future advancements through the standardization and automation of preprocessing pipelines.
RQ5: What are the most commonly used machine learning algorithms for lung cancer prediction on tabular datasets?
From Figure 3, we can observe that Gradient Boosting, Artificial Neural Network, Logistic Regression, Naive Bayes are the most used ML models, where as Transformer Based Model, Voting Classifier, Generalized Linear Model are the least used ML models for lung cancer prediction. Table 11 provides a detailed overview of the machine learning models employed across selected studies for lung cancer prediction using tabular data. The table shows a wide range of algorithms, from classical statistical methods to advanced deep learning architectures, highlighting the diversity of approaches in the field. Many studies have favored probabilistic and ensemble-based approaches, with Naïve Bayes, Decision Trees, Random Forests, and Logistic Regression being among the most frequently applied methods. Naïve Bayes and Decision Trees are commonly used for their simplicity and interpretability, making them suitable for preliminary analysis and feature importance assessment. Random Forests and Gradient Boosting methods, on the other hand, are extensively adopted due to their robustness in handling high-dimensional data and their ability to mitigate overfitting through ensemble techniques. Support Vector Machines, k-Nearest Neighbors, and Artificial Neural Networks are also popular choices, often chosen for their flexibility in modeling complex, non-linear relationships. Logistic Regression remains a staple in the predictive modeling domain due to its efficiency and the straightforward interpretability of its coefficients. Additionally, specialized models such as the Kaplan-Meier estimator, Survival Models, and Fuzzy Inference Systems indicate that some studies have focused on time-to-event data or uncertainty handling, further emphasizing the domain-specific challenges of lung cancer prediction. Emerging techniques, including deep learning approaches like CNNs and Transformer-Based models, along with Graph Machine Learning and Variational Autoencoders (VAEs), signal a growing interest in leveraging advanced algorithms to capture intricate patterns within the data. The inclusion of models such as Linear Regression, K-Means Clustering, and LDA also points to exploratory analyses and dimensionality reduction efforts that precede more complex modeling. Overall, Table 11 underscores the comprehensive utilization of a broad spectrum of machine learning techniques in lung cancer prediction. The selection of these models reflects a balance between traditional methods, which offer interpretability and simplicity, and modern, sophisticated algorithms, which promise enhanced predictive performance and the ability to model complex relationships in the data. This diversity not only caters to the varying nature of tabular data but also paves the way for future research aimed at integrating multiple approaches to improve model robustness and accuracy.
5.1. Which models are commonly used for diagnosis prediction?
Table 12 provides an overview of the machine learning models that have been commonly employed for diagnosis prediction across various studies. The table reflects a diverse selection of models ranging from traditional statistical approaches to more advanced ensemble and deep learning methods.
Logistic Regression is frequently used, as evidenced by its presence in several studies (PS20, PS26, PS32, PS35). Its popularity can be attributed to its efficiency and the clear interpretability of its coefficients, which are particularly valuable in a clinical context. Support Vector Machines (SVM) also appear prominently (PS20, PS24, PS26, PS39), offering robust classification through margin-based separation that helps in distinguishing between diagnostic categories effectively.
Ensemble methods such as Random Forest (PS24, PS26, PS31, PS36, PS37) and XGBoost (PS4, PS20, PS24, PS26, PS36) are widely applied. These models are favored for their ability to handle complex, non-linear relationships and reduce overfitting through the aggregation of multiple decision trees. Decision Trees (PS24, PS39, PS35) provide intuitive insights into the decision-making process, making them a useful tool for understanding diagnostic criteria.
Other models like k-Nearest Neighbors (PS20, PS26) and Naïve Bayes (PS20, PS24, PS26, PS36, PS35) are also in use, offering simplicity and speed for classification tasks based on proximity or probabilistic assumptions, respectively. Neural Networks, including various architectures such as ANN, MLP, and CNN (PS24, PS20, PS26, PS31, PS32, PS34, PS36, PS38, PS39, PS35, PS40), have gained traction for their ability to capture complex, high-dimensional patterns in diagnostic data.
Additionally, models like Linear Discriminant Analysis (PS1, PS39) serve a dual role in classification and dimensionality reduction. Specialized ensemble techniques, such as Extra Tree (PS26) and AdaBoost (PS26), have been explored to further improve predictive performance. Emerging methods such as CATBoost (PS36), Bayesian Networks (PS35), and Variational Autoencoders (PS38) illustrate the field’s ongoing efforts to integrate more advanced and nuanced algorithms into diagnostic prediction frameworks.
Overall, the distribution of models presented in Table 12 underscores a broad methodological spectrum. This diversity reflects the balance between the need for interpretable, reliable models and the pursuit of higher predictive accuracy through advanced machine learning techniques. The varying approaches also suggest that the choice of model may be influenced by specific dataset characteristics and the unique requirements of each diagnostic task.
5.2. Which models are commonly used for risk prediction?
Table 13 outlines the range of models used for risk prediction in lung cancer, revealing a preference for both traditional and advanced machine learning techniques. Logistic Regression is a staple in these studies, appearing in multiple works (PS6, PS10, PS14, PS22, PS23, PS28, PS33, PS13) due to its straightforward interpretability and efficiency in estimating risk probabilities. Ensemble methods also play a significant role, with Random Forest models frequently adopted (PS3, PS6, PS22, PS23, PS28, PS33, PS13) for their ability to manage non-linear relationships and reduce overfitting through aggregation of decision trees.
XGBoost, another ensemble method known for its gradient boosting framework, is similarly prevalent (PS22, PS23, PS28, PS33, PS13), offering high accuracy and robustness in handling complex data structures. Support Vector Machines are also utilized (PS6, PS22, PS28, PS33) to delineate risk boundaries in high-dimensional spaces, while Decision Trees provide an intuitive means for risk stratification (PS3, PS22, PS23, PS33).
Advanced boosting techniques such as Gradient Boosting Machines (PS6, PS23, PS22) further refine risk predictions by sequentially correcting errors made by previous models. Neural network-based approaches, represented by Multi-Layer Perceptrons (PS6, PS33), add another layer of sophistication by capturing intricate, non-linear patterns in the data. In addition, models like LightGBM (PS13) have been explored for their efficiency and scalability.
The table also indicates the use of specialized methods tailored to specific aspects of risk prediction, such as Parametric Survival Models (PS9, PS17), which incorporate time-to-event data, and Bayesian Networks (PS22) that model probabilistic relationships. Other notable approaches include LASSO (PS28) for feature selection, Fuzzy Inference Systems (PS3) to handle uncertainty, and optimization methods like Stochastic Gradient Descent (PS22). Finally, combinations of ensemble techniques like J48, AdaBoost, and Rotation Forest (PS22) underscore the experimental nature of research in this area.
Overall, the models employed for risk prediction reflect a balance between classic statistical methods and modern machine learning algorithms. This diverse methodological landscape not only accommodates the varied characteristics of clinical and tabular datasets but also supports the development of robust risk prediction frameworks that can be fine-tuned to specific clinical applications.
5.3. Which models are commonly used for survival prediction?
Table 14 provides an overview of the machine learning models that have been commonly employed for survival prediction across various studies. The table illustrates a diverse selection of models, ranging from traditional statistical methods to advanced deep learning techniques, each addressing the unique challenges posed by survival data.
Random Survival Forest appears in studies PS2 and PS16, showcasing its strength in handling censored data and capturing non-linear relationships through ensemble learning. The Cox Proportional Hazards model, featured in PS10, PS15, and PS16, remains a staple in survival analysis due to its interpretability and established framework for estimating hazard ratios.
Deep learning techniques have also made inroads in survival prediction. DeepSurv (PS15, PS21) and Neural Networks (Deep Learning) (PS5, PS25, PS29, PS41, PS10) illustrate the field’s move toward models that can uncover complex, high-dimensional patterns in survival outcomes. More traditional classification methods are still in use, with Logistic Regression (PS8, PS12, PS29, PS13, PS10) and Support Vector Machines (SVM) (PS5, PS8, PS12, PS27, PS41) being applied for their robustness and efficiency.
Additionally, ensemble methods such as Random Forest (PS8, PS12, PS13) and XGBoost (PS8, PS13) are favored for their ability to mitigate overfitting and manage intricate interactions within the data. Decision Trees (PS5, PS7, PS8, PS12, PS27, PS13) offer a clear, interpretable structure for decision-making, while Gradient Boosting Machine (PS12, PS27, PS41) and Linear Regression (PS27, PS41) provide further avenues for predictive modeling with varying degrees of complexity. Complementary models like K-Nearest Neighbors (PS7, PS8, PS12), Naive Bayes (PS7, PS12), and REPTree (PS7) round out the table, each contributing unique advantages in terms of speed, simplicity, or alternative tree-based strategies.
Overall, the distribution of models in Table 14 reflects a balance between leveraging traditional, interpretable approaches and embracing modern, computationally intensive methods, ensuring that survival prediction frameworks can be tailored to the specific characteristics and requirements of different datasets.
RQ6: What are the evaluation metrics that are set to validate the model’s performance?
6.1. Which validation methods are used to evaluate the models?
Table 15 provides an overview of the various validation methods employed by the selected studies to assess model performance. The table reveals that the most commonly used method is the holdout approach (train-test split), which is applied in several studies (e.g., PS7, PS12, PS16, PS19, PS23, PS26, PS36). This method is popular for its simplicity and ease of implementation, offering a straightforward way to gauge model performance on unseen data. Cross-validation, including specific variants such as 10-fold cross-validation used in studies PS5, PS26, and PS27, is also frequently adopted. This technique provides a more robust performance estimate by repeatedly partitioning the data, thus mitigating the risk of overfitting and ensuring a more reliable assessment.
In addition, a few studies have employed temporal validation (PS32) to account for time-dependent patterns in the data, which is particularly relevant in scenarios where the temporal aspect is critical for predicting outcomes. External validation (PS4) further reinforces the generalizability of the models by testing them on completely independent datasets. Some studies have used case-control sampling (PS32) and stratified sampling (PS12) to ensure that the validation process maintains the inherent structure and distribution of the data.
Notably, a significant number of studies did not specify the validation method used (as indicated by the extensive list of PS# where the method is not specified). This lack of detail may point to challenges in reporting standards or variability in experimental setups across different research works.
Overall, the validation strategies documented in Table 15 illustrate a range of approaches—from simple holdout methods to more rigorous cross-validation techniques—underscoring the importance of carefully selecting and clearly reporting validation methods to ensure that model performance is accurately and reliably assessed.
6.2. Which performance matrices have been used most?
Table 16 categorizes the various performance metrics used across the selected studies to evaluate lung cancer prediction models. Among these, accuracy remains the most widely adopted metric (PS8, PS21, PS24, PS25, PS26, PS30, PS13, PS3, PS19, PS20, PS31, PS22, PS18, PS29, PS36, PS38, PS33). This metric provides a straightforward measure of overall model correctness but can be misleading in imbalanced datasets where one class dominates.
To address this limitation, AUC/ROC (Area Under the Receiver Operating Characteristic Curve) is frequently reported (PS21, PS24, PS26, PS30, PS13, PS20, PS31, PS12, PS23, PS14, PS9, PS5, PS4, PS22, PS11, PS38, PS1). This metric is particularly useful for assessing model discrimination capabilities, as it evaluates the trade-off between sensitivity and specificity across different classification thresholds.
Sensitivity (Recall/True Positive Rate) and Specificity (True Negative Rate) are also extensively used (PS8, PS21, PS24, PS26, PS30, PS13, PS3, PS19, PS20, PS31, PS12, PS23, PS11, PS18, PS36, PS37, PS33 for Sensitivity; PS8, PS21, PS24, PS26, PS13, PS3, PS19, PS20, PS23, PS14, PS11, PS18, PS37, PS38, PS33 for Specificity). These metrics provide more granular insights into the model’s ability to correctly identify positive and negative cases, which is particularly important in medical applications where false negatives can have severe consequences.
Precision (Positive Predictive Value) and F1-Score are commonly used to balance false positives and false negatives (PS26, PS30, PS13, PS20, PS22, PS12, PS23, PS14, PS32, PS11, PS38, PS39, PS33 for Precision; PS8, PS26, PS13, PS20, PS22, PS23, PS32, PS38, PS33, PS39 for F1-Score). The F1-score is particularly useful in imbalanced datasets as it considers both precision and recall.
For survival analysis models, the C-index (Concordance Index) is often employed (PS21, PS13, PS15, PS17), as it measures the model’s ability to rank survival times correctly. Additionally, calibration metrics, such as calibration curves and Brier scores, have been used to assess how well predicted probabilities align with actual outcomes (PS13, PS23, PS16). Hazard Ratios (HR) (PS10, PS28, PS15) are another survival-specific metric that helps in understanding the relative risk between groups.
Other specialized metrics include Matthews Correlation Coefficient (MCC) (PS20, PS19, PS23), Negative Predictive Value (NPV) (PS20, PS23, PS14, PS11, PS32), Mean Absolute Error (MAE) and Root Mean Square Error (RMSE) (PS7, PS27, PS18, PS42) for regression models, and survival-specific metrics like Kaplan-Meier curves and time-dependent AUROC (PS10, PS15, PS16).
Beyond these standard metrics, some studies have reported domain-specific measures, such as mean Average Precision (mAP) (PS34), Judgment Ratio (PS29), Volume Doubling Time (VDT) (PS42), and class-specific sensitivity/specificity (PS37), reflecting the unique challenges in evaluating lung cancer prediction models.
Overall, the selection of evaluation metrics varies depending on the study’s goals, with a combination of traditional classification metrics, survival-specific measures, and specialized domain-specific metrics providing a comprehensive assessment of model performance.
RQ7: What feature selection and dimensionality reduction techniques are used to impact the performance of the models?
Feature selection and dimensionality reduction play a crucial role in improving the performance of predictive models by eliminating irrelevant or redundant features, thereby enhancing computational efficiency and generalizability. The selected studies employ a diverse range of techniques to refine feature sets, categorized primarily into filter methods, wrapper methods, embedded methods, clinical/expert-driven selection, statistical/univariate analysis, meta-heuristic approaches, and other techniques.
Filter Methods, which independently assess feature importance based on statistical measures, are commonly used. Techniques such as ANOVA F-value (PS12), Mutual Information (PS31), Spearman’s rank correlation (PS13), and Gain Ratio (PS22) help identify the most informative features without considering the model’s impact. These methods are computationally efficient and scalable but may not capture complex feature interactions.
Wrapper Methods rely on iterative model training to evaluate feature subsets, often leading to more optimal selections at the cost of increased computational expense. LASSO regression (PS24, PS41) and Recursive Feature Elimination (RFE) (PS12, PS39) are widely used, with RFE iteratively removing the least important features based on model performance. These methods are particularly effective for high-dimensional datasets but require careful tuning to avoid overfitting.
Embedded Methods integrate feature selection directly into the learning process, making them computationally efficient while maintaining strong predictive power. Feature importance scores from XGBoost and Random Forest (PS8, PS22, PS28, PS33) and SVM kernel coefficients (PS20) are frequently utilized. Additionally, more specialized embedded techniques like Correlation-Based Feature Selection (CFS), ReliefF, and Cuckoo Search Optimization (CSO) (PS39) have been explored.
Clinical/Expert-Driven Feature Selection ensures that selected variables are relevant to domain knowledge. Studies employ clinical relevance assessment (PS19), expert-guided grouping (PS32), and clinical experience-based selection (PS21, PS16). These methods enhance interpretability and reliability but may be limited by subjective bias.
Statistical and Univariate Analysis approaches, including logistic regression-based feature selection (PS24), Cochran-Mantel-Haenszel test (PS28), and multivariate analysis (PS23), help in identifying significant predictors through hypothesis testing. These methods are commonly used in conjunction with other selection techniques for robustness.
Meta-Heuristic and Optimization-Based Methods leverage nature-inspired algorithms to explore feature subsets efficiently. The Squirrel Search Algorithm (SSA) (PS7), Genetic Algorithm (GA), and Cuckoo Search (PS39) are examples of heuristic techniques applied to optimize feature selection. While these approaches can provide highly optimized solutions, they are computationally intensive and require fine-tuning.
Other notable methods include Backward Stepwise Selection (PS14), which iteratively removes non-significant predictors, and AIC-Based Selection (PS17), which minimizes model complexity while maintaining explanatory power.
Despite the variety of feature selection techniques applied, several studies (PS10, PS25, PS15, PS27, PS29, PS9, PS35, PS36, PS40) do not explicitly specify their approach, indicating potential gaps in feature engineering documentation. The diversity of methods highlights the trade-offs between computational cost, model interpretability, and predictive performance, underscoring the need for tailored selection strategies based on dataset characteristics and modeling objectives.
Table 17.
Feature Selection Techniques Used in Studies.
| Technique Category | Methods | PS# |
|---|---|---|
| Filter Methods | ANOVA F-value, Mutual Information, Spearman’s rank correlation, Gain Ratio | PS12 (ANOVA), PS31 (Mutual Information), PS13 (Spearman), PS22 (Gain Ratio) |
| Wrapper Methods | LASSO regression, Recursive Feature Elimination (RFE) | PS24 (LASSO), PS12 (RFE), PS39 (RFE), PS41 (LASSO) |
| Embedded Methods | XGBoost/RF feature importance, SVM kernel coefficients | PS8 (XGB/RF), PS20 (SVM), PS28 (XGBoost), PS22 (RF), PS33 (ExtraTree), PS39 (CFS, ReliefF, CSO) |
| Clinical/Expert-Driven | Clinical relevance, expert-guided grouping | PS21 (clinical experience), PS19 (clinical relevance), PS32 (clinical-guided mapping), PS16 |
| Statistical/Univariate | Univariate analysis (e.g., logistic regression, Cochran-Mantel-Haenszel) | PS28 (univariate), PS24 (multivariate logistic regression), PS23 (multivariate analysis) |
| Meta-Heuristic/Optimization | Squirrel Search Algorithm (SSA), Genetic Algorithm (GA), Cuckoo Search | PS7 (SSA), PS39 (GA, Cuckoo Search) |
| Other | Backward stepwise selection, AIC-based selection | PS14 (backward stepwise), PS17 (AIC) |
| Not Specified | – | PS10, PS25, PS15, PS27, PS29, PS9, PS35, PS36, PS40 |
Dimensionality reduction is essential in machine learning as it converts high-dimensional data into a more manageable format while retaining important information. Table 18 summarizes the dimensionality reduction methods used in the selected studies to evaluate model performance. The reviewed studies employ various techniques categorized into linear methods, non-linear methods, regularization, encoding/scaling, attention-based methods, feature grouping, autoencoders, and domain-specific approaches. Linear Methods reduce the complexity of high-dimensional data by mapping it onto a lower-dimensional space while preserving key variance. Principal Component Analysis (PCA) (PS33, PS37, PS39, PS1) is a commonly used approach that transforms data into a set of orthogonal components ordered by the amount of variance they capture. By minimizing redundancy, PCA improves computational efficiency and retains the most relevant features, making it a valuable tool for dimensionality reduction across various domains. Non-linear methods are effective for handling complex feature interactions that linear techniques may overlook, making them valuable for high-dimensional datasets. t-Distributed Stochastic Neighbor Embedding (t-SNE) (PS11, PS37) is a popular technique that reduces dimensionality while preserving local data structures. It is primarily used for visualization but can also support feature reduction by uncovering patterns and clusters. Regularization-based methods incorporate feature selection into the learning process by applying penalties to the model’s complexity. LASSO (Least Absolute Shrinkage and Selection Operator) (PS24, PS31) is a popular technique that enforces sparsity by penalizing the coefficients of less important features, thereby reducing dimensionality while preserving predictive accuracy. Encoding and Scaling methods transform categorical and numerical data into standardized forms, improving model performance and convergence. Techniques like one-hot encoding and z-score (PS2) are commonly used to preprocess the features. Additionally, robust scaling (PS12) and min-max scaling (PS36) have also been explored. Attention and Transformer-Based Methods use attention mechanisms to prioritize relevant features. Position embeddings (PS32) preserve spatial relationships, while masking (PS2) handles missing data. CBAM (Convolutional Block Attention Module) (PS34) improves feature selection by focusing on key features. These methods are commonly applied in transformer models for sequential data. Feature Grouping (PS32, PS28) reduces dimensionality by aggregating related features based on clinical or hierarchical relevance. For example, Read codes are grouped into 450 categories, reducing raw features from 33k to 118. This method simplifies high-dimensional data but relies on domain knowledge for effective grouping. Variational Autoencoders (VAE) (PS38) learn compressed representations by encoding input data into a lower-dimensional latent space and reconstructing it. This reduces dimensionality while preserving key variations, making them effective for tasks like image processing and unsupervised learning. Domain-specific dimensionality Reduction techniques refine feature sets for specific domains, such as medical imaging. Methods like image normalization (PS31), Hounsfield unit scaling (PS42), and ablation studies (PS42) help preprocess and enhance data by resizing, normalizing, and removing features, improving model performance and interpretability. Although, there have been used variety of dimensionality reduction techniques, several studies (PS8, PS21, PS26, PS30, PS10, PS3, PS19, PS20, PS23, PS15, PS18, PS29, PS5, PS6, PS4, PS35, PS40) do not explicitly mention dimensionality reduction methods, highlighting potential gaps in feature engineering documentation.
The analysis reveals notable patterns in method selection across prediction tasks. For diagnosis prediction, clinical/expert-driven feature selection was predominant, reflecting the need for clinically interpretable models. In contrast, risk prediction models favored statistical and filter methods suitable for epidemiological datasets, while survival prediction utilized embedded methods compatible with time-to-event data. The substantial number of studies (approximately 30%) that did not specify their feature engineering approach represents a significant reproducibility concern in the literature.
RQ8: What ensemble techniques are performed to boost the performance over the traditional ML models?
Ensemble learning techniques are widely employed to improve the predictive accuracy and robustness of traditional machine learning models. By combining multiple classifiers, ensemble methods help mitigate individual model weaknesses, reduce variance, and enhance generalization.
The relative frequency of different ensemble techniques used across the studies is summarized in Figure 4. The graph clearly shows that XGBoost is the most predominantly employed ensemble method, underscoring its reputation for high performance and efficiency in the domain. Random Forest also demonstrates significant adoption, reflecting its robustness and effectiveness as a go-to bagging algorithm. Other boosting variants like AdaBoost and LightGBM see moderate but important usage. In contrast, more complex techniques such as Stacking, Voting, and Hybrid Models are less frequently applied, likely due to their increased computational complexity and implementation overhead, though they offer unique performance advantages as discussed in the subsequent sections. This distribution highlights a strong preference for powerful, yet relatively straightforward, boosting and bagging algorithms in the current literature on lung cancer prediction.
The studies listed in Table 19 employ various ensemble methods, including bagging, boosting, stacking, and hybrid models, to enhance lung cancer prediction. Bagging-based approaches such as Random Forest (PS8, PS24, PS13, PS3, PS12, PS23, PS22, PS33, PS37) are among the most frequently applied ensemble techniques. Random Forest, which aggregates predictions from multiple decision trees, is particularly effective in handling high-dimensional data and reducing overfitting. Similarly, Rotation Forest (PS22), a variant of bagging that applies feature transformation to subsets of data before training individual classifiers, is also explored. Boosting methods play a significant role in improving weak learners through iterative refinement. XGBoost (PS24, PS26, PS30, PS13, PS28, PS23, PS4, PS33, PS40) is one of the most commonly used gradient boosting algorithms, known for its efficiency and high predictive power. Extreme Gradient Boosting (PS24, PS40), an advanced variant of XGBoost, further enhances performance by optimizing computational speed and handling missing values more effectively. Other boosting techniques such as AdaBoost (PS26, PS22) and LightGBM (PS13) have also been utilized, offering alternative approaches to improve weak learners through weighted resampling. Stacking and hybrid ensemble models provide an additional layer of performance enhancement. Stacking (PS41) combines multiple base learners by training a meta-model on their predictions, thereby leveraging the strengths of diverse algorithms. Hybrid models such as ConvXGB (PS36), which integrates Convolutional Neural Networks (CNN) with XGBoost, and DT-SVM (PS39), which combines Decision Trees and Support Vector Machines, demonstrate the potential of deep learning and classical ML fusion. Voting and weighted combination strategies are also explored. A Voting Classifier (PS26, Ensemble 2) aggregates predictions from different models using either hard or soft voting mechanisms. Additionally, weighted averaging methods such as Late Fusion (PS31), Meta-model fusion (PS16), and Custom Ensemble techniques (PS27, PS41) offer alternative ways to optimize prediction by assigning different importance levels to individual classifiers.
Ensemble technique selection demonstrated clear task-dependent patterns. For diagnosis prediction, hybrid models like ConvXGB (PS36) that combine deep learning with traditional ensembles showed particular promise in han- dling complex feature interactions. Risk prediction models heavily favored XGBoost and Random Forest for their interpretability and robustness with traditional risk factors. Survival prediction uniquely employed meta-model approaches (PS16) that could handle censored data and temporal patterns.
The diverse range of ensemble approaches underscores their critical role in boosting predictive performance over traditional machine learning models. While bagging methods like Random Forest ensure robustness, boosting techniques such as XGBoost and AdaBoost provide better generalization. Meanwhile, hybrid and stacking models further refine accuracy by intelligently integrating multiple learning paradigms. These findings highlight the importance of selecting ensemble strategies tailored to specific dataset characteristics and application needs.
RQ9: What are techniques that are used to interpret the results of the models?
Interpreting machine learning models is crucial for validating their decision-making processes, improving transparency, and ensuring reliability in high-stakes applications such as healthcare. Various techniques are employed to explain model predictions, ranging from feature importance methods to statistical analysis and visualization tools.
The distribution of interpretation techniques, as shown in Figure 5, reveals a clear preference for post-hoc explanation methods over inherently interpretable models. Feature Importance (29%) and Visualization Tools (24%) together account for over half of all techniques used, underscoring the field’s reliance on methods that explain complex, high-performing models after they have been trained. The significant use of Model-Agnostic (10%) and Statistical Analysis (12%) methods further reinforces this trend, highlighting the need for flexible tools that can be applied across different model architectures and provide statistical validation. In contrast, inherently Interpretable Models themselves are employed in only 2% of cases, suggesting a trade-off where practitioners often prioritize predictive performance and then use post-hoc methods to instill trust. The remaining techniques, including Sensitivity Analysis, Attention Mechanisms, Cluster Analysis, and Example-Based Localization, while each representing a smaller fraction, are critical for specific data types (e.g., images, temporal data) and provide nuanced, complementary insights into model behavior.
Feature importance analysis is widely used to determine which variables most influence the model’s predictions. Methods such as SHAP (Shapley Additive Explanations), LIME (Local Interpretable Model-agnostic Explanations), and Permutation Importance are frequently applied (PS8, PS12, PS23, PS31, PS33, PS36, PS41, PS3, PS24, PS28, PS42, PS19). Additionally, built-in feature importance rankings from tree-based models like Random Forest (RF) and XGBoost provide further interpretability.
Visualization tools help in understanding model behavior and decision boundaries. Techniques such as Nomograms, Calibration Plots, t-SNE (t-Distributed Stochastic Neighbor Embedding), Kaplan-Meier Curves, Partial Dependence Plots (PDP), and Beeswarm Plots are employed across multiple studies (PS24, PS13, PS15, PS11, PS16, PS23, PS28, PS33, PS41, PS27). These tools enable researchers to analyze variable relationships, class separability, and prediction confidence.
Model-agnostic interpretation methods, including SHAP, LIME, and PDP, are applied in studies (PS12, PS23, PS36, PS41) to provide insights independent of specific model architectures. These techniques explain individual predictions, helping users understand how small changes in input features affect outputs.
Statistical analysis techniques such as Pearson’s Correlation, Heatmap Correlation, Odds Ratios, Cox Regression, and Decision Curve Analysis are employed (PS26, PS28, PS13, PS16, PS27) to validate model relationships and assess the clinical relevance of predicted risk factors.
Sensitivity analysis techniques, including Occlusion Sensitivity and Input Perturbation, are utilized (PS11, PS19) to examine how minor changes in input values influence predictions, revealing feature stability and robustness.
Inherently interpretable models like Decision Trees, Bayesian Networks, and Logistic Regression (PS3, PS18, PS35, PS28) are also used, offering transparency by design. These models provide direct interpretability without requiring additional post-hoc explanations.
Attention mechanisms, particularly Transformer Attention Scores (PS32), help visualize where deep learning models focus during predictions, enhancing interpretability for neural networks.
Cluster analysis techniques, such as k-means applied to pathway representations (PS32), allow researchers to identify natural groupings within data, shedding light on potential subpopulations.
Example-based explanations, such as Case-Based Reasoning (PS10), aid interpretability by linking new predictions to similar past cases, making model decisions more relatable to domain experts.
Localization techniques, such as Visual Bounding Boxes (PS34), are applied to highlight specific image regions contributing to a model’s decision, making deep learning models in medical imaging more interpretable.
Overall, these diverse interpretation methods enhance trust in machine learning models by providing clear explanations of their predictions. While feature importance and statistical methods offer numerical insights, visualization and attention mechanisms provide a more intuitive understanding, making model decisions transparent and actionable for domain experts.
Table 20.
Interpretation Techniques Used in Studies.
| Category | Methods | PS# |
|---|---|---|
| Feature Importance | SHAP, LIME, Permutation Importance, RF/XGBoost Feature Importance | PS8, PS12, PS23, PS31, PS33, PS36, PS41, PS3, PS24, PS28, PS42, PS19 |
| Visualization Tools | Nomograms, Calibration Plots, t-SNE, Kaplan-Meier Curves, PDP, Beeswarm | PS24, PS13, PS15, PS11, PS16, PS23, PS28, PS33, PS41, PS27 |
| Model-Agnostic Methods | SHAP, LIME, Partial Dependence Plots (PDP) | PS12, PS23, PS36, PS41 |
| Statistical Analysis | Pearson’s/Heatmap Correlation, Odds Ratios, Cox Regression, Decision Curves | PS26, PS28, PS13, PS16, PS27 |
| Sensitivity Analysis | Occlusion Sensitivity, Input Perturbation | PS11, PS19 |
| Inherently Interpretable Models | Decision Trees, Bayesian Networks, Logistic Regression | PS3, PS18, PS35, PS28 |
| Attention Mechanisms | Transformer Attention Scores | PS32 |
| Cluster Analysis | k-means on Pathway Representations | PS32 |
| Example-Based Explanations | Case-Based Reasoning (e.g., recurrence prediction) | PS10 |
| Localization Techniques | Visual Bounding Boxes (e.g., infected regions) | PS34 |
5. Performance Analysis
The analysis of performance metrics across the 42 studies, detailed in Table 21, reveals a wide spectrum of results, with many models reporting high accuracy and AUC values. However, a critical synthesis is essential to contextualize these findings beyond the raw metrics. Performance was highly contingent on the specific prediction task. In diagnosis prediction, models frequently reported the highest performance, with several studies achieving accuracies and AUCs above 95%. For instance, Multi-class Neural Networks reached 100% accuracy (PS25), XGBoost achieved 97.5% (PS30), and an MLP with feature selection delivered 98% accuracy (PS12). Ensemble methods like XGBoost and Random Forest, along with deep learning hybrids such as the ConvXGB model (97.43% accuracy, PS36), were consistently among the top performers. In contrast, performance for risk prediction was generally more modest but clinically realistic, with AUCs typically ranging from 0.75 to 0.88, as seen in XGBoost (0.881 AUC, PS28) and other ensemble methods, reflecting the inherent challenge of forecasting future events in diverse populations. For survival analysis, the Concordance Index (C-index) was the primary metric, with values generally between 0.70 and 0.80. Machine learning models like DeepSurv (C-Index of 0.7181 in PS21 and 0.74 in PS15) demonstrated competitive performance against traditional benchmarks.
While these results, including exceptional reports such as 99.866% accuracy from Decision Trees with k-means clustering (PS18) and 99% accuracy from XGBoost with SMOTE+ENN+PCA (PS33), are impressive, they must be interpreted with caution. Such figures can be inflated by several methodological factors prevalent in the reviewed literature. The high performance in diagnostic tasks often originates from relatively small, curated datasets or employs sophisticated techniques to address class imbalance, which may not generalize to broader, more heterogeneous clinical populations. Furthermore, the scarcity of external validation means the robustness of these models on independent, unseen datasets from different institutions is largely unknown, raising significant concerns about overfitting. Potential data leakage from inadequate separation of training and test sets can also lead to optimistically biased performance estimates. Therefore, while Table 21 provides a comprehensive overview of reported capabilities, the most reliable finding of this review is not the absolute performance numbers, but the consistent trend identifying ensemble methods, particularly XGBoost and Random Forest, as the most effective and robust model types for structured data across all prediction tasks.
6. Discussion
This systematic review provides a structured synthesis of machine learning applications for lung cancer prediction using structured data, explicitly covering three distinct tasks—diagnosis, risk assessment, and survival analysis. Our findings reveal a field where the optimal ML approach is highly task-dependent, yet dominated by a consistent set of powerful techniques. Contrary to the broader AI trend, it is evident that while Deep Learning has gained popularity, traditional Machine Learning models, particularly ensemble methods, are preferred for prediction tasks on structured clinical data. Among these, Gradient Boosting (especially XGBoost) and Random Forest emerged as the most prevalent and high-performing models across the board, valued for their robustness with tabular data. Their application, however, is nuanced: for diagnosis, they are often part of complex pipelines with heavy feature engineering; for risk assessment, they provide a powerful upgrade to traditional statistical models; and for survival analysis, specialized ensembles are gaining traction against established benchmarks like Cox regression.
A key finding is the critical importance of task-specific data sources and predictive features. The SEER registry was a cornerstone for diagnosis and survival studies, while population registries (e.g., Danish, EPIC) were pivotal for risk prediction. The most influential predictive features were consistently demographics—with attributes such as Age, Gender, Race, and Smoking History being almost universal—and core clinical parameters like TNM stage and comorbidities. The widespread adoption of explainable AI (XAI) techniques, particularly SHAP and LIME, signifies a maturation in the field, enabling practitioners to understand the reasoning behind model predictions and fostering necessary trust for potential clinical integration.
However, this review also uncovers pressing methodological issues that threaten the translation of these models into clinical practice. The overwhelming reliance on holdout validation and the rarity of external validation cast doubt on the real-world robustness and generalizability of the reported high performances. Furthermore, while XAI tools are widely adopted, their use is often superficial, indicating a need for more standardized reporting and a stronger link between model interpretations and established clinical knowledge. Finally, the reliance on private datasets and frequently incomplete reporting of preprocessing and feature selection steps severely hampers reproducibility and independent verification, representing a significant barrier to scientific progress. By synthesizing evidence across the entire prediction continuum, this review not only maps the current landscape but also provides a foundational roadmap, highlighting that future work must prioritize robust validation, deepened interpretability, and enhanced reproducibility to develop truly clinically actionable ML tools.
7. Limitations and Future Works
This systematic review was designed with specific methodological boundaries to ensure a focused and in-depth analysis, and these deliberate choices both define its unique contribution and highlight pathways for future research. The strict focus on structured, tabular data was central to providing a dedicated synthesis for this data modality, enabling a precise analysis of its specific challenges and opportunities; however, this necessarily excluded innovative approaches utilizing non-tabular data like free-text clinical notes or raw medical images. Furthermore, the decision to adopt a comprehensive scope encompassing diagnosis, risk, and survival prediction provides a holistic, clinically-relevant view of the patient journey. We contend that this inclusive approach is a strength that offers a unified perspective absent from more narrowly focused reviews, even if it broadens the scope beyond a strict definition of "early prediction." Finally, while the search strategy was rigorous, the rapid evolution of the field and the focus on peer-reviewed literature mean some recent or preliminary work may not have been captured.
The synthesis conducted within these boundaries has clearly delineated several critical priorities for the field. The most pressing need is a paradigm shift towards robustness and reproducibility, necessitating the standard adoption of external validation and the creation of public benchmark datasets to overcome the current overreliance on private data and internal validation, which severely limits clinical credibility. Subsequently, research must deepen its commitment to clinical utility by moving beyond the routine application of explainable AI tools towards developing standardized, clinically-grounded interpretation frameworks and conducting real-world feasibility studies. From a technical standpoint, there is significant, untapped potential for architectural innovation beyond the dominant ensemble models, particularly in exploring advanced strategies like stacking and blending or pioneering hybrid architectures that fuse different learning paradigms. Ultimately, by addressing these priorities and building upon this foundational review through the integration of multi-modal data and cross-disciplinary applications, the field can bridge the gap between technical performance and genuine clinical impact in precision oncology.
8. Conclusion
This systematic review has synthesized the landscape of machine learning applications for lung cancer prediction using structured clinical data, comprehensively addressing diagnosis, risk assessment, and survival analysis. Through a rigorous analysis of 42 studies, our task-oriented synthesis reveals that ensemble methods, particularly XGBoost and Random Forest, are the most effective and prevalent algorithms across all prediction tasks. Their performance, however, is profoundly shaped by the specific clinical objective and the corresponding dataset, with key predictors consistently being demographics like age and smoking history, and core clinical parameters such as tumor stage. Despite the field reporting impressive performance metrics, this review uncovers a critical impediment to clinical translation: a pervasive lack of external validation and standardized reporting, which casts doubt on the real-world robustness of these models. Furthermore, while explainability tools like SHAP and LIME are widely adopted, their application requires deeper clinical integration. By mapping the state-of-the-art and clearly delineating these methodological gaps, this review provides a foundational roadmap for developing transparent, reproducible, and clinically actionable ML tools. Addressing these challenges is paramount for the research community to truly advance precision oncology and improve patient outcomes in lung cancer.
Author Contributions: Towhidul Islam
Designed the review protocol, generated search string, performed search, data extraction, synthesis, and led manuscript writing., Writing – original draft, Writing – review & editing. Safa Asgar: Assisted in study selection, data extraction, preparation of tables/figures, and manuscript editing, Writing – review & editing. Sajjad Mahmood: Supervision, methodological guidance, and critical revision of the manuscript.
Conflicts of Interest
The authors declare that they have no known competing financial interests or personal relationships that could have appeared to influence the work reported in this paper.
Appendix A. Example Appendix Section
Table A1.
Selected Primary Studies.
| PS# | Title | Reference |
|---|---|---|
| PS1 | Sex and Smoking Status Effects on the Early Detection of Early Lung Cancer in High-Risk Smokers Using an Electronic Nose | McWilliams et al. (2015) |
| PS2 | A deep learning approach for overall survival prediction in lung cancer with missing values | Caruso et al. (2024) |
| PS3 | A new tool to predict lung cancer based on risk factors | Ahmad and Mayya (2020) |
| PS4 | Benign-malignant classification of pulmonary nodules by low-dose spiral computerized tomography and clinical data with machine learning in opportunistic screening | Zheng et al. (2023) |
| PS5 | Machine learning application in personalised lung cancer recurrence and survivability prediction | Yang et al. (2022) |
| PS6 | Synergy between imputed genetic pathway and clinical information for predicting recurrence in early stage non-small cell lung cancer | Timilsina et al. (2023) |
| PS7 | A Heuristic Machine Learning-Based Optimization Technique to Predict Lung Cancer Patient Survival | Kukreja et al. (2023) |
| PS8 | A Machine Learning-Based Investigation of Gender-Specific Prognosis of Lung Cancers | Yeh et al. (2021) |
| PS9 | A Risk Model for Lung Cancer Incidence | Hoggart et al. (2012) |
| PS10 | An Artificial Intelligence-Based Tool for Data Analysis and Prognosis in Cancer Patients: Results from the Clarify Study | Torrente et al. (2022) |
| PS11 | Artificial Intelligence-Based Prediction of Lung Cancer Risk Using Nonimaging Electronic Medical Records: Deep Learning Approach | Yeh et al. (2021) |
| PS12 | Body composition radiomic features as a predictor of survival in patients with non-small cellular lung carcinoma: A multicenter retrospective study | Rozynek et al. (2024) |
| PS13 | Comparison of nomogram and machine-learning methods for predicting the survival of non-small cell lung cancer patients | Lei et al. (2022) |
| PS14 | Developing and Validating a Lung Cancer Risk Prediction Model: A Nationwide Population-Based Study | Rubin et al. (2023) |
| PS15 | Development and Validation of a Deep Learning Model for Non-Small Cell Lung Cancer Survival | She et al. (2020) |
| PS16 | Development of a "meta-model" to address missing data, predict patient-specific cancer survival and provide a foundation for clinical decision support | Baron et al. (2021) |
| PS17 | Development of a risk prediction model for lung cancer: The Japan Public Health Center-based Prospective Study | Charvat et al. (2018) |
| PS18 | Early Detection and Prevention of Cancer using Data Mining Techniques | Ramachandran et al. (2014) |
| PS19 | Exploring the efficacy of artificial neural networks in predicting lung cancer recurrence: a retrospective study based on patient records | Lorenc et al. (2023) |
| PS20 | Identification of non-small cell lung cancer with chronic obstructive pulmonary disease using clinical symptoms and routine examination: a retrospective study | Zhuan et al. (2023) |
| PS21 | Interpretable deep learning survival predictive tool for small cell lung cancer | Zhuan et al. (2023) |
| PS22 | Lung Cancer Risk Prediction with Machine Learning Models | Dritsas and Trigka (2022) |
| PS23 | Machine learning approaches for prediction of early death among lung cancer patients with bone metastases using routine clinical characteristics: An analysis of 19,887 patients | Cui et al. (2022) |
| PS24 | Machine learning predictive models and risk factors for lymph node metastasis in cell lung cancer | Wu et al. (2024) |
| PS25 | Multi-Class Neural Networks to Predict Lung Cancer | Rajan et al. (2019) |
| PS26 | Performance of machine learning algorithms for lung cancer prediction: a comparative approach | Maurya et al. (2024) |
| PS27 | Prediction of lung cancer patient survival via supervised machine learning classification techniques | Lynch et al. (2017) |
| PS28 | Prediction of the 1-Year Risk of Incident Lung Cancer: Prospective Study Using Electronic Health Records from the State of Maine | Wang et al. (2019) |
| PS29 | Prognostic models in patients with non-small cell lung cancer using artificial neural networks in comparison with logistic regression | Hanai et al. (2003) |
| PS30 | Simulation of a machine learning enabled learning health system for risk prediction using synthetic patient data | Chen and Chen (2022) |
| PS31 | Single Modality vs. Multimodality: What Works Best for Lung Cancer Screening? | Sousa et al. (2023) |
| PS32 | Transformer-based deep learning model for the diagnosis of suspected lung cancer in primary care based on electronic health record data | Wang et al. (2024) |
| PS33 | An eXplainable machine learning framework for predicting the impact of pesticide exposure in lung cancer prognosis | V.r. and S.s. (2025) |
| PS34 | Attention-guided CenterNet deep learning approach for lung cancer detection | Dawood et al. (2025) |
| PS35 | Benchmarking prognosis methods for survivability – A case study for patients with contingent primary cancers | Makond et al. (2021) |
| PS36 | DeepXplainer: An interpretable deep learning based approach for lung cancer detection using explainable artificial intelligence | Wani et al. (2024) |
| PS37 | Detection of lung cancer metastasis from blood using L-MISC nanosensor: Targeting circulating metastatic cues for improved diagnosis | Premachandran et al. (2024) |
| PS38 | Early multi-cancer detection through deep learning: An anomaly detection approach using Variational Autoencoder | Sado et al. (2024)) |
| PS39 | Effective multiple cancer disease diagnosis frameworks for improved healthcare using machine learning | Hsu et al. (2021) |
| PS40 | Lung cancer disease detection using service-oriented architectures and multivariate boosting classifier | Chandrasekar et al. (2022) |
| PS41 | Lung cancer survival period prediction and understanding: Deep learning approaches | Doppalapudi et al. (2021) |
| PS42 | Towards automatic forecasting of lung nodule diameter with tabular data and CT imaging | Ferreira et al. (2024) |
Appendix A.1
Access the supplementary data here:
References
- Ahmad S. Ahmad and Ali M. Mayya. A new tool to predict lung cancer based on risk factors. Heliyon, 6(2):e03402, February 2020. ISSN 2405-8440. [CrossRef]
- Fatimah Abdulazim Altuhaifa, Khin Than Win, and Guoxin Su. Predicting lung cancer survival based on clinical data using machine learning: A review. Comput Biol Med, 165:107338, October 2023. ISSN 1879-0534. [CrossRef]
- Peter B Bach, Michael W Kattan, Mark D Thornquist, Mark G Kris, R Cameron Tate, Matt J Barnett, L-J Hsieh, and Colin B Begg. Variations in lung cancer risk among smokers. Journal of the National Cancer Institute, 95(6):470–478, 2003.
- Jason M. Baron, Ketan Paranjape, Tara Love, Vishakha Sharma, Denise Heaney, and Matthew Prime. Development of a "meta-model" to address missing data, predict patient-specific cancer survival and provide a foundation for clinical decision support. J Am Med Inform Assoc, 28(3):605–615, March 2021. ISSN 1527-974X. [CrossRef]
- Camillo Maria Caruso, Valerio Guarrasi, Sara Ramella, and Paolo Soda. A deep learning approach for overall survival prediction in lung cancer with missing values. Computer Methods and Programs in Biomedicine, 254:108308, September 2024. ISSN 0169-2607. URL https://www.sciencedirect.com/science/article/pii/S016926072400302X. [CrossRef]
- Urmila Chandran, Jenna Reps, Robert Yang, Anil Vachani, Fabien Maldonado, and Iftekhar Kalsekar. Machine Learning and Real-World Data to Predict Lung Cancer Risk in Routine Care. Cancer Epidemiol Biomarkers Prev, 32(3):337–343, March 2023. ISSN 1538-7755. [CrossRef]
- Thaventhiran Chandrasekar, Sekar Kidambi Raju, Manikandan Ramachandran, Rizwan Patan, and Amir H. Gandomi. Lung cancer disease detection using service-oriented architectures and multivariate boosting classifier. Applied Soft Computing, 122:108820, June 2022. ISSN 1568-4946. URL https://www.sciencedirect.com/science/article/pii/S1568494622002253. [CrossRef]
- Hadrien Charvat, Shizuka Sasazuki, Taichi Shimazu, Sanjeev Budhathoki, Manami Inoue, Motoki Iwasaki, Norie Sawada, Taiki Yamaji, Shoichiro Tsugane, and JPHC Study Group. Development of a risk prediction model for lung cancer: The Japan Public Health Center-based Prospective Study. Cancer Sci, 109(3):854–862, March 2018. ISSN 1349-7006. [CrossRef]
- Anjun Chen and Drake O. Chen. Simulation of a machine learning enabled learning health system for risk prediction using synthetic patient data. Sci Rep, 12(1):17917, October 2022. ISSN 2045-2322. [CrossRef]
- Yunpeng Cui, Xuedong Shi, Shengjie Wang, Yong Qin, Bailin Wang, Xiaotong Che, and Mingxing Lei. Machine learning approaches for prediction of early death among lung cancer patients with bone metastases using routine clinical characteristics: An analysis of 19,887 patients. Front Public Health, 10:1019168, 2022. ISSN 2296-2565. [CrossRef]
- Hussain Dawood, Marriam Nawaz, Muhammad U. Ilyas, Tahira Nazir, and Ali Javed. Attention-guided CenterNet deep learning approach for lung cancer detection. Computers in Biology and Medicine, 186:109613, March 2025. ISSN 0010-4825. URL https://www.sciencedirect.com/science/article/pii/S0010482524016986. [CrossRef]
- Shreyesh Doppalapudi, Robin G. Qiu, and Youakim Badr. Lung cancer survival period prediction and understanding: Deep learning approaches. International Journal of Medical Informatics, 148:104371, April 2021. ISSN 1386-5056. URL https://www.sciencedirect.com/science/article/pii/S1386505620319079. [CrossRef]
- Elias Dritsas and Maria Trigka. Lung Cancer Risk Prediction with Machine Learning Models. Big Data and Cognitive Computing, 6(4):139, December 2022. ISSN 2504-2289. URL https://www.mdpi.com/2504-2289/6/4/139. Number: 4 Publisher: Multidisciplinary Digital Publishing Institute. [CrossRef]
- Carlos A. Ferreira, Kiran Vaidhya Venkadesh, Colin Jacobs, Miguel Coimbra, and Aurélio Campilho. Towards automatic forecasting of lung nodule diameter with tabular data and CT imaging. Biomedical Signal Processing and Control, 96:106625, October 2024. ISSN 1746-8094. URL https://www.sciencedirect.com/science/article/pii/S1746809424006839. [CrossRef]
- Taizo Hanai, Yasushi Yatabe, Yusuke Nakayama, Takashi Takahashi, Hiroyuki Honda, Tetsuya Mitsudomi, and Takeshi Kobayashi. Prognostic models in patients with non-small-cell lung cancer using artificial neural networks in comparison with logistic regression. Cancer Sci, 94(5):473–477, May 2003. ISSN 1347-9032. [CrossRef]
- Clive Hoggart, Paul Brennan, Anne Tjonneland, Ulla Vogel, Kim Overvad, Jane Nautrup Østergaard, Rudolf Kaaks, Federico Canzian, Heiner Boeing, Annika Steffen, Antonia Trichopoulou, Christina Bamia, Dimitrios Trichopoulos, Mattias Johansson, Domenico Palli, Vittorio Krogh, Rosario Tumino, Carlotta Sacerdote, Salvatore Panico, Hendriek Boshuizen, H. Bas Bueno-de Mesquita, Petra H.M. Peeters, Eiliv Lund, Inger Torhild Gram, Tonje Braaten, Laudina Rodríguez, Antonio Agudo, Emilio Sanchez-Cantalejo, Larraitz Arriola, Maria-Dolores Chirlaque, Aurelio Barricarte, Torgny Rasmuson, Kay-Tee Khaw, Nicholas Wareham, Naomi E. Allen, Elio Riboli, and Paolo Vineis. A Risk Model for Lung Cancer Incidence. Cancer Prev Res (Phila), 5(6):834–846, June 2012. ISSN 1940-6207. URL https://www.ncbi.nlm.nih.gov/pmc/articles/PMC4295118/. [CrossRef]
- Ching-Hsien Hsu, Xing Chen, Weiwei Lin, Chuntao Jiang, Youhong Zhang, Zhifeng Hao, and Yeh-Ching Chung. Effective multiple cancer disease diagnosis frameworks for improved healthcare using machine learning. Measurement, 175:109145, April 2021. ISSN 0263-2241. URL https://www.sciencedirect.com/science/article/pii/S0263224121001706. [CrossRef]
- Yah Ru Juang, Lina Ang, and Wei Jie Seow. Predictive performance of risk prediction models for lung cancer incidence in Western and Asian countries: a systematic review and meta-analysis. Sci Rep, 15(1):4259, March 2025. ISSN 2045-2322. [CrossRef]
- Hormuzd A Katki, Stephanie A Kovalchik, Christine D Berg, Li C Cheung, and Anil K Chaturvedi. Development and validation of risk models to select ever-smokers for ct lung cancer screening. JAMA, 315(21):2300–2311, 2016.
- Sonia Kukreja, Munish Sabharwal, Mohd Asif Shah, and D. S. Gill. A Heuristic Machine Learning-Based Optimization Technique to Predict Lung Cancer Patient Survival. Comput Intell Neurosci, 2023:4506488, 2023. ISSN 1687-5273. [CrossRef]
- Haike Lei, Xiaosheng Li, Wuren Ma, Na Hong, Chun Liu, Wei Zhou, Hong Zhou, Mengchun Gong, Ying Wang, Guixue Wang, and Yongzhong Wu. Comparison of nomogram and machine-learning methods for predicting the survival of non-small cell lung cancer patients. Cancer Innov, 1(2):135–145, August 2022. ISSN 2770-9183. [CrossRef]
- Andżelika Lorenc, Anna Romaszko-Wojtowicz, Łukasz Jaśkiewicz, Anna Doboszyńska, and Adam Buciński. Exploring the efficacy of artificial neural networks in predicting lung cancer recurrence: a retrospective study based on patient records. Transl Lung Cancer Res, 12(10):2083–2097, October 2023. ISSN 2218-6751. [CrossRef]
- Chip M. Lynch, Behnaz Abdollahi, Joshua D. Fuqua, Alexandra R. de Carlo, James A. Bartholomai, Rayeanne N. Balgemann, Victor H. van Berkel, and Hermann B. Frieboes. Prediction of lung cancer patient survival via supervised machine learning classification techniques. Int J Med Inform, 108:1–8, December 2017. ISSN 1872-8243. [CrossRef]
- Bunjira Makond, Kung-Jeng Wang, and Kung-Min Wang. Benchmarking prognosis methods for survivability – A case study for patients with contingent primary cancers. Computers in Biology and Medicine, 138:104888, November 2021. ISSN 0010-4825. URL https://www.sciencedirect.com/science/article/pii/S001048252100682X. [CrossRef]
- Muntasir Mamun, Afia Farjana, Miraz Al Mamun, and Md Salim Ahammed. Lung cancer prediction model using ensemble learning techniques and a systematic review analysis. In 2022 IEEE World AI IoT Congress (AIIoT), pages 187–193, June 2022. URL https://ieeexplore.ieee.org/abstract/document/9817326. [CrossRef]
- Satya Prakash Maurya, Pushpendra Singh Sisodia, Rahul Mishra, and Devesh Pratap Singh. Performance of machine learning algorithms for lung cancer prediction: a comparative approach. Sci Rep, 14(1):18562, August 2024. ISSN 2045-2322. [CrossRef]
- Annette McWilliams, Parmida Beigi, Akhila Srinidhi, Stephen Lam, and Calum E. MacAulay. Sex and Smoking Status Effects on the Early Detection of Early Lung Cancer in High-Risk Smokers Using an Electronic Nose. IEEE Trans. Biomed. Eng., 62(8):2044–2054, August 2015. ISSN 0018-9294, 1558-2531. URL http://ieeexplore.ieee.org/document/7058387/. [CrossRef]
- Matthew J Page, Joanne E McKenzie, Patrick M Bossuyt, Isabelle Boutron, Tammy C Hoffmann, Cynthia D Mulrow, Larissa Shamseer, Jennifer M Tetzlaff, Elie A Akl, Sue E Brennan, Roger Chou, Julie Glanville, Jeremy M Grimshaw, Asbjørn Hróbjartsson, Manoj M Lalu, Tianjing Li, Elizabeth W Loder, Evan Mayo-Wilson, Steve McDonald, Luke A McGuinness, Lesley A Stewart, James Thomas, Andrea C Tricco, Vivian A Welch, Penny Whiting, and David Moher. The prisma 2020 statement: an updated guideline for reporting systematic reviews. BMJ, 372:n71, 2021. [CrossRef]
- Srilakshmi Premachandran, Ashok Kumar Dhinakaran, Sunit Das, Krishnan Venkatakrishnan, Bo Tan, and Mansi Sharma. Detection of lung cancer metastasis from blood using L-MISC nanosensor: Targeting circulating metastatic cues for improved diagnosis. Biosensors and Bioelectronics, 243:115782, January 2024. ISSN 0956-5663. URL https://www.sciencedirect.com/science/article/pii/S0956566323007248. [CrossRef]
- Juliet Rani Rajan, A. Chilambu Chelvan, and J. Shiny Duela. Multi-Class Neural Networks to Predict Lung Cancer. J Med Syst, 43(7):211, May 2019. ISSN 1573-689X. [CrossRef]
- P. Ramachandran, N. Girija, and T. Bhuvaneswari. Early Detection and Prevention of Cancer using Data Mining Techniques. International Journal of Computer Applications, 97(13):48–53, July 2014. URL https://ijcaonline.org/archives/volume97/number13/17069-7492/.
- Miłosz Rozynek, Zbisław Tabor, Stanisław Kłęk, and Wadim Wojciechowski. Body composition radiomic features as a predictor of survival in patients with non-small cellular lung carcinoma: A multicenter retrospective study. Nutrition, 120:112336, April 2024. ISSN 1873-1244. [CrossRef]
- Katrine H. Rubin, Peter F. Haastrup, Anne Nicolaisen, Sören Möller, Sonja Wehberg, Sanne Rasmussen, Kirubakaran Balasubramaniam, Jens Søndergaard, and Dorte E. Jarbøl. Developing and Validating a Lung Cancer Risk Prediction Model: A Nationwide Population-Based Study. Cancers, 15(2):487, January 2023. ISSN 2072-6694. URL https://www.mdpi.com/2072-6694/15/2/487. Number: 2 Publisher: Multidisciplinary Digital Publishing Institute. [CrossRef]
- Innocent Tatchum Sado, Louis Fippo Fitime, Geraud Fokou Pelap, Claude Tinku, Gaelle Mireille Meudje, and Thomas Bouetou Bouetou. Early multi-cancer detection through deep learning: An anomaly detection approach using Variational Autoencoder. Journal of Biomedical Informatics, 160:104751, December 2024. ISSN 1532-0464. URL https://www.sciencedirect.com/science/article/pii/S1532046424001692. [CrossRef]
- Yunlang She, Zhuochen Jin, Junqi Wu, Jiajun Deng, Lei Zhang, Hang Su, Gening Jiang, Haipeng Liu, Dong Xie, Nan Cao, Yijiu Ren, and Chang Chen. Development and Validation of a Deep Learning Model for Non-Small Cell Lung Cancer Survival. JAMA Netw Open, 3(6):e205842, June 2020. ISSN 2574-3805. [CrossRef]
- Rebecca L. Siegel, Kimberly D. Miller, Nikita Sandeep Wagle, and Ahmedin Jemal. Cancer statistics, 2023. CA A Cancer J Clinicians, 73(1):17–48, January 2023. ISSN 0007-9235, 1542-4863. URL https://acsjournals.onlinelibrary.wiley.com/doi/10.3322/caac.21763. [CrossRef]
- Joana Vale Sousa, Pedro Matos, Francisco Silva, Pedro Freitas, Hélder P. Oliveira, and Tania Pereira. Single Modality vs. Multimodality: What Works Best for Lung Cancer Screening? Sensors (Basel), 23(12):5597, June 2023. ISSN 1424-8220. [CrossRef]
- Martin C Tammemägi, Hormuzd A Katki, William G Hocking, Timothy R Church, Neil Caporaso, Paul A Kvale, Anil K Chaturvedi, Gerard A Silvestri, Thomas L Riley, John Commins, et al. Selection criteria for lung-cancer screening. New England Journal of Medicine, 368(8):728–736, 2013.
- Mohan Timilsina, Dirk Fey, Samuele Buosi, Adrianna Janik, Luca Costabello, Enric Carcereny, Delvys Rodrıguez Abreu, Manuel Cobo, Rafael López Castro, Reyes Bernabé, Pasquale Minervini, Maria Torrente, Mariano Provencio, and Vít Nováček. Synergy between imputed genetic pathway and clinical information for predicting recurrence in early stage non-small cell lung cancer. Journal of Biomedical Informatics, 144:104424, August 2023. ISSN 1532-0464. URL https://www.sciencedirect.com/science/article/pii/S1532046423001454. [CrossRef]
- María Torrente, Pedro A. Sousa, Roberto Hernández, Mariola Blanco, Virginia Calvo, Ana Collazo, Gracinda R. Guerreiro, Beatriz Núñez, Joao Pimentao, Juan Cristóbal Sánchez, Manuel Campos, Luca Costabello, Vit Novacek, Ernestina Menasalvas, María Esther Vidal, and Mariano Provencio. An Artificial Intelligence-Based Tool for Data Analysis and Prognosis in Cancer Patients: Results from the Clarify Study. Cancers (Basel), 14(16):4041, August 2022. ISSN 2072-6694. [CrossRef]
- Nitha V.r. and Vinod Chandra S.s. An eXplainable machine learning framework for predicting the impact of pesticide exposure in lung cancer prognosis. Journal of Computational Science, 84:102476, January 2025. ISSN 1877-7503. URL https://www.sciencedirect.com/science/article/pii/S1877750324002692. [CrossRef]
- Lan Wang, Yonghua Yin, Ben Glampson, Robert Peach, Mauricio Barahona, Brendan C. Delaney, and Erik K. Mayer. Transformer-based deep learning model for the diagnosis of suspected lung cancer in primary care based on electronic health record data. EBioMedicine, 110:105442, December 2024. ISSN 2352-3964. [CrossRef]
- Xiaofang Wang, Yan Zhang, Shiying Hao, Le Zheng, Jiayu Liao, Chengyin Ye, Minjie Xia, Oliver Wang, Modi Liu, Ching Ho Weng, Son Q. Duong, Bo Jin, Shaun T. Alfreds, Frank Stearns, Laura Kanov, Karl G. Sylvester, Eric Widen, Doff B. McElhinney, and Xuefeng B. Ling. Prediction of the 1-Year Risk of Incident Lung Cancer: Prospective Study Using Electronic Health Records from the State of Maine. J Med Internet Res, 21(5):e13260, May 2019. ISSN 1438-8871. [CrossRef]
- Niyaz Ahmad Wani, Ravinder Kumar, and Jatin Bedi. DeepXplainer: An interpretable deep learning based approach for lung cancer detection using explainable artificial intelligence. Computer Methods and Programs in Biomedicine, 243:107879, January 2024. ISSN 0169-2607. URL https://www.sciencedirect.com/science/article/pii/S016926072300545X. [CrossRef]
- Bo Wu, Yihui Zhu, Zhuozheng Hu, Jiajun Wu, Weijun Zhou, Maoyan Si, Xiying Cao, Zhicheng Wu, and Wenxiong Zhang. Machine learning predictive models and risk factors for lymph node metastasis in non-small cell lung cancer. BMC Pulm Med, 24(1):526, October 2024. ISSN 1471-2466. [CrossRef]
- Yang Yang, Li Xu, Liangdong Sun, Peng Zhang, and Suzanne S. Farid. Machine learning application in personalised lung cancer recurrence and survivability prediction. Computational and Structural Biotechnology Journal, 20:1811–1820, January 2022. ISSN 2001-0370. URL https://www.sciencedirect.com/science/article/pii/S2001037022001106. [CrossRef]
- Marvin Chia-Han Yeh, Yu-Hsiang Wang, Hsuan-Chia Yang, Kuan-Jen Bai, Hsiao-Han Wang, and Yu-Chuan Jack Li. Artificial Intelligence-Based Prediction of Lung Cancer Risk Using Nonimaging Electronic Medical Records: Deep Learning Approach. J Med Internet Res, 23(8):e26256, August 2021. ISSN 1438-8871. [CrossRef]
- Yansong Zheng, Jing Dong, Xue Yang, Ping Shuai, Yongli Li, Hailin Li, Shengyong Dong, Yan Gong, Miao Liu, and Qiang Zeng. Benign-malignant classification of pulmonary nodules by low-dose spiral computerized tomography and clinical data with machine learning in opportunistic screening. Cancer Medicine, 12(11):12050–12064, 2023. ISSN 2045-7634. URL https://onlinelibrary.wiley.com/doi/abs/10.1002/cam4.5886. _eprint: https://onlinelibrary.wiley.com/doi/pdf/10.1002/cam4.5886. [CrossRef]
- Bing Zhuan, Hong-Hong Ma, Bo-Chao Zhang, Ping Li, Xi Wang, Qun Yuan, Zhao Yang, and Jun Xie. Identification of non-small cell lung cancer with chronic obstructive pulmonary disease using clinical symptoms and routine examination: a retrospective study. Front Oncol, 13:1158948, July 2023. ISSN 2234-943X. URL https://www.ncbi.nlm.nih.gov/pmc/articles/PMC10419203/. [CrossRef]
Figure 2.
Distribution of papers over the years.
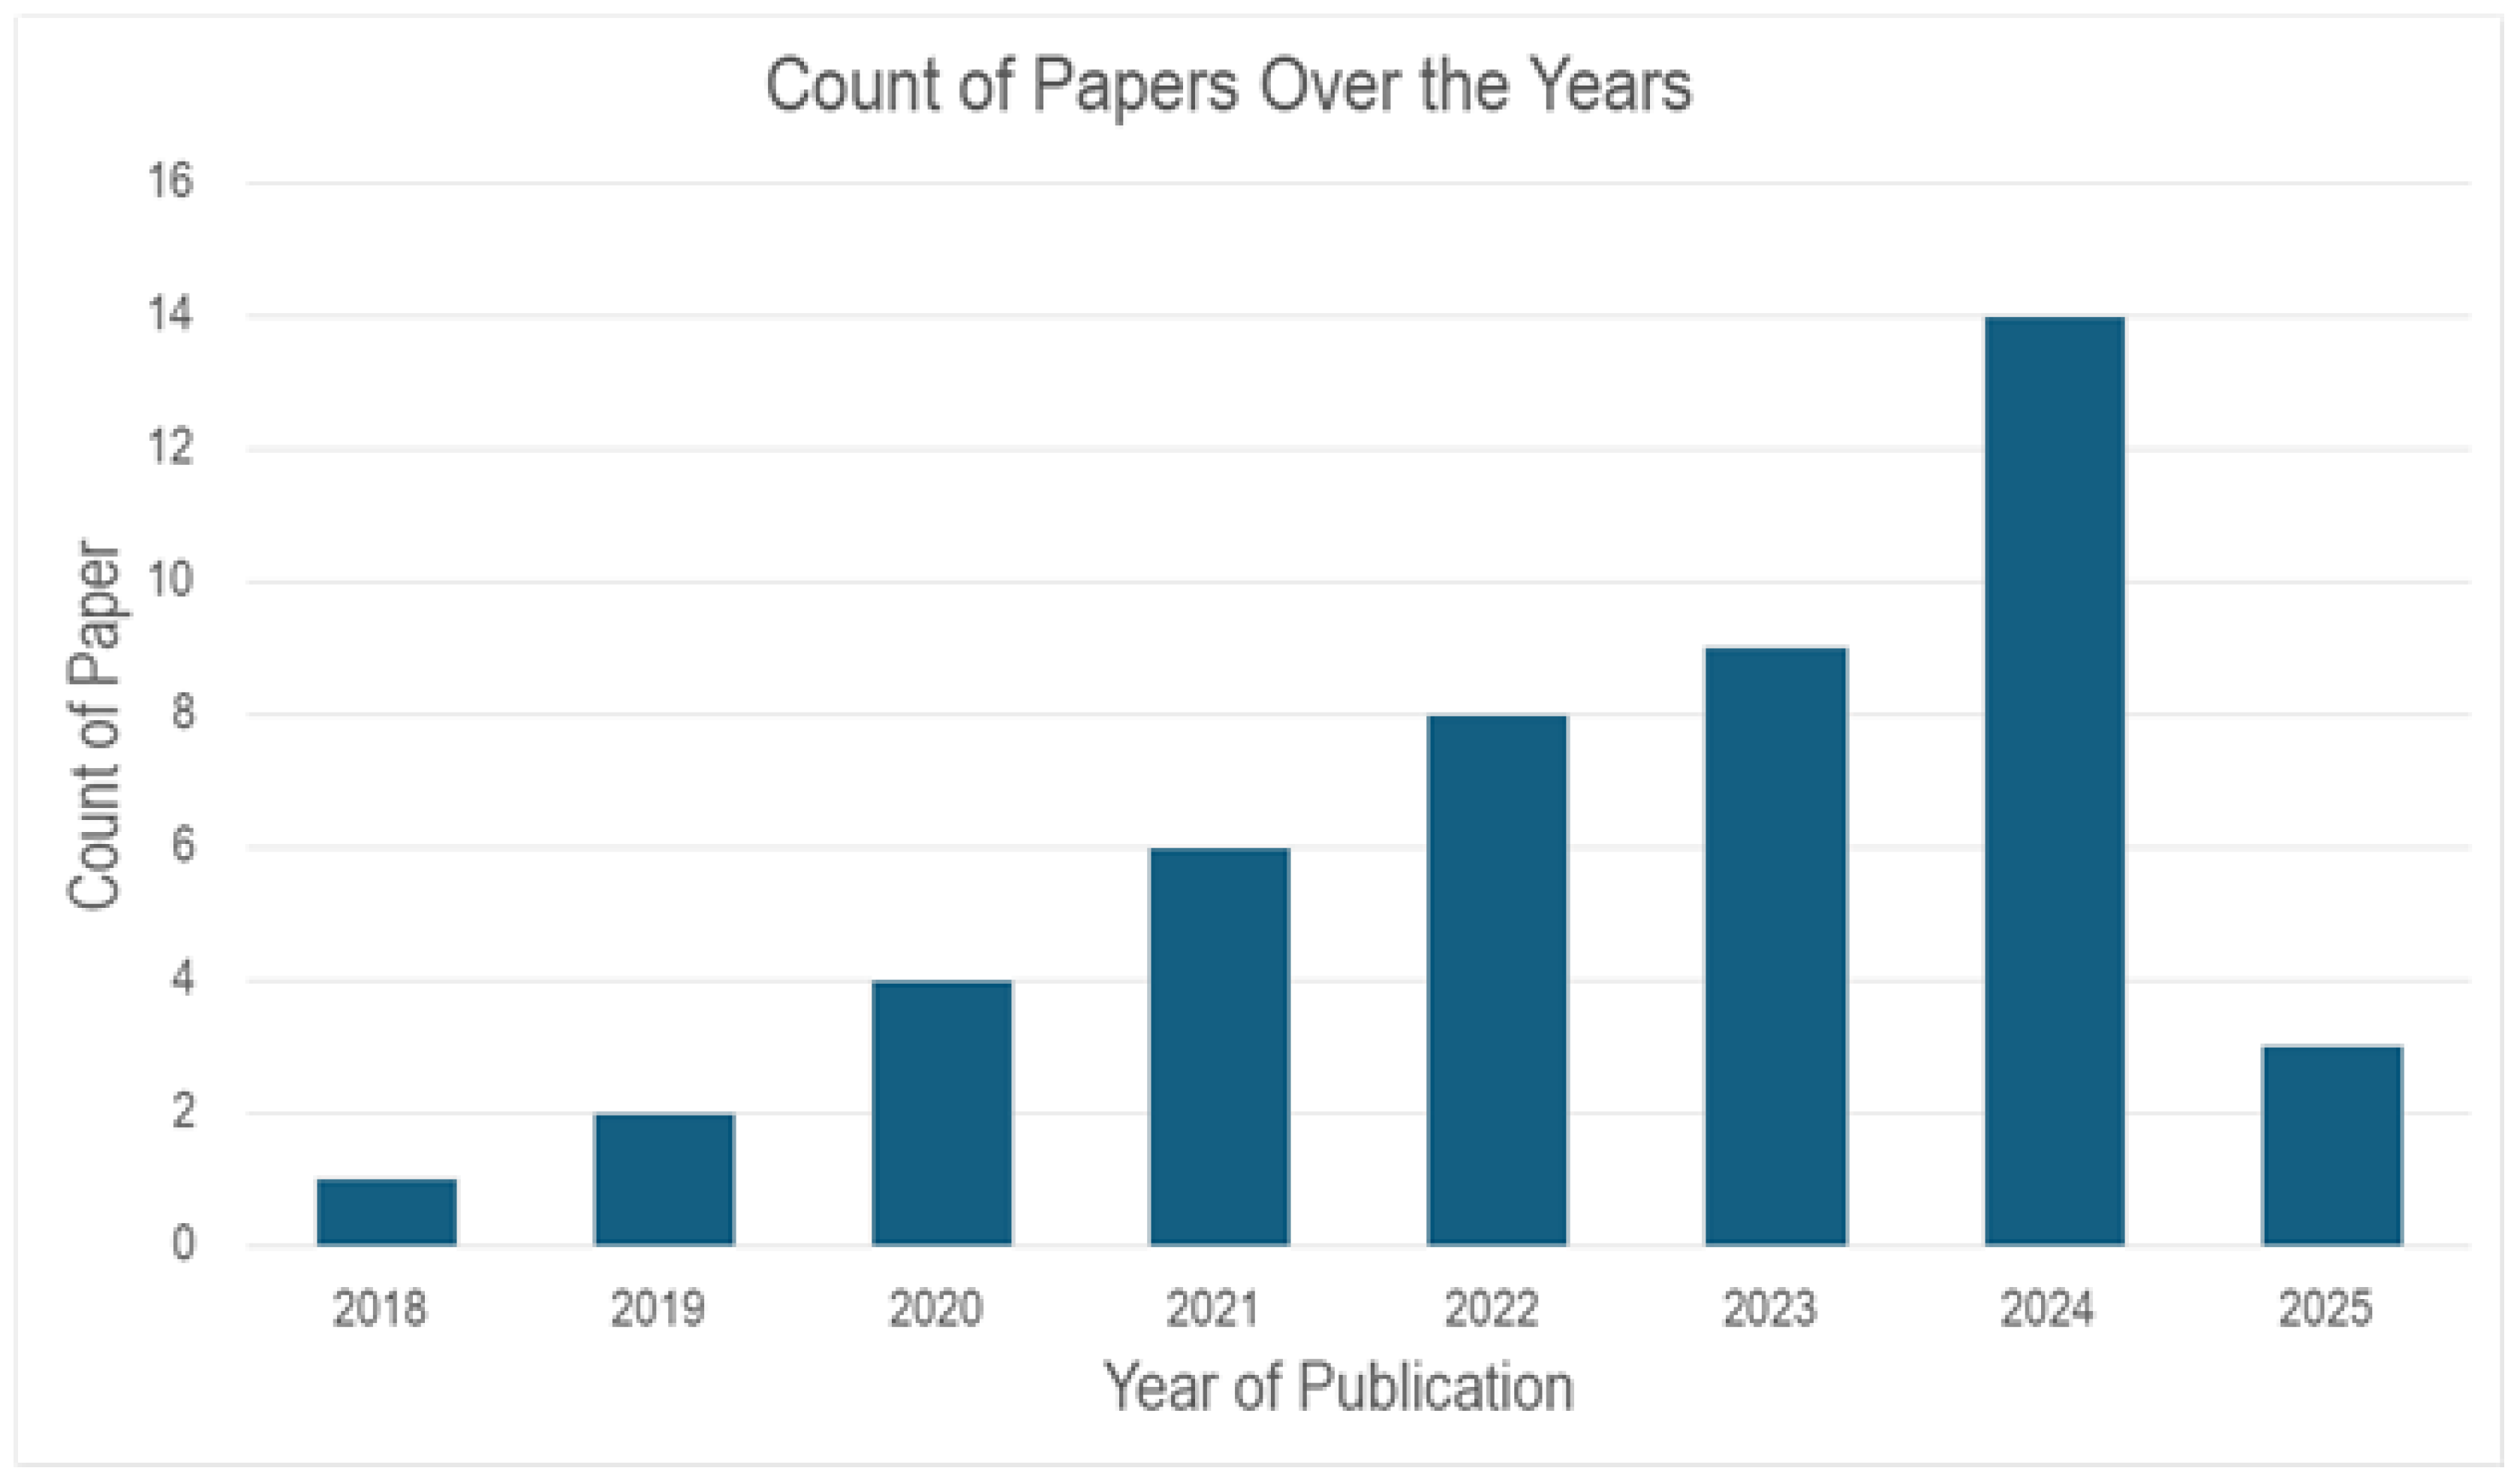
Figure 3.
Overall Distribution of Machine Learning Models.
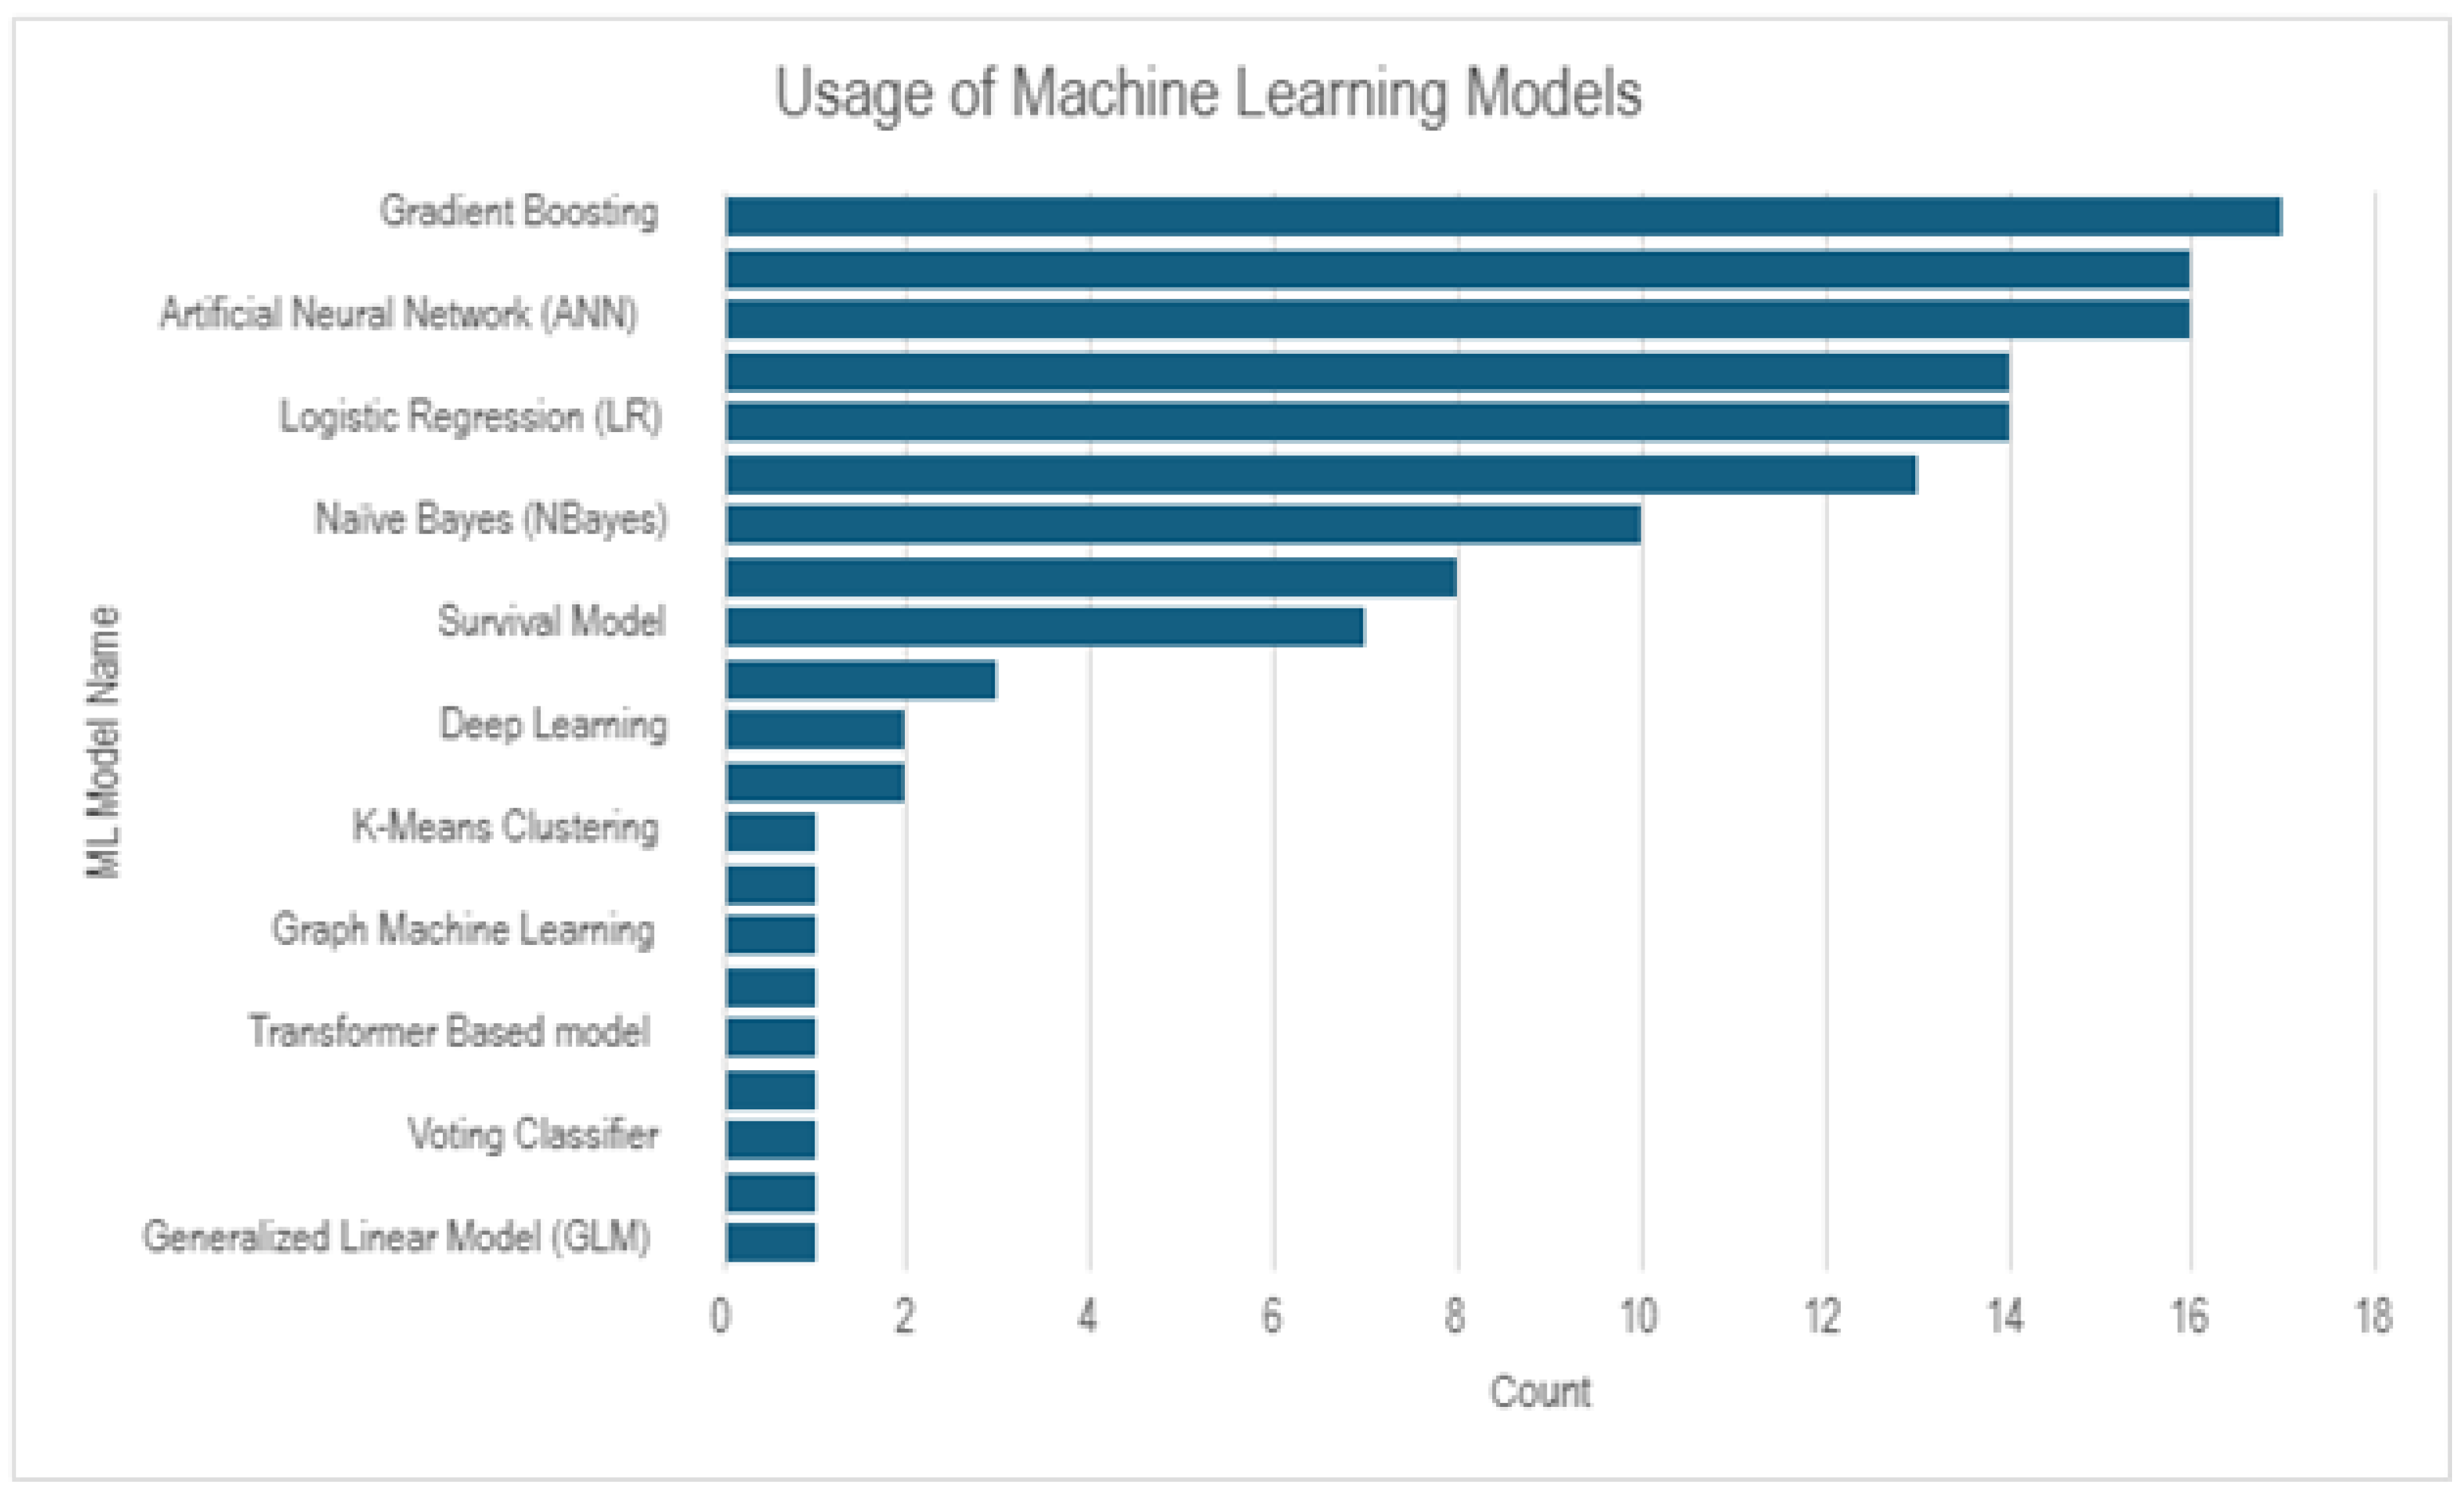
Figure 4.
Frequencies of Ensemble methods used in the selected studies
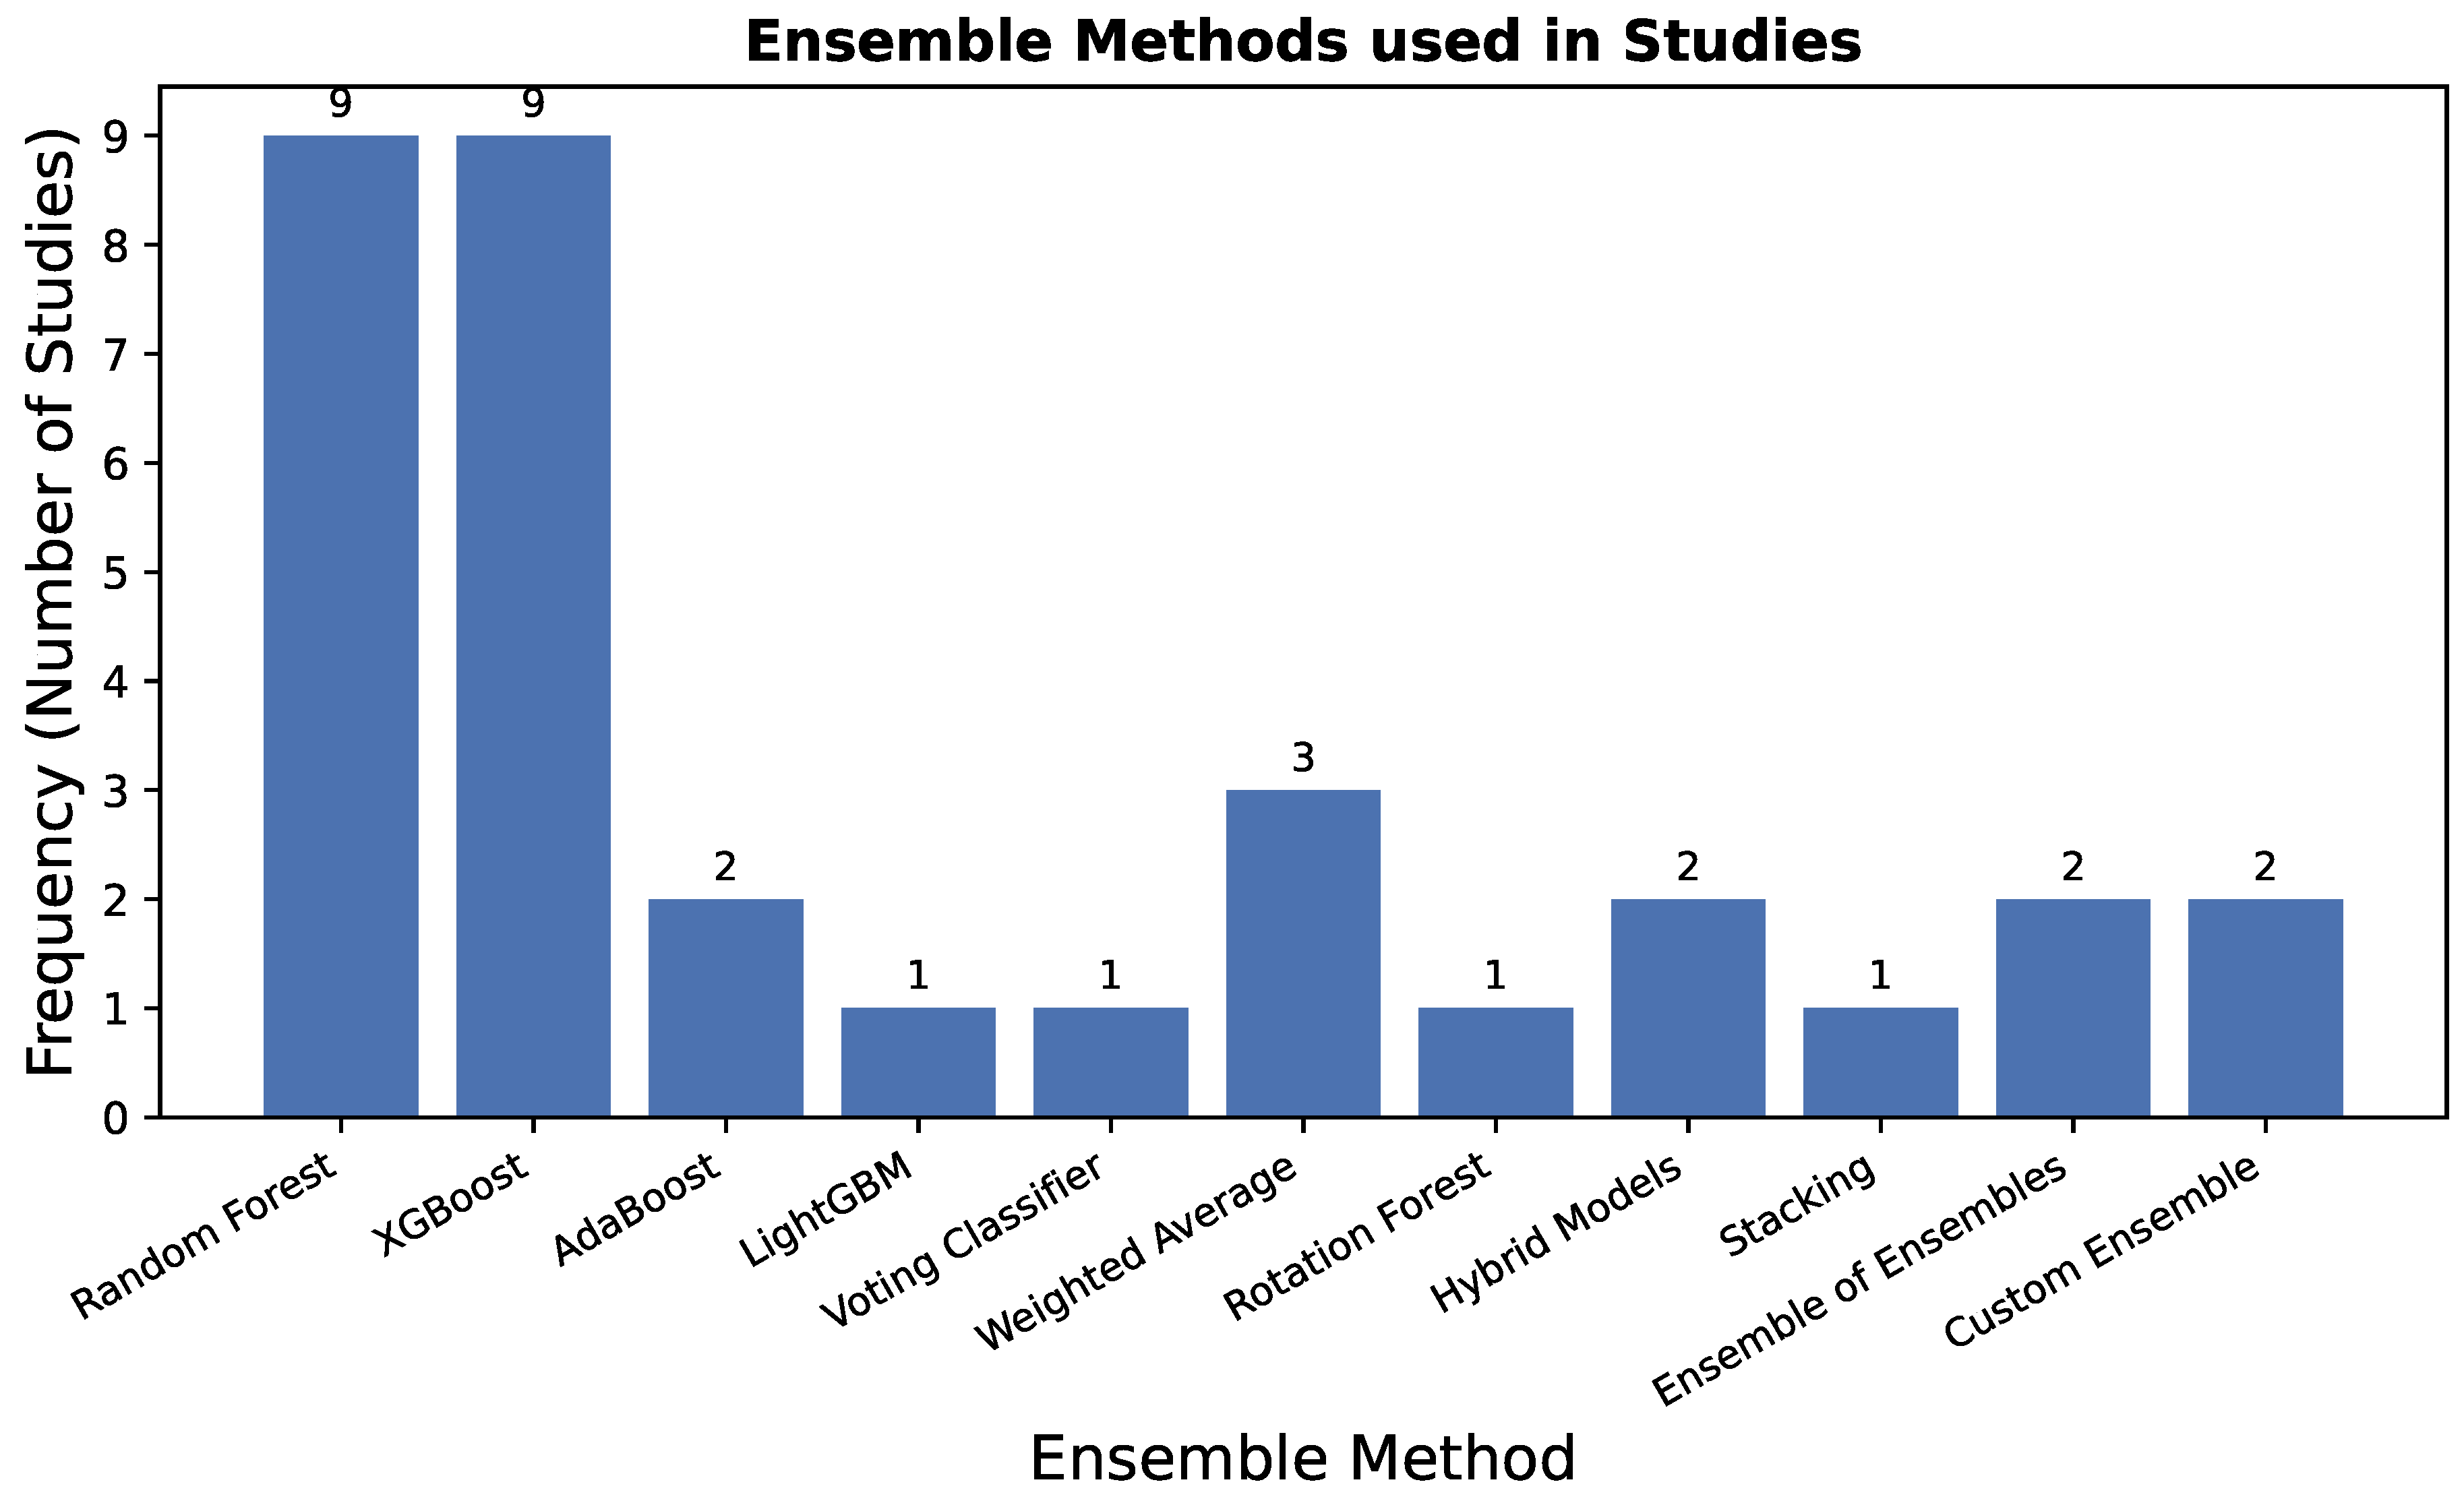
Figure 5.
Frequencies of Interpretable Techniques used in the selected studies.
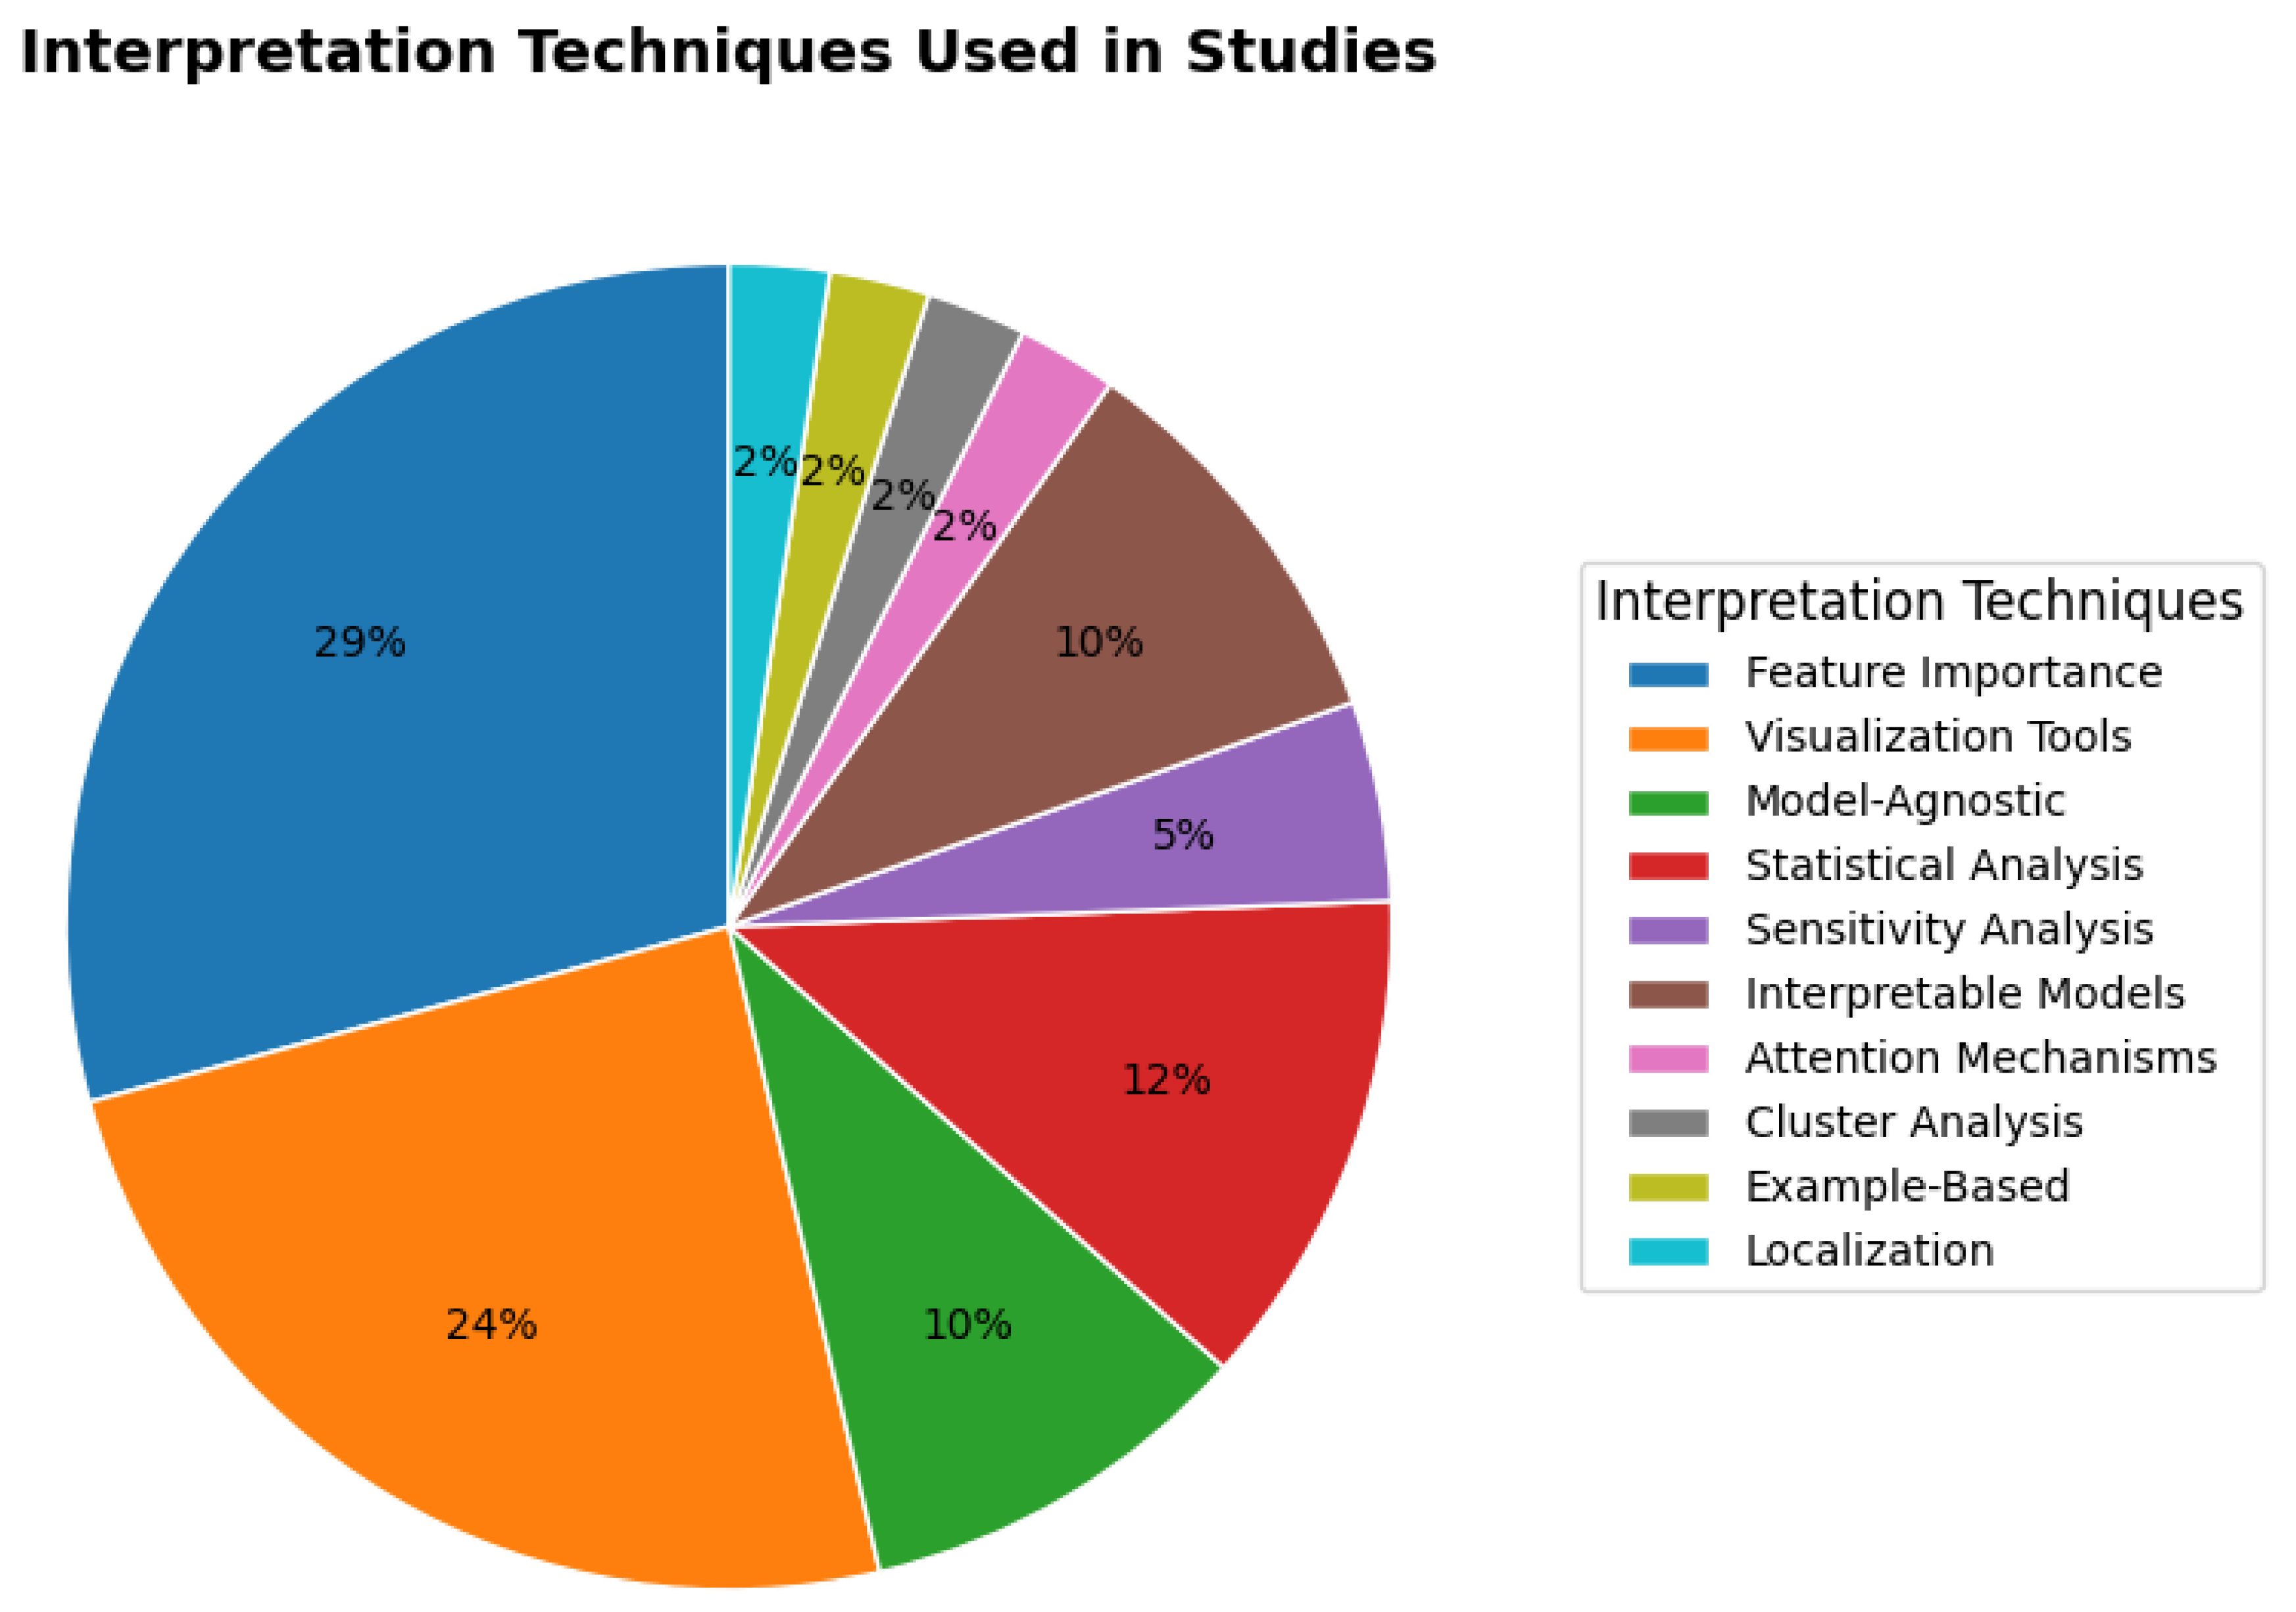
Table 1.
Research Questions and Rationale.
| Research Question | Rationale |
|---|---|
| 1. What is the status of machine learning models for the prediction of lung cancer from tabular datasets over the years? | To analyze the progress and trends in machine learning models for lung cancer prediction using tabular datasets. |
| 2. What are the key features (attributes) used in lung cancer prediction models? | To identify the most critical features that influence lung cancer prediction models, since selecting the right attributes can significantly enhance the performance. |
| 3. Which tabular datasets are frequently used in lung cancer prediction? 3.1. Which datasets are used for lung cancer diagnosis prediction? 3.2. Which datasets are used for lung cancer risk prediction? 3.3. Which datasets are used for lung cancer survival prediction? | To find out all available datasets used previously and categorize them based on the quality of the datasets. |
| 4. What are the preprocessing techniques used to feed them into the models? | We aim to compare past ML preprocessing techniques for lung cancer prediction and analyze their interrelationships. |
| 5. What are the most commonly used machine learning algorithms for lung cancer prediction on tabular datasets? 5.1. Which models are commonly used for diagnosis prediction? 5.2. Which models are commonly used for risk prediction? 5.3. Which models are commonly used for survival prediction? | In this research question, we want to list all the methods used for predicting lung cancer earlier. |
| 6. What are the evaluation metrics that are set to validate the model’s performance? 6.1. Which validation methods are used to evaluate the models? 6.2. Which performance metrics have been used most? | This RQ explores how the ML methods were evaluated in previous studies and which evaluation metrics were considered to determine the best-fit model based on evaluation metrics. |
| 7. What feature selection and dimensionality reduction techniques are used to impact the performance of the models? | To identify the most effective feature selection and dimensionality reduction techniques that can enhance the performance of ML models by improving accuracy, reducing computational complexity, and minimizing the risk of overfitting. |
| 8. What ensemble techniques are performed to boost the performance over the traditional ML models? | To explore how ensemble techniques can enhance the predictive performance of traditional ML models by combining multiple models to improve accuracy, robustness, and generalization. |
| 9. What are the techniques that are used to interpret the results of the models? | To list the techniques for interpreting results of the models and try to understand the pattern and improvement by the model’s performance. |
Table 2.
Inclusion & Exclusion Criteria.
| Inclusion Criteria | Exclusion Criteria |
|---|---|
| IC1: Relevance to lung cancer prediction (diagnosis, risk, or survival) | Ex1: Not written in English |
| IC2: Use of tabular/structured datasets (including imaging-derived features in structured format) | Ex2: Book chapters, conference papers, review papers, PhD theses/dissertations |
| IC3: Machine learning model(s) used for prediction | Ex3: Full-text not available |
| IC4: Peer-reviewed journal articles | EC4: Studies relying primarily on image analysis without structured clinical data |
Table 4.
Study Selection process and Quality Assessment.
| Identifier | SP Checklist | Score |
|---|---|---|
| SP1 | Research Objective Clarity | (+1) Yes / (0) No |
| SP2 | Dataset Structure and Relevance | (+1) Yes / (0) No |
| SP3 | Descriptive Methodology & use of Machine Learning | (+1) Yes / (0) No |
| SP4 | Performance Metrics Mentioned | (+1) Yes / (0) No |
| SP5 | Preprocessing Methods described | (+1) Yes / (0) No |
| SP6 | Dataset Availability and Details | (+1) Yes / (0) No |
| SP7 | Comparisons made | (+1) Yes / (0) No |
| SP8 | Explainability and interpretability methods | (+1) Yes / (0) No |
| SP9 | Challenges & Limitations | (+1) Yes / (0) No |
| SP10 | Recent Publication | (+1) Yes / (0) No |
Table 5.
Data Collection & Description.
| Extracted Data | Description | RQ |
|---|---|---|
| Metadata | Title, Authors, Publication Year, Journal/Conference | RQ1 |
| Dataset | Dataset Name, Dataset Source, Sample Size, Feature Types, Key Features Used | RQ2, RQ3 |
| Methods | ML Algorithms Used, Ensemble Methods Used, Feature Selection Methods, Dimensionality Reduction Methods, Preprocessing Techniques, Interpretability Methods | RQ4, RQ5, RQ7, RQ8, RQ9 |
| Evaluation | Performance Metrics, Best Performing Model | RQ6 |
Table 6.
Data Key Attributes Used in Selected Studies.
| Category | Key Attributes | PS# | Count |
|---|---|---|---|
| Demographics | Age, Gender, Race, Marital Status, Education, Living Area, Socioeconomic Status (SES), Medicaid Coverage, Occupation. | PS8, PS21, PS24, PS26, PS10, PS13, PS28, PS23, PS15, PS27, PS22, PS11, PS18, PS29, PS14, PS17, PS9, PS33, PS36, PS40, PS35, PS1 | 22 |
| Clinical Parameters | T/N/M Stage, Tumor Size, Grade, Histology, Primary Site, Metastases (Brain/Liver), AJCC TNM Staging, Karnofsky Performance Scale (KPS), Follow-up Time, Survival Status, Chronic Diseases (COPD, Diabetes, CVDs). | PS8, PS21, PS24, PS10, PS13, PS20, PS19, PS28, PS16, PS23, PS15, PS27, PS22, PS11, PS18, PS29, PS14, PS41, PS35, PS1 | 20 |
| Lifestyle & Environment | Smoking (Pack-Years, Cessation), Alcohol Use, Air Pollution, Occupational Hazards (Asbestos, Silica), Diet, Obesity, Insecticide Use. | PS26, PS3, PS17, PS9, PS33, PS36, PS40, PS1 | 8 |
| Symptoms & Comorbidities | Coughing Blood, Shortness of Breath, Chest Pain, Wheezing, Fatigue, Weight Loss, Chronic Inflammation, Allergy, Snoring, Anemia, Frequent Cold. | PS26, PS3, PS25, PS20, PS28, PS18, PS36, PS40 | 8 |
| Treatment | Surgery (Type/Sequence), Chemotherapy, Radiotherapy, Immunotherapy, Molecular Therapy (EGFR/ALK), Medication Codes (ATC/WHO). | PS8, PS21, PS13, PS23, PS15, PS27, PS19, PS16, PS41, PS35 | 10 |
| Molecular/ Genetic | Biomarkers (EGFR, ALK, KRAS, BRAF), Gene Expression, SNPs, Nuclear Morphology (Size/Shape/Texture), Protein Levels (p27, p53). | PS10, PS7, PS16, PS9, PS38, PS29, PS36 | 7 |
| Imaging/ Diagnostics | CT Nodule Features (Size/Shape/Density), Emphysema Score, FEV1/FVC Ratio, TumorSize, Goddard Score, PET-derived Features. | PS31, PS20, PS42, PS34, PS37, PS12, PS41 | 7 |
| Social/ Economic Factors | Low Income, Low Education, Medicaid Coverage, Occupational Exposures. | PS28, PS14, PS33, PS40 | 4 |
| Survival/ Outcomes | Overall Survival (OS), 1-Year Survival, Survival Time, Mortality Risk. | PS10, PS13, PS27, PS12, PS41, PS35, PS2, PS5, PS6 | 9 |
| Model/ Methodology-Specific Categories | Machine Learning Models (Transformers, XGBoost, ANNs), Genetic Pathways, Anomaly Detection, Survival Prediction Algorithms. | PS2, PS5, PS6, PS4, PS33, PS42, PS34, PS37, PS38, PS39 | 10 |
Table 7.
Categorized Datasets Used for Lung Cancer Diagnosis Prediction.
| Category | Key Datasets/ Examples |
|---|---|
| Population-Based/Registry | SEER (PS8, PS21, PS24, PS27, PS15, PS41), Danish registers (PS14), EPIC (PS9), JPHC (PS17), large oncologic DB (PS23) |
| Clinical/EHR Data | Flatiron Health EHR (PS16), Maine HIE (PS28), WSIC (PS32), Taiwan NHIRD (PS11, PS35), CLARO (PS2), CLARIFY (PS10) |
| Imaging and Radiology | NLST & LIDC (PS31, PS42), ACRIN NSCLC-DICOM-PET (PS12), LUNA-16/Kaggle (PS34, PS40) |
| Genomic/Multi-Omics | TCGA (PS5, PS6, PS38), GTex (PS38), SLCG (PS6) |
| Synthetic/Sensor-Based/Specialized | Synthetea (PS30), eNose (PS1), Pesticide & Lung Cancer (PS33), Blood nanosensor (PS37), Multi-cancer (PS39), Multi-modal (PS40) |
Table 8.
Categorized Datasets Used for Lung Cancer Risk Prediction.
| Category | Key Datasets/ Examples |
|---|---|
| Population-Based/Registry | Danish national registers (PS14), EPIC (European Prospective Investigation into Cancer and Nutrition) (PS9), Japan Public Health Center Study Cohort (PS17) |
| Clinical/EHR Data | Taiwan National Health Insurance Research Database (NHIRD) (PS11), Lung Cancer Prediction Dataset (PS22), “A new tool to predict lung cancer based on risk factors” (PS3) |
| Synthetic/Sensor-Based | Synthea synthetic patient data (PS30) |
Table 9.
Categorized Datasets Used for Lung Cancer Survival Prediction.
| Category | Key Datasets/ Examples |
| Population-Based/Registry | SEER (PS8, PS21, PS15, PS41), Large oncologic database (PS23) |
| Clinical/EHR Data | CLARIFY (PS10), Retrospective cohort from CUCH (PS13), Flatiron Health EHR (PS16), CLARO (PS2), NHIRD (PS35), Wisconsin Prognostic Lung Cancer subdirectory (PS7), Prognostic models (PS29) |
| Imaging and Radiology | ACRIN NSCLC-DICOM-PET (PS12) |
| Genomic/Multi-Omics | TCGA (PS5), TCGA & SLCG (PS6) |
| Synthetic/Sensor-Based/Specialized | Pesticide & Lung Cancer (PS33) |
Table 10.
Preprocessing techniques used in Selected Studies.
| Data Preprocessing | PS# |
|---|---|
| Encoding and Transformation | PS8, PS21, PS20, PS41, PS1, PS36 |
| Normalization/Standardization | PS8, PS21, PS38, PS42, PS12, PS31, PS42 |
| Missing Data Handling | PS21, PS20, PS33, PS41 |
| Data Cleaning and Filtering | PS8, PS14, PS15 |
| Data Splitting and Validation | PS26, PS7, PS27, PS16 |
| Domain-Specific Preprocessing | PS12, PS31, PS34, PS37, PS10, PS13 |
Table 11.
Distribution of Models for Selected Studies.
| Machine Learning Model | PS# |
|---|---|
| Naïve Bayes (NBayes) | PS8, PS24, PS26, PS20, PS7, PS12, PS22, PS33, PS41, PS35 |
| Decision Tree (DTree) | PS8, PS26, PS13, PS3, PS7, PS12, PS23, PS27, PS22, PS18, PS5, PS33, PS39 |
| Random Forest (RF) | PS8, PS24, PS26, PS30, PS13, PS3, PS12, PS23, PS22, PS31, PS2, PS6, PS33, PS37, PS36, PS41 |
| k-Nearest Neighbor (KNN) | PS8, PS26, PS30, PS20, PS28, PS7, PS12, PS22 |
| Logistic Regression (LR) | PS8, PS26, PS10, PS13, PS20, PS32, PS12, PS23, PS22, PS29, PS14, PS6, PS33, PS35 |
| Support Vector Machine (SVM) | PS24, PS26, PS30, PS20, PS28, PS12, PS27, PS22, PS18, PS5, PS6, PS33, PS39, PS35 |
| Artificial Neural Network (ANN) | PS24, PS26, PS25, PS20, PS19, PS12, PS23, PS22, PS29, PS5, PS6, PS33, PS42, PS39, PS41, PS35 |
| Generalized Linear Model (GLM) | PS24 |
| Gradient Boosting | PS8, PS24, PS26, PS30, PS13, PS20, PS28, PS12, PS23, PS27, PS22, PS6, PS4, PS33, PS36, PS40, PS41 |
| Voting Classifier | PS26 |
| Survival Model | PS21, PS16, PS15, PS17, PS9, PS2, PS34 |
| Deep Learning | PS10, PS31 |
| Graph Machine Learning | PS10 |
| Kaplan-Meier estimator | PS10 |
| Fuzzy Inference System | PS18 |
| Transformer Based model | PS32 |
| Linear Regression | PS27, PS41 |
| K-Means Clustering | PS18 |
| LDA | PS1 |
| VAE | PS38 |
| CNN | PS11, PS36, PS41 |
Table 12.
Distribution of Models used for Diagnosis Prediction.
| Model | PS# |
|---|---|
| Logistic Regression | PS20, PS26, PS32, PS35 |
| Support Vector Machine (SVM) | PS20, PS24, PS26, PS39 |
| Random Forest (RF) | PS24, PS26, PS31, PS36, PS37 |
| XGBoost | PS4, PS20, PS24, PS26, PS36 |
| Decision Trees | PS24, PS39, PS35 |
| K-Nearest Neighbors (KNN) | PS20, PS26 |
| Naive Bayes | PS20, PS24, PS26, PS36, PS35 |
| Neural Networks (ANN/MLP/CNN) | PS24, PS20, PS26, PS31, PS32, PS34, PS36, PS38, PS39, PS35, PS40 |
| Linear Discriminant Analysis | PS1, PS39 |
| Extra Tree | PS26 |
| AdaBoost | PS26 |
| CATBoost | PS36 |
| Bayesian Network | PS35 |
| Variational Autoencoder (VAE) | PS38 |
Table 13.
Distribution of Models Used for Risk Prediction.
| Models | PS# |
|---|---|
| Logistic Regression | PS6, PS10, PS14, PS22, PS23, PS28, PS33, PS13 |
| Random Forest (RF) | PS3, PS6, PS22, PS23, PS28, PS33, PS13 |
| XGBoost | PS22, PS23, PS28, PS33, PS13 |
| Support Vector Machine (SVM) | PS6, PS22, PS28, PS33 |
| Decision Trees | PS3, PS22, PS23, PS33 |
| Gradient Boosting Machine | PS6, PS23, PS22 |
| Multi-Layer Perceptron (MLP) | PS6, PS33 |
| LightGBM | PS13 |
| Parametric Survival Models | PS9, PS17 |
| Bayesian Network | PS22 |
| LASSO | PS28 |
| Fuzzy Inference System | PS3 |
| Stochastic Gradient Descent | PS22 |
| J48/AdaBoost/Rotation Forest | PS22 |
Table 14.
Distribution of Models Used for Survival Prediction.
| Models | PS# |
|---|---|
| Random Survival Forest | PS2, PS16 |
| Cox Proportional Hazards | PS10, PS15, PS16 |
| DeepSurv | PS15, PS21 |
| Logistic Regression | PS8, PS12, PS29, PS13, PS10 |
| Support Vector Machine (SVM) | PS5, PS8, PS12, PS27, PS41 |
| Random Forest (RF) | PS8, PS12, PS13 |
| XGBoost | PS8, PS13 |
| Decision Trees | PS5, PS7, PS8, PS12, PS27, PS13 |
| Neural Networks (Deep Learning) | PS5, PS25, PS29, PS41, PS10 |
| Gradient Boosting Machine | PS12, PS27, PS41 |
| Linear Regression | PS27, PS41 |
| K-Nearest Neighbors (KNN) | PS7, PS8, PS12 |
| Naive Bayes | PS7, PS12 |
| REPTree | PS7 |
Table 15.
Evaluation Metrics Categorized for Selected Studies.
| Validation Method | PS# |
|---|---|
| Holdout (Train-Test Split) | PS7, PS12, PS16, PS19, PS23, PS26, PS36 |
| Cross-Validation | PS5, PS26 (10-fold), PS27 (10-fold) |
| Temporal Validation | PS32 |
| External Validation | PS4 |
| Case-Control Sampling | PS32 |
| Stratified Sampling | PS12 |
| Not Specified | PS8, PS10, PS3, PS9, PS14, PS15, PS17, PS18, PS20, PS21, PS22, PS24, PS25, PS28, PS29, PS30, PS31, PS33, PS34, PS35, PS37, PS38, PS39, PS40, PS41, PS42, PS1, PS2, PS6, PS11, PS13 |
Table 16.
Performance Metrics Categorized for Selected Studies.
| Performance Metric | PS# |
|---|---|
| Accuracy (Acc) | PS8, PS21, PS24, PS25, PS26, PS30, PS13, PS3, PS19, PS20, PS31, PS22, PS18, PS29, PS36, PS38, PS33 |
| AUC/ROC/AUROC | PS21, PS24, PS26, PS30, PS13, PS20, PS31, PS12, PS23, PS14, PS9, PS5, PS4, PS22, PS11, PS38, PS1 |
| Sensitivity (Recall/TPR) | PS8, PS21, PS24, PS26, PS30, PS13, PS3, PS19, PS20, PS31, PS12, PS23, PS11, PS18, PS36, PS37, PS33 |
| Specificity (TNR) | PS8, PS21, PS24, PS26, PS13, PS3, PS19, PS20, PS23, PS14, PS11, PS18, PS37, PS38, PS33 |
| Precision (PPV) | PS26, PS30, PS13, PS20, PS22, PS12, PS23, PS14, PS32, PS11, PS38, PS39, PS33 |
| F1-Score | PS8, PS26, PS13, PS20, PS22, PS23, PS32, PS38, PS33, PS39 |
| C-index (Concordance Index) | PS21, PS13, PS15, PS17 |
| Calibration Metrics | PS13 (calibration curves, slope), PS23 (Brier score, calibration slope), PS16 (Poisson slopes) |
| Hazard Ratios (HR) | PS10, PS28, PS15 |
| MCC (Matthews Correlation) | PS20, PS19, PS23 |
| NPV | PS20, PS23, PS14, PS11, PS32 |
| MAE/RMSE | PS7, PS27, PS18, PS42 |
| Survival-Specific Metrics | PS10 (survival probabilities), PS15 (Kaplan-Meier, log-rank), PS16 (time-dependent AUROC) |
| Specialized Metrics | PS34 (mAP), PS29 (Judgment Ratio), PS42 (VDT), PS37 (class-specific sensitivity/specificity) |
Table 18.
Dimensionality Reduction Methods Used in Studies.
| Technique Category | Methods | PS# |
|---|---|---|
| Linear Methods | Principal Component Analysis (PCA) | PS33, PS37, PS39, PS1 |
| Non-Linear Methods | t-SNE (t-distributed Stochastic Neighbor Embedding) | PS11 (t-SNE), PS37 (t-SNE) |
| Regularization | LASSO (implicit via feature selection) | PS24, PS31 |
| Encoding/Scaling | One-Hot Encoding, Z-Score Normalization, Min-Max Scaling | PS2 (one-hot, Z-score), PS12 (robust scaling), PS36 (MinMaxScaler) |
| Attention/Transformer | Position embeddings, masking for missing data, attention mechanisms | PS32 (transformer attention), PS2 (masking), PS34 (CBAM attention) |
| Feature Grouping | Code/feature grouping (hierarchical or clinical relevance) | PS32 (Read codes → 450 groups), PS28 (33k → 346 → 118 features) |
| Autoencoders | Variational Autoencoder (VAE) | PS38 |
| Domain-Specific | Image normalization, Hounsfield Unit scaling, ablation studies | PS31 (resizing/normalization), PS42 (Hounsfield Units), PS42 (randomization-based ablation) |
| Not Specified | – | PS8, PS21, PS26, PS30, PS10, PS3, PS19, PS20, PS23, PS15, PS18, PS29, PS5, PS6, PS4, PS35, PS40 |
Table 19.
Ensemble Techniques Used in Studies.
| Ensemble Technique | PS# |
|---|---|
| Random Forest | PS8, PS24, PS13, PS3, PS12, PS23, PS22, PS33, PS37 |
| XGBoost | PS24, PS26, PS30, PS13, PS28, PS23, PS4, PS33, PS40 |
| AdaBoost | PS26 (Ensemble_1), PS22 |
| LightGBM | PS13 |
| Voting Classifier | PS26 (Ensemble_2) |
| Weighted Average | PS31 (Late Fusion), PS16 (Meta-model), PS27 (Custom Ensemble) |
| Rotation Forest | PS22 |
| Hybrid Models | PS36 (ConvXGB), PS39 (DT-SVM) |
| Stacking | PS41 |
| Extreme Gradient Boosting | PS24, PS40 |
| Custom Ensemble | PS27 (weighted sum), PS41 (stacking) |
Table 21.
Performance Analysis of Selected Studies.
| PS# | Best Performance (Accuracy/Metric) | Best Model Name |
|---|---|---|
| PS8 | 90.75% | XGB |
| PS21 | 0.7181 (C-Index) | DeepSurv |
| PS24 | 0.81 (AUC) | GLM |
| PS26 | 92.86% | K-Nearest Neighbors |
| PS30 | 97.5% | XGBoost |
| PS10 | N/A | – |
| PS13 | 85% (60th Month) | Nomogram (overall performance) |
| PS3 | 93.33% | Lung Cancer Prediction Tool (LCPT) |
| PS25 | 100% | Multi-class Neural Networks |
| PS20 | 94.6% | Support Vector Machine (SVM) |
| PS31 | 0.8021 (AUC) | Full Intermediate Fusion (FIF) |
| PS19 | 89.9% (test) | MLP 9:17-7-1:1 architecture |
| PS32 | 0.924 (AUROC) | MedAlbert + LRC |
| PS28 | 0.881 (AUC) | XGBoost |
| PS7 | 98.78% | Naive Bayes + SSA |
| PS16 | 0.7–0.8 (AUROC) | Meta-model |
| PS12 | 98% | MLP with ANOVA F-value feature selection |
| PS23 | 0.82 (AUC) | Gradient Boosting Machine |
| PS15 | 0.74 (C statistics) | DeepSurv |
| PS27 | 15.30 (lowest RMSE) | Custom Ensemble |
| PS22 | 97.1% | Rotation Forest (RotF) |
| PS11 | 0.902 (AUC) | CNN model |
| PS18 | 99.866 | Decision Trees + k-means clustering |
| PS29 | 87% | ANN (vs. logistic regression) |
| PS14 | 81.0% (AUC) | Model B |
| PS17 | 0.793 (c-index) | Risk prediction model |
| PS9 | 0.843 (AUC) | Weibull hazard model (smoking info) |
| PS2 | 80.72 (c-index) | SHAP (for interpretability) |
| PS5 | 0.837 (AUC) | Decision Trees |
| PS6 | 0.75 (PR-AUC), 0.80 (ROC-AUC) | Model with SHAP for feature ranking |
| PS4 | 0.75 | XGBoost (via feature importance) |
| PS33 | 99% | XGBoost with SMOTE+ENN+PCA |
| PS42 | 0.99 mm (MAD: for 1-year) | Tabular data model with class weights |
| PS34 | 99.63% (LUNA-16) | Improved CenterNet (ResNet-34 + CBAM) |
| PS37 | 100% (Sensitivity) | Random Forest |
| PS36 | 97.43% | ConvXGB model |
| PS40 | 93.4% | MRRXGBDC technique |
| PS39 | 98.21% | MLP-NN with GA-CFS feature selection |
| – | 95% (0.950) | Variational Autoencoder (VAE) |
| PS41 | 71.18% (classification accuracy) | ANN for classification |
| PS35 | 95.79% | NB |
| PS1 | 0.846 (AUC – Ex-Smoker Female) | CART & DFA |
Disclaimer/Publisher’s Note: The statements, opinions and data contained in all publications are solely those of the individual author(s) and contributor(s) and not of MDPI and/or the editor(s). MDPI and/or the editor(s) disclaim responsibility for any injury to people or property resulting from any ideas, methods, instructions or products referred to in the content. |
© 2025 by the authors. Licensee MDPI, Basel, Switzerland. This article is an open access article distributed under the terms and conditions of the Creative Commons Attribution (CC BY) license (http://creativecommons.org/licenses/by/4.0/).
Copyright: This open access article is published under a Creative Commons CC BY 4.0 license, which permit the free download, distribution, and reuse, provided that the author and preprint are cited in any reuse.


