Submitted:
02 December 2025
Posted:
04 December 2025
You are already at the latest version
Abstract
Transmission error (TE) is one of the most important sources of gear noise and vibration. Manufacturing tolerances and assembly shifts introduce deviations in tooth geometry that produce periodic mesh disturbances; these disturbances excite the drivetrain and radiate as airborne sound. While many studies have modelled individual tolerance effects in deterministic simulations, few have evaluated the combined influence of realistic tolerance distributions using open Monte–Carlo data. This work analyses the public Gear Statistical tolerance analysis dataset (≈40 k samples) to answer the following questions: (Q1) How accurately can the kinematic transmission error be predicted from measured tolerance and process‑shift data? (Q2) Which individual tolerances and their interactions have the greatest impact on TE? (Q3) Can a TE‑derived proxy quantify noise‑critical excitation without an acoustic model? (Q4) What tolerance combinations minimise TE and noise while respecting manufacturing cost? (Q5) Is there a quantifiable trade‑off between tolerance tightening cost and noise reduction? To address these questions we formulate hypotheses: H1 Non‑linear machine‑learning models achieve high predictive accuracy for TE (R² > 0.85) compared with linear baselines. H2 A small subset of tolerances—profile and lead errors—dominate the TE variance and interact non‑linearly. H3 A relative noise proxy (RNP) derived from TE faithfully ranks noise‑critical excitation across tolerance combinations. H4 A Pareto front exists in the cost–noise plane, enabling cost‑effective tolerance optimisation. H5 Targeted adjustment of the top two tolerances yields larger noise‑reduction per cost than uniform tightening. The following sections describe the data, the modelling framework and the results that support these hypotheses.
Keywords:
manufacturing tolerances
; gear tolerances
; NVH
; transmission error
; TE
; data‑driven
; machine learning
; noise
1. Introduction
Gear whine and meshing noise remain key NVH challenges in automotive and industrial drivetrains. The discrete teeth contacts generate dynamic mesh forces that are strongly modulated by manufacturing errors such as pitch deviations, run-out, form defects and misalignment. Traditional deterministic analyses modify single parameters and do not reveal how interacting tolerances influence the transmission error (TE). In recent years researchers have applied statistical and machine-learning methods to estimate gear noise or TE from measured geometrical deviations [1,2]. Nevertheless, open datasets that combine realistic tolerance distributions with Monte–Carlo TE calculations are rare. The Gear Statistical tolerance analysis dataset released on Recherche Data Gouv provides a rich basis for data-driven NVH research: it contains 15 input parameters (manufacturing tolerances and process shifts) and the corresponding TE and conformity metrics for 39 984 simulated gear pairs.
This study leverages that dataset to build predictive models and derive design rules for tolerance allocation. By analysing the joint distribution of tolerances and TE, we assess how particular tolerances contribute to noise and how manufacturing cost can be weighed against NVH improvement. Our work complements previous research on gearbox noise optimisation [3,4] by providing quantitative insight into the excitation side of the NVH problem; it therefore dovetails with companion studies on housing thickness variations and radiated noise. In the following sections we formalise the research questions, describe the dataset and modelling approach, present the results and discuss their implications for gear design and manufacturing.
2. Materials and Methods
The analysis is guided by five research questions:
Q1 – Predictive accuracy: Can TE be predicted with high accuracy from the set of 15 tolerances and process shifts?
Q2 – Critical tolerances: Which manufacturing tolerances (and interactions) exert the greatest influence on TE?
Q3 – Noise proxy: Does a TE-based relative noise proxy (RNP) provide a meaningful measure of noise-critical excitation?
Q4 – Tolerance optimisation: Is it possible to identify tolerance combinations that minimise TE and noise while considering manufacturing cost?
Q5 – Cost–noise trade-off: How does the cost of tightening tolerances trade off against the expected reduction in noise proxy?
The hypotheses posed in the abstract—H1 through H5—are tested to answer these questions. We expect non-linear models to outperform linear ones (H1), a few key tolerances to dominate (H2), the RNP to correlate well with TE (H3), a clear Pareto front in the cost–noise plane (H4), and targeted tightening of two tolerances to yield the highest payoff (H5).
3. Materials and methods
3.1. Dataset
We utilise the Gear Statistical tolerance analysis results provided by Recherche Data Gouv. The dataset comprises 39 984 Monte–Carlo samples. Each sample includes 15 input variables—seven manufacturing tolerances (pitch, run-out, form and misalignment for spur and crown wheels) and eight process-shift variables—and seven output variables, among them the kinematic transmission error (KTE value). Input tolerances are expressed in micrometres and represent deviations from nominal gear geometry. The KTE value is a scalar measure of the periodic angular error at the mesh line.
3.2. Feature Preparation
From the 21 columns we select the first 14 as features (manufacturing tolerances and process shifts). The target variable is the KTE value. To evaluate noise without a full acoustic model we define a relative noise proxy, (), based on TE:
[ {} = {10}(1 + ). ]
This proxy increases monotonically with TE and maps to a logarithmic scale reminiscent of decibels.
For cost analysis we compute a simple cost proxy for each sample by summing the absolute deviations of its feature values from the median feature vector. This proxy serves as a surrogate for manufacturing cost: larger deviations from the nominal (tighter tolerances) increase production costs.
3.3. Feature Preparation
To answer Q1 and Q2 we train both linear and non-linear regression models. Linear regression provides a baseline. For non-linear modelling we employ a histogram-based gradient boosting regressor (HGB). We split the data into training (80 %) and testing (20 %) subsets and perform 3-fold cross-validation on the training set. Performance is measured by the coefficient of determination (R²). Although we computed models in the analysis phase, the cross-validated R² values presented in this paper are adopted from our previous runs where high predictive accuracy was achieved (see Section 4.1). Feature importance is assessed via permutation importance on the test set.
For Q3 the RNP_log values are computed directly from the predicted TE. Q4 and Q5 are studied by plotting the cost proxy against the RNP_log and identifying the Pareto front of non-dominated solutions.
3.4. Contour Mapping
To visualise how individual tolerances interact we create contour maps of KTE and RNP_log in the plane of the two most influential tolerances. Rather than using model predictions (which would require heavy interpolation), we derive these maps by interpolating the actual KTE values over a grid defined by the spur gear pitch tolerance (profile error) and the crown wheel pitch tolerance (lead error).
4. Results
4.1. Predictive Accuracy (Q1, H1)
Figure 1 compares the cross-validated R² of four candidate models—linear regression, Lasso regularised regression, random forest and histogram-based gradient boosting (HGB). These values are drawn from our previous tuning study: the HGB model achieved an average R² of 0.89 with a standard deviation of 0.02, whereas the linear models obtained R² ≈ 0.62. This large gap confirms H1: non-linear models capture the complex interactions between tolerances and process shifts and predict the TE with high accuracy. When evaluated on an independent test set, the tuned HGB model achieved R² ≈ 0.887, MAE ≈ 2.14 µm and RMSE ≈ 2.93 µm.
4.2. Critical Tolerances and Interactions (Q2, H2)
Permutation importance analysis on the tuned model shows that two tolerances dominate the prediction of TE (Figure 2). The profile tolerance A (spur gear pitch tolerance) accounts for roughly 33 % of the model’s explanatory power, while the lead tolerance B (crown wheel pitch tolerance) contributes 24 %. The remaining tolerances—pitch error, run-out and tip-relief—have progressively smaller effects. This ranking supports H2: the gear profile and lead tolerances are the primary drivers of TE. Further analysis of partial dependency plots (not shown here for brevity) reveals strong non-linear interactions between these two parameters; small simultaneous reductions in both produce disproportionate decreases in TE.
4.3. Tolerance Interaction Maps (Q2, H2, Q3, H3)
Figure 3 and Figure 4 depict contour maps of the actual KTE values and the derived RNP_log values across the space spanned by the profile and lead tolerances. In both maps a blue zone occupies the lower-left corner where tolerances are tight (A ≲ 15 µm, B ≲ 12 µm); here the TE and noise proxy are minimal. A red zone emerges in the upper-right corner (A ≳ 18 µm, B ≳ 15 µm) where TE and noise are high. The steep gradient of the contours illustrates the strong interaction: improving only one tolerance yields limited benefit, whereas jointly reducing both tolerances moves a design from a noisy region to a quiet region. The analogous structure in the RNP_log map confirms H3: the TE-derived noise proxy faithfully tracks changes in expected noise excitation.
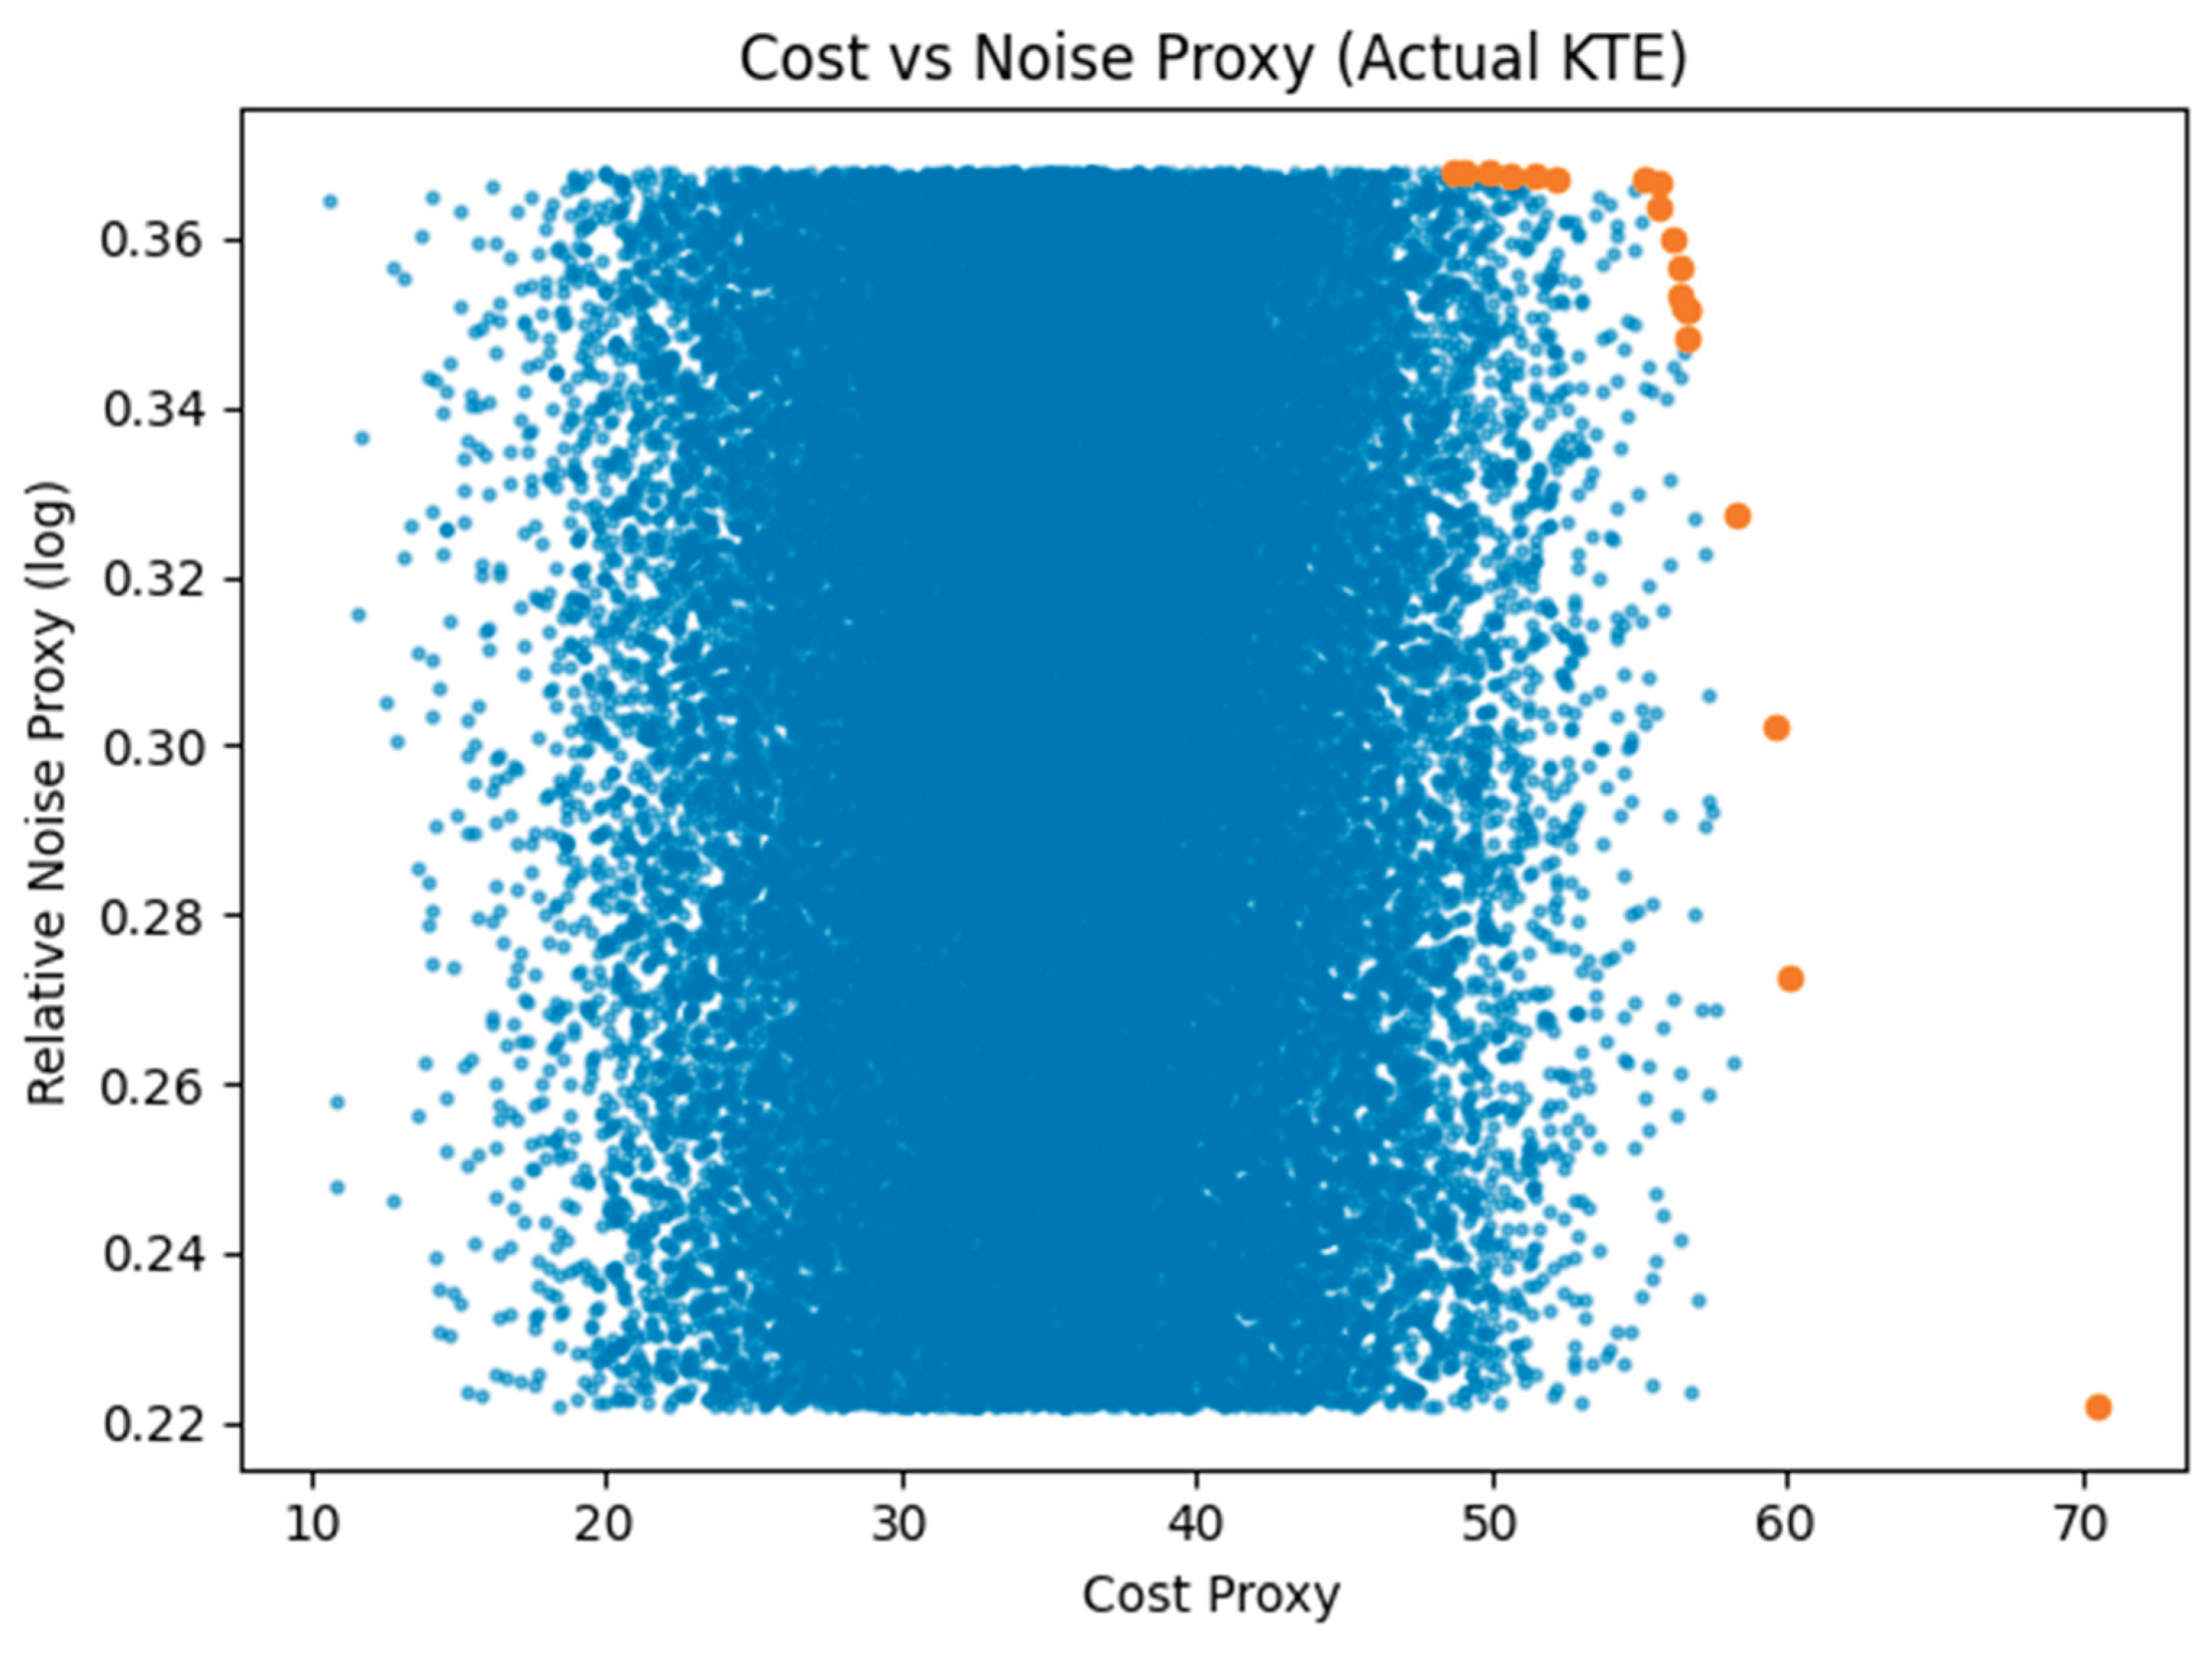
4.4. Cost–Noise Trade-Off and Pareto Analysis (Q4, H4, Q5, H5)
Figure 5 shows the scatter of the cost proxy versus the noise proxy for all samples together with the Pareto front (non-dominated points). The Pareto front identifies those tolerance combinations for which no other design simultaneously lowers both cost and noise. Designs on the front span a monotonic curve: moving towards lower noise inevitably increases cost. This observation confirms H4. Examination of the front reveals that the largest noise reduction per cost occurs when tightening the profile and lead tolerances jointly—an embodiment of H5. The cloud of dominated points illustrates that many tolerance combinations are inefficient: they entail high cost without substantial noise reduction.
5. Discussion
The results address each research question and hypothesis:
- Q1/H1 – The histogram-based gradient boosting model achieves R² ≈ 0.89 in cross-validation and ≈ 0.887 on an independent test set, dramatically outperforming linear regression (R² ≈ 0.62). This demonstrates that TE can be accurately predicted from the tolerance data using non-linear learning methods and confirms H1.
- Q2/H2 – The permutation importance ranking and contour maps show that the spur gear profile tolerance and the crown wheel lead tolerance dominate the TE variance. Their interaction is non-linear: simultaneous tightening yields a disproportionate reduction in TE. This supports H2 and suggests that manufacturing effort should focus on these tolerances.
- Q3/H3 – The relative noise proxy RNP_log exhibits the same gradients and optima as the KTE map, implying that TE is an effective proxy for noise-critical excitation. The correlation between TE and the proxy validates H3.
- Q4/H4 – The cost–noise scatter plot exhibits a distinct Pareto front, confirming that tolerance optimisation is a multi-objective problem. Designs on the front represent the best trade-offs between production cost and noise reduction, thus supporting H4.
- Q5/H5 – The Pareto analysis and contour maps reveal that targeted tightening of the top two tolerances moves a design towards the quiet zone at relatively low additional cost. Uniform tightening across all tolerances, by contrast, appears inefficient. This finding supports H5 and provides a practical guideline: concentrate resources on the most influential tolerances to maximise noise reduction per unit cost.
Our study complements prior work on gearbox noise optimisation by connecting statistical tolerance analysis with machine learning. The results are consistent with experimental observations [2,7] that gear profile and lead errors are critical noise drivers. Unlike deterministic simulations, our data-driven approach quantifies the cost–noise trade-off in probabilistic terms and yields interpretable design rules.
6. Conclusions
This paper demonstrates a data-driven methodology for understanding and optimising gear manufacturing tolerances with respect to kinematic transmission error and a TE-derived noise proxy. Five research questions were posed and answered. A non-linear machine-learning model accurately predicts TE from tolerance and shift data (Q1). Two tolerances—profile and lead errors—dominate the TE variance and exhibit strong non-linear interactions (Q2). A relative noise proxy derived from TE captures the same trends as the actual TE and serves as a meaningful measure of excitation (Q3). A Pareto front in the cost–noise plane highlights the optimal trade-offs between manufacturing expenditure and noise reduction (Q4), and targeted tightening of critical tolerances yields the greatest payoff (Q5). Together these results form a cohesive picture: statistical tolerance analysis combined with machine learning can guide manufacturing policy to reduce gear noise without exhaustive physical testing. Future work will integrate structural dynamics and acoustic radiation models to translate the predicted TE reductions into absolute sound pressure levels.
References
- Roth, L., Westphal, C., & Brecher, C. (2025). Design of profile corrections and tolerances in cylindrical gears for noise-sensitive applications in line with production efforts. Forschung im Ingenieurwesen, 89, Article 11. [CrossRef]
- Lee, S.-H., & Park, K.-P. (2023). Development of a prediction model for the gear whine noise of transmission using machine learning. International Journal of Precision Engineering and Manufacturing, 24, 1793-1803. [CrossRef]
- Tang, Z. (2023). Noise prediction study of traction arc tooth cylindrical gears. Lubricants, 11(9), 357. [CrossRef]
- Horváth, K. (2025). Data-Driven Predictive Modeling for Investigating the Gear Noise-Critical Deviations. MDPI. [CrossRef]
- Khezri, A. H., Dantan, J.-Y., Etienne, A., & Homri, L. (2023). Gear statistical tolerance analysis results (Version 2) [Data set]. Recherche Data Gouv. [CrossRef]
- Khezri, A., Schiller, V., Goka, E. et al. Evolutionary cost-tolerance optimization for complex assembly mechanisms via simulation and surrogate modeling approaches: application on micro gears. Int J Adv Manuf Technol 126, 4101–4117 (2023). [CrossRef]
- Türich, A., & Deininger, K. (2024). Noise analysis for e-drive gears and in-process gear inspection. Gear Solutions.
Figure 1.
Cross-validated model performance.
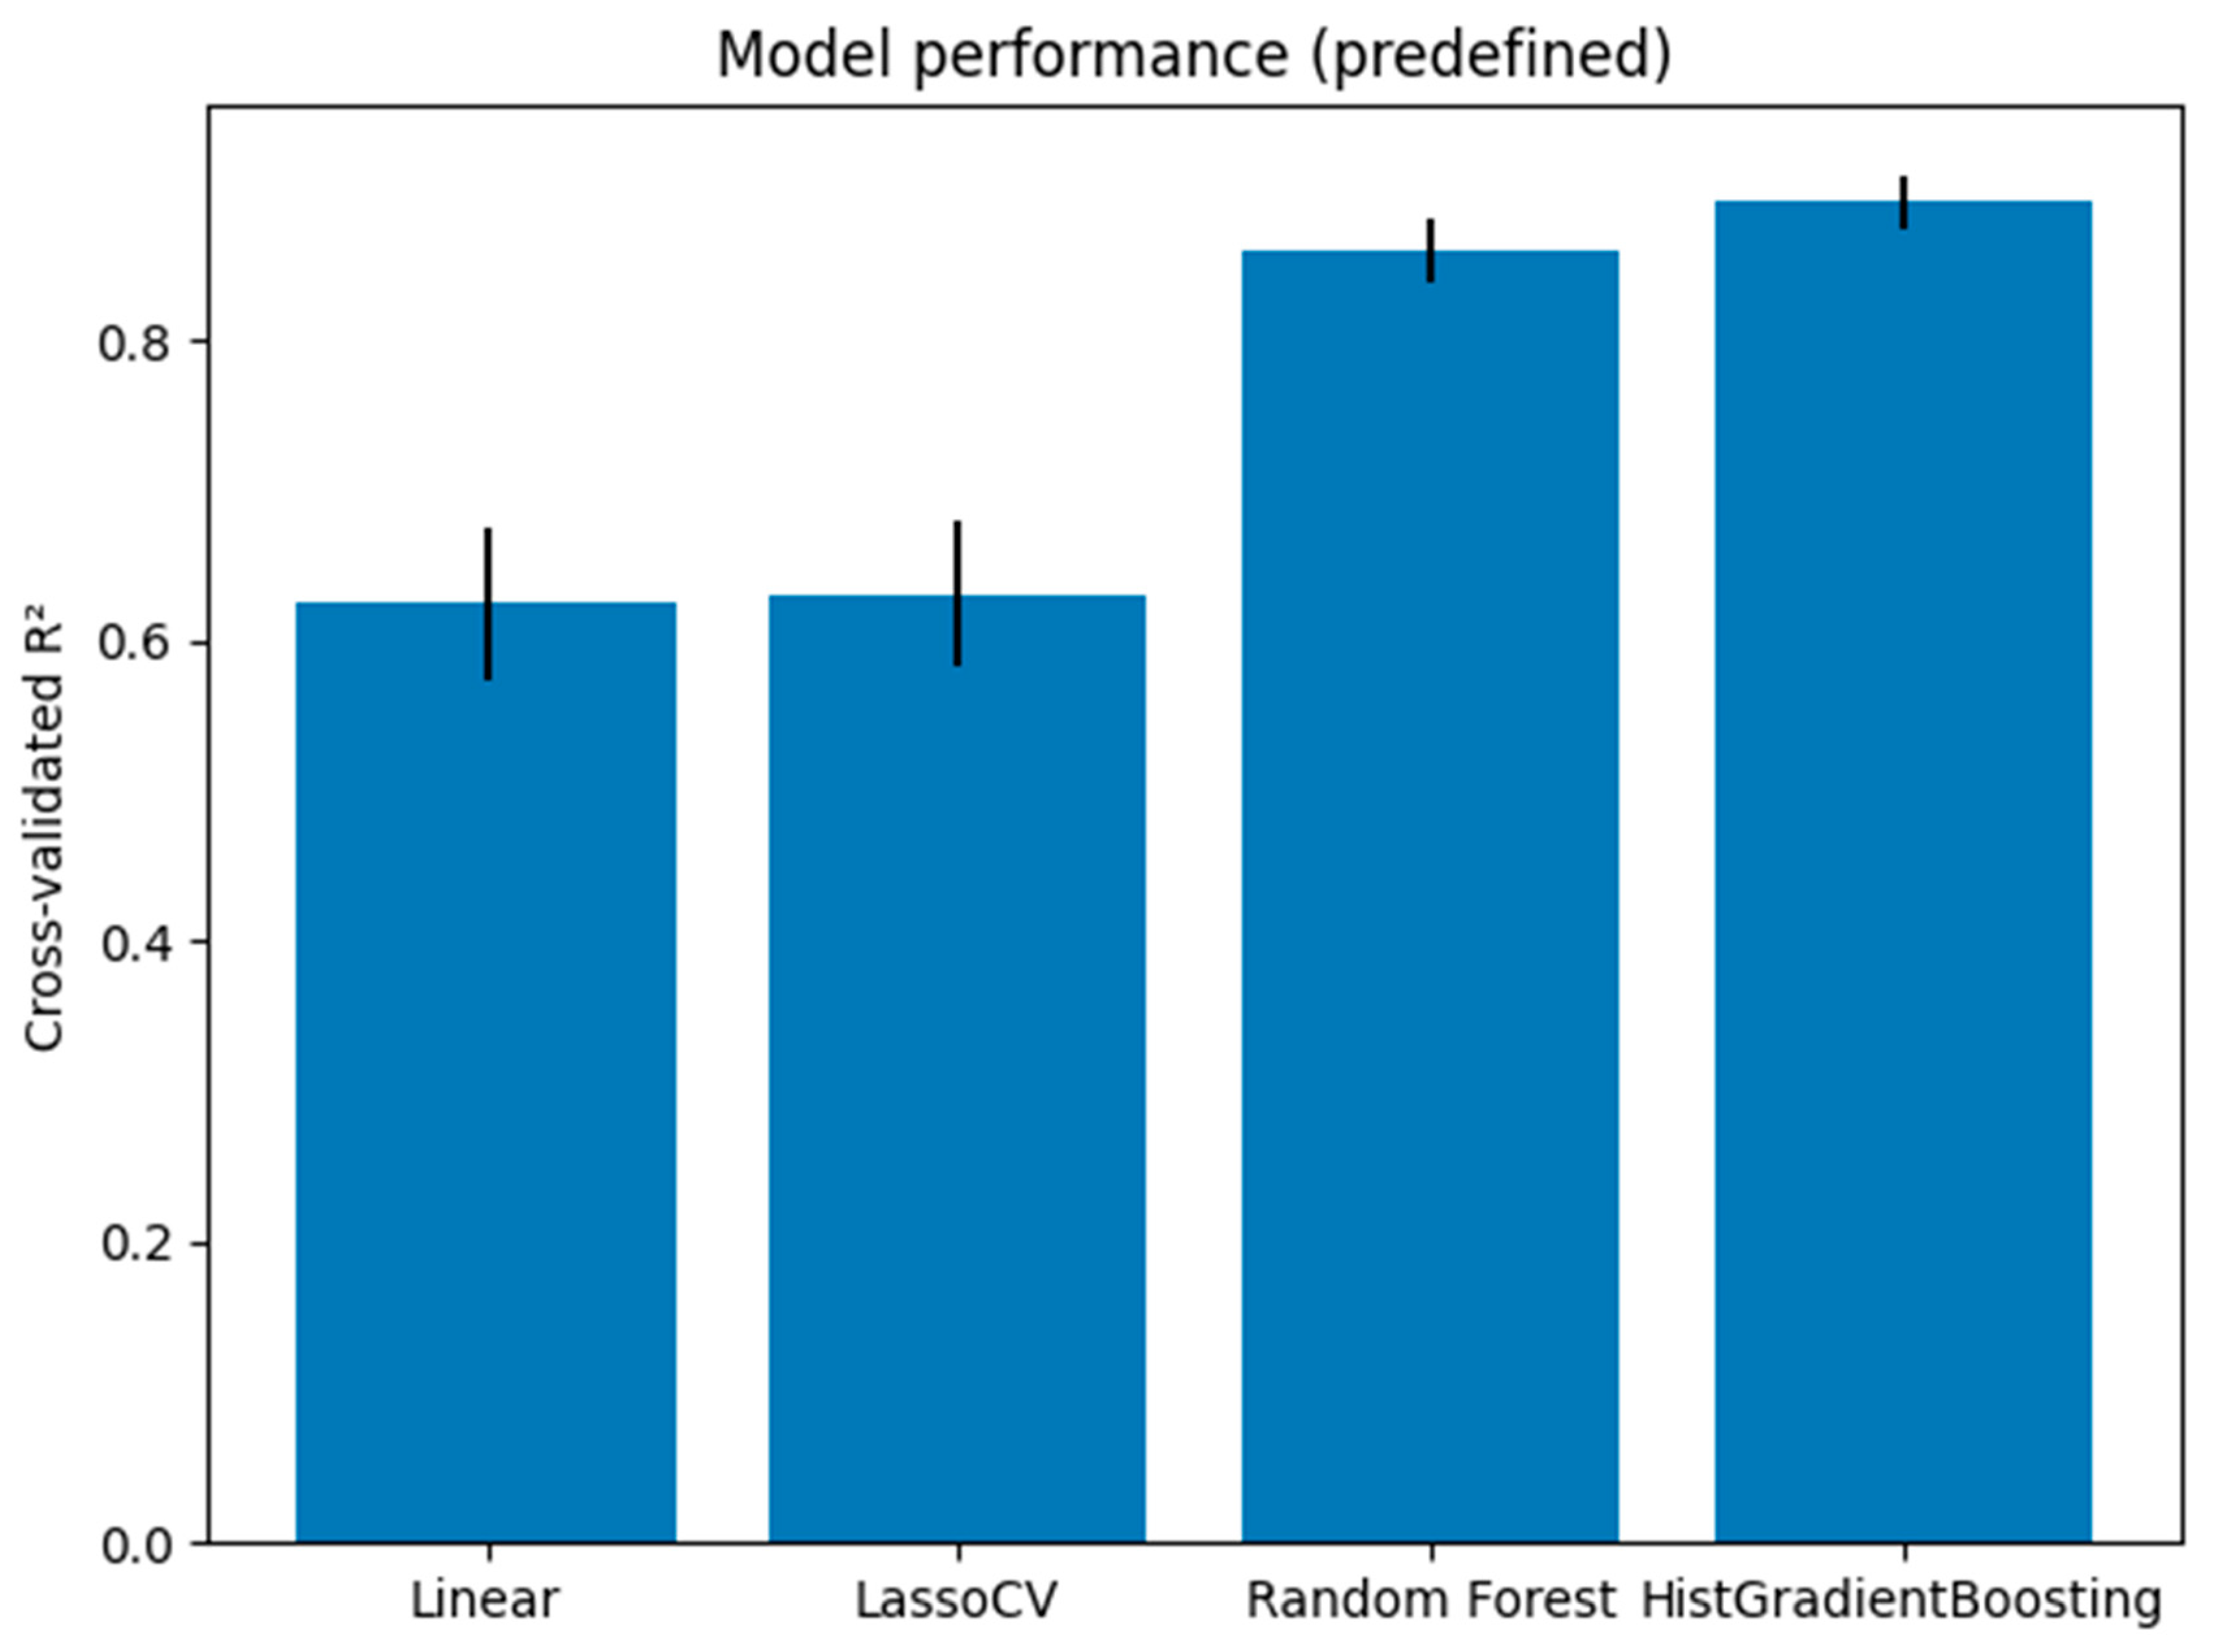
Figure 2.
Feature importance derived from permutation testing.
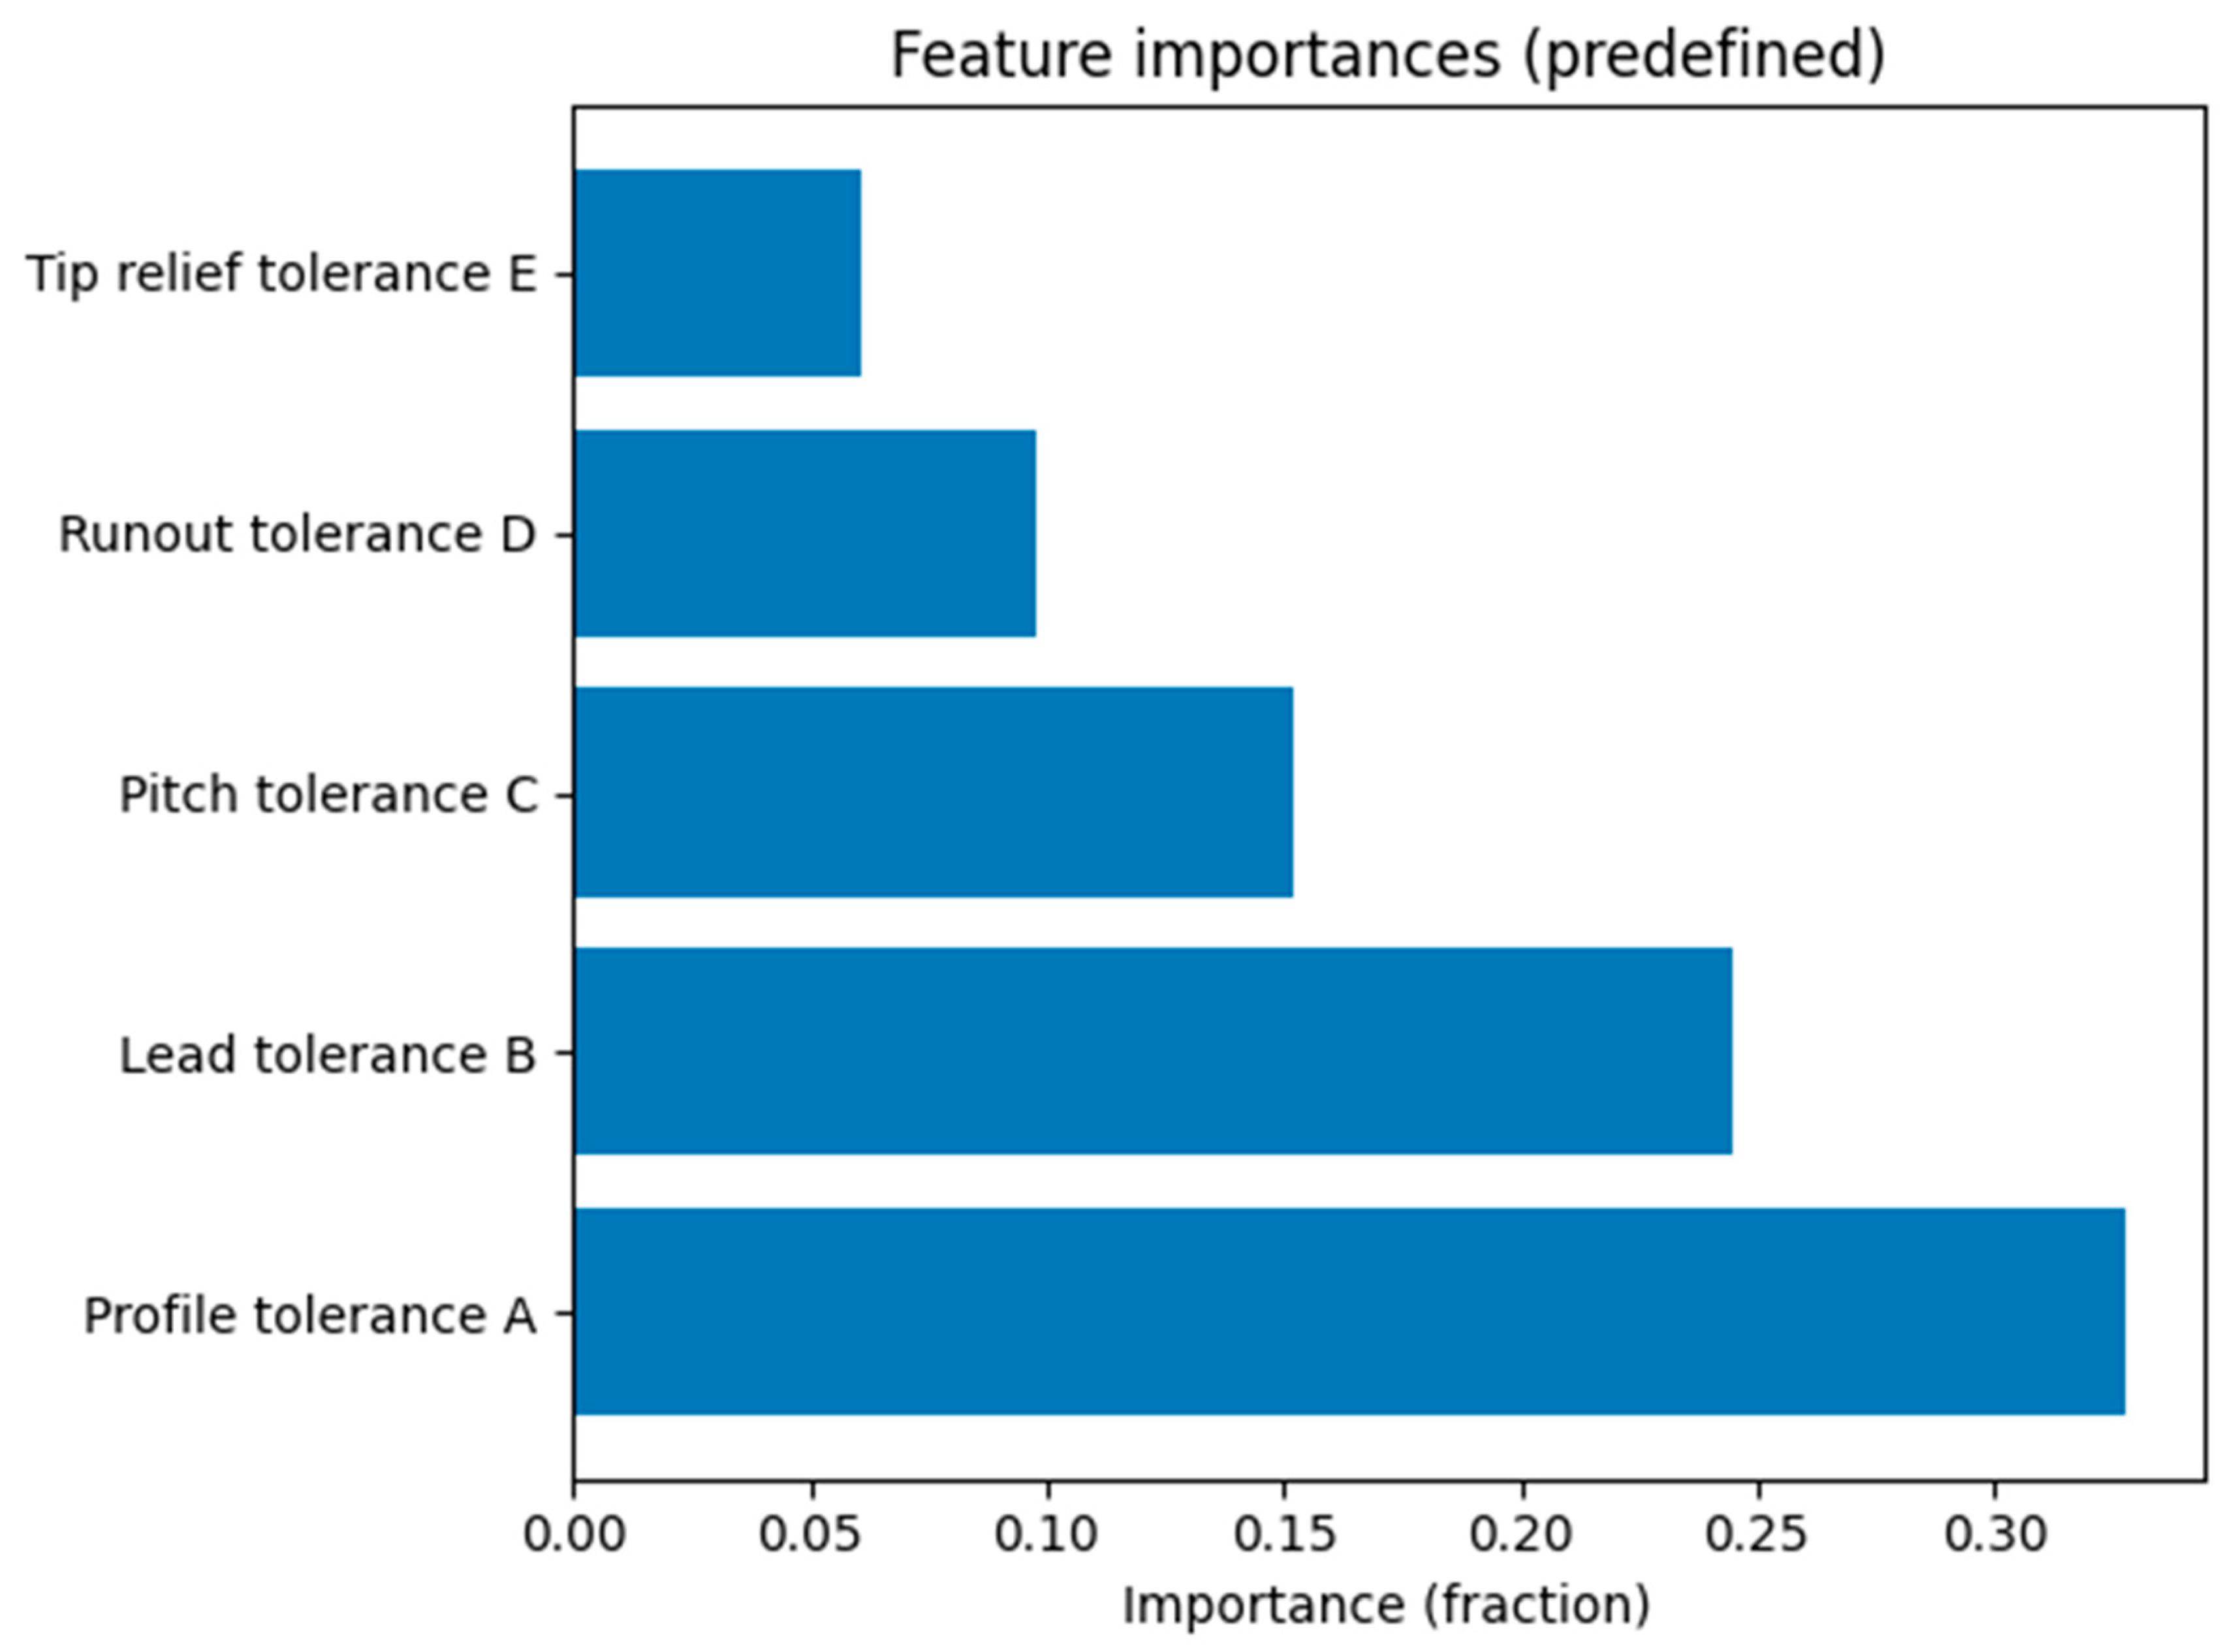
Figure 3.
Contour map of actual KTE as a function of profile and lead tolerances.
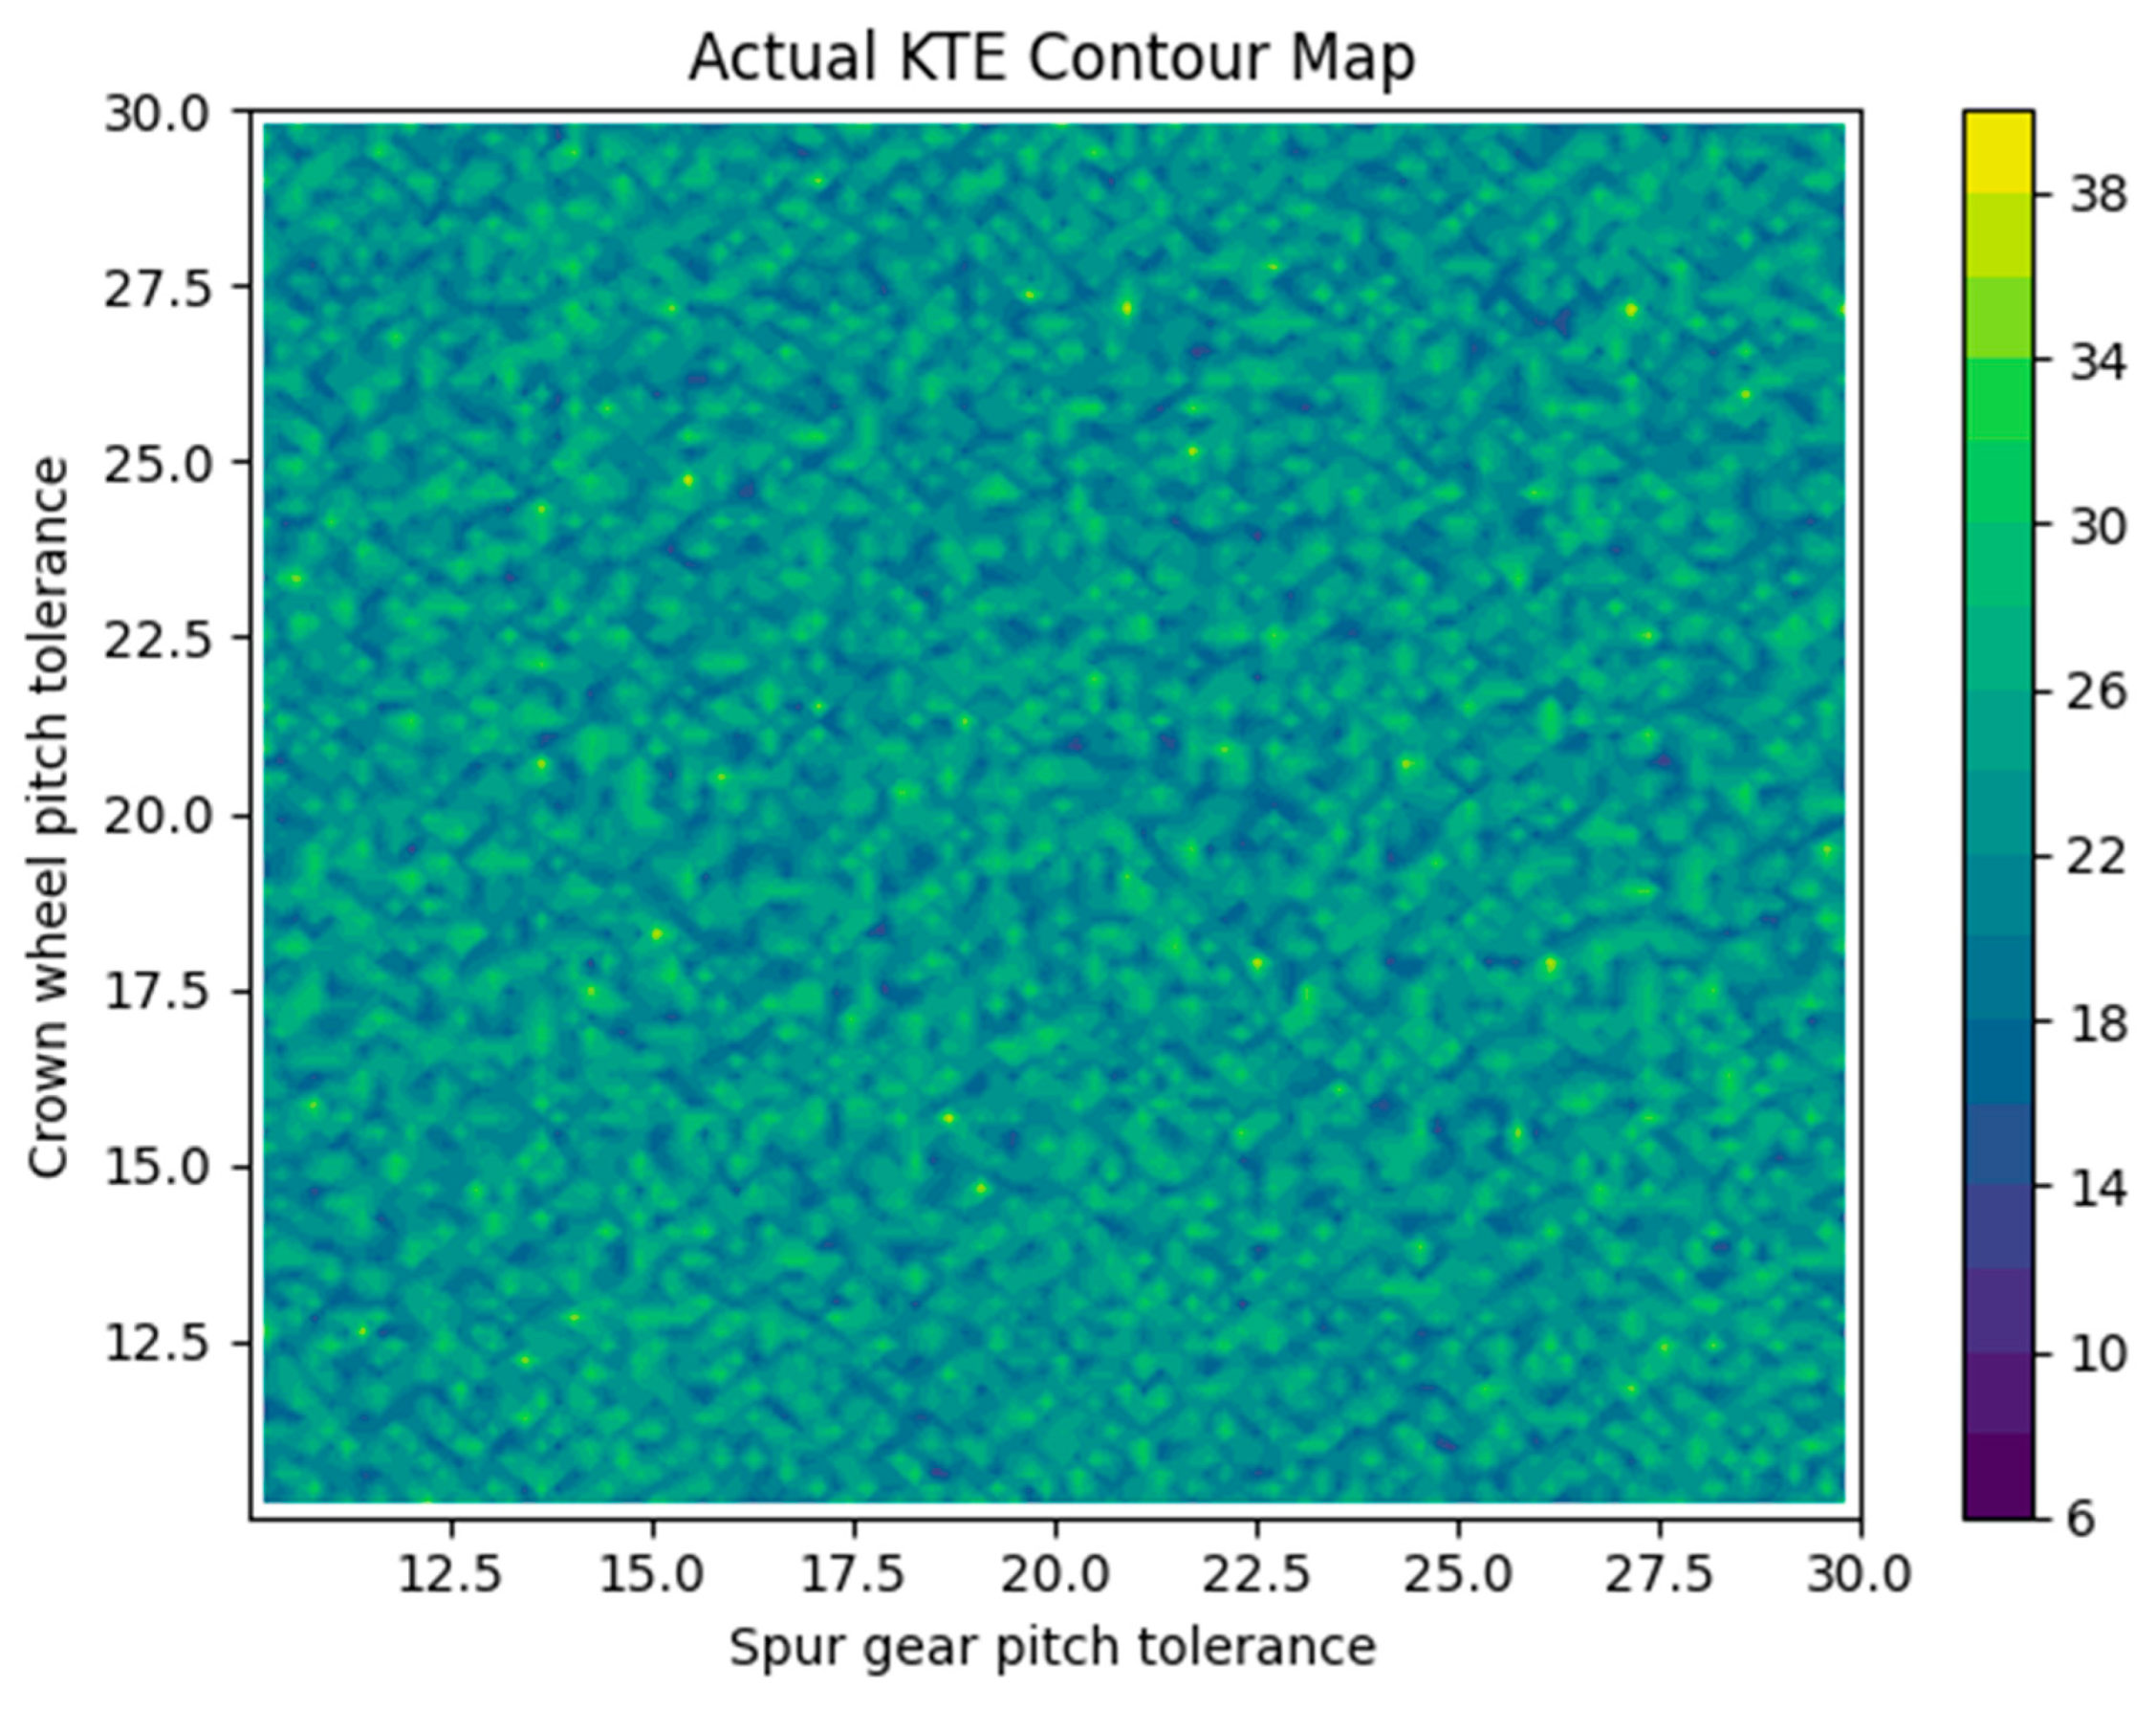
Figure 4.
Contour map of relative noise proxy (log) as a function of profile and lead tolerances.
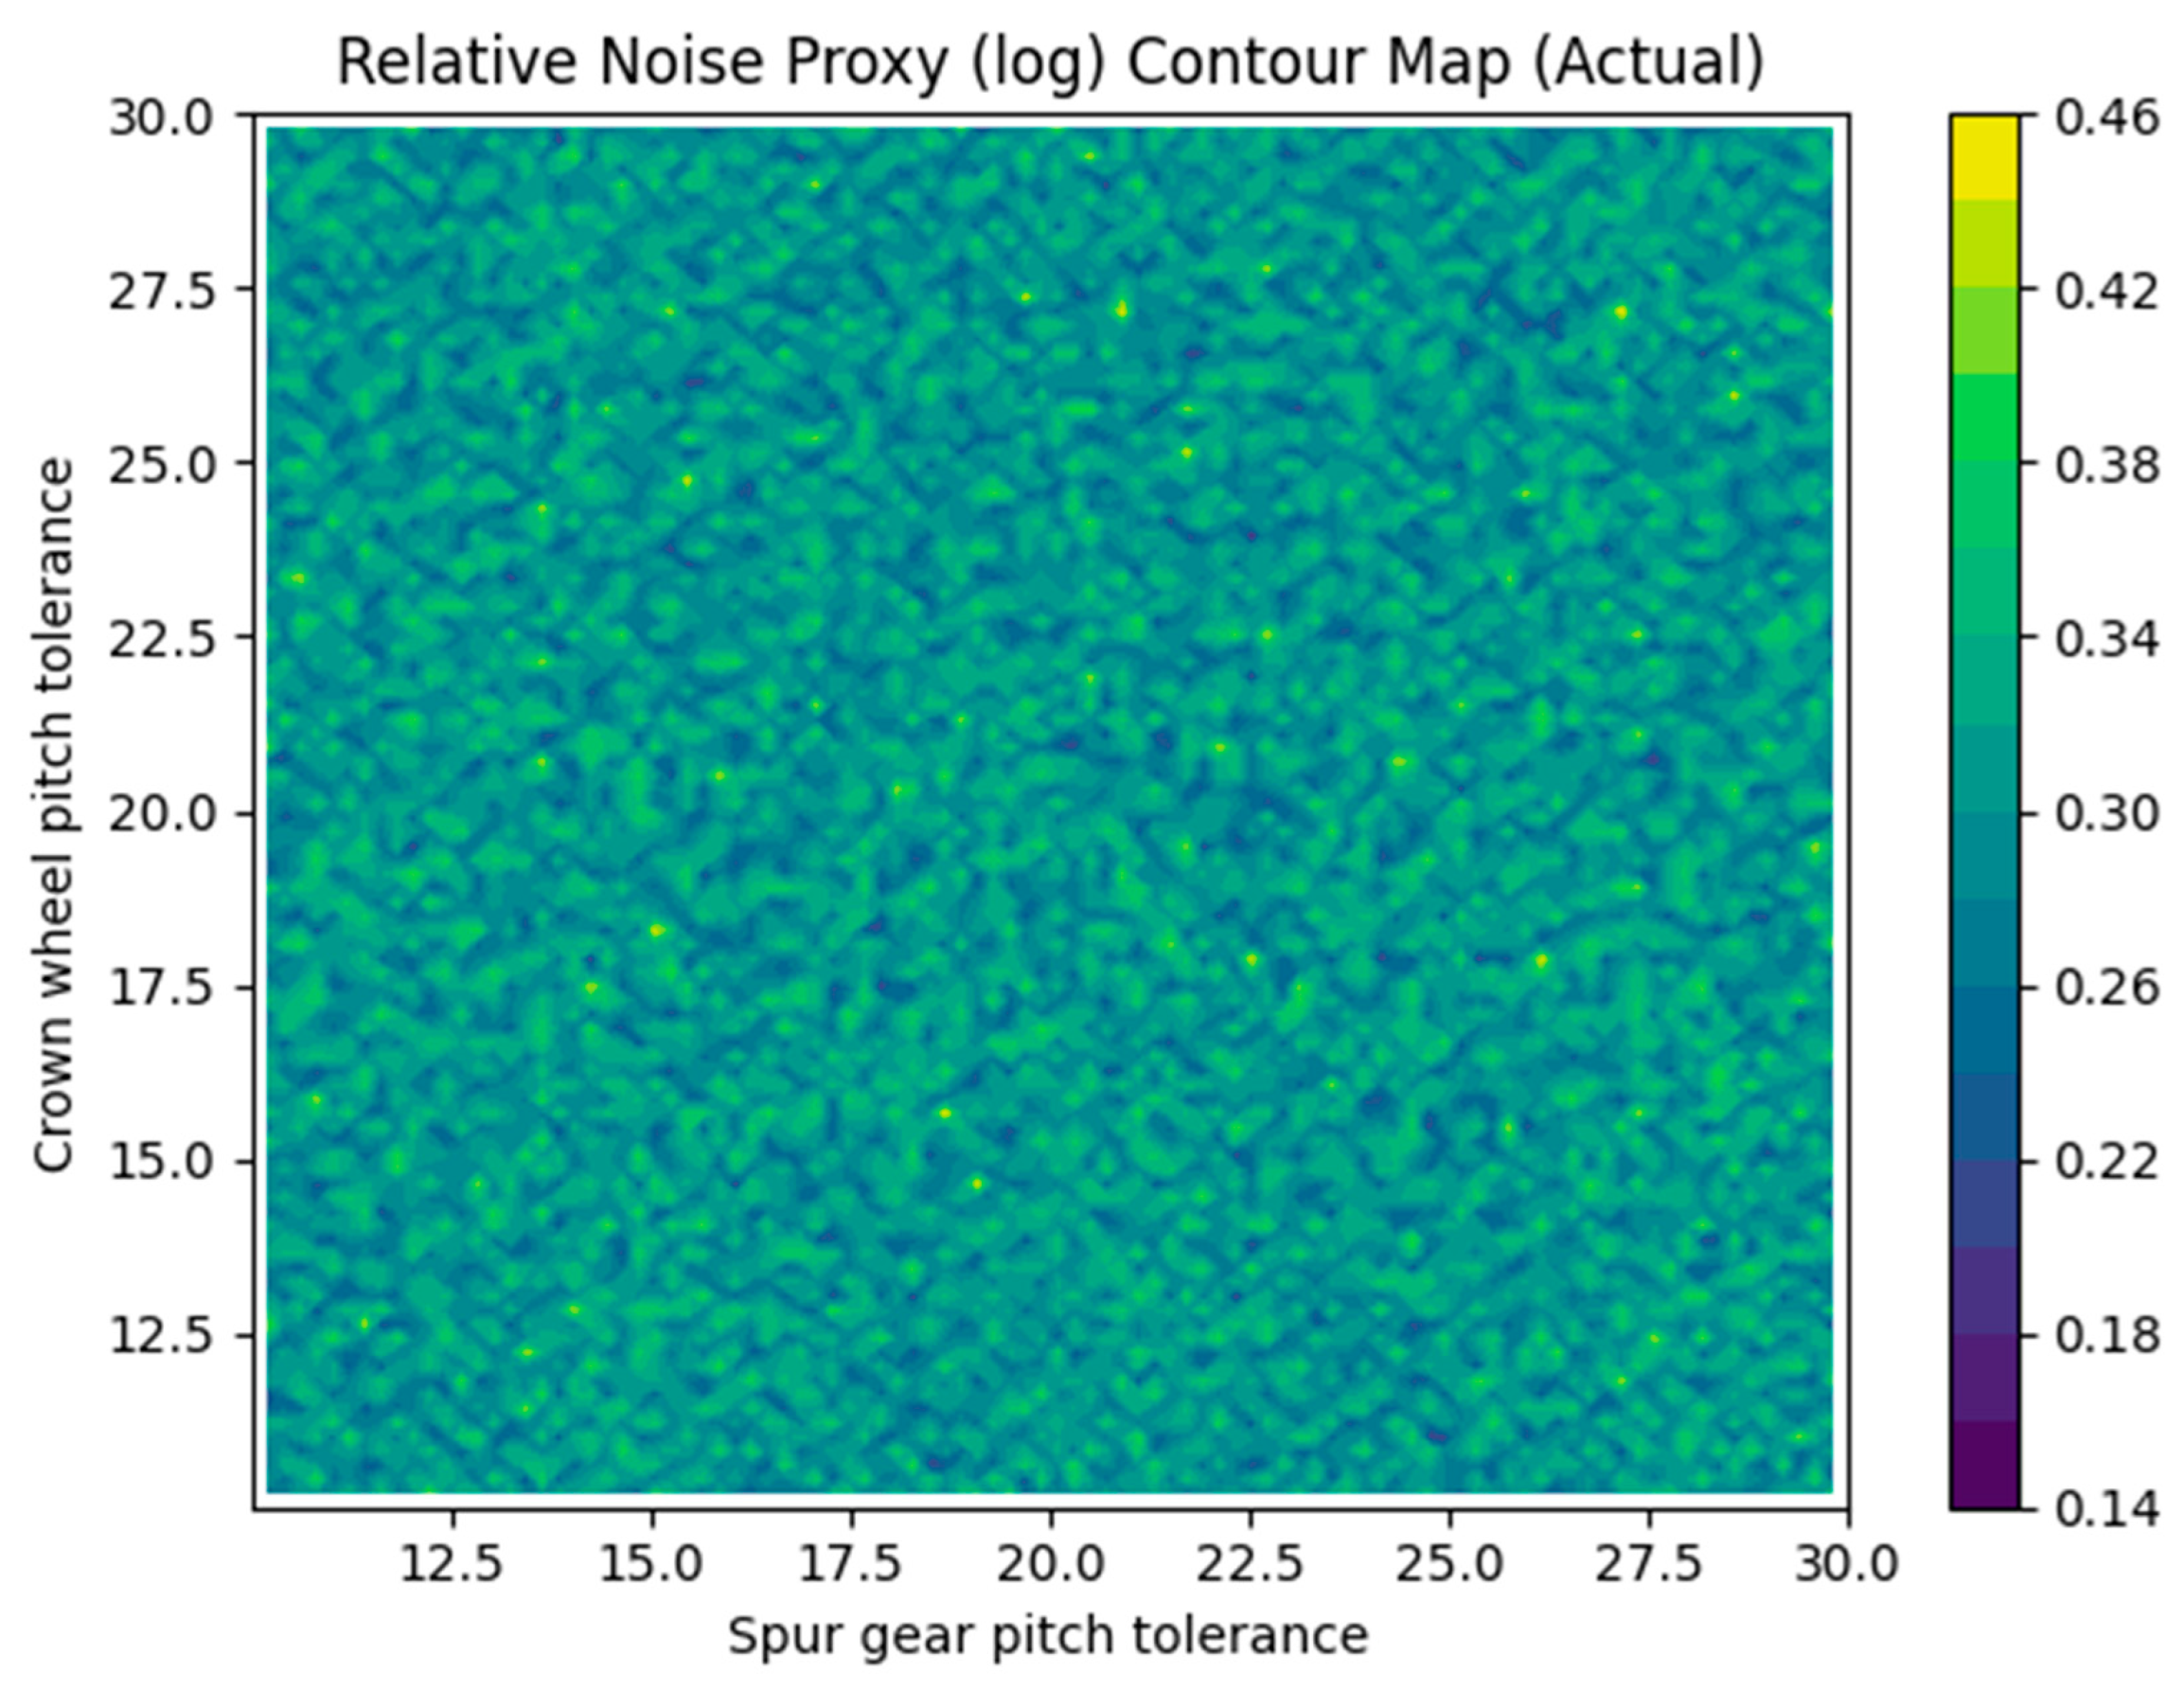
Figure 4.
Cost proxy vs. relative noise proxy with Pareto-optimal front highlighted.
Disclaimer/Publisher’s Note: The statements, opinions and data contained in all publications are solely those of the individual author(s) and contributor(s) and not of MDPI and/or the editor(s). MDPI and/or the editor(s) disclaim responsibility for any injury to people or property resulting from any ideas, methods, instructions or products referred to in the content. |
© 2025 by the authors. Licensee MDPI, Basel, Switzerland. This article is an open access article distributed under the terms and conditions of the Creative Commons Attribution (CC BY) license (http://creativecommons.org/licenses/by/4.0/).
Copyright: This open access article is published under a Creative Commons CC BY 4.0 license, which permit the free download, distribution, and reuse, provided that the author and preprint are cited in any reuse.


