
Submitted:
02 December 2025
Posted:
04 December 2025
You are already at the latest version
Abstract
Background: Maintaining a physical and mental balance in the face of educational, social and behavioral demands requires involvement, perseverance, continuous information and evaluation of evolution. One of the aspects that contributes to maintaining this balance is also socio-professional development during university studies through learning experiences that can shape a more sustainable future. In this sense, the present study aims to nuance the correlations between academic specialization, body composition of students and their living environment. Methods: The assessment of body composition was carried out using bioelectrical impedance analysis on a research sample that included 206 students (105 men and 101 women, average age approximately 20 years). Results: The results obtained indicated a significant correlation between body composition and the field of study. In contrast, regarding the living environment, it did not present a significant influence on the university program of students. Conclusion: These perspectives support a deeper understanding of how we can intervene, through the integration of physical education programs, to promote thinking and practicing physical exercise from the student period in a sustainable way.
Keywords:
university studies
; body composition
; academic specialization
; physical education
1. Introduction
Learning experiences are influenced by a multitude of factors, including environmental contexts, body composition, intrinsic and extrinsic motivation, and the quality of social and educational interactions. There is research has highlighted the disparities in body composition metrics across different living environments, with urban populations often showing higher values for height, weight, and muscle mass compared to their rural counterparts [25]. These differences have been attributed to disparities in access to health resources, physical activity opportunities, and dietary diversity, which are more prevalent in urban settings. Similarly, the field of study plays a significant role, as students in sports and health-related domains are more likely to adopt healthier habits due to increased exposure to health education [21].
University students represent a critical population for studying health behaviors, as they are often in a transitional phase where long-term habits are established [9]. Studies have shown that students from sports and health-related domains display healthier lifestyles compared to their peers from non-sport and health-related domains, including better dietary choices and higher physical activity levels [12].
However, despite these findings, limited research has explored the combined influence of academic focus and living environment on body composition.
It is well known that a deeper understanding of the unique challenges and opportunities that students face in adopting a sustainable lifestyle is needed. Building on these insights, the present study aims to analyze the relationship between body composition, field of study, and living environment among university students, providing a comprehensive perspective on the determinants of health in this population.
Previous research has highlighted the impact of the living environment on students' health behaviors, including food consumption patterns, physical activity levels, and body composition. For instance, Tan et al. (2019) [35], demonstrated that urban women tend to have lower body fat percentages and healthier anthropometric measures compared to their rural counterparts. This difference is primarily attributed to better access to healthcare and dietary resources in urban environments. Bandyopadhyay and Chattopadhyay (1981) [2] found significant differences in body composition, with urban male students exhibiting lower body fat percentages compared to their rural peers, mainly due to access to fitness facilities and structured physical activities.
Furthermore, diet and nutrition play crucial roles in determining body composition. For example, Dare et al. (2017) [7] demonstrated that adherence to the Mediterranean diet positively influenced body composition, with students showing lower body fat and higher lean mass. Similar conclusions were drawn by López-Sánchez et al. (2020) [21], showing that better dietary habits and physical activity levels were linked to improved body composition.
Tafireyi and Grace (2021) [34] further explored the link between body composition and lifestyle habits, revealing that sedentary behavior and poor dietary choices were strongly associated with higher body fat percentages. In contrast, Petreková et al. (2024) [33], in a pilot study on the assessment of body mass index, body composition, physical activity, and dietary preferences in university students, found that students who maintained a balance between diet and physical activity had healthier BMI and body composition metrics.
In a gender-specific analysis, Fayad and Dopsaj (2024) [10] found that dietary habits and activity significantly influenced body composition outcomes, particularly when physical activity was factored in. Oshita et al. (2024) [30] also examined the interaction between body composition, physical activity, nutritional intake status, and chronotype among female university students in Japan, demonstrating that healthier eating patterns and higher physical activity correlated with improved body composition metrics.
The impact of physical activity on body composition and health outcomes is also explored by researchers such as Heydenreich et al. (2021) [13], who found that students engaging in regular physical activity had better body composition and bone health. This finding aligns with Osmani and Peric (2023) [31], who found that students with positive attitudes toward physical activity demonstrated better body composition and overall health markers. These studies collectively highlight the significant role of both environmental factors (urban vs. rural) and individual lifestyle choices (diet, physical activity) in determining body composition outcomes among university students.
In addition to the influence of the living environment, the field of study also plays a significant role in shaping students' health behaviors and body composition. Worldwide findings highlighted those students in health and sports-related fields who followed a well-structured physical activity as part of their academic programs had more favorable body composition metrics due to higher levels of physical activity and better nutrition in contrast with more sedentary fields like humanities or engineering [21].
On the other hand, students in fields that require long hours of studying or computer-based work, such as Engineering or IT, often exhibit higher levels of sedentary behavior and associated health risks. Petreková et al. (2024) [33], found that students in non-sport and health-related fields had higher body mass indexes (BMIs) and body fat percentages than their peers in health fields. These findings align with those of Yahia et al. (2016) [37], who reported that students in more sedentary disciplines had poorer dietary habits and lower physical activity levels, contributing to their less favorable body composition.
Jaremków et al. (2024) [16] explored the relationship between body composition and physical activity level in students of medical faculties, finding that medical students, despite having high academic demands, were more likely to prioritize physical health due to their awareness of its importance. These students showed better body composition metrics compared to students in non-medical fields. Research suggests that students in sports and health fields tend to adopt healthier lifestyles due to awareness of the importance of physical activity and proper nutrition, while students in non-sports fields often face challenges in maintaining a sustainable lifestyle.
Examining the role of gender, age, and field of study in physical activity and sedentary behavior among university students, it was found that students in health-related fields were more physically active compared to students in other fields, such as social sciences or engineering, who exhibited more sedentary behaviors. This higher level of physical activity among health students directly contributed to better body composition, with lower body fat percentages and healthier BMI levels [9].
Exploring the body composition and dietary habits of health college students, Kilinç and Çagdas (2012) [17] found that students in health-related fields had better nutrition knowledge and practiced healthier eating habits, which positively influenced their body composition. On the other hand, gender differences in barriers to physical activity among students studying physical activity and sports sciences were highlighted, showing that while male students generally exhibited healthier body compositions, female students faced more significant challenges in overcoming barriers to regular exercise [22].
Mealha et al. (2013) [23] took a different approach by investigating the risk of eating disorders among dietetics and nutrition students. They found that, paradoxically, despite their knowledge of nutrition, these students were at higher risk for disordered eating behaviors, which had a negative impact on their body composition. This suggests that even in health-related fields, stress and academic pressures can lead to unhealthy behaviors. Students in non-health fields, such as engineering or business, tend to exhibit more sedentary behaviors and poorer dietary habits. Al-Qahtani (2019) [1], in a comparison of health-promoting behaviors between healthcare and non-healthcare students in Saudi Arabia, found that non-healthcare students were less likely to engage in regular physical activity and had poorer dietary habits, which was reflected in their higher BMI and body fat percentages. These findings were supported by Özcan and Bozhüyük (2016) [32], who reported that students in health-related fields had healthier lifestyles than their counterparts in non-health disciplines. In contrast, health-related disciplines often promote behaviors that positively affect body composition. For example, Muñoz-Rodríguez et al. (2021) [28] found that biomedical education significantly influenced students’ health and eating habits, contributing to healthier body composition. Similarly, Chao (2023) [5] reported that health-related students in Taiwan exhibited more health-promoting lifestyle behaviors, such as regular exercise and balanced diets, compared to students in non-health-related fields.
Studies focusing on mental health have also revealed meaningful connections between academic fields and health outcomes. Jansen et al. (2022) [15] conducted a longitudinal analysis that found that students in health-related fields tended to have better mental and physical health outcomes, while those in more academically demanding, sedentary fields like law or computer science showed higher levels of stress and poorer health behaviors. These studies underscore the critical role that academic discipline plays in shaping health behaviors and body composition. Fields that encourage or require physical activity and health-related knowledge tend to produce students with healthier body composition. At the same time, those that involve long periods of sedentarism or higher levels of stress may contribute to poorer results in shaping a sustainable lifestyle.
This study aims to identify the relationship between body composition, field of study, and living environment (urban vs. rural) among students during their academic specialization. It is hypothesized that students enrolled in sports and health-related domains and those living in urban areas will exhibit healthier body compositions, characterized by lower body fat percentages and higher lean muscle mass, compared to their peers in non-sport and health-related fields and rural environments.
2. Materials and Methods
2.1. Study Design
This study employed a cross-sectional design (single-blind) to examine the relationship between body composition, field of study, and living environment (urban vs. rural) among students across their academic specialization. Data was collected at a single time point, using objective physical assessments and using advanced technological tools to ensure accuracy and reliability.
2.2. Participants
The sample consisted of 206 university students (105 males and 101 females) aged around 20 years (M: 19.98 ±2.67; F: 20 ±1.67), all enrolled in various study programs at „Vasile Alecsandri” University of Bacău.
The participants were recruited using purposive sampling and predefined criteria. The inclusion criteria were based on (1) registered on one program study of University ”Vasile Alecsandri” of Bacau, (2) without physical and physiological restriction, (3) having a minimum class attendance rate of 85%, (4) students from both urban and rural areas. Exclusion criteria were applied, and the subjects with (1) musculoskeletal conditions, (2) sustained recent traumatic injuries, (3) experienced significant weight chances (more than 5kg in last 6 months), (4) nutritional disorders, (5) chronic medical condition like diabetes, (6) subjects that taking supplements or medications that could influence the body composition, or (7) subjects that following restricted diets.
The study was conducted in accordance with the Declaration of Helsinki, all participants provided informed consent. The University’s Ethics Committee approved the study with ethical notification on scientific research document No 21319/2/12.11.2024.
2.3. Instruments
Body composition was assessed using two technologies: (1) bioelectrical impedance analysis (BIA) using the Tanita InnerScan V (BC-601) [36] and (2) GMON software, which enabled the transfer of data from the body analyzer to a computer for detailed analysis in real-time.
Tanita InnerScan V (BC-601) is a complex body composition analyzer instrument that uses bioelectrical impedance, one of the most advanced technologies. This allows for the extraction of measurements of body parameters in just 15 seconds. Additionally, it accurately estimates daily calorie intake, considering the average daily activities. The product's specifications are weight (3,1 kg), dimension (344x320x54mm), material (plastic), weight-maximum capacity (150kg), and power supply (4 battery AA size)- (Tanita Corporation, 2018-2019). Also, the measuring platform is equipped with four oval electrodes, a bar with electrodes for hands, a display, and a spot where users can insert an SD memory card.
GMON Software is an advanced tool for analyzing and managing health data, compatible with Tanita body composition analyzers. Its modular structure and interface allow for the efficient management of various types of data. The software provides professional assessments and clear reports that facilitate data collection and results generation (GMON Software - Medizin&Service).
The parameters analyzed included height, body weight, body mass index (BMI), muscle mass, body fat, bone mineralization, hydration levels, metabolic age, and daily caloric consumption.
2.4. Procedures
Participants underwent body composition assessments at the University's Research Center for Human Performance, where trained staff operated the Tanita InnerScan V BC-601 body composition analyzer. Data was automatically transferred to the GMON software, which facilitated real-time analysis and storage of the results.
First, the room was prepared for measuring procedures (sanitized and well-ventilated, the light adjusted, and the temperature set at 20 degrees), and the equipment was prepared (ensuring a stable and safe measuring platform, cleansing the electrodes with alcohol, full battery, SD memory card available, software ready to use). Secondly, the investigator sets the data on the subject, such as birthday, gender, height, and activity level (level 1- inactivity; level 2-occasional; level 3- intense/ athlete).
The subject was informed about the measuring procedure and asked to remain in their underwear. Before accessing the platform, they were asked to clear their feet on a paper towel placed before it. After stepping onto the platform, the examiner ensures that the feet are placed correctly on the electrode, the hand is fully in contact with the electrode of the bar, the knees are not flexed, and the elbows are extended. After the measurement process, the subject steps off the platform.
2.5. Data Analysis
Descriptive statistics, including the arithmetic mean, standard deviation, and coefficient of variation for each parameter, were calculated using JASP software. These measures provided a basic statistical overview of the data, highlighting variability within the sample and allowing for comparisons between groups based on the field of study and living environment.
Given the non-normal distribution of most variables, as assessed by the Shapiro-Wilk test, the Mann-Whitney U test was employed for group comparisons. This non-parametric test allowed for robust comparisons without assuming normality. The test statistics (U) and p-values were reported for each parameter to evaluate statistical significance.
Boxplots were generated to visually represent the distribution of key body composition parameters (e.g., hydration levels, body fat percentage, muscle mass) across groups. These graphical tools emphasized central tendencies, variability, and the presence of outliers, facilitating a more straightforward interpretation of the results.
3. Results
This section explores two major aspects of body composition analysis: the influence of academic domains (sport and health-related vs. non-sport and health-related) and the role of living environments (urban vs. rural). These complementary analyses provide insights into the impact of lifestyle factors, such as educational focus and geographical setting, on students' health parameters.
3.1. Relationship Between Body Composition and Field of Study
These findings provide insights into potential differences between students in sports and health-related (S&H domains) and non-sport and health-related (NS&H domains) academic domains. The analysis focuses on hydration levels, body fat percentage, and muscle mass, offering insights into potential differences influenced by educational focus.
A Mann-Whitney U test was conducted to compare body composition parameters between students in S&H domains and NS&H domains. As shown in Table 1, the results revealed no statistically significant differences for most parameters, including height (p = .079), body weight (p = .178), BMI (p = .324), muscle mass (p = .193), body fat percentage (p = .092), bone mineralization (p = .288), metabolic age (p = .155), and daily caloric consumption (p = .214).
However, a significant difference was observed for hydration levels (U = 6378.50, p = .006). Students in S&H domains exhibited a higher median hydration level (62.2%) compared to those in NS&H domains (58.25%), as illustrated in Figure 1. This result suggests that students in sports and health-related fields may maintain better hydration habits, likely influenced by greater awareness of its importance for health.
Trends in Body Fat Percentage and Muscle Mass
Although no statistically significant differences were found for body fat percentage (U = 4505.00, p = .092), students in S&H domains showed a lower median body fat percentage (18.1%) compared to those in NS&H domains (20.9%), as shown in Figure 2. This trend may indicate differences in lifestyle or physical activity levels between the two groups.
A similar pattern was observed for muscle mass. Students in S&H domains had a slightly lower median muscle mass (46.05 kg) compared to those in NS&H domains (49.9 kg), but the difference was not statistically significant (U = 4667.50, p = .193). This finding is visualized in Figure 3, emphasizing variability within each group.
A comprehensive descriptive analysis of the body composition parameters is presented in Table 2. Key measures such as the median, mean, standard deviation, and coefficient of variation provide additional insights into the variability and distribution of data across the two domains of study. For example, the coefficient of variation for hydration levels was lower in NS&H domains (0.13) compared to S&H domains (0.20), suggesting a more consistent hydration status within the former group.
Overall, students in sports and health-related fields demonstrated higher hydration levels, possibly reflecting greater awareness of healthy habits. While no significant differences were observed for body fat percentage or muscle mass, trends suggest a potential influence of academic domains on lifestyle and physical activity levels.
3.2. Relationship Between Body Composition and Student’ Living Environment
In this part of our article, we present a view of the relationship between body composition parameters and students' living environments (urban vs. rural).
Table 3 presents descriptive statistics and Mann-Whitney U test results, while Figure 4, Figure 5, Figure 6, Figure 7 and Figure 8 provide graphical representations of the data. Each parameter's interquartile range (IQR) highlights the variability within and between groups. Significant differences were observed for several parameters, including height, body weight, BMI, muscle mass, and caloric consumption, emphasizing the influence of the living environment on body composition. In contrast, no significant differences were found in body fat percentage and hydration levels.
The Body Mass Index (BMI) significantly differed between urban and rural student environments (U = 6231.00, p = 0.02). As shown in Table 3, the median BMI for rural students (21.8) was higher compared to urban students (21.3). The interquartile range (IQR) for urban students was 19.90–25.10, indicating broader variability, while for rural students, the IQR was narrower, at 19.10–23.50. This result is visualized in Figure 4, where the boxplot illustrates the distribution of BMI for both groups. Although the medians are close, the IQR difference suggests more significant BMI variability among urban students.
Body weight also showed a statistically significant difference between urban and rural students (U = 6335.00, p = 0.01). Urban students had a higher median weight (66.3 kg) compared to rural students (61.5 kg), as detailed in Table 3. The IQR for urban students was 57.20–75.40, while for rural students, it was 53.60–69.60. Figure 5 illustrates these differences, showing that rural students exhibit a slightly narrower distribution, while urban students display a broader range of values.
Daily caloric consumption differed significantly between the two environments (U = 6390.00, p = 0.01). Urban students reported a higher median caloric intake (2400 kcal) compared to rural students (2200 kcal), as shown in Table 3. The IQR for urban students was 2126.00–2935.00, indicating higher variability compared to rural students (IQR: 2034.00–2664.00). In Figure 6, the boxplot demonstrates this difference, with urban students clustering around higher caloric values and rural students showing a narrower distribution.
The Mann-Whitney U test revealed a significant difference in height between urban and rural students (U = 6475.00, p = 0.006). The median height for urban students was greater (173 cm) compared to rural students (168 cm). As seen in Table 3, the IQR for urban students was 166.00–180.00, while for rural students, it was narrower at 162.00–175.00. This difference is further emphasized in Figure 7, where the boxplot shows a consistent upward shift for urban students compared to their rural counterparts.
Muscle mass was significantly higher among urban students (U = 6430.00, p = 0.01). The median muscle mass for urban students was 50.0 kg compared to 47.0 kg for rural students, as outlined in Table 3. The IQR for urban students was 41.80–60.40, while for rural students, it was narrower at 39.40–54.50. Figure 8 highlights this difference, showing that urban students generally exhibit higher and more consistent muscle mass levels compared to rural students.
Although no statistically significant differences were observed for Body Fat Percentage (p = 0.72) or Hydration Levels (p = 0.39), these parameters are presented in Table 3 for completeness. The medians were similar across urban and rural groups, indicating comparable distributions.
The analysis revealed significant differences in several body composition parameters between students from urban and rural environments. Urban students exhibited higher median values for height, body weight, BMI, muscle mass, and caloric consumption, suggesting a potential influence of lifestyle, dietary habits, and access to health resources associated with urban living. In contrast, no significant differences were observed for body fat percentage and hydration levels, indicating a comparable distribution of these parameters across both environments. These findings underscore the role of the living environment as a determinant of certain health-related metrics, with urban students generally displaying characteristics linked to greater nutritional and physical activity opportunities.
4. Discussion
This study investigated the relationship between body composition, field of study, and living environment among university students. The findings highlighted significant differences in hydration levels, height, BMI, and muscle mass, emphasizing the role of academic focus and geographical setting in shaping body composition. These results align with broader trends in the literature, including disparities observed globally between urban and rural populations [8] and the influence of academic exposure to health education on lifestyle behaviors [20,29].
The relationship between study programs and body composition observed in our sample is supported by research exploring the impact of physical activity on health. Hui et al. (2020) [14] and Chacón-Borrego (2023) [4] confirm that different levels of physical activity significantly influence body composition, particularly in young people. Furthermore, Bou-Sospedra et al. (2020) [3] suggests that fitness levels can serve as predictors of overall health and mental balance.
Our analysis revealed higher hydration levels among students in sport and health-related (S&H) fields compared to non-sport and health-related (NS&H) fields. This finding aligns with previous studies [12,21] who emphasized the role of health education in promoting healthier behaviors. At the same time, this is consistent with Lewandowski et al. (2024) [20], who noted that students exposed to health-focused education are more likely to adopt better hydration practices and healthier lifestyles. These results suggest that integrating health education into academic curricula can positively influence health-related behaviors.
Despite no significant differences in body fat percentage or muscle mass, trends observed in our data suggest a healthier overall profile for students in S&H fields, consistent with the notion that exposure to health-related curricula fosters awareness and healthier lifestyles [9]. Similarly, this study complies with O’Brien et al. (2022) [29], who reported a steady decline in physical fitness even among students specializing in human movement. This decline could be attributed to modern sedentary lifestyles and limited engagement in regular physical activity despite formal health education. Such trends highlight the importance of sustained, practical interventions complementing theoretical knowledge. Morales et al. (2023) [27] further emphasized the role of physical activity in shaping anthropometric profiles, advocating for structured physical activity programs within academic curricula.
The study showed significant differences in body composition parameters (height, weight, BMI, muscle mass, and caloric consumption) between urban and rural students. These findings align closely with Mihai et al. (2024) [25], who observed similar trends, attributing these differences to disparities in access to health resources, physical activity opportunities, and dietary options. Urban students consistently exhibited higher median values for these parameters, reflecting disparities in access to resources, such as healthcare, fitness facilities, and diverse dietary options. These findings are supported by Dong et al. (2019) [8], who demonstrated similar patterns among Chinese children and adolescents, attributing these differences to regional variations in health infrastructure and economic development.
The differences between urban and rural environments identified in our study align with previous research highlighting the significant impact of environmental factors on physical health. Frehlich et al. (2024) [11] and Kranjac et al. (2024) [19] emphasize that urbanization levels are crucial in shaping body composition and fitness. Similarly, Cook et al. (2020) [6] underscore the distinctive body composition characteristics observed in rural settings, supporting the trends found in our sample.
Urban students benefit from a greater variety of food options, access to gyms, and structured physical activities, which may explain our study's higher BMI and muscle mass. Additionally, the broader variability in urban students' parameters could reflect the duality of urban living, where healthier options coexist with increased risks of sedentary behavior and stress (Mealha et al., 2013). For rural students, the observed lower BMI, muscle mass, and caloric consumption values align with reports from Mihai et al. (2024), who noted that limited access to health resources in rural areas contributes to these disparities.
No significant differences were observed for body fat percentage and hydration levels, suggesting that these parameters may be more influenced by individual habits or genetic predispositions rather than environmental factors.
The use of bioelectrical impedance analysis (BIA) in this study ensured precise and reliable body composition measurements. This methodology aligns with the recommendations of Mocini et al. (2023) [26], who highlighted the importance of advanced technologies for accurate assessments. Similarly, Kokura et al. (2023) [18] noted the growing utility of non-invasive techniques like BIA and ultrasound, emphasizing their suitability for large-scale studies.
Integrating such technologies provides a robust framework for assessing body composition across diverse populations, facilitating comparisons between groups and ensuring methodological consistency.
These findings underscore the need for targeted health promotion strategies:
- for urban students: developing strategies to mitigate sedentary behavior and stress in urban settings can enhance the health benefits associated with better resource access [23].
5. Conclusions
This study provides valuable information about the relationships between body composition, field of study, and living environment among students, regardless of academic major. The results reveal significant differences in body composition parameters, such as hydration levels, BMI, and muscle mass, highlighting the role of forming a balance between physical and intellectual effort through more sustainable educational practices.
Although no significant differences were observed between academic fields in terms of body fat percentage or muscle mass, trends suggest that education structured through learning experiences positively influences awareness of more sustainable perspectives by adopting healthy behaviors and maintaining a balance between physical and intellectual activity.
The certainty that learning experiences encourage sustainable thinking and practices among students and contribute to a more sustainable future is also highlighted by the results of the analysis of living environments, which revealed that students from urban areas had higher median values for height, weight, BMI, muscle mass and caloric intake, possibly due to better access to medical resources, diverse food options and facilities for physical activity. However, students from rural areas had a comparable distribution of body fat percentage and hydration levels, suggesting that individual habits may influence these parameters more than environmental factors and may affect the quality of intellectual activity.
Limitations and Future Directions
This study has several limitations. First, the cross-sectional design precludes causal interpretations of the relationships observed. Second, the sample was limited to a single university, which may not fully represent broader student populations. Third, while some environmental factors were considered, additional variables, such as socioeconomic status, stress levels, and sleep patterns, could further illuminate the interplay between environment and body composition. Future research should employ longitudinal designs to explore changes in body composition over time, include diverse and representative samples, and investigate the role of psychosocial factors in shaping health behaviors. Incorporating qualitative data, such as interviews or focus groups, could also provide deeper insights into the motivations behind student health behaviors.
Author Contributions
software, I.M., C.D.P and G.M.; validation, C.I.A., E.A.P., C.D.P. and I.M.; formal analysis, I.M., C.D.P. and G.M.; investigation, D.I.A., I.M., E.A.P and C.I.A.; resources, E.A.P., C.D.P. and C.I.A.; data curation, I.M., D.I.A., C.D.P. and E.A.P.; writing—original draft preparation, D.I.A., I.M. and E.A.P.; writing—review and editing, D.I.A., I.M., C.I.A., E.A.P., C.D.P. and G.M.; visualization, I.M. and C.D.P.; supervision, D.I.A., I.M. and C.I.A.; project administration, D.I.A.; funding acquisition, D.I.A., E.A.P., G.M. and C.I.A. All authors have read and agreed to the published version of the manuscript.
Funding
This research was funded by National Council for Financing Higher Education Romania and ”Vasile Alecsandri” University of Bacău, Romania, grant number CNFIS-FDI-2022-0087 REconect-UBc. The APC will be financed by the ”Vasile Alecsandri” University of Bacău, Romania.
Institutional Review Board Statement
The study was conducted in accordance with the Declaration of Helsinki, and approved by the University’s Ethics Committee of the ”Vasile Alecsandri” University of Bacău (No 21319/2/12.11.2024).
Informed Consent Statement
Informed consent was obtained from all subjects involved in the study.
Data Availability Statement
The original contributions presented in the study are included in the article, further inquiries can be directed to the corresponding author. The data that support the findings of this study are available on request from the corresponding author.
Acknowledgments
The authors thank the students and volunteers for their active involvement, the National Council for Financing Higher Education, Romania and ”Vasile Alecsandri” University of Bacău for their support and encouragement.
Conflicts of Interest
The authors declare no conflicts of interest.
References
- Al-Qahtani, M.F. Comparison of health-promoting lifestyle behaviours between female students majoring in healthcare and non-healthcare fields in KSA. J. Taibah Univ. Med Sci. 2019, 14, 508–514. [Google Scholar] [CrossRef] [PubMed]
- Bandyopadhyay, B.; Chattopadhyay, H. Body fat in urban and rural male college students of Eastern India. Am. J. Phys. Anthr. 1981, 54, 119–122. [Google Scholar] [CrossRef]
- Bou-Sospedra, C.; Adelantado-Renau, M.; Beltran-Valls, M.R.; Moliner-Urdiales, D. Association between Health-Related Physical Fitness and Self-Rated Risk of Depression in Adolescents: Dados Study. Int. J. Environ. Res. Public Heal. 2020, 17, 4316. [Google Scholar] [CrossRef]
- Chacón-Borrego, F. Physical activity and physical fitness in children and their relationship on body fat. J. Hum. Sport Exerc. 2022, 18, 283–295. [Google Scholar] [CrossRef]
- Chao, D.-P. Health-promoting lifestyle and its predictors among health-related and non-health-related university students in Taiwan: a cross-sectional quantitative study. BMC Public Heal. 2023, 23, 1–14. [Google Scholar] [CrossRef]
- Cook, I.; Mohlabe, M.; Alberts, M. Descriptive epidemiology of objectively-measured, free-living sleep parameters in a rural African setting. BMC Res. Notes 2020, 13, 1–8. [Google Scholar] [CrossRef] [PubMed]
- Dare, C.; Viebig, R. F.; Batista, N. S. P. Body composition and components of Mediterranean Diet in Brazilian and European University Students. Rbone-Revista Brasileira de Obesidade Nutricao e Emagrecimento 2017, 11(67), 557–566. [Google Scholar]
- Dong, Y.; Lau, P.W.C.; Dong, B.; Zou, Z.; Yang, Y.; Wen, B.; Ma, Y.; Hu, P.; Song, Y.; Ma, J.; et al. Trends in physical fitness, growth, and nutritional status of Chinese children and adolescents: a retrospective analysis of 1·5 million students from six successive national surveys between 1985 and 2014. Lancet Child Adolesc. Heal. 2019, 3, 871–880. [Google Scholar] [CrossRef]
- Edelmann, D.; Pfirrmann, D.; Heller, S.; Dietz, P.; Reichel, J.L.; Werner, A.M.; Schäfer, M.; Tibubos, A.N.; Deci, N.; Letzel, S.; et al. Physical Activity and Sedentary Behavior in University Students–The Role of Gender, Age, Field of Study, Targeted Degree, and Study Semester. Front. Public Heal. 2022, 10, 821703. [Google Scholar] [CrossRef]
- Fayad, F.; Dopsaj, M. Influence of dietary habits on body composition in Lebanese active University students. Kinesiol. Slov. 2024, 30, 78–93. [Google Scholar] [CrossRef]
- Frehlich, L.; Turin, T.C.; Doyle-Baker, P.K.; McCormack, G.R. Neighbourhood walkability and greenspace and their associations with health-related fitness in urban dwelling Canadian adults. Prev. Med. 2024, 184, 107998. [Google Scholar] [CrossRef]
- González-Carcelén, C.M.; Sánchez, G.F.L.; Sánchez-García, C.; Ortega, E.J.I.; Suárez, A.D. Composición corporal e imagen corporal de estudiantes de Ciencias del Deporte. Sport. Sci. J. Sch. Sport, Phys. Educ. Psychomot. 2018, 4, 411–425. [Google Scholar] [CrossRef]
- Heydenreich, J.; Schweter, A.; Lührmann, P. Impact of physical activity, anthropometric, body composition, and dietary factors on bone stiffness in German university students. J. Sports Med. Phys. Fit. 2021, 61, 571–581. [Google Scholar] [CrossRef]
- Hui, S.S.-C.; Zhang, R.; Suzuki, K.; Naito, H.; Balasekaran, G.; Song, J.-K.; Park, S.Y.; Liou, Y.-M.; Lu, D.; Poh, B.K.; et al. Physical activity and health-related fitness in Asian adolescents: The Asia-fit study. J. Sports Sci. 2019, 38, 273–279. [Google Scholar] [CrossRef]
- Jansen, M.; Chapman, C.; Richardson, T.; Elliott, P.; Roberts, R. The relationship between mental and physical health: a longitudinal analysis with British student. J. Public Ment. Heal. 2022, 21, 218–225. [Google Scholar] [CrossRef]
- Jaremków, A.; Markiewicz-Górka, I.; Hajdusianek, W.; Czerwińska, K.; Gać, P. The Relationship between Body Composition and Physical Activity Level in Students of Medical Faculties. J. Clin. Med. 2023, 13, 50. [Google Scholar] [CrossRef]
- Kilinc, F.N.; Cagdas, D. Sağlık meslek lisesi öğrencilerinin beslenme alışkanlıklarının, beslenme bilgi düzeylerinin ve vücut bileşimlerinin değerlendirilmesi. Turk. Arch. Pediatr. 2012, 47, 181–188. [Google Scholar] [CrossRef]
- Kokura, Y.; Nishioka, S.; Maeda, K.; Wakabayashi, H. Ultrasound utilized by registered dietitians for body composition measurement, nutritional assessment, and nutritional management. Clin. Nutr. ESPEN 2023, 57, 173–180. [Google Scholar] [CrossRef] [PubMed]
- Kranjac, A.W.; Kranjac, D.; Kain, Z.N.; Ehwerhemuepha, L.; Jenkins, B.N. Obesity Heterogeneity by Neighborhood Context in a Largely Latinx Sample. J. Racial Ethn. Heal. Disparities 2023, 11, 980–991. [Google Scholar] [CrossRef]
- Lewandowski, A.; Siedlaczek, M.; Piekorz, Z.; Kryst, Ł. “Secular trends (2001–2020) in physical fitness as a health component in physiotherapy students from Bydgoszcz (Poland)”. Sci. Rep. 2024, 14, 1–13. [Google Scholar] [CrossRef] [PubMed]
- Smith, L.; López-Sánchez, G.; Radzimiński, Ł.; Skalska, M.; Jastrzębska, J.; Smith, L.; Wakuluk, D.; Jastrzębski, Z. Body composition, physical fitness, physical activity and nutrition in Polish and Spanish female students of sports sciences. Sci. Sports 2020, 35, e21–e28. [Google Scholar] [CrossRef]
- Martínez-Sánchez, S.M.; Martínez-Sánchez, L.M.; Martínez-García, C. Gender differences in barriers to physical exercise among university students studying physical activity and sports sciences. Heal. Educ. J. 2024, 83, 192–204. [Google Scholar] [CrossRef]
- Mealha, V.; Ferreira, C.; Guerra, I.; Ravasco, P. Students of dietetics & nutrition; a high risk group for eating disorders? Nutr. Hosp. 2013, 28, 1558–1566. [Google Scholar] [CrossRef]
- Medina, G.; Reyes, M.I.Z.; Bajaña, J.T.M. Composición corporal y nivel de actividad física en la población de Milagro (Body composition and level of physical activity in the population of Milagro). Retos 2024, 61, 1009–1015. [Google Scholar] [CrossRef]
- Mihai, I.; Rada, L.; Enache, C.; Bejtka, M.; Bakiko, I.; Alexe, C.I. Trends regarding the living environment and body composition among university students. Phys. Educ. Stud. 2024, 28, 242–249. [Google Scholar] [CrossRef]
- Mocini, E.; Cammarota, C.; Frigerio, F.; Muzzioli, L.; Piciocchi, C.; Lacalaprice, D.; Buccolini, F.; Donini, L.M.; Pinto, A. Digital Anthropometry: A Systematic Review on Precision, Reliability and Accuracy of Most Popular Existing Technologies. Nutrients 2023, 15, 302. [Google Scholar] [CrossRef]
- Ferro, E.F.; Morales, C.; Osorio, J.; Cid, F.M. Independence of the anthropometric profile, attention and intelligence in higher education students in the field of physical activity in Chile. 2023, 40, 1246–1252. [Google Scholar] [CrossRef] [PubMed]
- Muñoz-Rodríguez, J.R.; Luna-Castro, J.; Ballesteros-Yáñez, I.; Pérez-Ortiz, J.M.; Gómez-Romero, F.J.; Redondo-Calvo, F.J.; Alguacil, L.F.; Castillo, C.A. Influence of biomedical education on health and eating habits of university students in Spain. Nutrition 2021, 86, 111181. [Google Scholar] [CrossRef]
- O’brien, M.W.; Shivgulam, M.E.; Wojcik, W.R.; Barron, B.A.; Seaman, R.E.; Fowles, J.R. 30 Year Trends of Reduced Physical Fitness in Undergraduate Students Studying Human Movement. Int. J. Environ. Res. Public Heal. 2022, 19, 14099. [Google Scholar] [CrossRef]
- Oshita, K.; Ishihara, Y.; Seike, K.; Myotsuzono, R. Associations of body composition with physical activity, nutritional intake status, and chronotype among female university students in Japan. J. Physiol. Anthr. 2024, 43, 1–9. [Google Scholar] [CrossRef]
- Osmani, A.; Perić, D.B. Physical activity, body composition and attitudes toward exercise among college students. South Afr. J. Res. Sport, Phys. Educ. Recreat. 2023, 45, 60–79. [Google Scholar] [CrossRef]
- Özcan, S.; Bozhüyük, A. Çukurova Üniversitesi sağlık bilimleri öğrencilerinin sağlıklı yaşam davranışları. Cukurova Med J. 2016, 41, 664–674. [Google Scholar] [CrossRef]
- Petřeková, K.; Borzenko, N.; Kovalová, M.; Gottfriedová, N. Assessment of Body Mass Index, Body Composition, Physical Activity, and Dietary Preferences in University Students: A Pilot Study. Obesities 2024, 4, 35–44. [Google Scholar] [CrossRef]
- Tafireyi, C. G. S.; Grace, J. Association between sedentariness, eating habits and body composition among Eswatini university students. South African Journal for Research in Sport Physical Education and Recreation 2021, 43(3), 77–86. [Google Scholar]
- Tan, M.; Brown, L.J.; Mathews, K.I.; Whatnall, M.C.; Hutchesson, M.J.; MacDonald-Wicks, L.K.; Patterson, A.J. Rural versus urban women: An examination of anthropometry and body composition. Aust. J. Rural. Heal. 2019, 27, 70–77. [Google Scholar] [CrossRef] [PubMed]
- TANITA INNERSCAN V BC-601 MANUAL Pdf Download | ManualsLib. 12 February 2025. Available online: https://www.manualslib.com/manual/2723866/Tanita-Innerscan-V-Bc-601.html.
- Yahia, N.; Wang, D.; Rapley, M.; Dey, R. Assessment of weight status, dietary habits and beliefs, physical activity, and nutritional knowledge among university students. Perspect. Public Heal. 2015, 136, 231–244. [Google Scholar] [CrossRef] [PubMed]
Figure 1.
Distribution of hydration levels (%) by domain (S&H domains vs. NS&H domains).
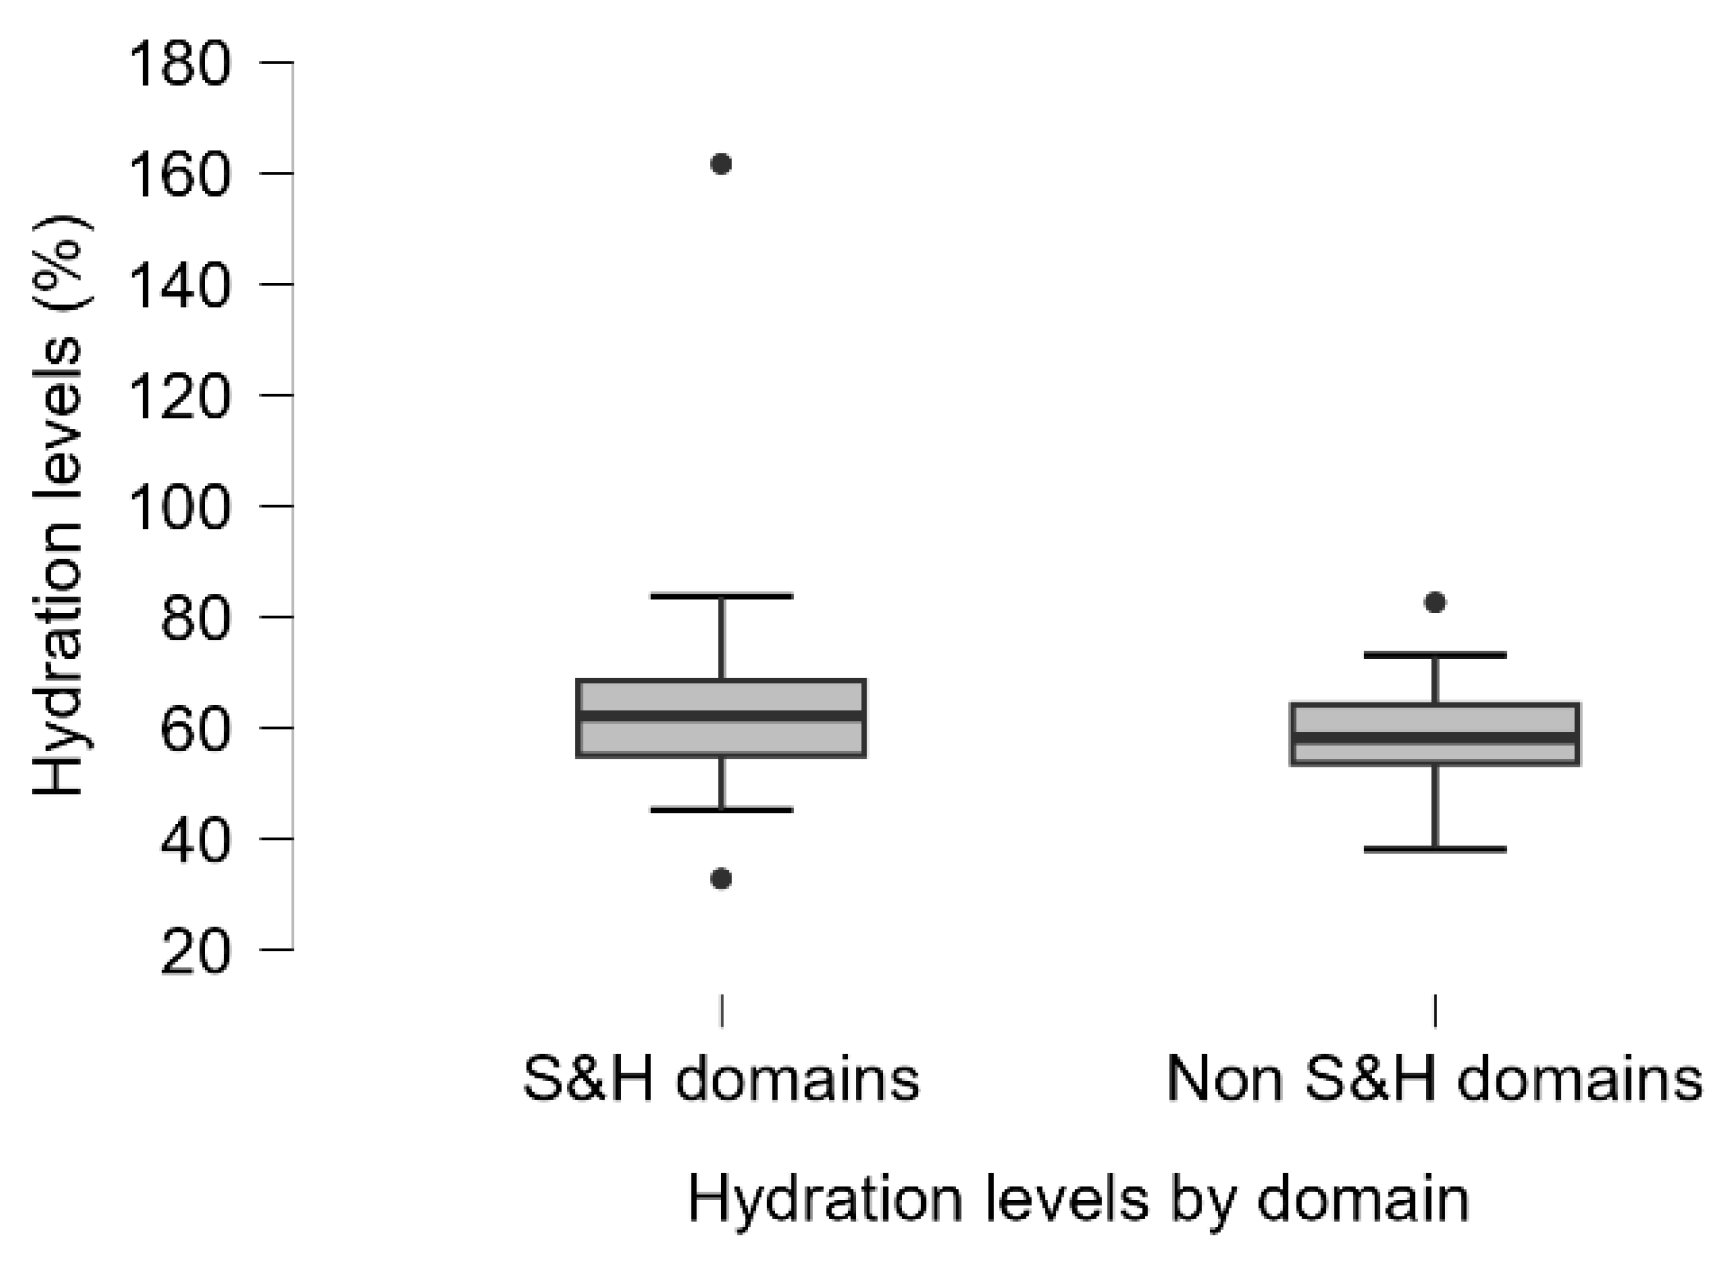
Figure 2.
Distribution of body fat percentage (%) by domain (S&H domains vs. NS&H domains).
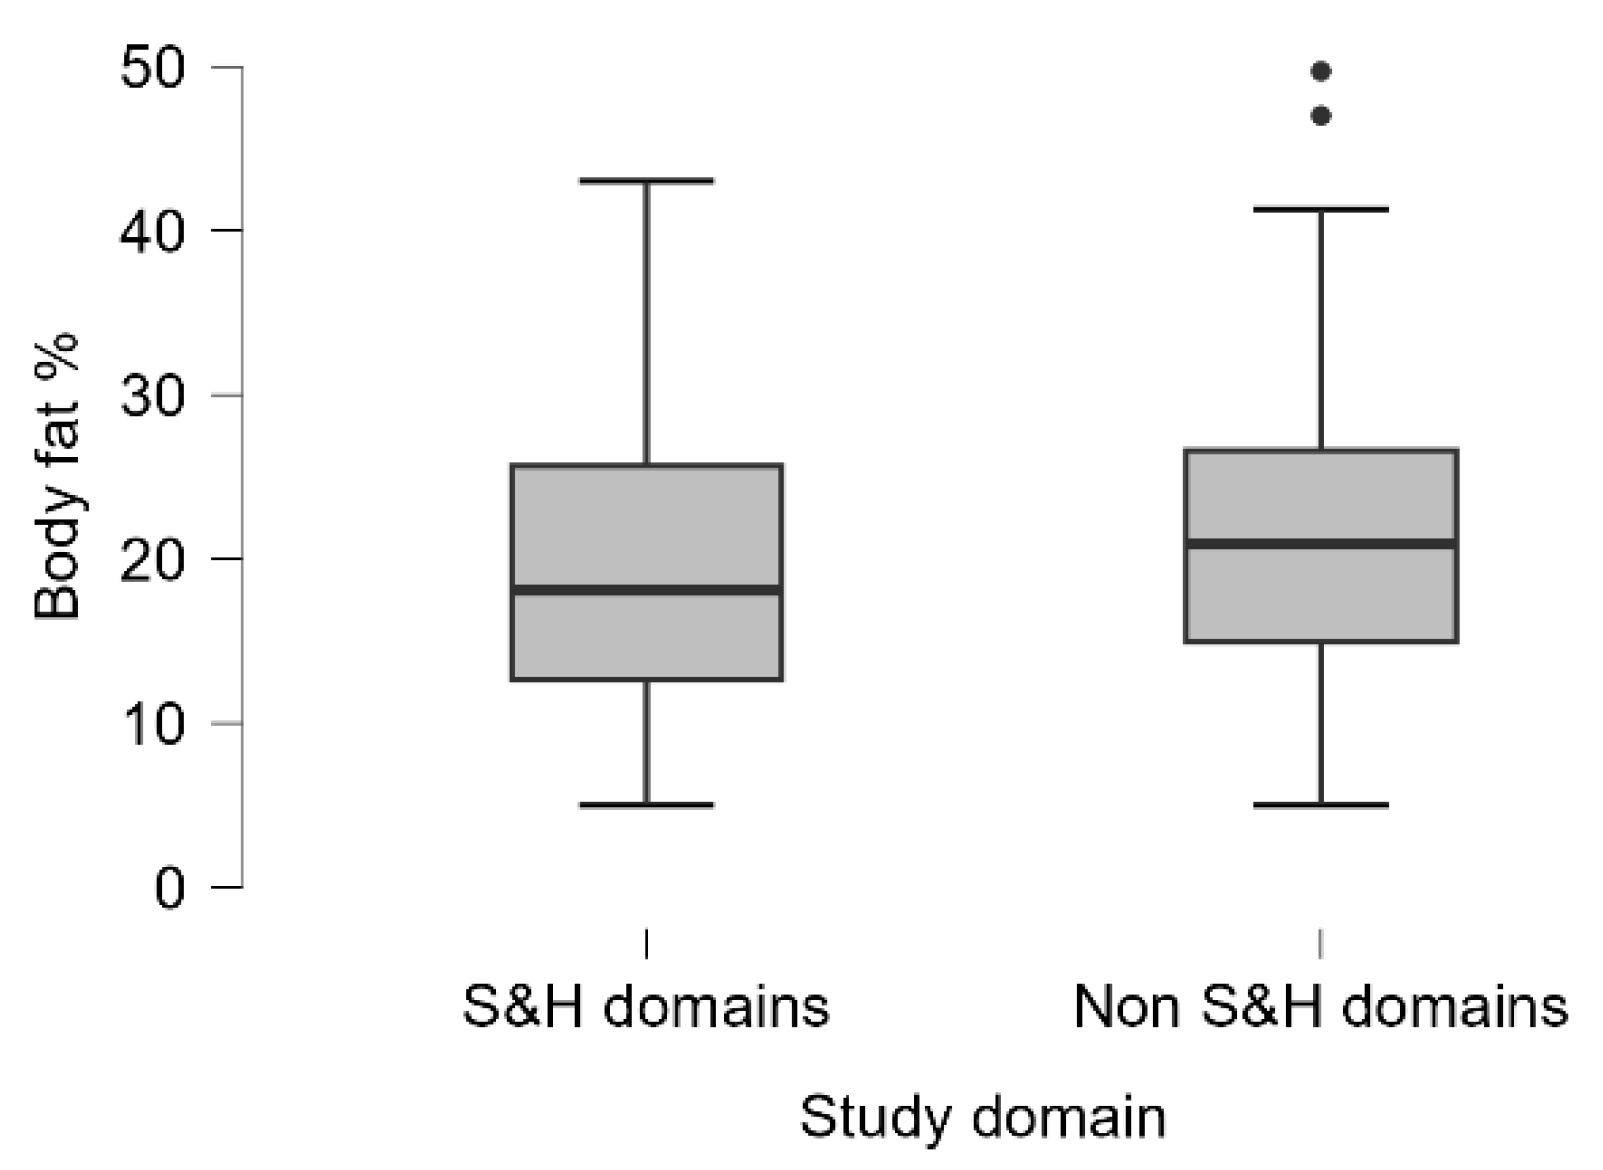
Figure 3.
Distribution of muscle mass (kg) by domain (S&H domains vs. NS&H domains).
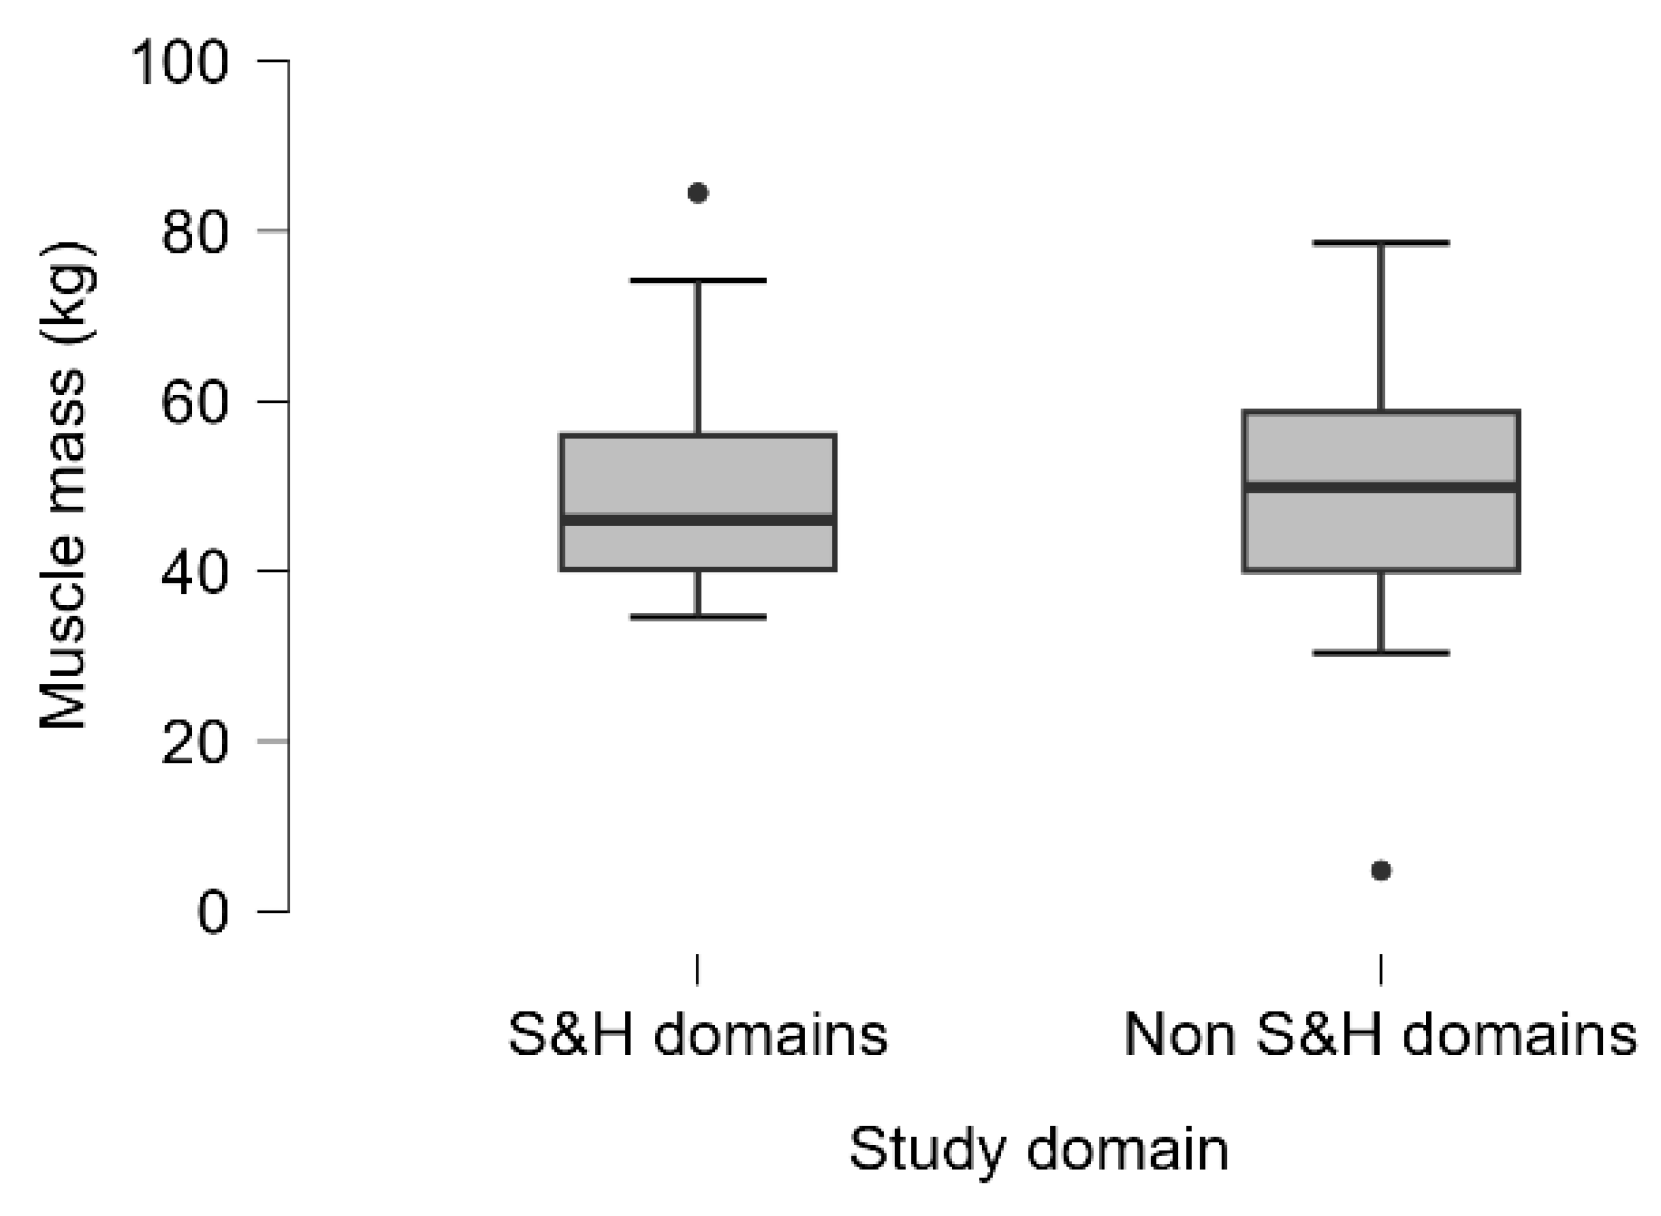
Figure 4.
Distribution of Body Mass Index (BMI) by living environment (Urban vs. Rural).
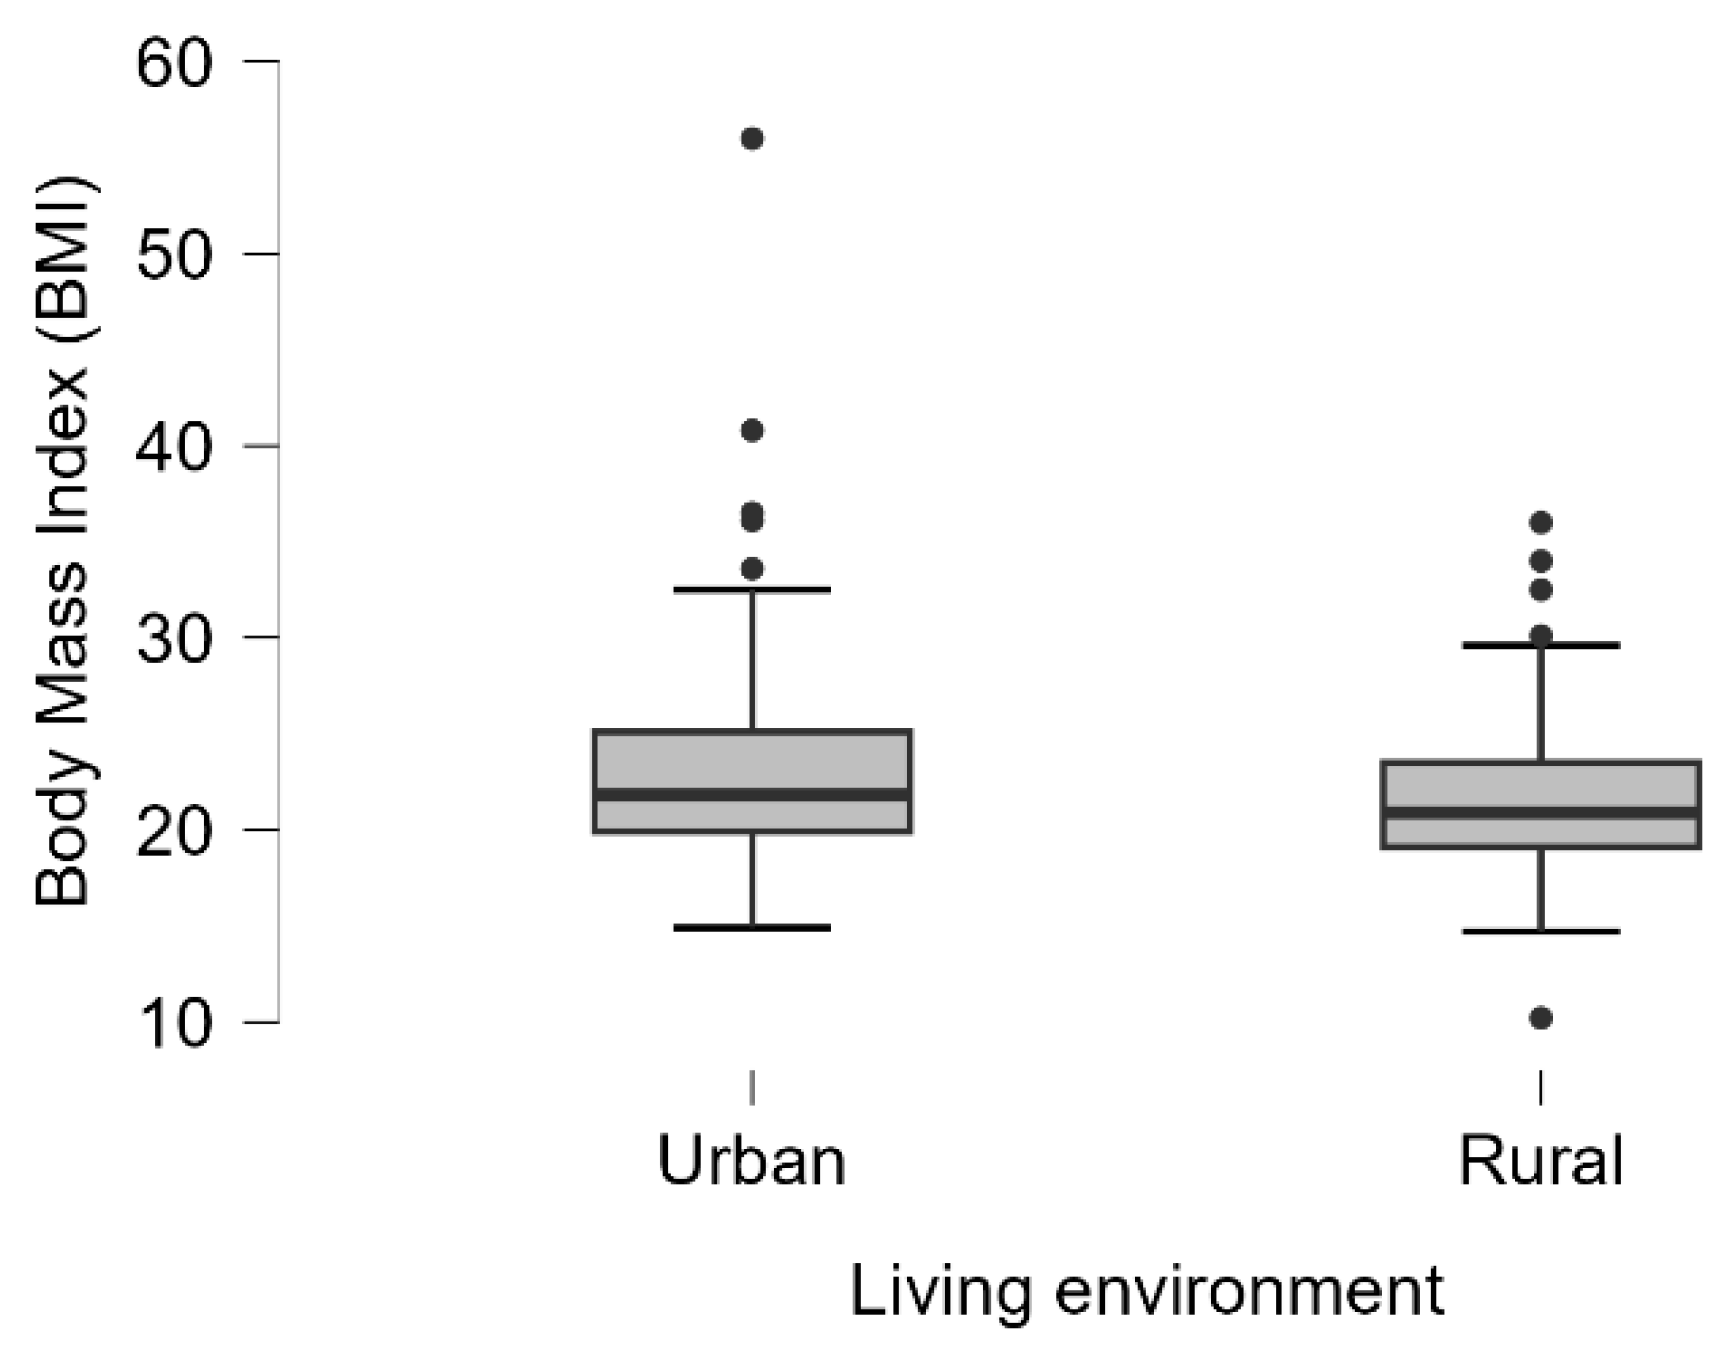
Figure 5.
Weight Distribution by living environment (Urban vs. Rural).
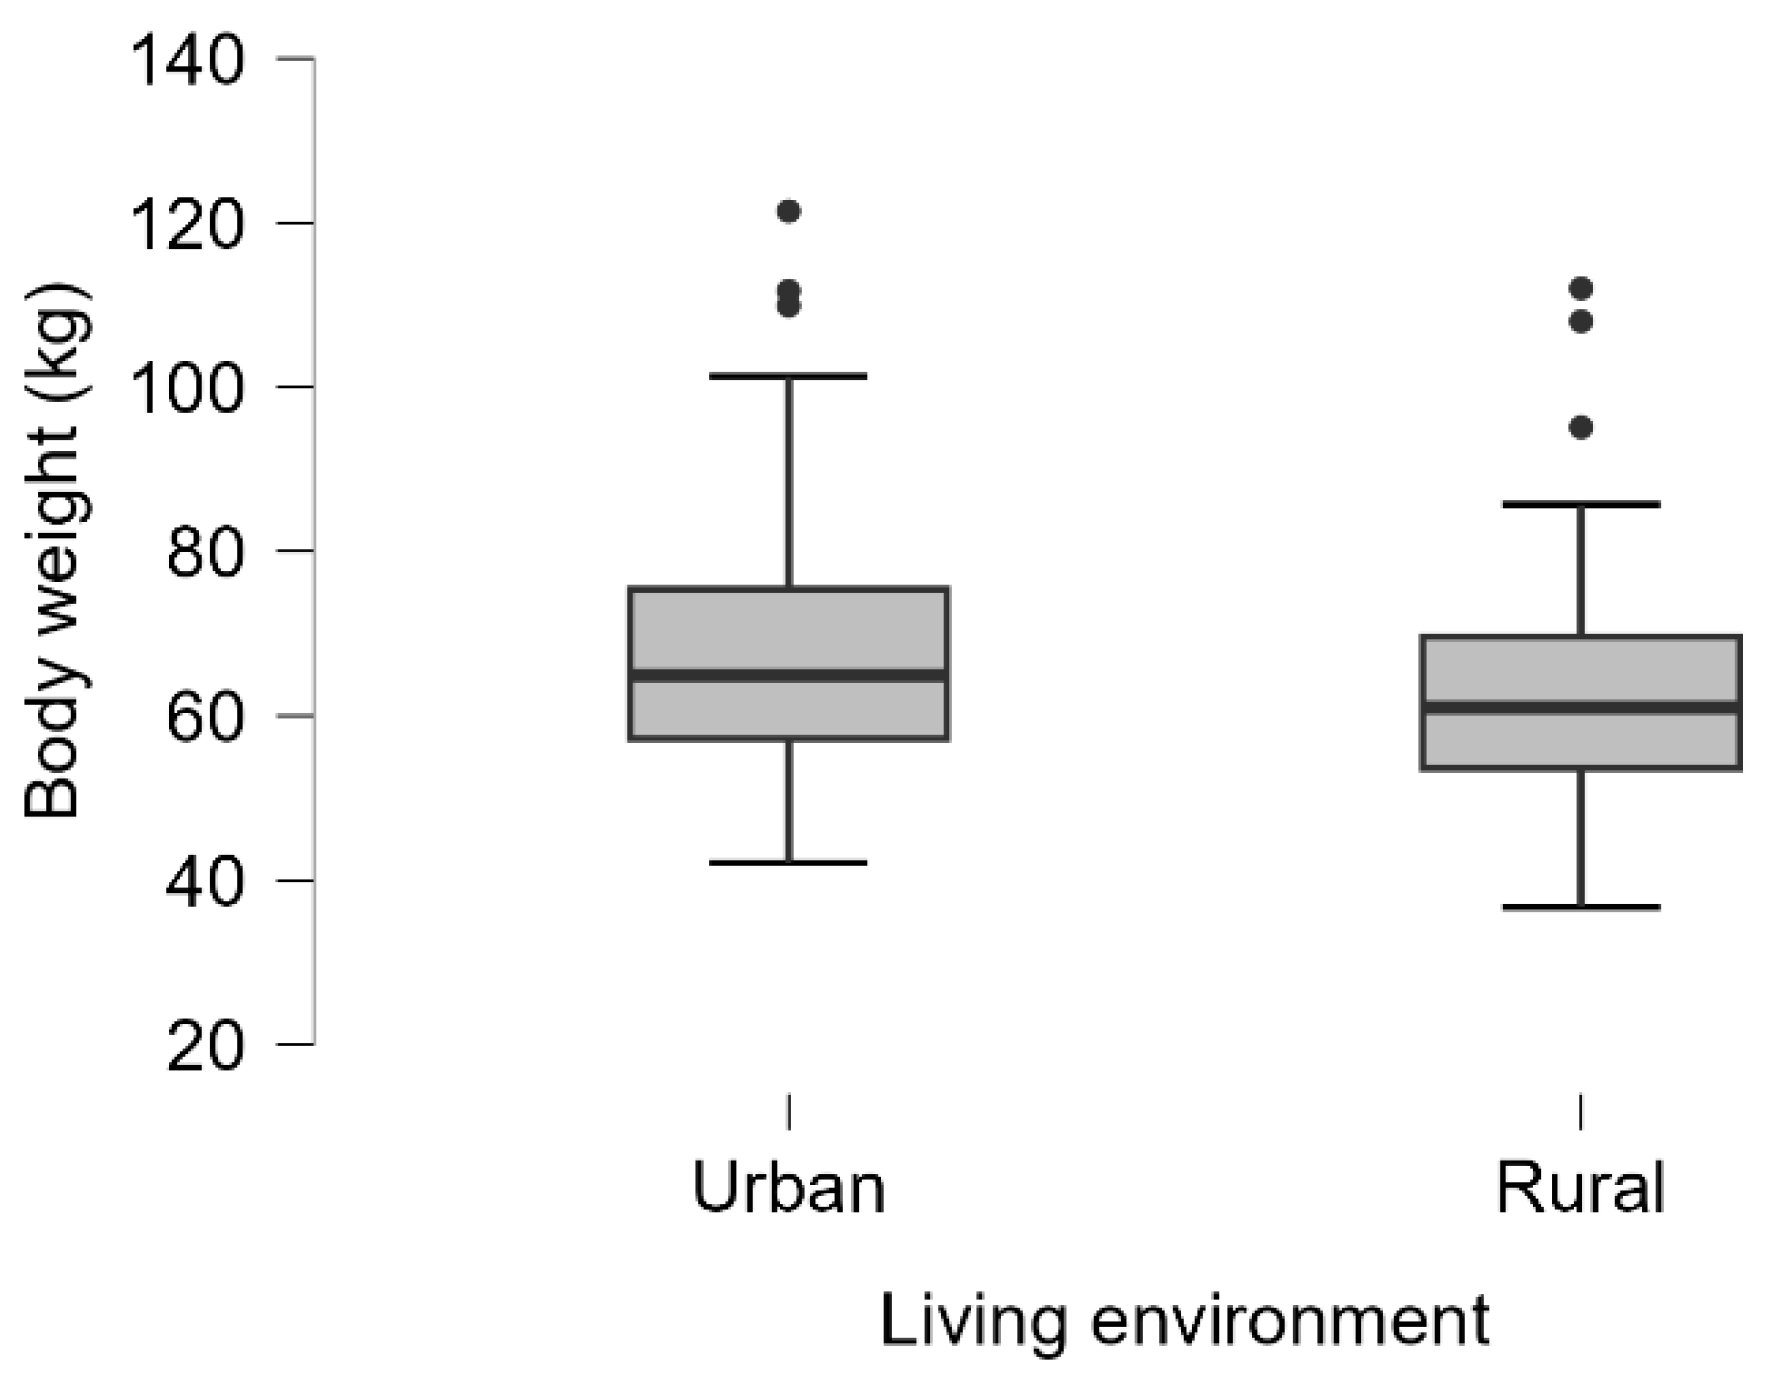
Figure 6.
Distribution of Daily Caloric Consumption by Living Environment (Urban vs. Rural).
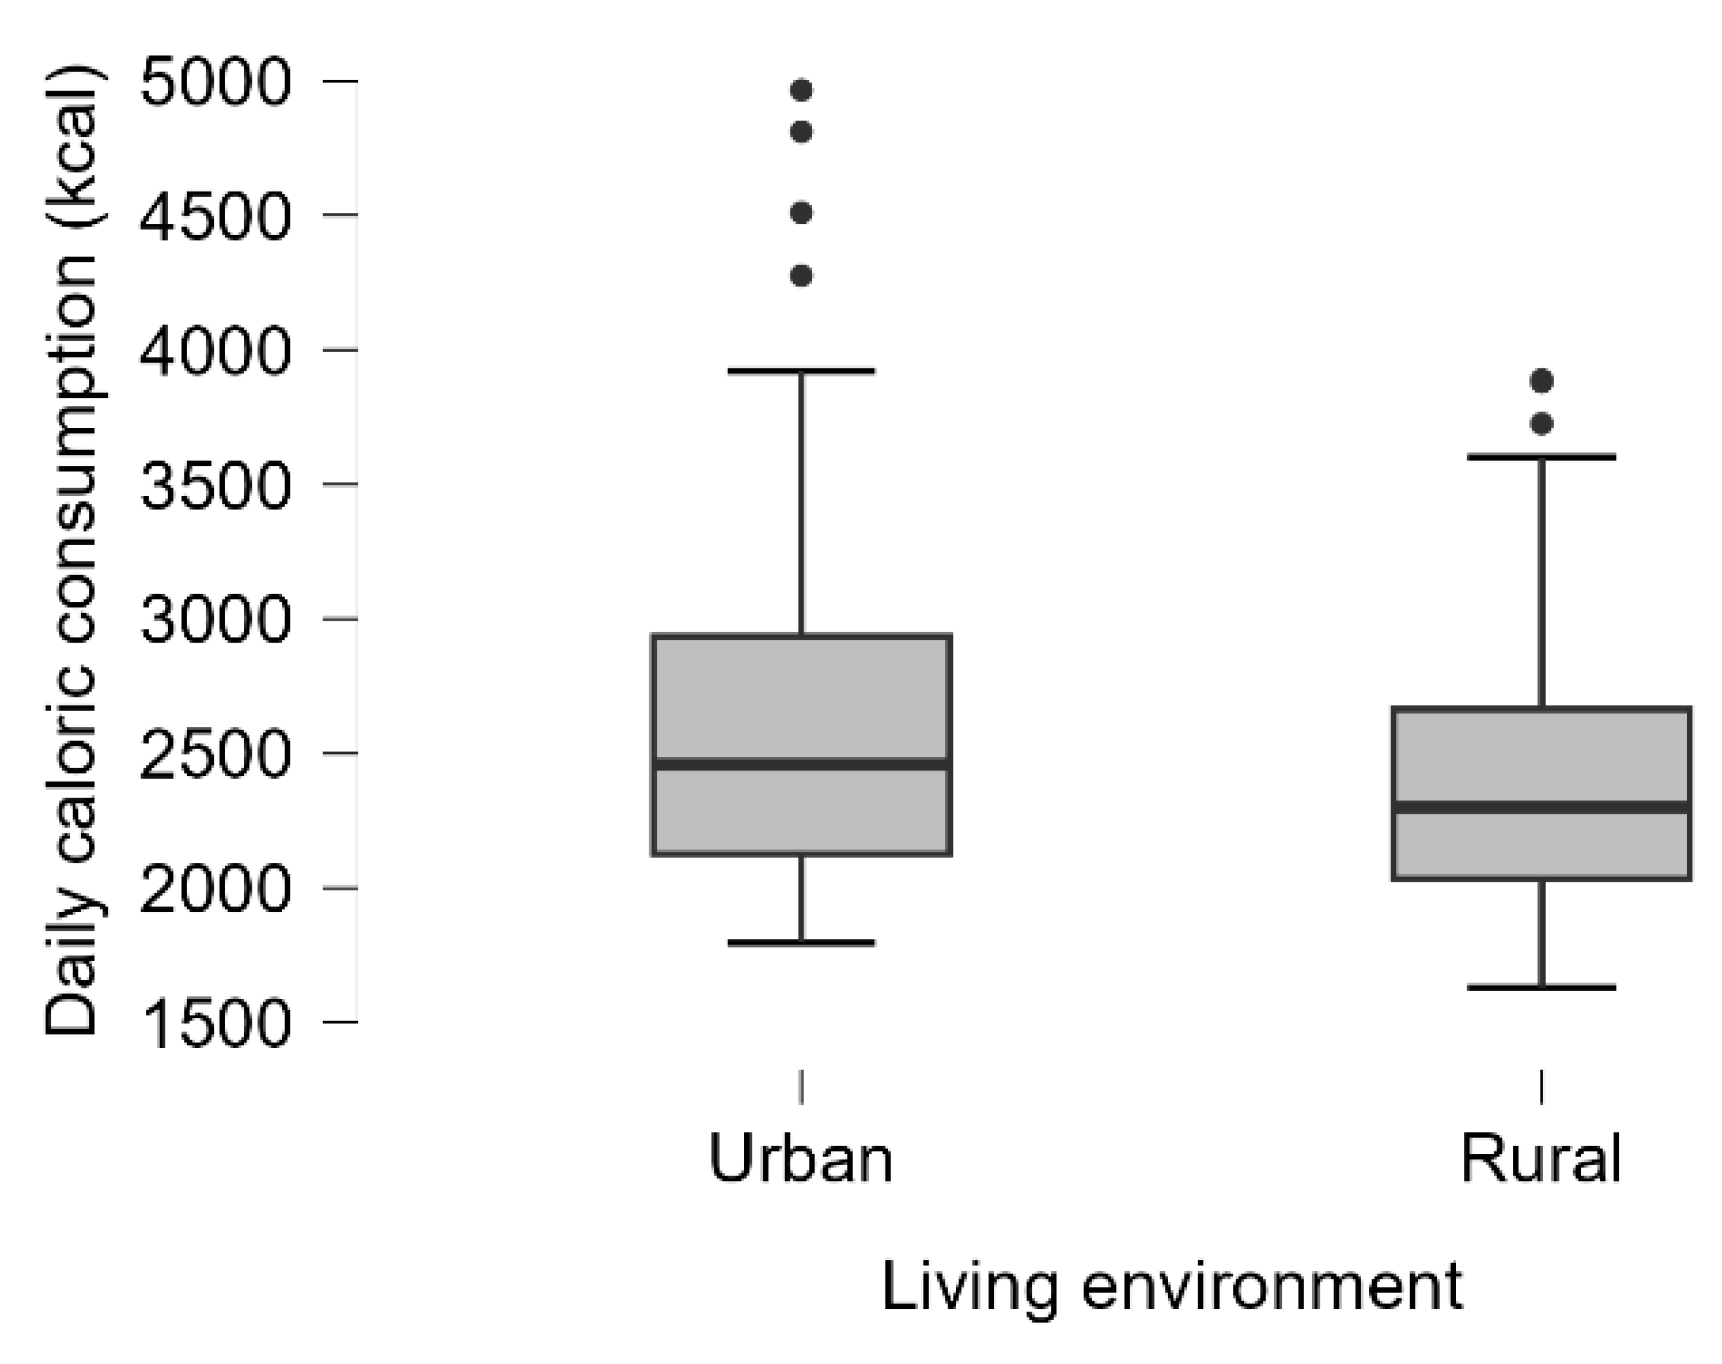
Figure 7.
Height distribution by living environment (Urban vs. Rural).
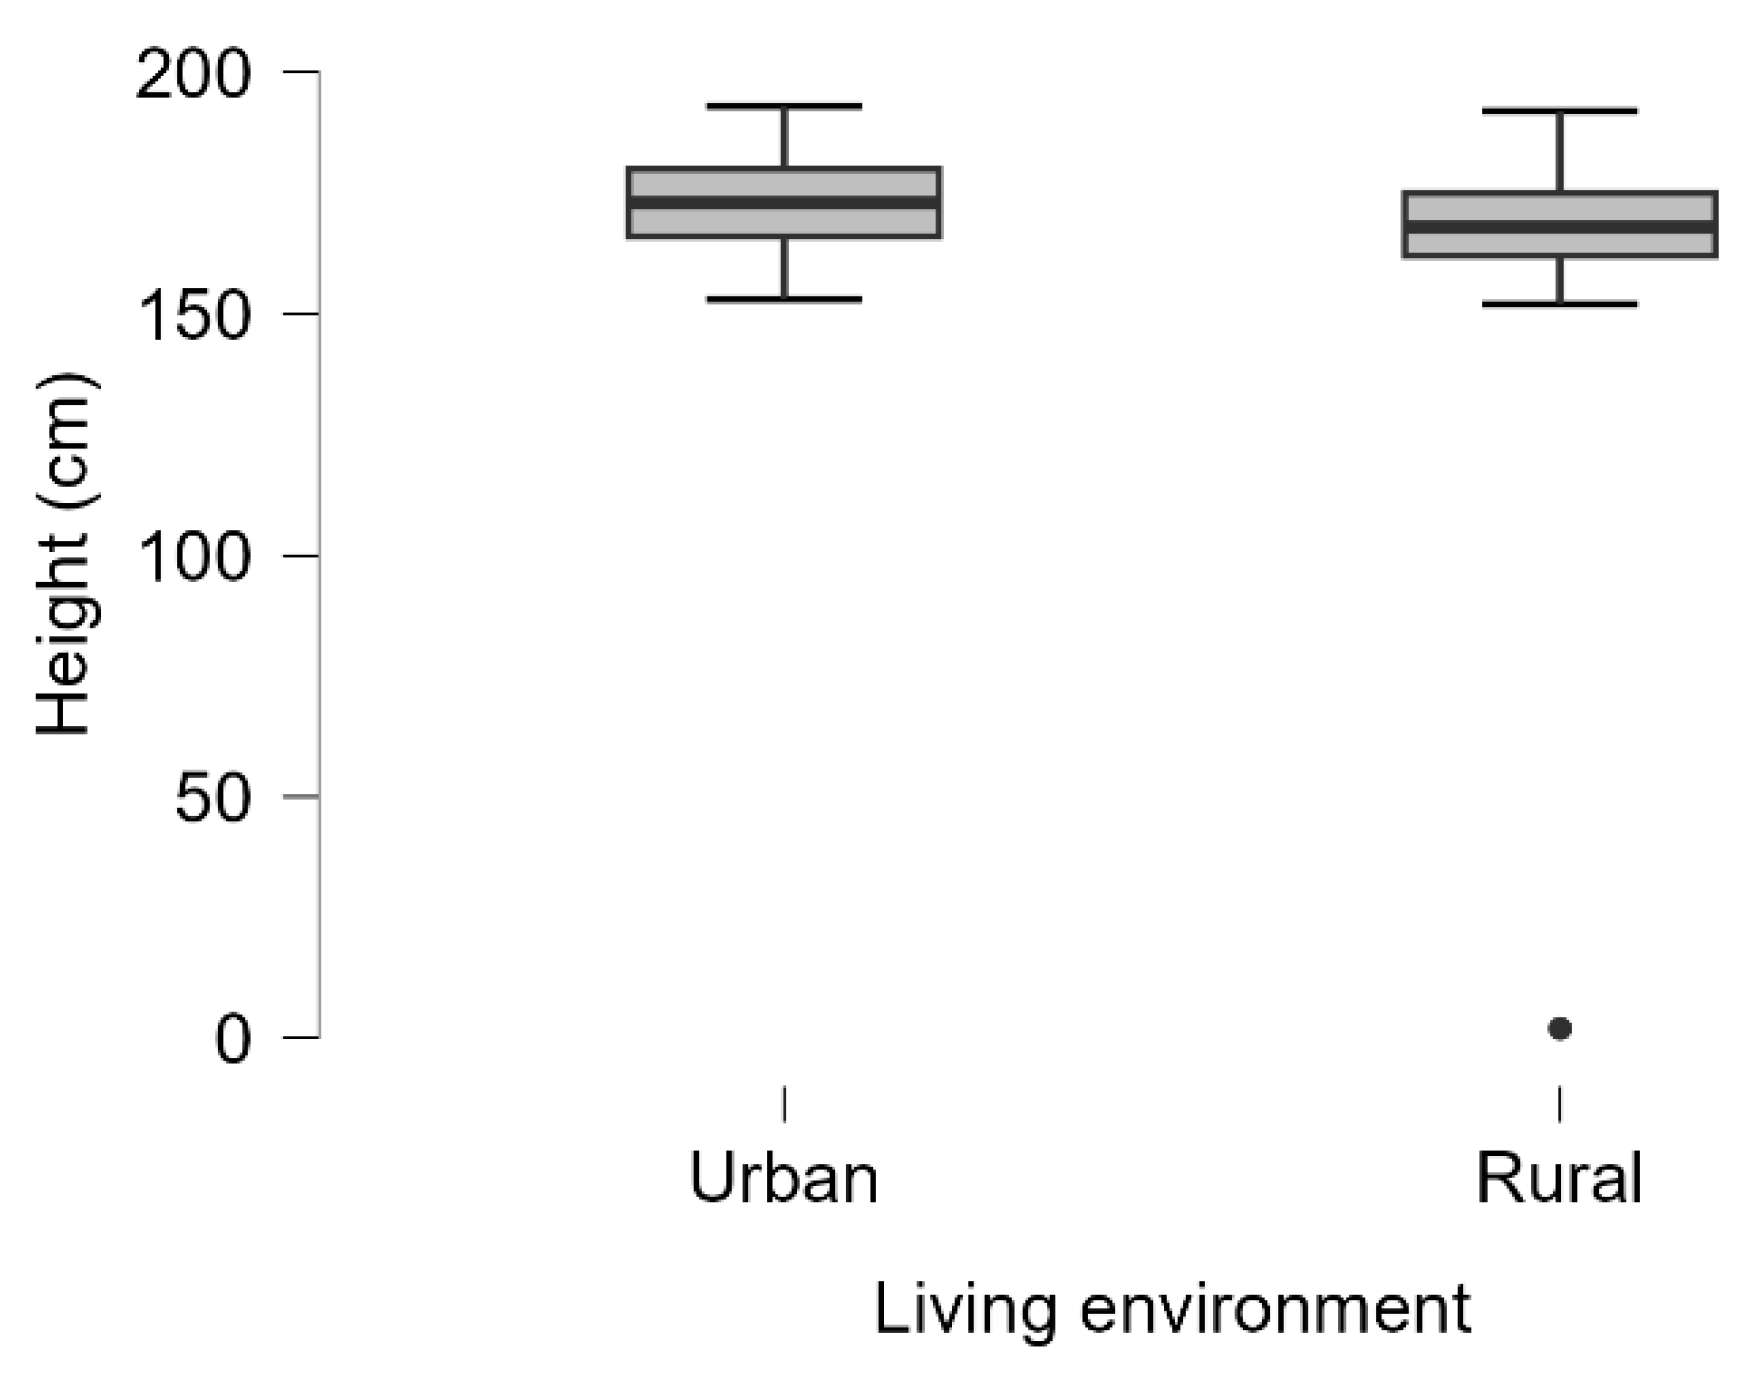
Figure 8.
Muscle Mass Distribution by living environment (Urban vs. Rural).
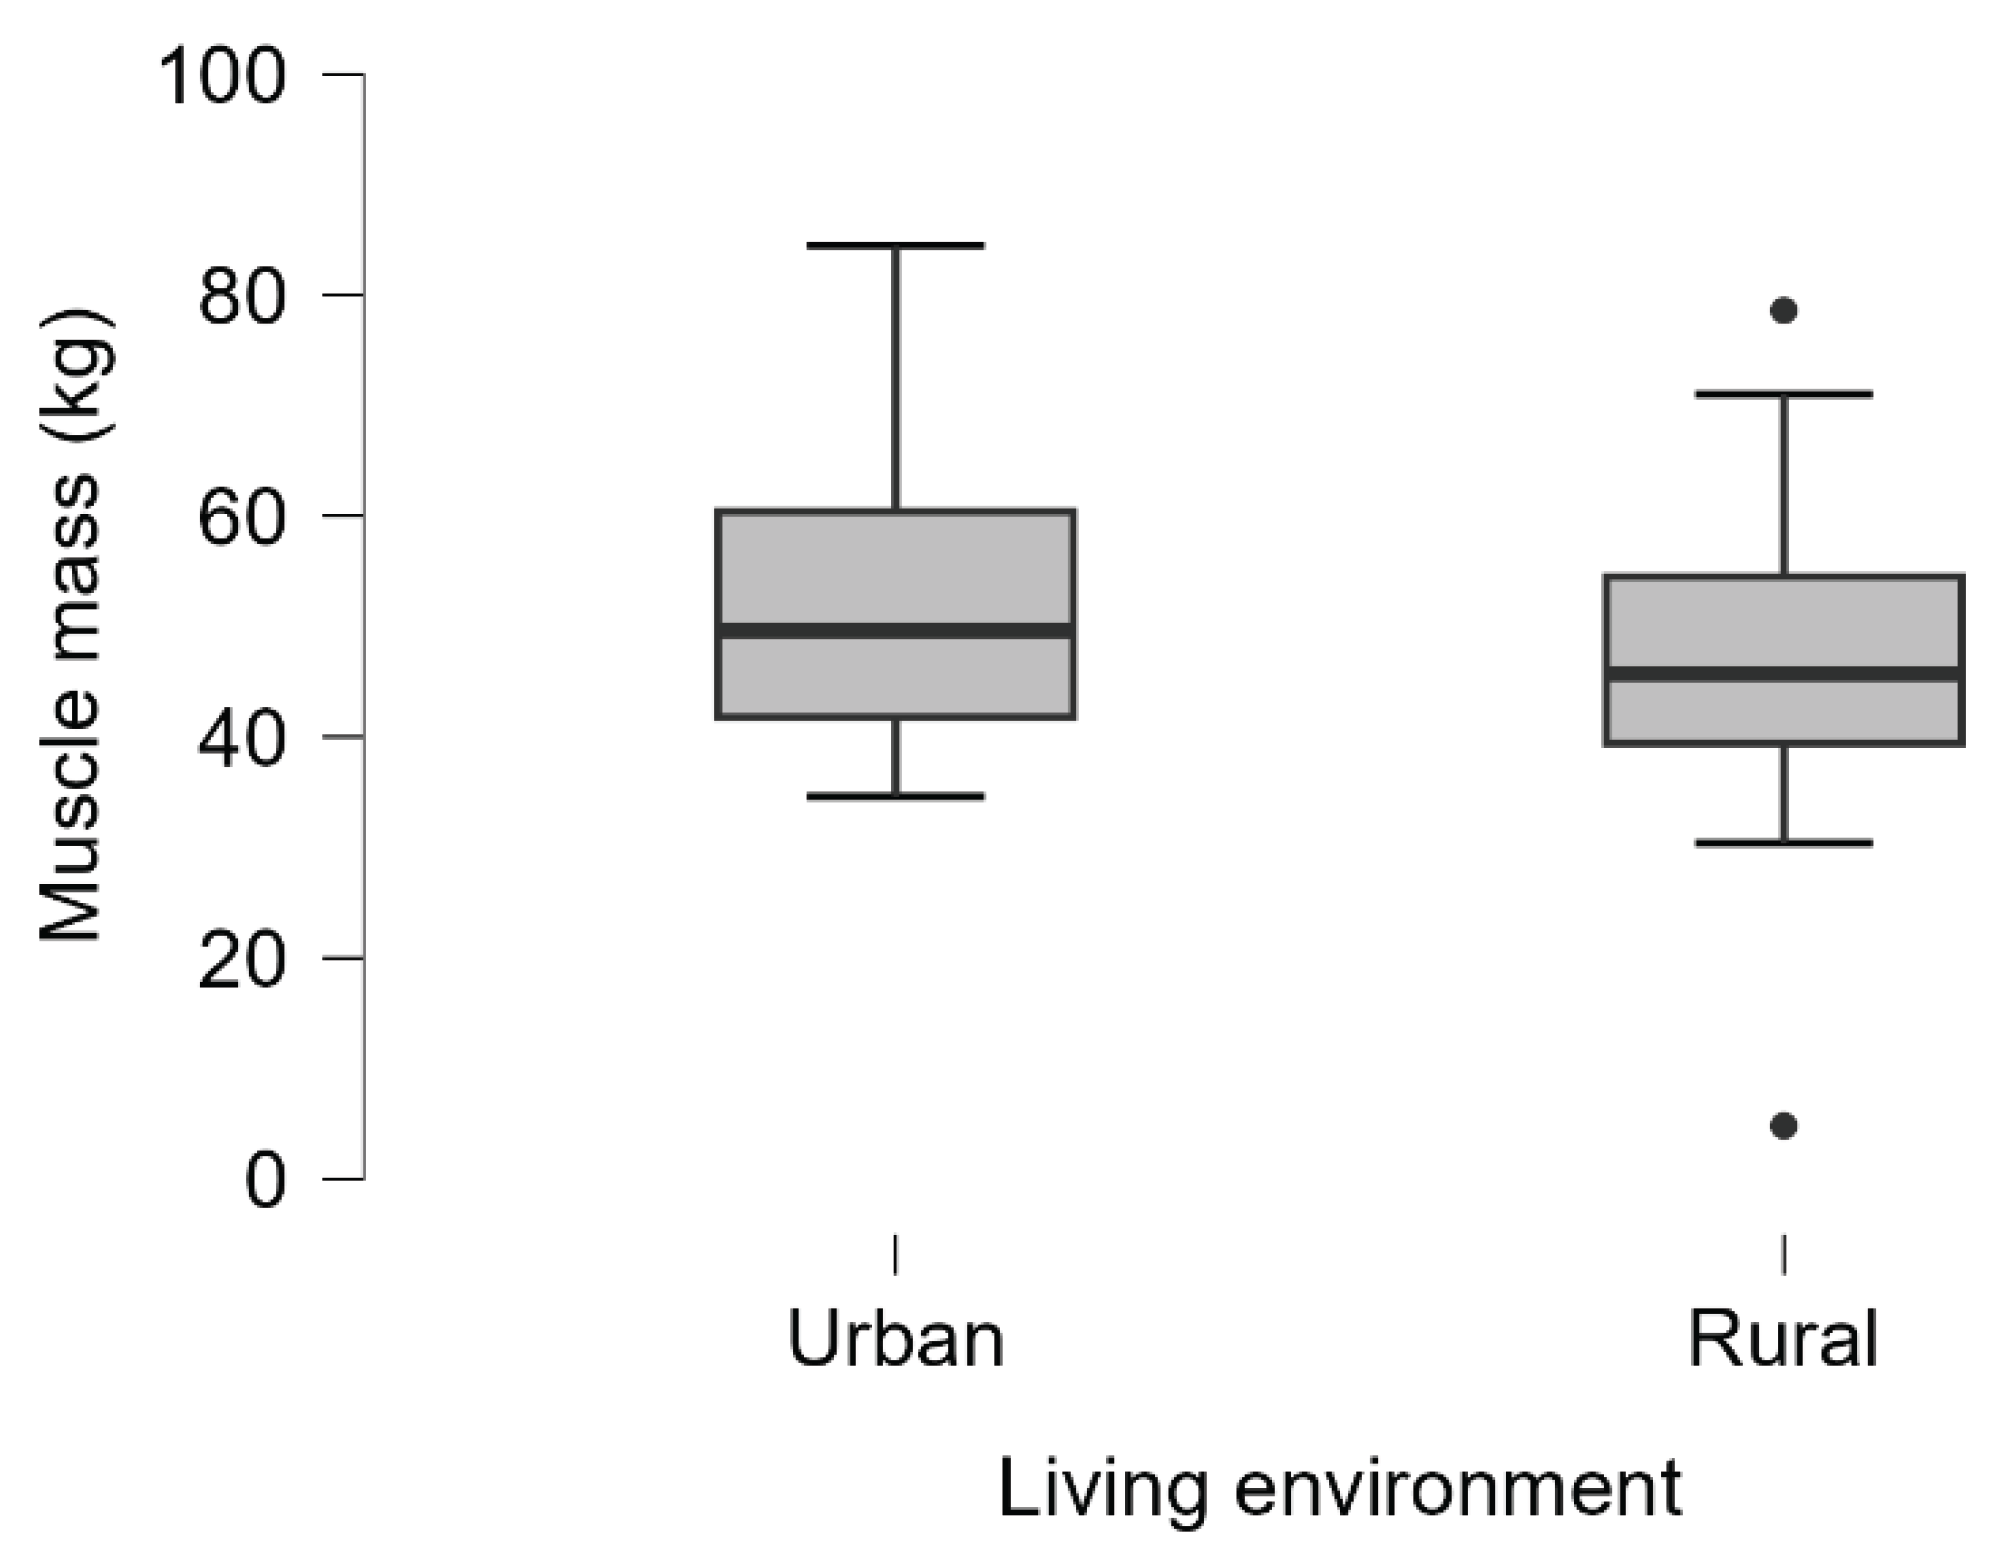

Table 1.
Results of Mann-Whitney U test for body composition parameters.
| Mann-Whitney U test | U | p |
| Height (cm) | 4474.000 | 0.079 |
| Body weight (kg) | 4648.000 | 0.178 |
| Body Mass Index (BMI) | 4801.000 | 0.324 |
| Muscle mass (kg) | 4667.500 | 0.193 |
| Body fat % | 4505.000 | 0.092 |
| Bone mineralization (kg) | 4770.000 | 0.288 |
| Hydration levels (%) | 6378.500 | 0.006 |
| Metabolic age (years) | 4667.500 | 0.155 |
| Daily caloric consumption (kcal) | 4692.500 | 0.214 |
Table 2.
Descriptive statistics for body composition parameters by domain of study.
| Median | Mean | Std. Deviation | Coefficient of variation | Minimum | Maximum | ||
| Height (cm) | S&H domains | 169.50 | 168.41 | 18.26 | 0.11 | 2.00 | 193.00 |
| Height (cm) | Non S&H domains | 172.00 | 172.24 | 9.91 | 0.06 | 152.00 | 193.00 |
| Body weight (kg) | S&H domains | 62.00 | 63.68 | 12.82 | 0.20 | 42.10 | 121.40 |
| Body weight (kg) | Non S&H domains | 64.95 | 67.61 | 16.64 | 0.25 | 36.70 | 112.00 |
| Body Mass Index (BMI) | S&H domains | 21.40 | 21.83 | 3.91 | 0.18 | 10.20 | 36.10 |
| Body Mass Index (BMI) | Non S&H domains | 21.45 | 23.26 | 6.00 | 0.26 | 14.70 | 56.00 |
| Muscle mass (kg) | S&H domains | 46.05 | 48.51 | 10.20 | 0.21 | 34.60 | 84.50 |
| Muscle mass (kg) | Non S&H domains | 49.90 | 50.40 | 12.28 | 0.24 | 4.80 | 78.60 |
| Body fat % | S&H domains | 18.10 | 18.91 | 8.71 | 0.46 | 5.00 | 43.00 |
| Body fat % | Non S&H domains | 20.90 | 21.18 | 8.95 | 0.42 | 5.00 | 49.70 |
| Bone mineralization (kg) | S&H domains | 2.50 | 2.59 | 0.51 | 0.20 | 1.90 | 4.30 |
| Bone mineralization (kg) | Non S&H domains | 2.60 | 2.93 | 2.62 | 0.89 | 1.70 | 27.00 |
| Hydration levels (%) | S&H domains | 62.20 | 62.94 | 12.69 | 0.20 | 32.90 | 161.70 |
| Hydration levels (%) | Non S&H domains | 58.25 | 58.82 | 7.52 | 0.13 | 38.20 | 82.70 |
| Metabolic age (years) | S&H domains | 12.00 | 16.89 | 8.12 | 0.48 | 12.00 | 46.00 |
| Metabolic age (years) | Non S&H domains | 12.00 | 19.26 | 10.17 | 0.53 | 12.00 | 57.00 |
| Daily caloric consumption (kcal) | S&H domains | 2349.00 | 2451.54 | 499.07 | 0.20 | 1796.00 | 4510.00 |
| Daily caloric consumption (kcal) | Non S&H domains | 2436.00 | 2601.09 | 656.91 | 0.25 | 1630.00 | 4965.00 |
* Note: S&H= sports and health domains; Non S&H= sports and health domains.
Table 3.
Descriptive Statistics and Mann-Whitney U Results.
| Parameter | Urban (Median, IQR) | Rural (Median, IQR) | U | p |
| Body Mass Index (kg/m²) | 21.3 (19.90–25.10) | 21.8 (19.10–23.50) | 6231.00 | 0.02 |
| Body Weight (kg) | 66.3 (57.20–75.40) | 61.5 (53.60–69.60) | 6335.00 | 0.01 |
| Daily Caloric Consumption (kcal) | 2400 (2126.00–2935.00) | 2200 (2034.00–2664.00) | 6390.00 | 0.01 |
| Height (cm) | 173 (166.00–180.00) | 168 (162.00–175.00) | 6475.00 | 0.006 |
| Muscle Mass (kg) | 50.0 (41.80–60.40) | 47.0 (39.40–54.50) | 6430.00 | 0.01 |
| Body Fat Percentage (%) | 19.8 (18.5–21.5) | 20.1 (18.9–21.7) | 5454.00 | 0.72 |
| Hydration Levels (%) | 60.0 (58.5–62.2) | 59.8 (58.3–61.8) | 4931.00 | 0.39 |
* Note: The interquartile range (IQR) provides a measure of variability within each group, highlighting differences between urban and rural students for key body composition parameters.
Disclaimer/Publisher’s Note: The statements, opinions and data contained in all publications are solely those of the individual author(s) and contributor(s) and not of MDPI and/or the editor(s). MDPI and/or the editor(s) disclaim responsibility for any injury to people or property resulting from any ideas, methods, instructions or products referred to in the content. |
© 2025 by the authors. Licensee MDPI, Basel, Switzerland. This article is an open access article distributed under the terms and conditions of the Creative Commons Attribution (CC BY) license (https://creativecommons.org/licenses/by/4.0/).
Copyright: This open access article is published under a Creative Commons CC BY 4.0 license, which permit the free download, distribution, and reuse, provided that the author and preprint are cited in any reuse.


