Submitted:
02 December 2025
Posted:
03 December 2025
You are already at the latest version
Abstract
A disintegrin and metalloproteinase with thrombospondin motifs 6 (ADAMTS6) is an extracellular protease that promotes the invasion of lung adenocarcinoma (LUAD) cells. Herein, we investigate its role in epithelial-mesenchymal transition (EMT), a process that drives metastasis and drug resistance in LUAD. Re-analysis of microarray and RNA sequencing data from LUAD cells reveals that during EMT, TGF-β1 increases ADAMTS6 expression, presumably through the SMAD pathway, as SMAD2 loss completely blocks this effect. Moreover, it was shown that ADAMTS6 occupies hub positions within TGF-β1-associated gene networks. Using additional datasets, we found that ADAMTS6 expression increases under other EMT-inducing conditions, including IL-1β induction and acquired gefitinib resistance, but decreases upon knockdown of Twist1, a master regulator of EMT. This supports the involvement of ADAMTS6 in EMT within a broader context. Our knockout experiments in A549 cells showed that ADAMTS6 expression enhanced cell migration, invasion, colony formation, doxorubicin resistance, and expression of the mesenchymal markers N-cadherin, vimentin, and Twist1, but attenuated cell adhesion to the extracellular matrix and expression of the epithelial marker E-cadherin. Re-analysis of transcriptomic data from patient tumors demonstrates that high ADAMTS6 expression correlates with the expression of EMT markers, further supporting the ADAMTS6–EMT link. Moreover, high ADAMTS6 expression is associated with a worse survival prognosis. Overall, ADAMTS6 promotes EMT in LUAD cells and may be considered a marker of this process, as well as a potential therapeutic target for its inhibition.
Keywords:
ADAMTS
; EMT
; lung cancer
; metastasis
; drug resistance
1. Introduction
Lung cancer was the most common form of cancer worldwide in 2022, accounting for 2.48 million new cases, with about half being adenocarcinoma [1]. Lung adenocarcinoma (LUAD) often metastasizes to such organs as brain, bone, and liver even in its early stages, which complicates effective treatment [2]. Understanding the molecular mechanisms underlying metastasis offers valuable insights for monitoring and preventing the progression of LUAD.
Transforming growth factor beta (TGF-β) is a multifunctional cytokine with three isoforms, among which TGF-β1 is the most widely distributed. Upon secretion into the extracellular matrix (ECM), it forms a large latent complex with other proteins. Cleavage of this complex by ECM proteases releases active TGF-β1, which binds to the TβRI/TβRII receptor, activating both the classical SMAD-dependent pathway and non-classical pathways like ERK, MAPK, and PI3K/AKT [3]. In LUAD cells, TGF-β1 frequently promotes epithelial–mesenchymal transition (EMT), characterized by the adoption of a spindle cell shape, cytoskeletal reorganization, secretion of ECM proteases, loss of epithelial markers, and the acquisition of mesenchymal markers [4,5,6]. These changes collectively enable tumor cells to penetrate the basement membrane and disseminate from the primary tumor site during the early stages of the metastatic cascade [7,8]. In addition, EMT increases LUAD cell resistance to chemotherapeutic agents such as docetaxel, cisplatin, and doxorubicin [9,10,11].
ADAMTS (a disintegrin and metalloproteinase with thrombospondin motifs) is a family of 19 structurally related extracellular proteases involved in both physiological and pathological processes. Notably, some ADAMTS proteases regulate cancer metastasis and EMT by modulating cell–ECM interactions and oncogenic signaling pathways [12]. Among these, ADAMTS6 was long considered an orphan protein, but recent studies have shown that it targets ECM-associated proteins such as fibrillin-1/2, fibronectin, and syndecan-4 [13,14]. These activities may contribute to ADAMTS6’s promotion of invasiveness in breast and colon cancer cells, although a direct link has yet to be established [15,16]. Additionally, ADAMTS6 activates the AKT and NF-κB pathways via an unspecified mechanism and the SMAD pathway by cleaving latent TGF-β binding proteins 1 and 3 (LTBP-1 and LTBP-3) to activate TGF-β1 [13,16,17]. Consequently, ADAMTS6 influences EMT marker expression by suppressing E-cadherin and inducing N-cadherin, vimentin, and Snail in colon cancer cells [16]. Thus, ADAMTS6 plays a multifaceted role in the regulation of cancer-associated EMT, acting both as an ECM remodeling protease and a regulator of cell signaling.
Although ADAMTS6 is expressed at similar levels in both tumor and normal tissues, it significantly affects chemoresistance and invasiveness in LUAD [18,19,20,21]. While its role in EMT has been established in colon cancer [16], it remains unexplored in LUAD. However, several lines of evidence suggest that ADAMTS6 may regulate EMT in LUAD cells: (1) TGF-β1 and tumor necrosis factor alpha (TNF-α) synergistically upregulate ADAMTS6 via a KDM6B (lysine demethylase 6B)-dependent mechanism [18]; (2) ADAMTS6 promotes invasion of TGF-β1/TNF-α-induced A549 cells in transwell assays [18]; (3) ADAMTS6 is co-expressed with vimentin in lung tumors from patients [18]; and (4) related proteases ADAMTS1 and ADAMTS16 activate latent TGF-β1 to induce EMT in LUAD cells [22,23].
Therefore, this study aimed to investigate the role of ADAMTS6 in regulating EMT, which is important for establishing its prognostic and therapeutic significance in LUAD. To this end, ADAMTS6 expression and its position within the gene network of TGF-β1-induced EMT were evaluated through analysis of previously published microarray data. Publicly available microarray, RNA-sequencing (RNA-seq), and single-cell RNA-sequencing (scRNA-seq) datasets of LUAD cells were used to verify ADAMTS6 as a marker of EMT. Patient data were also analyzed to further validate the association of ADAMTS6 with classical EMT markers, clinicopathological characteristics, and survival outcomes. Finally, ADAMTS6 was knocked out in A549 cells using CRISPR/Cas9 methodology to assess its effect on the acquisition of mesenchymal traits by the cells.
2. Results
2.1. Assessing the EMT Regulatory Potential of ADAMTS6 in LUAD Cells
A comprehensive bioinformatic analysis of publicly available transcriptomic data was performed to investigate the potential of ADAMTS6 in regulating TGF-β1-induced EMT in LUAD cells. This analysis aimed to identify changes in ADAMTS6 expression during TGF-β1 induction and to define its position within the EMT regulome.
First, we performed differential expression analysis comparing TGF-β1-treated H358, A549, and HCC827 human LUAD cells to untreated controls using microarray datasets GSE79235, GSE49644, GSE114761, and GSE123031. H358 cells were treated with two TGF-β1 regimens: a full dose of 4 ng/mL for 2 wk (yielding 1906 differentially expressed genes (DEGs)) and a half-dose of 2 ng/mL for 3 wk (yielding 1032 DEGs). Both regimens shared a core transcriptomic response of 643 DEGs, while 1263 and 389 DEGs were specific to the full dose and half-dose, respectively. For A549 cells, pooled samples from 24-, 48-, and 120-h time points with 5 ng/mL TGF-β1 treatment were compared to pooled control samples, revealing 556 DEGs. HCC827 cells treated with 10 ng/mL TGF-β1 for 72 h exhibited 437 DEGs (Figure 1A). Notably, only 46 DEGs were shared among the three cell lines, highlighting the strong dependence of TGF-β1-induced transcriptomic response on cell context.
Next, we validated the induction of EMT in the analyzed datasets. Gene set enrichment analysis (GSEA) revealed that the EMT hallmark signature was enriched in TGF-β1-treated cells compared to controls across all four datasets (Figure 1B). While the specific set of differentially expressed EMT markers varied across datasets, a consistent pattern emerged: epithelial markers (e.g., CDH1, EPCAM, and KRT19) showed decreased expression, while mesenchymal markers (e.g., CDH2, VIM, and FN1) showed increased expression (Figure 1C). These data demonstrate that TGF-β1 induces EMT in LUAD cells, regardless of the treatment regimen, which is consistent with the original studies [24,25,26].
We then examined the changes in ADAMTS6 expression across datasets. In H358 cells, TGF-β1 treatment at 4 ng/mL for 2 wk and at 2 ng/mL for 3 wk led to a 6.5- and an 8.6-fold upregulation of ADAMTS6, respectively. Similarly, ADAMTS6 expression increased by 8.6-fold in HCC827 cells after 72 h of induction at 10 ng/mL. In contrast, TGF-β1 did not significantly regulate ADAMTS6 in A549 cells, although a trend towards its increased expression was observed upon induction at 5 ng/mL (Figure 1D). Specifically, ADAMTS6 expression increased by 30% at 24 h and rose slightly by another 6% at 48 h, before plateauing and remaining unchanged over the next 3 d of induction (Figure 1E). However, statistical validation was not feasible due to the use of a single biological replicate per time point. Despite this limitation, consistent results across four datasets suggest that ADAMTS6 expression is induced during TGF-β1-mediated EMT in LUAD cells.
To assess the regulatory potential of ADAMTS6, we performed a gene network analysis based on the assumption that genes acting as hubs within the EMT network are key regulators of this process [27]. We constructed four gene networks from DEGs obtained from four datasets using STRING database and visualized them in Cytoscape (Figure S1). Network topology was then analyzed using CytoHubba plugin, and genes belonging to the top 15% according to at least one of twelve centrality metrics were selected as hub candidates. Intersecting the candidate lists from all four networks revealed 50 hub genes that are central in at least three networks (Figure 2A). Among these, 23 were upregulated, 23 were downregulated, and four exhibited variable expression across the datasets following TGF-β1 induction (Figure 2B).
The downregulated hub genes included those with established roles in epithelial homeostasis and disease, such as E(epithelial)-cadherin (CDH1) and epidermal growth factor family proteins (AREG, EREG, and BTC) [28]. Additionally, genes linked to innate immunity were suppressed, including those involved in antiviral defense (OAS1, HERC5, and IFIT1/2/3), the antibacterial protein LCN2, and the complement regulator CFH, which reflects the central role of TGF-β1 in coordinating immune evasion [29]. Consistently, the upregulated hub genes comprised well-studied mesenchymal markers, such as N(neural)-cadherin CDH2, matrix metalloproteinase MMP9, as well as transcription factors SNAI2 and ZEB2, repressing CDH1 expression [30].
Notably, ADAMTS6 emerged as an upregulated hub gene. Despite its moderate centrality metrics, it ranked highly in DMNC and Clustering Coefficient (Figure 2C), suggesting a stable coordinating role within the analyzed networks.
Based on the identification of prominent EMT markers among the upregulated DEGs, we hypothesized that the remaining DEGs, including ADAMTS6, also play critical roles in EMT regulation. To test this hypothesis, we conducted a text mining analysis of Pubmed abstracts to examine the co-occurrence of DEG names with key terms such as “LUAD”, “lung cancer”, “EMT”, and “metastasis”. This approach identified 15 genes strongly associated with lung cancer (including 10 linked to LUAD) and 18 genes associated with metastasis, primarily connected to EMT (Figure 2D). Among these were previously mentioned CDH2, MMP9, SNAI2 and ZEB2, as well as cytokines and chemokines shown to induce EMT, including IL11 [31], WNT5B [32], CCL20 [33], and CXCL1 [34], and genes with established EMT-regulatory functions, such as SERPINE1 [35], THBS1 [36], and TIMP2 [37]. The results of text mining confirm that our network analysis effectively identified key EMT regulatory genes in LUAD cells; therefore, ADAMTS6 may also have regulatory potential, as it exhibits network connectivity similar or comparable to established EMT regulators. Additionally, text mining revealed that ADAMTS6, along with genes CGB8, PCOLCE2, PTPRK, and COL7A1, remains under-studied compared to established EMT regulators (Figure 2D). Overall, gene network analysis provided a strong rationale for further study of ADAMTS6 function in EMT of LUAD cells.
2.2. Validation the Link Between ADAMTS6 and EMT Induction in Pulmonary Epithelial Cells
To explore the connection between ADAMTS6 and EMT induction in lung cells in greater detail, we formulated the following three questions: (i) Is ADAMTS6 activation sustained during prolonged exposure of LUAD cells to TGF-β1? (ii) Does ADAMTS6 expression correlate with the EMT status of LUAD cells in scRNA-seq analysis? (iii) Is ADAMTS6 activated upon EMT induction in other pulmonary epithelial cells, or is this relationship unique to LUAD?
Analysis of two independent transcriptomic datasets (Table S1) showed that a 2-d treatment of A549 cells with TGF-β1 at 5–10 ng/mL increased ADAMTS6 expression by more than 11-fold, which is consistent with the data described above. Chronic exposure of A549 cells to 2 ng/mL TGF-β1 for 60 d produced an even more pronounced, 84.7-fold induction of ADAMTS6 (Figure 3A). Interestingly, ADAMTS6 upregulation was reduced 6.3-fold by a SMAD2 loss-of-function mutation but was not significantly affected by treatment with 40 mM sodium acetate (fold change = 1.2) (Figure 3A). These results suggest that TGF-β1 induces ADAMTS6 expression in both short-term and chronic regimens via a mechanism that is dependent on the SMAD2/3 pathway but independent of fatty acid metabolism.
To address the second question, we analyzed the scRNA-seq dataset GSE147405, which includes A549 cell samples collected from 0 h to 7 d during TGF-β1 induction, as well as from 8 h to 3 d after TGF-β1 withdrawal. Seven distinct cell clusters were identified: clusters 1, 2, 3, and 4 were present initially (time point 0 h), while clusters 0, 5, and 6 emerged following TGF-β1 treatment (Figure 3B). We performed single-sample gene set enrichment analysis (ssGSEA) to evaluate the EMT status of these clusters. The epithelial gene signature was enriched in clusters 1, 2, and 3, whereas the mesenchymal gene signature and hallmark EMT signature were enriched in clusters 0, 4, 5, and 6 (Figure 3C). Accordingly, clusters 1, 2, and 3 were classified as epithelial-like, while clusters 0, 4, 5, and 6 were mesenchymal-like, which was consistent with the expression of classical EMT markers (Figure S2). ADAMTS6 expression was higher in mesenchymal-like cells compared to that in epithelial like cells (Figure 3D), a finding further confirmed by pseudobulk analysis (Figure 3E). These results independently confirm the association between ADAMTS6 and EMT at the single-cell level in LUAD cells.
Finally, to determine whether ADAMTS6 activation during EMT is a common feature across pulmonary epithelial cells, we evaluated the effect of TGF-β1 on ADAMTS6 expression in H1975 LUAD cells, SK-MES-1 squamous cell carcinoma cells, and normal small airway epithelial cells (Figure 3F). Treatment of H1975 cells with TGF-β1 at 2 ng/mL for 24 and 48 h increased ADAMTS6 expression by 3.6- and 2.5-fold, respectively. In SK-MES-1 cells, TGF-β1 at the same concentration induced a 2.3-fold upregulation of ADAMTS6 at 6 h, rising to over 3-fold at 24 and 48 h (Figure 3F). Chronic exposure to 10 ng/mL TGF-β1 for 15 d caused a pronounced 66.3-fold increase in ADAMTS6 in normal small airway epithelial cells, similar to the chronic exposure effects observed in A549 cells (Figure 3A, Figure 3F). These results indicate that TGF-β1 induces ADAMTS6 in a broad spectrum of pulmonary cell lines, despite differences in experimental incubation schemes. Additionally, findings in normal lung cells suggest a possible role of ADAMTS6 in EMT during lung fibrosis, which requires further study.
2.3. Reconstruction of the EMT-Associated Upstream Regulatory Network for ADAMTS6 in LUAD Cells
To reconstruct the upstream network controlling ADAMTS6 activation during EMT, we supplemented our study with an analysis of transcriptomic data from LUAD cells undergoing EMT induced by factors other than TGF-β. We found that chronic exposure of A549 cells to interleukin 1 beta (IL-1β) for 15 and 21 d increased ADAMTS6 expression by 5.9-fold and 4.6-fold, respectively (Figure 3G). Surprisingly, another pro-inflammatory cytokine, TNF-α (20 ng/mL, 24 h), had no effect on ADAMTS6 levels (p > 0.05; data not shown). Furthermore, a 5.8-fold activation of ADAMTS6 was observed in HCC4006 cells rendered resistant to the EGFR inhibitor gefitinib (Figure 3G). Interestingly, EGFR signaling itself did not appear to play a major role in ADAMTS6 regulation, as neither EGF treatment nor EGFR knockdown in LUAD cells induced ADAMTS6 expression. Conversely, combined EGFR/MEK inhibition through a 2-wk treatment with 100 nM osimertinib and 30 nM trametinib (OT) induced EMT accompanied by a 5.1-fold downregulation of ADAMTS6 [38]; this effect, however, may be attributable to MEK blockade.
Other upstream positive regulators of ADAMTS6 included protein kinase C (PKC), induced by phorbol 12-myristate 13-acetate (PMA) in H1975 cells [39] and Twist1, the knockdown of which reduced ADAMTS6 expression by 11.7-fold in H1993 cells (Figure 3G). In turn, the EMT repressor RAVER1 and YAP1, a key component of the Hippo pathway, were identified as negative regulators of ADAMTS6. Their inhibition via siRNA and the CRISPR/Cas9 system, respectively, increased ADAMTS6 levels in LUAD cells by 3.2-fold and 2.3-fold, respectively (Figure 3G). Notably, the addition of the OT combination to YAP1 knockout reduced this effect by 3-fold.
2.4. The Development of a CRISP/Cas9 System Targeting ADAMTS6
Next, we investigated how ADAMTS6 expression affects EMT in A549 cells using CRISPR/Cas9-induced knockout. The ADAMTS6 gene consists of 31 exons and has multiple splice variants, with the main isoform containing 25 exons encoding a protein of approximately 125.3 kDa. To disrupt the ADAMTS6 open reading frame (ORF), exon 4 was selected as the target region for CRISPR/Cas9-mediated editing due to its size (169 bp) and its position at the start of the transcript. The knockout strategy involved inducing two double-strand breaks (DSBs) simultaneously, one within intron 3 and another within exon 4 (Figure 4A).
Target protospacer sequences identified via Benchling analysis demonstrated good efficiency/specificity ratios (Figure 4A). Constructs expressing CRISPR/Cas9 components were generated based on pX458 vector following a standard protocol [40]. A549 cells were transfected according to the proposed strategy. Subsequently, GFP-expressing cell fractions were sorted to obtain single-cell clones. Initial screening involved PCR analysis using primers flanking the expected deletion region. Several clones showed loss of genomic sequence between protospacers (“4-1” + “e-b”) (Figure 4B). The size of deletions varied among clones and did not always match expectations; for example, clones 202 and 204 exhibited larger deletions. A second round of PCR, using primers closely flanking the exon, demonstrated the presence of a second ADAMTS6 allele in all clones except one. The target region structure of clone 202 was further analyzed via Sanger sequencing of PCR products (Figure 4C). The results revealed two mutations: a 1047 bp deletion covering parts of exon 4 and introns 3 and 4, and an inversion between DSB sites that disrupts the exon structure (Supplementary results). Both mutations are predicted to result in the loss of functional ADAMTS6 protein.
ADAMTS6 knockout was confirmed via RT-qPCR using primers located downstream of the established mutational sites. Clone 202 exhibited a 2.2-fold reduction in ADAMTS6 mRNA level compared to the parental A549 line. Lachat et al. previously demonstrated that sequential incubation with 4 ng/mL TGF-β1 for 3 d and 20 ng/mL TNF-α for 2 d significantly induces ADAMTS6 expression [18]. Using this protocol, we observed a 2.6-fold increase in ADAMTS6 mRNA level in control A549 cells. However, expression in clone 202 remained unchanged following TGF-β1/TNF-α treatment and stayed stably suppressed relative to untreated control (Figure 5A).
The obtained results showed that gene editing disrupted the ADAMTS6 gene structure and abrogated its stable expression, presumably through nonsense-mediated decay [41]. Therefore, we used clone 202 to assess the influence of ADAMTS6 on the EMT phenotype and hereafter refer to it as AD6-KO cell line.
2.5. Assessing the Effects of ADAMTS6 Knockout on EMT Characteristics of Human LUAD Cells
To investigate the effects of ADAMTS6 knockout on EMT-related processes, it was essential to distinguish these effects from potential impacts on cell viability caused by gene alterations. Therefore, we first evaluated the proliferative potential of the AD6-KO cell line compared to the parental A549 line using MTT staining. The results showed that AD6-KO cells had viable cell counts similar to A549 cells after 24–48 h of incubation (Figure 5B), confirming applicability for their use in experiments on the EMT phenotype.
EMT promotes tumor cell migration from the primary tumor site during dissemination, the initial stage of metastasis [42,43]. Prior study by Lachat et al. demonstrated that ADAMTS6 knockdown suppressed, with a non-significant trend, the invasion of TGF-β1/TNF-α-treated A549 cells (p = 0.059) through Matrigel, which mimics ECM [18]. Based on these findings, we investigated cell motility during ADAMTS6 suppression in greater detail.
To assess the impact of ADAMTS6 suppression on A549 cell motility, we performed wound healing assays. These assays revealed that AD6-KO cells exhibited a 22.4% and 27.4% reduction in migration to the center of the wound compared to A549 cells at 24 and 48 h, respectively (Figure 5C). Transwell assays further supported these findings, showing reductions of 57.6% and 40.7% in directed migration toward 10% FBS across the membrane at 24 and 48 h, respectively (Figure 5D). To model cell migration through ECM in tumors, we coated the upper chambers of a transwell system with Matrigel and monitored cell invasion into the lower chambers containing 10% FBS. Matrigel markedly impeded cell invasion, with active movement detectable only by day 3. After 83 h, AD6-KO cells exhibited a statistically significant decrease of 29.6% in their invasion capacity relative to A549 cells. This trend persisted through day 4, although increased intra-group variability diminished the statistical significance at later time points (Figure 5E). Thus, using three test systems, we confirmed the observation of Lachat et al. that ADAMTS6 mediates LUAD cell movement.
Since cell motility relies on specialized cytoskeletal organization and adhesive interactions with the ECM substrate [43], we conducted targeted experiments to investigate whether ADAMTS6 affects these migration-related factors. The shape of cells indirectly reflects cytoskeletal organization, as actively migrating cells are typically more elongated due to the formation of actin stress fibers and the anterior–posterior distribution of adhesive molecules [4,44]. However, microscopic examination revealed no significant differences in morphology between AD6-KO and A549 cells. Notably, the proportion of elongated cells with an aspect ratio exceeding 2 remained over 36% in AD6-KO cells, suggesting that cytoskeletal structures associated with active cell migration are not regulated by ADAMTS6 (Figure 5F). In contrast, we observed a significant enhancement in cell adhesion upon ADAMTS6 suppression. To evaluate this, cells were placed in culture plates coated with Matrigel or rat tail collagen, or in uncoated plates, and allowed to adhere for 1 h. Non-adherent cells were washed out, and the number of adherent cells was assessed using the MTT assay. The number of AD6-KO cells adherent to plastic, collagen, and Matrigel was 46.8%, 31.3%, and 48.6% higher, respectively, compared to the corresponding number of A549 cells (Figure 5G). These findings led us to conclude that ADAMTS6 positively regulates A549 cell motility, likely by weakening cell adhesion to the substrate. Supporting this conclusion, prior studies have established an inverse relationship between excessive adhesion and effective cell migration [45,46,47].
Both literature data and our transcriptomic analysis demonstrate that EMT is characterized by the loss of epithelial markers and the acquisition of mesenchymal lineage markers [5,6] (Figure 1C, Figure S2). To further investigate this, we conducted RT-qPCR analysis to measure mRNA levels of epithelial markers (KRT18, KRT19, and CDH1) and mesenchymal markers (FN1, VIM, and CDH2) in A549 cells following ADAMTS6 suppression. While the expression of the cytokeratin markers KRT18 and KRT19 remained unchanged (Figure S3), ADAMTS6 knockout is accompanied by a significant increase of epithelial cadherin CDH1 expression by 3.8-fold (Figure 5H). In contrast, mesenchymal markers CDH2, VIM, and TWIST1 showed decreased expression by 1.5, 1.4, and 1.7 times, respectively, in AD6-KO cells compared to A549 cells (Figure 5H). These findings suggest that ADAMTS6 facilitates the phenotypic switch to a mesenchymal phenotype during EMT.
In addition to enhanced motility, mesenchymal or hybrid E/M phenotypes generated during EMT are strongly associated with increased resistance to cancer therapy [48]. Specifically, LUAD cells have been shown to exhibit reduced sensitivity to topoisomerase II inhibitor doxorubicin following EMT induction [11,49]. In our study, ADAMTS6 silencing decreased the doxorubicin IC50 from 2.4 μM to 1.45 μM, with a significant increase in toxicity observed at concentration points of 0.5, 1, and 1 μM in AD6-KO cells compared to A549 cells (Figure 5I). These findings suggest that ADAMTS6 enhances tumor cell resistance to doxorubicin, likely through the activation of EMT.
EMT drives tumor cell intravasation into blood vessels as single cells or small cell clusters. At later stages, these disseminated cells colonize distant organ, where their ability to proliferate becomes a critical property for metastasis [42]. To model metastatic spread, we seeded cells at low density in culture plates and assessed colony formation after 2 wk. Our results showed that AD6-KO exhibited a 2.9-fold reduction in colony area compared to parental A549 cells, indicating significantly suppressed metastatic potential (Figure 5J). These findings suggest that, in addition to its role in EMT regulation, ADAMTS6 may also contribute to metastatic outgrowth.
Collectively, our findings demonstrate that ADAMTS6 may participate in metastatic spread of LUAD cells at two critical stages: dissemination and colonization. During the first stage, ADAMTS6 regulates EMT by enhancing cell migration and invasion, reducing cell adhesiveness, altering marker expression, and increasing chemoresistance. The molecular mechanism underlying the role of ADAMTS6 in the second stage, metastatic colonization, requires further investigation.
2.6. Validating Associations of ADAMTS6 with EMT in Patient Cohort
As the final step of our study, we evaluated the extent to which findings on ADAMTS6 involvement in EMT, obtained from cell culture models, can be applied to human tumors. We re-analyzed gene expression data from the TCGA-LUAD, GSE31210, and GSE72094 datasets, which include tumor sections from 516, 226, and 442 LUAD patients. Correlation analysis revealed a significant positive correlation between ADAMTS6 expression and mesenchymal markers (CDH2, VIM, and FN1) as well as EMT-related transcription factors (SNAI1, SNAI2, ZEB1, and ZEB2), alongside a negative correlation with epithelial markers (CDH1, EPCAM, OCLN, and KRT19) (Figure 6A). Next, we selected the top 20 and bottom 20 tumor samples based on ADAMTS6 expression in each dataset (Figure S4A) and performed GSEA, which demonstrated enrichment of the EMT hallmark signature in the “ADAMTS6 high” groups across all three datasets (Figure 6B). Collectively, these results confirm the previously established positive association between ADAMTS6 and EMT induction.
To further elucidate how ADAMTS6 may regulate EMT in LUAD tumors, we analyzed the enrichment of Kyoto Encyclopedia of Genes and Genomes (KEGG) and Gene Ontology molecular function (GO-MF) pathways in “ADAMTS6 high” and “ADAMTS6 low” groups. Beyond dataset-specific enrichment (Figure S4B, S4C), we identified two KEGG (“ECM-receptor interaction”, “focal adhesion”) and five GO-MF (“metallopeptidase activity”, “metalloendopeptidase activity”, “hormone activity”, “extracellular matrix structural constituent”, “extracellular matrix structural constituent conferring tensile strength”) terms common to all three datasets (Figure 6C). These findings suggest that ADAMTS6 may influence EMT not only through its metallopeptidase activity on ECM components but also by modulating focal adhesion and ligand-receptor interactions, particularly ECM-receptor interaction.
We analyzed TCGA-LUAD patients stratified by various clinicopathological characteristics and found no association between ADAMTS6 expression and patient age, gender, pathological stage, and TNM stage (Figure S5A–F). However, ADAMTS6 was significantly upregulated in tumor samples compared to normal lung tissues (Figure 6D), which was also confirmed using UALCAN and OncoDB databases (Figure S5G, S5H). The impact of ADAMTS6 on the survival of LUAD patients was evaluated using Kaplan–Meier analysis. GEPIA2, utilizing RNA-Seq data from TCGA-LUAD, revealed a negative association between ADAMTS6 expression and disease-free survival, while overall survival showed a similar trend but did not reach statistical significance in the log-rank test (Figure 6E). In contrast, an integrative analysis of 17 microarray datasets comprising 672 LUAD patients using KMplotter platform demonstrated a significant decrease in both progression-free and overall survival in patients with high ADAMTS6 levels (Figure 6F).
Taken together, the clinical data support the involvement of ADAMTS6 in the EMT of LUAD cells. According to in silico analysis, ADAMTS6 may regulate focal adhesion and cell receptors through its metallopeptidase activity. Additionally, ADAMTS6 expression is elevated in tumor tissues compared to normal lung tissues and is associated with worse patient survival.
3. Discussion
Metastasis is a life-threatening complication of cancer, particularly LUAD, and investigating its molecular mechanisms is crucial for developing improved methods of prognosis and treatment [2]. Recent reports show that EMT plays a key role in the early stages of LUAD metastasis by promoting cancer cell migration and invasion [4,5,6,7,8]. During EMT, cancer cells actively secrete extracellular proteases, among which matrix metalloproteinases (MMPs) are the most extensively studied and are increasingly recognized as promising therapeutic targets in LUAD [50]. Specifically, MMPs 2 and 9 (gelatinases) facilitate tumor cell invasion through the basement membrane by degrading its key components [51,52]. Furthermore, they support EMT by the release of TGF-β1 from its latent complex and cleaving E-cadherin [53,54,55]. Consequently, MMP2/9 promote migration and invasion and upregulate the expression of N-cadherin, vimentin, and Snail in LUAD cells [55,56,57].
Nevertheless, clinical trials of MMP inhibitors for treating LUAD have been unsuccessful, partly because MMPs play a crucial role in maintaining normal tissue homeostasis, and their inhibition can cause severe side effects [50]. For this reason, the search for tumor-specific proteases is of great importance. ADAMTS proteases offer a promising therapeutic avenue, as they exhibit activities primarily detected in tumors, including promoting growth, drug resistance, angiogenesis, and metastasis [12,19,22,23,58,59,60]. Different ADAMTS family members have contrasting effects on LUAD prognosis: some, such as ADAMTS4, ADAMTS5, and ADAMTS16, are associated with poorer outcomes [22,59,61], while others, including ADAMTS1, ADAMTS8, and ADAMTS18, are linked to improved patient survival [62,63,64]. Therefore, it is crucial to develop inhibitors that selectively target specific ADAMTS members that are implicated in LUAD progression. For example, ADAMTS4 and ADAMTS5, which degrade aggrecan, have become targets for inhibitors currently in phase III clinical trials for osteoarthritis treatment [65]. This highlights the importance of in depth characterizing ADAMTS proteases in LUAD to better understand their prognostic significance and therapeutic potential.
Given the significant impact of metastasis on LUAD prognosis, the discovery that certain ADAMTS proteases can induce EMT and thereby promote metastasis in animal models is especially important. For example, ADAMTS4 promotes EMT in A549 and NCI-H1299 cells via c-Myc-dependent activation of the MAPK pathway [59]. ADAMTS16 and TGF-β1 form a positive feedback loop that enhances EMT in A549 and H1975 cells: TGF-β1 induces ADAMTS16 via the SMAD/SOX4 axis, while ADAMTS16 activates latent TGF-β1. Knockdown of ADAMTS16 significantly reduces metastasis of A549 cells in nude mice [22]. Similarly, Hu et al. reported that ADAMTS1 promotes EMT in A549 and H226 cells and metastasis in nude mice by facilitating TGF-β1 maturation [23]. However, Lee et al. found contradictory results, showing that ADAMTS1 suppresses EMT, as its knockdown in A549 cells increased migration, mesenchymal marker expression, and metastasis in nude mice [64]. Interestingly, ADAMTS5 enhances the motility of A549 cells while promoting a more epithelial-like phenotype, as indicated by E-cadherin and vimentin expression [61].
ADAMTS6, which targets fibrillin-1/2, fibronectin, LTBP-1/3, and syndecan-4, has emerged as a key factor in cardiovascular, musculoskeletal, and various cancer diseases [14]. The relationship between ADAMTS6 and EMT depends on the type of cancer. For example, ADAMTS6 facilitates EMT in colon cancer cells via the AKT and NF-κB signaling pathways [16]. Immunohistochemical (IHC) studies have also shown that ADAMTS6 is co-expressed with the EMT master regulator Twist1 in esophageal squamous cell carcinoma tumors [66]. In contrast, ADAMTS6 inhibits EMT in epithelial ovarian cancer [67]. In breast cancer, the effect of ADAMTS6 on EMT is cell line-dependent. While ADAMTS6 suppresses migration, invasion, and xenograft tumor growth in MCF7 and MDA-MB-468 cells by inhibiting the EGFR/ERK1/2 pathway, it acts downstream of the calcium channel TRPV6 to promote migration in BT549 cells [15,68].
Previously, Lachat et al. found that the histone demethylase KDM6B paradoxically induces EMT in A549 cells, whether overexpressed or inhibited. They also identified ADAMTS6 as a direct KDM6B target that is critical for invasion triggered by co-treatment with TGF-β and TNF-α. Additionally, IHC analysis showed co-expression of ADAMTS6 with the mesenchymal marker vimentin in 30 patient tumors [18]. Based on these findings and ADAMTS6’s established role in EMT across various tumor types [15,16,66,67,68], we propose that ADAMTS6 plays a significant regulatory role in LUAD EMT. This study supports the hypothesis by revealing that ADAMTS6 (1) shows increased expression during EMT induced by various stimuli, (2) occupies a central position in the EMT regulatory network, (3) influences EMT-associated traits, including migration, invasion, marker gene expression, chemoresistance, and colony formation, (4) correlates with clinicopathological characteristics and survival in LUAD patients.
Differential expression analysis revealed that ADAMTS6 is significantly upregulated during TGF-β1-induced EMT in A549, H358, HCC827, and H1975 LUAD cells (Figure 1D, Figure 1E, Figure 3A, Figure 3F). ScRNA-seq of TGF-β1-stimulated A549 cells confirmed higher ADAMTS6 expression in mesenchymal-like clusters than in epithelial-like clusters (Figure 3D, Figure 3E). These results are consistent with a previously published report showing that TGF-β induces ADAMTS6 in primary human keratinocytes [69]. Moreover, ADAMTS6 activates latent TGF-β1 by cleaving LTBP-1/3, thereby establishing a positive feedback loop [17].
Both this study and Lachat et al. demonstrated that TNF-α markedly enhances TGF-β1-induced ADAMTS6 expression in A549 cells (Figure 5A) [18], likely reflecting crosstalk between the SMAD and NF-κB signaling pathways during EMT induction [70,71]. Consistently, the loss of SMAD2 or Twist1, a downstream transcription factor, suppressed ADAMTS6 expression in TGF-β1-induced A549 cells (Figure 3A, Figure 3G). While TNF-α induces ADAMTS6 in keratinocytes and retinal pigment epithelial cells [69,72], microarray analysis did not show this effect in LUAD, likely due to testing a single concentration and time point (20 ng/ml, 24 hours).
Broad analysis confirms ADAMTS6 as an EMT marker in various conditions, including IL-1β treatment, desensitization of LUAD cells to gefitinib, RAVER1 depletion, and PKC activation (Figure 3G). IL-1 and EGF induce ADAMTS6 in keratinocytes [69]. In LUAD cells, IL-1β significantly increases ADAMTS6 expression, while the EGF/EGFR axis has little effect (Figure 3G). Conversely, ADAMTS6 inhibits EGFR activation without altering its expression in breast cancer cells [68]. Notably, resistance to the EGFR inhibitor gefitinib strongly elevates ADAMTS6 expression in LUAD cells (Figure 3G). This resistance is associated with activation of the MEK/ERK pathway [73]. Dual inhibition of EGFR and MEK by OT reduced ADAMTS6 expression, suggesting that MEK acts as an upstream regulator of ADAMTS6 (Figure 3G). Supporting this, nicotinamide N-methyltransferase (NNMT) decreases phosphatase PP2A methylation, which induces EMT via MEK activation in breast cancer cells [74] and promotes migration while increasing ADAMTS6 expression in renal cancer cells [75]. RAVER1 regulates alternative splicing, and its depletion promotes TGF-β-induced EMT. The upregulation of ADAMTS6 following RAVER1 knockdown may be due to upregulation of TGF-β1 and its receptors, TβRI and TβRII [76]. Similarly, the effect of PKC might be mediated through TGF-β1 by inducing its secretion [77] and enhancing the expression of downstream transcription factors Snail and Twist [78]. Interestingly, YAP1 is negatively associated with ADAMTS6 expression (Figure 3G). YAP1 mediates EMT induced by EGFR/MEK inhibition [38] or mechanical stress [79]. Since ADAMTS6 activates YAP in TC28a/2 chondrocytes [17], its downregulation by YAP1 may represent a regulatory negative feedback loop.
Gene network analysis combined with PubMed text mining identified ADAMTS6 as a key hub in the EMT regulome (Figure 2). This approach, previously used to reveal EMT regulators such as CRTC2 [80], MDK [81], and POLR3G [82], is further validated here by its identification of well-known EMT regulators, including CDH2, SNAI2, ZEB2, and MMP9 [30,80,81,82,83]. Notably, all these genes displayed gene network interconnectivity comparable to that of ADAMTS6, highlighting its significant regulatory role (Figure 2C).
Using CRISPR/Cas9-induced knockout, we verified that ADAMTS6 positively regulates EMT in LUAD. ADAMTS6 promoted A549 cell migration and invasion by reducing cell-ECM adhesion (Figure 5C–E, 5G). This effect likely stems from ADAMTS6 cleaving syndecan-4 and inhibiting focal adhesions, as shown in normal epithelial cells [13]. Transcriptomic analysis showed that patient tumors with high ADAMTS6 expression were enriched for focal adhesion gene signatures (Figure 6C), possibly reflecting a compensatory response to restore cell adhesion. By cleaving syndecan-4, ADAMTS6 reduces activation of focal adhesion kinase (FAK) [13]. To compensate, cells may upregulate Pyk2, a structurally similar kinase, or FAK-related non-kinase (FRNK), both of which can partially substitute for FAK functions [84,85]. The role of the ADAMTS6/syndecan-4/FAK axis in LUAD EMT requires further investigation.
We demonstrated that ADAMTS6 regulates EMT markers at the transcriptomic level by increasing N-cadherin (CDH2), vimentin (VIM), and Twist1 (TWIST1), while decreasing E-cadherin (CDH1) in A549 cells (Figure 5H). Similar associations were observed in LUAD patient tumors, where high ADAMTS6 expression correlated with enrichment of the EMT hallmark gene signature (Figure 6A, Figure 6B). These findings support the previously reported link between ADAMTS6 and vimentin expression in patient lung tumors [18]. Similar effects on N-cadherin, vimentin, and E-cadherin were reported in colon cancer cells [16], and ADAMTS6 expression was also correlated with Twist in esophageal squamous cell carcinoma tumors [66].
EMT enhances the resistance of LUAD to various chemotherapy drugs [9,10,11]. Specifically, tumor cells that have undergone EMT exhibit reduced sensitivity to doxorubicin, a DNA intercalating agent [11]. In our study, doxorubicin demonstrated a pronounced cytotoxic effect on A549 with suppressed ADAMTS6, which we suspect is related to the role of ADAMTS6 as an EMT inducer (Figure 5I). In contrast, ADAMTS6 increases the sensitivity of PC-9 LUAD cells to gefitinib, an EGFR inhibitor, by forming a negative feedback loop with AGR2 [19]. Interestingly, AGR2 inhibits EMT in A549 and H1299 cells: upregulates the epithelial marker E-cadherin, downregulates the mesenchymal markers vimentin, N-cadherin, ZEB1 and Slug, reduces cell invasion, enhances cell adhesion to plastic and Matrigel, and strengthens cell-cell contacts [86]. These effects contrast with the ADAMTS6 activity demonstrated here (Figure 5). Based on these observations, we hypothesize that the ADAMTS6/AGR2 axis may have opposing effects on gefitinib resistance and EMT, which requires further investigation.
We propose two mechanisms by which ADAMTS6 may induce EMT, based on enriched terms from GSEA of patient LUAD tumors.
- One of the enriched terms is “ECM-receptor interactions” (Figure 6C). ADAMTS6 cleaves the ECM-interacting receptor syndecan-4, as well as ECM components such as fibronectin and fibrillin-1 [13]. Syndecan-4, upregulated by TGF-β1 or delivered via extracellular vesicles, induces EMT in A549 cells [87,88]. Although syndecan-4 shedding does not directly drive EMT [87], it may influence EMT indirectly, as syndecan-4 binds TGF-β1 and attenuates SMAD3 activation [89]. Fibronectin proteolysis affects EMT in multiple ways, depending on the specific proteins released from its binding: the release of integrin α5β1 inhibits FAK activation and cell invasion [90], whereas the release of latent TGF-β1 activates the SMAD2/3 pathway in breast cancer cells [91]. Fibrillin-1 likely has little influence on EMT, acting downstream of syndecan-4 and fibronectin. Notably, fibronectin replaces syndecan-4 as the key regulator of fibrillin-1 deposition during TGF-β1-induced EMT [92]. Fibrillin-1 knockdown does not affect fibronectin expression or EMT-associated processes, including migration, invasion, and marker expression, in breast cancer cells [93].
- Another enriched term is “extracellular matrix structural constituent conferring tensile strength” (Figure 6C). ADAMTS6-mediated ECM cleavage may alter matrix stiffness, inducing EMT in LUAD cells though mechanical forces. Consistently, ADAMTS6 increases mechanotension in TC28a/2 chondrocytes, promoting YAP/TAZ nuclear translocation [17], a hallmark of EMT triggered by mechanical stress [79]. Together, latent TGF-β1, syndecan-4, fibronectin, and ECM stiffness are potential ADAMTS6 targets regulating EMT in LUAD cells and require further investigation.
Although ADAMTS6 did not affect the viability of A549 cells under normal growth conditions (Figure 5B), it significantly enhanced their survival at low density, suggesting a role in metastatic outgrowth (Figure 5J). Other EMT-inducing ADAMTS proteases, ADAMTS1 and ADAMTS16, have also been shown to promote lung cancer metastasis: ADAMTS1 accelerates spontaneous pulmonary metastasis of Lewis lung carcinoma in C57BL/6 mice, while ADAMTS16 enhances pulmonary metastasis of A549 cells following tail vein injection in nude mice [22,94]. In contrast, ADAMTS8 suppresses colony formation in A549 and H460 cells, consistent with its association with improved patient survival [58,63]. Future studies should investigate whether ADAMTS6 promotes metastatic nodule growth in animal models and clarify the mechanisms involved.
By analyzing clinicopathological parameters, we found that ADAMTS6 expression did not vary in LUAD tumors from patients of different ages, genders, tumor stages, and TNM stages (Figure S5). However, ADAMTS6 levels were elevated in LUAD tumors compared to normal lung tissues (Figure 6D). Interestingly, this finding contradicts previous studies that reported no difference between normal and tumor tissues [20,21]. To validate our results, we cross-checked the data using the UALCAN and OncoDb databases [95,96] (Figure S5G, S5H). Additionally, we observed that high ADAMTS6 expression was associated with reduced overall, disease-free, and progression-free survival in LUAD patients (Figure 6E, F). Therefore, like ADAMTS4 [59], ADAMTS5 [61], and ADAMTS16 [22], ADAMTS6 may serve as a negative prognostic marker for LUAD.
This study has limitations. Although ADAMTS6 knockout reduced both cell adhesion and invasion, further experiments are needed to establish a causal relationship between these effects (Figure 5C–E, Figure 5G). Overexpression studies are also necessary to complement knockout results (Figure 5). Additionally, evaluating the impact of ADAMTS6 on LUAD metastasis in mouse models would be valuable. Our analysis of molecular mechanism relied on tumor RNA sequencing data, which may be confounded by patient heterogeneity and the presence of non-tumor cell types within the tumors. To address this, we analyzed three independent clinical datasets to identify common pathways (Figure 6C); however, these findings require confirmation through biochemical and genetic validation in cell models.
4. Materials and Methods
4.1. Data Acquisition
Microarray data from TGF-β1-induced H358 cells (GSE79235, GSE49644), A549 cells (GSE114761), HCC827 cells (GSE123031), and patient LUAD tumors (GSE31210 and GSE72094), along with scRNA-seq data from TGF-β1-treated A549 cells (GSE147405) and several verification datasets (Table S1), were retrieved from Gene Expression Omnibus (GEO) database (https://www.ncbi.nlm.nih.gov/geo/) with accession dates of 22 September 2022 (cell data), 23 August 2025 (patient data), 24 February 2025 (scRNA-seq), and 4 October 2025 (verification data). The Cancer Genome Atlas Lung Adenocarcinoma (TCGA-LUAD) RNA-Seq dataset was sourced from Genomic Data Commons (GDC) data portal (https://portal.gdc.cancer.gov/, accessed on 23 August 2025).
4.2. Microarray Analysis
Expression data were normalized using log normalization. Differential expression analysis of the cell culture datasets GSE79235, GSE49644, GSE114761, and GSE123031 was performed using GEO2R tool, applying a threshold of |log2FC| ≥ 1.5 and a Benjamini-Hochberg corrected p-value < 0.05. In the verification datasets, changes in ADAMTS6 expression during EMT in LUAD, lung squamous carcinoma, and small airway epithelium cells were analyzed using GEO2R, with significant regulation defined as |log2FC| ≥ 1 and a Benjamini-Hochberg corrected p-value < 0.05. The design of these comparisons is presented in Table S1. For clinical datasets GSE31210 and GSE72094, differential expression analysis was conducted by selecting the top 20 and bottom 20 samples based on ADAMTS6 expression and comparing these groups using limma package (v3.62.2). GSEA was performed on DEGs to assess the enrichment of the hallmark EMT gene set, as well as gene sets from Kyoto Encyclopedia of Genes and Genomes (KEGG) and Gene Ontology molecular function (GO-MF).
4.3. Gene Set Enrichment Analysis
All gene sets were obtained from Molecular Signatures Database (MSigDB) using msigdbr package (v25.1.1). GSEA was performed on DEGs ranked by log2FC using clusterProfiler package (v4.14.6) with the following parameters: gene set sizes ranging from 25 to 500, multiple testing correction using the Benjamini-Hochberg method, and a p-value cutoff of 0.05.
4.4. Gene Network Analysis
Gene networks were constructed using DEGs from GSE79235, GSE49644, GSE114761, and GSE123031 with STRING plugin (v2.2.0) in Cytoscape platform (v3.10.3), applying a confidence score > 0.7 and no additional interactions as cutoff criteria. Gene centrality was assessed using twelve topological criteria from cytoHubba plugin (v0.1).
4.5. Text Mining
The co-occurrence of hub gene names with the terms “lung adenocarcinoma OR LUAD”, “epithelial-mesenchymal transition OR EMT”, “lung cancer”, and “metastasis” within the same sentence in the MEDLINE database was evaluated using GenCLiP 3.0 (http://cismu.net/genclip3/analysis.php, accessed on 6 March 2025). A gene was considered linked to a term if more than five articles mentioning both were found.
4.6. scRNA-Seq Analysis
scRNA-seq analysis was performed using Seurat package (v5.3.0). High-quality cells were included in the analysis if they had more 200 but less than 5000 detected genes, over 1000 UMI counts, and less than 5% mitochondrial gene content. Raw data were log-normalized, and expression values of all genes were scaled. Dimensionality reduction was conducted using principal component (PC) analysis on the top 2000 variable genes. Cells were clustered using the top 50 PCs and a resolution of 1 via FindNeighbors and FindClusters functions. To determine whether cell clusters were epithelial-like or mesenchymal-like, ssGSEA was performed using irGSEA package (v3.3.2) with default settings, assessing enrichment of the hallmark EMT set from MSigDB, along with epithelial and mesenchymal gene sets identified by Cook et al. [97]. Clusters were then merged into epithelial-like and mesenchymal-like groups, and pseudobulk differential expression analysis was performed using edgeR algorithm from DElegate package (v1.2.1), applying a threshold of |log2FC| ≥ 0.5 and a false discovery rate (FDR)-adjusted p-value < 0.05
4.7. sgRNA Design and Cloning Strategy
sgRNAs targeting intron 3 (“4-1”) and exon 4 (“e-b”) of the ADAMTS6 gene were designed using Benchling (https://www.benchling.com, accessed on 25 October 2022) (Table S2). Top and bottom strands of protospacers were annealed and cloned into CRISPR/Cas9-expressing vector pSpCas9(BB)-2A-GFP (pX458; Addgene, #48138) as described previously [40]. The vector was pre-digested with BstV2I restriction endonuclease (SibEnzyme, Novosibirsk, Russia), and ligation was performed using T4 DNA ligase (Thermo Fisher Scientific, Waltham, MA, USA). Electrocompetent E. coli TOP10 cells were transformed using MicroPulser (Bio-Rad, Hercules, CA, USA). Plasmids were isolated using Plasmid-mini (Biolabmix Ltd., Novosibirsk, Russia) and HiPure Plasmid EF Maxi (Magen, China) kits. DNA concentration and quality were assessed using a Nano-500 spectrophotometer (Allsheng Instruments Co., Ltd, Hangzhou, China). Insertions into plasmids were verified by Sanger sequencing.
4.8. Cell Lines and Transfection
Human A549 LUAD cells were obtained from Russian Cell Culture Collection (St. Petersburg, Russia) and maintained in DMEM (Sigma-Aldrich Inc., St. Louis, MO, USA) supplemented with 10% fetal bovine serum (FBS; Dia-M, Moscow, Russia), 100 U/mL penicillin, 100 μg/mL streptomycin, and 0.25 μg/mL amphotericin B (Central Drug House, New Delhi, India) at 37 °C in 5% CO2. A549 cells (1 × 10⁶) were plated in 6-well plates and, after 24 h, transfected with 2 μg of expression vectors containing the “4-1” and “e-b” inserts mixed at a 1:1 ratio using Lipofectamine 3000 (Thermo Fisher Scientific, Waltham, MA, USA) according to the manufacturer’s protocol. Cells transfected with pX458 plasmid lacking the spacer sgRNA region served as the transfection control. After 48 h, cells were sorted by FACS (S3e Cell Sorter, Bio-Rad, Hercules, CA, USA), and 72 h later, single GFP-positive cells were plated in 96-well plates at a density of 0.5 cells per well. After 10–14 d of growth in full DMEM/F12, single-cell clones were divided into two 96-well plates for maintenance and mutation verification, respectively.
4.9. Verification of CRISP/Cas9-Generated Mutation
DNA was extracted from clones using 100 µL of Fast lysis buffer (Biolabmix Ltd., Novosibirsk, Russia) supplemented with Proteinase K, following the manufacturer’s instructions. Routine PCR amplification was performed using BioMaster HS-Taq PCR-Color mix (Biolabmix Ltd., Novosibirsk, Russia) and primers listed in Table S2. Mutations were identified by analyzing PCR products separated by electrophoresis on a 1.5% agarose gel and stained with ethidium bromide.
Clones harboring mutations were selected for Sanger sequencing using 4F/4R primers (Table S2). Samples preparation involved isolating genomic DNA using D-cells kit (Biolabmix Ltd., Novosibirsk, Russia), followed by PCR amplification and purification of the resulting amplicons using DR kit (Biolabmix Ltd., Novosibirsk, Russia).
4.10. Sanger Sequencing
Sequencing was performed using BigDye™ Terminator v3.1 Cycle Sequencing Kit (Thermo Fisher Scientific, Waltham, MA, USA). Reaction products were purified on Sephadex G-50 columns (Cytiva, Sweden) and analyzed using an ABI 3130XL Genetic Analyzer (Thermo Fisher Scientific Inc., Waltham, MA, USA) at SB RAS Genomics Core Facility.
4.11. Quantitative Real-Time Polymerase Chain Reaction (qRT-PCR)
To study ADAMTS6 expression, cells were seeded in 12-well plates for 24 h, then cultured in DMEM with 5% FBS and treated with 4 ng/mL TGF-β (ProSpec-Tany Technogene Ltd., Ness-Ziona, Israel) for 3 d followed by 20 ng/mL TNF-α (Sci-Store, Skolkovo, Russia) for 2 d. To evaluate EMT marker expression, cells were cultured in DMEM with 10% FBS for 24 h. After the end of incubation periods, total RNA was isolated from cells using TRIzol Reagent (Ambion, Austin, TX, USA) according to the manufacturer’s protocol. First strand cDNA was synthesized using 4 μg total RNA, 0.1 μM random hexaprimer, 5000 U/mL M-MuLV-RH revertase, and RT buffer mix (Biolabmix, Novosibirsk, Russia). RT-qPCR was performed using gene specific primers (Table S3) and BioMaster SYBR Blue reagent kit (Biolabmix, Novosibirsk, Russia). Relative expression was determined by normalizing to the housekeeping gene GAPDH using the 2−ΔΔCT method.
4.12. Cell Viability Analysis
Cells (104) were cultured in 96-well plates in DMEM supplemented with 10% FBS for 24 and 48 h. Then, MTT dye was added at a concentration of 0.5 mg/mL and incubated for 3 h. After incubation, the medium was removed, formazan crystals were dissolved in DMSO, and the optical density was measured at 570 nm using Multiscan RC plate reader (Thermo LabSystems, Helsinki, Finland).
4.13. Wound Healing Assay
Cells (1.3 × 10⁵) were seeded in 24-well plates and incubated for 24 h to reach a confluent monolayer. Wounds were created on the monolayers using 10 μL pipette tip, and detached cells were removed by washing with PBS. The cells were then cultured in serum-free DMEM for 24 and 48 h, and their migration toward the wounds was captured using EVOS XL Core microscope with a built-in camera (Thermo Fisher Scientific, Waltham, MA, USA). Wound closure was quantified by measuring the wound area at each time point using ImageJ (v2.14.0) and normalizing it to the wound area at 0 h.
4.14. Transwell Assays
For migration assays, 2 × 10⁴ cells suspended in serum-free DMEM were placed in the upper chamber of CIM-plate, while DMEM with 10% FBS was added to the lower chamber. The invasion assay followed a similar protocol except that the bottom of the upper chamber was coated with a 1:5 dilution of Matrigel (BD Biosciences, Bedford, MA, USA) in DMEM for 1 h before adding the cells. Cell migration and invasion to the lower chamber were monitored using xCELLigence RTCA DP system (ACEA Biosciences Inc., San Diego, CA, USA).
4.15. Evaluation of Cell Morphology
Cells (2500) were plated in 96-well plates for 24 h. Next, images were captured using EVOS XL Core microscope and 200 cells from five random fields of view were quantified for shape (aspect ratio, AR) and size using ImageJ.
4.16. Adhesion Assay
Cells (5 × 10⁴) were seeded in 96-well plates coated with Matrigel, rat tail collagen (Cell Applications Inc., San Diego, CA, USA), or left uncoated. After 1 h, non-adherent cells were removed by washing three times with PBS, and adherent cells were quantified by MTT assay.
4.17. Colony Formation
Cells were plated at low density (300 cells per well) in 6-well plates and incubated for 10 d, with medium refreshed every 5 d with 10% FBS-supplemented DMEM. Colonies were fixed with 4% formaldehyde and stained with 0.1% (w/v) crystal violet dye. Images were captured using iBright 1500 Imaging System (Thermo Fisher, Waltham, MA, USA), and colony area was measured using ImageJ.
4.18. Bulk RNA-Seq Analysis
Expression data from the TCGA-LUAD dataset were normalized using variance stabilizing transformation (VST) method. Subsequently, the top 20 and bottom 20 samples were selected based on ADAMTS6 expression levels. Raw counts were then extracted for these selected samples, and differential expression analysis comparing high and low ADAMTS6 expression groups was performed using DESeq2 package (v1.46.0). Subsequently, GSEA was performed on DEGs to assess the enrichment of the hallmark EMT gene set, as well as gene sets from Kyoto Encyclopedia of Genes and Genomes (KEGG) and Gene Ontology molecular function (GO-MF).
4.19. Survival Analysis
The impact of ADAMTS6 on LUAD patient survival was assessed using GEPIA2 (http://gepia2.cancer-pku.cn/, accessed on 25 June 2025) for RNA-Seq TCGA data and KMplotter (https://kmplot.com/analysis/, accessed on 25 June 2025) for 17 TCGA and GEO microarray datasets (JetSet best probe set). Patient were divided based on median ADAMTS6 expression, and overall, progression-free, and disease-free survival were analyzed using Kaplan–Meier curves and the log-rank test, using p-value < 0.05 as a significance threshold.
4.20. Statistical Analysis and Visualization
Data analysis and visualization was conducted using R v4.4.2 and RStudio v.2024.12.1. Pairwise comparisons were conducted using a two-tailed Student’s t-test from the stats package (v4.4.2). Spearman correlation analysis was performed, with results visualized using Hmisc (v5.2.3) and corrplot (v0.95) packages. Additional visualization tools included ggplot2 (v4.0.0), pheatmap (v1.0.13), circlize (v0.4.16), and ggvenn (v0.1.10) packages.
5. Conclusions
This study demonstrates that the extracellular protease ADAMTS6 plays a regulatory role in the acquisition of the mesenchymal phenotype during EMT in LUAD cells. Suppression of ADAMTS6 reduces migration, invasion, mesenchymal marker expression, and colony formation, while increasing epithelial E-cadherin expression and improving doxorubicin sensitivity in A549 cells. Along with its established association with poorer patient outcomes, these findings show the importance of ADAMTS6 in LUAD progression and suggests its potential as a prognostic marker and therapeutic target.
Supplementary Materials
The following supporting information can be downloaded at: Preprints.org, Figure S1: EMT gene networks; Figure S2: Expression of EMT cell markers in epithelial-like and mesenchymal-like clusters of A549 cells; Figure S3: Relative expression of the cadherins KRT18 and KRT19; Figure S4: Molecular pathways associated with high ADAMTS6 in tumors; Figure S5: Expression of ADAMTS6 in TCGA-LUAD tumors; Table S1: Design of differential expression analysis in verification datasets of EMT in LUAD; Table S2: Protospacer and PCR primer sequences; Table S3: RT-qPCR primer sequences; Supplementary results: Sanger sequencing of ADAMTS6 alleles. References [38,39,76,98,99,100,101,102,103,104,105,106,107,108] are cited in the supplementary materials.
Author Contributions
Conceptualization, K.V.O. and A.V.M.; methodology, K.V.O. and A.M.M.; software, K.V.O.; validation, K.V.O., A.V.M., and A.M.M.; formal analysis, K.V.O. and A.V.M.; investigation, K.V.O. and A.M.M.; resources, A.V.M., G.A.S., and M.A.Z.; data curation, K.V.O.; writing—original draft preparation, K.V.O. and A.M.M.; writing—review and editing, A.V.M., M.A.Z.; visualization, K.V.O.; supervision, A.V.M.; project administration, A.V.M.; funding acquisition, G.A.S. and M.A.Z. All authors have read and agreed to the published version of the manuscript.
Funding
This work was supported by the Russian Science Foundation (grant number 23-14-00374) (in silico and in vitro studies) and partly by the Russian state-funded projects for ICBFM SB RAS (grant numbers 125012300659-6 (design of a bioinformatics analysis pipeline) and 125012300660-2 (design of CRISPR/Cas9 system for ADAMTS6 knockout)).
Institutional Review Board Statement
Not applicable.
Informed Consent Statement
Not applicable.
Data Availability Statement
Upon reasonable request, the corresponding author will provide the data generated during this study.
Acknowledgments
The authors gratefully thank Albina V. Vladimirova (Institute of Chemical Biology and Fundamental Medicine SB RAS, Novosibirsk, Russia) for the help with cell maintenance.
Conflicts of Interest
The authors declare no conflicts of interest.
References
- Bray, F.; Laversanne, M.; Sung, H.; Ferlay, J.; Siegel, R.L.; Soerjomataram, I.; Jemal, A. Global Cancer Statistics 2022: GLOBOCAN Estimates of Incidence and Mortality Worldwide for 36 Cancers in 185 Countries. CA: A Cancer Journal for Clinicians 2024, 74, 229–263. [CrossRef]
- Zhu, T.; Bao, X.; Chen, M.; Lin, R.; Zhuyan, J.; Zhen, T.; Xing, K.; Zhou, W.; Zhu, S. Mechanisms and Future of Non-Small Cell Lung Cancer Metastasis. Frontiers in Oncology 2020, 10, 585284. [CrossRef]
- Haque, S.; and Morris, J.C. Transforming Growth Factor-β: A Therapeutic Target for Cancer. Human Vaccines & Immunotherapeutics 2017, 13, 1741–1750. [CrossRef]
- Nurmagambetova, A.; Mustyatsa, V.; Saidova, A.; Vorobjev, I. Morphological and Cytoskeleton Changes in Cells after EMT. Scientific Reports 2023, 13, 22164. [CrossRef]
- Kim, B.N.; Ahn, D.H.; Kang, N.; Yeo, C.D.; Kim, Y.K.; Lee, K.Y.; Kim, T.-J.; Lee, S.H.; Park, M.S.; Yim, H.W.; et al. TGF-β Induced EMT and Stemness Characteristics Are Associated with Epigenetic Regulation in Lung Cancer. Scientific Reports 2020, 10, 10597. [CrossRef]
- Wang, S.; Tong, X.; Li, C.; Jin, E.; Su, Z.; Sun, Z.; Zhang, W.; Lei, Z.; Zhang, H. Quaking 5 Suppresses TGF-β-induced EMT and Cell Invasion in Lung Adenocarcinoma. EMBO reports 2021, 22, e52079. [CrossRef]
- Paterson, E.L.; Kazenwadel, J.; Bert, A.G.; Khew-Goodall, Y.; Ruszkiewicz, A.; Goodall, G.J. Down-Regulation of the miRNA-200 Family at the Invasive Front of Colorectal Cancers with Degraded Basement Membrane Indicates EMT Is Involved in Cancer Progression. Neoplasia 2013, 15, 180–191. [CrossRef]
- Rice, A.; Cortes, E.; Lachowski, D.; Oertle, P.; Matellan, C.; Thorpe, S.D.; Ghose, R.; Wang, H.; Lee, D.A.; Plodinec, M.; et al. GPER Activation Inhibits Cancer Cell Mechanotransduction and Basement Membrane Invasion via RhoA. Cancers 2020, 12, 289. [CrossRef]
- Morelli, A.P.; Tortelli, T.C.; Mancini, M.C.S.; Pavan, I.C.B.; Silva, L.G.S.; Severino, M.B.; Granato, D.C.; Pestana, N.F.; Ponte, L.G.S.; Peruca, G.F.; et al. STAT3 Contributes to Cisplatin Resistance, Modulating EMT Markers, and the mTOR Signaling in Lung Adenocarcinoma. Neoplasia 2021, 23, 1048–1058. [CrossRef]
- Shen, W.; Pang, H.; Liu, J.; Zhou, J.; Zhang, F.; Liu, L.; Ma, N.; Zhang, N.; Zhang, H.; Liu, L. Epithelial-Mesenchymal Transition Contributes to Docetaxel Resistance in Human Non-Small Cell Lung Cancer. Oncology Research 2014, 22, 47–55. [CrossRef]
- Tao, L.; Shu-Ling, W.; Jing-Bo, H.; Ying, Z.; Rong, H.; Xiang-Qun, L.; Wen-Jie, C.; Lin-Fu, Z. MiR-451a Attenuates Doxorubicin Resistance in Lung Cancer via Suppressing Epithelialmesenchymal Transition (EMT) through Targeting c-Myc. Biomedicine & Pharmacotherapy 2020, 125, 109962. [CrossRef]
- Bacchetti, R.; Yuan, S.; Rainero, E. ADAMTS Proteases: Their Multifaceted Role in the Regulation of Cancer Metastasis. Diseases & Research 2024, 4, 40–52. [CrossRef]
- Cain, S.A.; Mularczyk, E.J.; Singh, M.; Massam-Wu, T.; Kielty, C.M. ADAMTS-10 and -6 Differentially Regulate Cell-Cell Junctions and Focal Adhesions. Scientific Reports 2016, 6, 35956. [CrossRef]
- Mead, T.J. ADAMTS6: Emerging Roles in Cardiovascular, Musculoskeletal and Cancer Biology. Frontiers in Molecular Biosciences 2022, 9, 1023511. [CrossRef]
- Xu, X.; Li, N.; Wang, Y.; Yu, J.; Mi, J. Calcium Channel TRPV6 Promotes Breast Cancer Metastasis by NFATC2IP. Cancer Lett 2021, 519, 150–160. [CrossRef]
- Wang, Y.P.; Zhao, Y.J.; Kong, X.L. A Metalloproteinase of the Disintegrin and Metalloproteinases and the Thrombospondin Motifs 6 as a Novel Marker for Colon Cancer: Functional Experiments. Genetics and Molecular Biology 2020, 43, e20190266. [CrossRef]
- Cain, S.A.; Woods, S.; Singh, M.; Kimber, S.J.; Baldock, C. ADAMTS6 Cleaves the Large Latent TGFβ Complex and Increases the Mechanotension of Cells to Activate TGFβ. Matrix Biology 2022, 114, 18–34. [CrossRef]
- Lachat, C.; Bruyère, D.; Etcheverry, A.; Aubry, M.; Mosser, J.; Warda, W.; Herfs, M.; Hendrick, E.; Ferrand, C.; Borg, C.; et al. EZH2 and KDM6B Expressions Are Associated with Specific Epigenetic Signatures during EMT in Non Small Cell Lung Carcinomas. Cancers 2020, 12, 3649. [CrossRef]
- Luu, T.-T.-T.; Bach, D.-H.; Kim, D.; Hu, R.; Park, H.J.; Lee, S.K. Overexpression of AGR2 Is Associated With Drug Resistance in Mutant Non-Small Cell Lung Cancers. Anticancer Research 2020, 40, 1855–1866. [CrossRef]
- Szmajda-Krygier, D.; Nocoń, Z.; Pietrzak, J.; Krygier, A.; Balcerczak, E. Assessment of Methylation in Selected ADAMTS Family Genes in Non-Small-Cell Lung Cancer. International Journal of Molecular Sciences 2025, 26, 934. [CrossRef]
- Pietrzak, J.; Świechowski, R.; Wosiak, A.; Wcisło, S.; Balcerczak, E. ADAMTS Gene-Derived circRNA Molecules in Non-Small-Cell Lung Cancer: Expression Profiling, Clinical Correlations and Survival Analysis. International Journal of Molecular Sciences 2024, 25, 1897. [CrossRef]
- Xiao, L.; Li, Q.; Chen, S.; Huang, Y.; Ma, L.; Wang, Y.; Chen, J.; Zhang, J.; Liu, A.; Yuan, X.; et al. ADAMTS16 Drives Epithelial-Mesenchymal Transition and Metastasis through a Feedback Loop upon TGF-Β1 Activation in Lung Adenocarcinoma. Cell Death & Disease 2024, 15, 837. [CrossRef]
- Hu, X.; Jiang, C.; Hu, N.; Hong, S. ADAMTS1 Induces Epithelial-Mesenchymal Transition Pathway in Non-Small Cell Lung Cancer by Regulating TGF-β. Aging 2023, 15, 2097–2114. [CrossRef]
- Gordian, E.; Welsh, E.A.; Gimbrone, N.; Siegel, E.M.; Shibata, D.; Creelan, B.C.; Cress, W.D.; Eschrich, S.A.; Haura, E.B.; Muñoz-Antonia, T. Transforming Growth Factor β-Induced Epithelial-to-Mesenchymal Signature Predicts Metastasis-Free Survival in Non-Small Cell Lung Cancer. Oncotarget 2019, 10, 810–824. [CrossRef]
- Sun, Y.; Daemen, A.; Hatzivassiliou, G.; Arnott, D.; Wilson, C.; Zhuang, G.; Gao, M.; Liu, P.; Boudreau, A.; Johnson, L.; et al. Metabolic and Transcriptional Profiling Reveals Pyruvate Dehydrogenase Kinase 4 as a Mediator of Epithelial-Mesenchymal Transition and Drug Resistance in Tumor Cells. Cancer & Metabolism 2014, 2, 20. [CrossRef]
- Kitai, H.; Ebi, H.; Tomida, S.; Floros, K.V.; Kotani, H.; Adachi, Y.; Oizumi, S.; Nishimura, M.; Faber, A.C.; Yano, S. Epithelial-to-Mesenchymal Transition Defines Feedback Activation of Receptor Tyrosine Kinase Signaling Induced by MEK Inhibition in KRAS-Mutant Lung Cancer. Cancer Discovery 2016, 6, 754–769. [CrossRef]
- Chin, C.-H.; Chen, S.-H.; Wu, H.-H.; Ho, C.-W.; Ko, M.-T.; Lin, C.-Y. cytoHubba: Identifying Hub Objects and Sub-Networks from Complex Interactome. BMC Systems Biology 2014, 8, S11. [CrossRef]
- Cheng, W.-L.; Feng, P.-H.; Lee, K.-Y.; Chen, K.-Y.; Sun, W.-L.; Van Hiep, N.; Luo, C.-S.; Wu, S.-M. The Role of EREG/EGFR Pathway in Tumor Progression. International Journal of Molecular Sciences 2021, 22, 12828. [CrossRef]
- Tauriello, D.V.F.; Sancho, E.; Batlle, E. Overcoming TGFβ-Mediated Immune Evasion in Cancer. Nature Reviews Cancer 2022, 22, 25–44. [CrossRef]
- Saitoh, M. Transcriptional Regulation of EMT Transcription Factors in Cancer. Seminars in Cancer Biology 2023, 97, 21–29. [CrossRef]
- Zhao, M.; Liu, Y.; Liu, R.; Qi, J.; Hou, Y.; Chang, J.; Ren, L. Upregulation of IL-11, an IL-6 Family Cytokine, Promotes Tumor Progression and Correlates with Poor Prognosis in Non-Small Cell Lung Cancer. Cellular Physiology and Biochemistry 2018, 45, 2213–2224. [CrossRef]
- Kato, S.; Hayakawa, Y.; Sakurai, H.; Saiki, I.; Yokoyama, S. Mesenchymal-Transitioned Cancer Cells Instigate the Invasion of Epithelial Cancer Cells through Secretion of WNT3 and WNT5B. Cancer Science 2014, 105, 281–289. [CrossRef]
- Fan, T.; Li, S.; Xiao, C.; Tian, H.; Zheng, Y.; Liu, Y.; Li, C.; He, J. CCL20 Promotes Lung Adenocarcinoma Progression by Driving Epithelial-Mesenchymal Transition. International Journal of Biological Sciences 2022, 18, 4275–4288. [CrossRef]
- Li, J.; Wu, D.M.; Han, R.; Deng, Y.Y.S.H.; Liu, T.; Zhang, T.; Xu, Y. Low-Dose Radiation Promotes Invasion and Migration of A549 Cells by Activating the CXCL1/NF-κB Signaling Pathway. OncoTargets and Therapy 2020, 13, 3619–3629. [CrossRef]
- Hu, B.; Chen, Z.; Wang, X.; Chen, F.; Song, Z.; Cao, C. MicroRNA-148a-3p Directly Targets SERPINE1 to Suppress EMT-Mediated Colon Adenocarcinoma Progression. Cancer Management and Research 2021, 13, 6349–6362. [CrossRef]
- Liu, X.; Xu, D.; Liu, Z.; Li, Y.; Zhang, C.; Gong, Y.; Jiang, Y.; Xing, B. THBS1 Facilitates Colorectal Liver Metastasis through Enhancing Epithelial–Mesenchymal Transition. Clinical and Translational Oncology 2020, 22, 1730–1740. [CrossRef]
- Liu, W.; Fu, X.; Li, R. CNN1 Regulates the DKK1/Wnt/Β-catenin/C-myc Signaling Pathway by Activating TIMP2 to Inhibit the Invasion, Migration and EMT of Lung Squamous Cell Carcinoma Cells. Experimental and Therapeutic Medicine 2021, 22, 855. [CrossRef]
- Kurppa, K.J.; Liu, Y.; To, C.; Zhang, T.; Fan, M.; Vajdi, A.; Knelson, E.H.; Xie, Y.; Lim, K.; Cejas, P.; et al. Treatment-Induced Tumor Dormancy through YAP-Mediated Transcriptional Reprogramming of the Apoptotic Pathway. Cancer Cell 2020, 37, 104-122.e12. [CrossRef]
- Weber, R.; Meister, M.; Muley, T.; Thomas, M.; Sültmann, H.; Warth, A.; Winter, H.; Herth, F.J.F.; Schneider, M.A. Pathways Regulating the Expression of the Immunomodulatory Protein Glycodelin in Non-Small Cell Lung Cancer. International Journal of Oncology 2019, 54, 515–526. [CrossRef]
- Ran, F.A.; Hsu, P.D.; Wright, J.; Agarwala, V.; Scott, D.A.; Zhang, F. Genome Engineering Using the CRISPR-Cas9 System. Nature Protocols 2013, 8, 2281–2308. [CrossRef]
- Lykke-Andersen, S.; Jensen, T.H. Nonsense-Mediated mRNA Decay: An Intricate Machinery That Shapes Transcriptomes. Nature Reviews Molecular Cell Biology 2015, 16, 665–677. [CrossRef]
- Gerstberger, S.; Jiang, Q.; Ganesh, K. Metastasis. Cell 2023, 186, 1564–1579. [CrossRef]
- Dongre, A.; Weinberg, R.A. New Insights into the Mechanisms of Epithelial–Mesenchymal Transition and Implications for Cancer. Nature Reviews Molecular Cell Biology 2019, 20, 69–84. [CrossRef]
- Jung, H.-Y.; Fattet, L.; Tsai, J.H.; Kajimoto, T.; Chang, Q.; Newton, A.C.; Yang, J. Apical–Basal Polarity Inhibits Epithelial–Mesenchymal Transition and Tumour Metastasis by PAR-Complex-Mediated SNAI1 Degradation. Nature Cell Biology 2019, 21, 359–371. [CrossRef]
- Anguiano, M.; Morales, X.; Castilla, C.; Pena, A.R.; Ederra, C.; Martínez, M.; Ariz, M.; Esparza, M.; Amaveda, H.; Mora, M.; et al. The Use of Mixed Collagen-Matrigel Matrices of Increasing Complexity Recapitulates the Biphasic Role of Cell Adhesion in Cancer Cell Migration: ECM Sensing, Remodeling and Forces at the Leading Edge of Cancer Invasion. PLOS ONE 2020, 15, e0220019. [CrossRef]
- Wieczorek, K.; Wiktorska, M.; Sacewicz-Hofman, I.; Boncela, J.; Lewiński, A.; Kowalska, M.A.; Niewiarowska, J. Filamin A Upregulation Correlates with Snail-Induced Epithelial to Mesenchymal Transition (EMT) and Cell Adhesion but Its Inhibition Increases the Migration of Colon Adenocarcinoma HT29 Cells. Experimental Cell Research 2017, 359, 163–170. [CrossRef]
- Guo, Q.; Li, L.; Gao, G.; Liu, R.; Einaga, Y.; Zhi, J. Nanodiamonds Inhibit Cancer Cell Migration by Strengthening Cell Adhesion: Implications for Cancer Treatment. ACS Applied Materials & Interfaces 2021, 13, 9620–9629. [CrossRef]
- Debaugnies, M.; Rodríguez-Acebes, S.; Blondeau, J.; Parent, M.-A.; Zocco, M.; Song, Y.; de Maertelaer, V.; Moers, V.; Latil, M.; Dubois, C.; et al. RHOJ Controls EMT-Associated Resistance to Chemotherapy. Nature 2023, 616, 168–175. [CrossRef]
- Yokoyama, T.; Saitoh, M.; Miyazawa, K. TGF-β Enhances Doxorubicin Resistance and Anchorage-Independent Growth in Cancer Cells by Inducing ALDH1A1 Expression. Cancer Science 2025, 116, 2176–2188. [CrossRef]
- Ashja Ardalan, A.; Khalili-Tanha, G.; Shoari, A. Shaping the Landscape of Lung Cancer: The Role and Therapeutic Potential of Matrix Metalloproteinases. International Journal of Translational Medicine 2024, 4, 661–679. [CrossRef]
- Farina, A.R.; Mackay, A.R. Gelatinase B/MMP-9 in Tumour Pathogenesis and Progression. Cancers 2014, 6, 240–296. [CrossRef]
- Shoari, A.; Ashja Ardalan, A.; Dimesa, A.M.; Coban, M.A. Targeting Invasion: The Role of MMP-2 and MMP-9 Inhibition in Colorectal Cancer Therapy. Biomolecules 2025, 15, 35. [CrossRef]
- Yu, Q.; Stamenkovic, I. Cell Surface-Localized Matrix Metalloproteinase-9 Proteolytically Activates TGF-β and Promotes Tumor Invasion and Angiogenesis. Genes and Development 2000, 14, 163–176. [CrossRef]
- Wang, M.; Zhao, D.; Spinetti, G.; Zhang, J.; Jiang, L.-Q.; Pintus, G.; Monticone, R.; Lakatta, E.G. Matrix Metalloproteinase 2 Activation of Transforming Growth Factor-Β1 (TGF-Β1) and TGF-Β1–Type II Receptor Signaling Within the Aged Arterial Wall. Arteriosclerosis, Thrombosis, and Vascular Biology 2006, 26, 1503–1509. [CrossRef]
- Ray, R.; Goel, S.; Al Khashali, H.; Darweesh, B.; Haddad, B.; Wozniak, C.; Ranzenberger, R.; Khalil, J.; Guthrie, J.; Heyl, D.; et al. Regulation of Soluble E-Cadherin Signaling in Non-Small-Cell Lung Cancer Cells by Nicotine, BDNF, and β-Adrenergic Receptor Ligands. Biomedicines 2023, 11, 2555. [CrossRef]
- Wang, Q.; Liu, X.-Y.; Zhang, X.-Q.; Huo, Z.-X.; Chen, C.-Y.; Chen, S.; Liu, C.-Y.; Zhu, J.; Liu, S.-S.; Lu, B. LRRC45 Promotes Lung Cancer Proliferation and Progression by Enhancing C-MYC, Slug, MMP2, and MMP9 Expression. Advances in Medical Sciences 2024, 69, 451–462. [CrossRef]
- Zeng, F.; Yu, N.; Han, Y.; Ainiwaer, J. The Long Non-Coding RNA MIAT/miR-139-5p/MMP2 Axis Regulates Cell Migration and Invasion in Non-Small-Cell Lung Cancer. Journal of Biosciences 2020, 45, 51. [CrossRef]
- Zhang, Y.; Hu, K.; Qu, Z.; Xie, Z.; Tian, F. ADAMTS8 Inhibited Lung Cancer Progression through Suppressing VEGFA. Biochemical and Biophysical Research Communications 2022, 598, 1–8. [CrossRef]
- Zhai, W.; Yang, W.; Ge, J.; Xiao, X.; Wu, K.; She, K.; Zhou, Y.; Kong, Y.; Wu, L.; Luo, S.; et al. ADAMTS4 Exacerbates Lung Cancer Progression via Regulating C-Myc Protein Stability and Activating MAPK Signaling Pathway. Biology Direct 2024, 19, 94. [CrossRef]
- Jiang, Y.; Huang, J.; Huang, Z.; Li, W.; Tan, R.; Li, T.; Chen, Z.; Tang, X.; Zhao, Y.; Qiu, J.; et al. ADAMTS12 Promotes Oxaliplatin Chemoresistance and Angiogenesis in Gastric Cancer through VEGF Upregulation. Cellular Signalling 2023, 111, 110866. [CrossRef]
- Gu, J.; Chen, J.; Feng, J.; Liu, Y.; Xue, Q.; Mao, G.; Gai, L.; Lu, X.; Zhang, R.; Cheng, J.; et al. Overexpression of ADAMTS5 Can Regulate the Migration and Invasion of Non-Small Cell Lung Cancer. Tumor Biology 2016, 37, 8681–8689. [CrossRef]
- Zhang, Y.; Xu, H.; Mu, J.; Guo, S.; Ye, L.; Li, D.; Peng, W.; He, X.; Xiang, T. Inactivation of ADAMTS18 by Aberrant Promoter Hypermethylation Contribute to Lung Cancer Progression. Journal of Cellular Physiology 2019, 234, 6965–6975. [CrossRef]
- Lee, H.-C.; Chang, C.-Y.; Wu, K.-L.; Chiang, H.-H.; Chang, Y.-Y.; Liu, L.-X.; Huang, Y.-C.; Hung, J.-Y.; Hsu, Y.-L.; Wu, Y.-Y.; et al. The Therapeutic Potential of ADAMTS8 in Lung Adenocarcinoma without Targetable Therapy. Journal of Personalized Medicine 2022, 12, 902. [CrossRef]
- Lee, H.-C.; Chang, C.-Y.; Huang, Y.-C.; Wu, K.-L.; Chiang, H.-H.; Chang, Y.-Y.; Liu, L.-X.; Hung, J.-Y.; Hsu, Y.-L.; Wu, Y.-Y.; et al. Downregulated ADAMTS1 Incorporating A2M Contributes to Tumorigenesis and Alters Tumor Immune Microenvironment in Lung Adenocarcinoma. Biology 2022, 11, 760. [CrossRef]
- Cuffaro, D.; Ciccone, L.; Rossello, A.; Nuti, E.; Santamaria, S. Targeting Aggrecanases for Osteoarthritis Therapy: From Zinc Chelation to Exosite Inhibition. Journal of Medicinal Chemistry 2022, 65, 13505–13532. [CrossRef]
- Liu, L.; Yang, Z.; Ni, W.; Xuan, Y. ADAMTS-6 Is a Predictor of Poor Prognosis in Patients with Esophageal Squamous Cell Carcinoma. Experimental and Molecular Pathology 2018, 104, 134–139. [CrossRef]
- Zhang, X.; Wang, J.; Liu, N.; Wu, W.; Li, H.; Chen, J.; Guo, X. Molecular Mechanism of CD163+ Tumor-Associated Macrophage (TAM)-Derived Exosome-Induced Cisplatin Resistance in Ovarian Cancer Ascites. Annals of Translational Medicine 2022, 10, 1014. [CrossRef]
- Xie, Y.; Gou, Q.; Xie, K.; Wang, Z.; Wang, Y.; Zheng, H. ADAMTS6 Suppresses Tumor Progression via the ERK Signaling Pathway and Serves as a Prognostic Marker in Human Breast Cancer. Oncotarget 2016, 7, 61273–61283. [CrossRef]
- Martin, C.; Percevault, F.; Ryder, K.; Sani, E.; Le Cun, J.-C.; Zhadobov, M.; Sauleau, R.; Le Dréan, Y.; Habauzit, D. Effects of Radiofrequency Radiation on Gene Expression: A Study of Gene Expressions of Human Keratinocytes From Different Origins. Bioelectromagnetics 2020, 41, 552–557. [CrossRef]
- Kawata, M.; Koinuma, D.; Ogami, T.; Umezawa, K.; Iwata, C.; Watabe, T.; Miyazono, K. TGF-β-Induced Epithelial-Mesenchymal Transition of A549 Lung Adenocarcinoma Cells Is Enhanced by pro-Inflammatory Cytokines Derived from RAW 264.7 Macrophage Cells. The Journal of Biochemistry 2012, 151, 205–216. [CrossRef]
- Borthwick, L.A.; Gardner, A.; De Soyza, A.; Mann, D.A.; Fisher, A.J. Transforming Growth Factor-Β1 (TGF-Β1) Driven Epithelial to Mesenchymal Transition (EMT) Is Accentuated by Tumour Necrosis Factor α (TNFα) via Crosstalk Between the SMAD and NF-κB Pathways. Cancer Microenvironment 2012, 5, 45–57. [CrossRef]
- Bevitt, D.J.; Mohamed, J.; Catterall, J.B.; Li, Z.; Arris, C.E.; Hiscott, P.; Sheridan, C.; Langton, K.P.; Barker, M.D.; Clarke, M.P.; et al. Expression of ADAMTS Metalloproteinases in the Retinal Pigment Epithelium Derived Cell Line ARPE-19: Transcriptional Regulation by TNFα. Biochimica et Biophysica Acta (BBA) - Gene Structure and Expression 2003, 1626, 83–91. [CrossRef]
- Yu, D.; Zhao, W.; Vallega, K.A.; Sun, S.-Y. Managing Acquired Resistance to Third-Generation EGFR Tyrosine Kinase Inhibitors Through Co-Targeting MEK/ERK Signaling. Lung Cancer: Targets and Therapy 2021, 12, 1–10. [CrossRef]
- Wang, Y.; Zhou, X.; Lei, Y.; Chu, Y.; Yu, X.; Tong, Q.; Zhu, T.; Yu, H.; Fang, S.; Li, G.; et al. NNMT Contributes to High Metastasis of Triple Negative Breast Cancer by Enhancing PP2A/MEK/ERK/c-Jun/ABCA1 Pathway Mediated Membrane Fluidity. Cancer Letters 2022, 547, 215884. [CrossRef]
- Ulanovskaya, O.A.; Zuhl, A.M.; Cravatt, B.F. NNMT Promotes Epigenetic Remodeling in Cancer by Creating a Metabolic Methylation Sink. Nature Chemical Biology 2013, 9, 300–306. [CrossRef]
- Wedler, A.; Bley, N.; Glaß, M.; Müller, S.; Rausch, A.; Lederer, M.; Urbainski, J.; Schian, L.; Obika, K.-B.; Simon, T.; et al. RAVER1 Hinders Lethal EMT and Modulates miR/RISC Activity by the Control of Alternative Splicing. Nucleic Acids Research 2024, 52, 3971–3988. [CrossRef]
- Sławińska-Brych, A.; Mizerska-Kowalska, M.; Król, S.K.; Stepulak, A.; Zdzisińska, B. Xanthohumol Impairs the PMA-Driven Invasive Behaviour of Lung Cancer Cell Line A549 and Exerts Anti-EMT Action. Cells 2021, 10, 1484. [CrossRef]
- Abera, M.B.; Kazanietz, M.G. Protein Kinase Cα Mediates Erlotinib Resistance in Lung Cancer Cells. Molecular Pharmacology 2015, 87, 832–841. [CrossRef]
- Yang, L.; Li, J.; Zang, G.; Song, S.; Sun, Z.; Li, X.; Li, Y.; Xie, Z.; Zhang, G.; Gui, N.; et al. Pin1/YAP Pathway Mediates Matrix Stiffness-Induced Epithelial–Mesenchymal Transition Driving Cervical Cancer Metastasis via a Non-Hippo Mechanism. Bioengineering & Translational Medicine 2023, 8, e10375. [CrossRef]
- Li, Y.; Zhang, Y.; Shi, H.; Liu, X.; Li, Z.; Zhang, J.; Wang, X.; Wang, W.; Tong, X. CRTC2 Activates the Epithelial–Mesenchymal Transition of Diabetic Kidney Disease through the CREB-Smad2/3 Pathway. Molecular Medicine 2023, 29, 146. [CrossRef]
- Xia, M.; Tong, S.; Gao, L. Identification of MDK as a Hypoxia- and Epithelial–Mesenchymal Transition-Related Gene Biomarker of Glioblastoma Based on a Novel Risk Model and In Vitro Experiments. Biomedicines 2024, 12, 92. [CrossRef]
- Chen, H.; Ma, L.; Yang, W.; Li, Y.; Ji, Z. POLR3G Promotes EMT via PI3K/AKT Signaling Pathway in Bladder Cancer. The FASEB Journal 2023, 37, e23260. [CrossRef]
- Xu, Y.; Yang, Q.; Fang, Z.; Tan, X.; Zhang, M.; Chen, W. TRIM66 Promotes Malignant Progression of Non-Small-Cell Lung Cancer Cells via Targeting MMP9. Computational and Mathematical Methods in Medicine 2022, 2022, 6058720. [CrossRef]
- Fan, H.; Guan, J.-L. Compensatory Function of Pyk2 Protein in the Promotion of Focal Adhesion Kinase (FAK)-Null Mammary Cancer Stem Cell Tumorigenicity and Metastatic Activity. Journal of Biological Chemistry 2011, 286, 18573–18582. [CrossRef]
- Tsujioka, M.; Miyazawa, K.; Ohmuraya, M.; Nibe, Y.; Shirokawa, T.; Hayasaka, H.; Mizushima, T.; Fukuma, T.; Shimizu, S. Identification of a Novel Type of Focal Adhesion Remodelling via FAK/FRNK Replacement, and Its Contribution to Cancer Progression. Cell Death & Disease 2023, 14, 256. [CrossRef]
- Sommerova, L.; Ondrouskova, E.; Vojtesek, B.; Hrstka, R. Suppression of AGR2 in a TGF-β-Induced Smad Regulatory Pathway Mediates Epithelial-Mesenchymal Transition. BMC Cancer 2017, 17, 546. [CrossRef]
- Toba-Ichihashi, Y.; Yamaoka, T.; Ohmori, T.; Ohba, M. Up-Regulation of Syndecan-4 Contributes to TGF-Β1-Induced Epithelial to Mesenchymal Transition in Lung Adenocarcinoma A549 Cells. Biochemistry and Biophysics Reports 2016, 5, 1–7. [CrossRef]
- Wang, Z.; Thakur, C.; Bi, Z.; Qiu, Y.; Zhang, W.; Ji, H.; Venkatesan, A.K.; Cherukuri, S.; Liu, K.J.; Haley, J.D.; et al. 1,4-Dioxane Induces Epithelial-Mesenchymal Transition and Carcinogenesis in an Nrf2-Dependent Manner. Journal of Extracellular Vesicles 2025, 14, e70072. [CrossRef]
- Tanino, Y.; Wang, X.; Nikaido, T.; Misa, K.; Sato, Y.; Togawa, R.; Kawamata, T.; Kikuchi, M.; Frevert, C.W.; Tanino, M.; et al. Syndecan-4 Inhibits the Development of Pulmonary Fibrosis by Attenuating TGF-β Signaling. International Journal of Molecular Sciences 2019, 20, 4989. [CrossRef]
- Gibson, S.V.; Madzharova, E.; Tan, A.C.; Allen, M.D.; Keller, U. auf dem; Louise Jones, J.; Carter, E.P.; Grose, R.P. ADAMTS3 Restricts Cancer Invasion in Models of Early Breast Cancer Progression through Enhanced Fibronectin Degradation. Matrix Biology 2023, 121, 74–89. [CrossRef]
- Belitškin, D.; Pant, S.M.; Munne, P.; Suleymanova, I.; Belitškina, K.; Hongisto, H.; Englund, J.; Raatikainen, T.; Klezovitch, O.; Vasioukhin, V.; et al. Hepsin Regulates TGFβ Signaling via Fibronectin Proteolysis. EMBO reports 2021, 22, e52532. [CrossRef]
- Baldwin, A.K.; Cain, S.A.; Lennon, R.; Godwin, A.; Merry, C.L.R.; Kielty, C.M. Epithelial–Mesenchymal Status Influences How Cells Deposit Fibrillin Microfibrils. Journal of Cell Science 2014, 127, 158–171. [CrossRef]
- Lien, H.-C.; Lee, Y.-H.; Juang, Y.-L.; Lu, Y.-T. Fibrillin-1, a Novel TGF-Beta-Induced Factor, Is Preferentially Expressed in Metaplastic Carcinoma with Spindle Sarcomatous Metaplasia. Pathology 2019, 51, 375–383. [CrossRef]
- Liu, Y.; Xu, Y.; Yu, Q. Full-Length ADAMTS-1 and the ADAMTS-1 Fragments Display pro- and Antimetastatic Activity, Respectively. Oncogene 2006, 25, 2452–2467. [CrossRef]
- Tang, G.; Cho, M.; Wang, X. OncoDB: An Interactive Online Database for Analysis of Gene Expression and Viral Infection in Cancer. Nucleic Acids Research 2022, 50, D1334–D1339. [CrossRef]
- Chandrashekar, D.S.; Karthikeyan, S.K.; Korla, P.K.; Patel, H.; Shovon, A.R.; Athar, M.; Netto, G.J.; Qin, Z.S.; Kumar, S.; Manne, U.; et al. UALCAN: An Update to the Integrated Cancer Data Analysis Platform. Neoplasia 2022, 25, 18–27. [CrossRef]
- Cook, D.P.; Vanderhyden, B.C. Context Specificity of the EMT Transcriptional Response. Nature Communications 2020, 11, 2142. [CrossRef]
- Nitschkowski, D.; Vierbuchen, T.; Heine, H.; Behrends, J.; Reiling, N.; Reck, M.; Rabe, K.F.; Kugler, C.; Ammerpohl, O.; Drömann, D.; et al. SMAD2 Linker Phosphorylation Impacts Overall Survival, Proliferation, TGFβ1-Dependent Gene Expression and Pluripotency-Related Proteins in NSCLC. British Journal of Cancer 2025, 133, 52–65. [CrossRef]
- Lyu, J.; Pirooznia, M.; Li, Y.; Xiong, J. The Short-Chain Fatty Acid Acetate Modulates Epithelial-to-Mesenchymal Transition. Molecular Biology of the Cell 2022, 33, br13. [CrossRef]
- Kwon, O.-S.; Kwon, E.-J.; Kong, H.-J.; Choi, J.-Y.; Kim, Y.-J.; Lee, E.-W.; Kim, W.; Lee, H.; Cha, H.-J. Systematic Identification of a Nuclear Receptor-Enriched Predictive Signature for Erastin-Induced Ferroptosis. Redox Biology 2020, 37, 101719. [CrossRef]
- Bae, G.Y.; Hong, S.K.; Park, J.R.; Kwon, O.S.; Kim, K.T.; Koo, J.H.; Oh, E.; Cha, H.J. Chronic TGFβ Stimulation Promotes the Metastatic Potential of Lung Cancer Cells by Snail Protein Stabilization through Integrin Β3-Akt-GSK3β Signaling. Oncotarget 2016, 7, 25366–25376. [CrossRef]
- Dvornikov, D.; Schneider, M.A.; Ohse, S.; Szczygieł, M.; Titkova, I.; Rosenblatt, M.; Muley, T.; Warth, A.; Herth, F.J.; Dienemann, H.; et al. Expression Ratio of the TGFβ-Inducible Gene MYO10 Is Prognostic for Overall Survival of Squamous Cell Lung Cancer Patients and Predicts Chemotherapy Response. Scientific Reports 2018, 8, 9517. [CrossRef]
- Tian, B.; Li, X.; Kalita, M.; Widen, S.G.; Yang, J.; Bhavnani, S.K.; Dang, B.; Kudlicki, A.; Sinha, M.; Kong, F.; et al. Analysis of the TGFβ-Induced Program in Primary Airway Epithelial Cells Shows Essential Role of NF-κB/RelA Signaling Network in Type II Epithelial Mesenchymal Transition. BMC Genomics 2015, 16, 529. [CrossRef]
- Gladilin, E.; Ohse, S.; Boerries, M.; Busch, H.; Xu, C.; Schneider, M.; Meister, M.; Eils, R. TGFβ-Induced Cytoskeletal Remodeling Mediates Elevation of Cell Stiffness and Invasiveness in NSCLC. Scientific Reports 2019, 9, 7667. [CrossRef]
- Li, R.; Ong, S.L.; Tran, L.M.; Jing, Z.; Liu, B.; Park, S.J.; Huang, Z.L.; Walser, T.C.; Heinrich, E.L.; Lee, G.; et al. Chronic IL-1β-Induced Inflammation Regulates Epithelial-to-Mesenchymal Transition Memory Phenotypes via Epigenetic Modifications in Non-Small Cell Lung Cancer. Scientific Reports 2020, 10, 377. [CrossRef]
- Ware, K.E.; Hinz, T.K.; Kleczko, E.; Singleton, K.R.; Marek, L.A.; Helfrich, B.A.; Cummings, C.T.; Graham, D.K.; Astling, D.; Tan, A.-C.; et al. A Mechanism of Resistance to Gefitinib Mediated by Cellular Reprogramming and the Acquisition of an FGF2-FGFR1 Autocrine Growth Loop. Oncogenesis 2013, 2, e39–e39. [CrossRef]
- Ao, L.; Jia, W.; Gong, Q.; Cui, J.; Wang, J.; Yu, Y.; Fu, C.; Li, H.; Wei, J.; Wang, R.; et al. Targeting GFPT2 to Reinvigorate Immunotherapy in EGFR-Mutated NSCLC. bioRxiv 2024, 2024.03.01.582888. [CrossRef]
- Liu, Y.; Mayo, M.W.; Xiao, A.; Hall, E.H.; Amin, E.B.; Kadota, K.; Adusumilli, P.S.; Jones, D.R. Loss of BRMS1 Promotes a Mesenchymal Phenotype through NF-κB-Dependent Regulation of Twist1. Molecular and Cellular Biology 2015, 35, 303–317. [CrossRef]
Figure 1.
Dissecting the regulatory role of ADAMTS6 in TGF-β1-induced EMT of LUAD cells. (A) Differential expression analysis of TGF-β1-treated versus untreated human LUAD cells (top). The table reflects the experimental conditions used in each dataset (bottom). (B) Activation of EMT hallmark gene signature in the microarray datasets, as determined by GSEA. (C) Differential expression (|log2(fold change (FC))| ≥ 1.5) of EMT markers between TGF-β1-induced and control cells in microarray datasets. Genes with non-significant changes (p-value ≥ 0.05) are indicated in gray. (D) Expression of ADAMTS6 in control and TGF-β1-induced cells. * and *** indicate p-values of < 0.05 and < 0.001, respectively, based on differential expression analysis. (E) Time-dependent changes in ADAMTS6 expression in A549 cells following TGF-β1 treatment.

Figure 2.
Gene network analysis. (A) Analysis workflow. Four gene networks were constructed from DEGs identified in each dataset by comparing TGF-β1-treated and control cells using STRING plugin in Cytoscape, and visualized in Figure S1. Each network was analyzed with CytoHubba plugin, and genes ranked in the top 15% by at least one of twelve centrality criteria were classified as hub genes. The intersection of hub genes from four networks yielded 50 common hub genes. (B) Differential expression (|log2FC| ≥ 1.5) of 50 common hub genes between TGF-β1-induced and control cells in microarray datasets. Genes with non-significant changes (p-value ≥ 0.05) are indicated in gray. (C) Ranking of ADAMTS6 among 23 upregulated hub genes according to 12 centrality measures computed by cytoHubba in gene networks. (D) Text mining summary. Associations of common hub genes with EMT, metastasis, LUAD, and lung cancer were extracted from PubMed Central. Line widths reflect the number of sentences in which a hub gene and term co-occur.
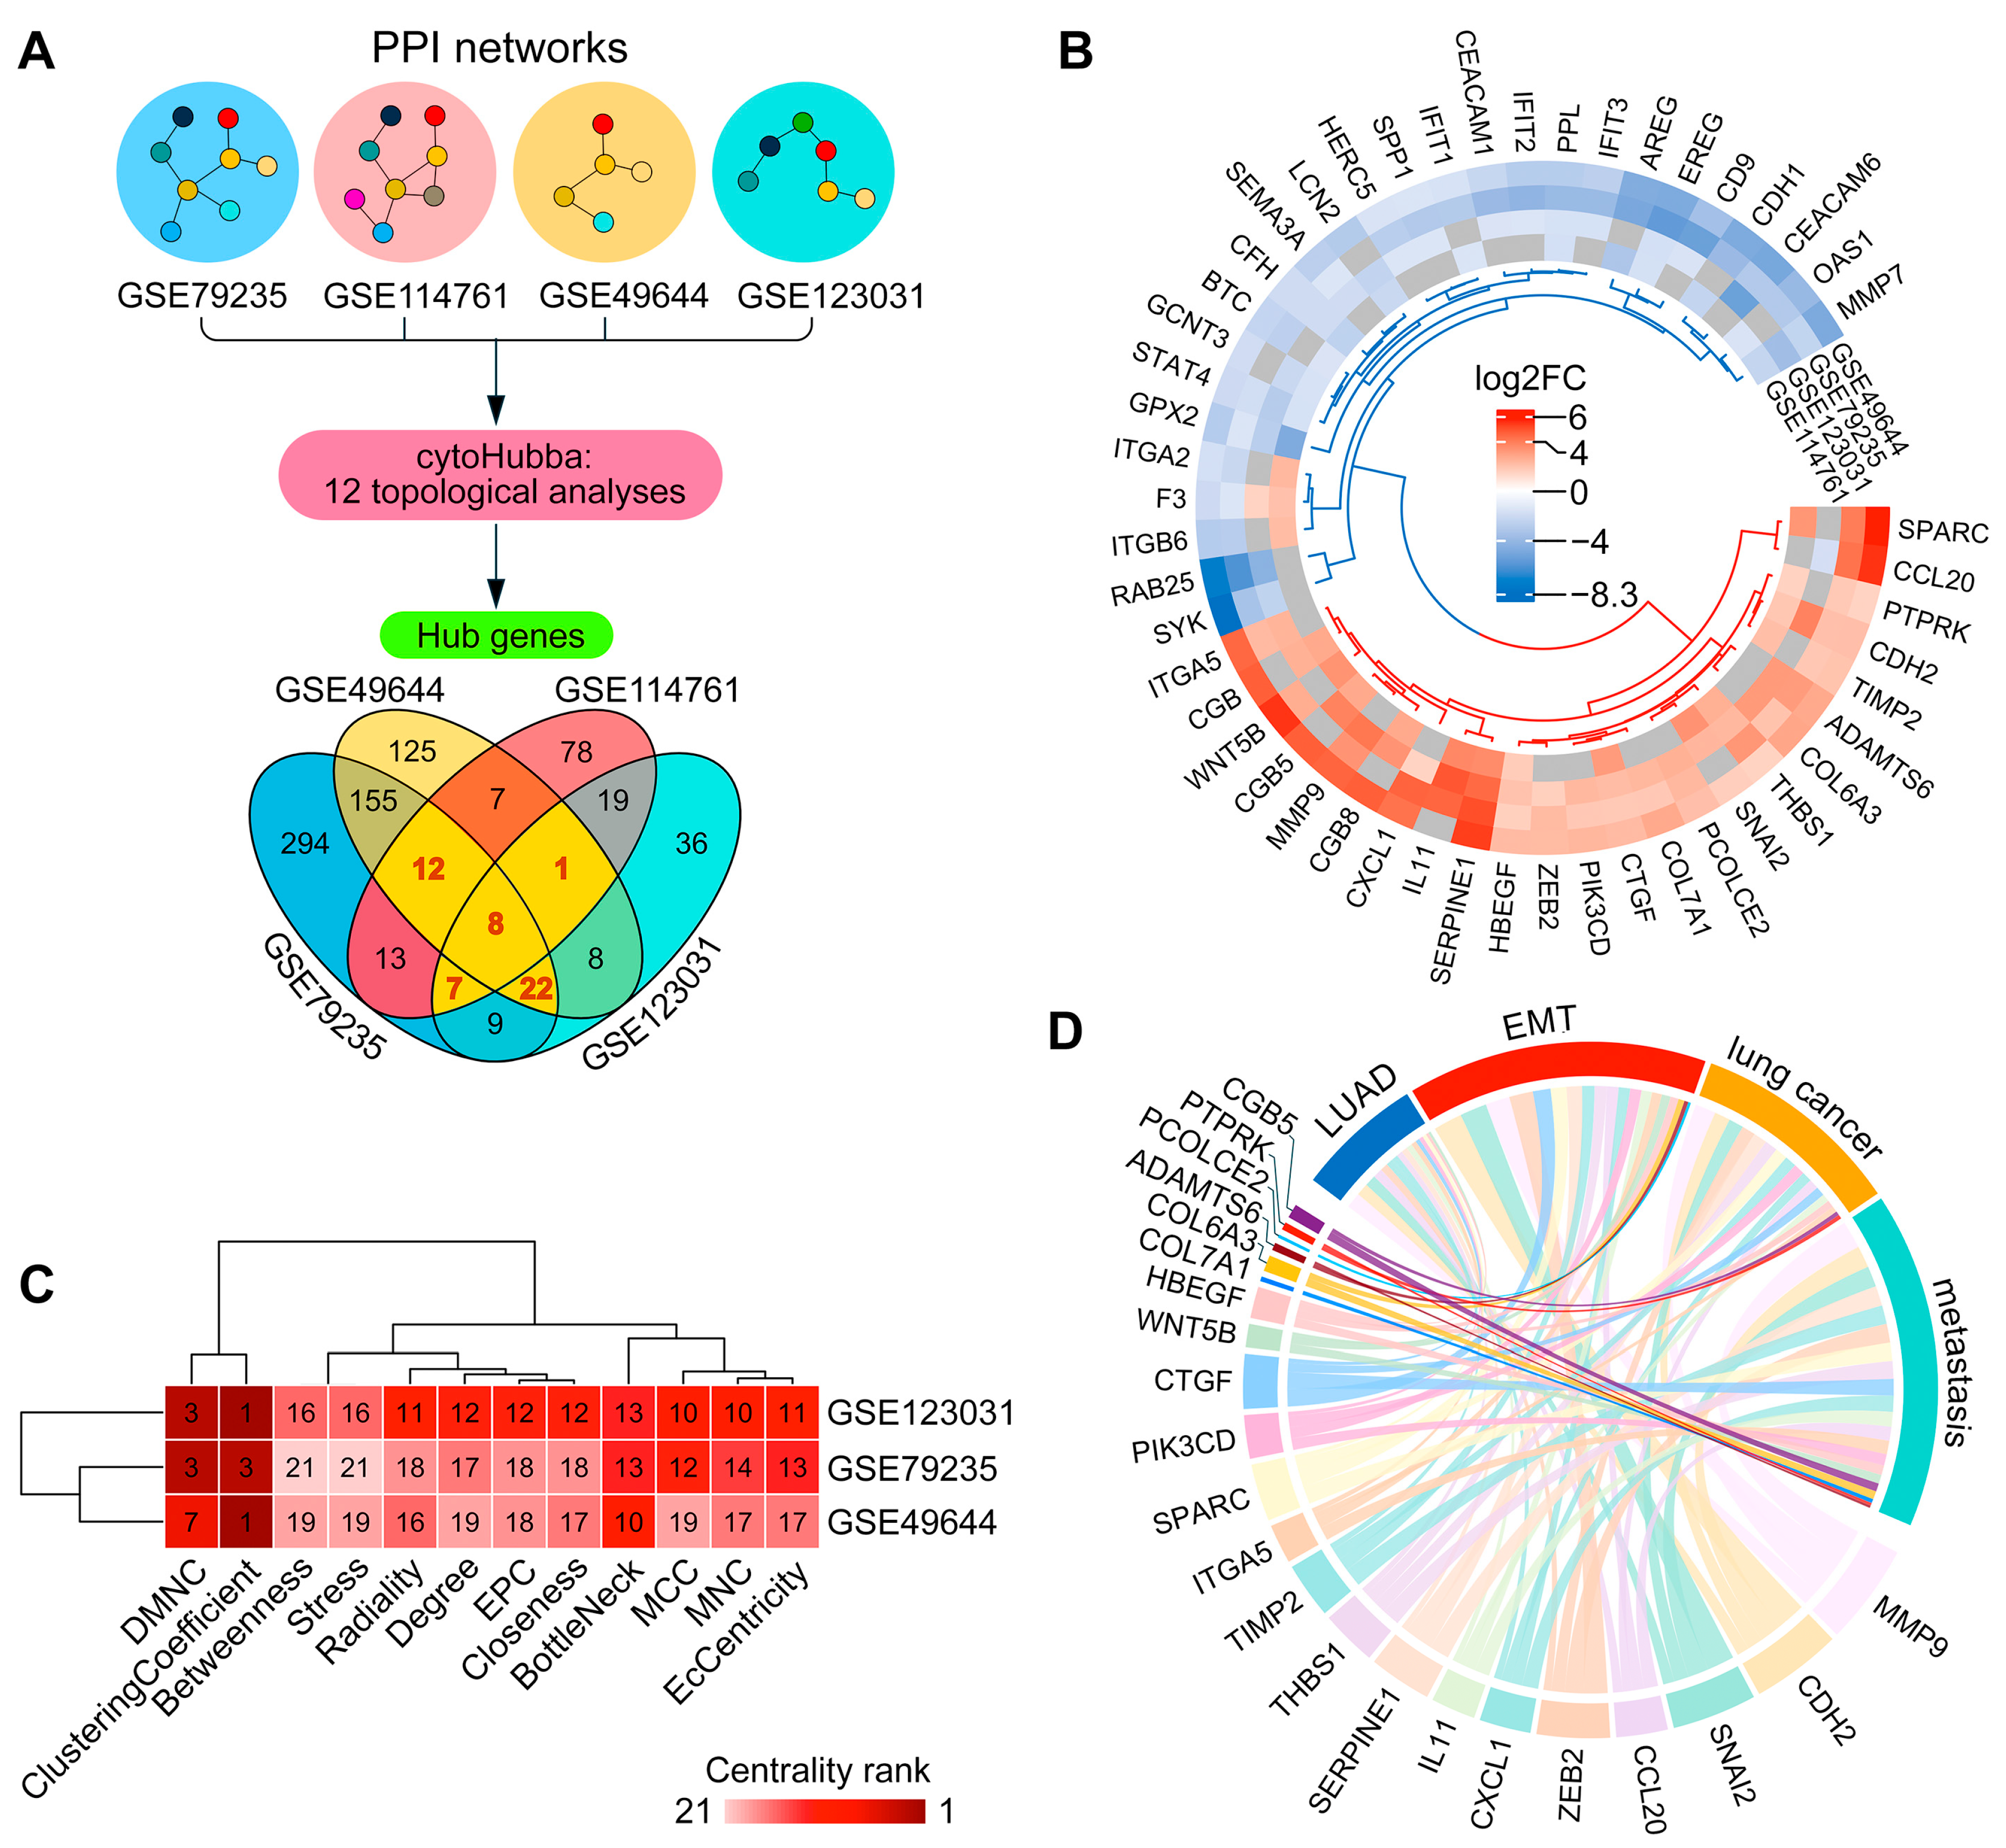
Figure 3.
ADAMTS6 as a marker of LUAD EMT. (A) Changes in ADAMTS6 expression in A549 cells following treatment with TGF-β1 and sodium acetate at specified concentrations and time points, and after SMAD2 mutation. Comparisons were made to untreated controls (red) or TGF-β1-treated cells (dark pink). (B) UMAP embeddings of A549 cells (left) and a graph showing the relative representation of clusters under each experimental condition (right). (C) Enrichment of epithelial, mesenchymal, and hallmark EMT signatures in cell clusters evaluated by ssGSEA. (D) Normalized expression of ADAMTS6 in epithelial and mesenchymal cells. (E) Volcano plot showing genes differentially expressed in mesenchymal cells, with ADAMTS6 and classical EMT markers highlighted. (F) Changes in ADAMTS6 expression in H1975 LUAD, SK-MES-1 SCC, and small airway epithelial (s.a.e.) cells following treatment with TGF-β1 at specified concentrations and time points, compared to untreated controls. (G) Changes in ADAMTS6 expression in specified LUAD cells upon EMT induction by various stimuli. Red and blue indicate up- and downregulation compared to corresponding controls (untreated, DMSO-treated, siNC), while dark pink shows downregulation relative to YAP1 knockout. (H) Network summarizing the regulation of ADAMTS6 by EMT-mediating genes and factors; red and blue indicate positive and negative regulators of expression, respectively. Gef. res., gefitinib resistance; OT, osimertinib and trametinib treatment; siEGFR and siRAVER1, knockdown of EGFR and RAVER1 by siRNA; shTwist1, Twist1 knockdown by shRNA; YAP1KO, CRISP/Cas9-induced YAP1 knockout. Information on datasets, group comparisons, and treatment schemes is summarized in Table S1. Dashed lines in A, F, and G indicate significant expression changes (|log2FC| ≥ 1).
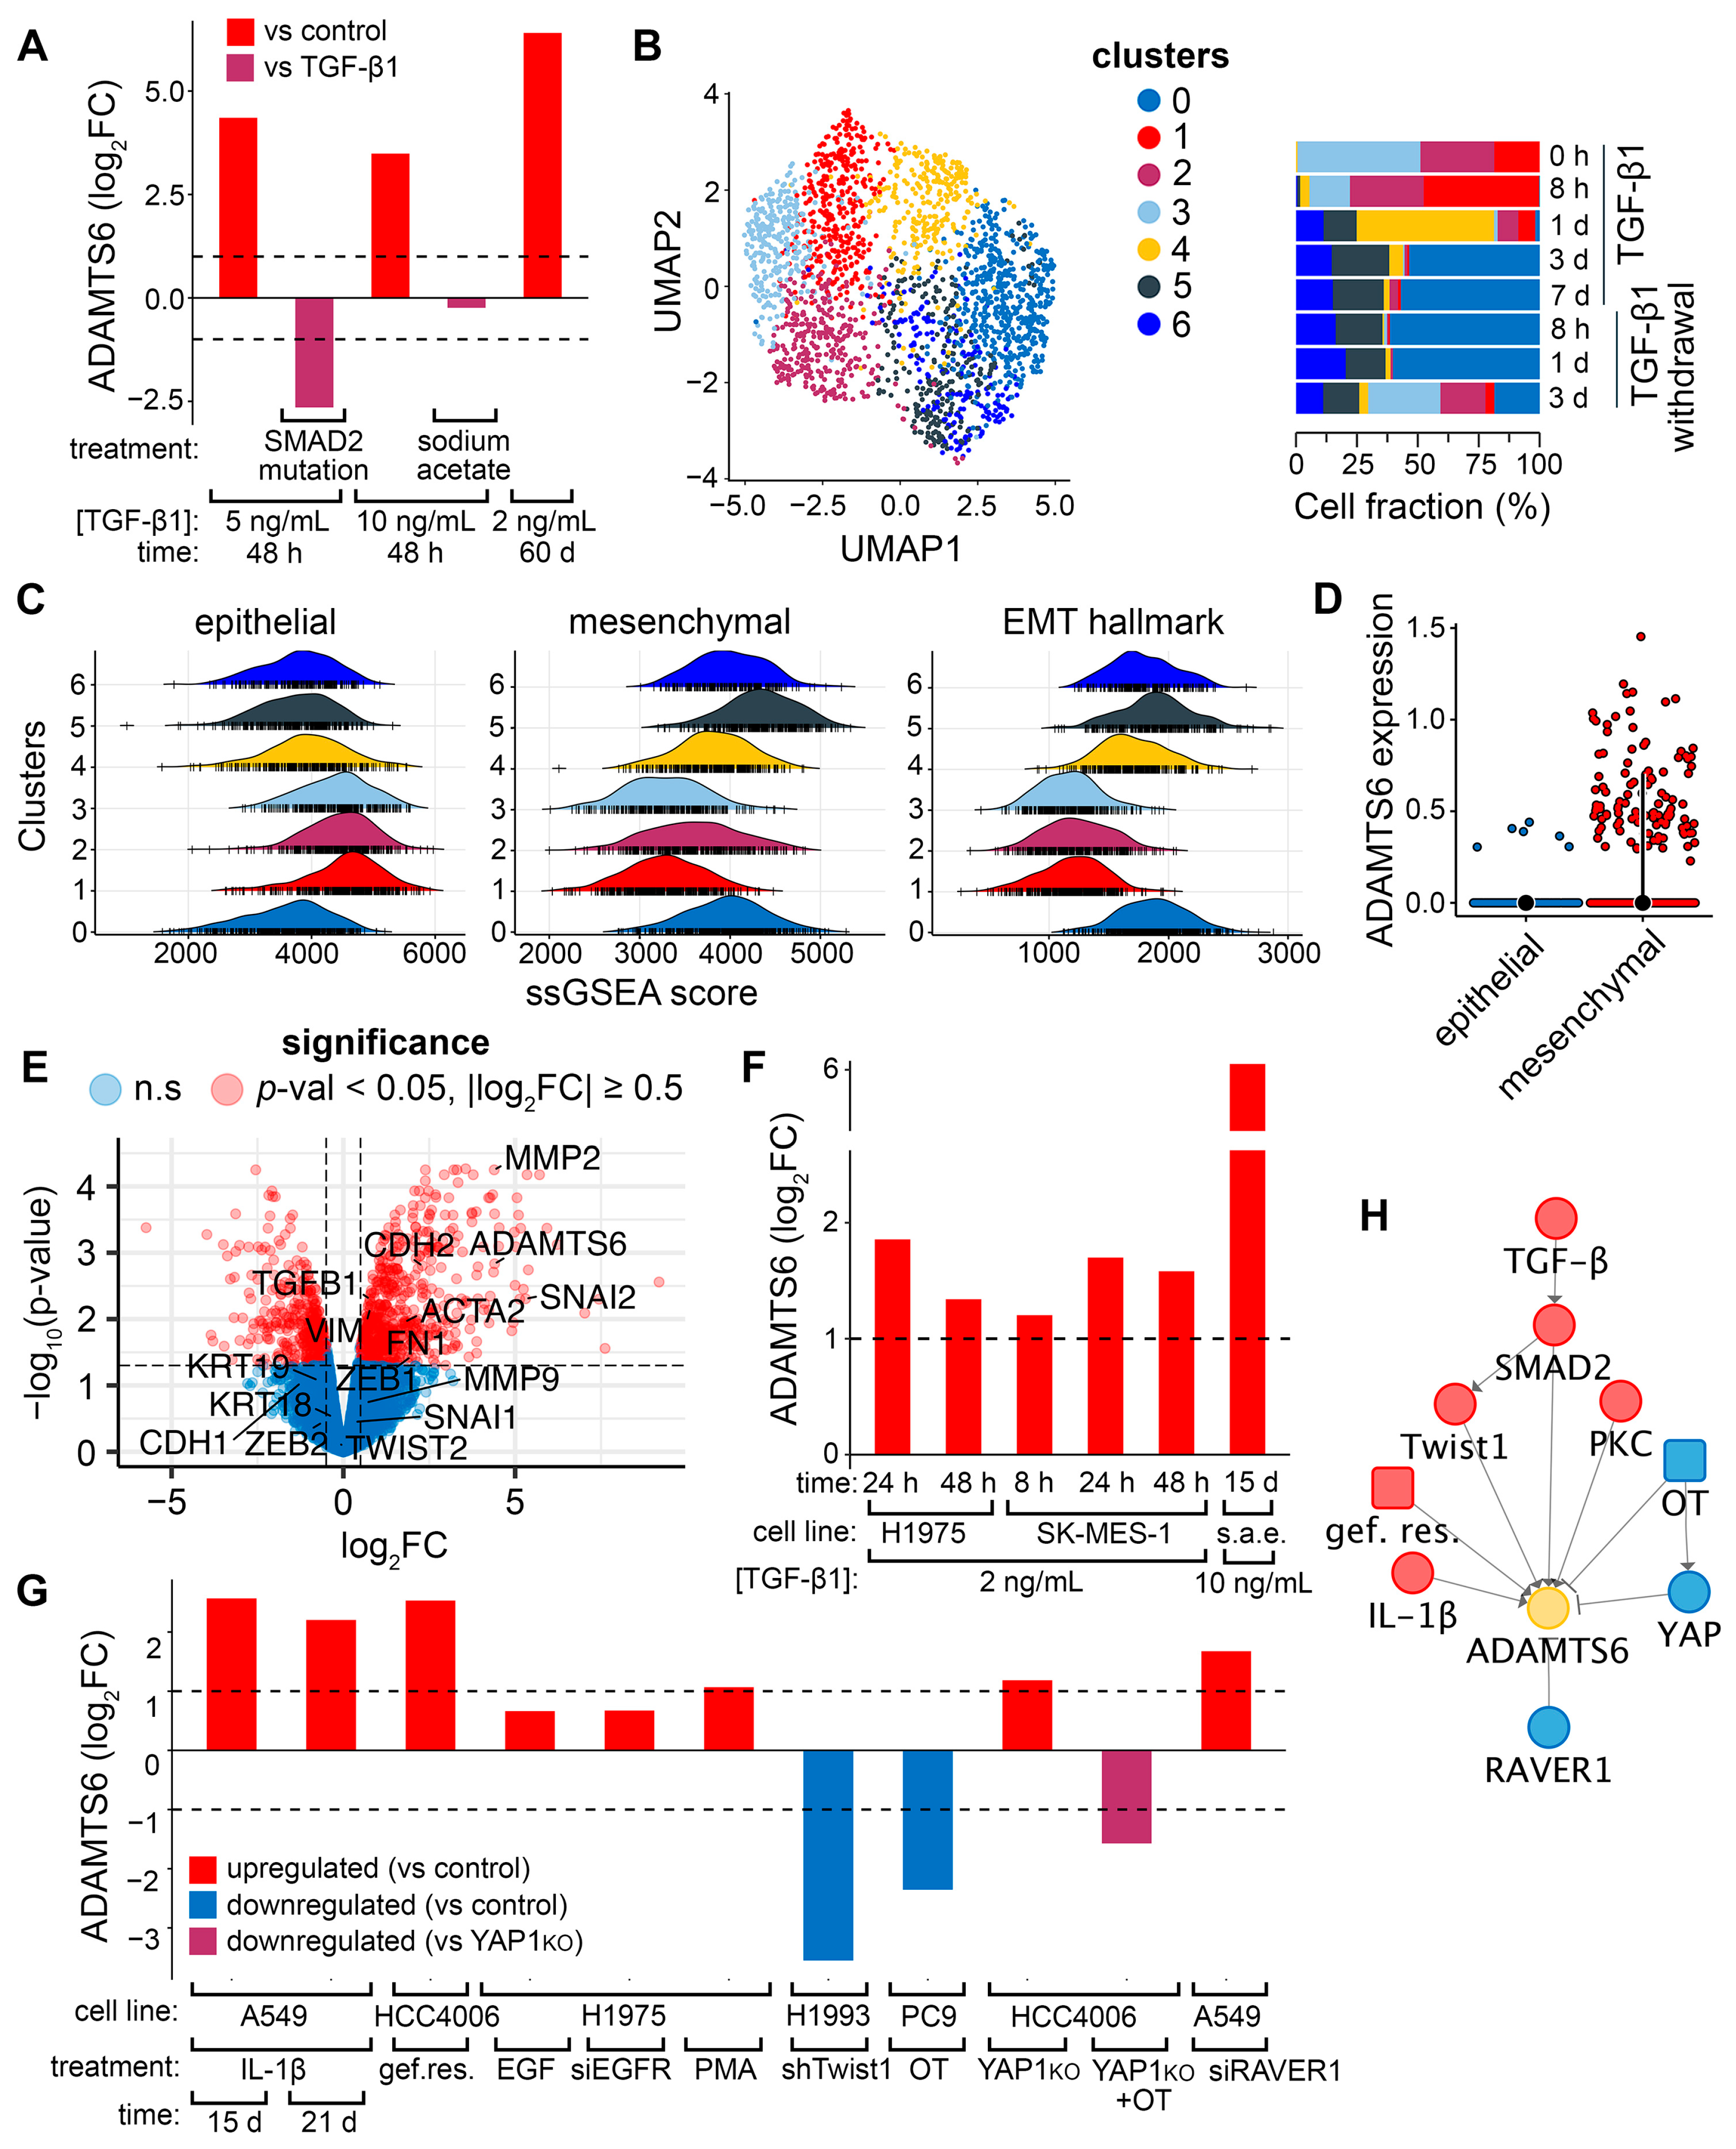
Figure 4.
Generation of ADAMTS6 knockout lines based on A549 human cells. (A) Editing strategy involving the usage of two CRISPR-induced DSBs with corresponding sequences of protospacers. (B) Clone selection based on PCR analysis of target genome region using various flanking primers. Products were analyzed in 1.5% agarose gel. “+” denotes the control A549 cells used as a positive PCR control. (C) CRISPR-induced mutations were determined through Sanger sequencing (see supplementary data).
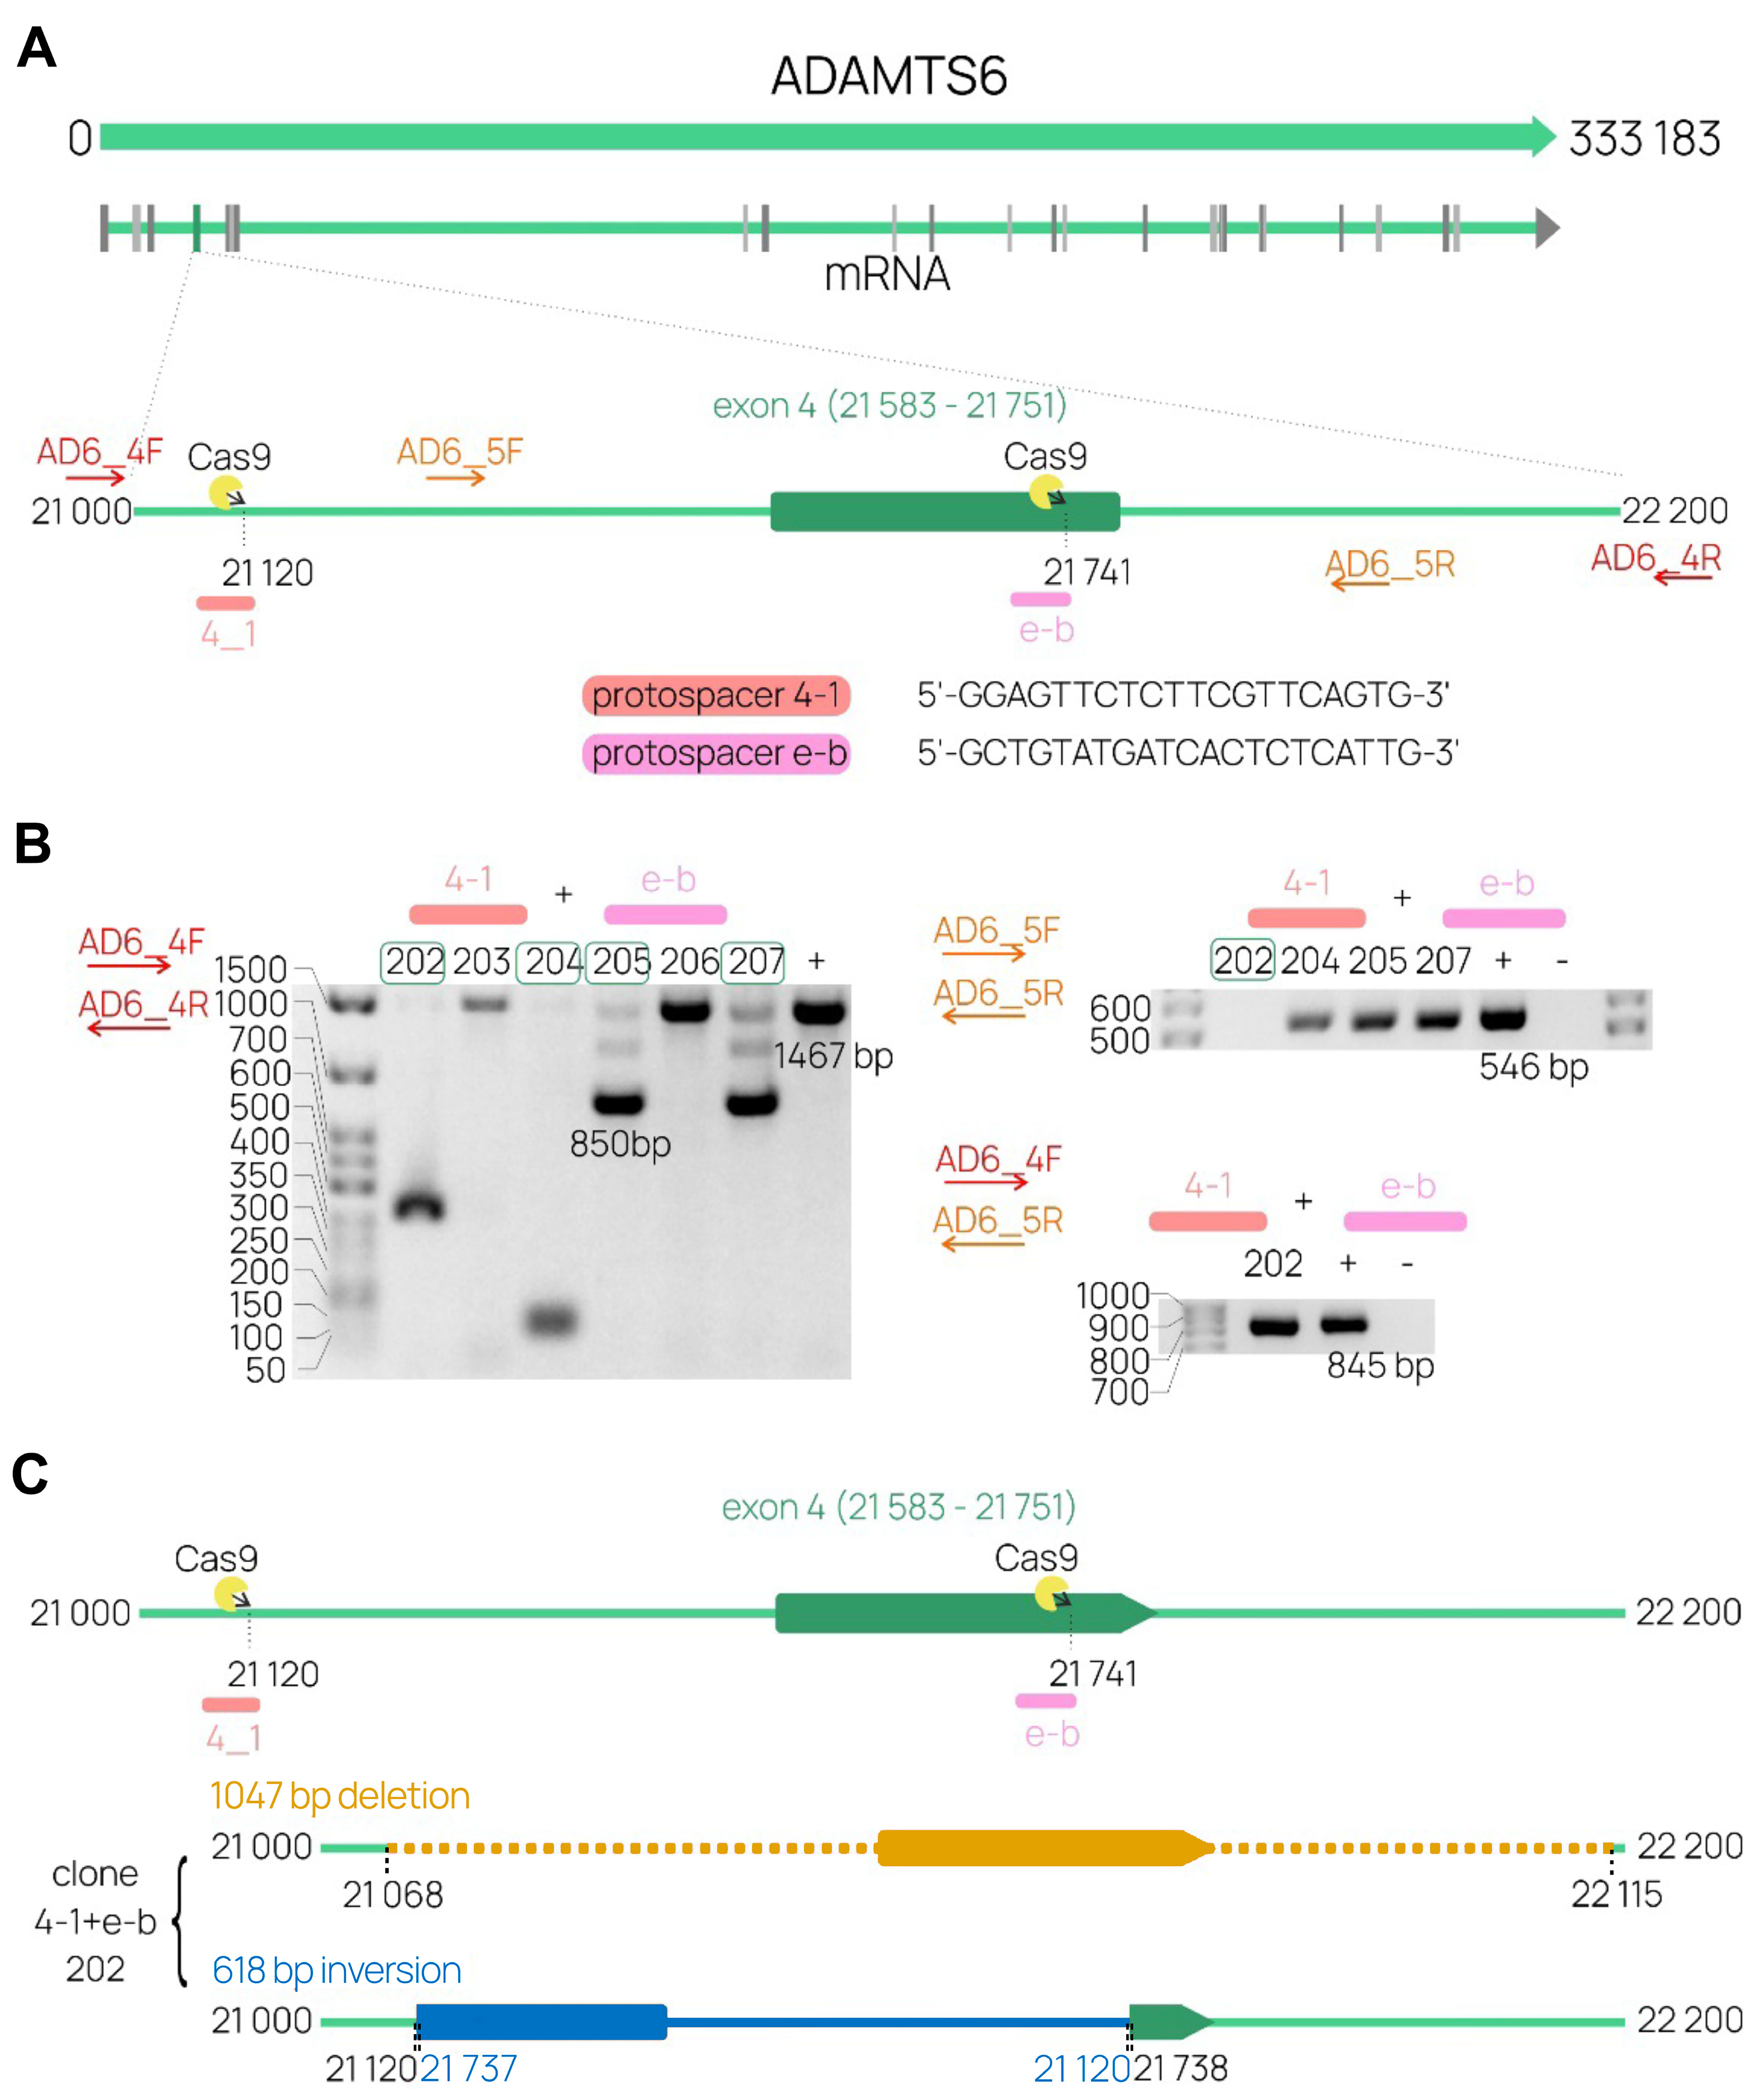
Figure 5.
Comparison of EMT-associated phenotypic manifestations in parental A549 cells (control) versus cells with CRISPR/Cas9-mediated ADAMTS6 knockout (AD6-KO). (A) Relative expression of ADAMTS6 in control and AD6-KO cells incubated under regimens: (i) TGF-β (4 ng/ml) for 3 d + TNF-α (20 ng/ml) for 2 d, (ii) without induction (5 d). Assessment by RT-qPCR with normalization to the housekeeping gene GAPDH. (B) Viability of control and AD6-KO cells after 24 and 48 h of incubation evaluated by MTT assay. (C) Wound healing on cell monolayers (top). Quantification was performed by assessing the reduction of cell-free zone (bottom). (D) Real-time quantification of cell migration using xCelligence system. The cell index is normalized to the 1-h time point. (E) Real-time quantification of cell invasion through Matrigel using xCelligence system. The cell index is normalized to the 72-h time point. (F) Cell morphology (top). Quantification was performed by calculating aspect ratio, the ratio of the cell’s long axis to its short axis (bottom). (G) Cell attachment to polystyrene, collagen, and Matrigel after 1 h of incubation, assessed by MTT assay after a triple wash step. (H) Relative expression of the epithelial marker CDH1 and the mesenchymal markers CDH2, VIM, and TWIST1 assessed via RT-qPCR and normalized to the housekeeping gene GAPDH. (I) Doxorubicin cytotoxicity assessed by MTT after a 72-h incubation period. Table represents IC50 quantification. (J) Colony formation after 10 d of incubation (top). Quantification was performed by calculating the total colony area (bottom). All experiments were conducted with a minimum of three biological replicates. Data are presented as mean ± SD. Statistical significance was determined by a two-tailed Student’s t-test: *p < 0.05, **p < 0.01, ***p < 0.001; n.s., not statistically significant.
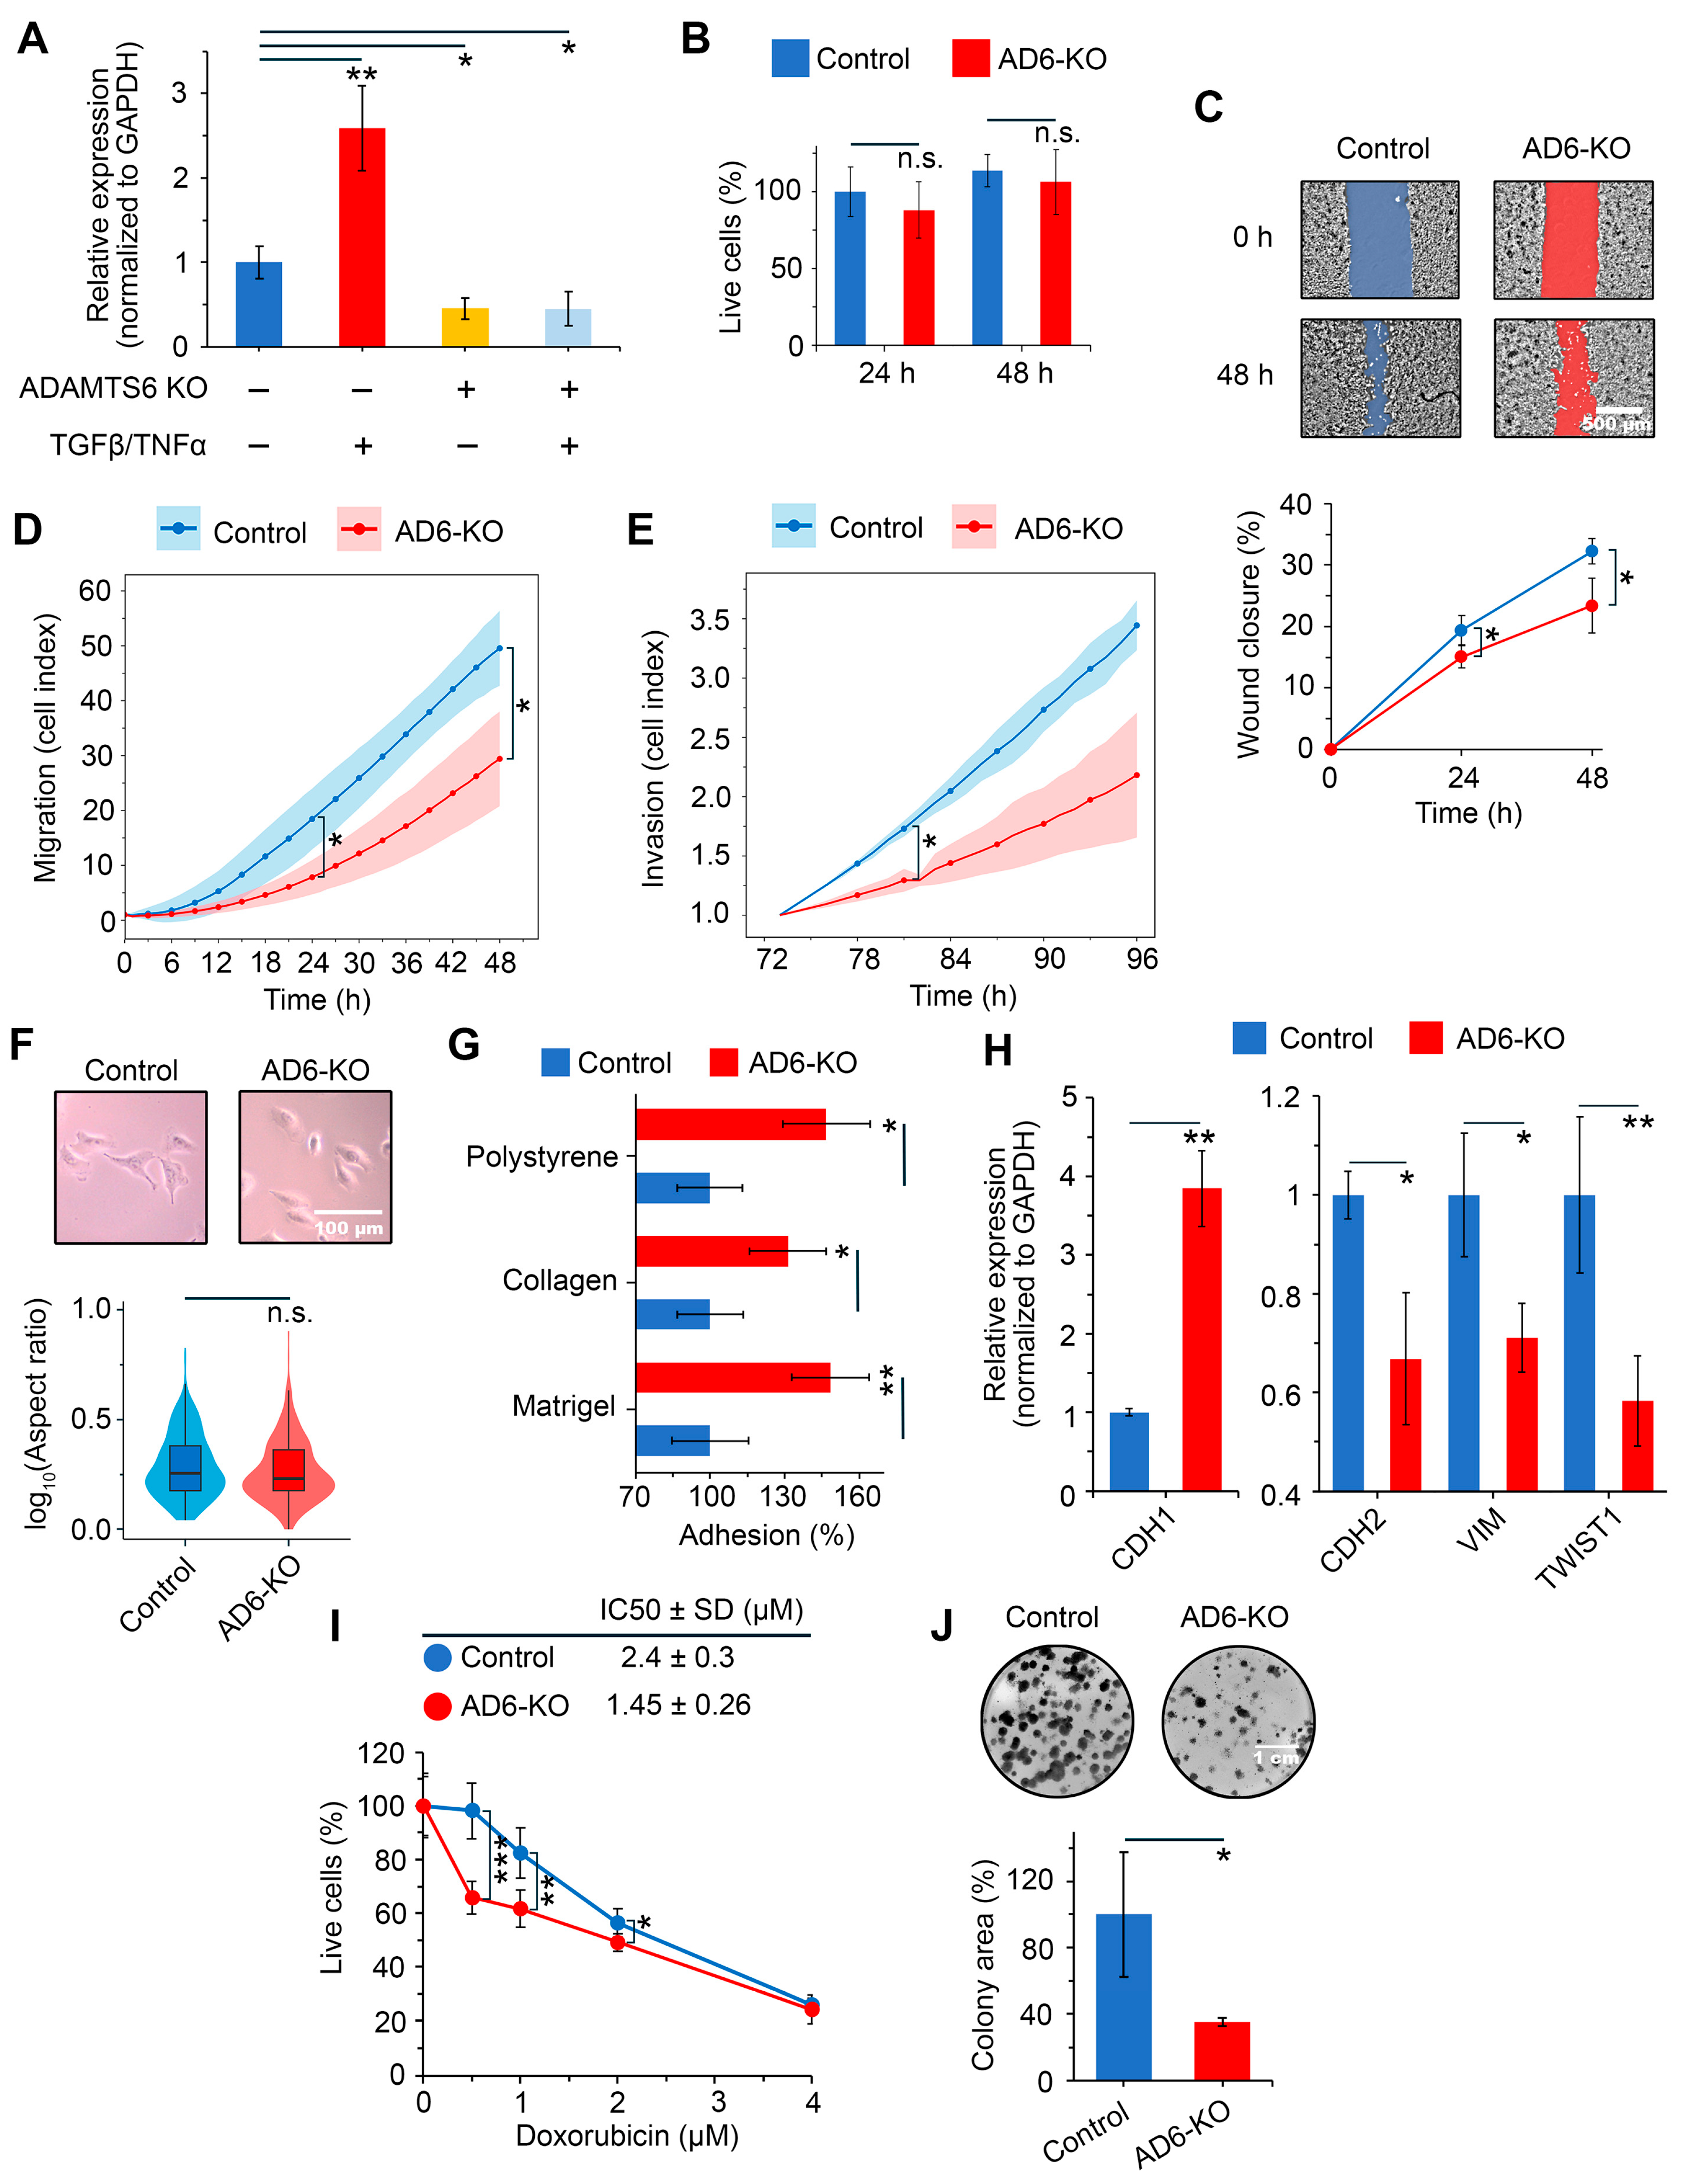
Figure 6.
Correlations of ADAMTS6 expression with EMT and clinicopathological features in LUAD patient cohorts (TCGA-LUAD, GSE31210, and GSE72094). (A) Heatmap showing the correlation between expression of ADAMTS6 and EMT markers in patient tumors. Non-significant correlations (p-value ≥ 0.05) are indicated by a cross. (B) Activation of the EMT hallmark gene signature in tumors with high ADAMTS6 expression, as determined by GSEA. (C) KEGG and GO-MF terms enriched in three clinical datasets when comparing tumors with high versus low ADAMTS6 expression. (D) ADAMTS6 expression in normal lung tissues and tumors from TCGA-LUAD dataset. Statistical significance was determined by a two-tailed Student’s t-test. (E, F) Kaplan–Meier survival analysis of ADAMTS6 in LUAD patients stratified by median expression, performed using GEPIA2 (E) and KMplotter (F).
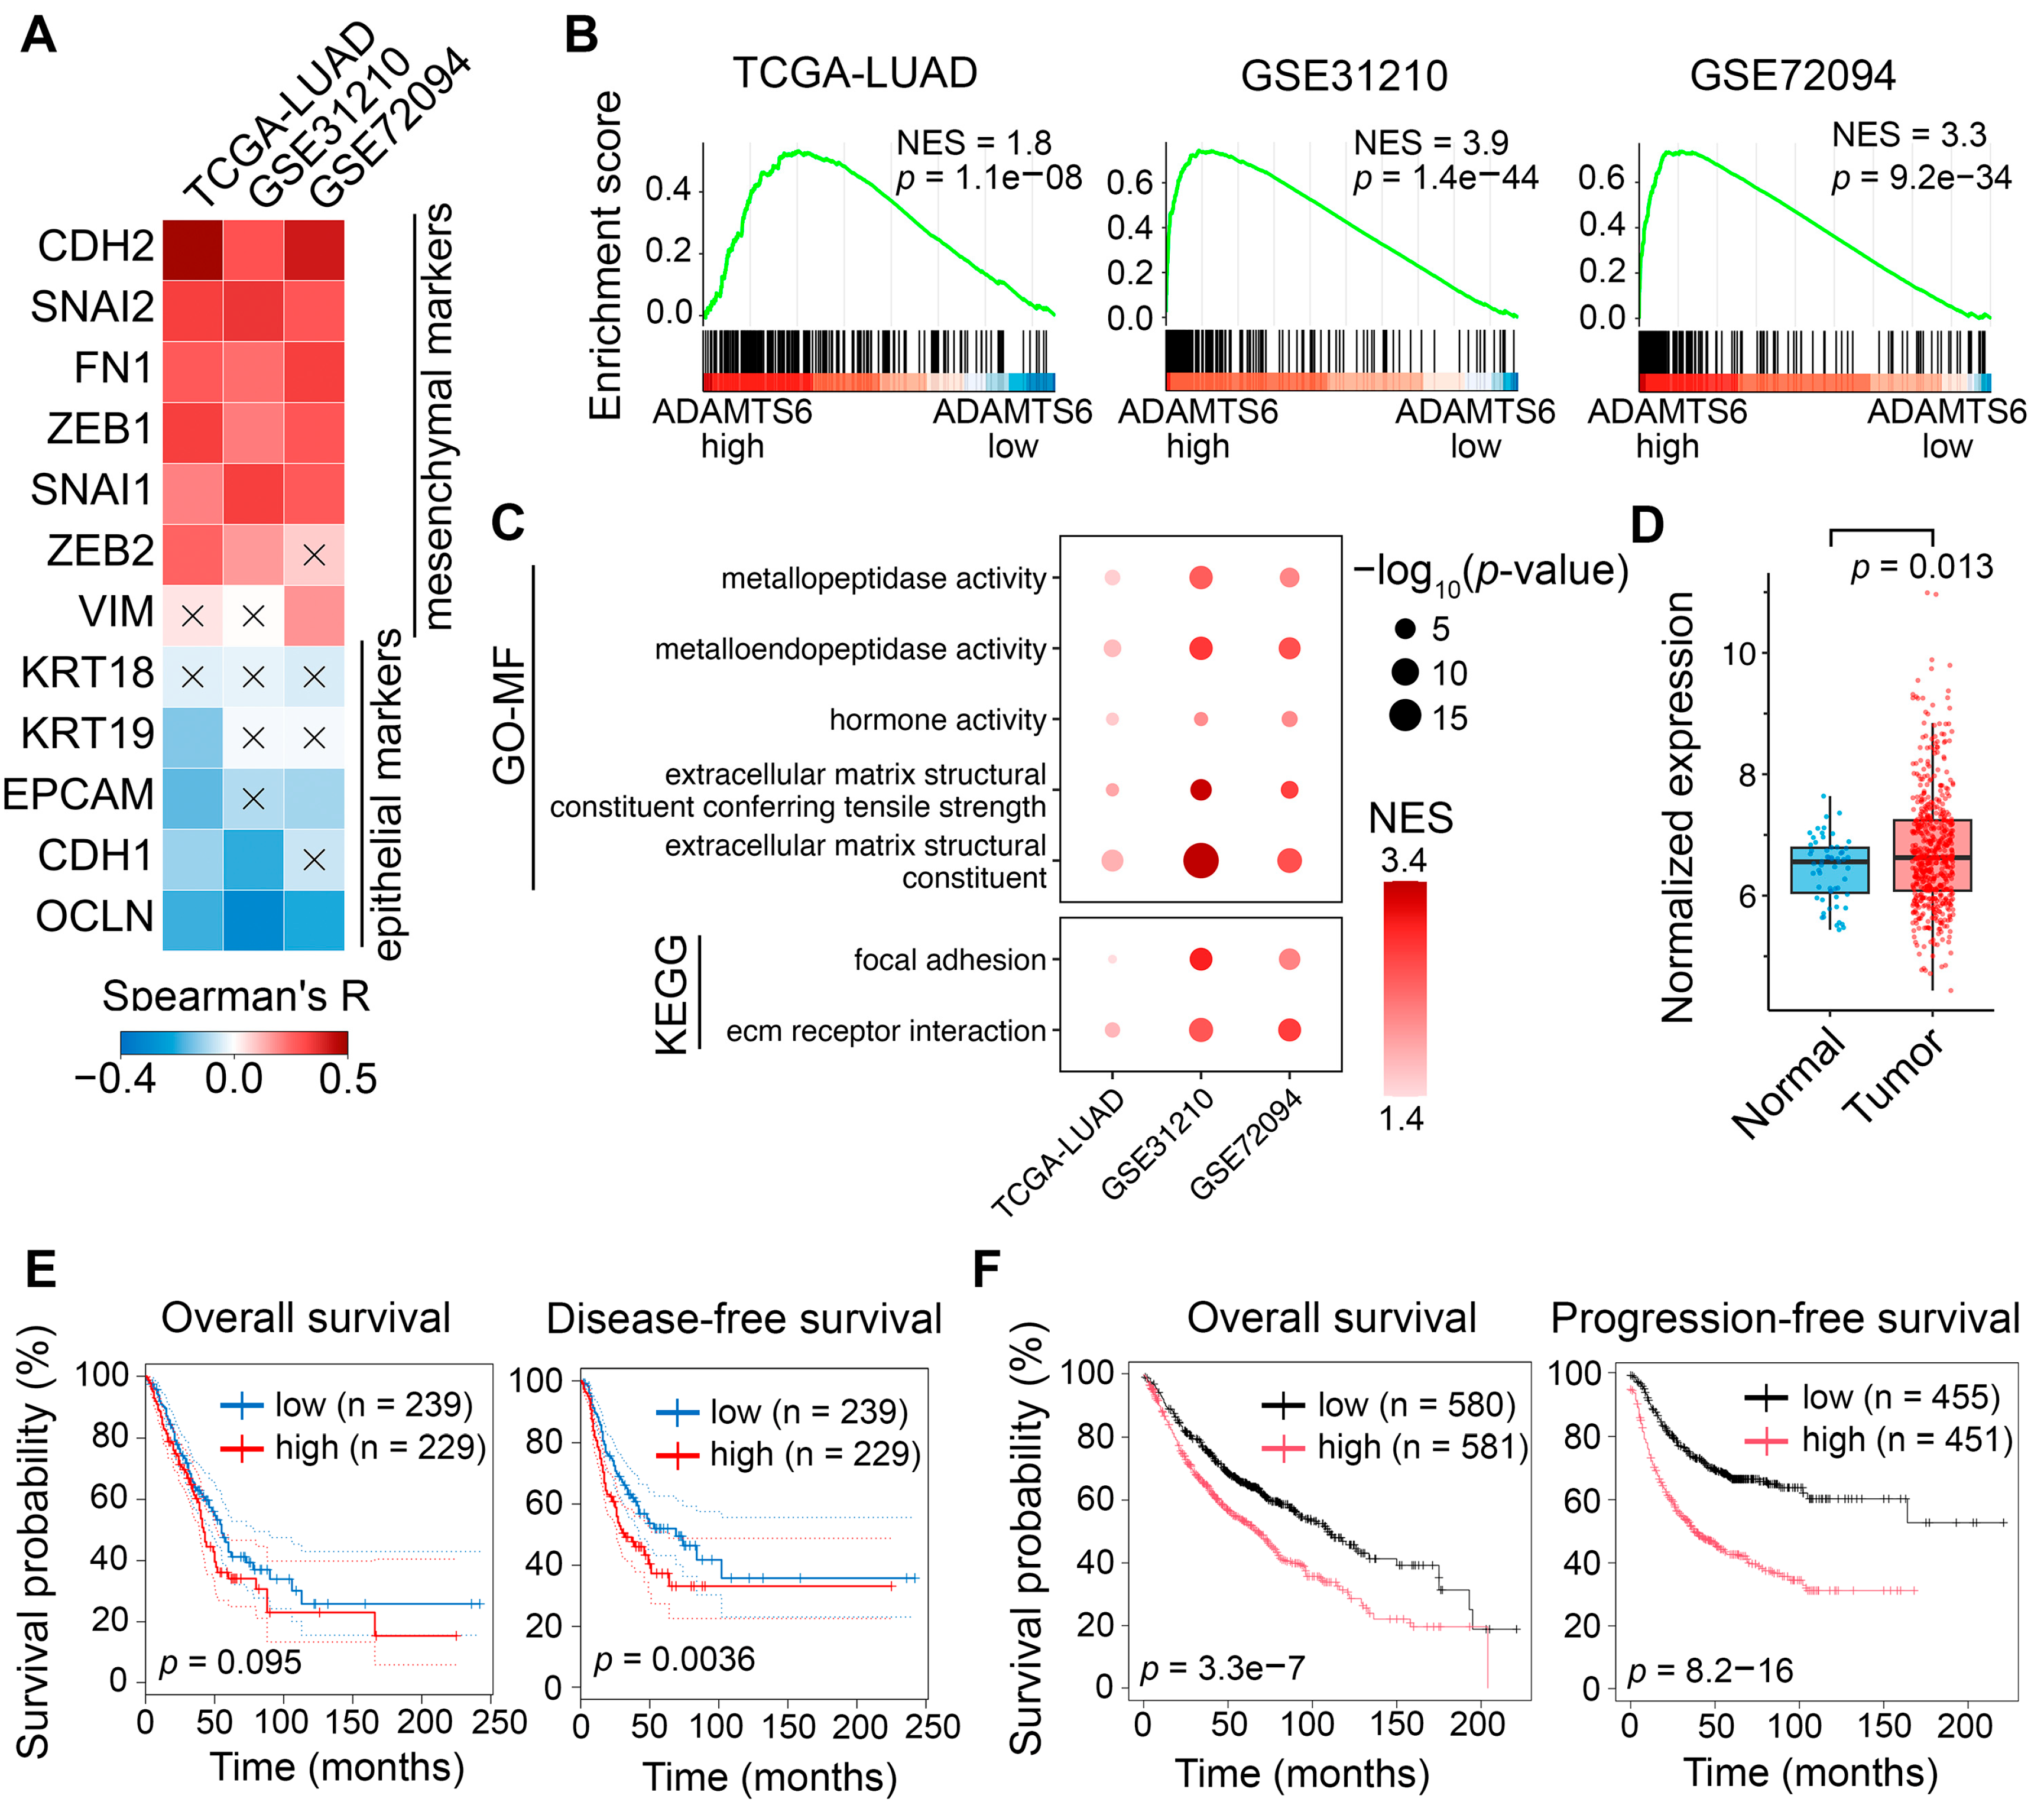
Disclaimer/Publisher’s Note: The statements, opinions and data contained in all publications are solely those of the individual author(s) and contributor(s) and not of MDPI and/or the editor(s). MDPI and/or the editor(s) disclaim responsibility for any injury to people or property resulting from any ideas, methods, instructions or products referred to in the content. |
© 2025 by the authors. Licensee MDPI, Basel, Switzerland. This article is an open access article distributed under the terms and conditions of the Creative Commons Attribution (CC BY) license (http://creativecommons.org/licenses/by/4.0/).
Copyright: This open access article is published under a Creative Commons CC BY 4.0 license, which permit the free download, distribution, and reuse, provided that the author and preprint are cited in any reuse.


