
Submitted:
01 December 2025
Posted:
05 December 2025
You are already at the latest version
Abstract
Cherry tomatoes are highly appreciated for their nutritional value, but remain highly perishable due to rapid respiration and senescence. This study evaluated the combined effect of plasma-activated water (PAW), a sodium caseinate-based edible coating, and antioxidant active packaging on the quality evolution of minimally processed (MP) cherry tomatoes stored at 1 °C, 4 °C, and 8 °C for 15 days. Samples subjected to the full treatment (PAW wash + coating + active packaging) are hereafter referred to as prototype samples, while untreated fruits served as controls. Physical, chemical, nutritional, and microbiological parameters were monitored and modelled using pseudo-zero- and first-order kinetics, with temperature dependence described through the Arrhenius equation. The combined treatment significantly reduced the degradation rates of pH, titratable acidity, total polyphenols, and antioxidant capacity, with kinetic constants up to 45% lower than those of the controls. Prototype samples better preserved polyphenol content and antioxidant capacity across all temperatures, particularly at 1 °C and 4 °C. Microbial loads were generally comparable between groups. However, prototype samples exhibited lower Enterobacteriaceae at 8 °C and higher yeast/mould counts at 4 °C and 8 °C. Overall, the multi-hurdle approach effectively slowed quality deterioration without affecting visual appearance. The kinetic modelling framework enabled reliable shelf-life prediction, highlighting the potential of combining mild, sustainable technologies to enhance the quality and safety of MP cherry tomatoes.
Keywords:
plasma-activated water
; edible coating
; active packaging
; minimally processed vegetables
; multi-hurdle technology
; kinetic modelling
; shelf-life prediction
; polyphenols
; antioxidant capacity
; microbiome composition
1. Introduction
The demand for minimally processed fruits and vegetables (MPFVs) has grown steadily in recent years due to their convenience, nutritional value, and reduced environmental impact [1] . In 2024, the global MPFV market reached USD 377.3 billion and is projected to nearly double by 2034, reflecting increasing consumer interest in fresh-like, ready-to-eat products [2]. Cherry tomatoes (Solanum lycopersicum var. cerasiforme) represent a rapidly expanding segment within this category, appreciated for their sensory qualities and high contents of ascorbic acid, lycopene, and phenolic compounds, which contribute to antioxidant, hypoglycemic, and hypolipidemic activity [3,4]. However, despite their nutritional benefits, cherry tomatoes are highly perishable due to their elevated respiration rate, soft texture, and susceptibility to microbial spoilage, resulting in short shelf-life and significant postharvest losses.
To mitigate quality degradation, several mild preservation strategies have been proposed. Modified atmosphere packaging (MAP), edible coatings, and bio-based active packaging have been shown to reduce respiration, limit water loss, and preserve firmness and nutritional value of fresh-cut produce [5]. Nonetheless, the effectiveness of these technologies is often limited when used individually, particularly for high-moisture, rapidly respiring commodities. Plasma-activated water (PAW) has recently emerged as an eco-friendly sanitation alternative, generating reactive species capable of reducing microbial loads without leaving chemical residues [2,6,7]. Its efficacy has been demonstrated on strawberries [8], fennel [9], fresh-cut apples [10,11], and leafy greens [7], where PAW improved microbial safety and mitigated enzymatic and textural degradation.
Edible coatings also represent a promising approach for MPFVs, functioning as semi-permeable barriers that modulate gas exchange, reduce transpiration, and help maintain firmness and nutritional attributes. Likewise, active packaging systems incorporating antioxidant compounds can scavenge reactive species and limit oxidative damage during storage. Recent studies have explored the integration of coating materials with antioxidant-enriched films to enhance their preservative effect while reducing the environmental footprint of packaging. However, the interactions among these technologies are complex, and their potential synergistic effects remain largely unexplored.
Previous research has investigated the use of PAW combined with coatings or bioactive packaging individually, highlighting improvements in colour retention, firmness, and polyphenol preservation in several fresh-cut products. Nevertheless, despite the promising results, no study to date has evaluated the combined application of PAW, edible coatings, and antioxidant active packaging on minimally processed (MP) cherry tomatoes [5,6,12]. Understanding the interaction of these mild technologies is critical, as multi-hurdle approaches may provide enhanced protection against quality degradation while maintaining the fresh-like characteristics demanded by consumers.
Another majo[10,11]r gap in the literature concerns the modelling of quality decay under combined mild technologies. Kinetic modelling is a powerful tool for describing the evolution of biochemical and physical attributes in fresh produce and for predicting shelf life under variable storage conditions. Pseudo-zero and pseudo-first-order reaction models, coupled with Arrhenius-type temperature dependence, have been successfully used to model changes in pH, titratable acidity, colour, firmness, and phenolic content in strawberries, tomatoes, apples, and mushrooms (ADD bibliography) . However, their application to MP cherry tomatoes preserved through integrated PAW–coating–active packaging systems has not yet been examined. Such models can support rapid shelf-life prediction and provide valuable information for product optimisation, cold-chain management, and industrial implementation.
Therefore, the aim of this study was to evaluate the combined effect of PAW, a sodium caseinate–based edible coating, and antioxidant active packaging on the physical, chemical, nutritional, and microbiological quality of MP cherry tomatoes stored at 1 °C, 4 °C, and 8 °C for 15 days. Quality parameters were analysed through kinetic modelling using pseudo-zero and first-order reactions, while the influence of temperature on degradation rates was described using the Arrhenius equation. This work provides new insights into the synergistic potential of mild, sustainable preservation technologies and establishes a kinetic framework for predicting the shelf life of minimally processed cherry tomatoes.
2. Materials and Methods
2.1. Materials
For the preparation of edible coating, sodium caseinate from bovine milk, propyl gallate, glycerol, span 80, sodium carbonate, tween 80, riboflavin, guar gum, methanol, sodium hydroxide, DPPH, and Folin-Ciocalteau reagents were purchased from Sigma-Aldrich (Milan, Italy), while the beeswax was obtained from Agraria Ughetto Apicoltura (Giaveno, Torino, Italy). Instituto Tecnológico del Embalaje (ITENE) gave packaging materials. Cherry tomatoes (Solanum lycopersicum var. cerasiforme) were bought at a local supermarket in Portici (Naples, Italy).
2.2. Methods
2.2.1. Preparation of Plasma-Activated Water
Plasma-activated water (PAW) was prepared following the protocol described by [13]. The resulting PAW showed a final pH of 1.79 ± 0.01. Immediately after preparation, the PAW was frozen and shipped from Germany to Italy under controlled temperature conditions. Prior to use, PAW was thawed at room temperature (25 °C) and its pH was measured to verify consistency with the original batch. No additional activation was performed before application.
2.2.2. Preparation of MP Cherry Tomatoes and Stored Condition
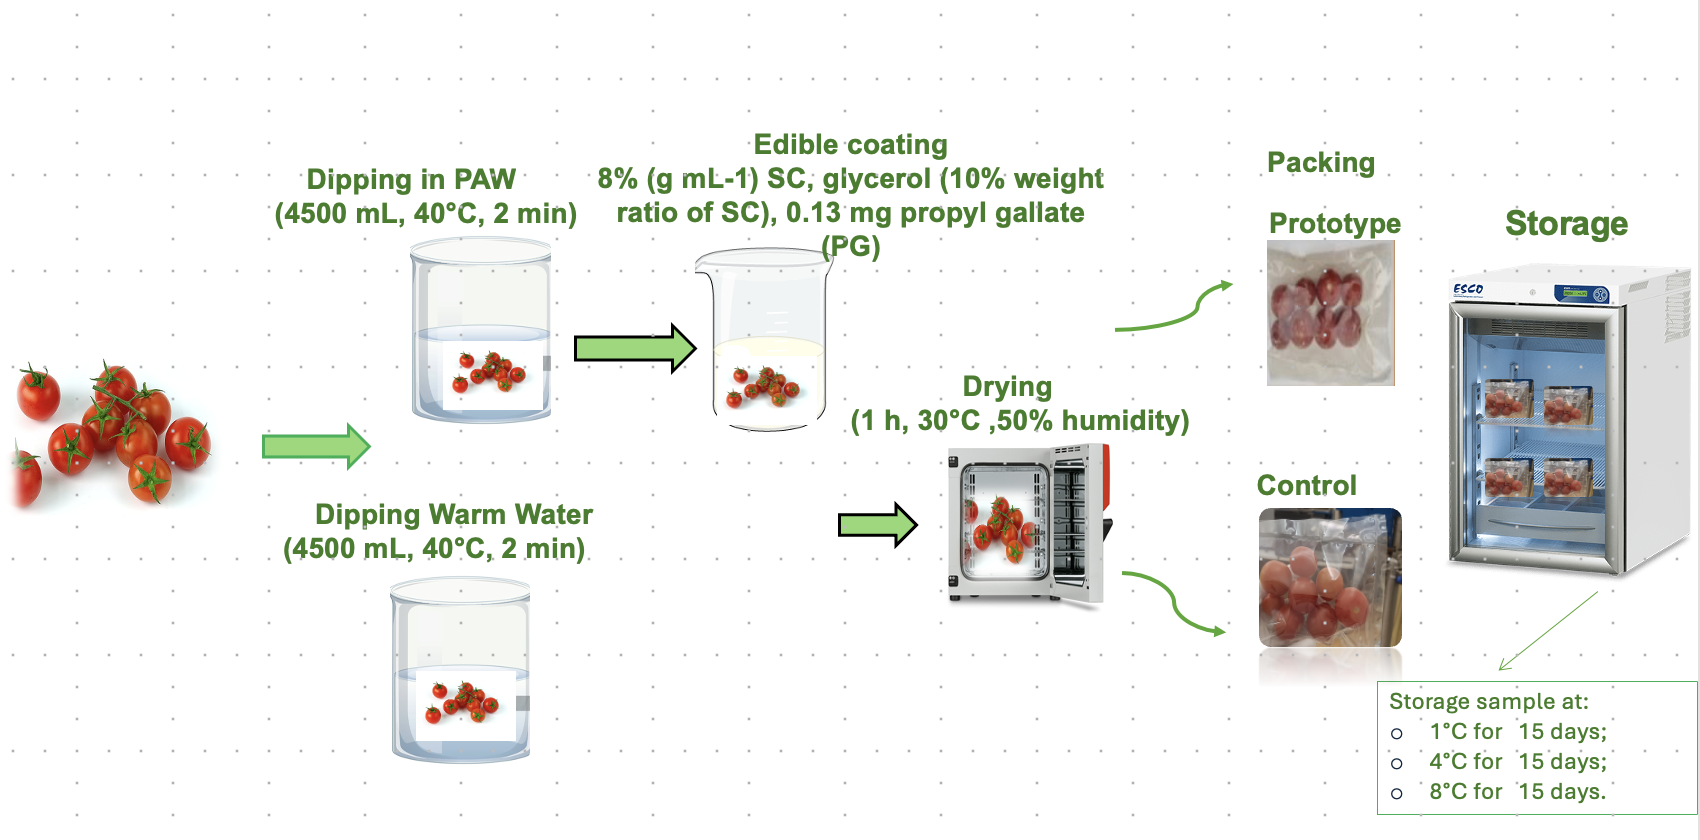
Cherry tomatoes were sorted to remove damaged fruits, rinsed, and divided into control and prototype groups. Two experimental groups were considered:
(i) Control samples: washed with warm tap water (4.5 L, 40 °C) for 2 min, drained, and dried at 30 °C and 50% relative humidity (RH) for 1 h.
(ii) Prototype samples: PAW-washed (4.5 L, 40 °C) for 2 min, coated with a sodium caseinate-based edible coating, drained and dried as control samples. Dried cherry tomatoes were coated using an active edible coating based on sodium caseinate, guar gum, beeswax, and propyl gallate, and prepared according to the procedure of Miele et al. [14]. Samples were dipped into the edible coating for 2 min and then quickly withdrawn, drained for 2 min, and dried for 1 h at 30 °C and 60% relative humidity.
Control samples were packed in PP 20 μm/PP 50 μm pouches, whereas prototype samples were packed in antioxidant PP 20 μm/PP + 10% orange peel extract 50 μm films. Packages contained 150–200 g of fruit and were stored at 1 °C, 4 °C, and 8 °C for 15 days. Sampling was performed at predetermined intervals.
2.2.3. Appearance and Colour Evaluation
To evaluate the visual appearance of MP cherry tomatoes, photos were taken at each storage time with and without packaging in Lightbox (lighting: LED strips, light intensity: 4500lux, colour temperature: 5000-5500 K). The colour analysis was performed using an electronic eye (visual analyzer VA400 IRIS, Alpha MOS, France) equipped with a CCD (charge-coupled device) camera (resolution 2592 ×1944 pixels and 24 bits) [15] Raw images were processed on an RGB scale and converted to the CIE L* a* b* scale using Alphasoft software (version 16.0). The L*, a*, and b* were measured in the different parts of the fennel sample, and the total colour change (TCC) was calculated[16].
2.2.4. Physicochemical Analysis
MP cherry tomatoes were homogenised with a blender and filtered, and the pH of the tomato juice was measured using a digital pH meter (DPH-2, Atago Co., Tokyo, Japan). Three measurements were obtained from each sample. Titratable acidity (TA) was determined by weighing 5 g of homogenised MP cherry tomatoes solutions in a flask. The mixture was titrated using NaOH solution (0.1 M) until the pH value of 8 was reached. The results are expressed as ml of titratable acidity. All assays were performed in triplicate for each treatment. The values at different storage times were normalised for the value of the samples at time 0, where the initial values of pH and TA were 4.12 ± 0.01 and 3.52 ± 0.01, respectively.
2.2.5. Total Polyphenol Content
The total phenolic content (TPC) was measured as reported by Di Giuseppe et al. [17]. 1 g of the homogenized sample was diluted with 10 ml of sodium carbonate (6%). The solution was filtered with a bench paper. 0.5 ml of filtrate was mixed with 2.5 ml of Folin-Ciocalteau reagent (10%) and 2 ml of sodium bicarbonate (6%). The sample was incubated in the dark for 1 h at 35 °C, then for 1 hour at 6 °C. The absorbance of the incubated sample was measured at 760 nm against a blank (2.5 mL of Folin-Ciocalteau reagent and 2.5 mL of sodium bicarbonate), using a spectrophotometer (UV-VIS (UV-550 Jasco, Japan). The TPC was expressed as mg gallic acid equivalent per g of dry weight (mg GAE eq g-1dw), using a calibration curve in the range 0-8 mg mL-1. The results, at each storage time, were normalised to the initial TPC value (1.9 ± 0.05 mg GAE eq g-1dw).
2.2.6. Antioxidant Capacity
0.5 g of the homogenised sample was added to 20 ml of pure methanol. The sample was held in an ultrasound bath for 30 min, then it was centrifuged at 10,000 rpm for 10 min at 4 °C. 100 μL of filtered supernatant was added to 3.9 mL of DDPH reagent solution (0.1 mM). The obtained solution was incubated in the dark for 30 min at room temperature. Finally, the absorbance at 517 nm was measured against pure methanol, using a UV–VIS spectrophotometer (UV-550 Jasco, Japan). The antioxidant capacity (AOC) was quantified as mg of Trolox equivalents (TROLOX eq g-1 dw), using a Trolox standard curve (0–625 mg mL-1). The AOC determined at each storage time was normalised for the initial value (16.85 ± 2.05 mg TROLOX eq g-1 dw).
2.2.7. Microbiological and Metagenomic Analyses
Samples were serially decimal diluted and aliquoted in plates of suitable media for each microbial group: plates of Plate Count Agar (PCA) for the enumeration of mesophilic bacteria incubated at 30 °C for 3 days; plates of Violet Red Bile Glucose agar (VRBGA) incubated at 37 °C for 48 h to count Enterobacteriaceae; and plates of Dichloran Rose-Bengal Chloramphenicol agar (DRBC) incubated at 28 °C for 4 days to count yeasts and moulds.
For metagenomics analysis, the microbial DNA was extracted from the prototype and control samples were stored at 4 °C and 8 °C at the end of the experiment. All the samples were analysed in triplicate. Briefly, samples were weighted and suspended in a 5:1 ratio in Phosphate Buffered Saline (PBS). Microorganisms were detached from the surface of tomatoes without breaking the matrix to avoid the release of plant cells. One hundred mL of supernatant was centrifuged at 6,500 x g for 15 min in order to precipitate the microbial cells. DNA extraction from the biomass was performed as previously described [18]. DNA concentration was estimated using the Qubit dsDNA HS assay kit (Thermo Fisher Scientific, Waltham, Massachusetts, US), then Whole Metagenome Shotgun Sequencing was performed with an Illumina HiSeq 4000 instrument (Illumina, San Diego, California, US), following the manufacturer’s procedure, leading to 2x150 bp raw reads.
The species-level profiles were estimated through MetaPhlAn (version 4.0.6; 10.1038/s41587-023-01688-w) using default settings. Raw reads were assembled into contigs using MegaHIT (version 1.3.1, 10.1093/bioinformatics/btv033) with default options, and antimicrobial resistance (AMR) genes were predicted from contigs through abricate (version 1.0.1; https://github.com/tseemann/abricate) relying on the CARD (10.1093/nar/gkw1004), Resfinder (10.1093/jac/dks261) and ARG-ANNOT (10.1128/AAC.01310-13) databases, filtering out all the alignments with percent identity and coverage below 80%. Read per Kilobase per Million Mapped Reads (RPKM) abundance of each AMR gene was calculated as previously described by .
2.2.8. kinetic Modelling
Changes in pH, TA, TPC, and AOC were modelled using pseudo-zero (eq. 1) and first-order kinetics (eq.2) [19]:
where and represents the initial and actual values of the quality parameters, k is the quality parameter decay rate constant [day- 1], and t is the time [day].
The Arrhenius model was used to describe the temperature-dependent decay rate constant:
where kref is the reaction rate at reference temperature (Tref =277.45K), A0 is the frequency factor (or pre-exponential factor), Ea is the activation energy, and R is the universal gas constant (8.314 J mol-1 K-1); T is the temperature (K).
2.2.9. Statistical Analysis
Data were analysed using SPSS 25.0 (SPSS Inc., Chicago, IL, USA). ANOVA assessed the effects of treatment, storage temperature, and time. Means were compared using Duncan’s post hoc test (p < 0.05). Independent-sample t-tests assessed treatment effects. Kinetic parameters were fitted using regression analysis in Microsoft Excel (version 2409). Metagenomic data were analysed in R version 4.4.1 (https://www.r-project.org). The package ‘ggplot2’ produced the species-level bar chart, whereas the function ‘pheatmap’ from the so-called package provided the hierarchical clustering of the AMR gene families.
3. Results
3.1. Appearance and Colour Parameters
As shown in Figure 1, at all temperatures, the treatments did not affect the visual appearance of MP cherry tomatoes up to 15 days of storage. Both control and prototype groups maintained similar levels of colour intensity and uniformity, with no notable surface defects or wrinkling observed over time. These results indicate that the implemented technologies did not compromise the visual appearance of the MP cherry tomatoes.
Colour is a crucial choice driver, which attracts consumers’ attention and prompts their choice and opinion to buy any fruit or vegetable [20], and enhances acceptance and appeal towards consumers [21]. The colour parameters of control and prototype groups, at each storage temperature and time, are shown in Table 1. ANOVA shows that the time has a significant effect on L*, a*, b*, and DE (p < 0.05), whereas the treatment had a significant impact on most of the colour parameters, especially a*, b*, and ΔE (p < 0.05 to p < 0.001). The effect of storage temperature was significant on a*, b*, ΔE (p < 0.001), but the parameter L* was unaffected by temperature. The interaction effect between time and temperature was statistically significant for all the parameters (p < 0.001). For all samples and at all temperatures, the L* value decreased from the initial value of 42 ± 2 to an average value of 36 ± 2 after two days of storage and then remained constant until 15 days of storage. At 1 °C, a* value for all samples increased from 14 ± 3 to 20 ± 3 after 9 days but then decreased again to 14 ± 3 by day 15. The same trend was observed for b*, whose value increased from 14 ± 3 to 19 ± 2 by day 2, then remained constant for up to 9 days and again decreased to 14 ± 2 on day 15.
Thus, with a slight variation over time, it is not possible to highlight a clear trend of a* and b* as a function of time. At 4 °C and 8 °C, a* value increased after two days up to a value of around 20 ± 1, then remained constant for up to 15 days. A similar trend was observed for b*, whose value increased during time up to 20 ± 1, with significant differences since day 2. For a* parameter, although the significant effect of temperature, the results did not highlight a clear dependence (the value of a* at 1 °C and 8 °C were not statistically different, whereas, at 4 °C, it assumed an average higher value). At all the temperatures studied and for all samples, the E increased from 0 to around 10 after 15 days of storage, with a significant difference since day 2.
Thus, the treatment of PAW in combination with sodium caseinate-based edible coating and antioxidant packaging did not have a significant impact on the colour of the MP cherry tomatoes during 15 days at 1 °C, 4 °C, and 8 °C. In a previous work, it was observed a significant effect of PAW and casein-based coating on the colour changes of cherry tomatoes, with a preservative impact over time [6]. Earlier findings reported that the different types of edible coating can delay the total colour changes in MPFV by minimizing the oxidation rate and ethylene production[22,23]. Thus, the different results obtained in this work could highlight a negative role of the propyl gallate added to the coating and of the active packaging on the colour parameters. Due to the slight changes in the colorimetric parameters, they were not considered as critical quality indices for the product’s shelf-life, and their kinetic modelling was not addressed.
3.2. Physiochemical Analysis
As a general trend, the pH of cherry tomatoes changes during storage, and a lower pH is associated with a slower respiration rate, meaning improved preservation condition[24]. Moreover, the pH of a fruit sample affects its taste and flavour during postharvest storage [25]. ANOVA showed that all the independent variables (treatment, time, and temperature) had a significant effect on the pH of the cherry tomatoes (p < 0.001), interaction effect among factors was also significant (p < 0.001). The initial pH of the cherry tomatoes was about 4.12 ± 0.01; during storage, the pH of the control group increased by 8%, 11%, and 13% whereas that of the prototype group increased by 5%, 6%, and 11%, respectively, at 1 °C, 4 °C, and 8 °C. Figure 2 shows the normalised pH data respect to the value of control sample at time zero as a function of storage time, for both the control and prototype groups, at 1 °C, 4 °C, and 8 °C.
These results indicate that microbial and enzymatic activities, which increase with temperature, lead to greater pH changes[26]. Furthermore, the combination of PAW, edible coating, and antioxidant packaging effectively mitigates the metabolic process, altering the pH during storage. Similar results have been reported for cherry tomatoes preserved with a chitosan nano-biopolymer/citrus paradisi peel oil system [27] and with a pectin edible coating [28]. Both studies demonstrated that the pH of coated tomato samples increases less intensively than the control ones, the coating having the effect of slowing down the rate of respiration and thus the consumption of organic acids.
The change of pH during storage time follows a pseudo-zero-order kinetic model (Figure 2, Table 2). The combination of the preservative technologies implemented significantly (p < 0.001) reduces the kinetic constant of pH change by 50% at 1 °C, by 56% at 4 °C, and by 18% at 8 °C, compared to the control group.
The Arrhenius equation well predicted the effect of temperature on the kinetic constants (R2>0.97) of both groups. As given in Table 3, the treatment has a significant impact on the activation energy [19] (p < 0.001). The Ea for the control and prototype groups was 51 ± 2 kJ mol-1 and 93 ± 3 kJ mol-1, respectively, highlighting that the prototype group was more sensitive to temperature variation than the control group during storage. Our findings were aligned with previous studies where the pseudo-zero-order kinetic model effectively described changes in pH of cherry tomatoes treated with high-voltage electrostatic fields [29]. Moreover, the change in pH of strawberries stored at different temperatures was also described with a pseudo-zero-order kinetic model [30].
Titratable acidity (TA) plays an important role in determining fruit flavour, taste, and sensory qualities [31,32]. The normalised value of TA during storage, for both groups of MP cherry tomatoes at all the temperatures, is reported in Figure 3. ANOVA showed that the time, the treatment, and the storage temperature have a significant effect on TA (p < 0.001). The interaction effect was also significant, a part of the interaction between temperature and treatment. 3. At 1 °C, 4 °C, and 8 °C, the control group showed a decrease of 20%, 22%, 28%. In contrast, the prototype group exhibited a reduction of 11%, 13% and 20% over the 15 days, respectively. TA values steadily dropped during storage because of decreasing organic acid contents, primarily citric acid, in contrast to pH, which rose over the postharvest storage period [33]. The prototype group showed a significantly higher TA than the control one (Figure 3), indicating that combined preservative technologies, mainly the coating and the antioxidant packaging, effectively slowed down metabolic activities and organic acid oxidation during postharvest [34].
A similar response of the TA was reported for the guava [35], tomatoes [36], and cherry tomatoes [37] treated with gum arabic, coating of bitter almond gum-fish gelatin conjugates, and chitosan/casein containing Origanum vulgare L. essential oil, respectively.
TA changed according to a pseudo-zero-order kinetic model (Figure 3, Table 2). The prototype group had a lower kinetic constant value than the control group; the reduction was of 38%, at 1 and 4 °C, and of 32%, at 8 °C, compared to the control group. As the temperatures increased from 1 °C to 8 °C, the k-values significantly (p < 0.05) increased for both groups.
The effect of the temperature on the kinetic constant has been predicted using the Arrhenius equation. As reported in Table 3, the Ea for the control group was 35 ± 3 kJ mol-1, which was significantly (p < 0.05) lower than the prototype group (46 ± 1 kJ mol-1). The results are consistent with the previous studies, where the kinetics of TA of different MPFV, such as strawberries, Shiitake mushrooms, and Kiwifruit, were also well described by the pseudo-zero-order kinetic model [30,32,38].
3.3. Total Polyphenol Content
The normalised values of TPC as a function of the storage time, at different temperatures, are illustrated in Figure 4. The TPC showed a significant decreasing trend in both control and prototype groups, achieving the control group a reduction of 30%, 32% and 39% and the prototype group a reduction of 16%, 25% and 33% over 15 days at 1 °C, 4 °C, and 8 °C, respectively. ANOVA showed that all the independent variables (time, treatment, and temperature) had a significant effect on the TPC of the MP cherry tomatoes (p < 0.001), significant was also the interaction effect among factors (p < 0.001). Combined preservative technologies were evidently successful in slowing down the enzymatic and chemical degradation of the polyphenols. It was already proven that treatment with PAW, alone or combined with the use of antimicrobial proteins, prevents damage to the cell structure of cherry tomatoes, thus delaying the degradation of polyphenols [39]. The results of this research are consistent with earlier studies by[40], which discussed the preservation of polyphenol content in tomatoes using coatings.
The TPC degradation during storage followed a pseudo-zero-order kinetic model (Figure 4, Table 2). The kinetic constant of the prototype group, compared to the control one, was reduced by 40%, 30%, and 26%, over 15 days at 1 °C, 4 °C, and 8 °C, respectively (p < 0.01). The k-values of TPC were significantly lower at 1 °C compared to samples stored at 4 °C and 8 °C (p < 0.05).
To assess the effect of temperature, Arrhenius equation parameters have been estimated. As shown in Table 3, the treatment had a significant impact on the Ea (p < 0.05). The control group had a lower Ea value (19 ± 3 kJ mol-1) than the prototype group (38 ± 6 kJ mol-1), pointing out that when the combined technologies were used, the energy barrier of polyphenol degradation was higher, but the rate changed more quickly with temperature. Similar findings for the total polyphenol content of tomatoes are reported in the literature; the combined effects of ultraviolet-C irradiation and ultrasound on TPC kinetics were studied. The TPC was best described by a first-order kinetic model, with the treated group showing activation energy (Ea = 135 kJ mol-1), indicating the sensitivity of TPC to temperature changes. Muley et al. [30] investigated the impact of storage temperature (5 °C, 10 °C, 20 °C, 26 °C, and 32 °C) on the freshly harvested strawberries and assessed the physical and biochemical changes during storage, and found that the TPC data were also best fitted with the pseudo-zero-order kinetic model with Ea = 31 kJ mol-1.
3.3. Antioxidant Capacity
The trend of antioxidant capacity of MP cherry tomatoes is illustrated in Figure 5. The normalised values of AOC of the control and prototype groups decreased significantly (p < 0.05) from day 0 to day 15 of the storage period at all temperatures investigated. The control group presented a drop of 10%, 12%, and 15%, while the prototype a reduction of 8%, 10%, and 13%, from day 0 to day 15 at 1 °C, 4 °C, and 8 °C, respectively underwent a substantial depletion during storage time from day 0 to day 15, retaining 18% of antioxidant capacity due to combined technology. ANOVA showed that all the independent variables (time, treatment and temperature) had a significant effect on the AOC of the MP cherry tomatoes (p < 0.001) and a significant interaction effect among factors has been found (p < 0.001).
The general trend indicated that the prototype group consistently maintains a higher antioxidant capacity compared to the control group across all temperatures. These results can be attributed to the combined technologies, providing protective effects against oxidative degradation, microbial activity, and enzymatic breakdown, thereby slowing the decline in antioxidant capacity over time. Higher storage temperatures (8 °C) are associated with a faster decrease in antioxidant capacity, likely due to increased rates of oxidative and enzymatic degradation. According to literature on the impact of coatings on tomato fruit’s antioxidant capacity, the application of coatings slows down the process of the fruit’s antioxidant capacity being reduced throughout the post-harvest period. It also shows that fresh-cut tomatoes stored at 10 °C exhibited higher antioxidants than those stored at 15 °C and 20 °C.
Antioxidant capacity decreased during storage time for all samples following a pseudo-first-order kinetic model, with the rate constant (k) increasing with temperature for both groups (Figure 5, Table 2). Furthermore, the k-values of AOC were significantly (p < 0.001) different for both control and prototype groups, and the k-values of the prototype groups were lower than the control groups across all the temperatures (Table 2). The k-values of the prototype group, compared to the control group, decreased by 52%, 44% and 39%, respectively, at 1 °C, 4 °C, and 8 °C, with a positive effect on the preservation of the AOC.
The dependence of the k-value by temperature was described by the Arrhenius equation; the treatment had a highly significant effect on the Ea (p < 0.001), with the control group having a lower Ea (24 ± 2 kJ mol-1) than the prototype group (46 ± 1 kJ mol-1). The results of our study align with previous findings, demonstrating the effectiveness of active coatings in preserving antioxidant capacity and following a pseudo-first-order kinetic model for fennel at different storage temperatures, and the Ea of the antioxidant loss was reduced by using a coating preservation treatment [15].
3.3. Microbiological and Metagenomic Analyses
Microbial counts of control and prototype groups during storage at 1 °C, 4 °C, and 8 °C up to 15 days are shown in Table 4, Table 5 and Table 6. No differences in the total aerobic microbial loads were found between the control and prototype groups at the end of storage at all storage temperatures. However, values at 4 and 1 °C were significantly lower than those at 8 °C (p < 0.05). In samples stored at 8 °C, we observed lower Enterobacteriaceae loads in the prototype vs control group from 9 days of storage onwards, suggesting that the treatment might effectively limit the overgrowth of this taxonomic group during the shelf-life of tomatoes. On the contrary, yeasts/moulds were higher in prototype groups stored at 4 °C and 8 °C, while they were always below the detection limit at 1 °C. Interestingly, PAW treatment led to a change in the microbiome taxonomic composition at baseline, with a decrease in the abundance of several Enterobacteriaceae species (Serratia liquefaciens, Raoultella ornithinolytica), while Lactobacillus spp. prevailed in the prototype (Figure 6). The difference observed at baseline was reflected in different microbial dynamics during the storage (Figure 6). In particular, we highlighted a drop in the abundance of Acinetobacter johnsonii, which shifted from an average of 73.9 ± 3.6% at baseline to 2.97 ± 2.75% after 15 days of storage at 8 °C. This species has been frequently isolated from fruits and vegetables [49,50] and has been recently advised as a reservoir of AMR genes potentially acquired through horizontal gene transfer events [41].
Furthermore, after 15 days of storage (Figure 7), a drop in the abundance of genes involved in resistance to different antibiotic classes was observed in prototype samples compared with control samples, suggesting that the treatment might limit the proliferation of bacterial species encoding genes linked with resistance to antimicrobial compounds, regardless of the storage temperature (Figure 7).
5. Conclusions
This study investigated the impact of combined treatments, plasma-activated water (PAW), edible coating, and active antioxidant packaging, on the appearance, pH value, titratable acidity, colour, total polyphenol content, antioxidant capacity, and microbiological properties of MP cherry tomatoes stored at 1 °C, 4 °C, and 8 °C. The results demonstrated that the combined treatment improved the appearance, pH value, and titratable acidity, strengthened antioxidant capacity, and slowed the loss of beneficial polyphenol content. However, it had a negative effect on colour parameters as compared to the control group. Quality parameters were best described by pseudo-zero or pseudo-first-order kinetic models, and the temperature dependence of the reaction rate constant was well explained by the Arrhenius equation. The combined treatment also led to a change in the microbiome taxonomic composition, particularly limiting the proliferation of bacterial species linked to antimicrobial resistance, regardless of the storage temperature.
Overall, the physical, chemical, nutritional, and microbiological properties of minimally processed cherry tomatoes were influenced by both the treatments and storage temperatures. Lower temperatures (1 °C and 4 °C) helped to better preserve the quality of MP cherry tomatoes. Our findings also demonstrated the feasibility of predicting the shelf-life and quality changes of MP cherry tomatoes at different storage temperatures using pseudo-zero and first-order kinetics in combination with the Arrhenius equation. Moreover, these findings would help consumers to determine the edible time for MP cherry tomatoes and the distributors to think about stock and sales strategies. Future studies should explore the applicability of these models to other fruits and vegetables under varying storage conditions.
Author Contributions
Syed Mudabbar Hussain Shah: Writing – review & editing, Writing – original draft, Validation, Methodology, Investigation, Data curation. Stefania Volpe: Writing – review & editing, Methodology, Investigation. Francesca Colonna: Methodology, Investigation, Data curation. Vincenzo Valentino: Investigation, writing-original draft; Francesca De Filippis: Methodology, Writing – review & editing. Silvana Cavella: Supervision, Writing – review & editing, Elena Torrieri: Resources, Conceptualization, Writing – review & editing, Supervision, Funding acquisition.
Funding
This study was supported by the SHEALTHY Project, which received funding from the European Commission, Horizon 2020 Research and Innovation Program under grant number 817936. The Ph.D. fellowship of Syed Mudabbar Hussain Shah is supported by PON Ricerca e Innovazione 2014- 2020 Action IV.4 “Doctorates and research contracts on topics of innovation”.
Conflicts of Interest
The authors declare no conflicts of interest.
References
- L. Ete, Anubha, and S. Jayarajan, “Recent advancement in minimal processing of fruits and vegetables: A Review,” in BIO Web of Conferences, EDP Sciences, May 2024. [CrossRef]
- J. H. Cheng, L. He, D. W. Sun, Y. Pan, and J. Ma, “Inhibition of cell wall pectin metabolism by plasma activated water (PAW) to maintain firmness and quality of postharvest blueberry,” Plant Physiology and Biochemistry, vol. 201, Aug. 2023. [CrossRef]
- J. Yin et al., “Analysis of the nutritional composition, biological activities, and phenolic metabolic bioactive module of cherry tomatoes,” LWT, vol. 209, Oct. 2024. [CrossRef]
- Z. Yang, W. Li, D. Li, and A. S. C. Chan, “Evaluation of Nutritional Compositions, Bioactive Components, and Antioxidant Activity of Three Cherry Tomato Varieties,” Agronomy, vol. 13, no. 3, Mar. 2023. [CrossRef]
- C. Giacondino, A. De Bruno, D. Puntorieri, M. Pizzimenti, and A. Piscopo, “Impact of Antioxidant-Enriched Edible Gel Coatings and Bio-Based Packaging on Cherry Tomato Preservation,” Gels, vol. 10, no. 9, Sep. 2024. [CrossRef]
- S. Volpe, M. Giello, S. Cavella, P. Masi, F. Villani, and E. Torrieri, “Effect of Plasma Activated Water and Sodium Caseinate Based Coating on the Quality of Minimally Processed Cherry Tomatoes during Storage,” Chem Eng Trans, vol. 102, pp. 205–210, 2023. [CrossRef]
- B. Gülenç, E. Özdemir, P. Başaran, S. Kartal, and T. Akan, “Impact on microbiology and product quality of plasma-activated water treatment on fresh green leafy vegetables,” Nov. 01, 2024, Elsevier B.V. [CrossRef]
- D. Ziuzina, S. Patil, P. J. Cullen, K. M. Keener, and P. Bourke, “Atmospheric cold plasma inactivation of Escherichia coli, Salmonella enterica serovar Typhimurium and Listeria monocytogenes inoculated on fresh produce,” Food Microbiol, vol. 42, pp. 109–116, 2014. [CrossRef]
- S. M. H. Shah et al., “Effect of plasma-activated water and antioxidant packaging on the degradation kinetic of minimally processed fennel quality during storage,” Applied Food Research, vol. 5, no. 2, Dec. 2025. [CrossRef]
- C. Liu, C. Chen, A. Jiang, X. Sun, Q. Guan, and W. Hu, “Effects of plasma-activated water on microbial growth and storage quality of fresh-cut apple,” Innovative Food Science and Emerging Technologies, vol. 59, Jan. 2020. [CrossRef]
- S. Perinban, V. Orsat, and V. Raghavan, “Influence of plasma activated water treatment on enzyme activity and quality of fresh-cut apples,” Food Chem, vol. 393, Nov. 2022. [CrossRef]
- M. Valentino, G. Sequino, F. De Filippis, R. Di Monaco, S. Cavella, and E. Torrieri, “The effect of edible coating based on sodium caseinate and propyl gallate on the shelf life of minimally processed fennel during storage,” Applied Food Research, vol. 4, no. 2, Dec. 2024. [CrossRef]
- L. R. Ribeiro, A. A. L. Tribst, and O. K. Schlüter, “Impact of plasma activated water (PAW) at different temperatures on Alicyclobacillus acidoterrestris spores,” LWT, vol. 191, Jan. 2024. [CrossRef]
- N. A. Miele, S. Volpe, E. Torrieri, and S. Cavella, “Improving physical properties of sodium caseinate based coating with the optimal formulation: Effect on strawberries’ respiration and transpiration rates,” J Food Eng, vol. 331, Oct. 2022. [CrossRef]
- M. Valentino, S. Volpe, S. Cavella, P. Masi, and E. Torrieri, “Effect of biopolymer active coating on alteration kinetics of minimally processed fennel stored at different temperatures,” Food Packag Shelf Life, vol. 39, Nov. 2023. [CrossRef]
- S. Volpe, S. Cavella, and E. Torrieri, “Biopolymer coatings as alternative to modified atmosphere packaging for shelf life extension of minimally processed apples,” Coatings, vol. 9, no. 9, Sep. 2019. [CrossRef]
- F. A. Di Giuseppe, S. Volpe, P. Di Pierro, A. Sorrentino, S. Cavella, and E. Torrieri, “Kinetics of enzymatic browning of minimally processed iceberg salad,” Chem Eng Trans, vol. 75, pp. 493–498, 2019. [CrossRef]
- G. Sequino, V. Valentino, E. Torrieri, and F. De Filippis, “Specific Microbial Communities Are Selected in Minimally-Processed Fruit and Vegetables according to the Type of Product,” Foods, vol. 11, no. 14, Jul. 2022. [CrossRef]
- Y. Song et al., “Storage time assessment and shelf-life prediction models for postharvest Agaricus bisporus,” LWT, vol. 101, pp. 360–365, Mar. 2019. [CrossRef]
- S. Radman et al., “Vinegar-Preserved Sea Fennel: Chemistry, Color, Texture, Aroma, and Taste,” Foods, vol. 12, no. 20, Oct. 2023. [CrossRef]
- H. N. J. Schifferstein, T. Wehrle, and C. C. Carbon, “Consumer expectations for vegetables with typical and atypical colors: The case of carrots,” Food Qual Prefer, vol. 72, pp. 98–108, Mar. 2019. [CrossRef]
- C. E. V. de Oliveira et al., “Effects of chitosan from Cunninghamella elegans on virulence of post-harvest pathogenic fungi in table grapes (Vitis labrusca L.),” Int J Food Microbiol, vol. 171, pp. 54–61, Feb. 2014. [CrossRef]
- N. Kumar, N. Neeraj, N. Pratibha, and A. Trajkovska Petkoska, “Improved Shelf Life and Quality of Tomato (Solanum lycopersicum L.) by Using Chitosan-Pullulan Composite Edible Coating Enriched with Pomegranate Peel Extract,” ACS Food Science and Technology, vol. 1, no. 4, pp. 500–510, May 2021. [CrossRef]
- G. Alharaty and H. S. Ramaswamy, “The effect of sodium alginate-calcium chloride coating on the quality parameters and shelf life of strawberry cut fruits,” Journal of Composites Science, vol. 4, no. 3, 2020. [CrossRef]
- M. Al-Dairi, P. B. Pathare, and R. Al-Yahyai, “Chemical and nutritional quality changes of tomato during postharvest transportation and storage,” Journal of the Saudi Society of Agricultural Sciences, vol. 20, no. 6, pp. 401–408, Sep. 2021. [CrossRef]
- M. Tolasa, F. Gedamu, and K. Woldetsadik, “Impacts of harvesting stages and pre-storage treatments on shelf life and quality of tomato (Solanum lycopersicum L.),” Cogent Food Agric, vol. 7, no. 1, 2021. [CrossRef]
- R. Jahani, M. Behnamian, S. Dezhsetan, R. Karimirad, and E. Chamani, “Chitosan nano-biopolymer/Citrus paradisi peel oil delivery system enhanced shelf-life and postharvest quality of cherry tomato,” Int J Biol Macromol, vol. 225, pp. 1212–1223, Jan. 2023. [CrossRef]
- R. Pholsin et al., “Impact of pectin edible coating extracted from cacao shell powder on postharvest quality attributes of tomato (Lycopersicon esculentum Mill.) fruit during storage,” Food Control, vol. 155, Jan. 2024. [CrossRef]
- Y. Zhao, L. Li, S. Gao, S. Wang, X. Li, and X. Xiong, “Postharvest storage properties and quality kinetic models of cherry tomatoes treated by high-voltage electrostatic fields,” LWT, vol. 176, Feb. 2023. [CrossRef]
- B. Muley, P. Kedia, K. Pegu, S. B. Kausley, and B. Rai, “Analyzing the physical and biochemical changes in strawberries during storage at different temperatures and the development of kinetic models,” Journal of Food Measurement and Characterization, vol. 16, no. 1, pp. 222–247, Feb. 2022. [CrossRef]
- R. Ding, X. Dai, Z. Zhang, Y. Bi, and D. Prusky, “Composite Coating of Oleaster Gum Containing Cuminal Keeps Postharvest Quality of Cherry Tomatoes by Reducing Respiration and Potentiating Antioxidant System,” Foods, vol. 13, no. 10, May 2024. [CrossRef]
- Yi, A. Kan, H. Peng, N. Wang, and X. Sun, “Prediction of quality indicators of strawberries under hypobaric storage using kinetic modeling,” Journal of Food Measurement and Characterization, vol. 18, no. 2, pp. 1473–1482, Feb. 2024. [CrossRef]
- G. E. Anthon, M. Lestrange, and D. M. Barrett, “Changes in pH, acids, sugars and other quality parameters during extended vine holding of ripe processing tomatoes,” J Sci Food Agric, vol. 91, no. 7, pp. 1175–1181, May 2011. [CrossRef]
- S. Ali et al., “Tragacanth gum coating modulates oxidative stress and maintains quality of harvested apricot fruits,” Int J Biol Macromol, vol. 163, pp. 2439–2447, Nov. 2020. [CrossRef]
- R. Etemadipoor, A. Mirzaalian Dastjerdi, A. Ramezanian, and S. Ehteshami, “Ameliorative effect of gum arabic, oleic acid and/or cinnamon essential oil on chilling injury and quality loss of guava fruit,” Sci Hortic, vol. 266, May 2020. [CrossRef]
- S. Dehghani, E. Hosseini, and E. Rousta, “Shelf-life extension of tomato (Solanum lycopersicum L.) using an edible coating of bitter almond gum-fish gelatin conjugates,” Prog Org Coat, vol. 170, Sep. 2022. [CrossRef]
- N. Roshandel-hesari, M. Mokaber-Esfahani, A. Taleghani, and R. Akbari, “Investigation of physicochemical properties, antimicrobial and antioxidant activity of edible films based on chitosan/casein containing Origanum vulgare L. essential oil and its effect on quality maintenance of cherry tomato,” Food Chem, vol. 396, Dec. 2022. [CrossRef]
- W. Zhang, Z. Luo, A. Wang, X. Gu, and Z. Lv, “Kinetic models applied to quality change and shelf life prediction of kiwifruits,” LWT, vol. 138, Mar. 2021. [CrossRef]
- F. Zou et al., “New strategy for improving postharvest quality of cherry tomatoes: Synergy of plasma-activated water and Welsh onion leaf protein extracts,” Food Control, vol. 164, Oct. 2024. [CrossRef]
- J. E. Dávila-Aviña et al., “Effect of edible coatings on bioactive compounds and antioxidant capacity of tomatoes at different maturity stages,” J Food Sci Technol, vol. 51, no. 10, pp. 2706–2712, Oct. 2014. [CrossRef]
Figure 1.
Changes of appearance in control and prototype groups of cherry tomatoes during storage at different temperatures. Images of cherry tomatoes (control (green line) – prototype (red line) stored at 1 °C, 4 °C and 8 °C for 15 days.
Figure 1.
Changes of appearance in control and prototype groups of cherry tomatoes during storage at different temperatures. Images of cherry tomatoes (control (green line) – prototype (red line) stored at 1 °C, 4 °C and 8 °C for 15 days.
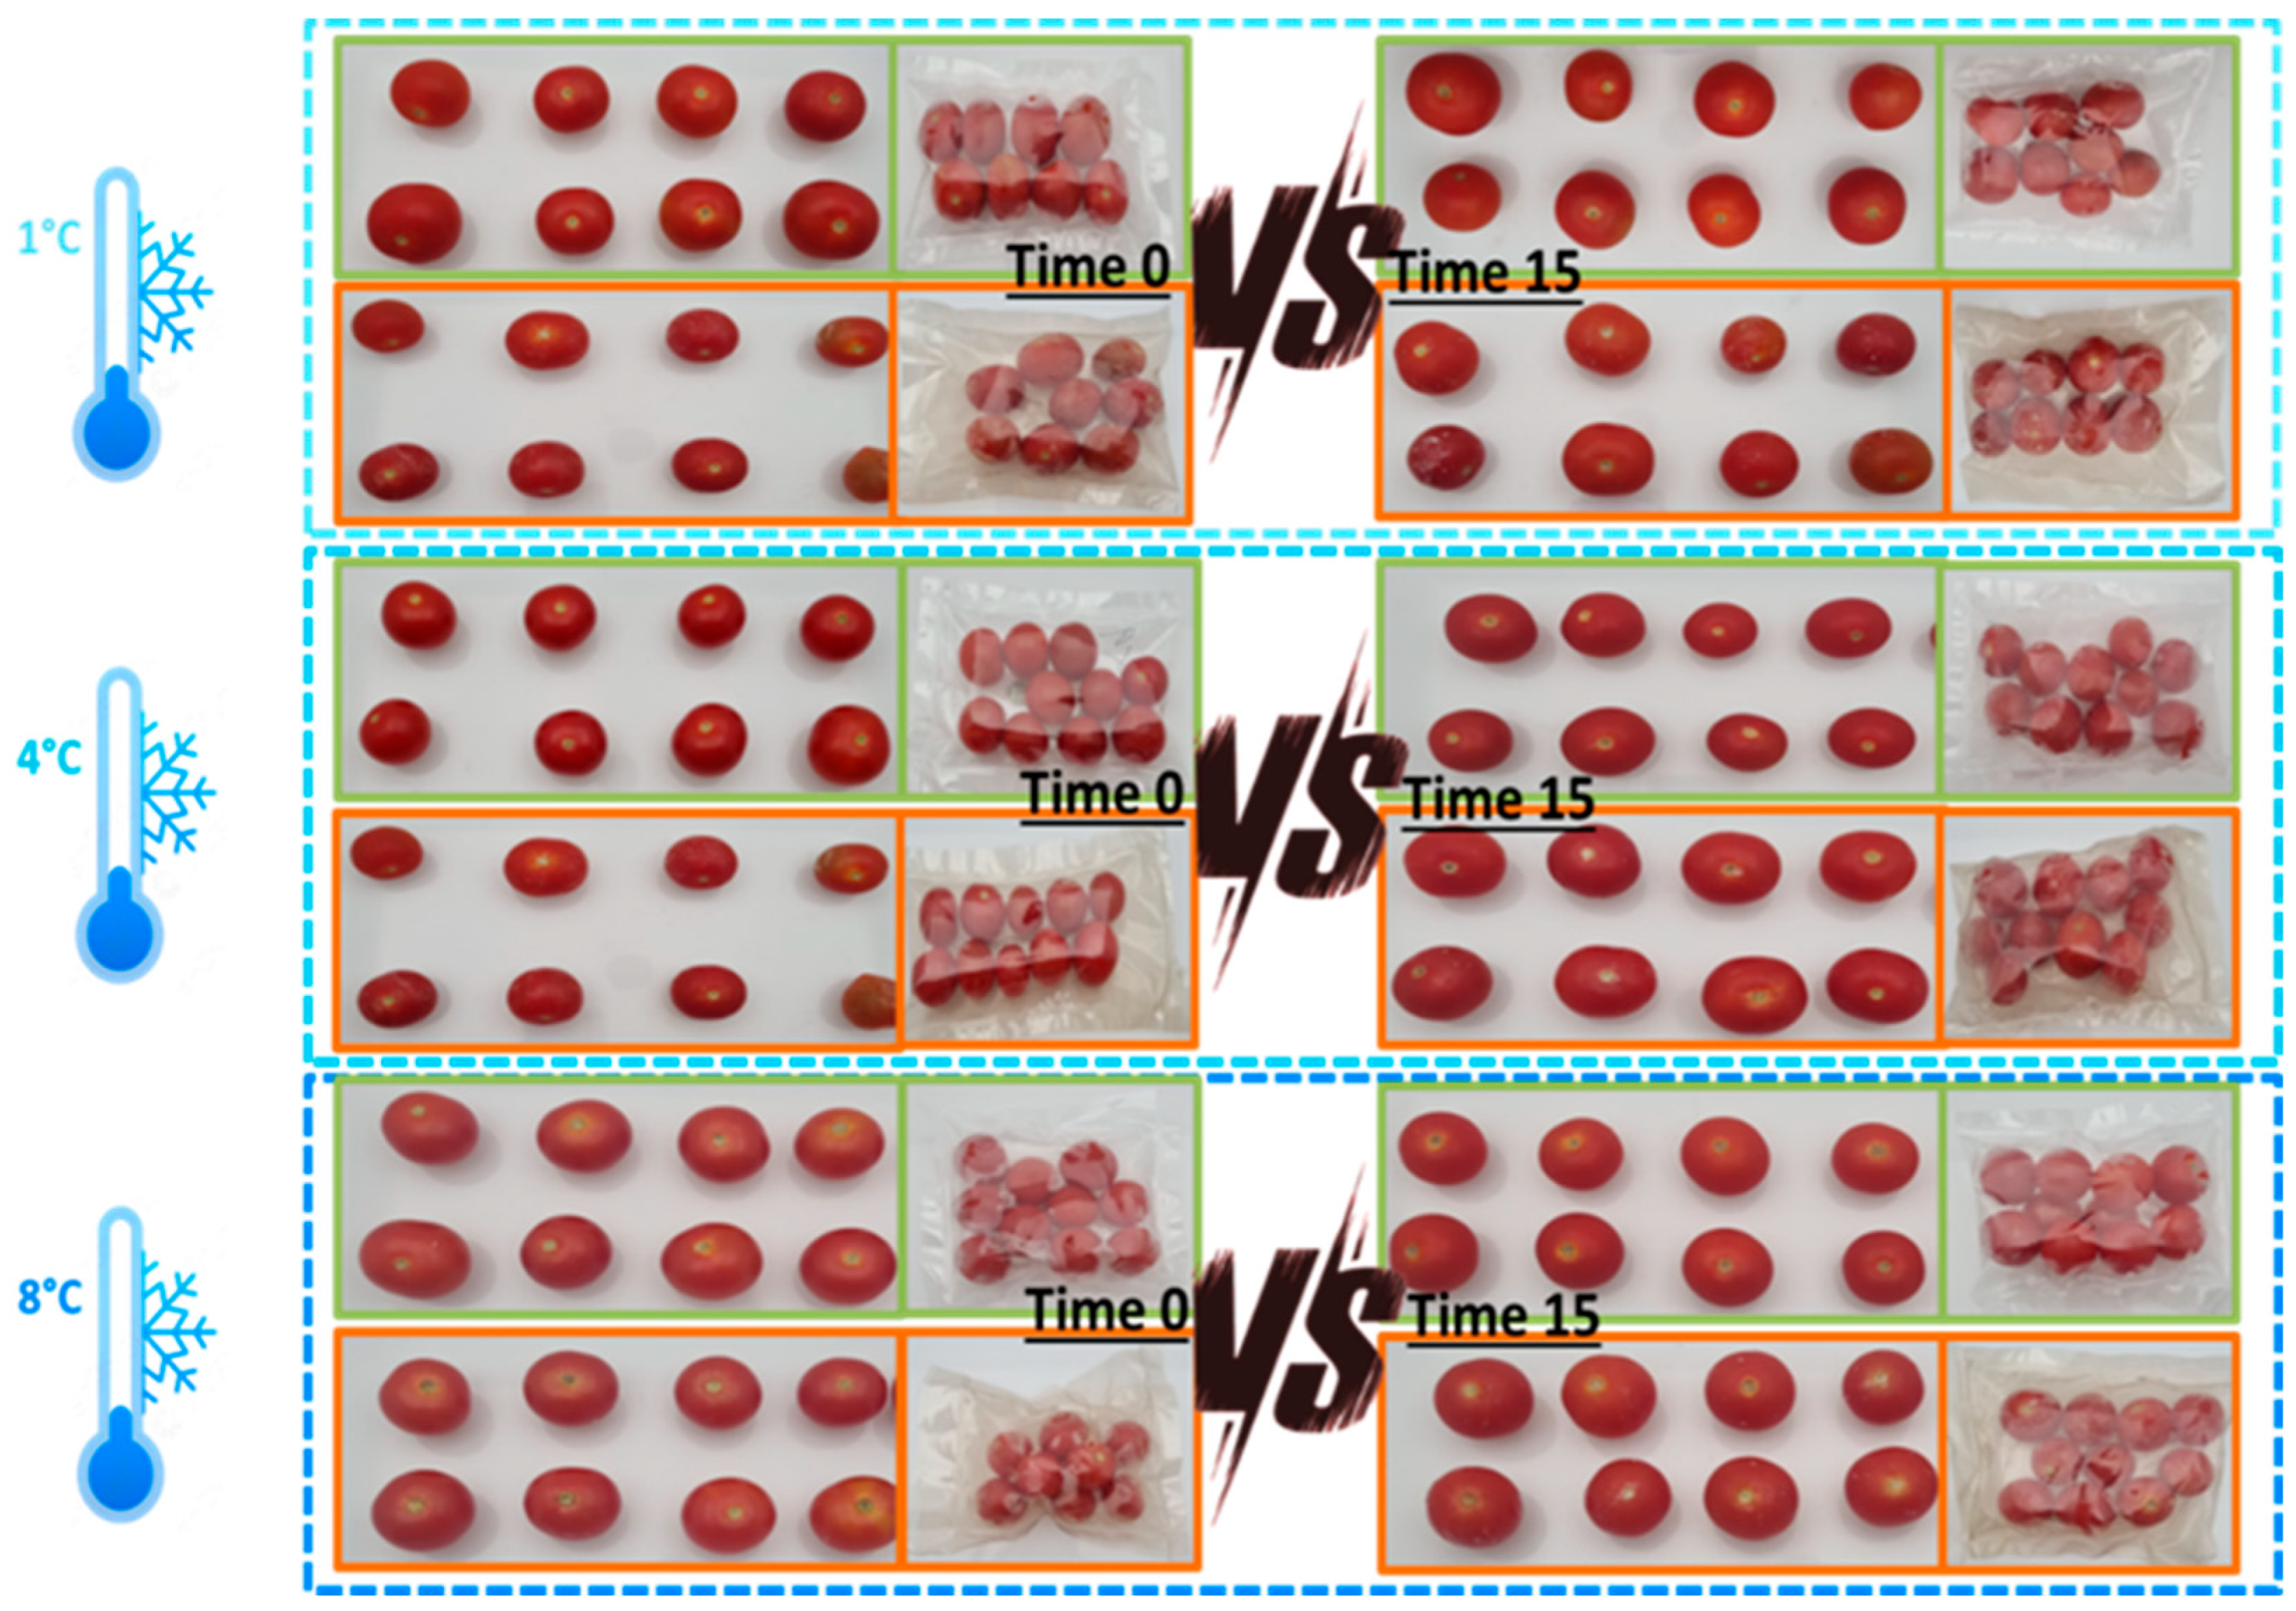
Figure 2.
Changes of normalized pH, control (■) and prototype (●) groups, of MP cherry tomatoes during storage at different temperatures. Values are reported as the mean of three replicates ± standard deviation. Different letters show a significant effect of time (p < 0.05); * shows significant effect of treatment (p < 0.05); ** shows significant effect of treatment (p < 0.01); *** shows significant effect of treatment (p < 0.001). — and — are the data predicted by the model for control and prototype groups, respectively.
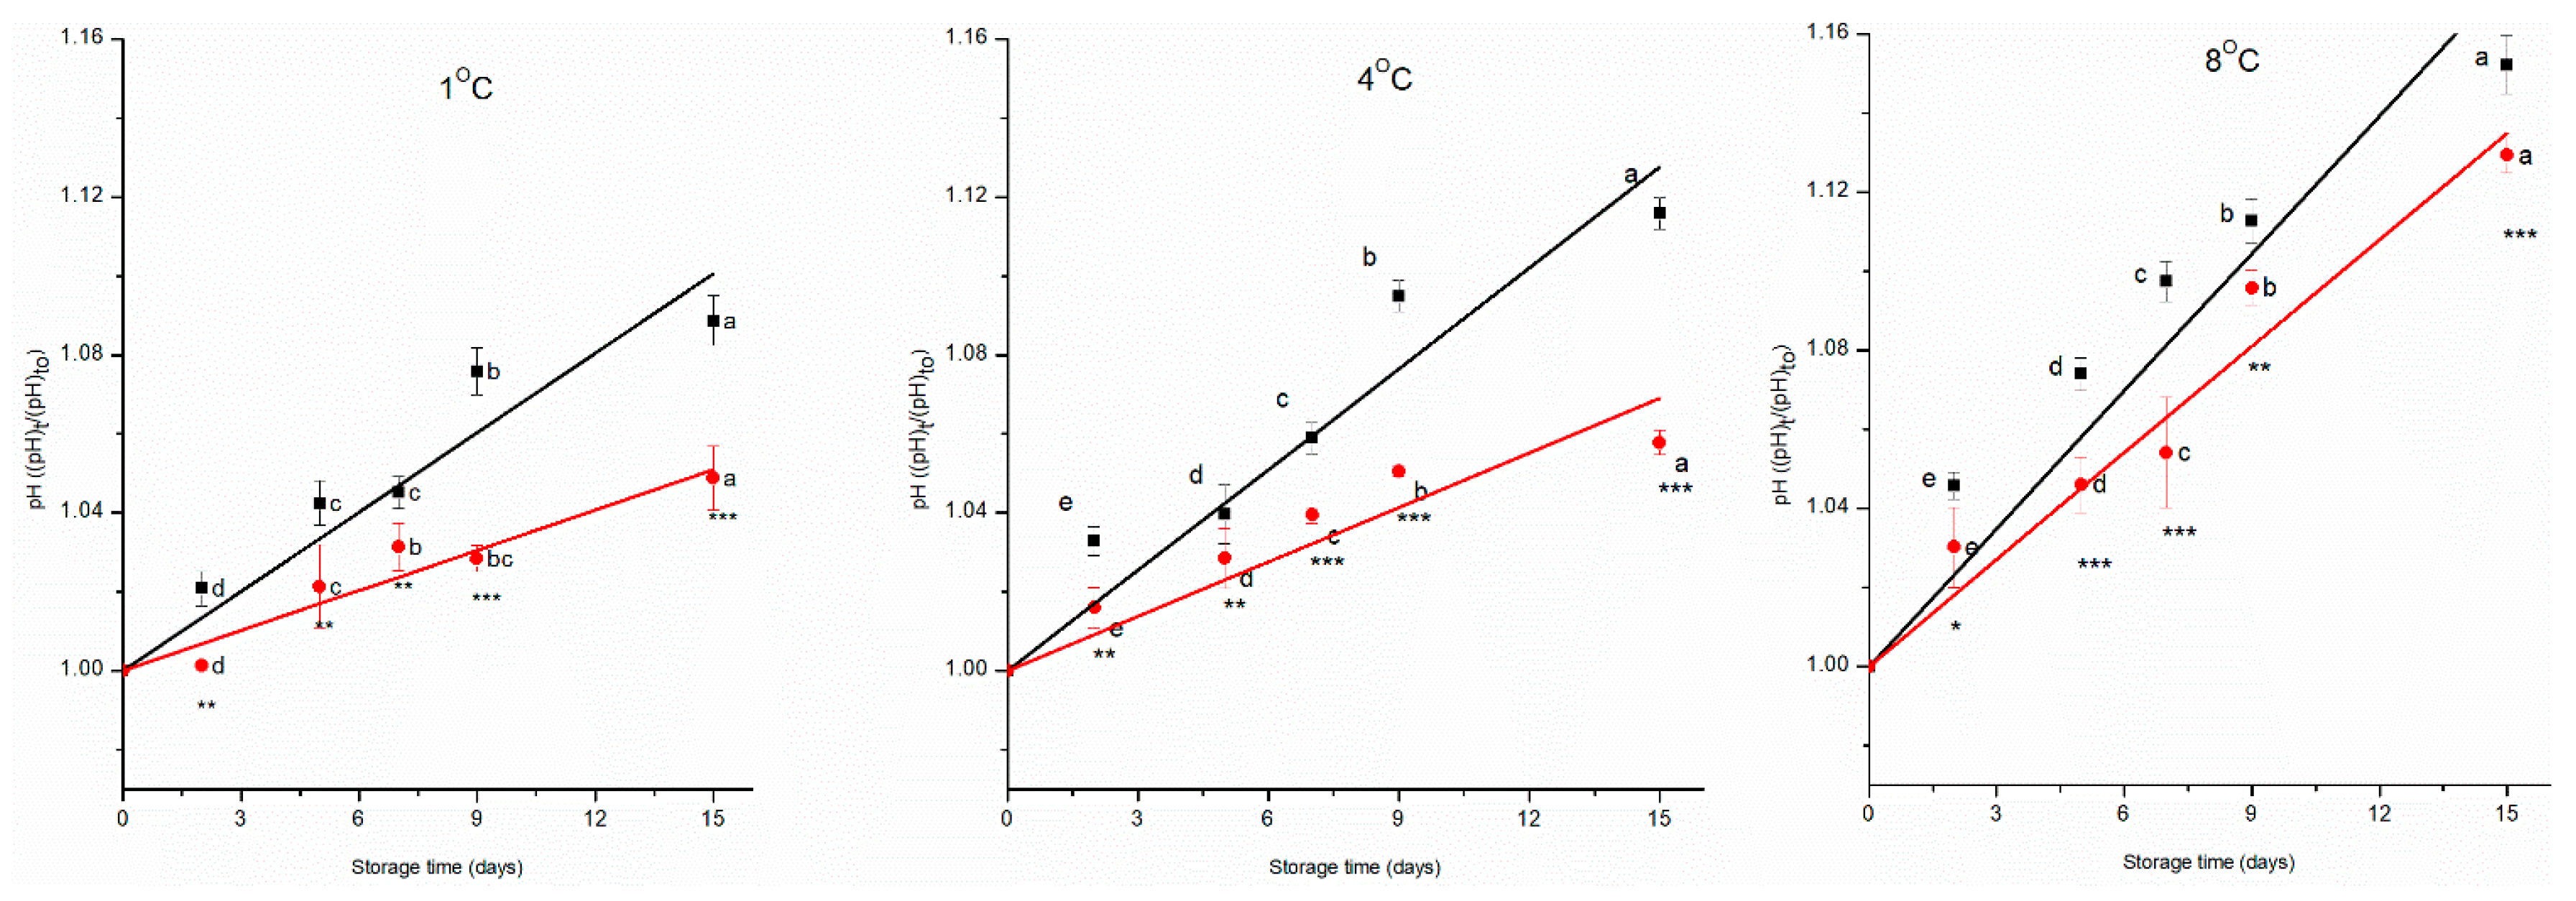
Figure 3.
Changes of normalized titratable acidity, control (■) and prototype (●) groups, of MP cherry tomatoes during storage at different temperatures. Values are reported as the mean of three replicates ± standard deviation. Different letters show a significant effect of time (p < 0.05); * significant effect of treatment (p < 0.05); ** shows significant effect of treatment (p < 0.01); *** shows significant effect of treatment (p < 0.001). — and — are the data predicted by the model for control and prototype groups, respectively.
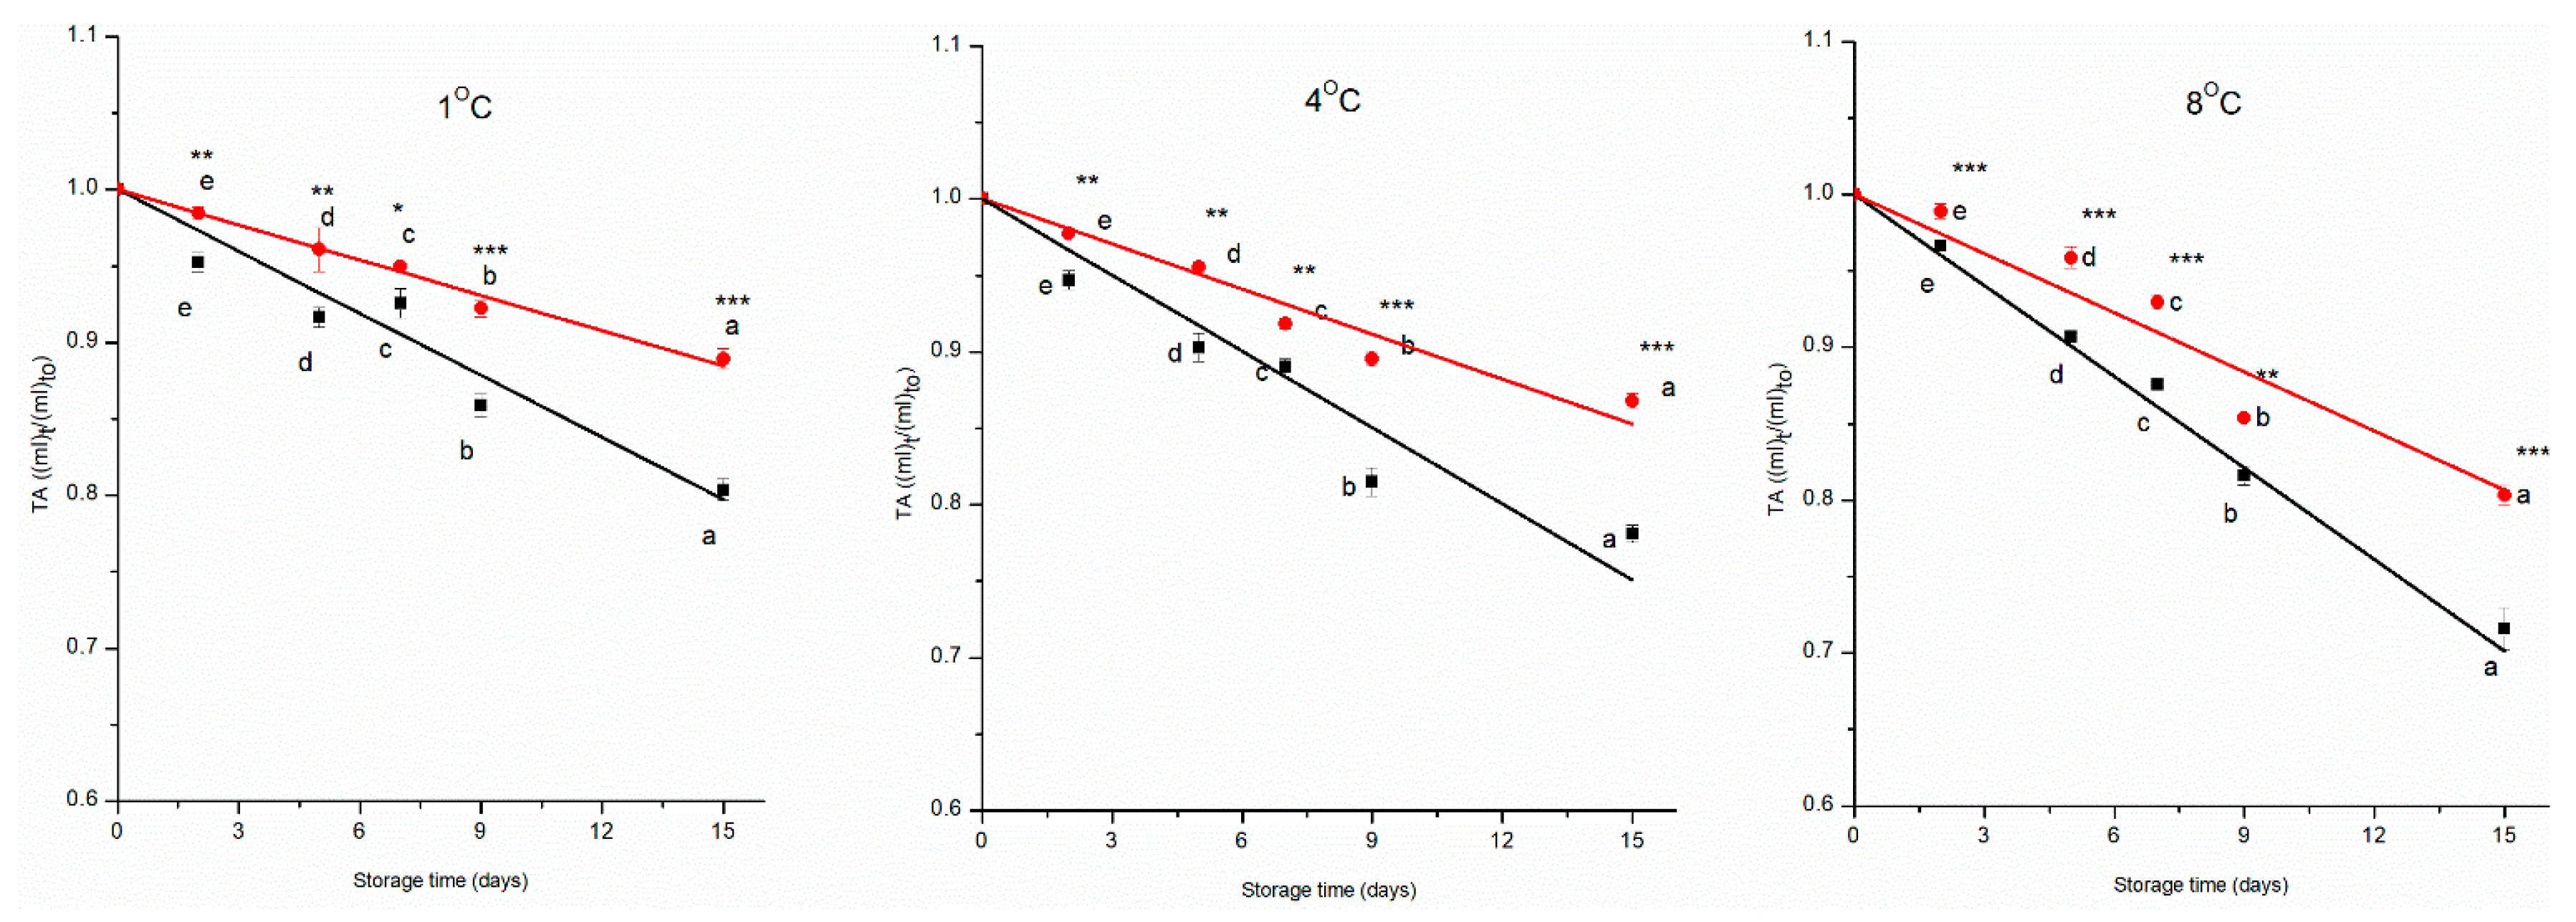
Figure 4.
Changes of normalized total polyphenol content (TPC), control (■) and prototype (●) groups, of MP cherry tomatoes during storage at different temperatures. Values are reported as the mean of three replicates ± standard deviation. Different letters show a significant effect of time (p < 0.05); * significant effect of treatment (p < 0.05); ** shows significant effect of treatment (p < 0.01); *** shows significant effect of treatment (p < 0.001). — and — are the data predicted by the model for control and prototype groups, respectively.
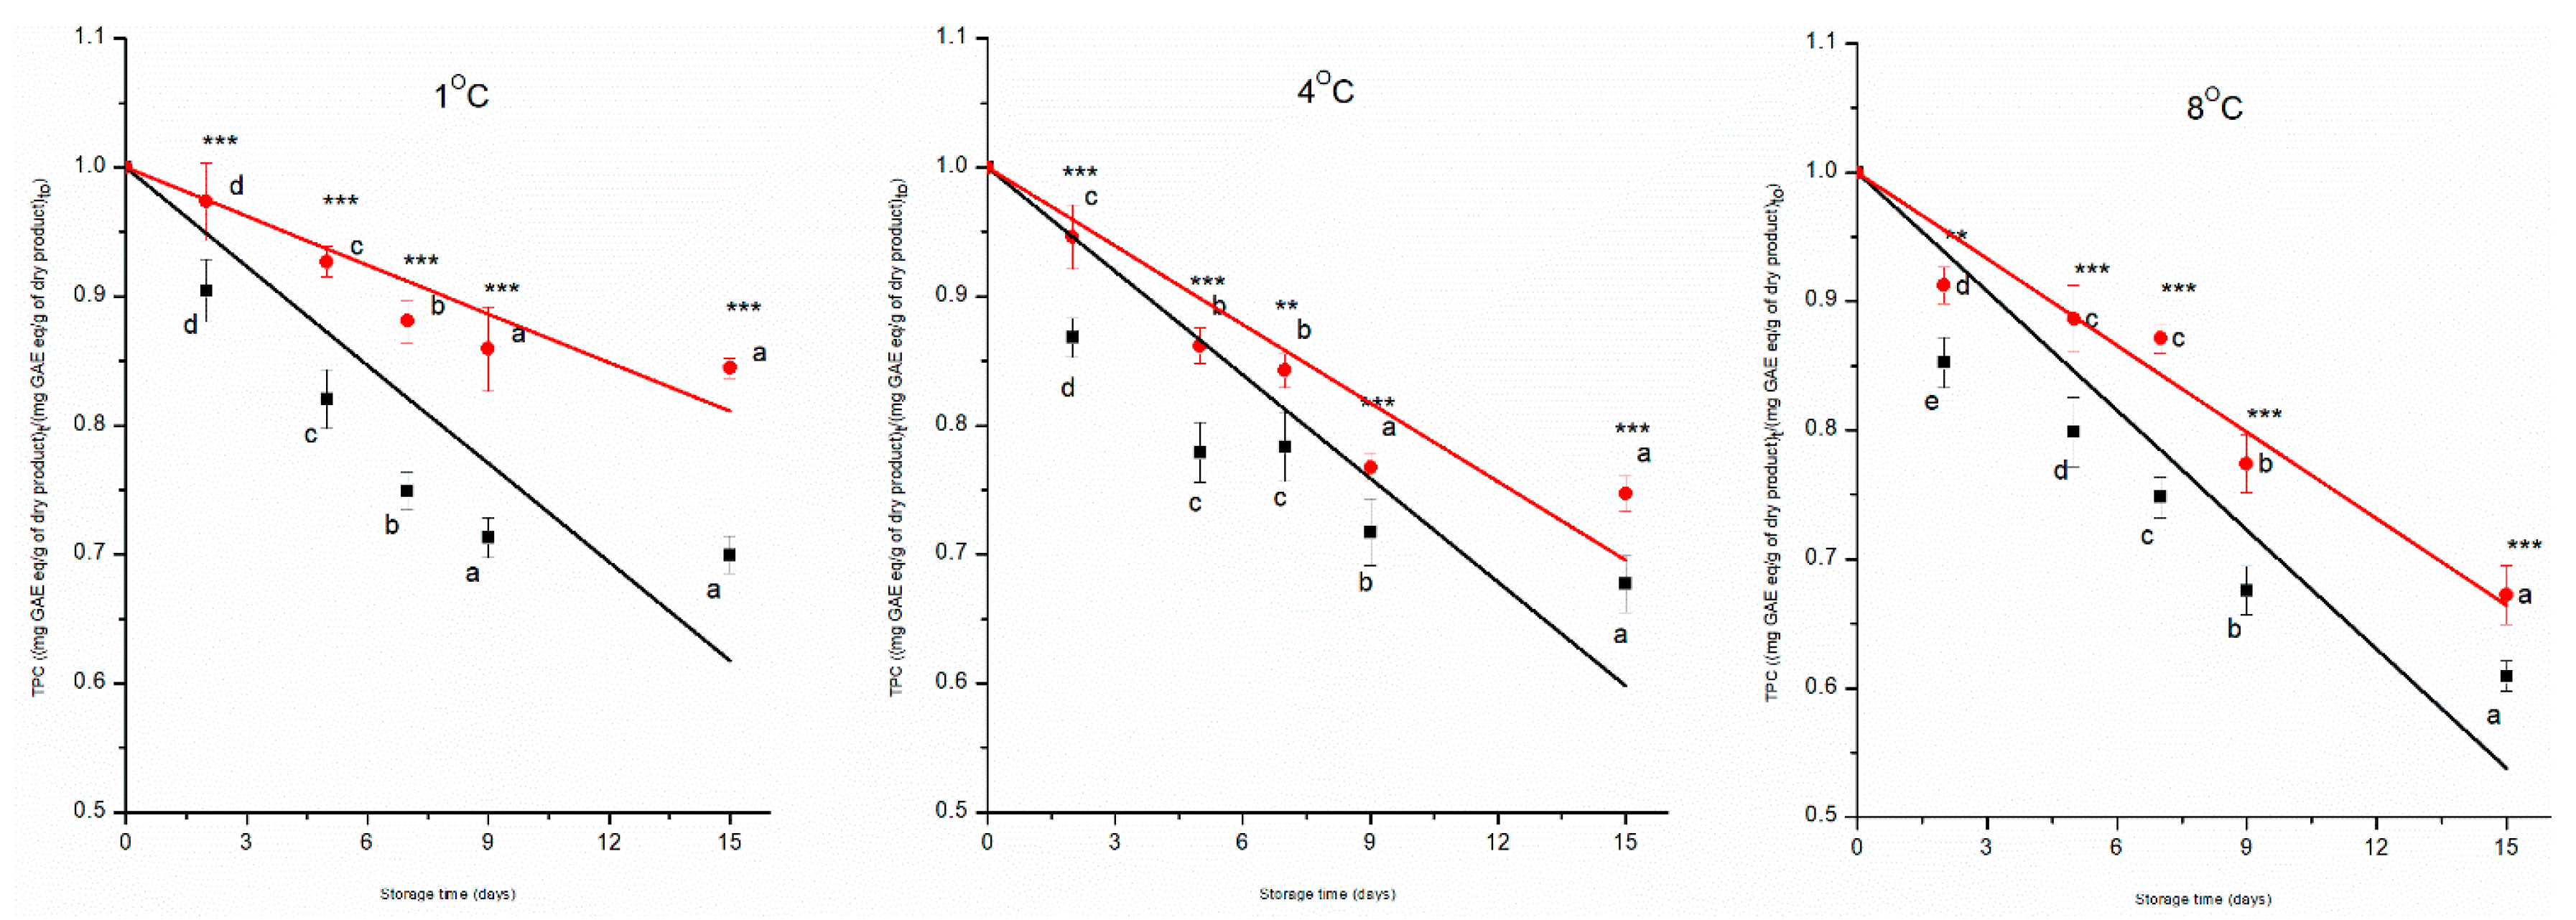
Figure 5.
Changes of normalized antioxidant capacity (AOC) in control (■) and prototype (●) groups of MP cherry tomatoes during storage at different temperatures. Values are reported as the mean of three replicates ± standard deviation. Different letters show a significant effect of time (p < 0.05); * significant effect of treatment (p < 0.05); ** shows significant effect of treatment (p < 0.01); *** shows significant effect of treatment (p < 0.001). — and — are the data predicted by the model for control and prototype groups, respectively.
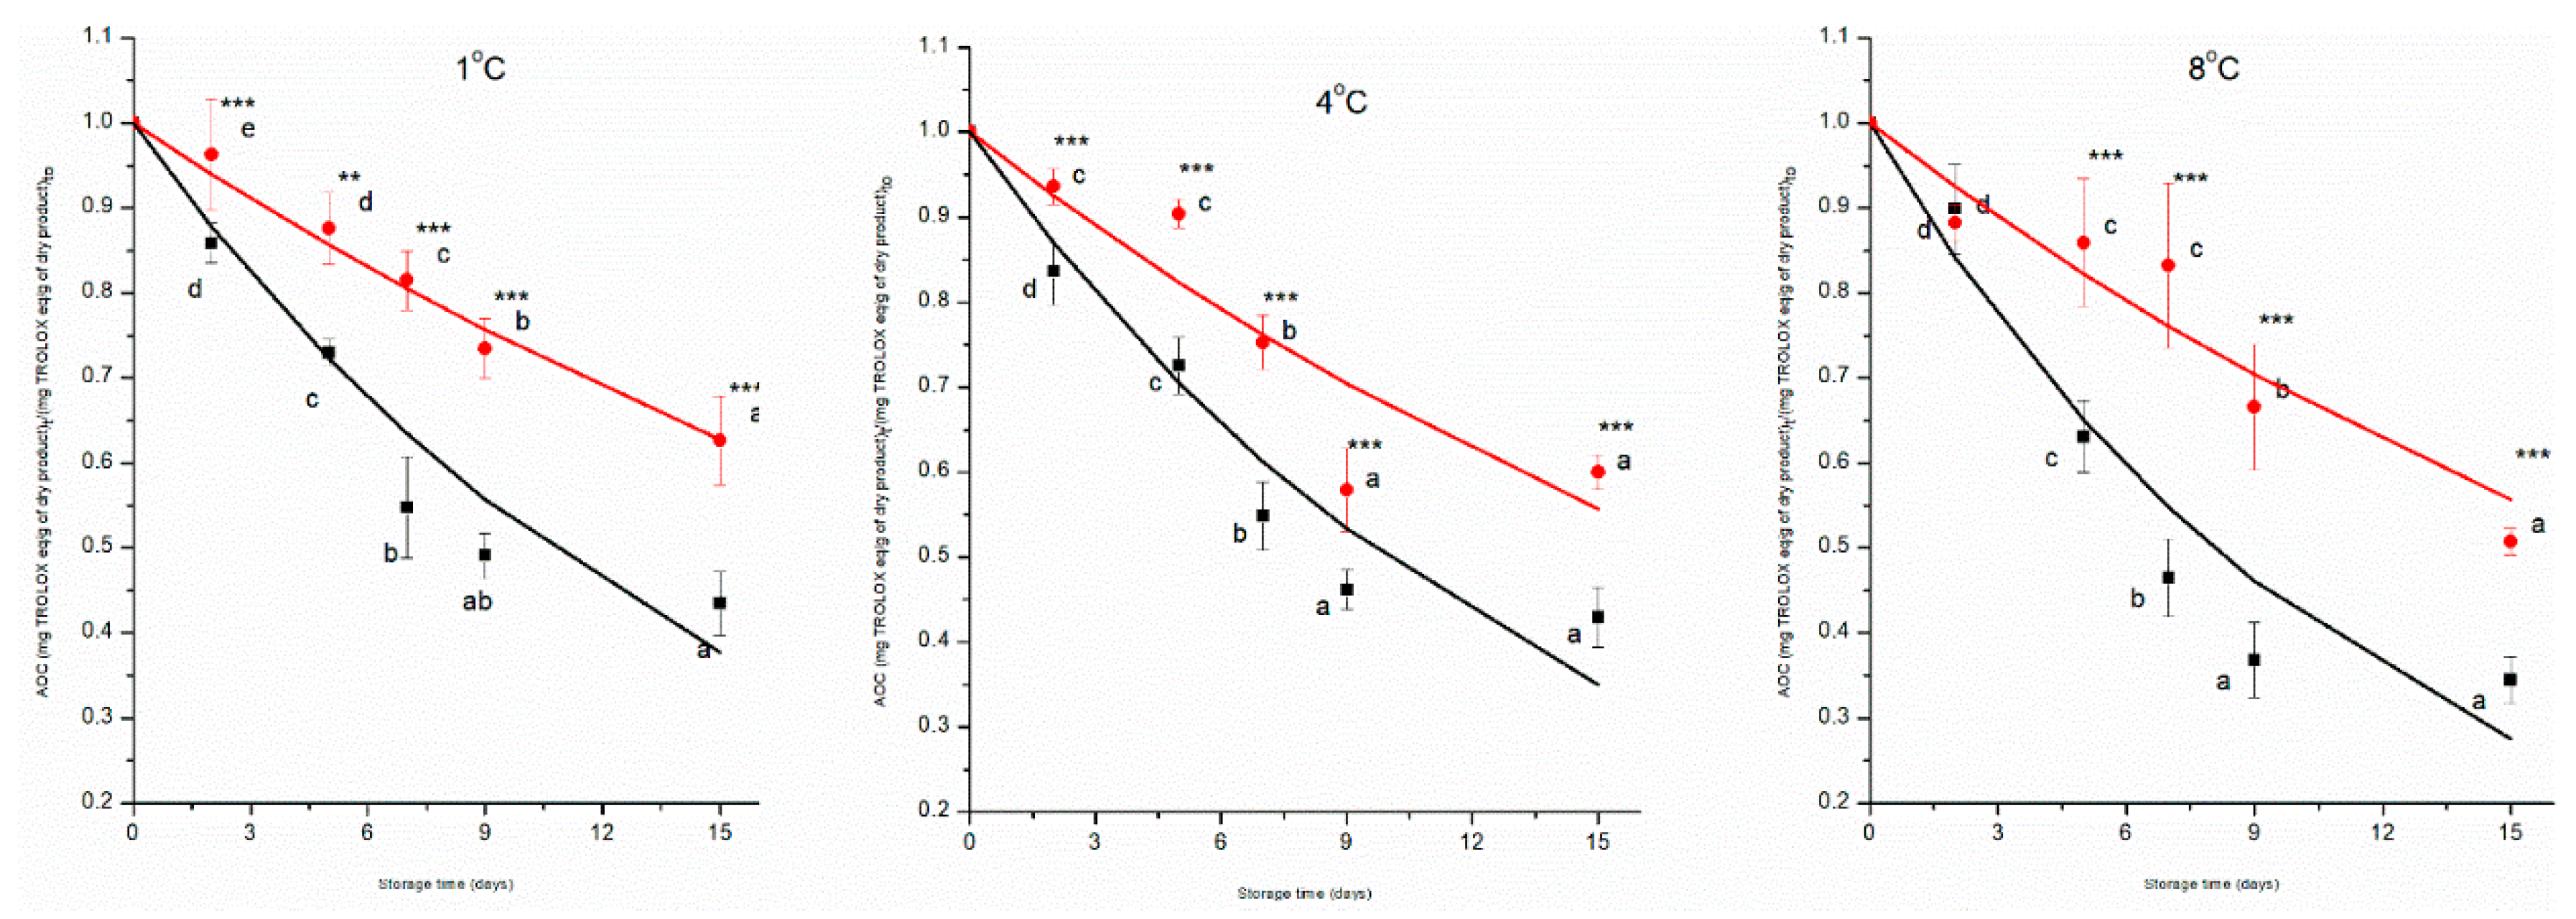
Figure 6.
Bar chart showing the species-level composition of Prototype and Control samples at baseline and after 15 days of storage at 4 °C and 8 °C. Only species with an average relative abundance > 2% are shown.
Figure 6.
Bar chart showing the species-level composition of Prototype and Control samples at baseline and after 15 days of storage at 4 °C and 8 °C. Only species with an average relative abundance > 2% are shown.
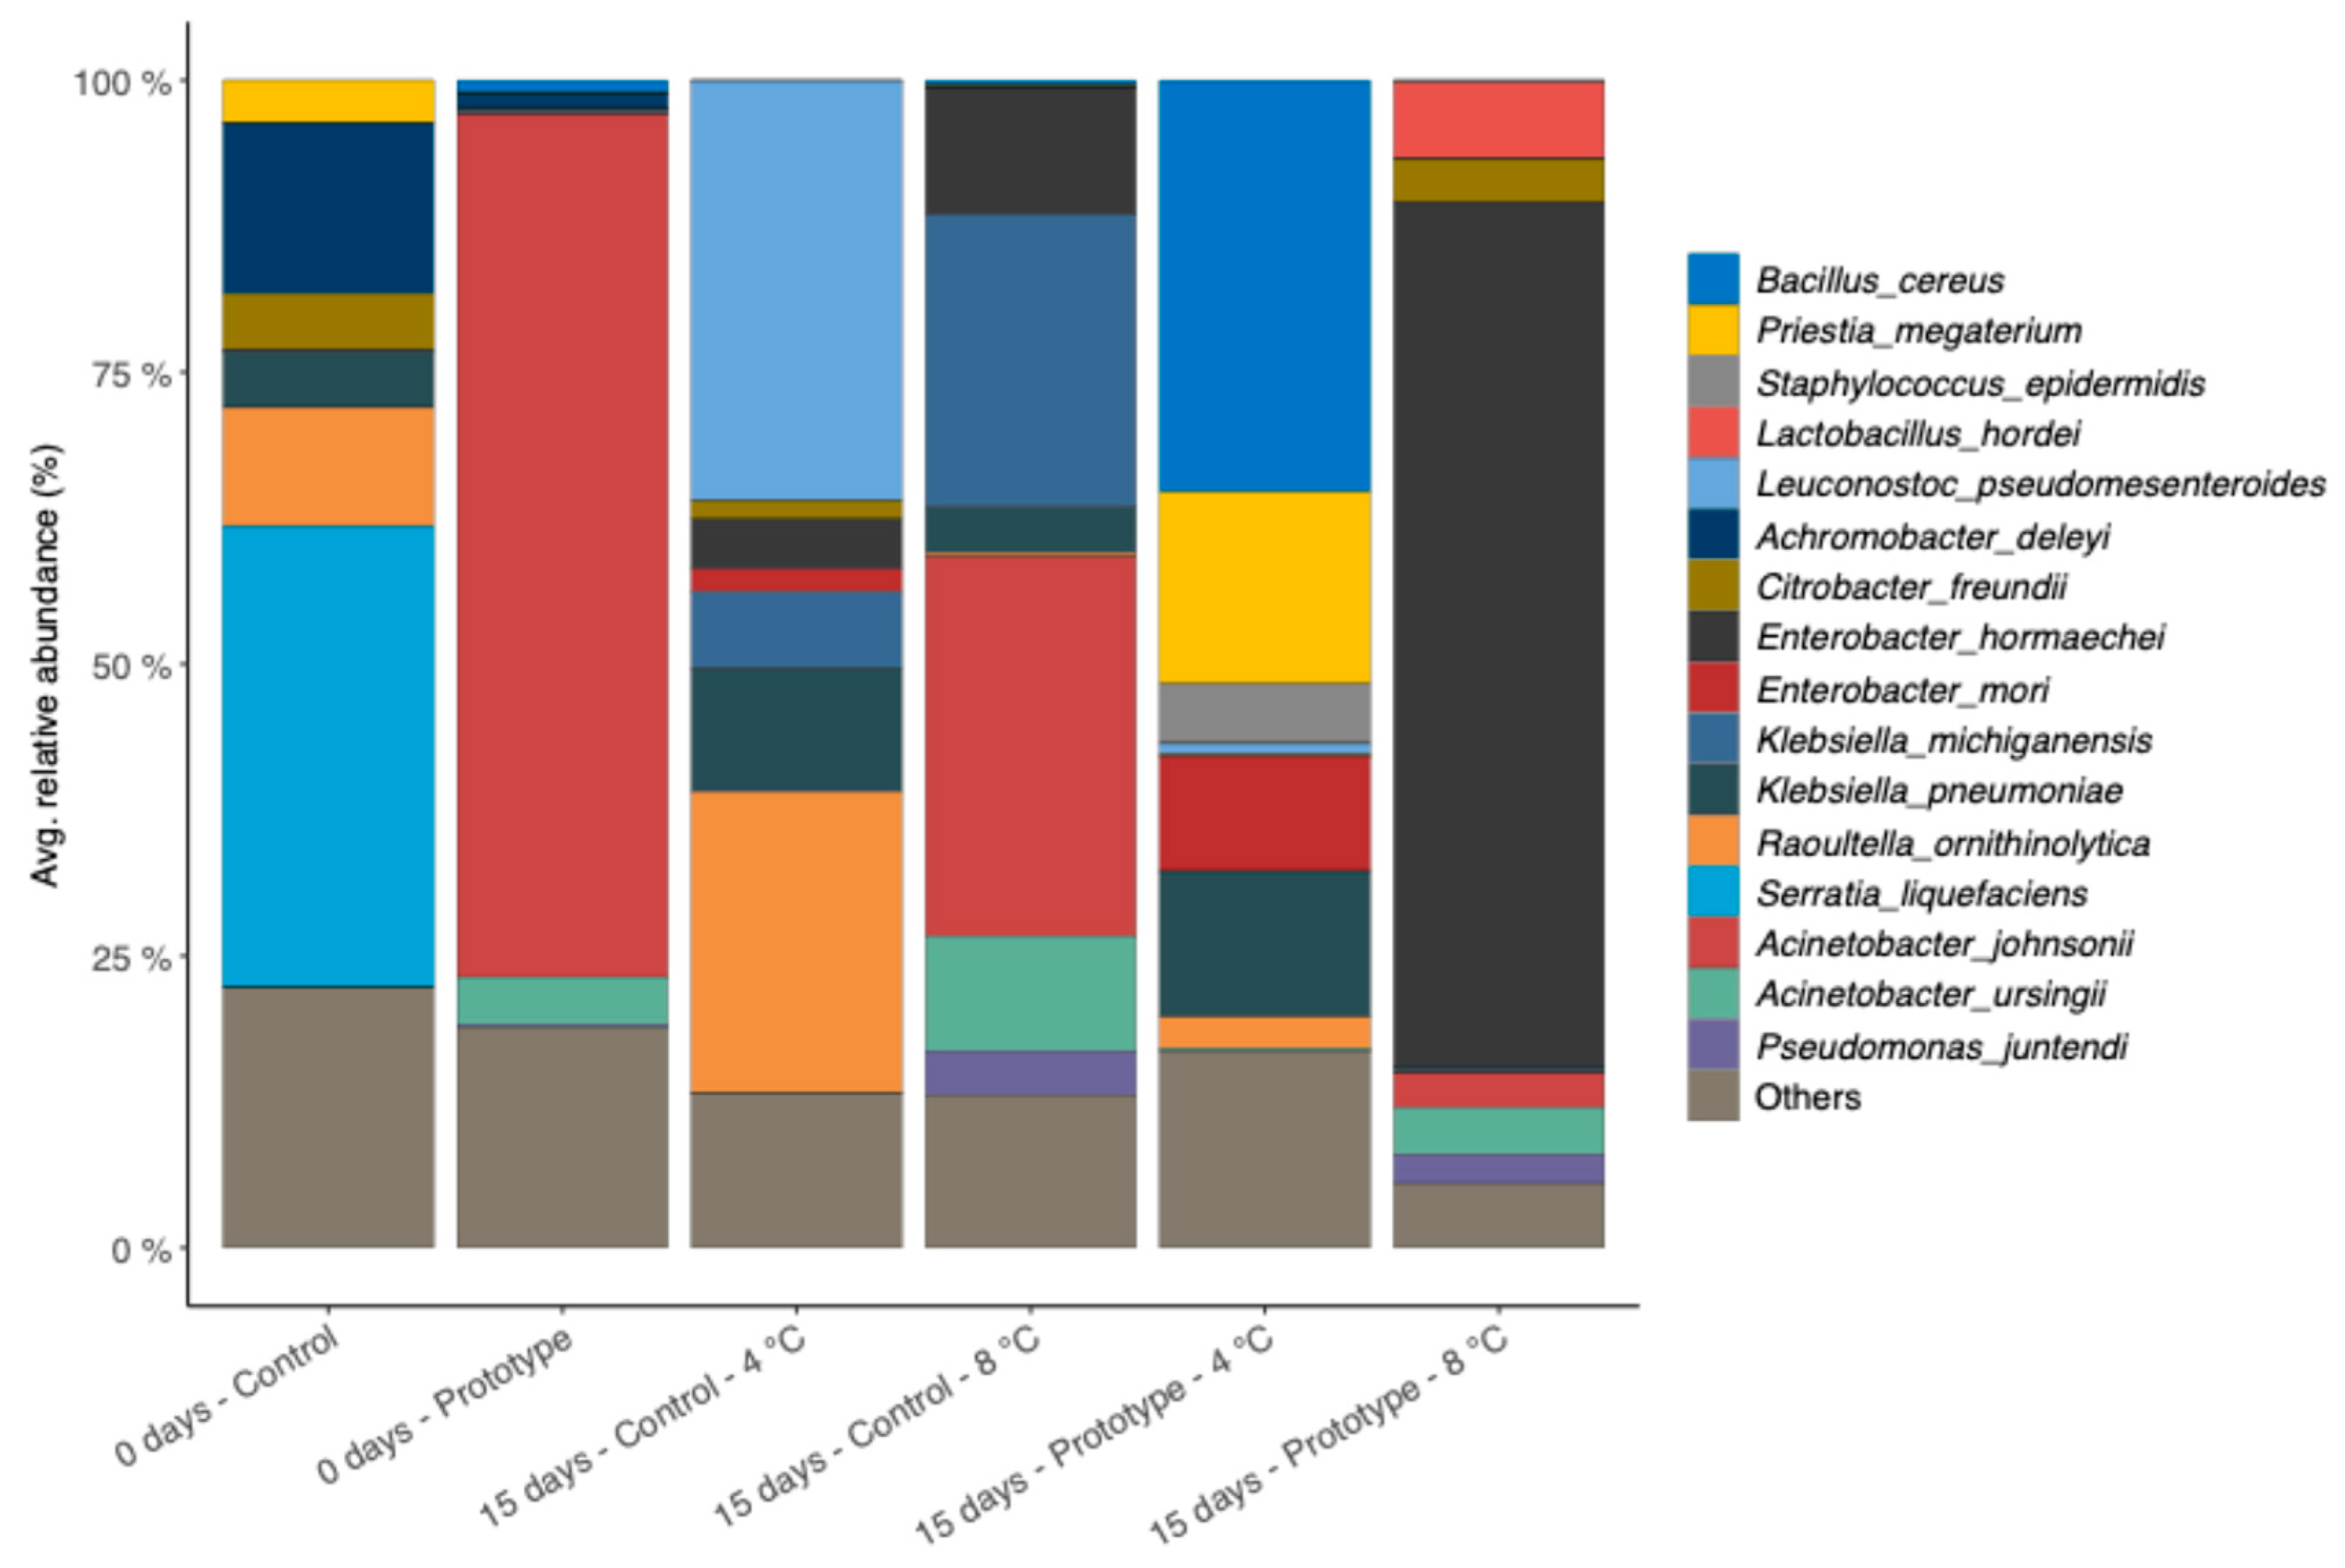
Figure 7.
Ward’s linkage clustering based on the Canberra distance of the scaled Reads per Kilobase per Million Mapped Reads (RPKM) abundance of antimicrobial resistance gene families.
Figure 7.
Ward’s linkage clustering based on the Canberra distance of the scaled Reads per Kilobase per Million Mapped Reads (RPKM) abundance of antimicrobial resistance gene families.
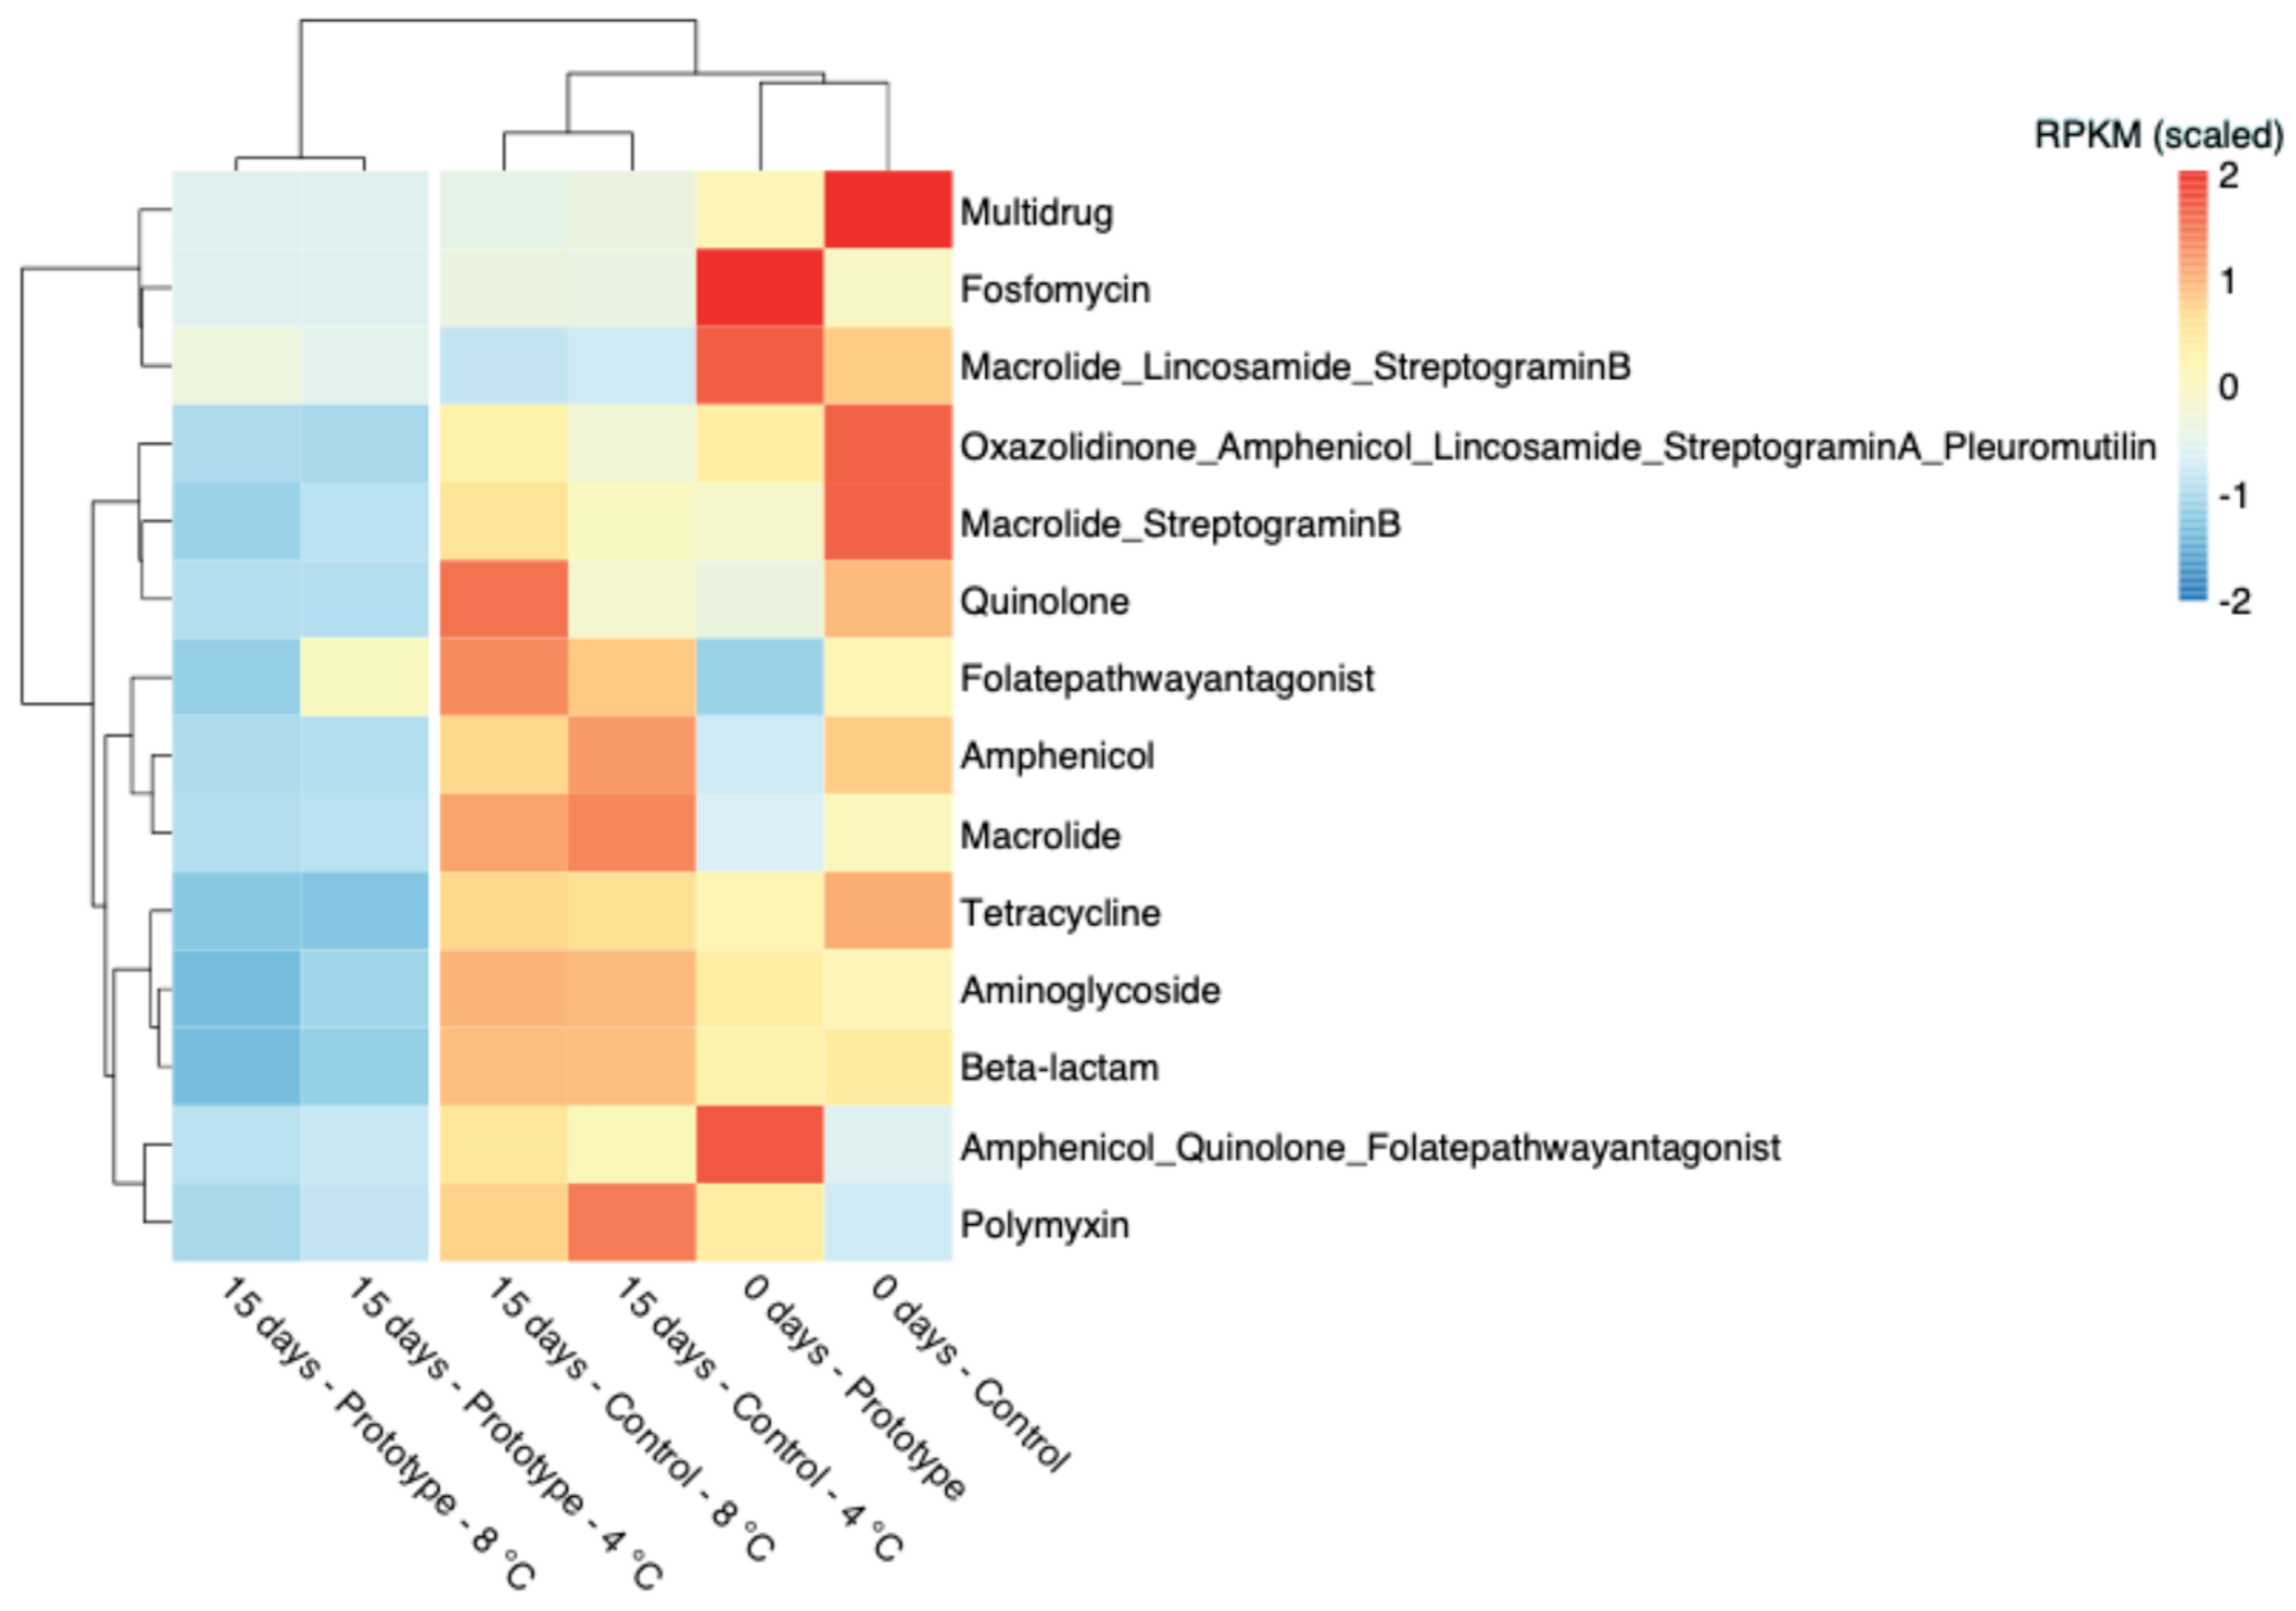

Table 1.
Colour parameters (L*, a*, b*, and ΔE) of control and prototype groups of MP cherry tomatoes, stored at different temperatures up to 15 days.
Table 1.
Colour parameters (L*, a*, b*, and ΔE) of control and prototype groups of MP cherry tomatoes, stored at different temperatures up to 15 days.
| Temperature | Parameters | Storage days | |||||||
|---|---|---|---|---|---|---|---|---|---|
| 0 | 2 | 5 | 7 | 9 | 15 | ||||
| 1 °C | L | 42±2d | 34±3a | 38±2c | 35±2a | 37±2b | 39±2c | ||
| Control Group | a | 14±3a | 18±2b | 18±3bc | 20±4c | 20±2c | 13±3a | ||
| b | 15±3a | 20±3d | 18±4b | 20±4cd | 18±3bc | 14±2a | |||
| ∆E | 0 | 9±3cd | 7±4b | 10±4d | 8±3bc | 5±2a | |||
| 4 °C | L | 40±2b | 36±2a | 36±2a | 35±2a | 36±2a | 36±4a | ||
| a | 16±2a | 20±3b | 20±3b | 21±3bc | 20±4bc | 22±3c | |||
| b | 15±2a | 19±3cd | 19±3c | 21±3d | 17±3b | 21±3d | |||
| ∆E | 0 | 8±4a | 8±3a | 10±3b | 8±3a | 10±4b | |||
| 8 °C | L | 42±1d | 38±2c | 37±2bc | 35±2a | 35±3a | 37±2b | ||
| a | 16±2a | 18±2b | 18±3b | 20±2b | 19±3b | 18±3b | |||
| b | 15±2a | 17±2b | 15±3a | 19±3c | 18±3cd | 17±3bc | |||
| ∆E | 0 | 5±3a | 6±2ab | 10±3d | 8±4b | 6±3bc | |||
| Prototype Group | 1 °C | L | 41±2d | 36±3b* | 34±3a*** | 35±3ab* | 35±2ab | 38±4c | |
| a | 14±3a | 15±3a*** | 20±3b | 18±4b | 19±3b | 14±3a | |||
| b | 14±2a | 17±4b** | 21±4d** | 19±5bc | 21±4cd** | 17±4b** | |||
| ∆E | 0 | 8±3a** | 12±3c*** | 10±3b | 11±3bc* | 7±3a** | |||
| 4 °C | L | 42±1d*** | 36±2b | 36±2b | 36±2b*** | 38±2c*** | 35±1a | ||
| a | 17±2a* | 20±3bc | 21±3c | 19±4ab** | 18±3b** | 22±3c | |||
| b | 15±1a | 18±3c | 19±3cd | 17±3b*** | 4±3a*** | 20±3d | |||
| ∆E | 0 | 8±3c | 9±4c | 7±3b*** | 5±2a** | 11±3d | |||
| 8 °C | L | 42±1c | 34±2b | 37±2a | 35±2a | 36±2b* | 34±3a*** | ||
| a | 16±2ab | 19±3d | 18±2c | 20±2d | 16±2a*** | 17±2bc | |||
| b | 14±2a | 18±3b | 14±2a | 20±3c | 15±3a*** | 18±2b | |||
| ∆E | 0 | 7±3b** | 5±2a | 10±3d | 6±2ab** | 9±2c** | |||
Values are reported as the mean of three replicates ± standard deviation. Different letters show significant effect of time (p < 0.05); * significant effect of treatment (p < 0.05); ** shows significant effect of treatment (p < 0.01); *** shows significant effect of treatment (p < 0.001).
Table 2.
Estimated parameters of pseudo-zero- and first-order kinetic model for quality indices of control and prototype groups of MP cherry tomatoes, stored at different temperatures up to 15 days.
Table 2.
Estimated parameters of pseudo-zero- and first-order kinetic model for quality indices of control and prototype groups of MP cherry tomatoes, stored at different temperatures up to 15 days.
| Quality Indices | Reaction Order | Temperature (◦C) | Groups | Kinetics parameters | ||
|---|---|---|---|---|---|---|
| k | R2 | RMSE | ||||
| 1 | Control | 0.006±0.0001c | 0.93 | 0.01 | ||
| 4 | 0.009±0.0002b | 0.94 | 0.03 | |||
| pH | Zero-order reaction | 8 | 0.011±0.0001a | 0.95 | 0.01 | |
| 1 | Prototype | 0.003±0.0001c*** | 0.93 | 0.01 | ||
| 4 | 0.004±0.0003b*** | 0.91 | 0.02 | |||
| 8 | 0.009±0.0002a*** | 0.96 | 0.01 | |||
| 1 | Control | 0.013±0.0002c | 0.95 | 0.02 | ||
| 4 | 0.016±0.0004b | 0.94 | 0.02 | |||
| Titratable acidity | Zero-order reaction | 8 | 0.019±0.0001a | 0.99 | 0.01 | |
| 1 | Prototype | 0.008±0.0001c*** | 0.98 | 0.01 | ||
| 4 | 0.010±0.0002b*** | 0.95 | 0.03 | |||
| 8 | 0.013±0.0003a*** | 0.94 | 0.02 | |||
| 1 | Control | 0.025±0.0002c | 0.82 | 0.06 | ||
| 4 | 0.027±0.0005b | 0.83 | 0.05 | |||
| Total polyphenol content | Zero-order reaction | 8 | 0.031±0.0010a | 0.90 | 0.04 | |
| 1 | Prototype | 0.015±0.0003c*** | 0.88 | 0.02 | ||
| 4 | 0.019±0.0010b*** | 0.91 | 0.06 | |||
| 8 | 0.023±0.0020a** | 0.96 | 0.02 | |||
| 1 | Control | 0.064±0.001c | 0.95 | 0.05 | ||
| 4 | 0.071±0.003b | 0.94 | 0.04 | |||
| Total Antioxidant capacity | First-order reaction | 8 | 0.083±0.003a | 0.94 | 0.06 | |
| 1 | Prototype | 0.031±0.003c*** | 0.98 | 0.02 | ||
| 4 | 0.040±0.001b*** | 0.85 | 0.06 | |||
| 8 | 0.051±0.004a*** | 0.92 | 0.04 | |||
Values are reported as the mean of three replicates ± standard deviation. k: estimated rate reaction constants for zero and first-order model (day-1); R2; coefficient of determination; RMSE: root mean square error; Different letters show significant effect of time (p < 0.05); ** shows significant effect of treatment (p < 0.01); *** shows significant effect of treatment (p < 0.001).
Table 3.
Estimated Arrhenius equation parameters for the quality indices of control and prototype groups of MP cherry tomatoes, stored at different temperatures up to 15 days.
Table 3.
Estimated Arrhenius equation parameters for the quality indices of control and prototype groups of MP cherry tomatoes, stored at different temperatures up to 15 days.
| Quality Indices | Group | kref (day-1) | Ea (kJmol-1) | R2 |
|---|---|---|---|---|
| pH | Control | 0.008±0.01 | 51±2*** | 0.98 |
| Prototype | 0.005±0.02 | 92±4 | 0.94 | |
| Titratable acidity | Control | 0.03±0.02 | 35±3* | 0.97 |
| Prototype | 0.02±0.01 | 46±1 | 0.98 | |
| Total Polyphenol content | Control | 0.03±0.01 | 19±3* | 0.97 |
| Prototype | 0.02±0.01 | 38±6 | 0.98 | |
| Total Antioxidant capacity | Control | 0.07±0.02 | 24±2*** | 0.98 |
| Prototype | 0.04±0.01 | 46±1 | 0.96 |
Values 4. 3 °C); kref: estimated rate reaction constants for zero and first-order model (day-1) at reference temperature; Ea: activation energy; R2: coefficient of determination; * shows significant effect of treatment (p < 0.05); *** shows significant effect of treatment (p < 0.001).
Table 4.
Microbial counts (logCFU/g) of control and prototype groups of MP cherry tomatoes, stored at 1 °C, up to 15 days.
Table 4.
Microbial counts (logCFU/g) of control and prototype groups of MP cherry tomatoes, stored at 1 °C, up to 15 days.
| Groups | Total Aerobic Microbial Count | Yeasts and Molds | Enterobacteriaceae | Storage time (days) |
|---|---|---|---|---|
| Prototype | 3.18 ± 0.83 | < 1 ± 0.05 | < 1 ± 0.04 | 0 |
| Control | 3.85 ± 1.24 | < 1 ± 0.06 | < 1 ± 0.16 | |
| Prototype | 2.95 ± 0.76 | < 1 ± 0.31 | < 1 ± 0.07 | 2 |
| Control | 3.18 ± 1.33 | < 1 ± 0.08 | < 1 ± 0.07 | |
| Prototype | 2.38 ± 1.46 | < 1 ± 0.20 | < 1 ± 0.02 | 5 |
| Control | 3.28 ± 0.97 | < 1 ± 0.17 | < 1 ± 0.02 | |
| Prototype | 2.72 ± 1.10 | < 1 ± 0.03 | < 1 ± 0.20 | 7 |
| Control | 3.70 ± 1.58 | < 1 ± 0.30 | < 1 ± 0.15 | |
| Prototype | 2.20 ± 0.74 | < 1 ± 0.12 | < 1 ± 0.08 | 9 |
| Control | 3.46 ± 1.22 | < 1 ± 0.51 | < 1 ± 0.13 | |
| Prototype | 2.53 ± 1.00 | < 1 ± 0.09 | < 1 ± 0.32 | 15 |
| Control | 3.56 ± 1.03 | < 1 ± 0.11 | < 1 ± 0.05 |
Values are reported as the mean of three replicates ± standard deviation.
Table 5.
Microbial counts (logCFU/g) of control and prototype groups of MP cherry tomatoes, stored at 4 °C, up to 15 days.
Table 5.
Microbial counts (logCFU/g) of control and prototype groups of MP cherry tomatoes, stored at 4 °C, up to 15 days.
| Groups | Total Aerobic Microbial Counts | Yeasts and Molds | Enterobacteriaceae | Storage time (days) |
|---|---|---|---|---|
| Prototype | 2.70 ± 1.09 | < 1 ± 0.08 | < 1 ± 0.04 | 0 |
| Control | 3.70 ± 1.33 | < 1 ± 0.10 | < 1 ± 0.02 | |
| Prototype | 3.48 ± 1.67 | < 1 ± 0.03 | < 1 ± 0.11 | 2 |
| Control | 2.89 ± 0.58 | < 1 ± 0.04 | < 1 ± 0.20 | |
| Prototype | 2.88 ± 1.10 | < 1 ± 0.12 | < 1 ± 0.07 | 5 |
| Control | 2.54 ± 0.56 | < 1 ± 0.09 | < 1 ± 0.09 | |
| Prototype | < 1 ± 0.09 | < 1 ± 0.21 | < 1 ± 0.07 | 7 |
| Control | 2.67 ± 0.91 | 1.65 ± 0.88 | < 1 ± 0.07 | |
| Prototype | 2.20 ± 1.00 | < 1 ± 0.04 | < 1 ± 0.02 | 9 |
| Control | 2.23 ± 1.88 | < 1 ± 0.17 | 1 ± 0.15 | |
| Prototype | 3.11 ± 0.93 | 3.36 ± 2.03 | 2.18 ± 1.23 | 15 |
| Control | 3.08 ± 0.96 | < 1 ± 0.09 | 2.46 ± 1.19 |
Values are reported as the mean of three replicates ± standard deviation.
Table 6.
Microbial counts (logCFU/g) of control and prototype groups of MP cherry tomatoes, stored at 8 °C, up to 15 days.
Table 6.
Microbial counts (logCFU/g) of control and prototype groups of MP cherry tomatoes, stored at 8 °C, up to 15 days.
| Groups | Total Aerobic Microbial Counts | Yeasts and Molds | Enterobacteriaceae | Storage time (days) |
|---|---|---|---|---|
| Prototype | 2.66 ± 1.43 | < 1 ± 0.03 | < 1 ± 0.02 | 0 |
| Control | 1.90 ± 1.01 | < 1 ± 0.05 | < 1 ± 0.10 | |
| Prototype | 3.48 ± 1.18 | 1.30 ± 0.20 | 1 ± 0.06 | 2 |
| Control | 3.30 ± 1.00 | < 1 ± 0.03 | 2.20 ± 1.20 | |
| Prototype | 4.20 ± 1.89 | 2.45 ± 0.88 | < 1 ± 0.04 | 5 |
| Control | 4.08 ± 1.07 | 1.78 ± 0.47 | 3.38 ± 1.87 | |
| Prototype | 5 ± 1.89 | 3.65 ± 1.01 | < 1 ± 0.08 | 7 |
| Control | 4.36 ± 1.37 | < 1 ± 0.08 | 3.11 ± 1.34 | |
| Prototype | 4.77 ± 0.79 | 3.11 ± 1.10 | < 1 ± 0.11a | 9 |
| Control | 4.72 ± 1.27 | < 1 ± 0.04 | 4.00 ± 1.35b | |
| Prototype | 4.34 ± 0.64 | 3.18 ± 1.23 | 1.78 ± 0.25a | 15 |
| Control | 4.15 ± 0.77 | < 1 ± 0.06 | 2.30 ± 0.16b |
Values are reported as the mean of three replicates ± standard deviation.
Disclaimer/Publisher’s Note: The statements, opinions and data contained in all publications are solely those of the individual author(s) and contributor(s) and not of MDPI and/or the editor(s). MDPI and/or the editor(s) disclaim responsibility for any injury to people or property resulting from any ideas, methods, instructions or products referred to in the content. |
© 2025 by the authors. Licensee MDPI, Basel, Switzerland. This article is an open access article distributed under the terms and conditions of the Creative Commons Attribution (CC BY) license (http://creativecommons.org/licenses/by/4.0/).
Copyright: This open access article is published under a Creative Commons CC BY 4.0 license, which permit the free download, distribution, and reuse, provided that the author and preprint are cited in any reuse.


