
Submitted:
01 December 2025
Posted:
02 December 2025
You are already at the latest version
Abstract
This study investigates the dynamic behavior of re-entrant unit cell-shaped steel frames through numerical and experimental modal analyses. Inspired by re-entrant honeycomb structures, individual frame units were modeled to explore how natural frequencies vary with beam cross-sectional dimensions and frame angles. Twenty distinct frame models, incorporating four cross-sectional sizes (4×4 mm, 8×8 mm, 12×12 mm, and 16×16 mm) and five main frame angles (120°, 150°, 180°, 210°, and 240°), were developed using 3D modeling and finite element analysis (FEA) tools. The first eight natural frequencies and corresponding mode shapes were extracted for each model. The results revealed that lower modes exhibit global bending and torsional behaviors, whereas higher modes demonstrate increasingly localized deformations. The natural frequencies decrease by approximately 180° in the straight frame configuration and increase in the hexagonal configurations, highlighting the critical influence of the frame geometry. Increasing the cross-sectional size consistently enhances the dynamic stiffness, particularly in hexagonal frames. A quadratic polynomial surface regression analysis was performed to model the relationship between natural frequencies, cross-sectional dimensions, and frame angles, achieving high predictive accuracy (R² > 0.98). This regression model provides an efficient design tool for predicting vibrational behavior and optimizing frame configurations without extensive simulations. Experimental modal analyses validated the numerical results, confirming the effectiveness of the modeling approach. Overall, this study offers a comprehensive understanding of the dynamic characteristics of re-entrant frame structures and proposes practical design strategies for improving vibrational performance, particularly in applications such as machine foundations, vibration isolation systems, and aerospace structures.
Keywords:
re-entrant frame structures
; modal analysis
; natural frequency
; finite element method (FEM)
; vibration optimization
1. Introduction
Re-entrant honeycomb structures are widely employed structural designs with numerous applications across various industries. These structures are usually found in lattice forms. However, in this study, inspired by the re-entrant honeycomb structure, we considered a single form (unit cell) of the re-entrant structure as a frame structure, which is used as a machine foundation for vibration reduction. We conducted both numerical and experimental modal analyses to examine the variations in the natural frequencies of the re-entrant structure-shaped steel frames with respect to the frame beam cross section dimensions and the frame angle. Both numerical calculations and experimental work were performed to determine how the natural frequency changes with respect to the beam cross-sectional dimensions and frame angle. Frame models with different beam cross section dimensions and main frame angles were created via 3D modeling software. Modal analyses were subsequently conducted for each model using the finite element method. In total, 20 distinct frame models were created to determine a valid relationship between the modal frequency and geometrical configurations. Experimental modal analyses were conducted to verify the finite element model results. As an introduction, a brief literature review of re-entrant honeycomb structures is presented.
Lian et al. [1] highlighted that implementing a hierarchical design in cell materials can enhance their energy absorption capabilities. They noted that materials with a negative Poisson’s ratio exhibit outstanding energy absorption potential and have a unique deformation mode. This paper presents augmented double-arrow honeycomb structures integrated into the re-entrant honeycomb, which possesses a negative Poisson’s ratio, serving as a substructure to increase the mechanical properties of the first-order re-entrant honeycomb and improve the energy absorption performance of the overall structure.
Elsamanty et al. [2] reported that auxetic structures were created for numerous applications. Because of their diverse uses, various studies have explored their static and dynamic properties. This paper outlines the findings from a numerical investigation of the dynamic characteristics of a re-entrant honeycomb auxetic structure in relation to its geometric parameters.
According to Baran [3], materials that exhibit a negative Poisson’s ratio are referred to as auxetics. These auxetics can be designed with various sizes, ranging from micro- to macrostructures. However, the application of auxetics in civil engineering has been explored only to a limited degree. This study uses a medium-sized re-entrant auxetic structure to enhance a reinforced concrete beam.
Rathore et al. [4] noted that the scarcity of building space in the prime locations of major cities has prompted architects to design asymmetrical buildings. These structures are intended to achieve optimal performance during earthquakes. However, their irregular shapes present unique challenges for structural engineers, who must ensure that buildings can withstand lateral forces and function effectively under these demanding conditions, safeguarding both the structure and its occupants. This study examines a building with an irregular L-shaped plane featuring a re-entrant corner. A total of 31 models are analyzed, which include 15 variations: five frames with different heights and brick infills, five frames of varying heights with brick infills and a shear wall at the core, and five frames with varying heights, brick infills, and shear walls integrated into the plan. Additionally, these 15 variants are re-evaluated by substituting the brick infills with AAC blocks to assess the decrease in seismic weight, alongside one regular RC frame for comparison.
Günaydın et al. [5] conducted a study examining the impact of various materials on hexagonal and re-entrant (auxetic) cellular structures. For each topology, they utilized three distinct material configurations: (a) nylon, (b) carbon fiber-reinforced nylon, and (c) glass fiber-reinforced nylon. A numerical model was developed to simulate the compressive behavior of these multimaterial cellular structures under quasistatic loading.
Goryachev et al. [6] illustrated the capabilities of a large-scale multipost re-entrant cavity via two case studies conducted with the same physical setup.
Le Floch et al. [7] asserted that cylindrical re-entrant cavities possess distinct three-dimensional characteristics, resonating with electric and magnetic fields in different sections of the cavity.
In their study, Fan et al. [8] analyzed the properties of resonant modes within a reentrant cavity structure comprising a post and a ring, which they confirmed through experimental verification.
In their study, Ma et al. [9] introduced an innovative hierarchical re-entrant honeycomb metamaterial by incorporating a square unit cell into the standard re-entrant honeycomb design, termed the square re-entrant honeycomb (SRH). This advanced structure enhances energy absorption capabilities and offers superior vibration insulation compared with the traditional RH model. The dynamic crushing behaviors of the SRH structures are examined theoretically and numerically. The results show that the theoretical plateau stress aligns well with the numerical findings. Additionally, the deformation modes and energy absorption capacities of traditional RH and square re-entrant honeycombs (SRHs) are analyzed at varying impact velocities.
Peng et al. [10] examined the flexural vibration behavior of a composite sandwich plate featuring a reentrant honeycomb core (CSP-RHC), noting that the impact of a negative Poisson’s ratio (NPR) on its dynamic attributes is still not well understood. This study analyzes the flexural vibration of the CSP-RHC using the 2D homogenized plate model (2D-HPM) through the variational asymptotic method, which derives effective plate properties by homogenizing the unit cell of the CSP-RHC. The accuracy and efficiency of the free flexural vibration results produced by the 2D-HPM are validated through comparisons with 3D finite element method (3D-FEM) results across various boundary conditions, and the effects of selected parameters on the free vibration characteristics of the CSP-RHC are examined.
Gao et al. [11] proposed an enhanced re-entrant negative Poisson’s ratio metamaterial fabricated through a combination of 3D printing and machining. Compared with its traditional counterpart, this improved metamaterial demonstrates superior load-carrying and vibration isolation capabilities.
Suthar and Purohit [12] noted that reinforced concrete (RC) buildings featuring plan and/or vertical irregularities are frequently constructed around the globe, even though they are susceptible to seismic forces. Although irregular RC buildings exhibiting asymmetry, as well as mass and stiffness inconsistencies, have been extensively studied, the seismic performance of RC buildings with re-entrant corner plan irregularities has received less attention. This study develops 104 RC building models that prominently feature re-entrant corners (shaped like C, L, T, and PLUS), in addition to one regular rectangular structure. The plan irregularity descriptors (PIDs) are compiled with their regularity limits and assessed for these building models.
Teng et al. [13] highlighted that re-entrant hexagonal honeycombs, an auxetic structure type, possess exceptional mechanical properties. However, most research has concentrated on two-dimensional (2D) re-entrant designs or three-dimensional (3D) structures, which often lack significant compressibility. This results in insufficient energy absorption capacity for practical use. Hence, exploring 3D re-entrant honeycomb structures capable of enduring large deformations is crucial for optimizing material utilization. This study focuses on the design, manufacturing, and analysis of a straightforward 3D re-entrant unit cell. The effects of geometric parameters on deformation modes and energy absorption capacity are assessed numerically, with experimental findings aligning closely with finite element predictions.
Farshbaf et al. [14] explored two structural types: re-entrant auxetic honeycomb and nonauxetic hexagonal honeycomb. They perform thorough deformation analyses in both 2D plane strain and 3D, utilizing linear triangular and tetrahedral multifield displacement‒pressure elements. The findings concerning the re-entrant auxetic structure align with the anticipated behavior, revealing a negative Poisson’s ratio and superior energy absorption efficiency compared with the hexagonal honeycomb.
Ergene and Yalçın [15] contend that advancements in technology demand innovative manufacturing techniques and lightweight, effective, and practical structural solutions to meet industrial requirements. Recently, the distinct properties of honeycomb and re-entrant (auxetic) cellular structures, such as energy and vibration absorption, resistance to indentation, uniform load distribution, and prospective application in sandwich composite structures, have been investigated.
In their research, Mustahsan et al. [16] presented a modified re-entrant honeycomb auxetic structure aimed at improving overall compliance and achieving a higher negative Poisson’s ratio (NPR). This structure is created by inserting a horizontal member between the vertical and re-entrant members of the semire-entrant honeycomb model, thereby enhancing compliance and reaching superior NPR values. An analytical model of the structure considers bending, shear, and axial deformations. The model’s validity is confirmed through finite element analysis (FEA) and tensile testing.
Choi and Park [17] described the re-entrant hexagonal structure as one of the most utilized auxetic metamaterials, recognized for its unique deformation characteristics and negative Poisson’s ratio. The Poisson’s ratio in these re-entrant auxetic structures changes depending on the design of the re-entrant shape and the deformation order. This study examined the deformation behavior of re-entrant auxetic structures through both experimental and numerical methods, modifying the re-entrant angle. The results from the experiments indicated that the Poisson’s ratio increased with a decrease in the re-entrant angle, maintaining auxetic properties only while a re-entrant cell exhibited a concave shape. Additionally, finite element analyses (FEAs) were performed to assess the deformation behavior of the re-entrant structures, employing 1D-beam and 2D-continuum elements.
Chen et al. [18] introduced a new auxetic honeycomb design featuring self-similar inclusions within a traditional re-entrant hexagonal framework. They created theoretical models to analyze the elastic mechanical properties of both types of auxetic honeycombs. This innovative re-entrant honeycomb exhibits improved auxeticity and stiffness relative to those of the original design. The in-plane compressive behavior of these auxetic structures is examined using both experimental and numerical simulation techniques, revealing strong consistency between the results.
Ma et al. [19] reported that origami honeycomb metamaterials have recently attracted considerable interest from researchers. These re-entrant origami honeycomb metamaterials exhibit outstanding mechanical performance owing to their lightweight nature, exceptional energy absorption capabilities, and varied configurations. This study involves the design of gradient re-entrant origami honeycomb metamaterials through adjustments to essential geometric parameters.
Shen et al. [20] examined the mechanical performance of a newly introduced 3D re-entrant lattice auxetic structure subjected to bending loads. This innovative structure enhances the design possibilities for 3D auxetic structures, particularly in energy absorption and impact protection applications.
Hedayati et al. [21] highlighted that 2D and 3D re-entrant designs are well-known auxetic structures characterized by a negative Poisson’s ratio. This study presents new analytical relationships for 2D re-entrant hexagonal honeycombs that are applicable to both negative and positive ranges of the cell interior angle.
Bai et al. [22] proposed an innovative construction method for vertically asymmetric reentrant honeycombs (VAREHs). They derived general analytical expressions for its elastic parameters, which apply to all VAREH variants, including reentrant hexagonal (REH) honeycombs. Additionally, they perform parametric analyses and benchmark these against finite element (FE) simulations. To validate the elastic mechanical properties of VAREH created through 3D printing, uniaxial tension experiments were also conducted.
In their study, Széles et al. [23] proposed a novel doubly re-entrant auxetic unit-cell design derived from the widely utilized auxetic honeycomb structure. Their objective is to develop a structure that preserves and amplifies the advantages of the auxetic honeycomb while mitigating all negative aspects.
Zhang et al. [24] examined the nonlinear transient responses of an auxetic honeycomb sandwich plate under dynamic impact loads. They formulate partial differential equations for a honeycomb sandwich plate using Reddy’s higher shear deformation theory and Hamilton’s principle. Their findings indicate that a honeycomb sandwich plate with a negative Poisson’s ratio performs better than one with a positive ratio for specific structures subjected to dynamic loads.
Dudek et al. [25] introduced a novel hierarchical mechanical metamaterial composed of re-entrant truss-lattice elements. This system can deform in various ways and displays a versatile range of auxetic behavior depending on slight changes in the thickness of its hinges. Additionally, based on which hierarchical level is deforming, the entire structure can exhibit a distinct type of auxetic behavior corresponding to a unique deformation mechanism.
In this study, in contrast to lattice forms, inspired by the re-entrant honeycomb structure, we analyzed a single form (unit cell) of the re-entrant structure as a frame and conducted experimental and finite element modal analyses with respect to the frame beam cross section dimensions and the main frame angle.
2. Re-Entrant Frame Models
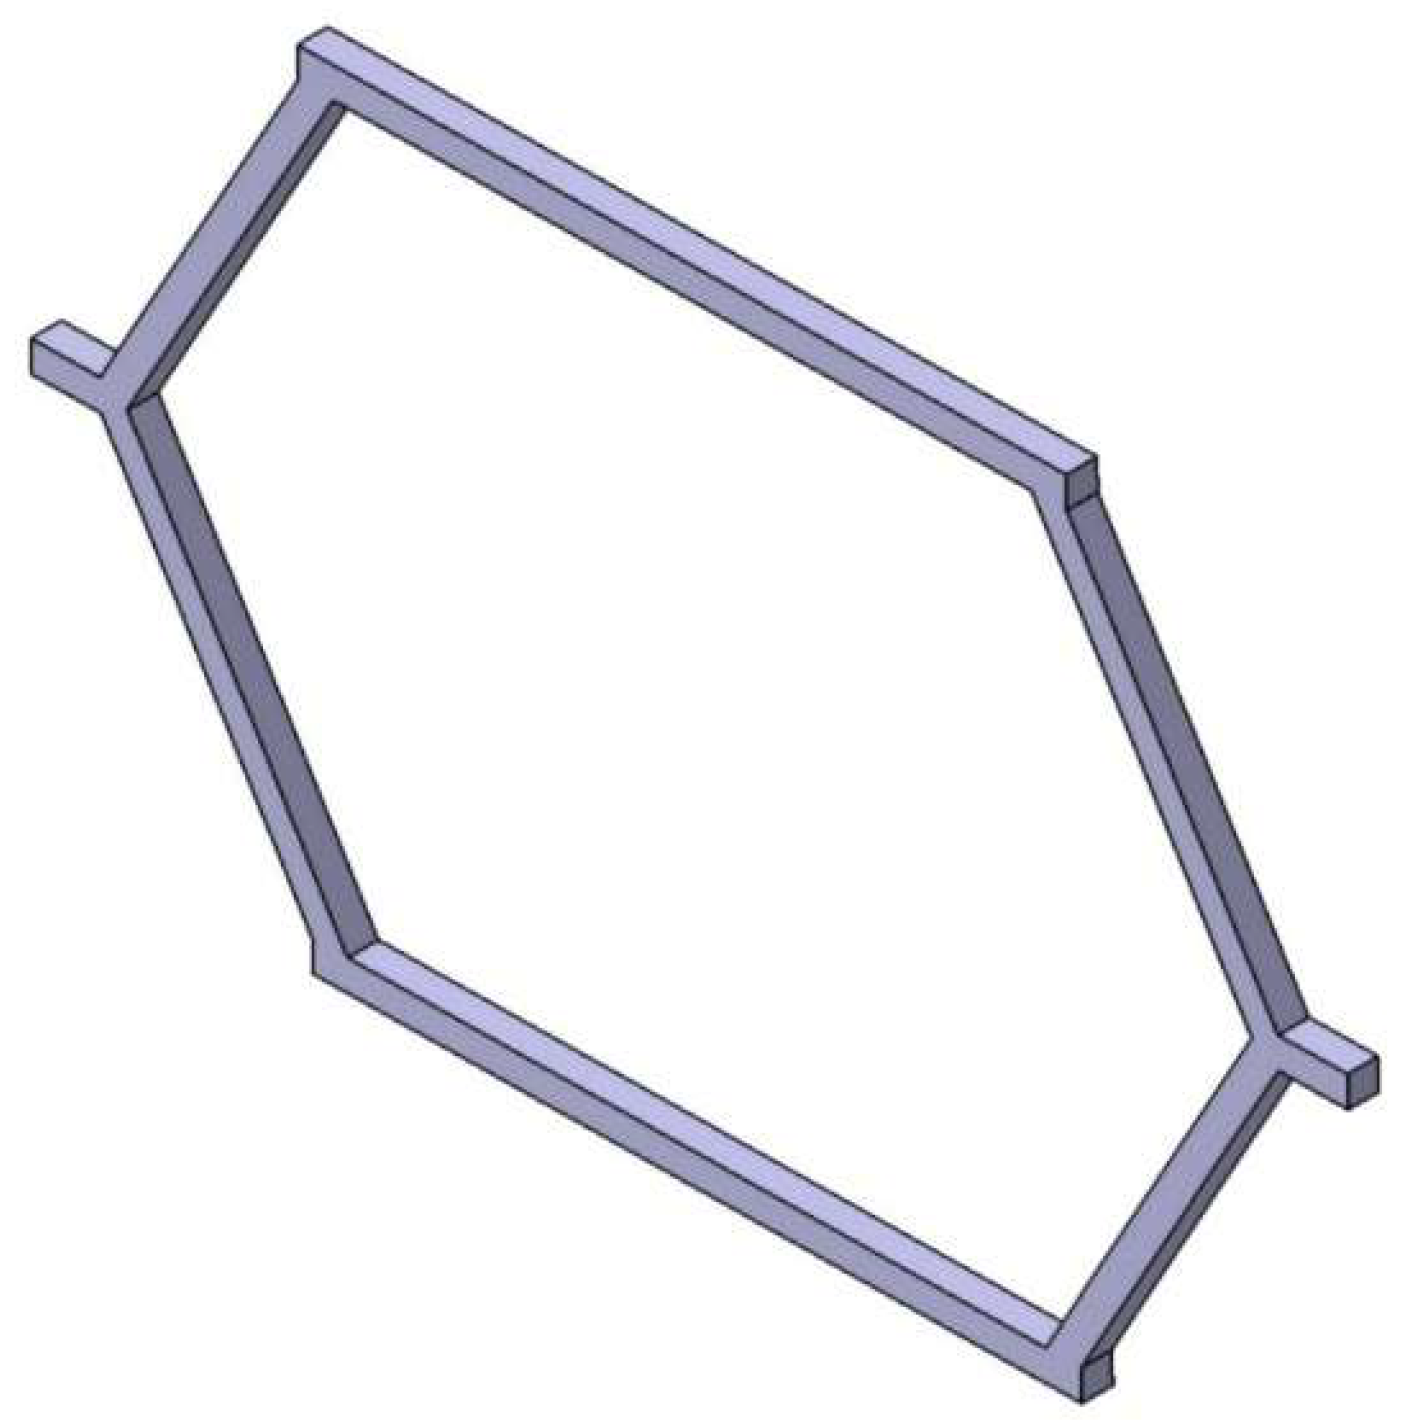
To determine the variation in the natural frequency of re-entrant steel frames with respect to the frame beam cross section dimensions and the frame angle, 20 distinct re-entrant frame models were created. The structure of the frame is shown in Figure 1.
As shown in Figure 1, each re-entrant steel frame was constructed with 6 beams with dimensions of 4x4 mm, 8x8 mm, 12x12 mm and 16x16 mm full square cross sections. The main frame angle (α) varied from 120° to 240°, increasing at 30° intervals. In total, 5 frame angle values were examined for each beam cross section dimension value. The width and height of the frame were chosen as constant values for all the models: 400x400 mm. The models with main frame angles of 120° and 150° were named re-entrant models, as shown in Figure 2 and Figure 3, and the models with main frame angles of 210° and 240° were named hexagonal models, as shown in Figure 5 and Figure 6. The model with a main frame angle of 180°, which is called the straight model, is also shown in Figure 4.
Figure 2.
Three-dimensional solid model of a 1200 frame (beam dimensions = 12x12 mm), which is designated Frame 12x12-120.
Figure 2.
Three-dimensional solid model of a 1200 frame (beam dimensions = 12x12 mm), which is designated Frame 12x12-120.
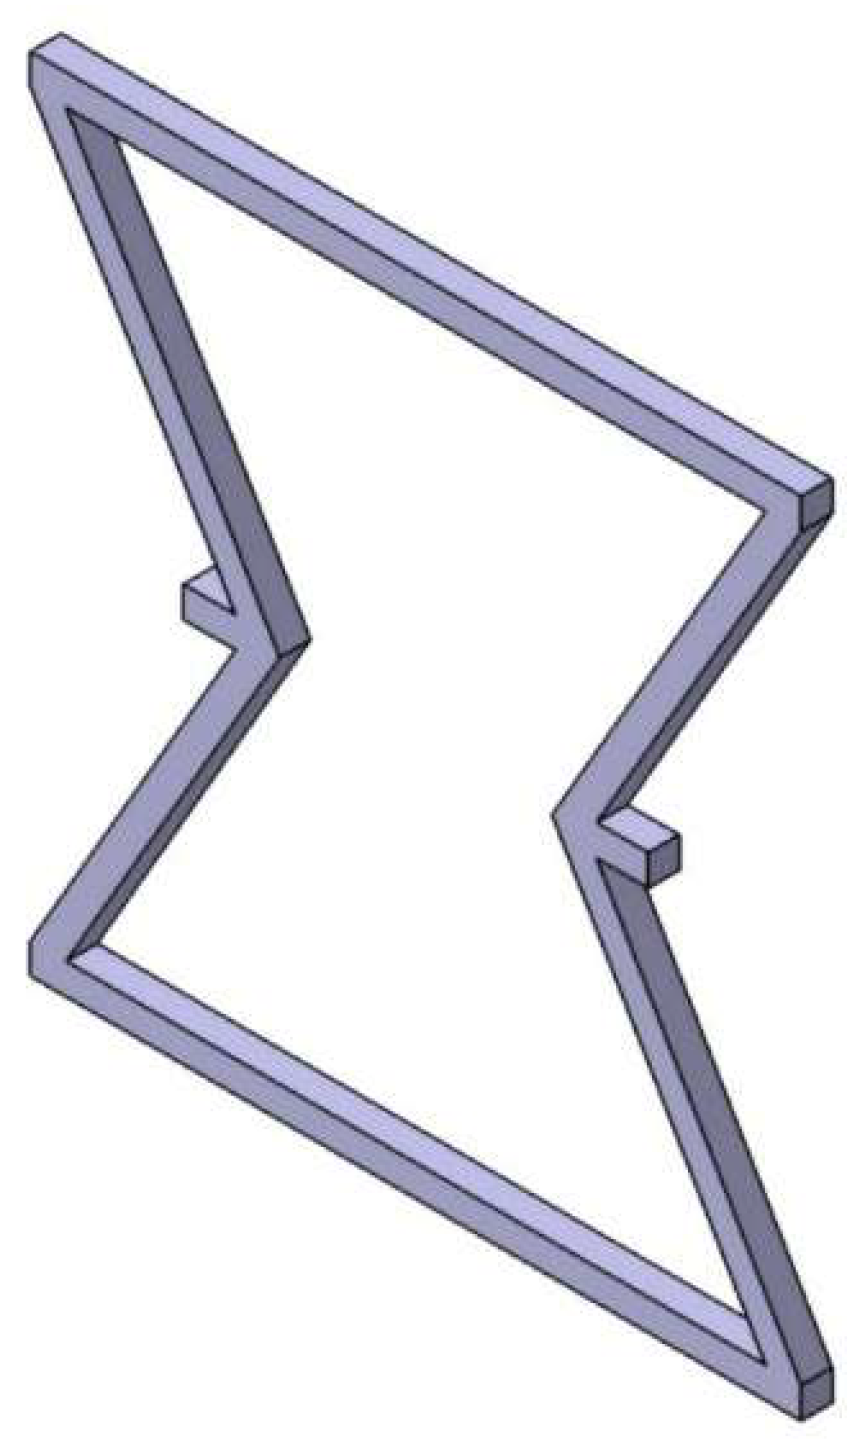
Figure 3.
Three-dimensional solid model of a 1500 frame (beam dimensions = 12x12 mm), which is designated Frame 12x12-150.
Figure 3.
Three-dimensional solid model of a 1500 frame (beam dimensions = 12x12 mm), which is designated Frame 12x12-150.
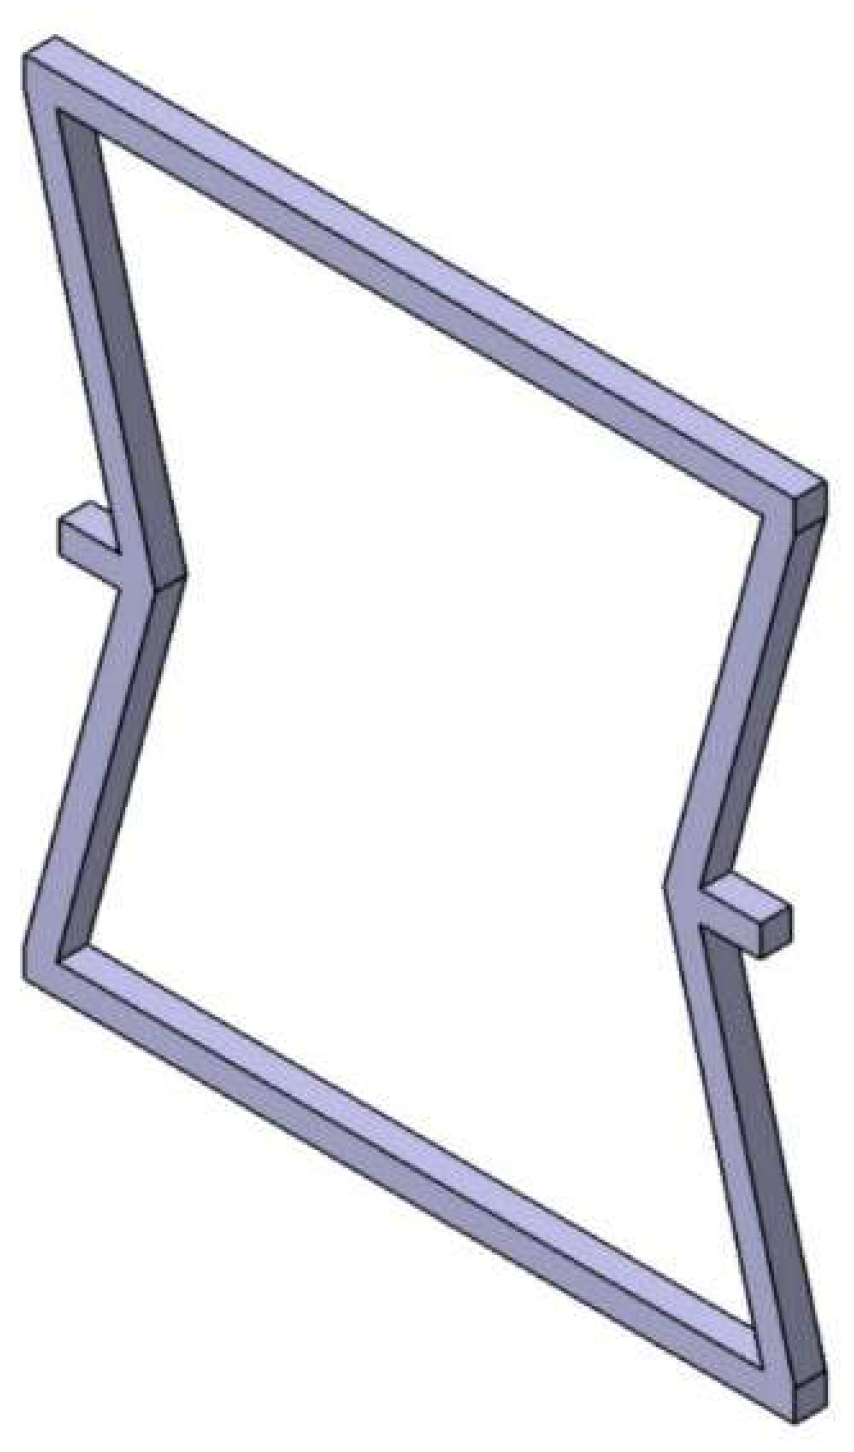
Figure 4.
Three-dimensional solid model of a 1800 frame (beam dimensions = 12x12 mm), which is designated Frame 12x12-180 (straight model).
Figure 4.
Three-dimensional solid model of a 1800 frame (beam dimensions = 12x12 mm), which is designated Frame 12x12-180 (straight model).
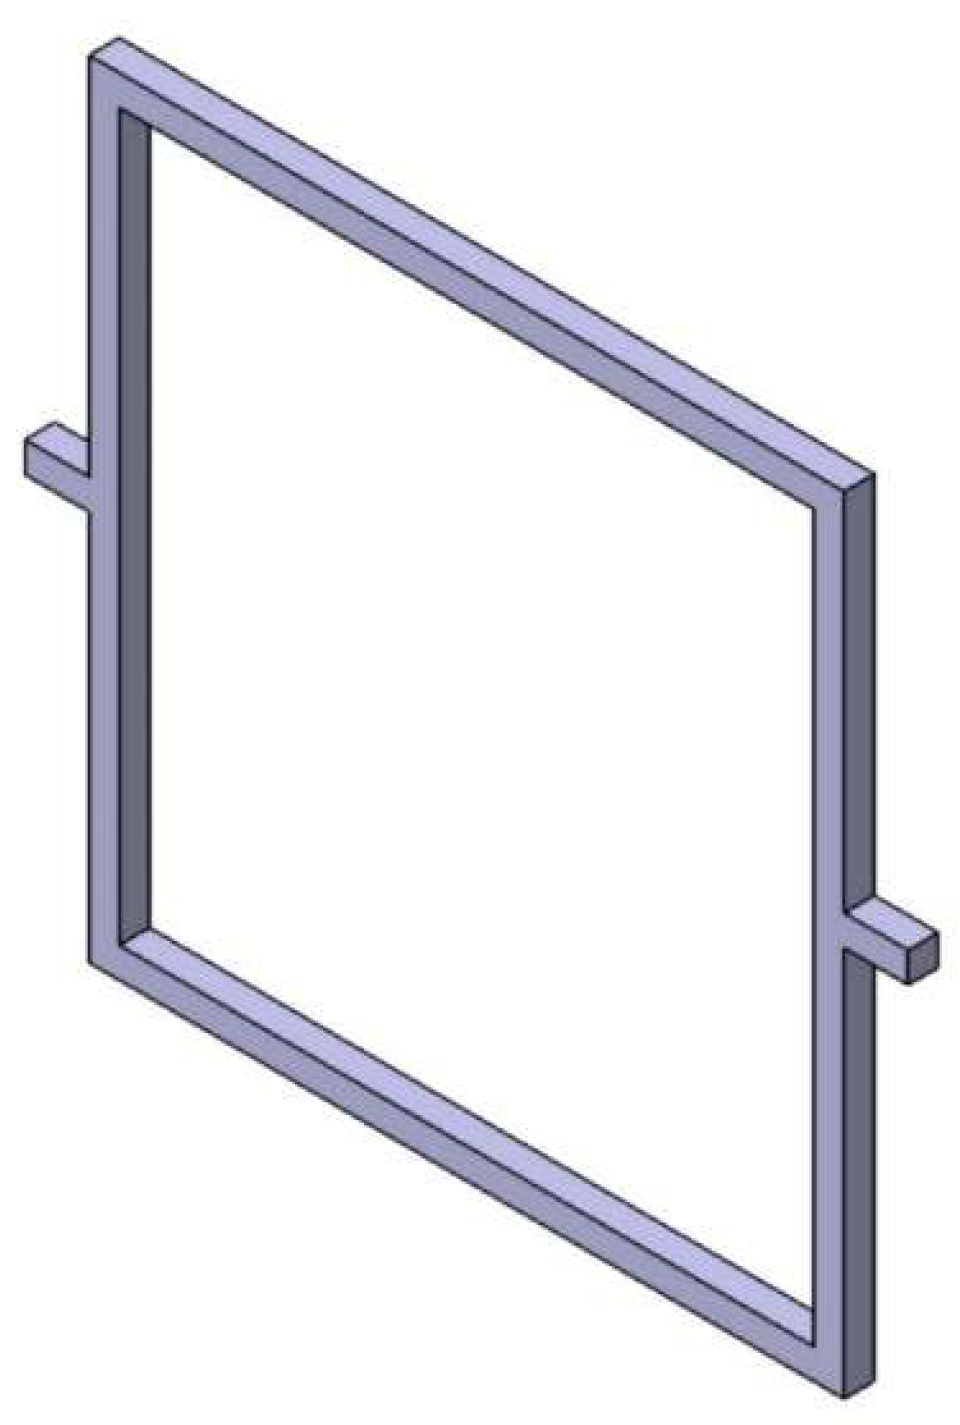
Figure 5.
Three-dimensional solid model of a 2100 frame (beam dimensions = 12x12 mm), which is designated Frame 12x12-210.
Figure 5.
Three-dimensional solid model of a 2100 frame (beam dimensions = 12x12 mm), which is designated Frame 12x12-210.
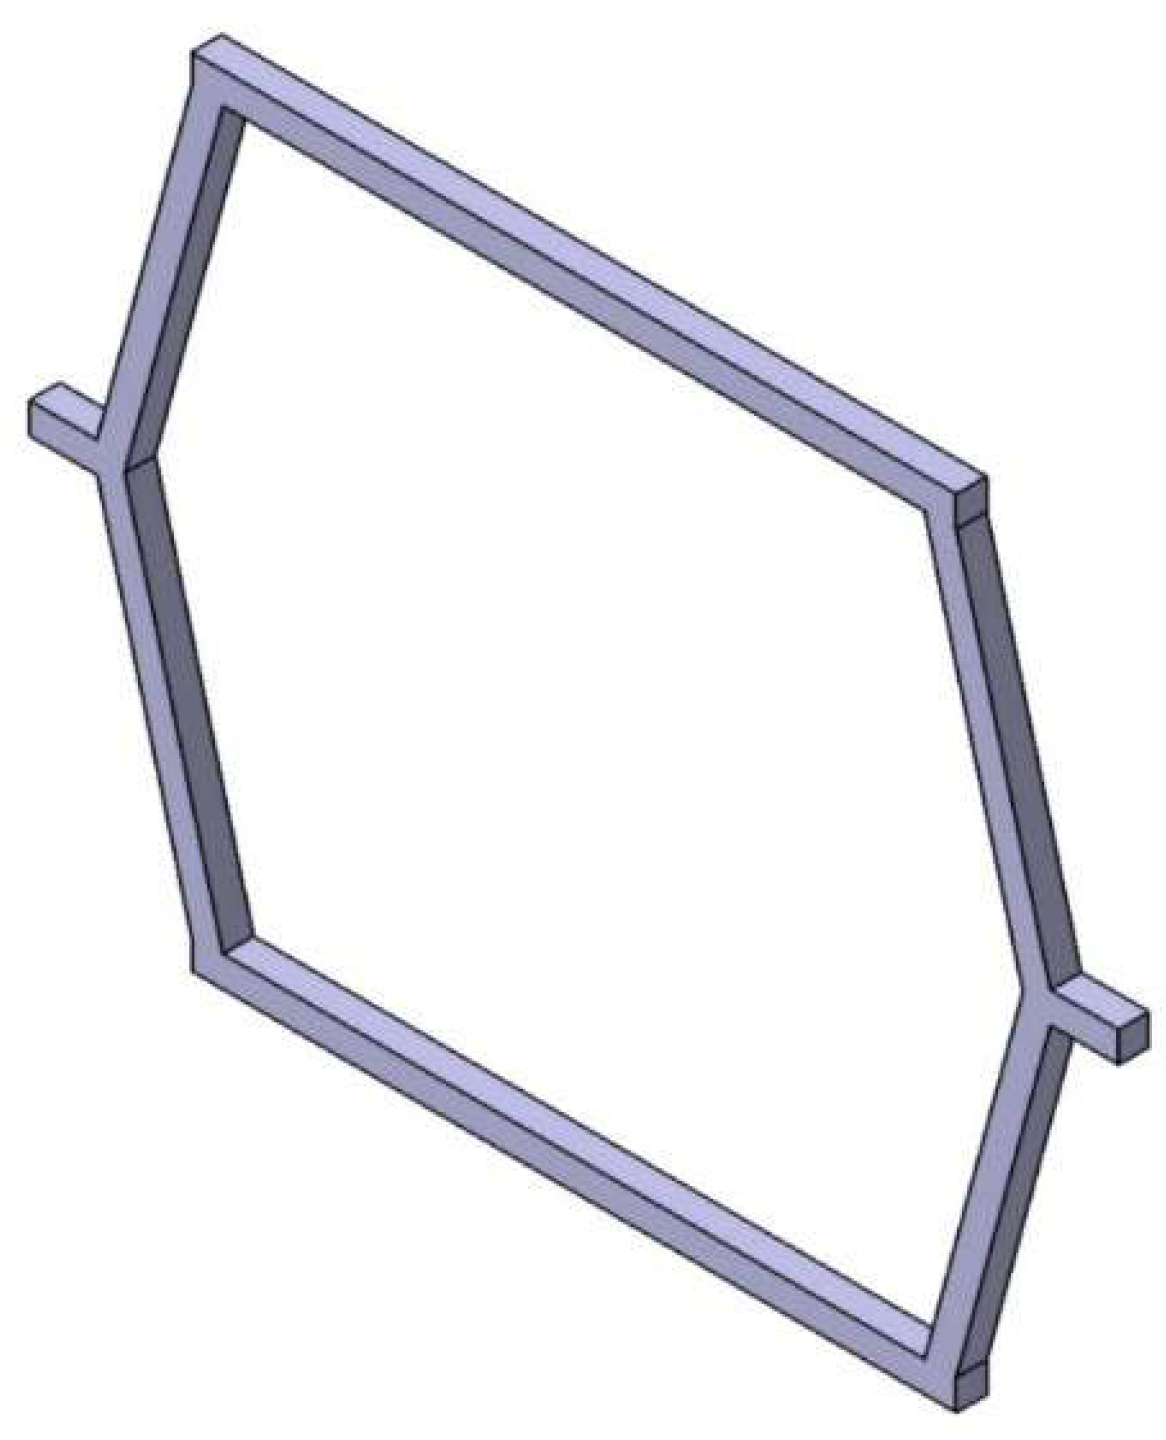
Figure 6.
Three-dimensional solid model of a 2400 frame (beam dimensions = 12x12 mm), which is designated Frame 12x12-240.
Figure 6.
Three-dimensional solid model of a 2400 frame (beam dimensions = 12x12 mm), which is designated Frame 12x12-240.
The models were named according to the beam cross-sectional dimension value of the frame beams and the frame main angle (α). For example, Frame 12x12-150 corresponds to the re-entrant steel frame model in which the main frame angle (α) is 150° and consists of beams with 12x12 mm square cross-sections. All 20 re-entrant frame models were drawn and modeled using the commercial 3D solid modeling software DS CATIA. Therefore, 20 distinct models were obtained to conduct finite element modal analysis.
3. Numerical (Finite Element) Analyses
After the assembled 3D solid models of the 20 re-entrant frames were obtained, they were imported into the commercial finite element analysis software program ANSYS for natural frequency and mode shape analyses. The approximate mesh size of the finite element models was 2 mm. The meshed finite element model of Frame 12x12-150 is shown in Figure 7. Linear hexahedral and tetrahedral solid elements were applied in the mesh, and the material properties are as follows:
- Density: 7,850 kg/m3
- Poisson’s ratio: 0.3
- Young’s modulus: 200,000 MPa
- Boundary condition: clamped-clamped
The frame models are clamped at both ends of the midhandles, which act as connections between unit cells in lattice forms.
For each analysis, the first eight eigenvalues (natural frequencies) were extracted. The first eight eigenvalues, which correspond to the first eight natural frequencies of a given structure, were derived by solving the eigenvalue problem formed from the mass and stiffness matrices of the structure. This process begins by establishing the governing equation of motion for undamped, free vibration: , where is the stiffness matrix, is the mass matrix, and denotes the eigenvalues (squared natural frequencies). Solving this generalized eigenvalue problem yields a set of eigenvalues and their associated eigenvectors. The square roots of the eigenvalues yield the natural frequencies in radians per second, which can be converted into Hz. The first eight eigenvalues refer to the eight lowest-frequency modes of vibration, which are typically the most significant for analyzing structural behavior, especially for systems with multiple degrees of freedom. These are ordered from lowest to highest frequencies and are usually the most energetic modes that notably contribute to the dynamic response of the system. The natural frequencies of all 20 re-entrant models are provided in Table 1.
Each eigenvalue is associated with a certain mode shape that describes the deformation pattern of the structure at that frequency. The modal superposition technique was employed to obtain mode shapes. Modal superposition technique is a fundamental method in structural dynamics that can be used to simplify and solve the equations of motion for complex structures. Rather than solving the full dynamic system directly, this approach aims to transform the problem into a set of uncoupled, simpler single-degree-of-freedom systems by using the natural modes of vibration of the system. This is possible because the natural mode shapes form an orthogonal basis, allowing the total dynamic response to be expressed as a sum (superposition) of individual modal contributions. In the case of Frame 12x12-150, the first eight natural frequencies were extracted, and their corresponding mode shapes are shown in Figure 8.
The first eight mode shapes of the re-entrant frame model with 12×12 mm beam cross-sections and a main frame angle of 150° (Frame 12x12-150) reveal valuable insights into the dynamic behavior of the structure. These modes can be interpreted as follows.
The mode shapes of the re-entrant frame model Frame 12×12-150 provide crucial insight into the dynamic behavior of the structure across a broad frequency range. The first mode, occurring at 63.34 Hz, is characterized by a global lateral sway, where the entire frame bends side to side within its plane, showing significant displacement at the top and bottom members, whereas the midhandle, constrained by clamped boundary conditions, remains stationary. This low-frequency, highly flexible mode is particularly critical for dynamic responses under seismic or wind loads and is sensitive to changes in frame geometry and stiffness. The second mode, at 101.34 Hz, demonstrates an out-of-plane bending motion, with the frame flapping forward and backward perpendicular to its initial plane. This mode indicates the frame’s out-of-plane flexibility, which is essential for understanding vulnerability to lateral-torsional buckling and dynamic blast loads. The third mode, at 107.30 Hz, transitions into a torsional deformation pattern where the frame twists about its vertical centroidal axis, with the top and bottom members rotating in opposite directions. This torsional response highlights potential vulnerabilities to asymmetric or rotational excitations and necessitates careful attention in design to ensure torsional stiffness. The fourth mode, at 123.87 Hz, introduces a more complex bending pattern with multiple nodes and anti-nodes along the frame height, suggesting a higher-order flexural response that could lead to localized stress concentrations and fatigue under cyclic loading. As we move into higher modes, the fifth mode at 147.60 Hz shows coupled behavior combining bending and torsion, resulting in asymmetric deformation where the two sides of the frame move differently. This complex dynamic coupling becomes crucial under multidirectional or irregular loading conditions. The sixth mode, at 172.93 Hz, reflects localized bending predominantly within individual beams, where the upper and lower beams bend in opposite directions. This local mode is vital for identifying zones susceptible to local buckling or yielding under dynamic loads. In the high-frequency range, the seventh mode at 296.90 Hz is a high-order global flexural mode with multiple wave-like deformations, which is indicative of the behavior of the frame under high-frequency vibrations or impact loads. Finally, the eighth mode at 301.91 Hz portrays a highly localized and complex pattern involving both bending and twisting in confined sections of the frame, revealing the structure’s sensitivity to localized dynamic instabilities and manufacturing imperfections. Overall, the progression of the mode shapes from global, rigid-body-like deformations at lower frequencies to highly localized, complex patterns at higher frequencies underscores the importance of considering both global and local dynamic behaviors in the design. Low-order modes govern serviceability and structural integrity under common dynamic loads, whereas higher-order modes are critical for fatigue resistance, local stress evaluation, and ensuring robustness against high-frequency excitations. A comprehensive understanding and interpretation of these mode shapes are essential for optimizing the frame’s design for dynamic performance, ensuring both global stability and local durability across the expected operational load spectrum. All mode shapes for all beam section dimensions and frame angles were investigated, and the same mode shapes were found to appear in the same order of mode number. Therefore, the general observations of mode shapes are as follows. Across all re-entrant frame models, the mode shapes consistently follow a clear progression from global to local deformation behaviors as the mode number increases. The first and second modes are dominated by global bending — with the first mode typically exhibiting in-plane lateral sway and the second mode showing out-of-plane bending — representing the most flexible, large-scale motions of the frame. These low-frequency modes are critical for assessing the overall stability and serviceability of frames under common dynamic loads such as wind or seismic excitations. The third mode generally introduces a torsional response, indicating the frames’ susceptibility to twisting motions about their vertical axis, which becomes an important factor in resisting asymmetric or eccentric dynamic loads. Higher-order modes, starting from the fourth mode onward, display increasingly complex deformation patterns, involving a combination of higher-order bending and torsion, as well as localized beam bending. These modes reveal the frames’ behavior under more demanding dynamic conditions, where local deformations, stress concentrations, and potential failure zones become more pronounced. The highest modes exhibit highly localized distortions with multiple nodes and antinodes, suggesting vulnerability to high-frequency vibrations, impacts, or fatigue-inducing loads. Overall, all re-entrant frames share a dynamic behavior where lower modes govern the global motion and dynamic response, whereas higher modes expose the frames’ local flexibility and critical areas for structural refinement. Understanding this general modal behavior is essential for designing re-entrant frame structures to ensure both global dynamic stability and local durability across various operating conditions.
In Figure 9, Figure 10, Figure 11 and Figure 12, the variation in the natural frequency with respect to the frame angle is shown for the 4x4 mm, 8x8 mm, 12x12 mm and 16x16 mm full square cross section values. Each graph shows how the first eight natural frequencies change as the frame angle increases from to , highlighting the significant influence of both the geometric configuration and cross-sectional dimensions on the dynamic behavior of the frame structure.
Figure 9, Figure 10, Figure 11 and Figure 12 illustrate how the first eight natural frequencies of the re-entrant frame structures vary with the frame angle for different cross-sectional dimensions—4×4 mm, 8×8 mm, 12×12 mm, and 16×16 mm. In Figure 9, corresponding to the smallest cross-section (4×4 mm), the frames exhibit the lowest natural frequencies across all the modes, indicating the highest flexibility. A clear trend is visible where the natural frequencies decrease as the frame angle approaches 180°, where the structure transitions to a straight configuration, and then increase again as the angle extends beyond 180° into the hexagonal range. This behavior reflects the frame becoming most compliant in the straight configuration and regaining stiffness as it moves toward the hexagonal form. In Figure 10, for the 8×8 mm cross section, a similar trend is observed, but the natural frequencies are higher due to increased stiffness. Moreover, the variations in the higher modes (especially Modes 5 to 8) are steeper, suggesting that these modes are more sensitive to geometric changes. Figure 11, which represents the 12×12 mm cross-section, shows further increases in frequency, and the decrease near 180° is less pronounced, indicating that the structure maintains greater stiffness even in its most compliant configuration. The mode separation also becomes clearer, with higher modes remaining relatively elevated across all angles. Finally, in Figure 12, for the largest cross-section of 16×16 mm, the frames exhibit the highest overall natural frequencies, and the variation with respect to the frame angle becomes minimal. The dip near 180° is barely noticeable, suggesting that the structure has become dynamically robust, less sensitive to geometric changes, and highly resistant to dynamic instabilities and resonance phenomena. Overall, as cross-sectional size increases, the natural frequencies rise significantly, and the influence of the frame angle on dynamic behavior diminishes. The re-entrant frames (angles less than 180°) tend to be stiffer than the hexagonal frames (angles greater than 180°) for the same cross-section. These trends collectively highlight that increasing the cross-sectional dimensions not only enhances global stiffness but also stabilizes the dynamic response across varying geometrical configurations, making the frames more resilient under different loading and vibration conditions. The combined effect of the frame geometry (angle) and beam cross-sectional dimensions plays a critical role in determining the dynamic characteristics of re-entrant frames. These observations have important implications for the practical design and optimization of re-entrant frame structures. The clear relationship between cross-sectional size and dynamic stability suggests that selecting larger beam cross-sections significantly enhances both the natural frequencies and the robustness of the frames against dynamic loads. Designers aiming for vibration-resistant structures should prioritize increasing the cross-sectional dimensions to not only increase the global stiffness but also minimize the sensitivity of the structure to geometrical variations such as changes in the frame angle. Particularly for applications involving variable loading directions or environments where dynamic excitations are prevalent—such as machine foundations, aerospace structures, or vibration isolation systems—employing thicker cross-sections can effectively mitigate the risk of resonance and fatigue. Furthermore, since the frames are most flexible near the 180° straight configuration, careful consideration should be given to operating conditions or structural deployments that approach this geometry. Reinforcements or hybrid designs combining increased cross-sectional size with strategic bracing may be warranted in such cases. Ultimately, the combination of optimal frame angle selection and appropriately sized beam cross-sections offers a powerful means to tailor the dynamic performance of re-entrant structures, ensuring both durability and operational reliability across a wide range of applications.
In Figure 13, Figure 14, Figure 15, Figure 16 and Figure 17, the variations in the natural frequencies with respect to the cross-sectional dimensions for each frame angle are given.
Figure 13, Figure 14, Figure 15, Figure 16 and Figure 17 present the variation in the first eight natural frequencies of the re-entrant frame models as a function of the beam cross-sectional dimensions for different frame angles—120°, 150°, 180°, 210°, and 240°. For the 120° frame (Figure 13), a sharp increase in natural frequency is observed with increasing cross-section, particularly from 4×4 mm to 8×8 mm, reflecting the inherently flexible nature of the re-entrant geometry and the significant benefit gained from modest increases in beam thickness. Similarly, the 150° frame (Figure 14) demonstrates a steady rise in frequency with increasing cross-section, although the slope is slightly less steep than that of the 120° frame, suggesting a moderate initial stiffness and a balanced improvement across all modes as the beams thicken. The straight frame at 180° (Figure 15) has the lowest natural frequency for a given cross-section, with a less steep increase in frequency as the beam dimensions increase, highlighting the geometric disadvantage of the straight configuration in terms of dynamic performance; even with thicker beams, the stiffness gain remains limited compared with that of other configurations. For the hexagonal configurations, the 210° frame (Figure 16) shows higher initial frequencies and a more pronounced increase with cross-sectional growth, especially for higher modes, indicating that the favorable geometry synergizes with material enhancements to achieve better dynamic stiffness. The 240° frame (Figure 17) exhibits the highest natural frequency overall, with strong and consistent gains as the cross-section increases, demonstrating the excellent dynamic performance that results from the combination of a wide hexagonal geometry and increased material volume. Overall, the general trend across all frame angles is that natural frequencies rise significantly with increasing cross-sectional size, but the rate and extent of improvement are highly dependent on the frame angle. Re-entrant frames (120° and 150°) show rapid initial stiffness gains, straight frames (180°) lag in dynamic performance, and hexagonal frames (210° and 240°) benefit most consistently, achieving high natural frequencies across all modes. Additionally, higher-order modes (Modes 5–8) are more sensitive to cross-sectional changes, especially in stiffer, hexagonal configurations. These results emphasize the critical role of both the cross-sectional dimension and frame geometry in optimizing the dynamic characteristics of re-entrant structures for various engineering applications.
The results shown in Figure 13, Figure 14, Figure 15, Figure 16 and Figure 17 suggest clear strategies for optimizing the design of re-entrant frame structures to enhance their dynamic performance. To achieve higher natural frequencies and improved resistance to dynamic excitations, increasing the cross-sectional dimensions of the beams is recommended, as this consistently results in significant gains in stiffness and vibrational resistance across all frame angles. However, the choice of frame geometry plays an equally crucial role. While re-entrant frames with angles such as 120° and 150° benefit from initial rapid stiffness gains with increasing beam size, their dynamic performance remains inherently limited compared with that of hexagonal configurations. In contrast, frames with larger angles, such as 210° and 240°, not only start with higher base stiffness due to their favorable geometry but also respond more effectively to cross-sectional enhancements, achieving superior dynamic stability across all modes. The straight frame (180°), on the other hand, consistently exhibits the lowest natural frequencies and demonstrates limited improvements even with larger cross-sections, indicating that it should be avoided in applications where the dynamic performance is critical. Additionally, since higher-order modes are more sensitive to cross-sectional increases, designs aiming to control or suppress higher-frequency resonances—such as those exposed to impact loads or machine-induced vibrations—will particularly benefit from thicker beam sections. Therefore, for optimal vibrational performance, a combination of selecting a hexagonal frame geometry and maximizing the beam cross-sectional dimensions is recommended, ensuring both global stiffness and local durability in dynamically demanding environments.
A quadratic polynomial surface regression analysis was also conducted on the modal results of all the models (Table 1), and an function was obtained to calculate the natural frequency for a given cross-sectional dimension and main frame angle. The quadratic polynomial surface regression program was written in MATLAB. The quadratic polynomial surface regression analysis conducted in this study is an effective curve-fitting technique for modeling the relationship between natural frequencies (f) and two independent variables: the cross-sectional dimension (b) and the main frame angle (α). By applying this method to the modal data from all structural models listed in Table 1, a comprehensive mathematical representation of how natural frequencies vary across different geometric configurations was developed. The main function is as follows:
where the input and output variables are as follows:
α: Main frame angle (degrees);
b: Beam cross-sectional dimension (mm) (for example; b is equal to 12 for the 12x12 beams); and
f: Natural frequency (Hz).
A custom MATLAB program was written to perform this regression analysis. The modal data for each mode (Modes 1 through 8) were substituted into the model, and the polynomial equation was fitted to the data points using least squares estimation, thereby minimizing the overall error between the model results and actual data. The result is a unique set of 6 polynomial coefficients (p values) for each mode, as provided in Table 2. These coefficients define the influence of each variable and their interactions:
- p00: Constant base value;
- p10 and p01: Linear influences of the dimension and angle, respectively; and
- p20, p02, p11: Second-degree interactions (nonlinear curvature).
The frequency values, which were calculated using the polynomial surface regression functions for all 20 models, were visualized as 3D surface plots (Figure 18, Figure 19, Figure 20, Figure 21, Figure 22, Figure 23, Figure 24 and Figure 25) for each mode.
Figure 18, Figure 19, Figure 20, Figure 21, Figure 22, Figure 23, Figure 24 and Figure 25 present the results of a quadratic polynomial surface regression analysis applied to the natural frequencies of the first eight vibration modes of re-entrant frame structures, providing a comprehensive visualization of how natural frequencies vary with respect to beam cross-sectional dimensions and main frame angles. In each figure, a smooth 3D surface is generated, accurately fitting the modal data with high R2 values above 0.98, indicating excellent predictive capability. Figure 18, corresponding to Mode 1, shows a steady increase in the natural frequency with increasing cross-sectional dimension and a distinct minimum at approximately 180°, highlighting the reduced stiffness in the straight frame configuration. Figure 19, for Mode 2, exhibits a similar trend but with steeper gradients, demonstrating greater sensitivity of higher modes to geometry and cross-sectional size. As seen in Figure 20 for Mode 3, which likely includes torsional effects, the frequency surface steepens further, indicating stronger interactions between the cross-section and frame angle. Figure 21, representing Mode 4, continues to reflect the characteristic drop in frequency near 180°, with increased frequency gains toward more re-entrant and hexagonal configurations. In Figure 22, for Mode 5, the interaction between geometry and size becomes more complex, producing a pronounced curvature in the surface, emphasizing the need for a balanced design to avoid frequency dips. Figure 23, Figure 24 and Figure 25, covering Modes 6 to 8, show progressively higher natural frequencies and steeper surfaces, with a clear trend of frequency saturation at larger beam sizes, especially for the highest modes. These figures confirm that increasing the beam cross-sectional size significantly enhances the natural frequency, the frame angle remains a critical design parameter, with hexagonal configurations (angles greater than 180°) offering superior dynamic performance. The consistent frequency minimum at approximately 180° underscores the inherent flexibility of the straight frame geometry, whereas the highest frequencies are achieved through the combination of thick beam cross-sections and hexagonal angles. Overall, the polynomial regression surfaces provide an effective analytical tool for predicting and optimizing the dynamic behavior of re-entrant structures, enabling rapid estimation of modal frequencies and supporting efficient design strategies without the need for extensive finite element simulations.
The results of the quadratic polynomial surface regression analysis offer valuable Insights for the practical design and optimization of re-entrant frame structures. By providing a reliable and accurate predictive model for natural frequencies based on beam cross-sectional dimensions and frame angles, the regression surfaces enable designers to quickly assess the dynamic behavior of different configurations without the need for time-consuming finite element simulations. This approach is particularly useful in the preliminary design phase, where rapid evaluations are crucial for narrowing down optimal design choices. Designers aiming to achieve higher natural frequencies should prioritize larger cross-sectional dimensions, as these dimensions consistently lead to significant increases in stiffness and vibrational resistance. Additionally, selecting frame angles in the hexagonal range (greater than 180°) further enhances the dynamic performance, whereas configurations near 180° should be approached with caution because of their inherent flexibility and lower natural frequencies. The regression model also supports inverse design strategies, allowing engineers to define target frequency ranges and back-calculate the required geometric parameters. Overall, the integration of this regression tool into the design process can significantly streamline structural optimization, ensure better control over dynamic characteristics, and ultimately lead to the development of more robust and vibration-resistant re-entrant frame structures. Figure 26 shows a workflow diagram for the regression-based design process for re-entrant frames.
4. Experimental Modal Analyses
Experimental modal analysis (EMA) is an effective instrument for describing, understanding and modeling a structure’s dynamic behavior. It can determine a structure’s natural frequencies as well as their mode shapes and can also verify accuracy and calibrate the finite element model. Scaled modal models require a precise force measurement. This can be achieved with electrodynamic and servohydraulic exciters controlled by a signal generator via a power amplifier. A more convenient and economical excitation method is a hammer fitted with a high-quality piezoelectric force transducer. In applications where a high crest factor and a limited ability to shape the input force spectrum are of no concern, impact hammer testing is an ideal source of excitation. Impact hammers are highly portable for field work and provide no unwanted mass loading to the structure during testing.
For the experiments, twenty distinct frame models, incorporating four cross-sectional sizes (4×4 mm, 8×8 mm, 12×12 mm, and 16×16 mm) and five main frame angles (120°, 150°, 180°, 210°, and 240°), were manufactured from the structural steel material. These models were the same as those used in the finite element analyses. Two steel red supporting towers were constructed for the clamped support of the test pieces. The towers were clamped to the test stand. An example (16×16 mm – 120°) of a re-entrant test piece mounted to the experiment booth and the location of the sensor (accelerometer) on the piece are shown in Figure 27.
The roving sensor (accelerometer) test method was selected as the experimental modal analysis technique. To implement this technique, the impact hammer was applied to a fixed point over the mesh on the structure, and the accelerometer was located at each mesh point (nodal point) on the structure for every hammer hit. The impact forces from the hammer and the responses from the accelerometer were collected by a data recorder and analyzer (B&K PULSE LAN- XI Data Acquisition Hardware and Modal Test Consultant Software). An image of the running data recorder and analyzer system connected to the computer captured during the experiment is shown in Figure 28. Then, using these data, the frequency response functions (FRFs) were obtained. Using modal analysis software (B&K Connect) and FRFs obtained from the recorder, we calculated the structures’ natural frequencies and mode shapes. The impact hammer (Endevco 2302-10) had a sensitivity of 2.27 mV/N with a head mass of 100 grams. The impact tip was an aluminum tip with a diameter of 6.4 millimeters. A miniature piezoelectric triaxial CCLD accelerometer (B&K TYPE 4535-B-001) with a sensitivity of 98 mV/g was used to collect the time data. The accelerometer had a frequency range of 0.3–10,000 Hz and a weight of 6 grams. The system’s sampling frequency was 2,048 Hz.
For each model (test piece), the following steps were conducted in the experiments.
- The model is selected (total of 20).
- The distance between the towers was adjusted to insert the test piece.
- The test piece is inserted.
- The bolts on the top of the towers were tightened so that the test piece was clamped.
Then, for each model, the hammer is applied (hit) at the same point on the test piece, and for each hit, the accelerometer is located at a different point of the mesh. All the data are subsequently collected by the data recorder and the analyzer and then transferred to the software running on the computer. For each model, a total of 16 different measurement points were selected and recorded. An example of a measurement screen for a hexagonal model (16×16 mm – 240°) is shown in Figure 29.
The calculated mode shapes of the model are given in Figure 30.
The experimental results (EXP) and comparisons with the corresponding numerical (FEM – Finite Element Method) results, as well as the discrepancies, are provided in Table 3. The discrepancies in the table were calculated according to the following formula:
Observations from experimental modal analysis can be grouped as follows.
General Agreement with the FEM Results:
- The experimental frequencies closely match the numerical (FEM) results, with discrepancies predominantly below 5% across all modes and configurations. This confirms the accuracy of the FEM models and validates the assumptions used in the numerical simulations.
- Higher discrepancies (up to ~7%) are observed mainly in higher modes and larger cross-sections (e.g., Frames 16x16 at 150° and 240°), which can be attributed to localized vibration complexities, slight manufacturing inaccuracies, or experimental noise.
Discrepancy Patterns across Modes:
- The lower modes (Modes 1 to 3) consistently exhibit the smallest discrepancies (typically between 1.1% and 2.5%), indicating robust experimental detectability and relatively low sensitivity to boundary and excitation uncertainties.
- The middle and higher modes (Modes 4 to 8) show increasing discrepancies, often reaching 4–7%, particularly in frames with larger masses and stiffnesses. This is expected, as higher modes are more sensitive to boundary imperfections, damping effects, and sensor placement.
Influence of Cross-Section Size:
- The discrepancies slightly increase with increasing beam cross-section. For example, the Frame 4x4 models generally yield lower discrepancy values than the 12x12 and 16x16 models do. Larger sections exhibit stiffer responses, where even small experimental variations (e.g., imperfect boundary clamping or sensor alignment) can lead to measurable deviations in higher-frequency responses.
- The best experimental-numerical alignment occurs for intermediate cross-sections such as 8x8 and 12x12 mm, which strike a balance between stiffness and experimental observability.
Effect of Frame Angle (Geometry):
- The straight frames (α = 180°) generally show slightly greater discrepancies in the upper modes, especially in Frames 12x12 and 16x16 (e.g., 6.97% at Mode 8 of Frame 16x16-180). This can be attributed to their inherent flexibility and the challenge in accurately capturing boundary behavior under dynamic excitation.
- The re-entrant (α = 120°, 150°) and hexagonal (α = 210°, 240°) configurations yield comparable experimental accuracies, although some of the highest discrepancies are noted in Modes 6–8 of the hexagonal models, which is likely due to the complex local deformation patterns at high frequencies.
Measurement Sensitivity and Experimental Challenges:
- The consistency of the discrepancies across modes and models indicates well-executed experimental procedures.
- Nonetheless, discrepancies in higher modes suggest challenges in capturing complex vibration patterns—especially twisting and local bending modes—due to limited sensor placement, lower signal‒to‒noise ratios at high frequencies, or unmodeled damping effects.
The experimental modal analysis successfully validates the finite element predictions for all 20 frame configurations. The consistently low discrepancies confirm the reliability of the test setup and the fidelity of the numerical models. Notably, lower modes are more accurately captured and are less affected by experimental uncertainties. Larger cross-sections and higher modes show slightly greater deviations, which is typical in dynamic testing due to the complexity in mode shapes and sensitivity to imperfections. Overall, the experimental approach is robust and effective, reinforcing the numerical findings and supporting the conclusions drawn regarding the influence of the frame angle and beam dimensions on vibrational behavior.
5. Conclusions
This study comprehensively investigated the dynamic behavior of re-entrant unit cell-shaped steel frame structures hrough detailed numerical and experimental modal analyses. Inspired by classical re-entrant honeycomb structures, this research focused on simplified unit frames rather than traditional lattice networks, allowing direct exploration of how geometric parameters—specifically, beam cross-sectional dimensions and frame angles—affect natural frequencies and mode shapes. The outcomes provide not only a deeper understanding of the vibrational characteristics of re-entrant frames but also practical strategies for optimizing their structural design to meet dynamic performance requirements.
The numerical analyses, which were conducted using finite element modeling with ANSYS, revealed consistent trends across the 20 frame models studied. The lower modes were generally dominated by global bending and torsional deformations, whereas the higher modes involved more localized, complex distortions. Importantly, the first and second modes typically involve large-scale lateral and out-of-plane bending movements, indicating that these modes are critical for assessing the frames’ global stability under dynamic loads. Torsional responses appeared prominently in the third mode, highlighting potential vulnerabilities to asymmetric dynamic excitations. As the mode number increased, the deformation patterns became increasingly intricate, with higher modes displaying combinations of local bending, twisting, and nodal displacements. These findings underline the necessity of considering both global and local modal behaviors during the design phase, particularly for applications where fatigue, resonance, or high-frequency vibrations are concerns.
The variation in natural frequencies was systematically evaluated against changes in beam cross-sectional dimensions and frame angles. Across all the cases, increasing the beam cross-sectional size led to a significant increase in the natural frequency, which corresponds to an increase in the dynamic stiffness. However, the effect of the frame angle was more nuanced. The models with a frame angle of 180°, representing a straight configuration, consistently exhibited the lowest natural frequencies, regardless of the cross-sectional size. This finding indicates that straight frames are inherently more flexible and, thus, more susceptible to vibrational instabilities. Conversely, both re-entrant frames (angles less than 180°) and hexagonal frames (angles greater than 180°) demonstrated superior stiffness, with hexagonal configurations (210° and 240°) showing the highest natural frequencies, especially when coupled with larger cross-sectional dimensions.
Figure 9, Figure 10, Figure 11 and Figure 12 demonstrate the strong dependency of the natural frequency trends on the frame angles for different cross-sectional sizes. The re-entrant frames showed rapid initial gains in stiffness with increasing beam thickness, whereas the hexagonal frames provided consistently high stiffness across the entire range of cross-sectional dimensions. In particular, the largest beam cross-section (16×16 mm) effectively minimized the variations in natural frequencies due to changes in the frame angle, indicating that robust structural behavior is resistant to geometric sensitivity. These insights suggest that for applications demanding high dynamic stability—such as vibration isolation platforms, machine foundations, and aerospace structural components—using thicker beams and opting for hexagonal configurations are advantageous design strategies.
The importance of geometry and size was further emphasized through a regression-based approach. A quadratic polynomial surface regression analysis was performed to establish an empirical relationship between natural frequencies, beam cross-sectional dimensions, and frame angles. The high R2 values (greater than 0.98 for all modes) indicated that the regression surfaces accurately captured the nonlinear interactions among these parameters. The 3D surface plots for each mode illustrate the complex but predictable manner in which structural geometry influences vibrational performance. The regression model not only provides a robust tool for predicting natural frequencies without the need for extensive finite element analyses but also supports inverse design processes, enabling designers to define target frequency ranges and back-calculate the necessary geometric parameters.
From a practical standpoint, regression analysis provides engineers with a valuable preliminary design tool. By inputting the desired natural frequency targets and operational constraints, optimal combinations of the frame angle and beam cross-sectional dimension can be quickly identified. This is particularly beneficial during early-stage design or optimization phases, where numerous design iterations are necessary but time and computational resources may be limited. Furthermore, the ability to predict dynamic behavior with reasonable accuracy using simple regression functions opens the door to integrating this method into automated design frameworks or optimization algorithms.
Experimental modal analyses were conducted to validate the numerical results. The experimental results closely matched the finite element predictions, with discrepancies generally less than 7%, confirming the accuracy of the numerical models. The consistency between the experimental and numerical outcomes strengthens the reliability of the findings and ensures that the conclusions drawn are not merely artifacts of simulation assumptions but reflect the real dynamic behavior of the frame structures.
Based on the findings, several key design recommendations can be proposed. First, increasing the beam cross-sectional dimensions is the most effective way to increase the dynamic stiffness and increase the natural frequency, thereby reducing the susceptibility of the structure to resonant vibrations. Second, frame angle selection should be strategically considered. Avoiding the 180° straight frame configuration is advisable for structures expected to experience significant dynamic loads, as these frames inherently exhibit lower stiffness and greater flexibility. Hexagonal configurations (angles of 210° and 240°) should be favored for their superior vibrational resistance and stability. Third, designers should leverage the quadratic regression model developed in this study for rapid, yet accurate, estimations of natural frequencies, enabling efficient design iterations and optimization.
In conclusion, this study successfully bridges the gap between geometrical design and dynamic performance in re-entrant frame structures. The combination of finite element modeling, experimental validation, and empirical regression analysis provides a robust framework for understanding and optimizing the vibrational behavior of these structures. The findings contribute significantly to the field of structural dynamics and offer practical tools and guidelines for engineers and designers aiming to develop vibration-resistant structures across a variety of engineering applications. The systematic approach adopted here ensures that re-entrant frame designs can be tailored effectively to meet stringent dynamic performance requirements, ultimately leading to safer, more reliable, and more efficient structural systems.
6. Future Work and Limitations
In terms of future work, this study opens several promising research avenues. Although the current study focused on steel frames, investigating different materials—such as composites or functionally graded materials—could provide insights into material-specific dynamic behaviors. Additionally, extending the regression model to include other parameters, such as beam length variations or different boundary conditions (e.g., pinned-pinned, free-free), could further enhance its applicability. Experimental validation under different loading conditions, such as dynamic impact or cyclic fatigue, would provide a more comprehensive understanding of real-world performance. Finally, integrating the regression model into optimization algorithms, such as genetic algorithms or machine learning-based design frameworks, could enable fully automated dynamic optimization of re-entrant frame structures. Finally, extending the analysis to multiunit lattices could reveal collective dynamic behaviors critical for large-scale structural applications.
Author Contributions
Adil Yucel served as the project supervisor. He also worked on the software aspects of the experimental part of the study. Alaeddin Arpaci contributed to the theoretical and numerical sections. Asli Bal and Cemre Ciftci were involved in the design and implementation of the experiments.
Funding
This research received no external funding.
Acknowledgments
We would like to express our special thanks to Electronics Engineer M.Sc. Alper Akgül from B&K Türkiye for his support during experimental analyses and device setup.
Conflicts of Interest
The author(s) declare no potential conflicts of interest with respect to the research, authorship and/or publication of this article.
References
- Lian, J.; Xu, L.; Wu, D.; Wang, Z. Study on re-entrant hierarchical honeycombs in-plane impact. Sci. Rep. 2023, 13, 21423. [Google Scholar] [CrossRef]
- Elsamanty, M.; Mostafa, A.; Ibrahim, A.A. Dynamic characteristics study of re-entrant honeycomb auxetic structure for AL6082. J. Egypt. Soc. Tribol. 2020, 17, 37–47. [Google Scholar] [CrossRef]
- Baran, T. Using of an auxetic structure as reinforcement of a bending reinforced concrete beam. J. Mech. Eng. Autom. 2019, 9, 1–6. [Google Scholar] [CrossRef]
- Rathore, H.S.; Mathur, A.; Hussain, S. Seismic analysis of irregular buildings with re-entrant corners and autoclaved aerated concrete blocks. Mater. Today Proc. 2022, 62, 1643–1650. [Google Scholar] [CrossRef]
- Günaydın, K.; Rea, C.; Kazancı, Z. Energy absorption enhancement of additively manufactured hexagonal and re-entrant (auxetic) lattice structures by using multi-material reinforcements. Addit. Manuf. 2022, 59, 103076. [Google Scholar] [CrossRef]
- Goryachev, M.; Jeong, J.; Tobar, M.E. Experimental implementation of a large scale multipost re-entrant array. Appl. Phys. Express 2019, 12, 054002. [Google Scholar] [CrossRef]
- Le Floch, J.M.; Fan, Y.; Aubourg, M.; Cros, D.; Carvalho, N.C.; Shan, Q.; Bourhill, J.; Ivanov, E.N.; Humbert, G.; Madrangeas, V.; et al. Rigorous analysis of highly tunable cylindrical transverse magnetic mode re-entrant cavities. Rev. Sci. Instrum. 2013, 84, 125114. [Google Scholar] [CrossRef]
- Fan, Y.; Zhang, Z.; Carvalho, N.C.; Floch, J.; Shan, Q.; Tobar, M.E. Discovery of higher order reentrant modes by constructing a cylindrical symmetric ring and post cavity resonator. 2013. [CrossRef]
- Ma, N.; Han, Q.; Han, S.; Li, C. Hierarchical re-entrant honeycomb metamaterial for energy absorption and vibration insulation. Int. J. Mech. Sci. 2023, 250, 108307. [Google Scholar] [CrossRef]
- Peng, X.; Zhong, Y.; Shi, J.; Shi, Z. Free flexural vibration analysis of composite sandwich plate with reentrant honeycomb cores using homogenized plate model. J. Sound Vib. 2022, 529, 116955. [Google Scholar] [CrossRef]
- Gao, X.; Wei, J.; Huo, J.; Wan, Z.; Li, Y. The vibration isolation design of a re-entrant negative poisson’s ratio metamaterial. Appl. Sci. 2023, 13, 9442. [Google Scholar] [CrossRef]
- Suthar, J.; Purohit, S. Seismic behaviour of re-entrant dominant RC frame buildings. Res. Eng. Struct. Mater. 2023, 9, 901–920. [Google Scholar] [CrossRef]
- Teng, X.C.; Ren, X.; Zhang, Y.; Jiang, W.; Pan, Y.; Zhang, X.G.; Zhang, X.Y.; Xie, Y.M. A simple 3D re-entrant auxetic metamaterial with enhanced energy absorption. Int. J. Mech. Sci. 2022, 229, 107524. [Google Scholar] [CrossRef]
- Farshbaf, S.; Dialami, N.; Cervera, M. Large deformation and collapse analysis of re-entrant auxetic and hexagonal honeycomb lattice structures subjected to tension and compression. Mech. Mater. 2025, 210, 105457. [Google Scholar] [CrossRef]
- Ergene, B.; Yalçın, B. Finite element analysis for compression behaviour of polymer based honeycomb and re-entrant structures. In Proceedings of the 4th International Conference on Engineering and Natural Science Ukraine, UK; 2018; pp. 549–556. [Google Scholar]
- Mustahsan, F.; Khan, S.Z.; Zaidi, A.A.; Alahmadi, Y.H.; Mahmoud, E.R.I.; Almohamadi, H. Re-entrant honeycomb auxetic structure with enhanced directional properties. Materials 2022, 15, 8022. [Google Scholar] [CrossRef]
- Choi, H.G.; Park, K. Deformation behavior of re-entrant auxetic metamaterials considering shape transformation effects. J. Mech. Sci. Technol. 2023, 37, 6143–6151. [Google Scholar] [CrossRef]
- Chen, Z.; Li, J.; Wu, B.; Chen, X.; Min Xie, Y. Enhanced mechanical properties of re-entrant auxetic honeycomb with self-similar inclusion. Compos. Struct. 2024, 331, 117921. [Google Scholar] [CrossRef]
- Ma, N.; Han, S.; Han, Q.; Li, C. Design and compressive behaviors of the gradient re-entrant origami honeycomb metamaterials. Thin-Walled Struct. 2024, 198, 111652. [Google Scholar] [CrossRef]
- Shen, J.; Zeng, Q.; Wang, J.; Ge, J.; Gao, F.; Liang, J. Study of mechanical properties of a new 3D re-entrant lattice auxetic structure under bending. Adv. Eng. Mater. 2023, 25, 2201509. [Google Scholar] [CrossRef]
- Hedayati, R.; Yousefi, A.; Dezaki, M.L.; Bodaghi, M. Analytical relationships for 2D re-entrant auxetic metamaterials: An application to 3D printing flexible implants. J. Mech. Behav. Biomed. Mater. 2023, 143, 105938. [Google Scholar] [CrossRef]
- Bai, Y.Z.; Qie, Y.H.; Meng, C.; Song, J.H. A new construction method for a vertically asymmetric reentrant honeycomb unit cell and the general analytical expression. Mech. Adv. Mater. Struct. 2025, 1–19. [Google Scholar] [CrossRef]
- Széles, L.; Horváth, R.; Cveticanin, L. Analysis of mechanical properties and parameter dependency of novel, doubly re-entrant auxetic honeycomb structures. Polymers 2024, 16, 2524. [Google Scholar] [CrossRef] [PubMed]
- Zhang, J.; Zhu, X.; Yang, X.; Zhang, W. Transient nonlinear responses of an auxetic honeycomb sandwich plate under impact loads. Int. J. Impact Eng. 2019, 134, 103383. [Google Scholar] [CrossRef]
- Dudek, K.K.; Martínez, J.A.I.; Kadic, M. Variable dual auxeticity of the hierarchical mechanical metamaterial composed of re-entrant structural motifs. Phys. Status Solidi 2022, 259, 2200404. [Google Scholar] [CrossRef]
Figure 1.
Re-entrant frame model.
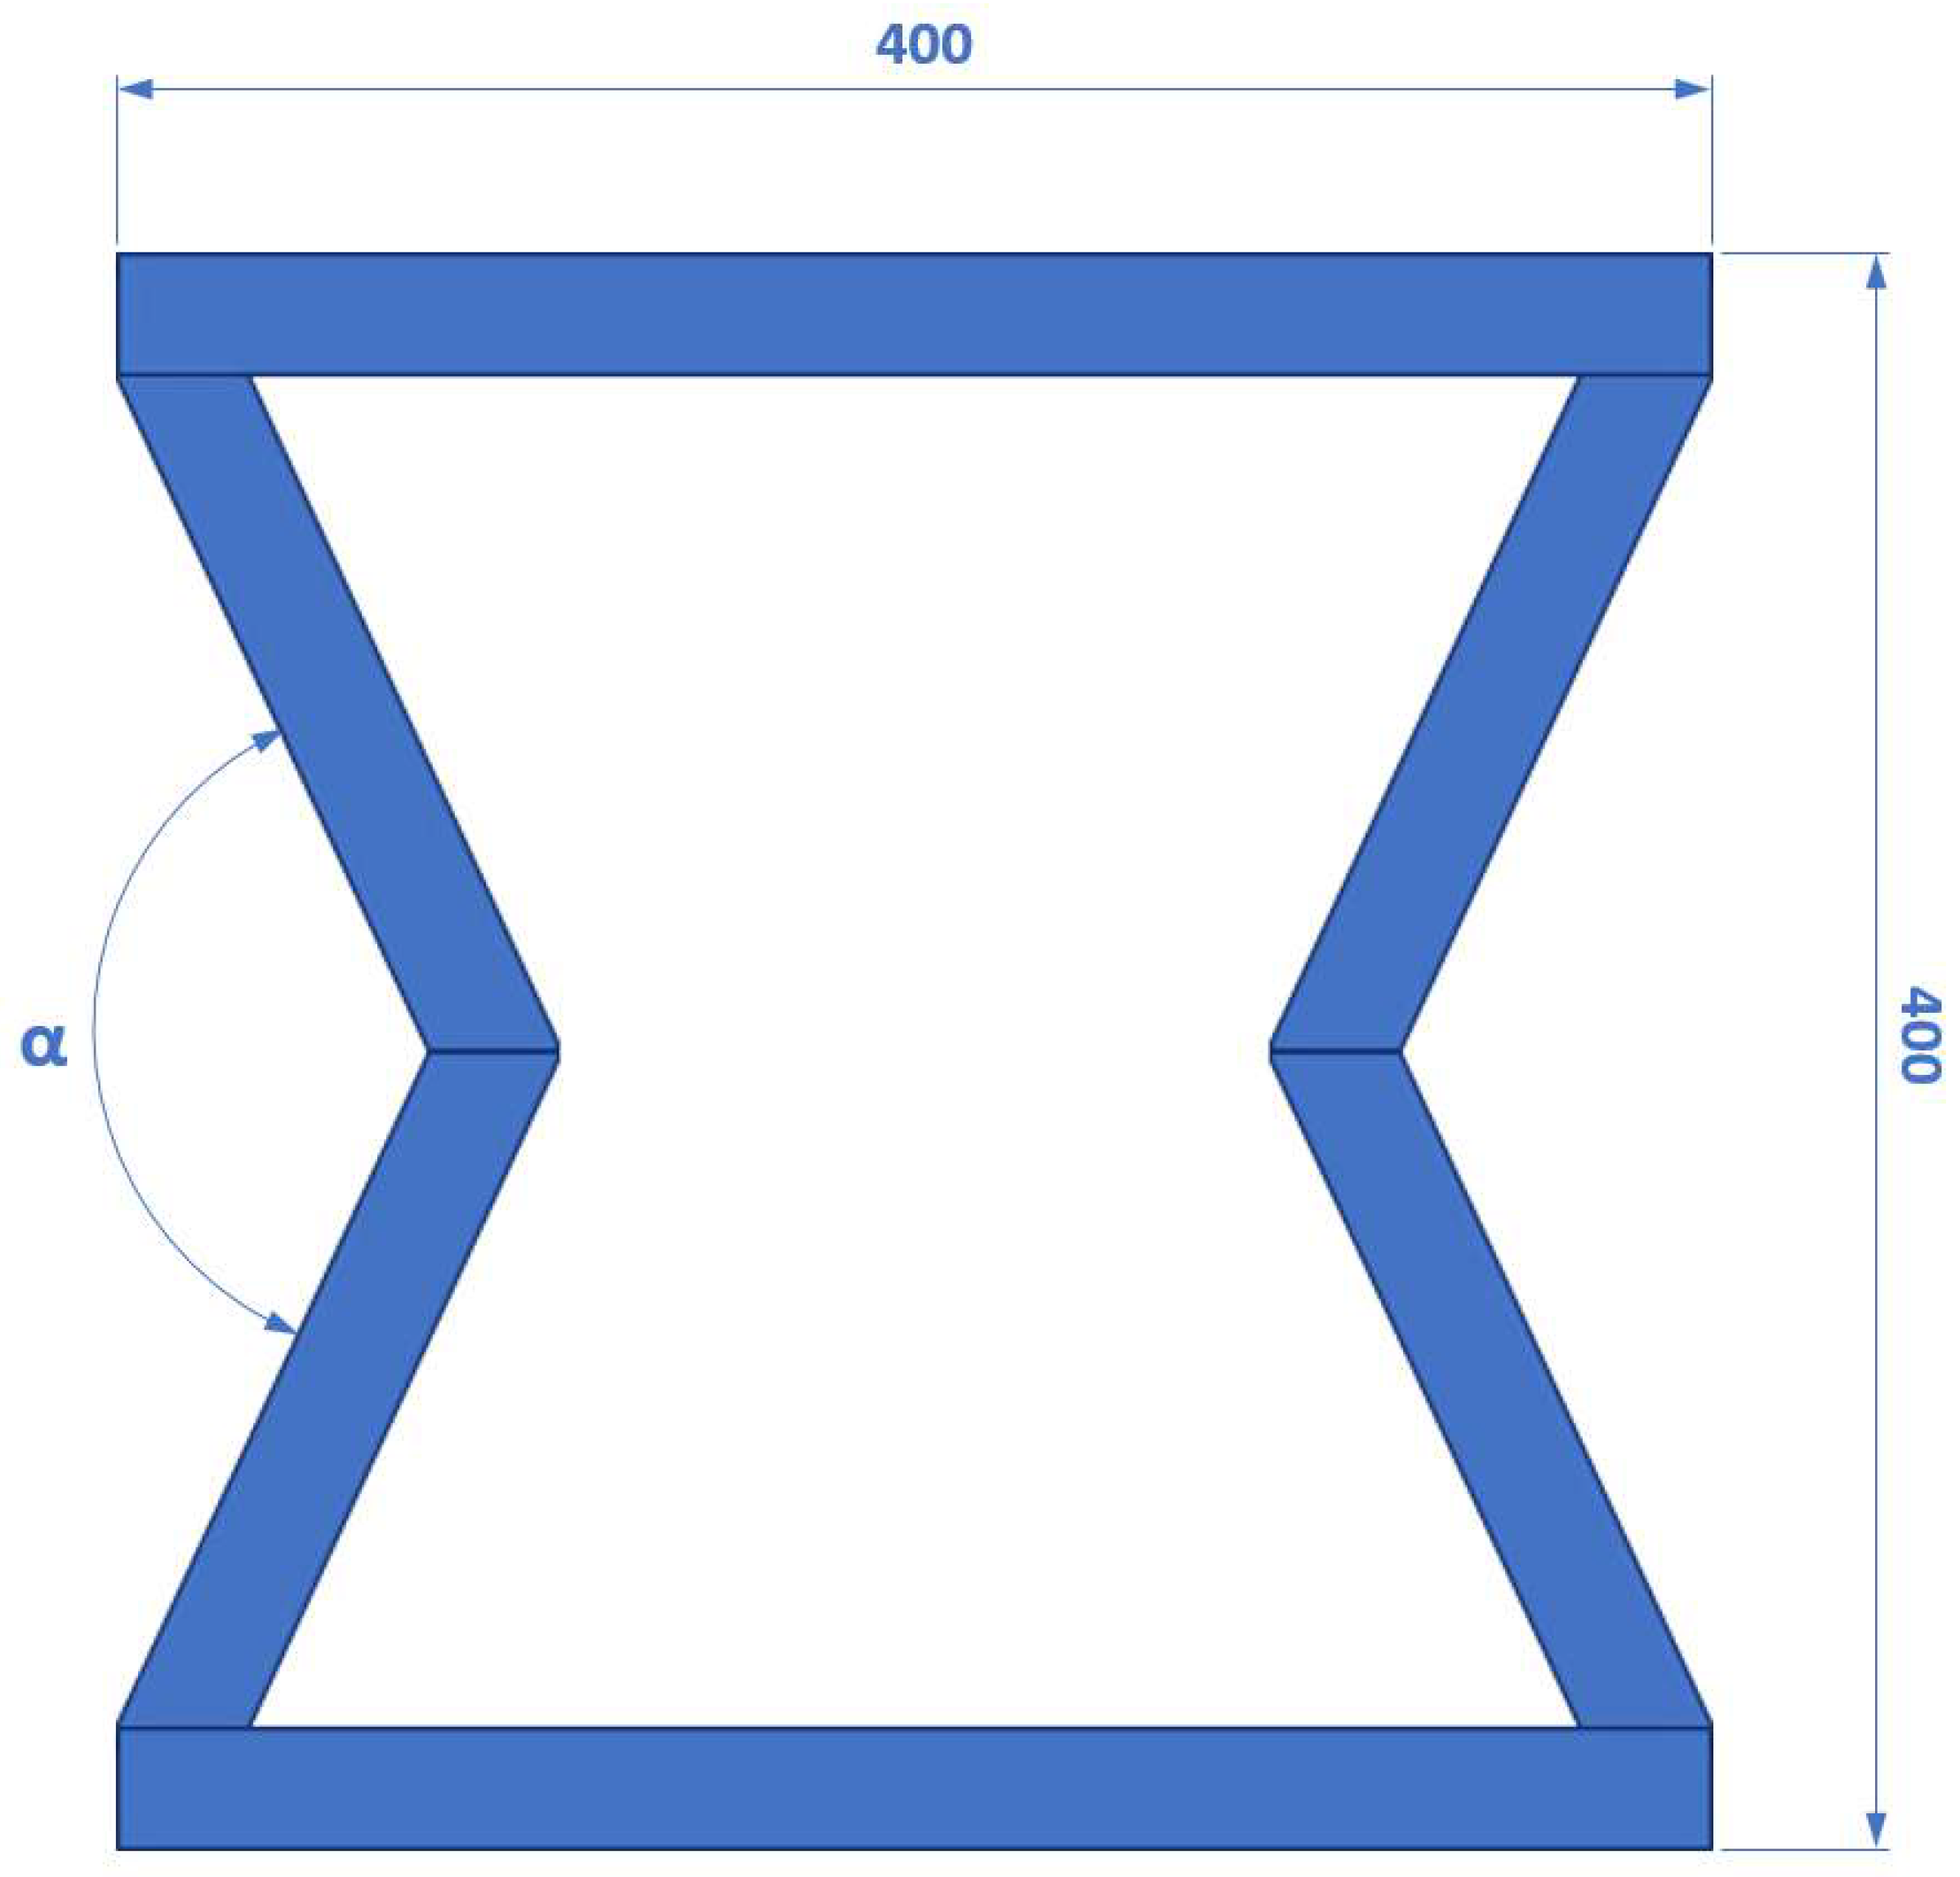
Figure 7.
Finite element model of Frame 12x12-150.

Figure 8.
First eight mode shapes of Frame 12x12-150: (a) Mode 1 (63.34 Hz); (b) Mode 2 (101.34 Hz); (c) Mode 3 (107.30 Hz); (d) Mode 4 (123.87 Hz); (e) Mode 5 (147.60 Hz); (f) Mode 6 (172.93 Hz); (g) Mode 7 (296.90 Hz); (h) Mode 8 (301.91 Hz).
Figure 8.
First eight mode shapes of Frame 12x12-150: (a) Mode 1 (63.34 Hz); (b) Mode 2 (101.34 Hz); (c) Mode 3 (107.30 Hz); (d) Mode 4 (123.87 Hz); (e) Mode 5 (147.60 Hz); (f) Mode 6 (172.93 Hz); (g) Mode 7 (296.90 Hz); (h) Mode 8 (301.91 Hz).
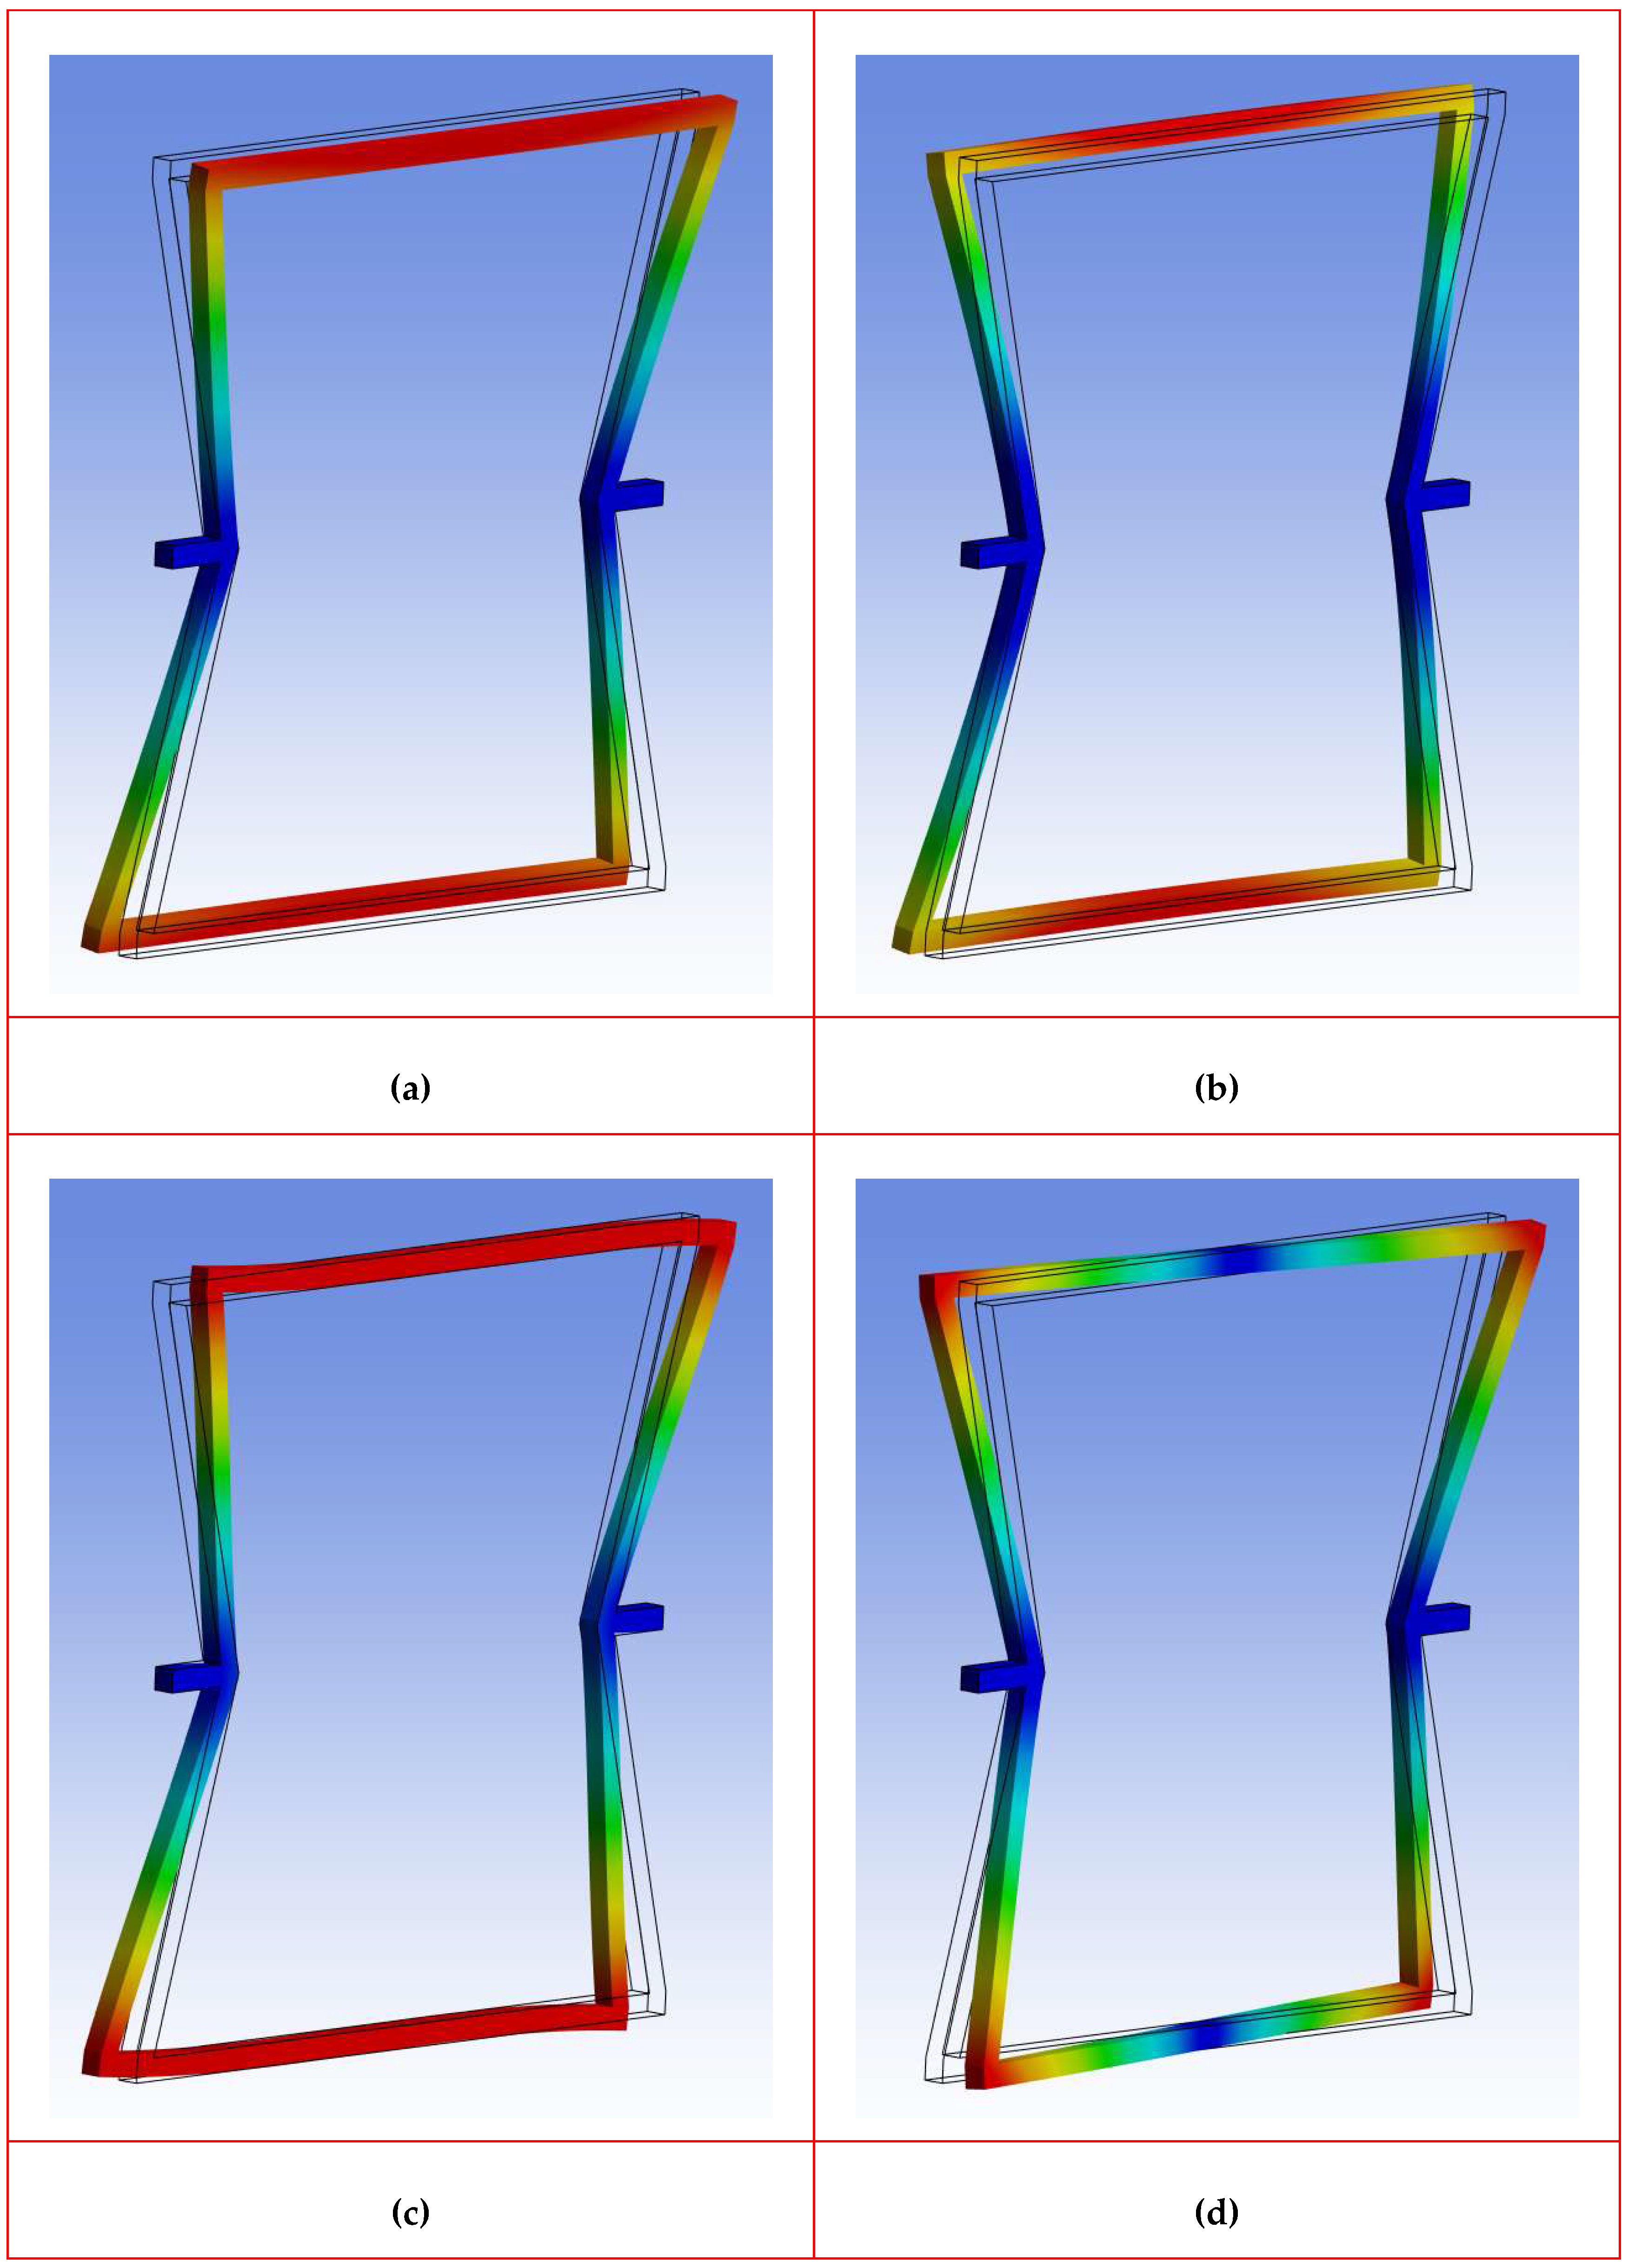
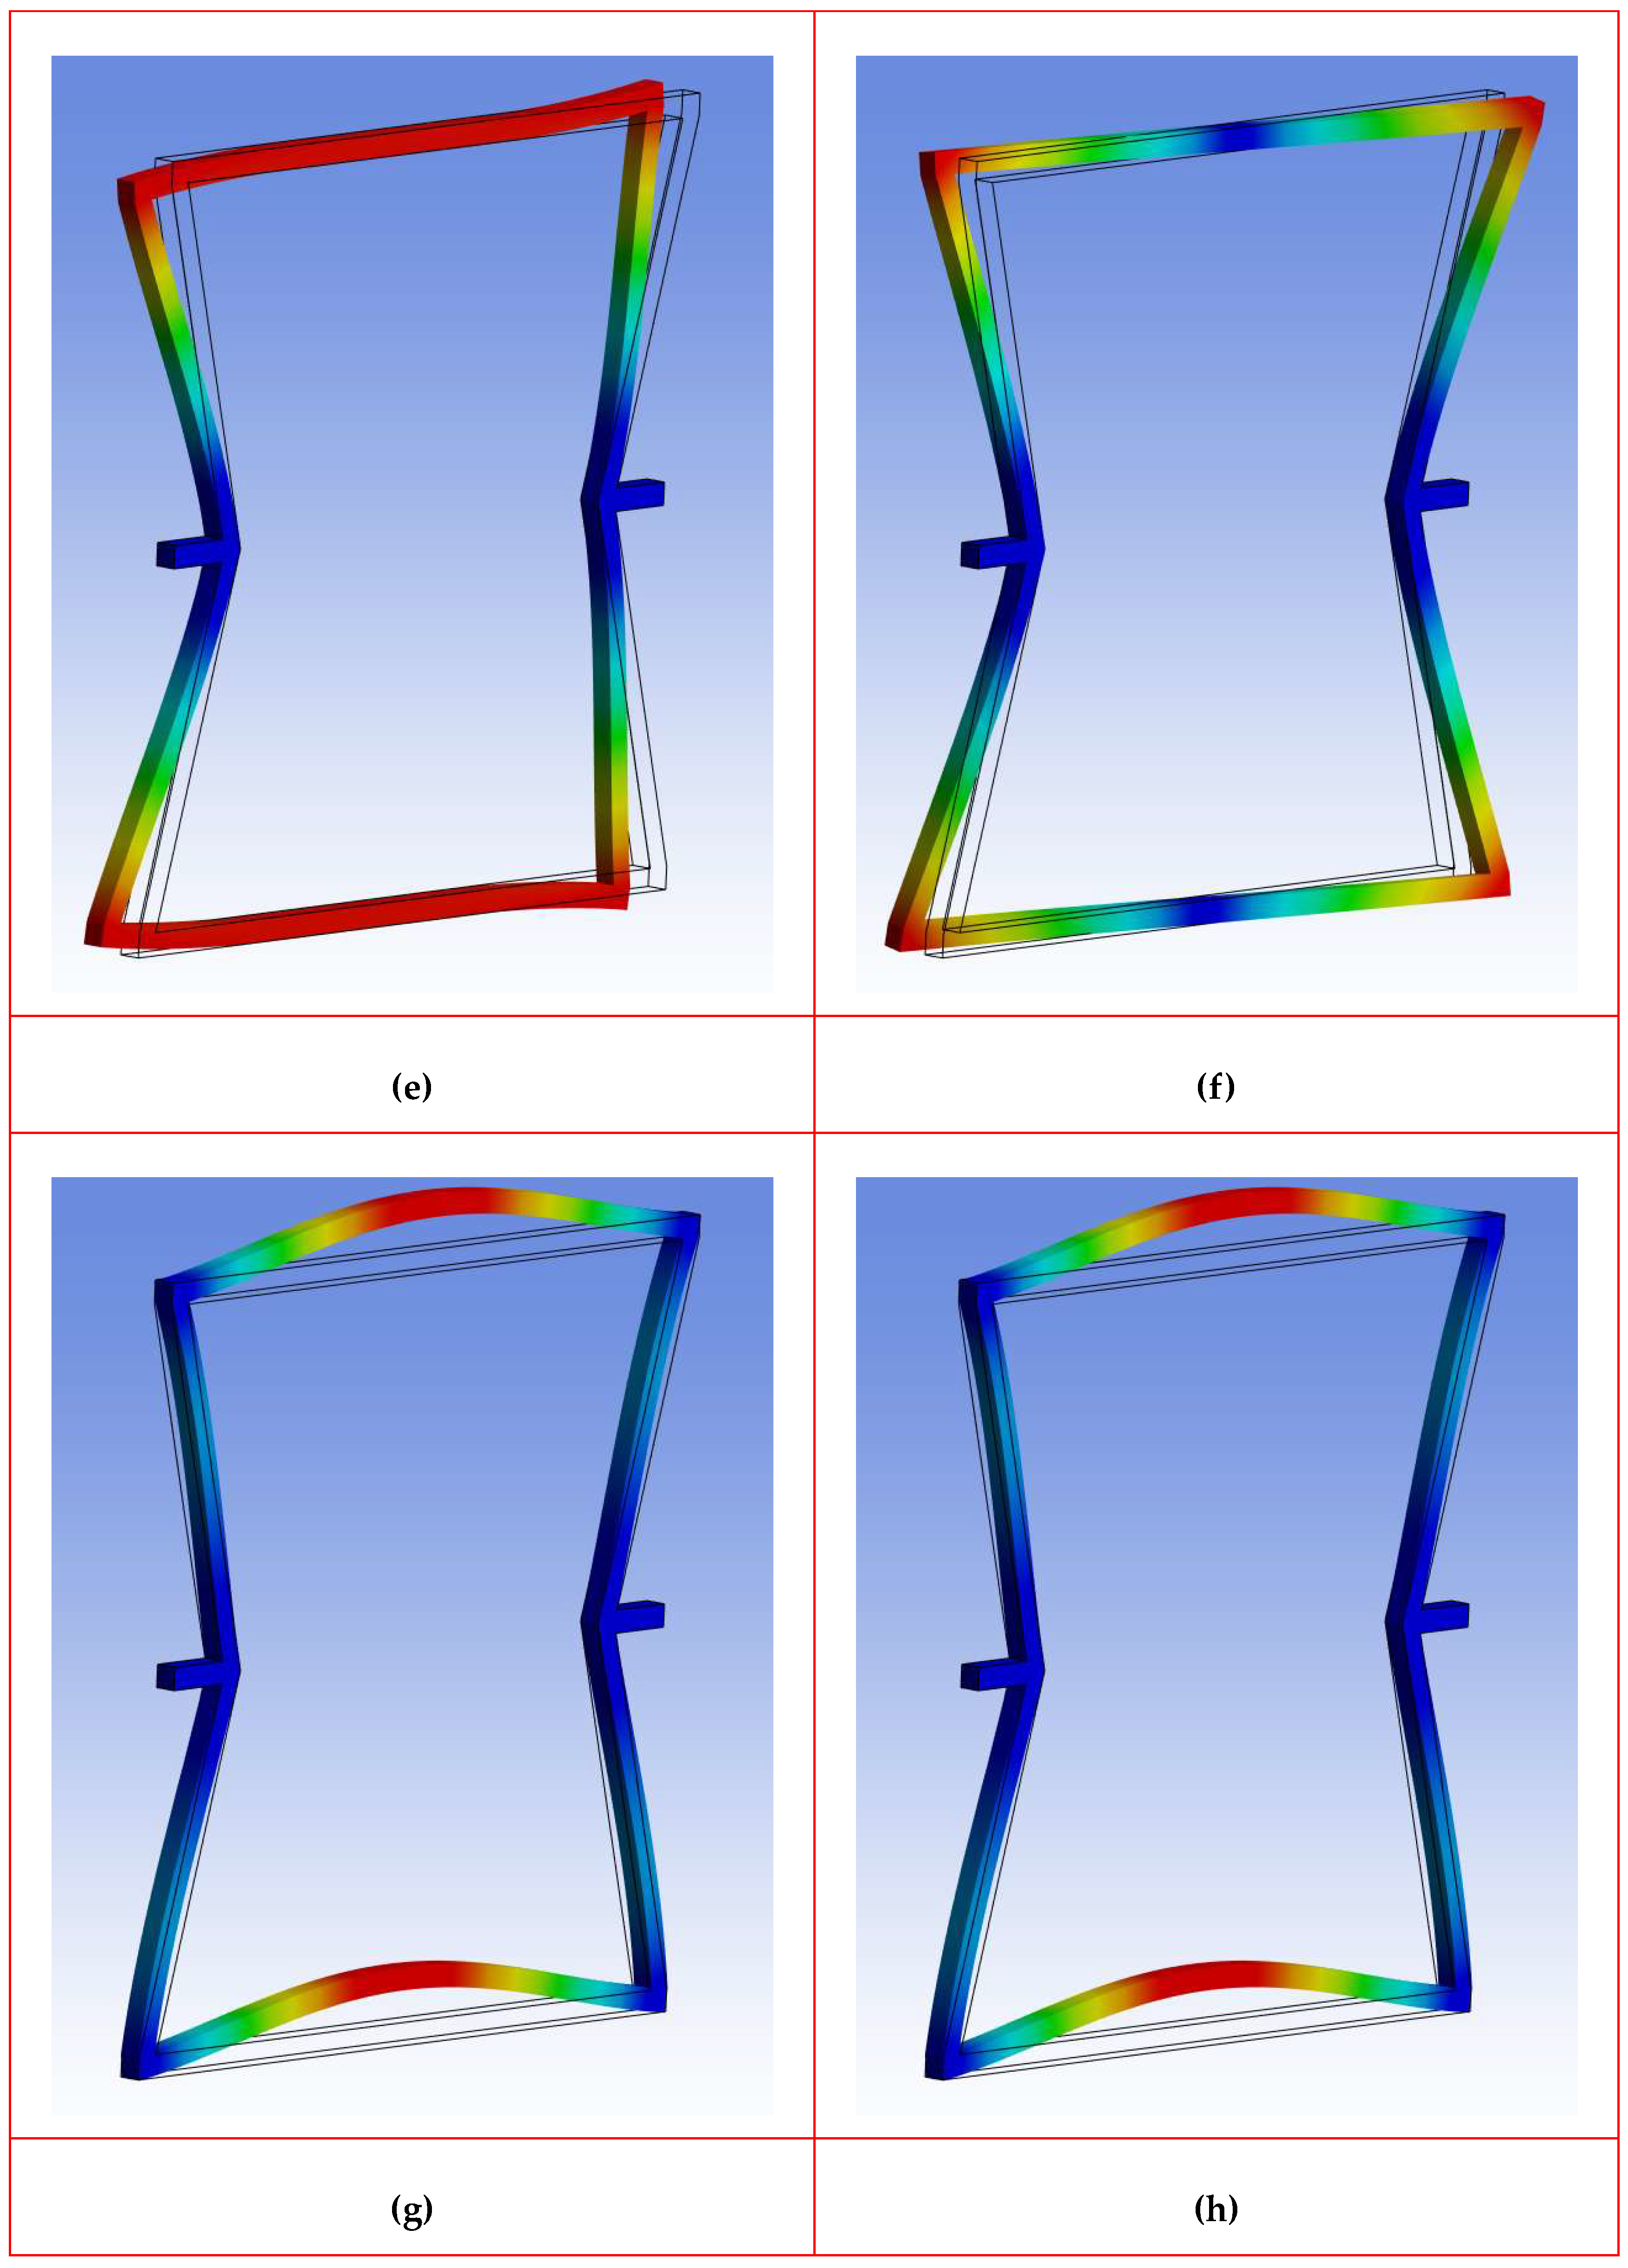
Figure 9.
Variations in the natural frequencies with respect to the frame angle for a cross section of 4x4 mm.
Figure 9.
Variations in the natural frequencies with respect to the frame angle for a cross section of 4x4 mm.
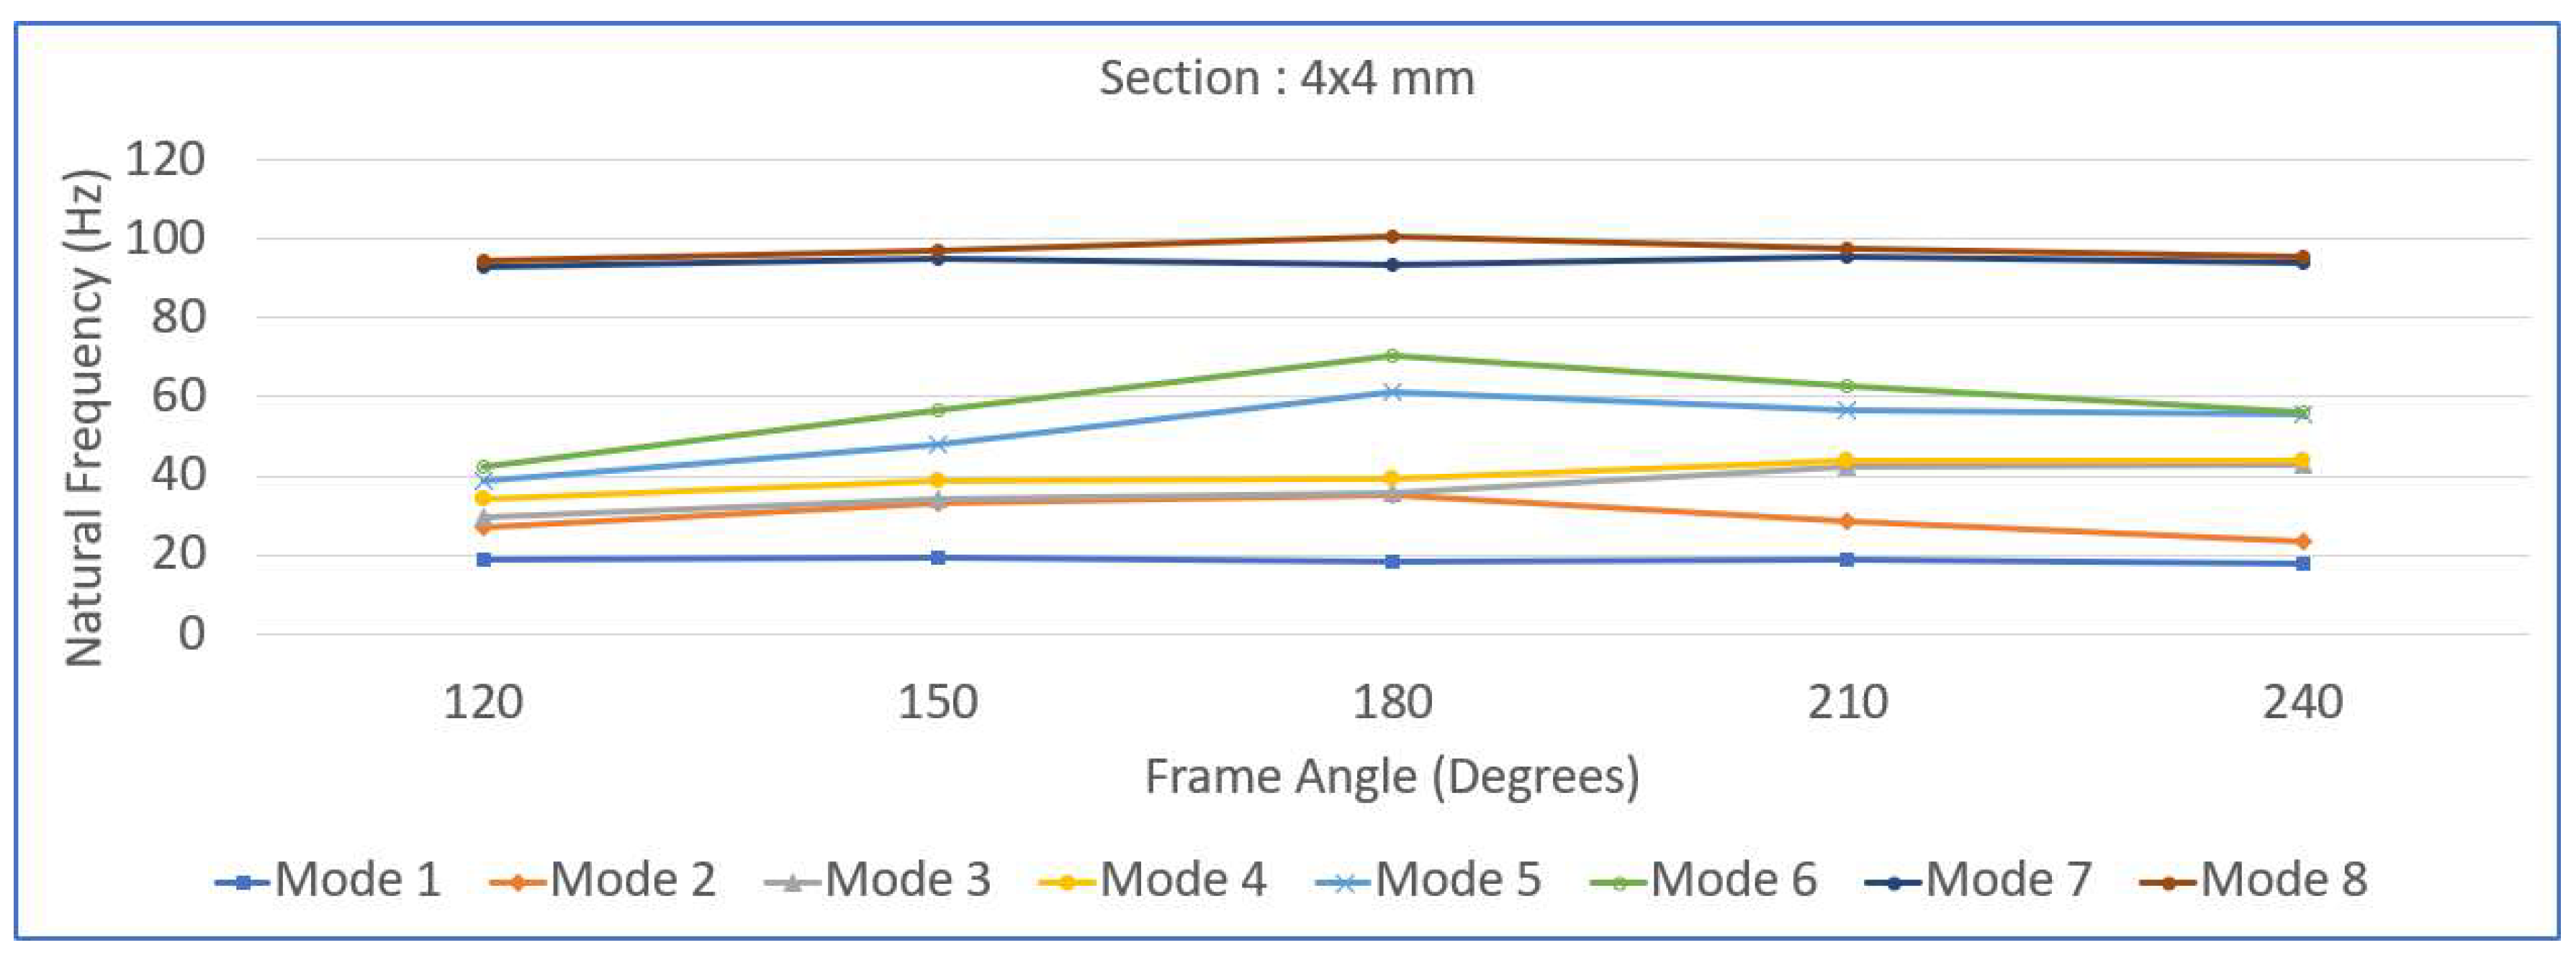
Figure 10.
Variations in the natural frequencies with respect to the frame angle for a cross section of 8x8 mm.
Figure 10.
Variations in the natural frequencies with respect to the frame angle for a cross section of 8x8 mm.
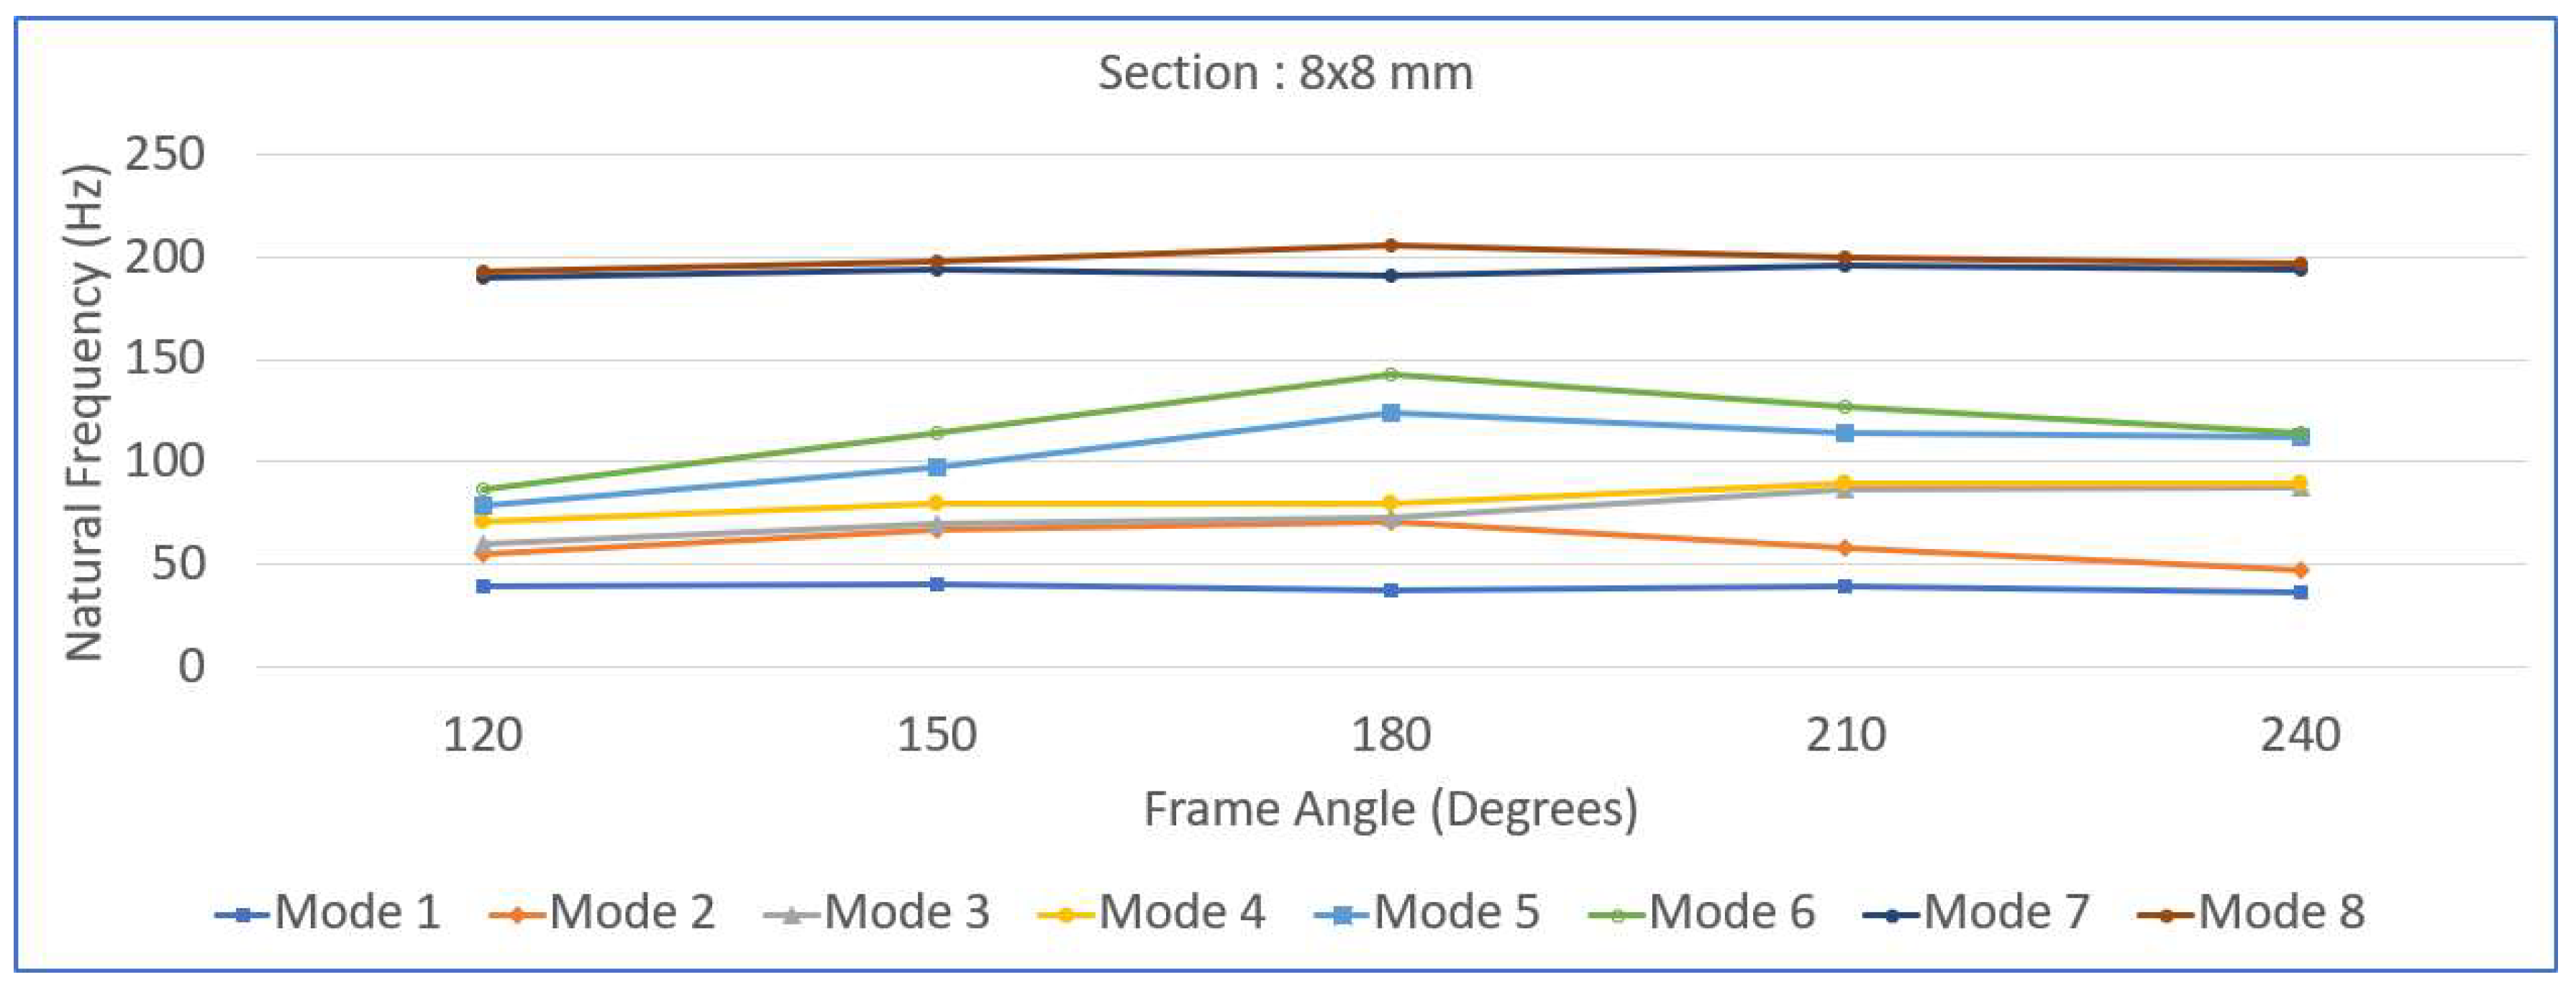
Figure 11.
Variations in the natural frequencies with respect to the frame angle for a cross section of 12x12 mm.
Figure 11.
Variations in the natural frequencies with respect to the frame angle for a cross section of 12x12 mm.
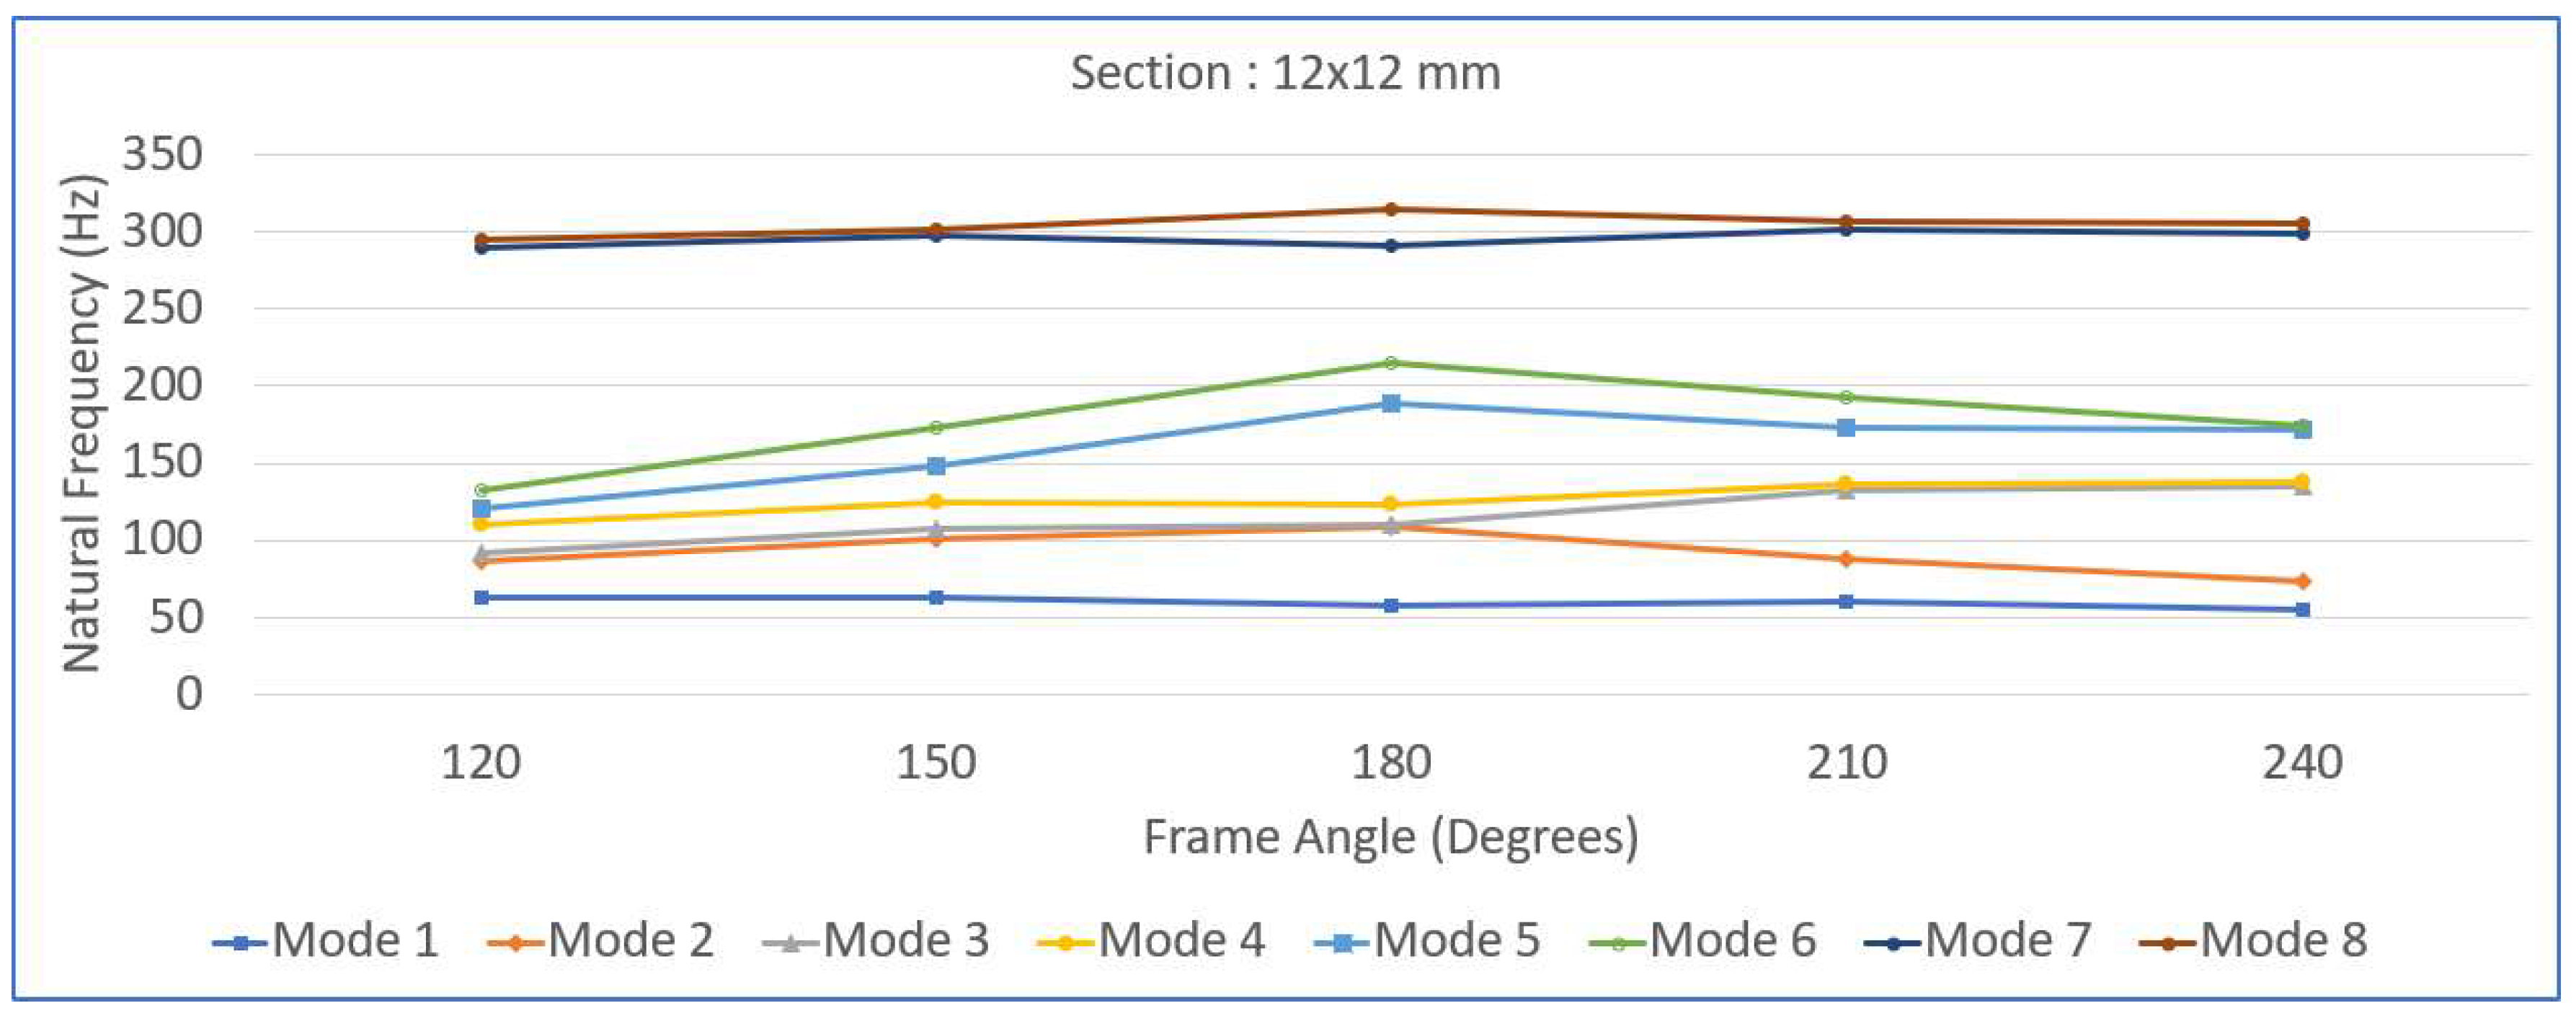
Figure 12.
Variations in the natural frequencies with respect to the frame angle for a cross section of size 16x16 mm.
Figure 12.
Variations in the natural frequencies with respect to the frame angle for a cross section of size 16x16 mm.
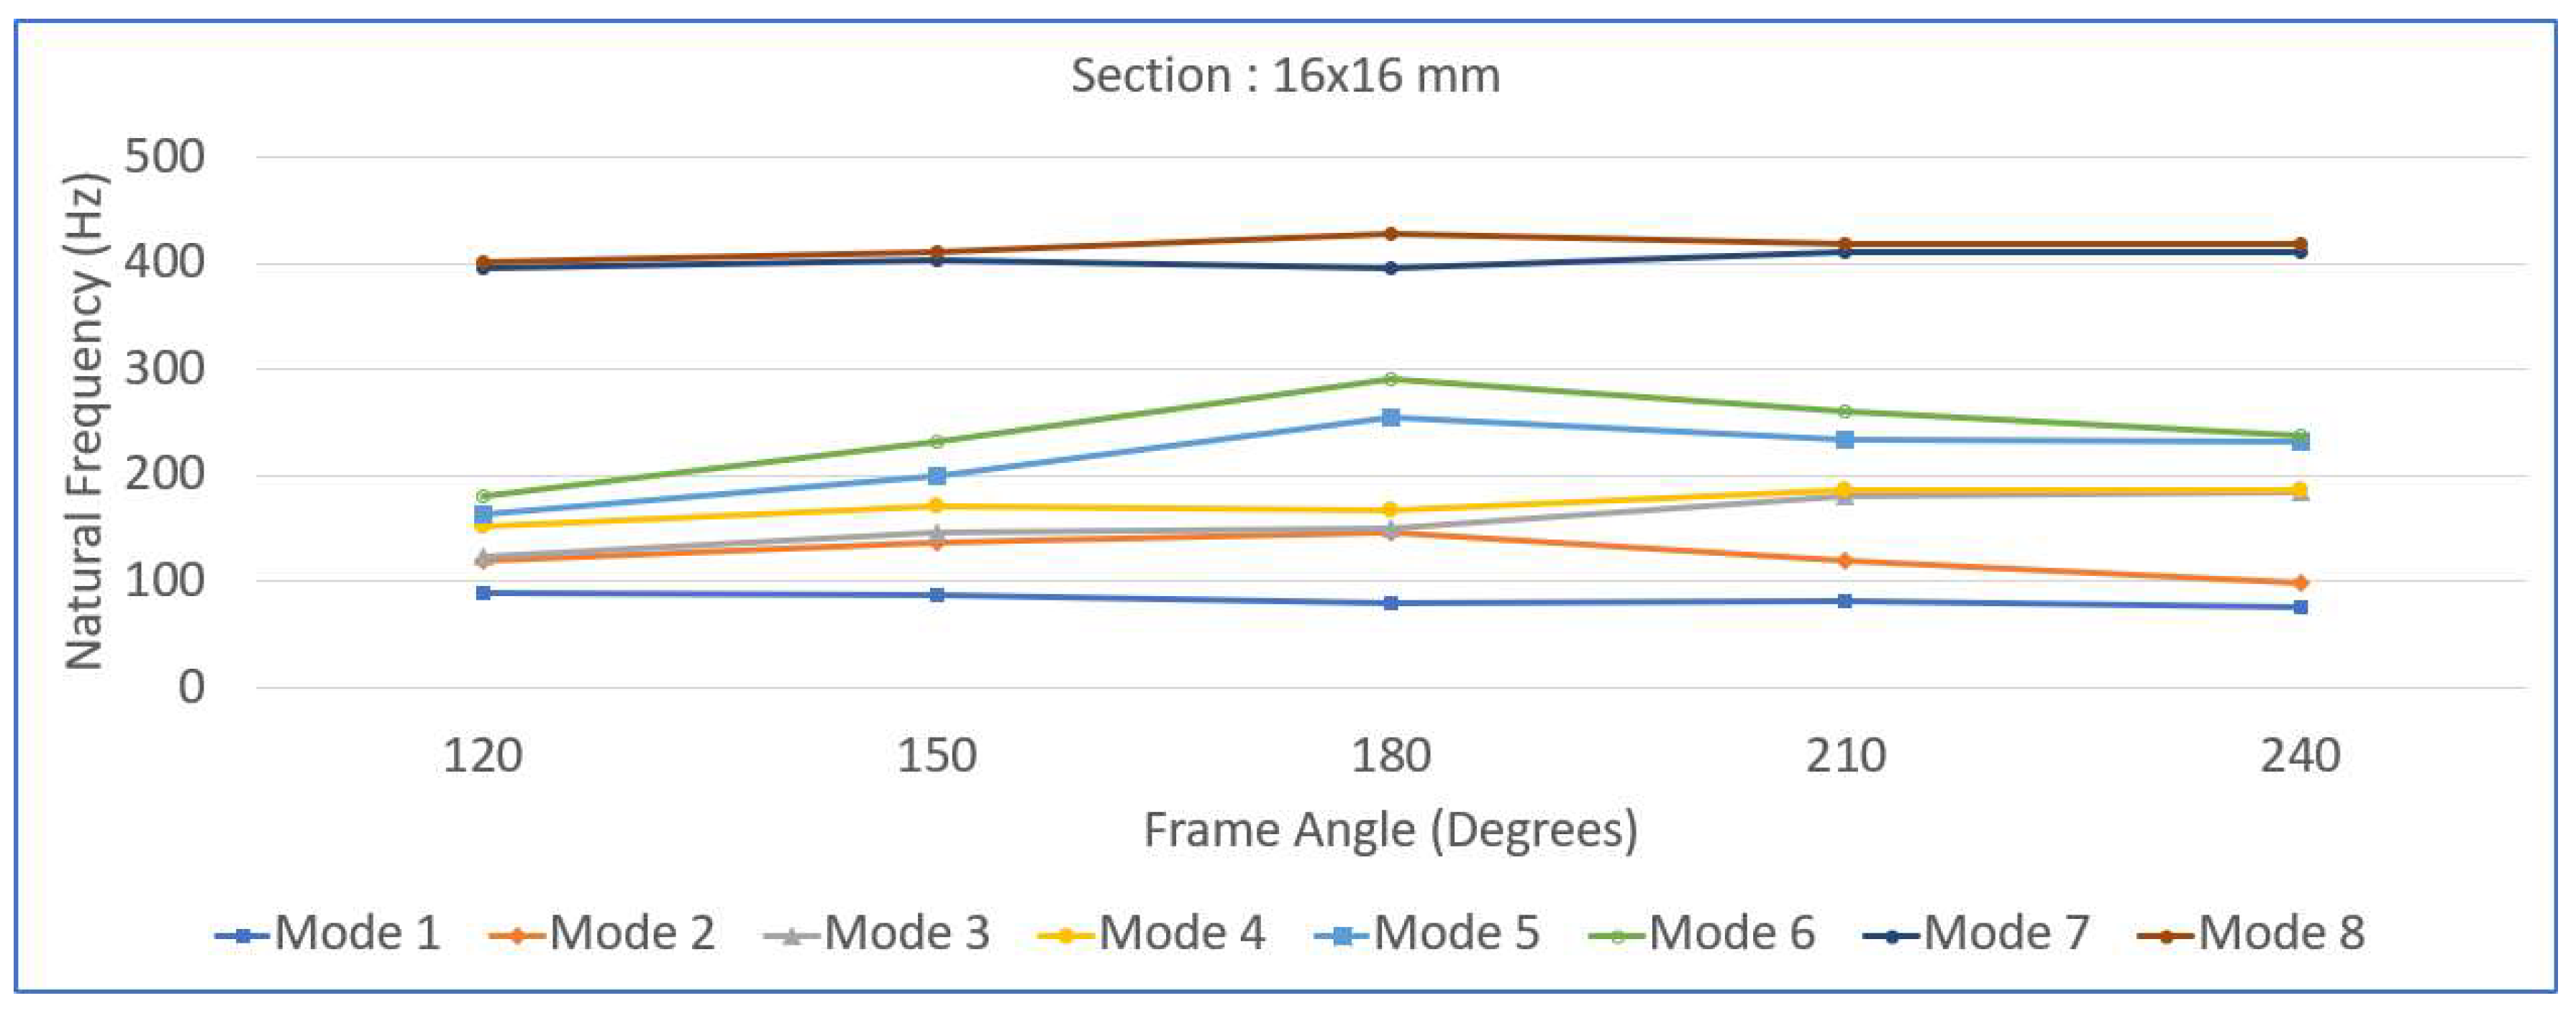
Figure 13.
Variations in the natural frequencies with respect to the cross-sectional dimensions for a 1200 frame angle.
Figure 13.
Variations in the natural frequencies with respect to the cross-sectional dimensions for a 1200 frame angle.
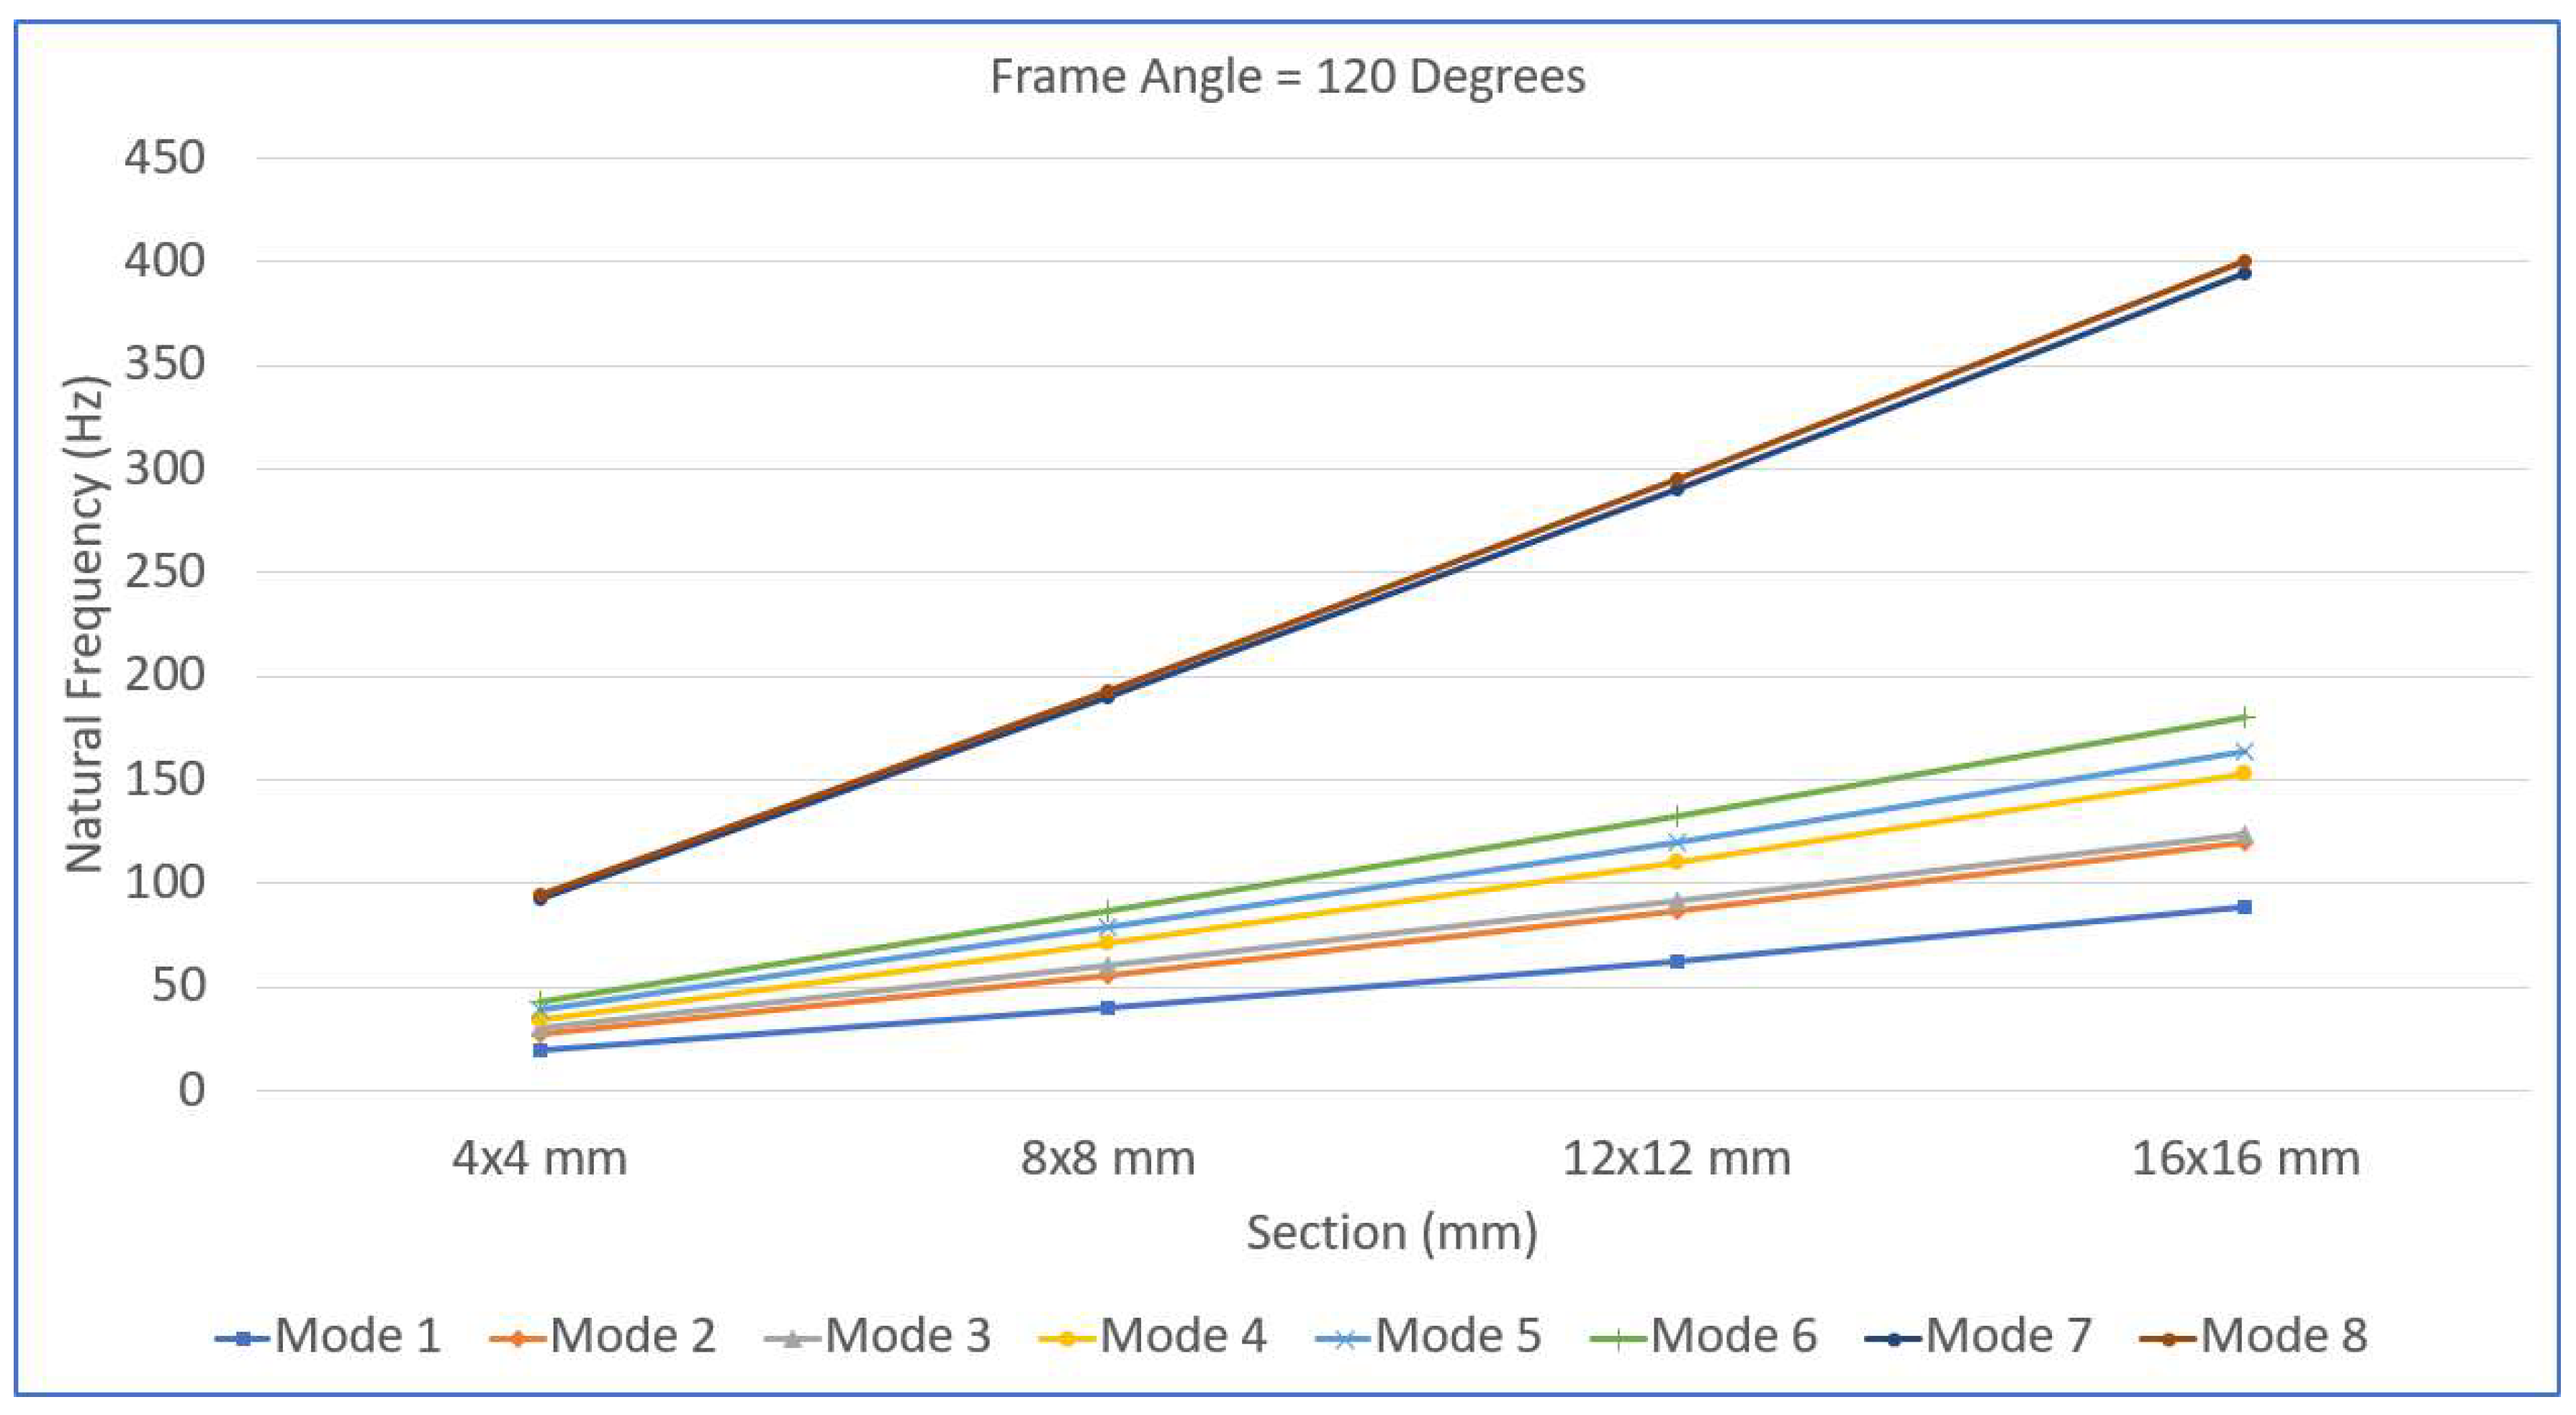
Figure 14.
Variations in the natural frequencies with respect to the cross-sectional dimensions for a 1500 frame angle.
Figure 14.
Variations in the natural frequencies with respect to the cross-sectional dimensions for a 1500 frame angle.
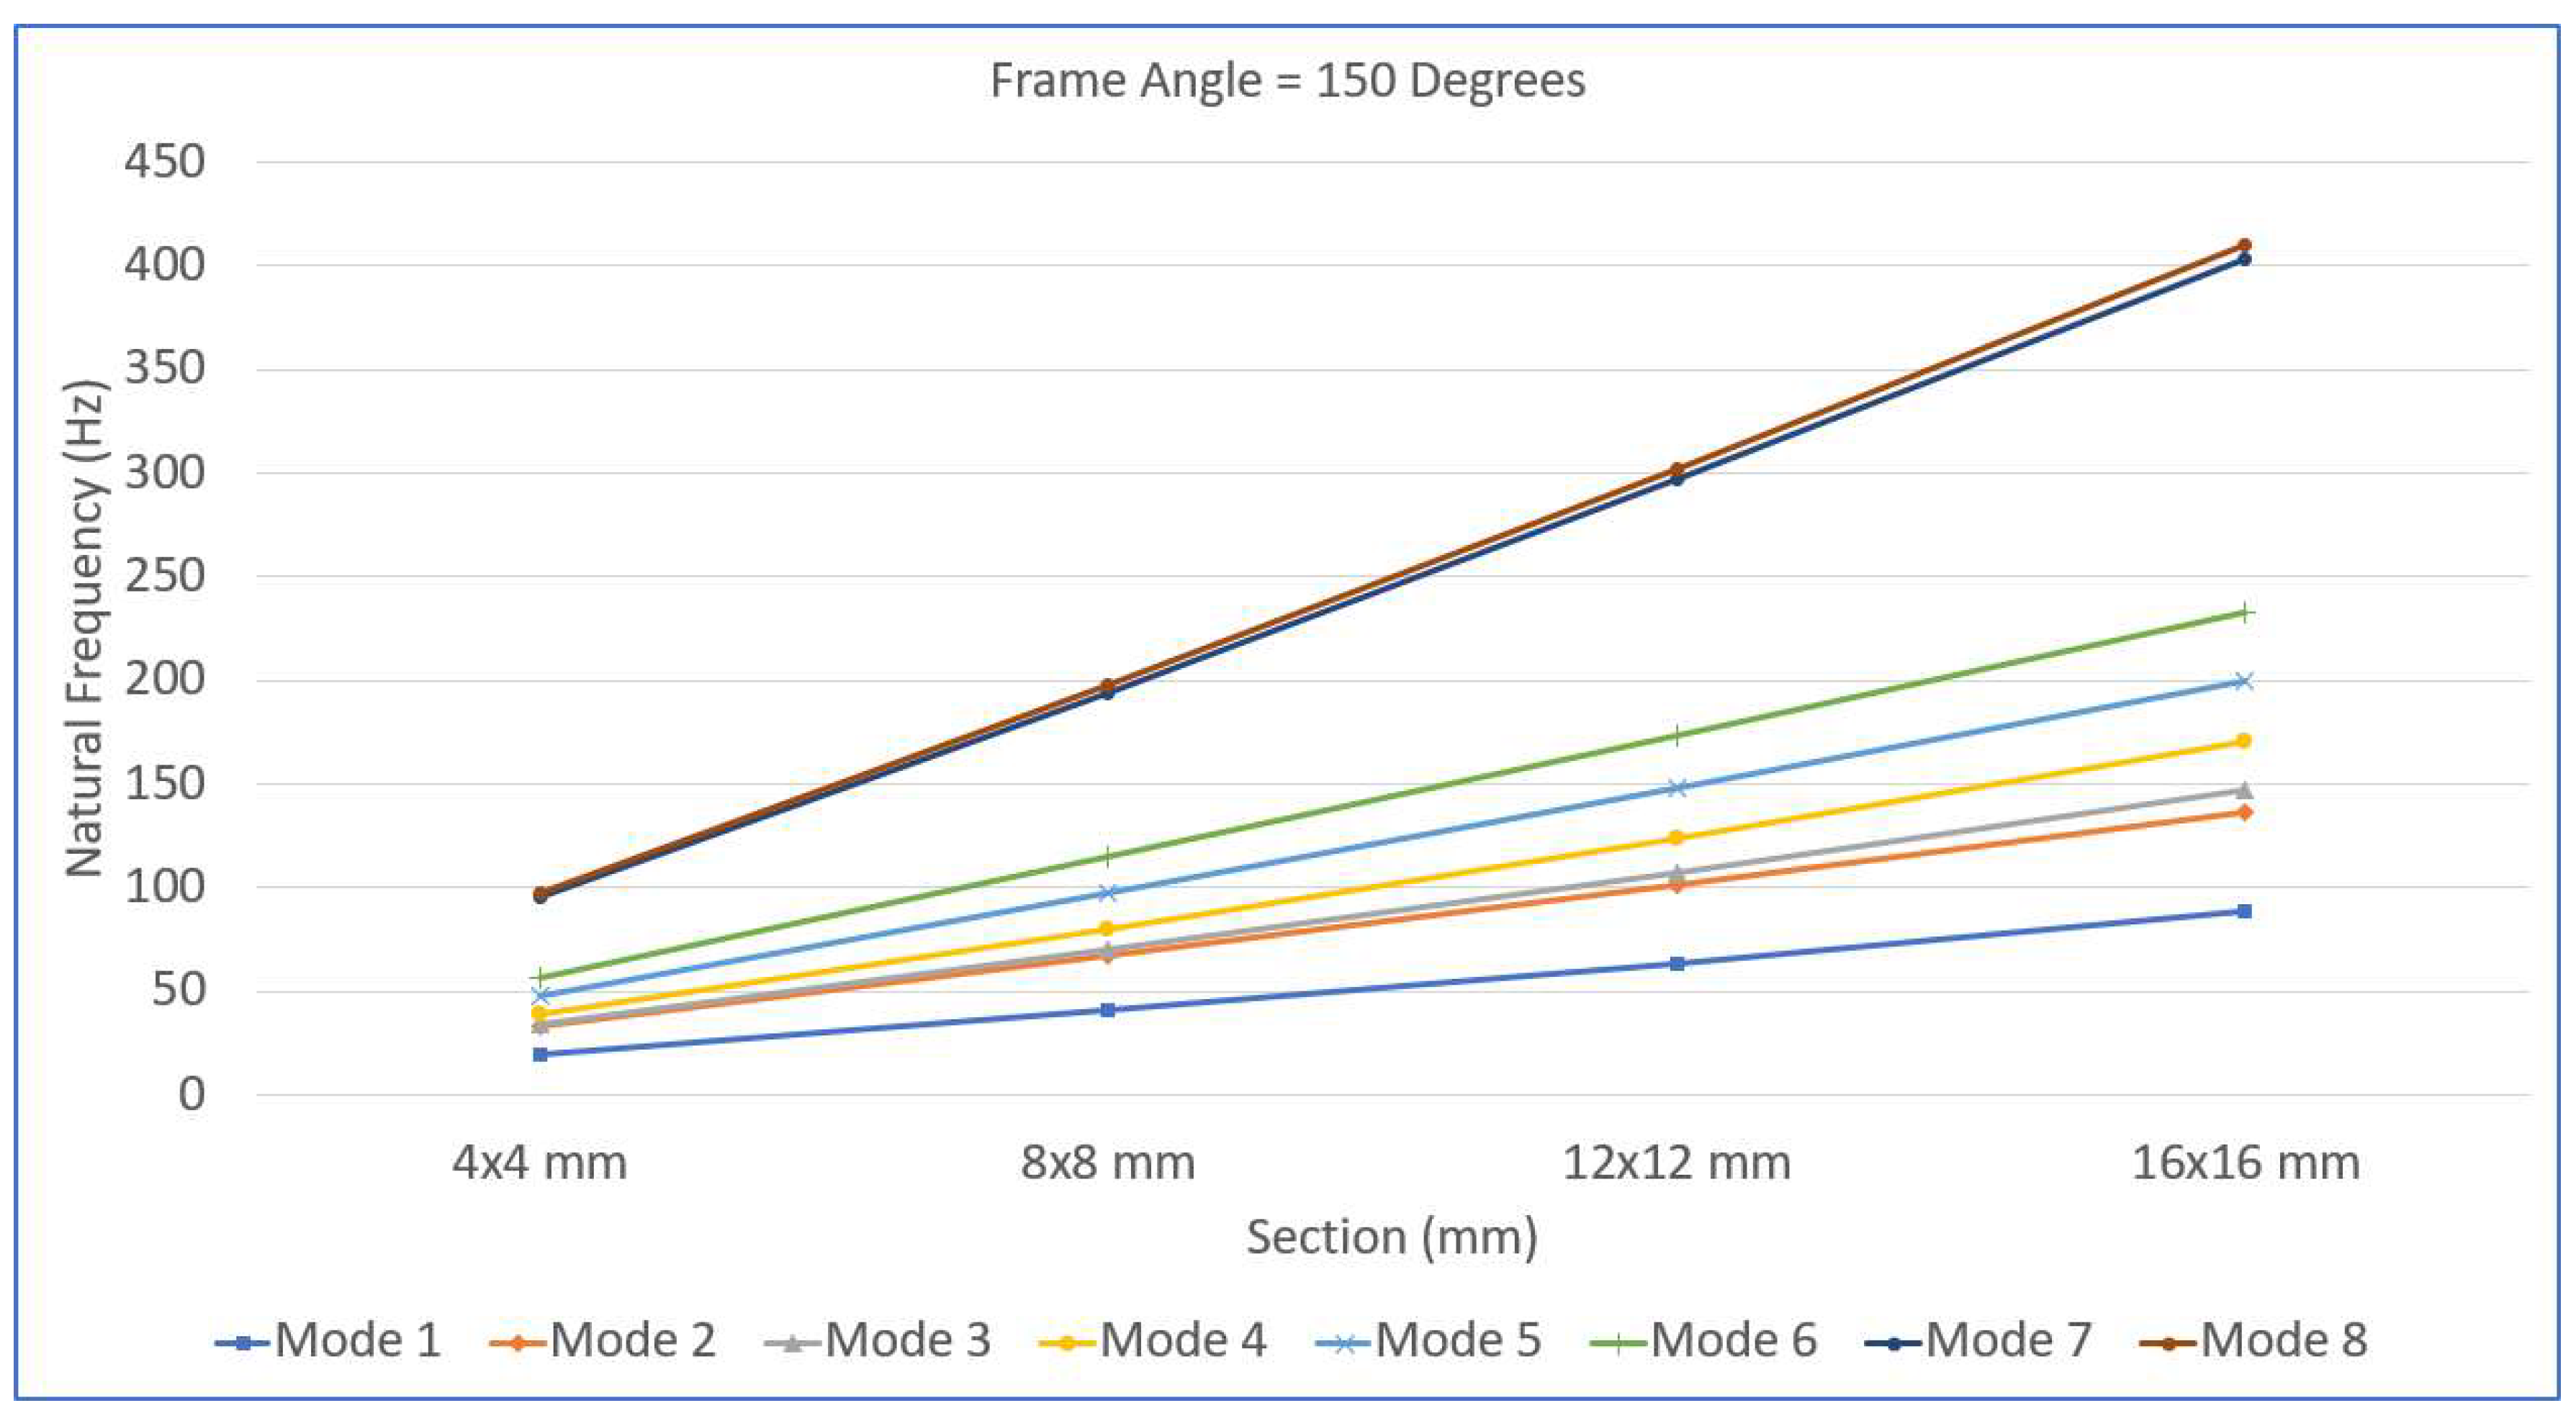
Figure 15.
Variations in the natural frequencies with respect to the cross-sectional dimensions for a 1800 frame angle.
Figure 15.
Variations in the natural frequencies with respect to the cross-sectional dimensions for a 1800 frame angle.
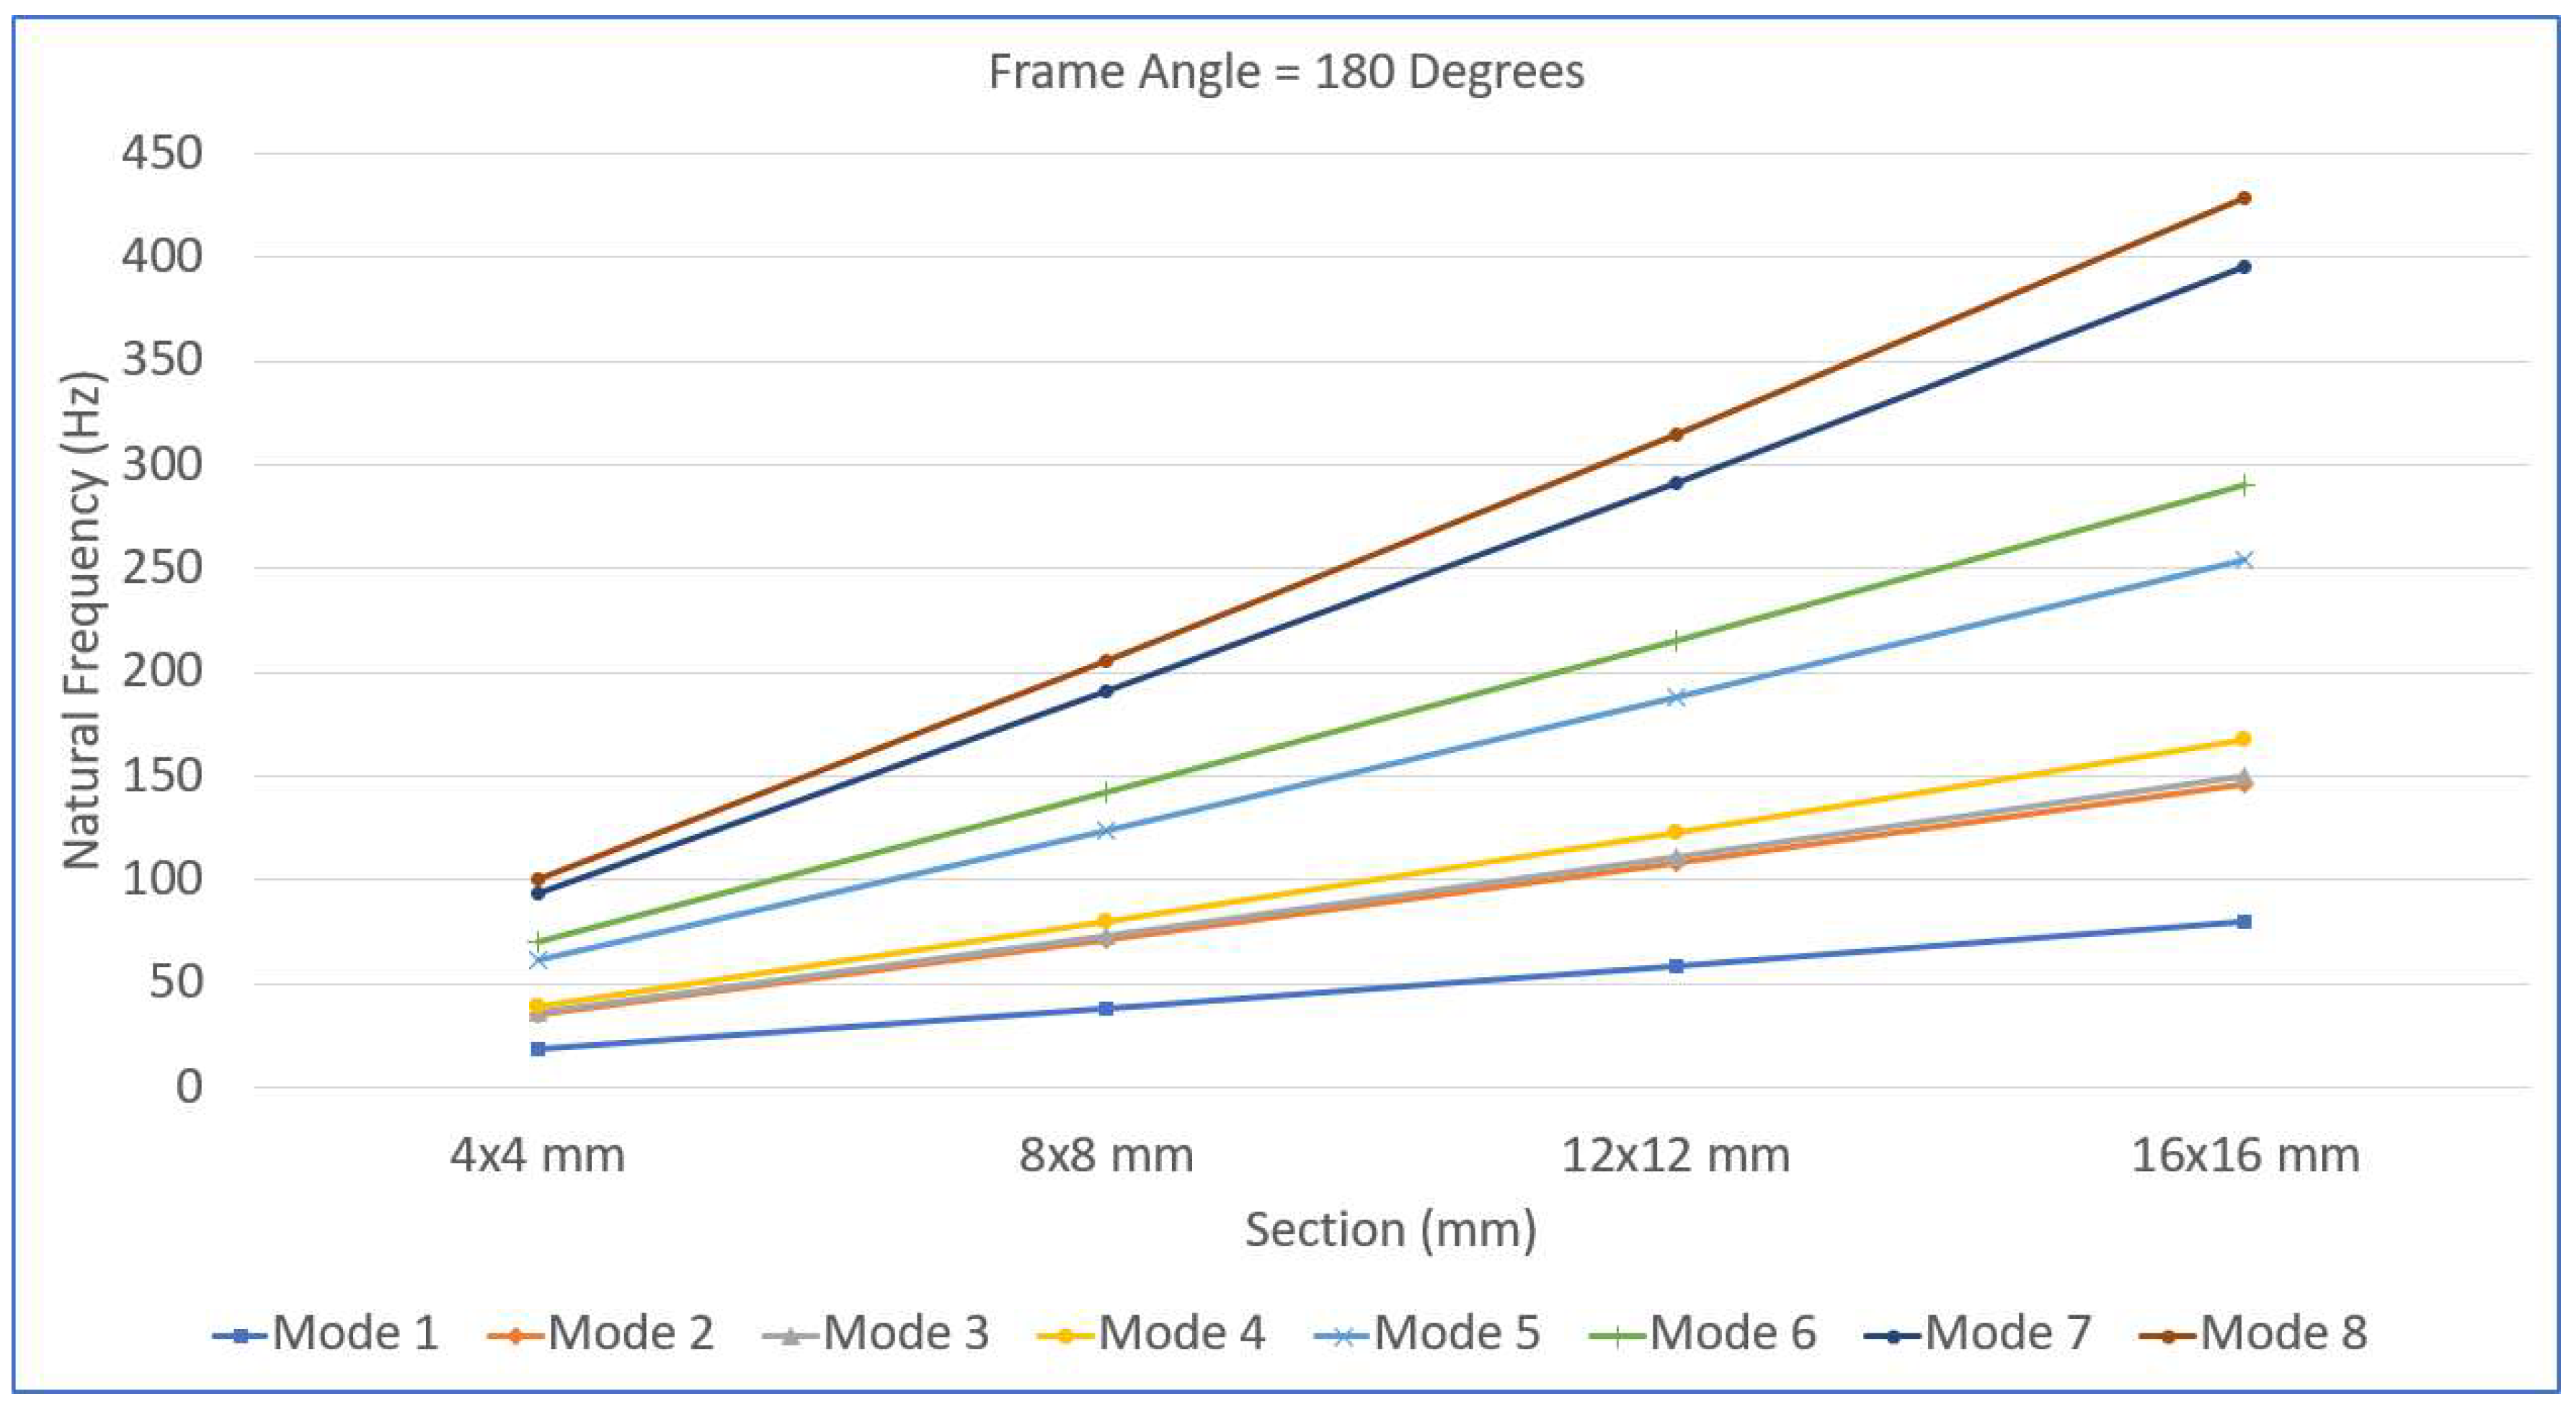
Figure 16.
Variations in the natural frequencies with respect to the cross-sectional dimensions for a 2100 frame angle.
Figure 16.
Variations in the natural frequencies with respect to the cross-sectional dimensions for a 2100 frame angle.
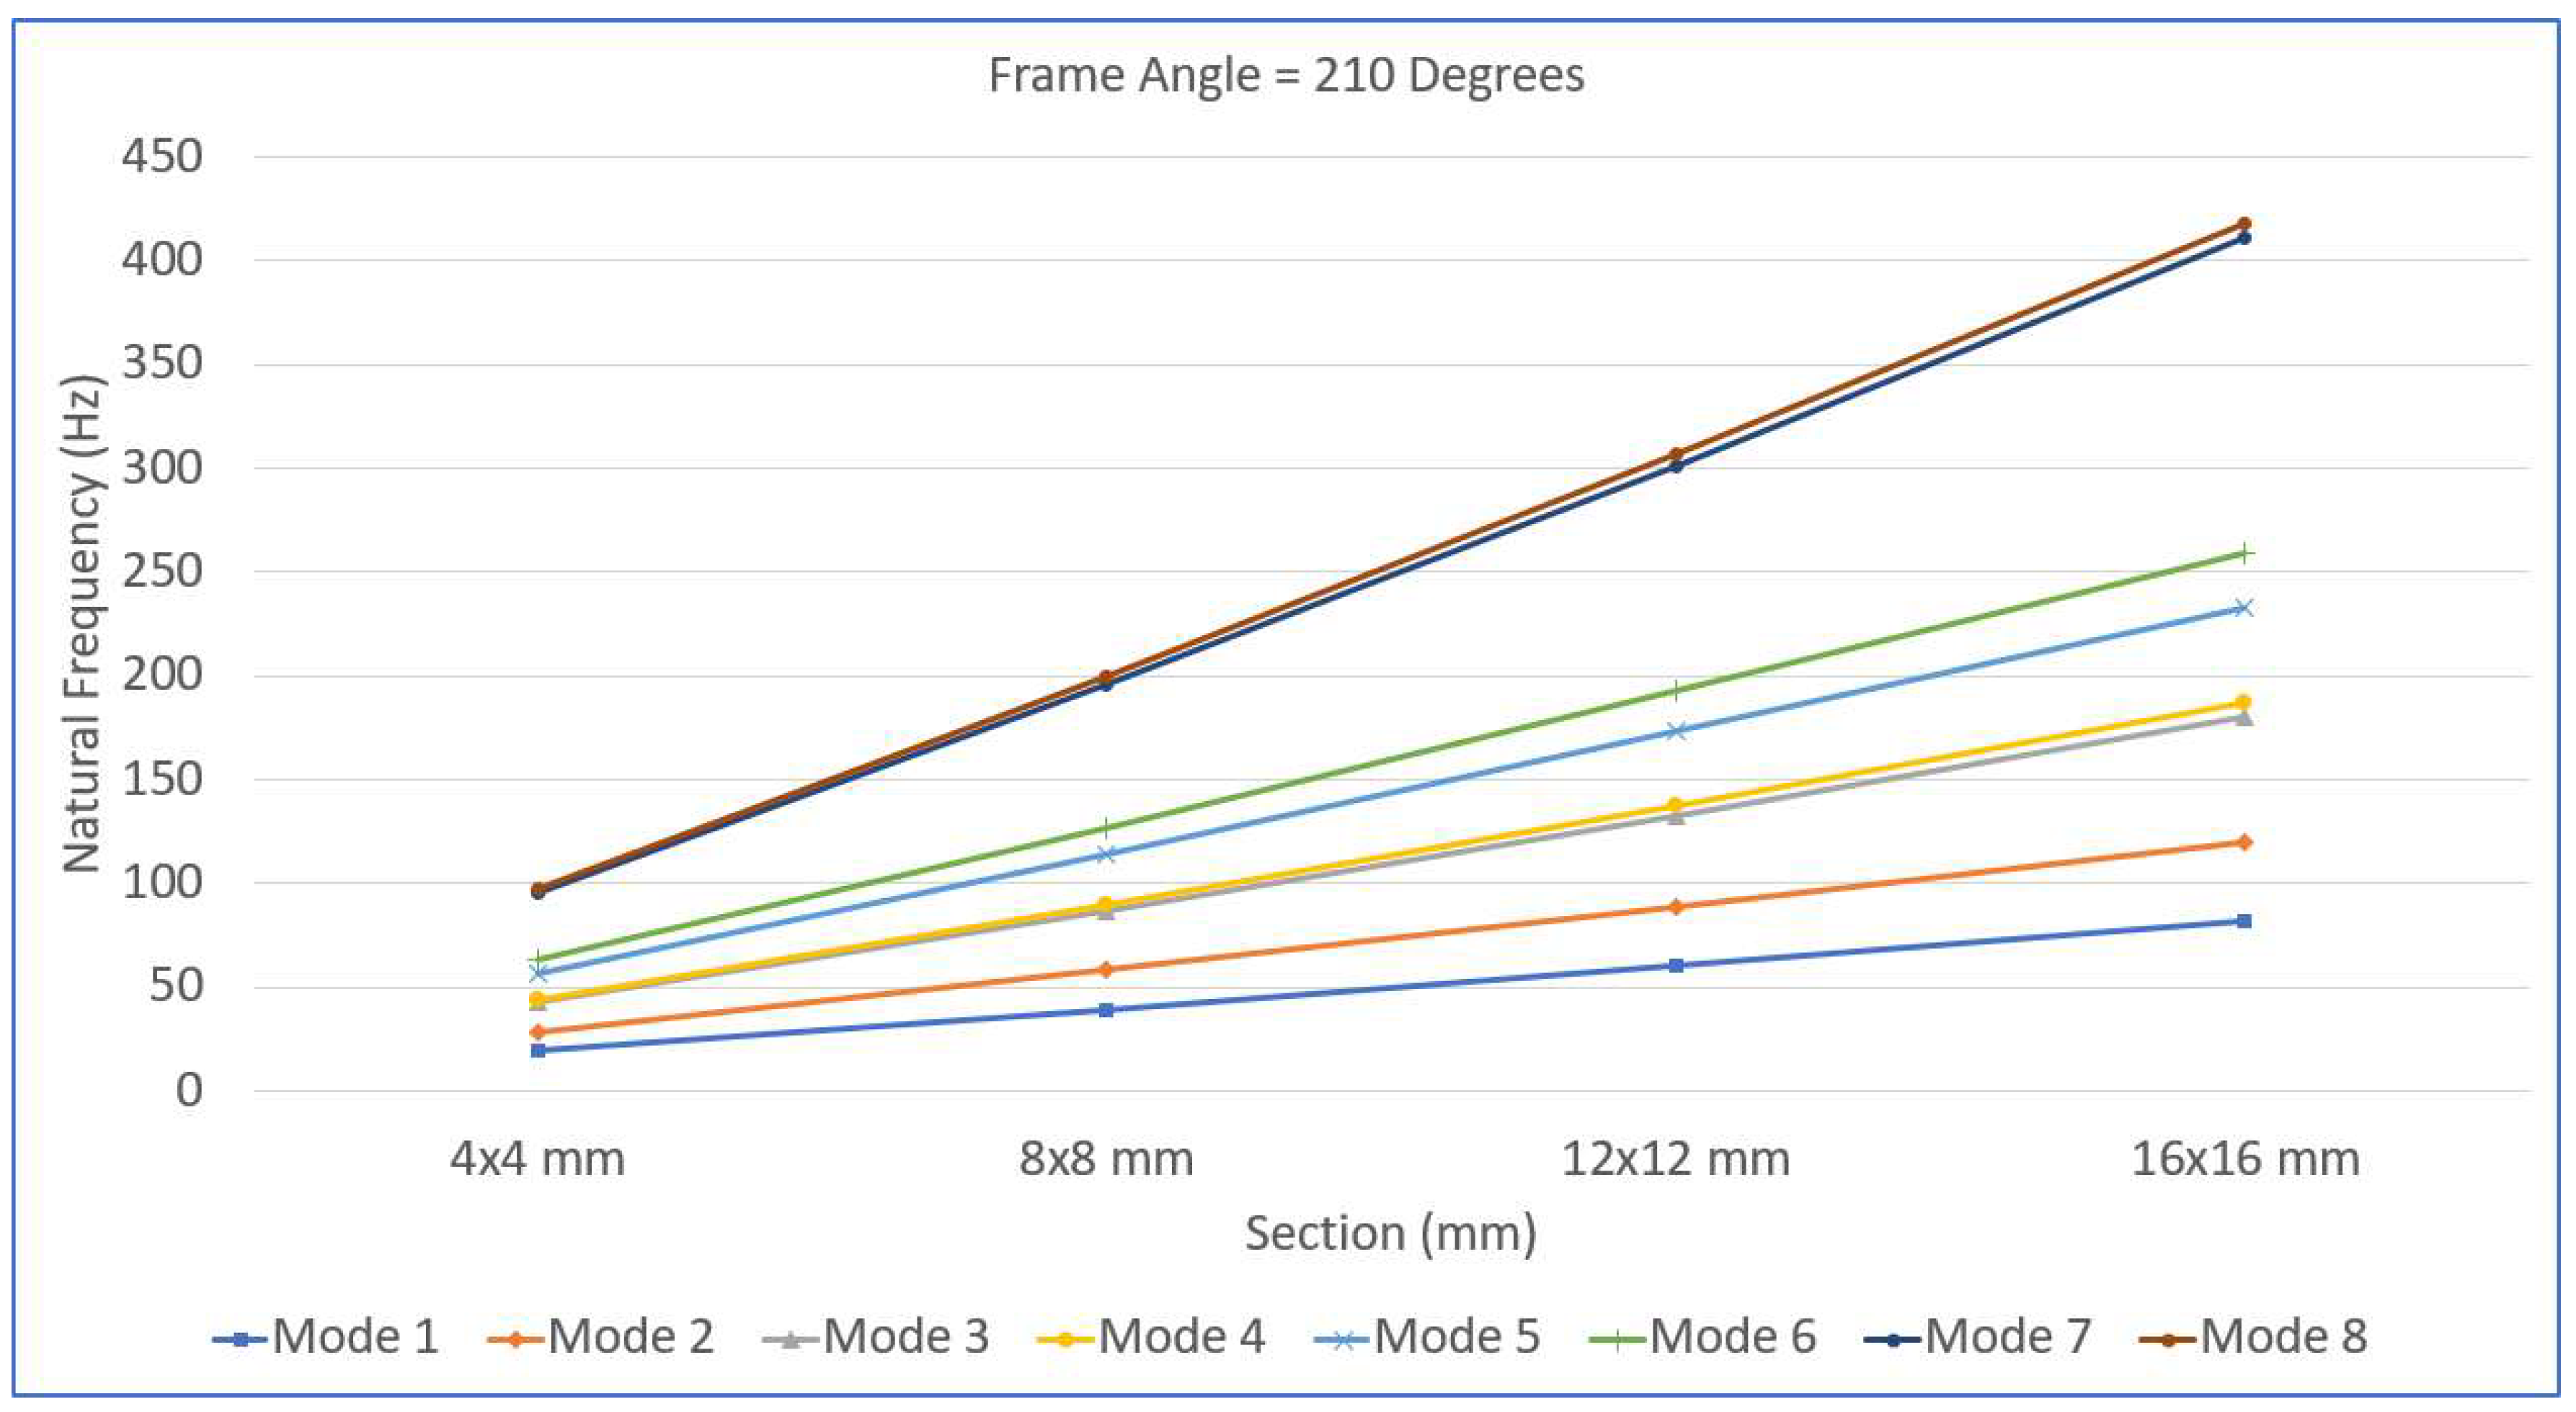
Figure 17.
Variations in the natural frequencies with respect to the cross-sectional dimensions for a 2400 frame angle.
Figure 17.
Variations in the natural frequencies with respect to the cross-sectional dimensions for a 2400 frame angle.
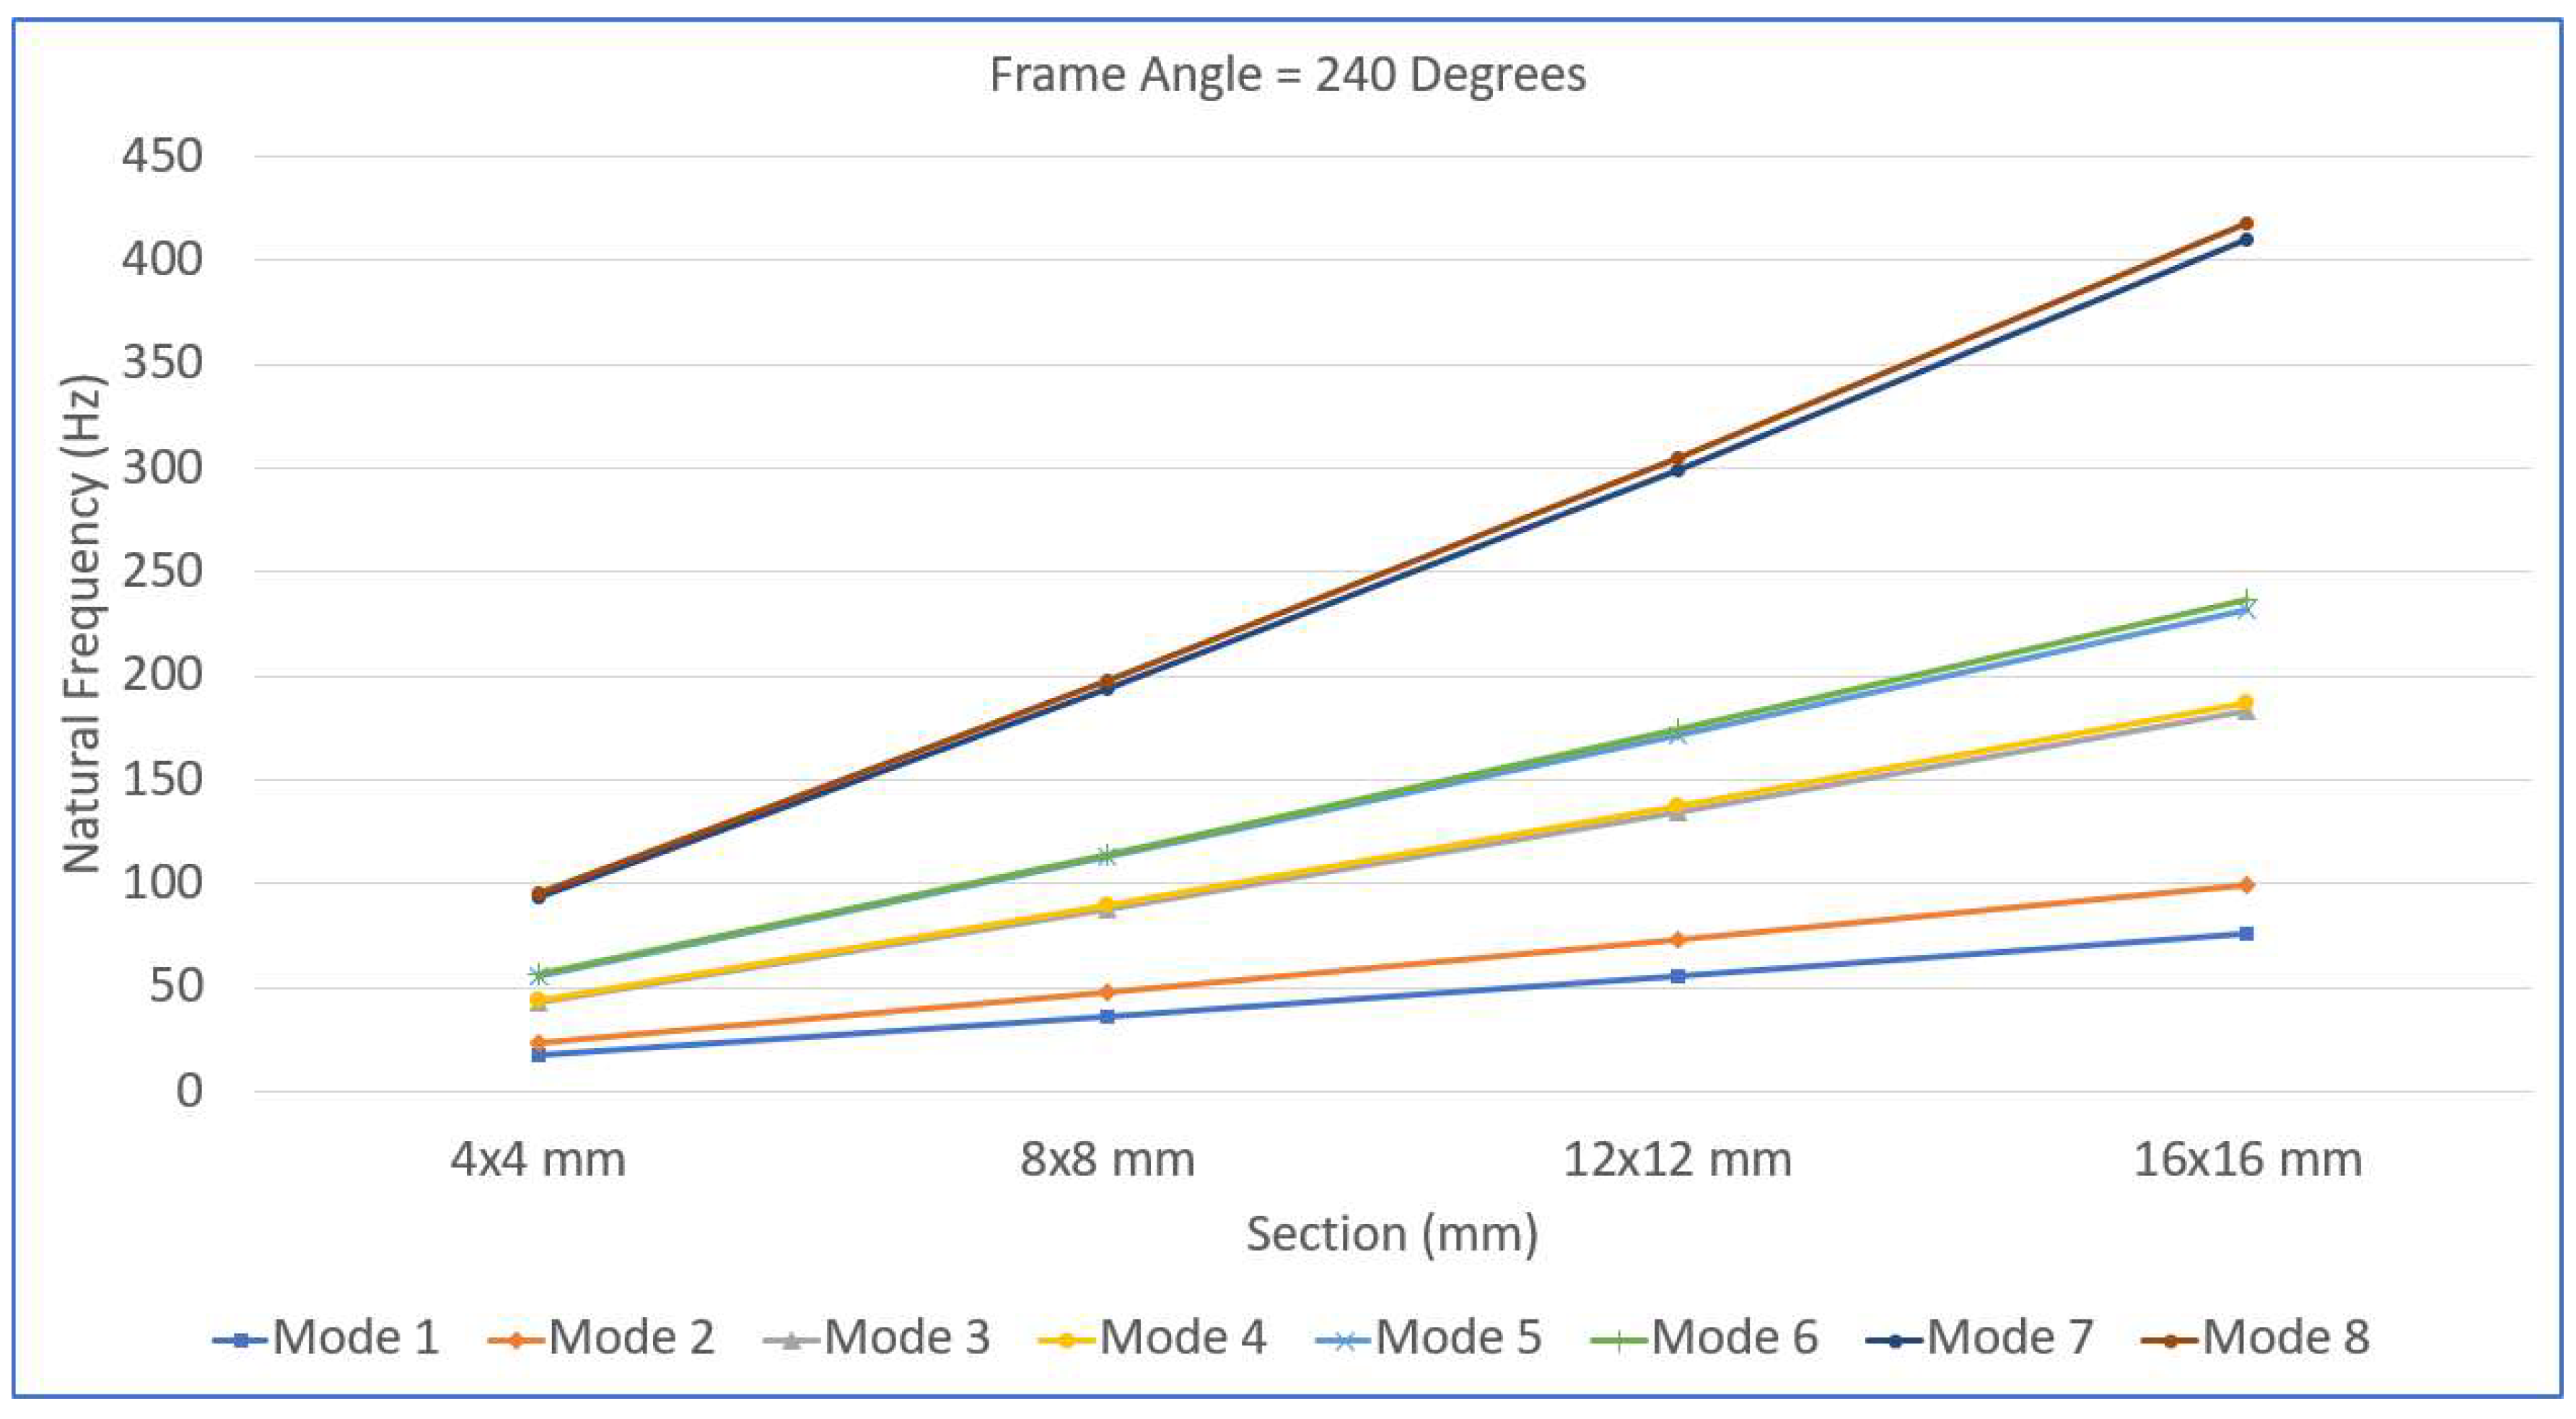
Figure 18.
A quadratic polynomial surface regression plot for Mode 1.
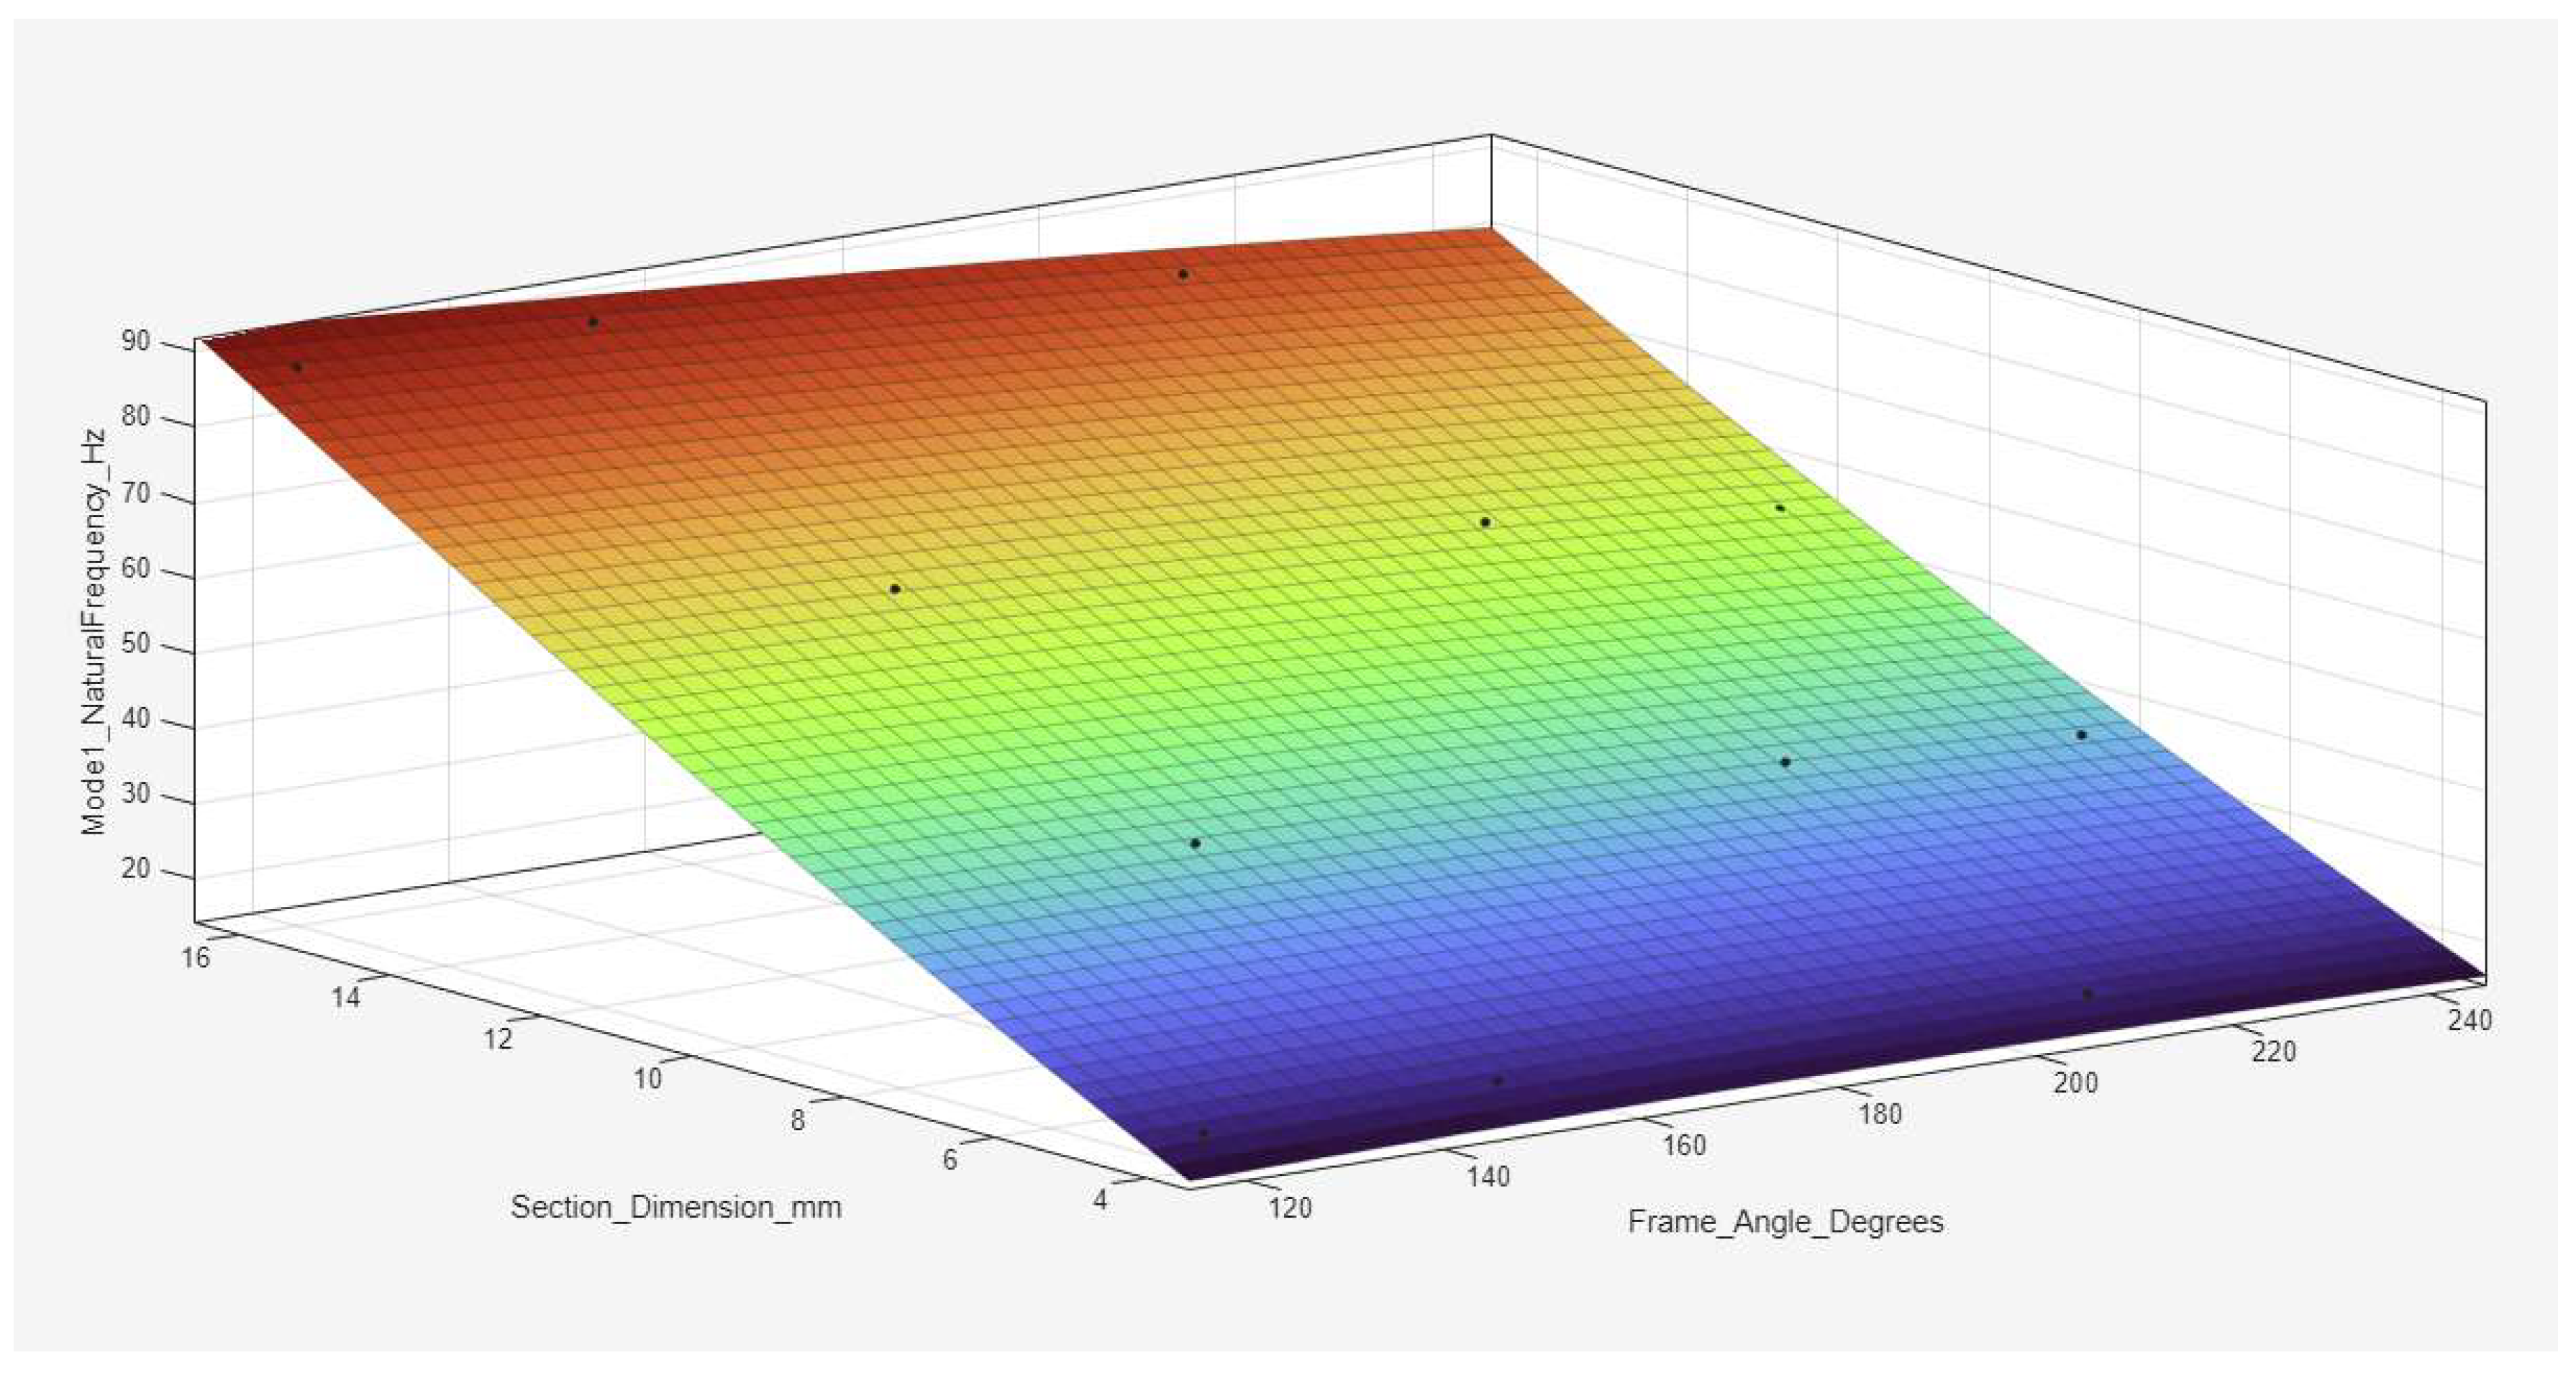
Figure 19.
A quadratic polynomial surface regression plot for Mode 2.
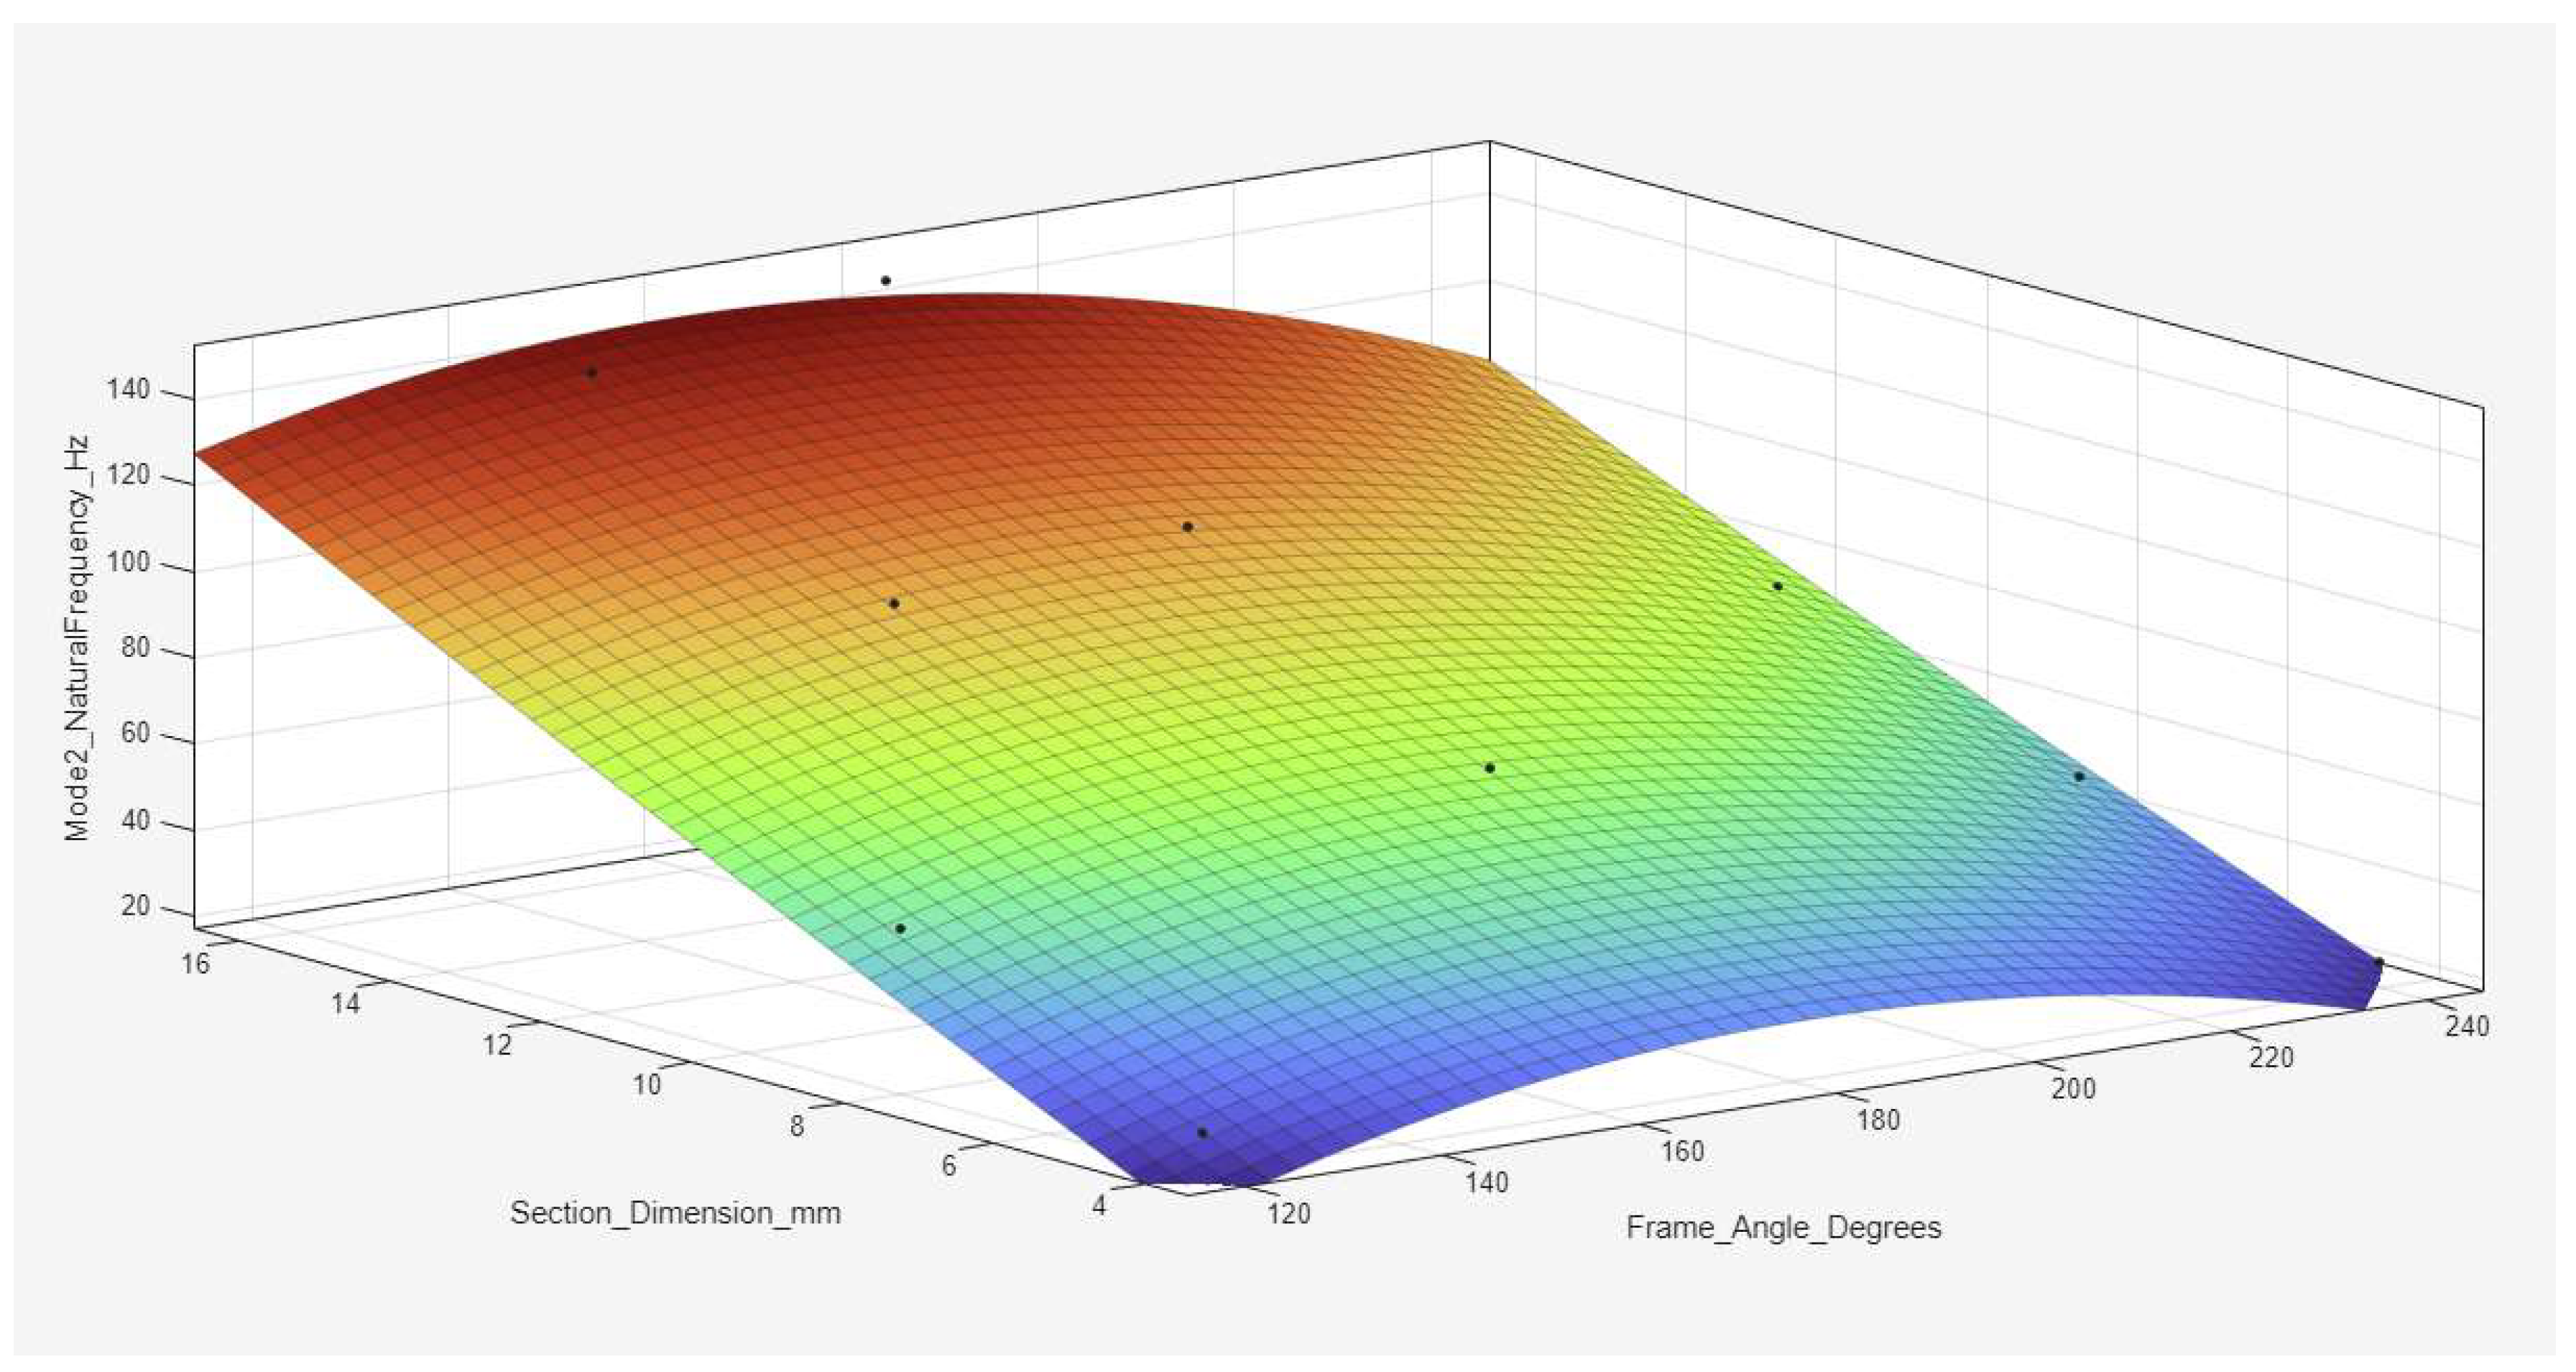
Figure 20.
A quadratic polynomial surface regression plot for Mode 3.
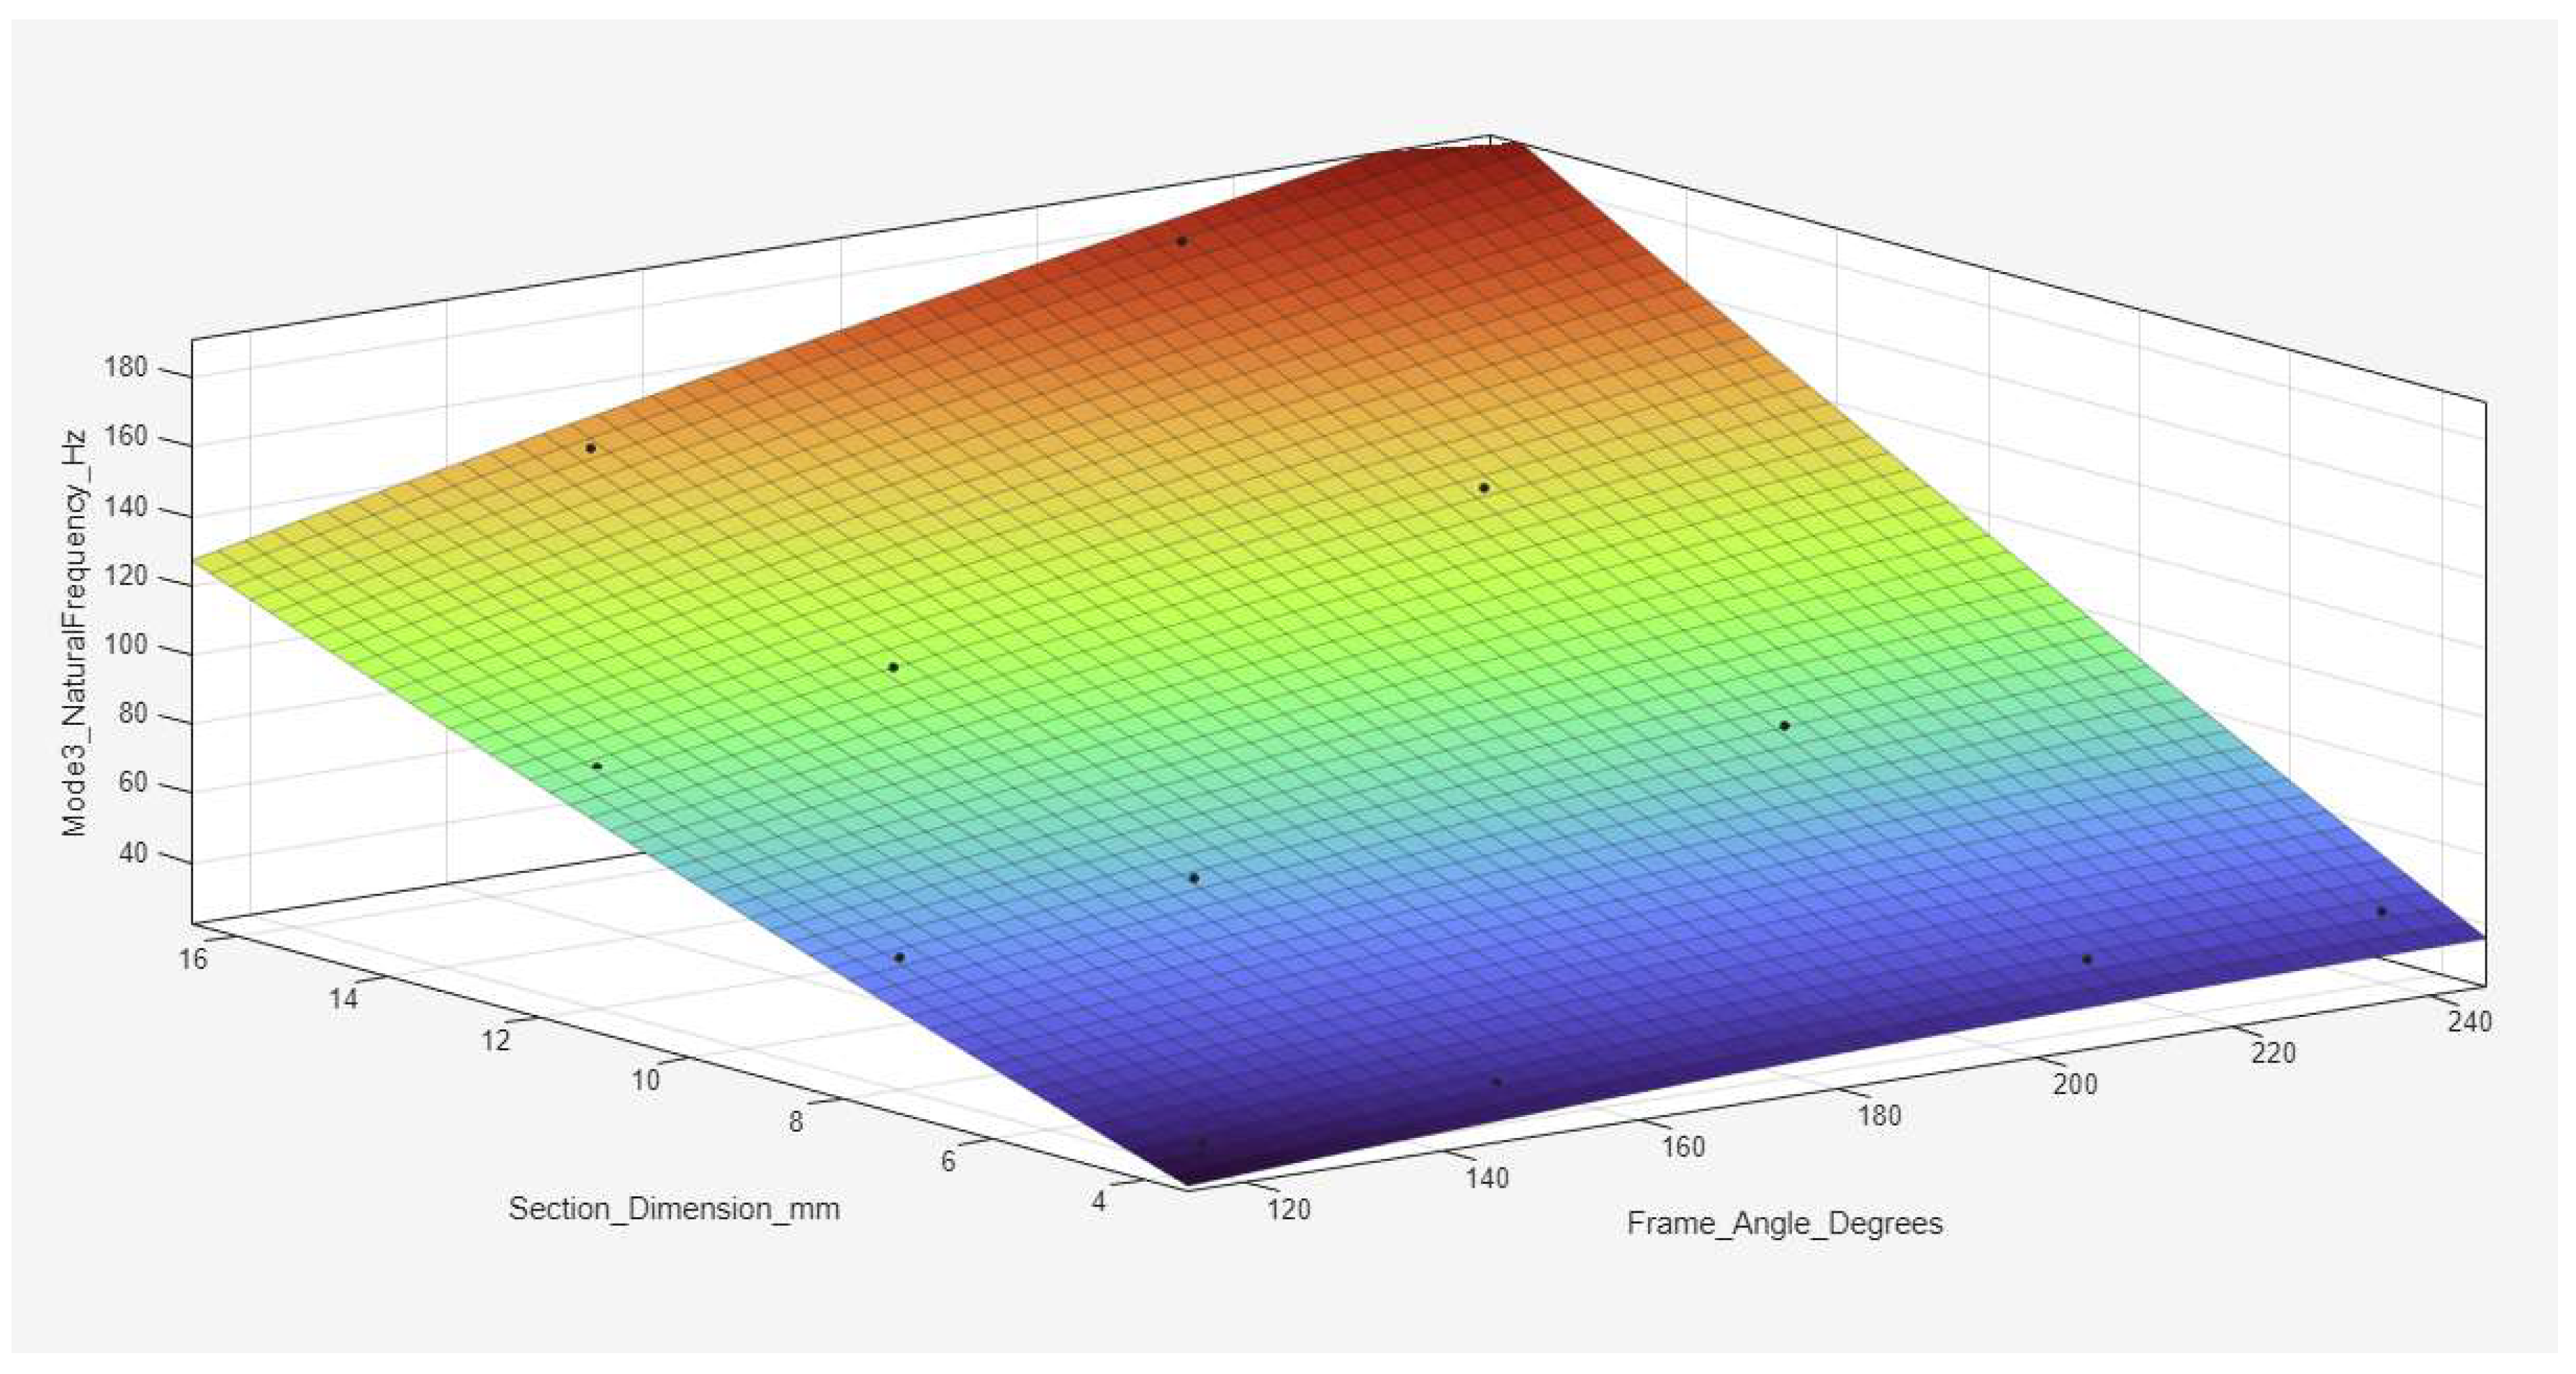
Figure 21.
A quadratic polynomial surface regression plot for Mode 4.
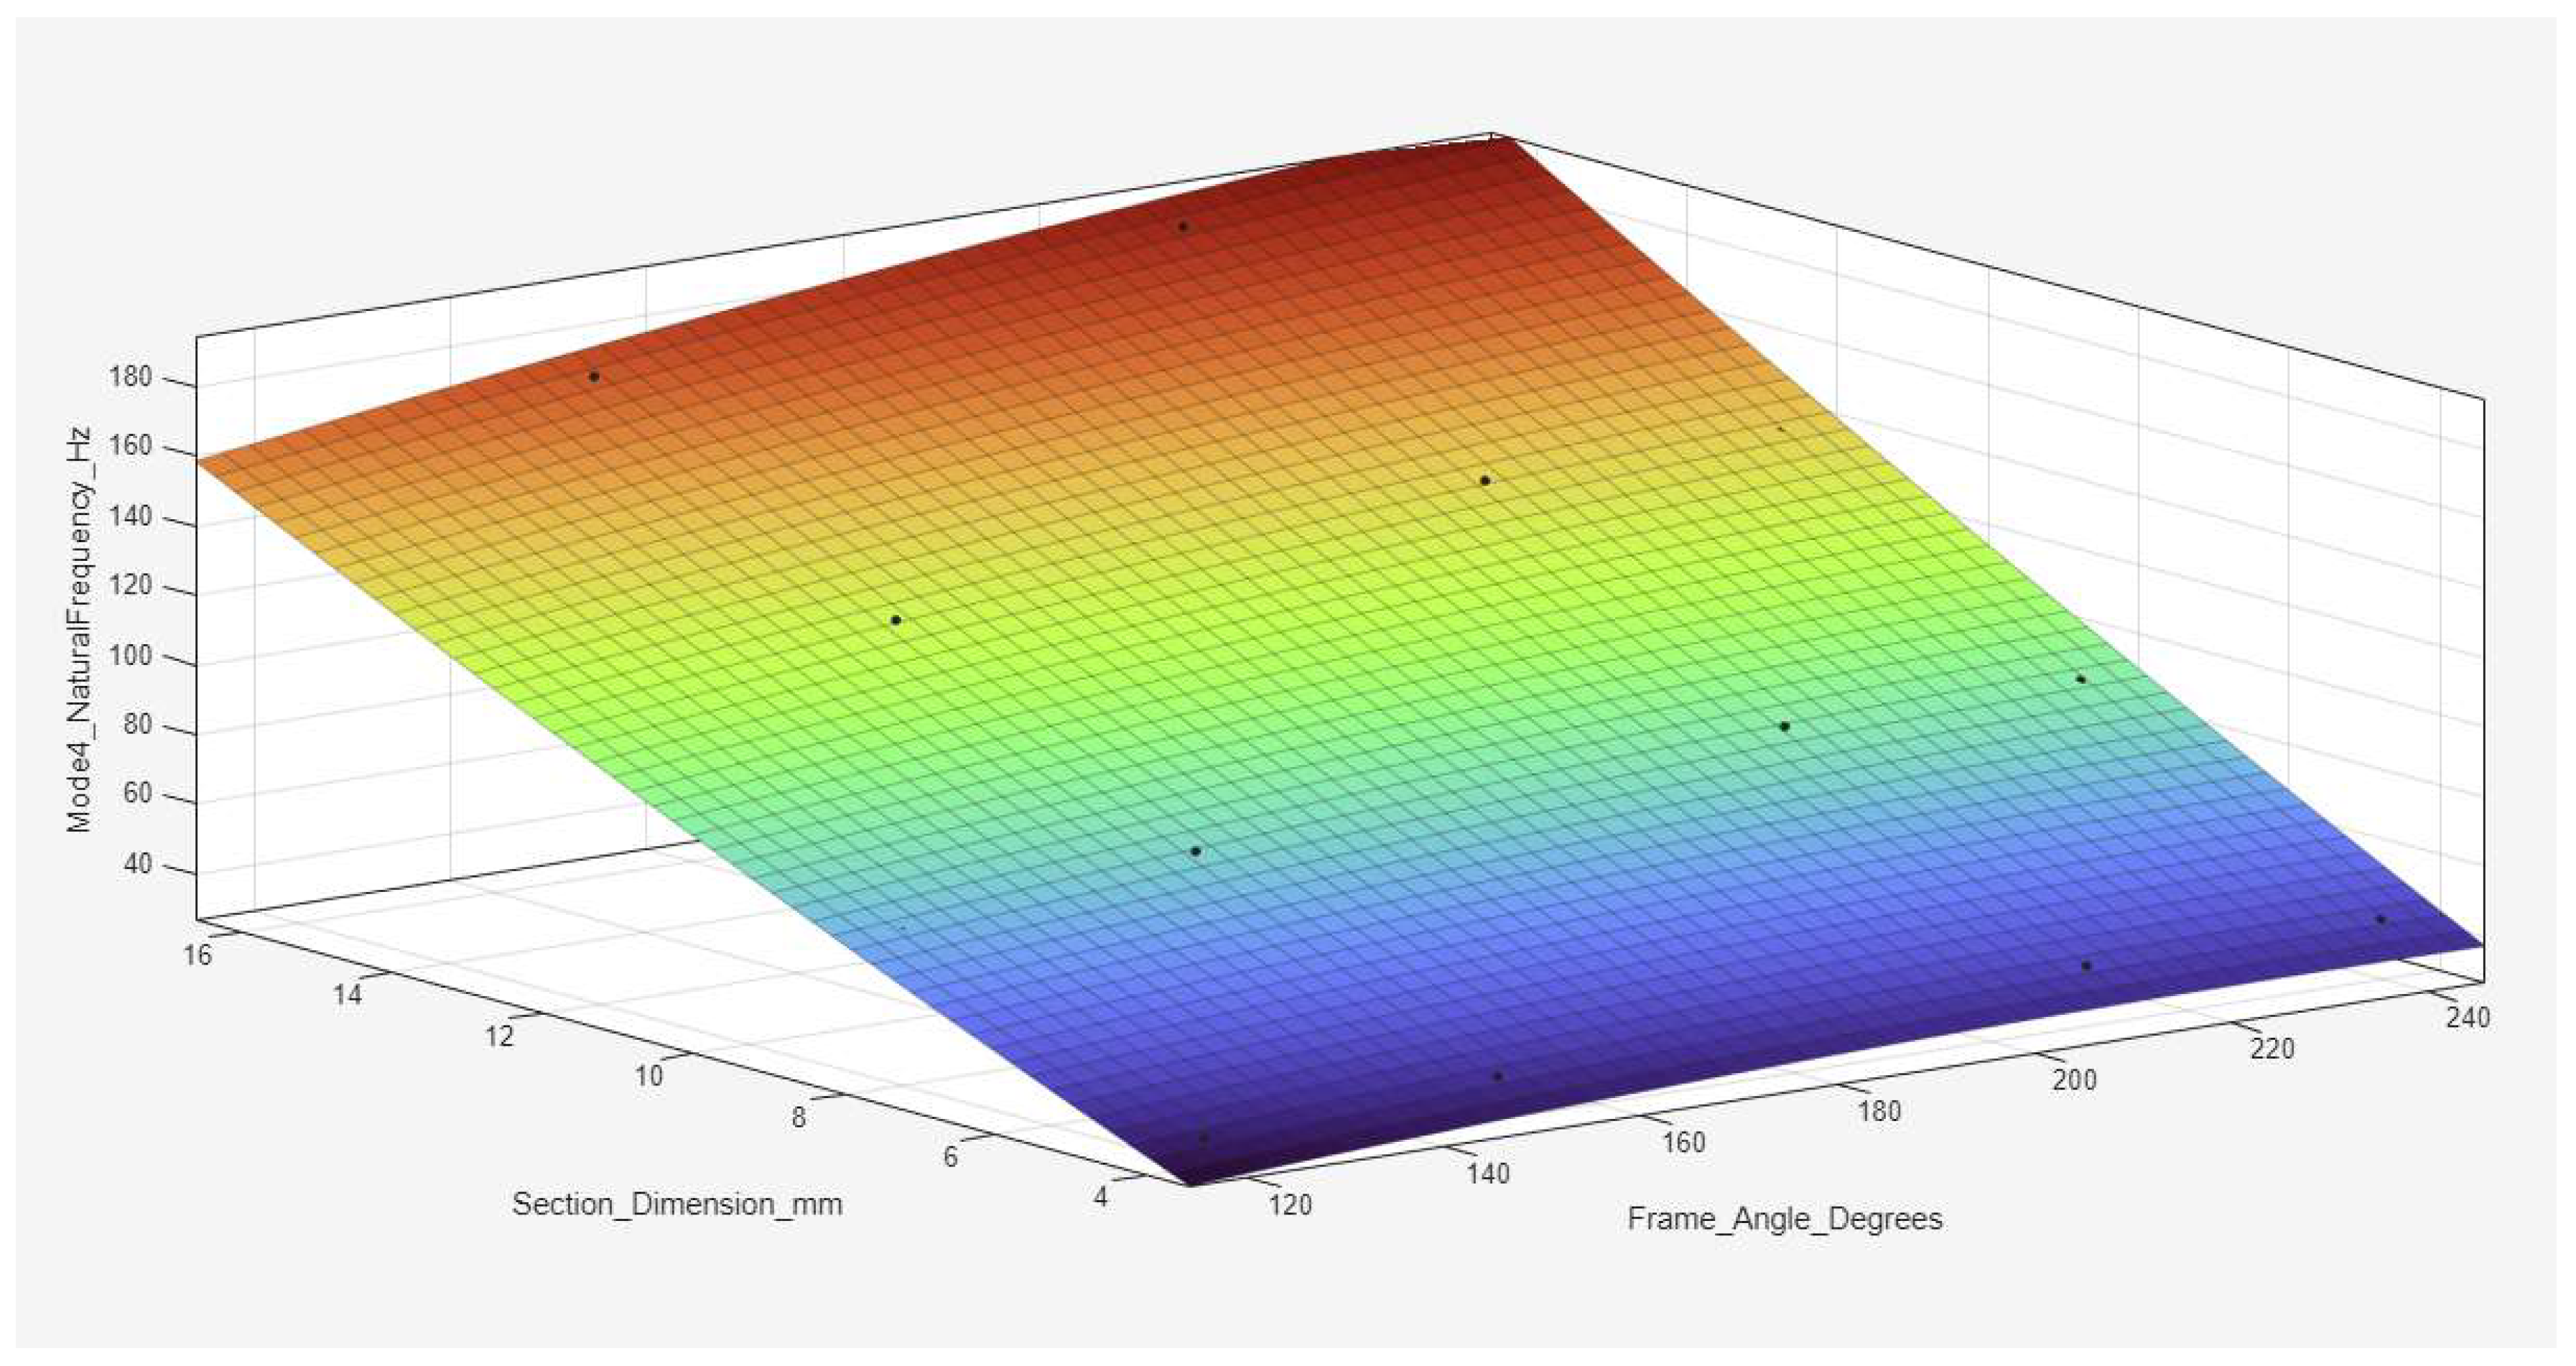
Figure 22.
A quadratic polynomial surface regression plot for Mode 5.
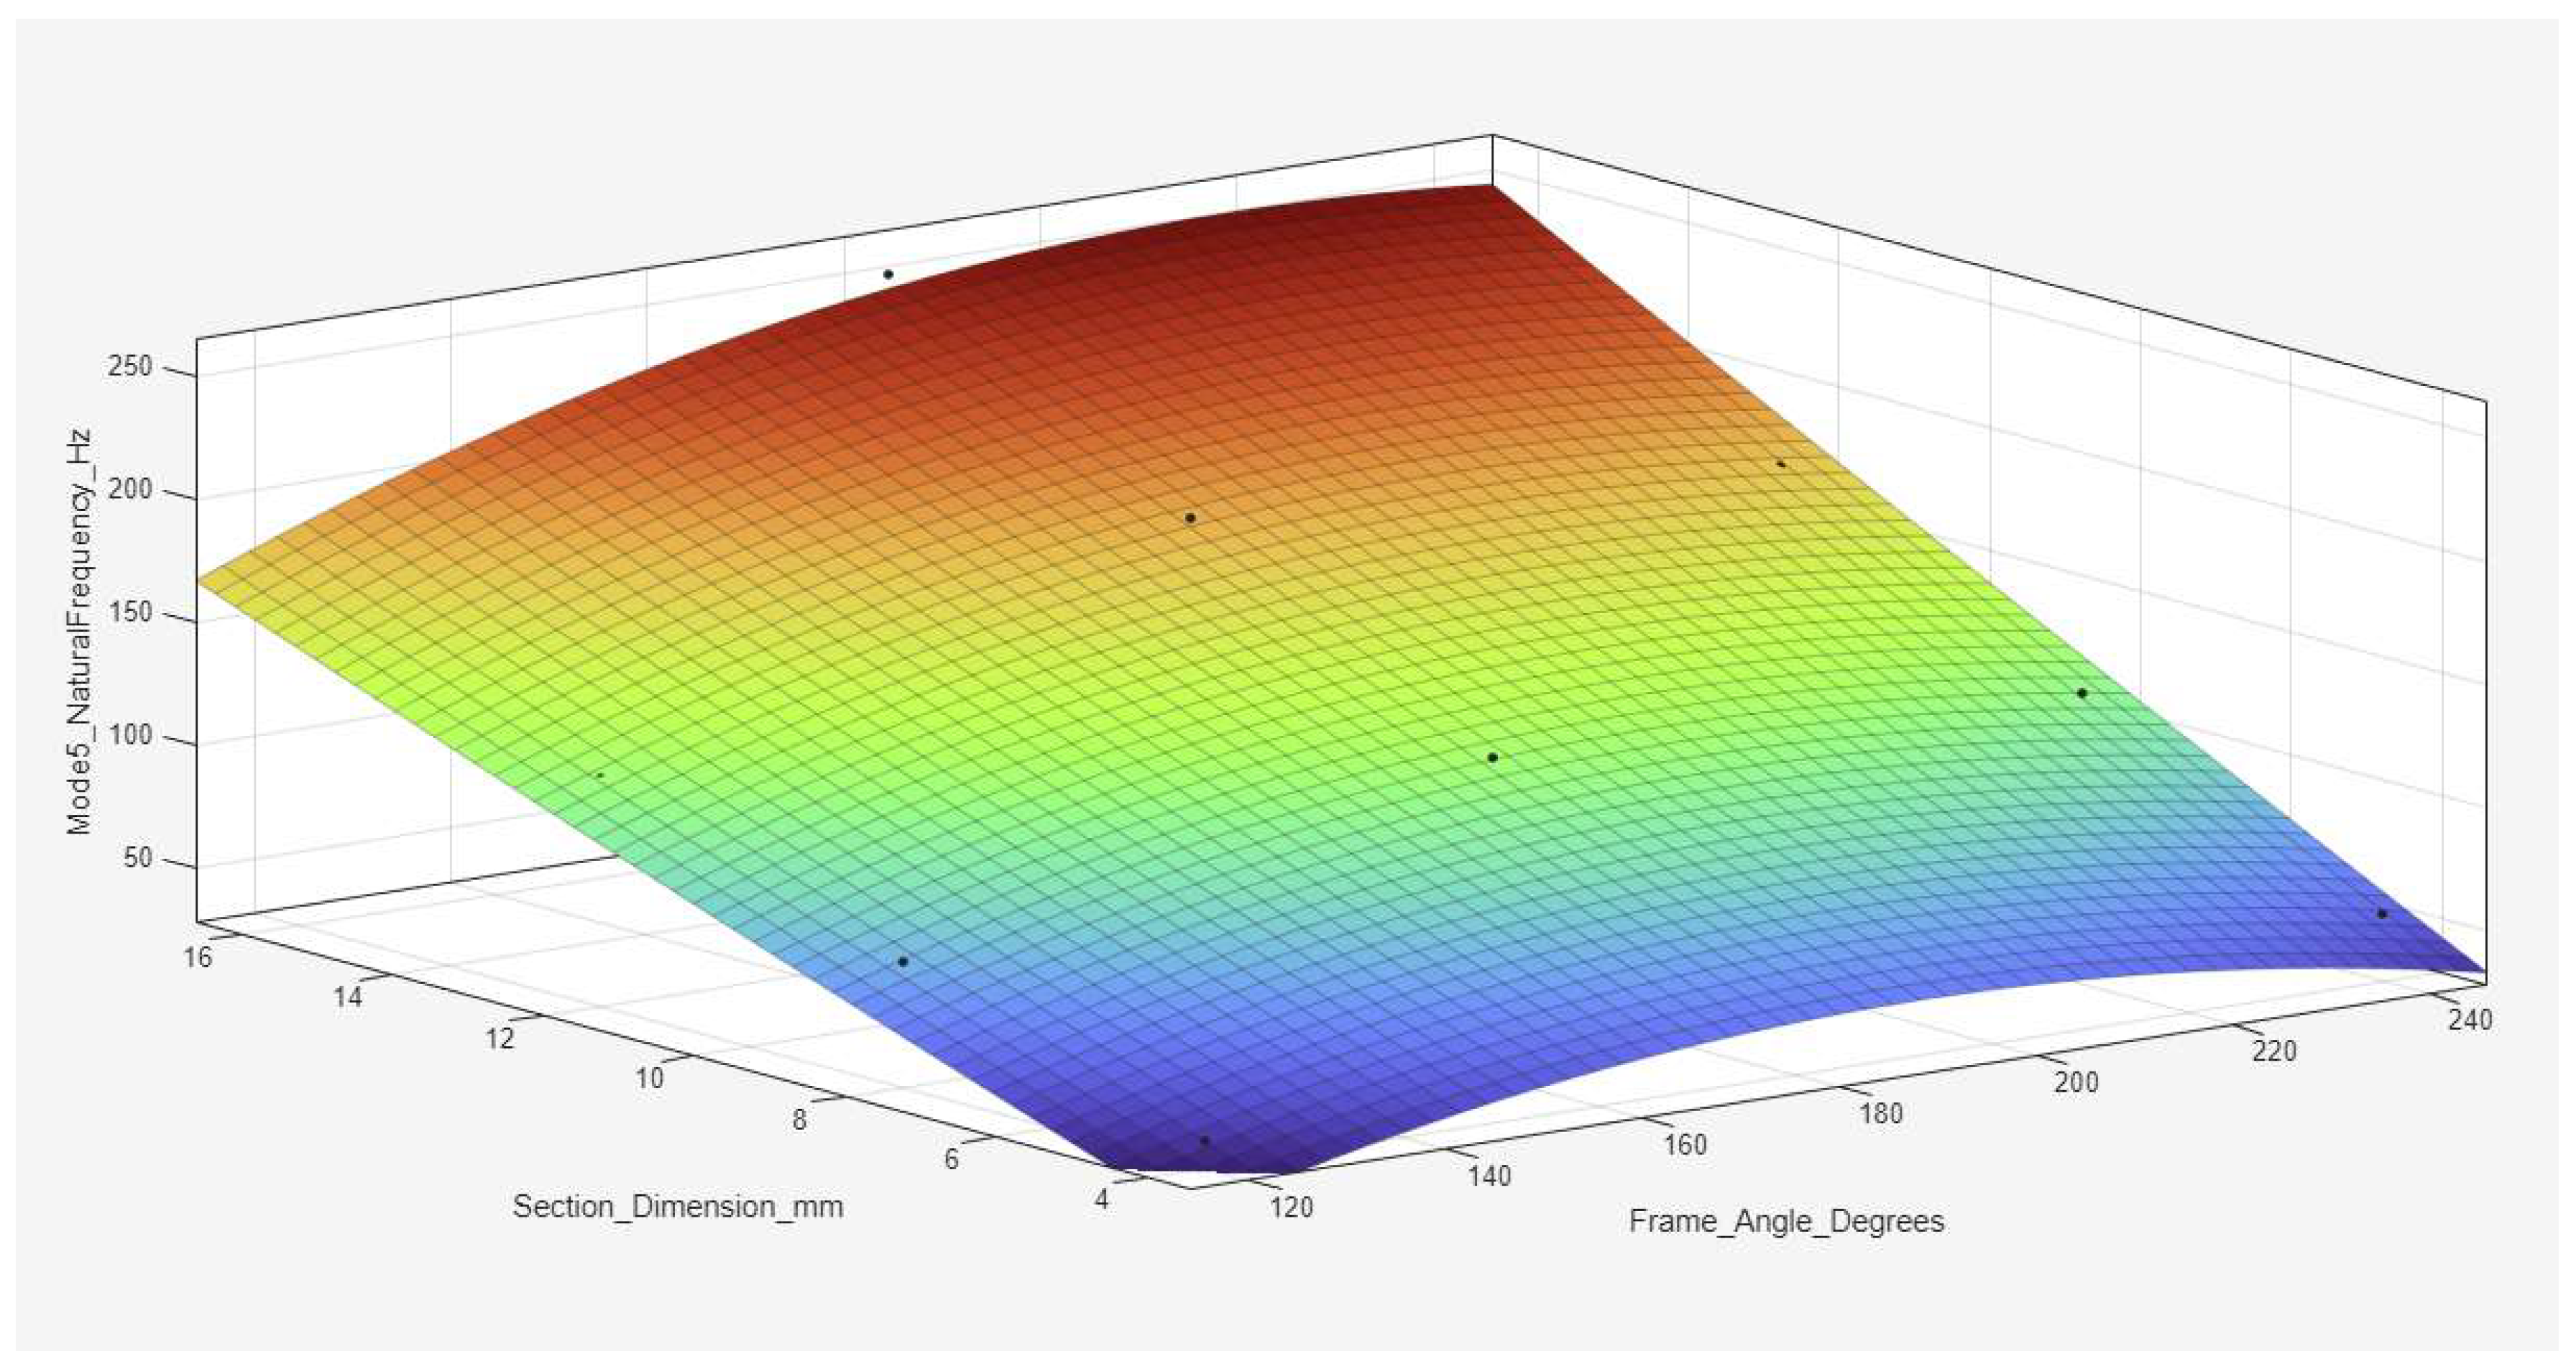
Figure 23.
A quadratic polynomial surface regression plot for Mode 6.
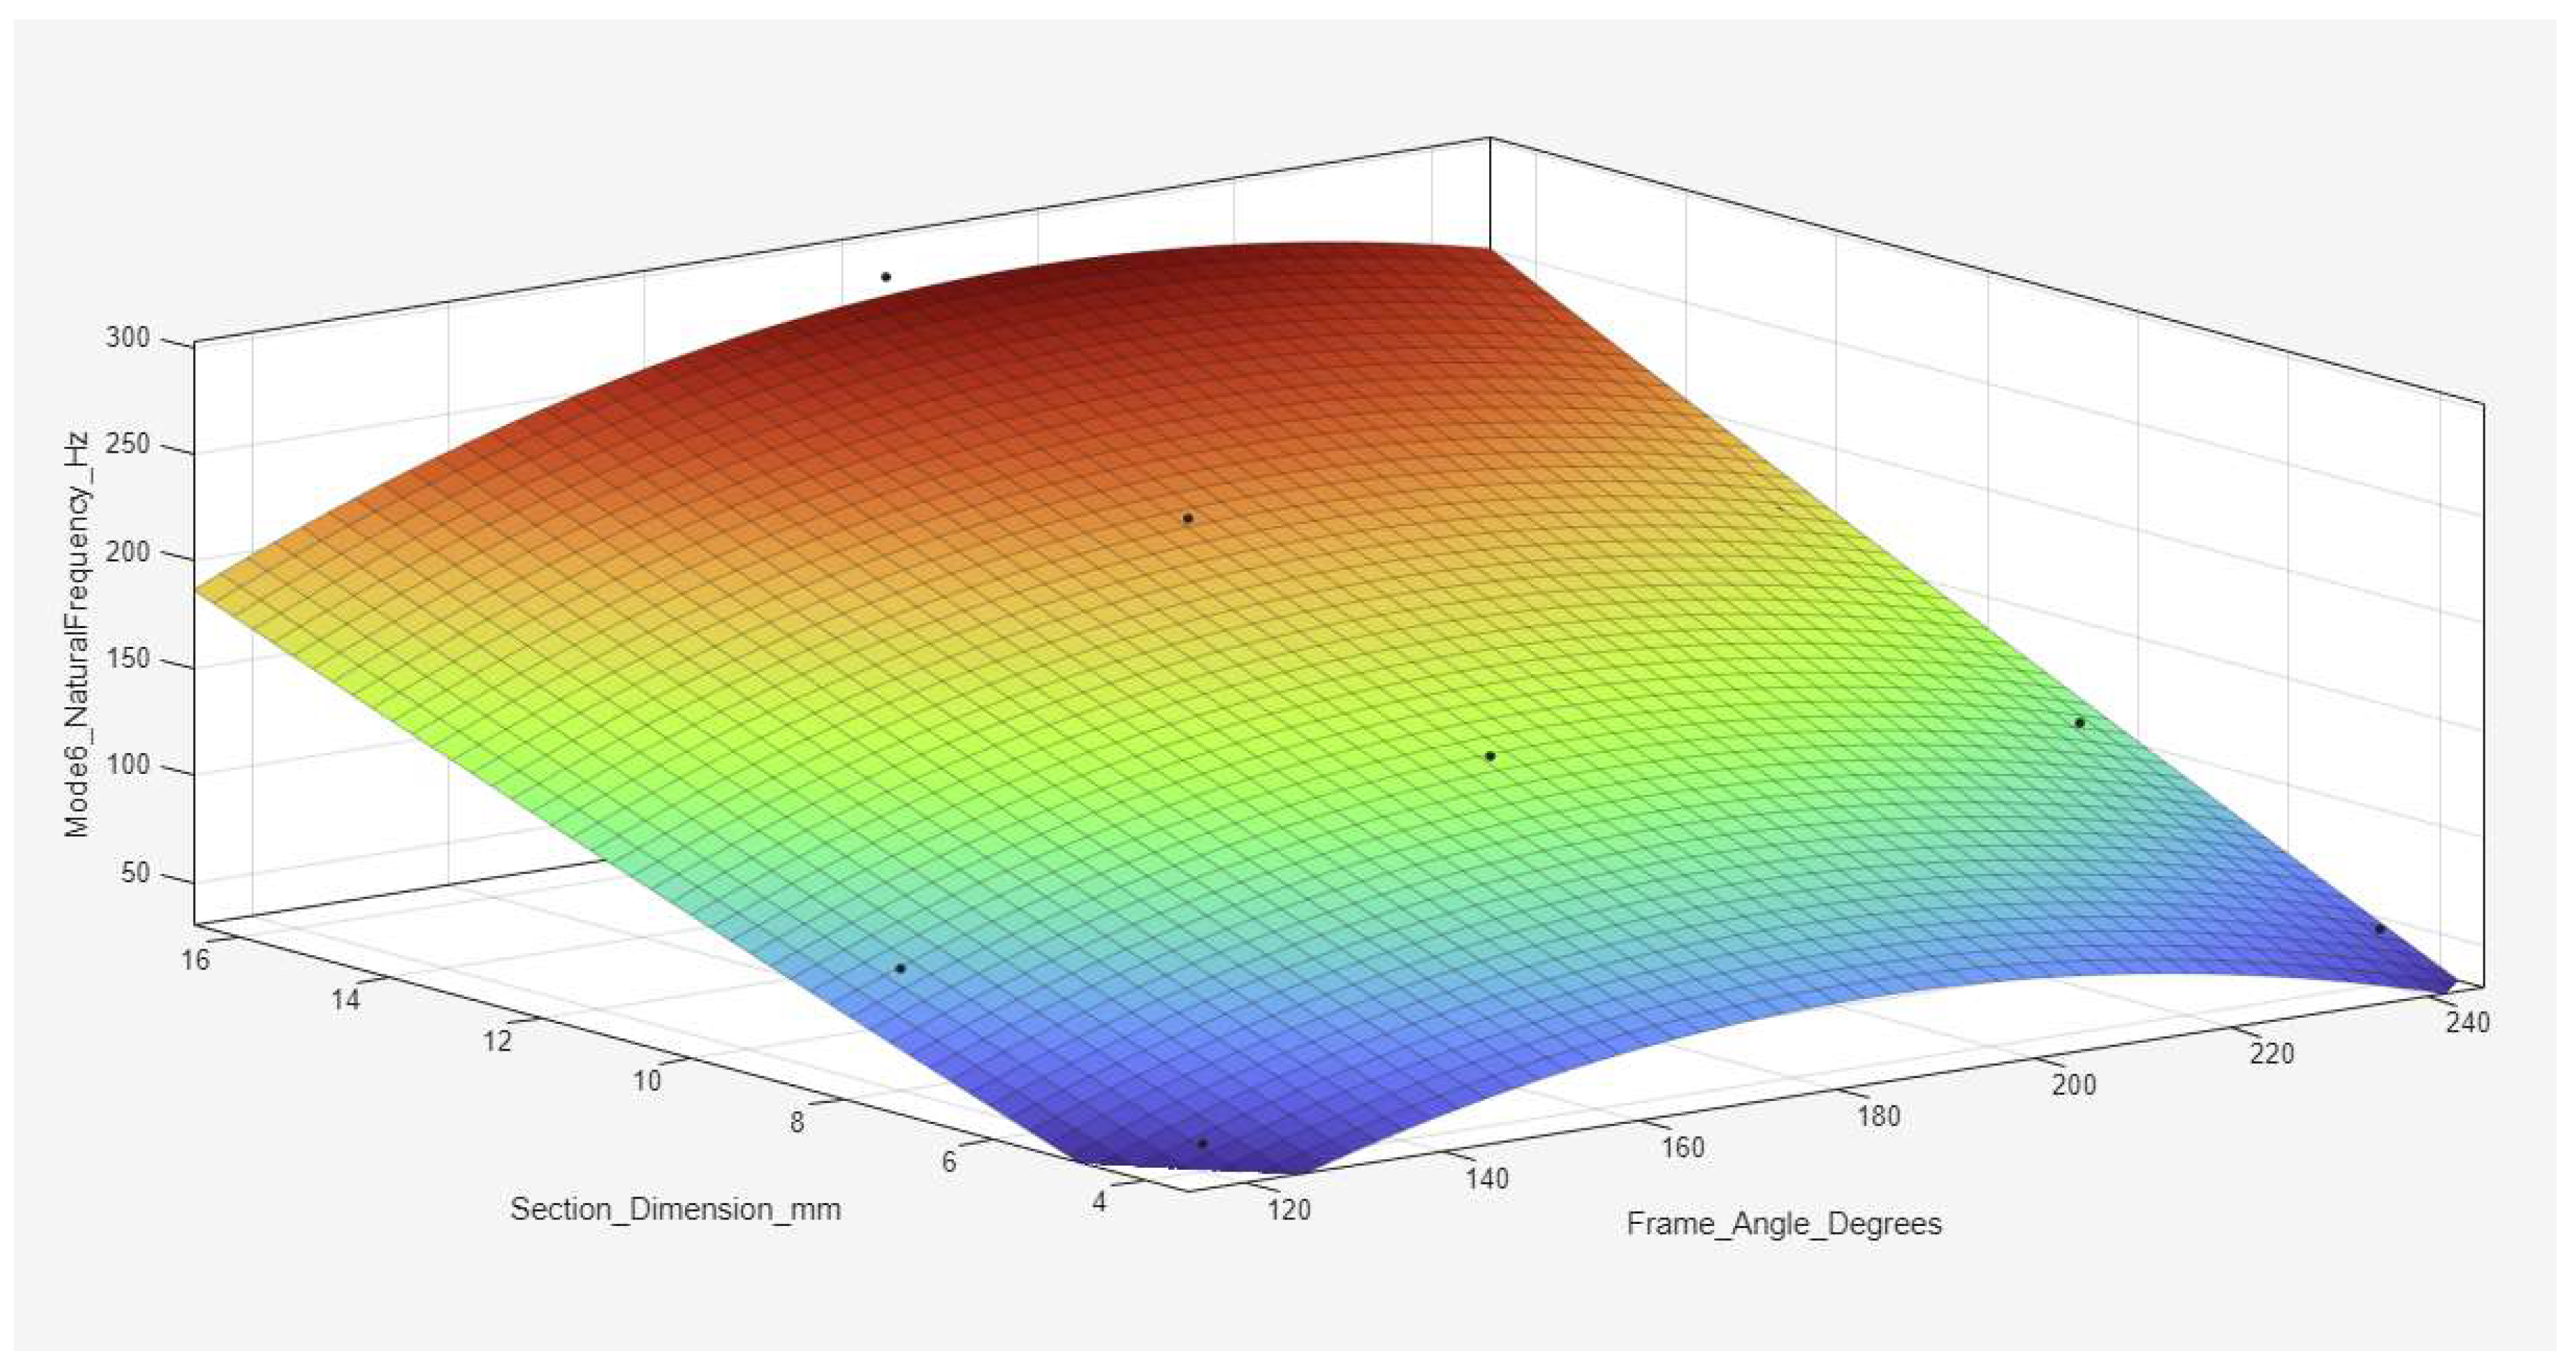
Figure 24.
A quadratic polynomial surface regression plot for Mode 7.
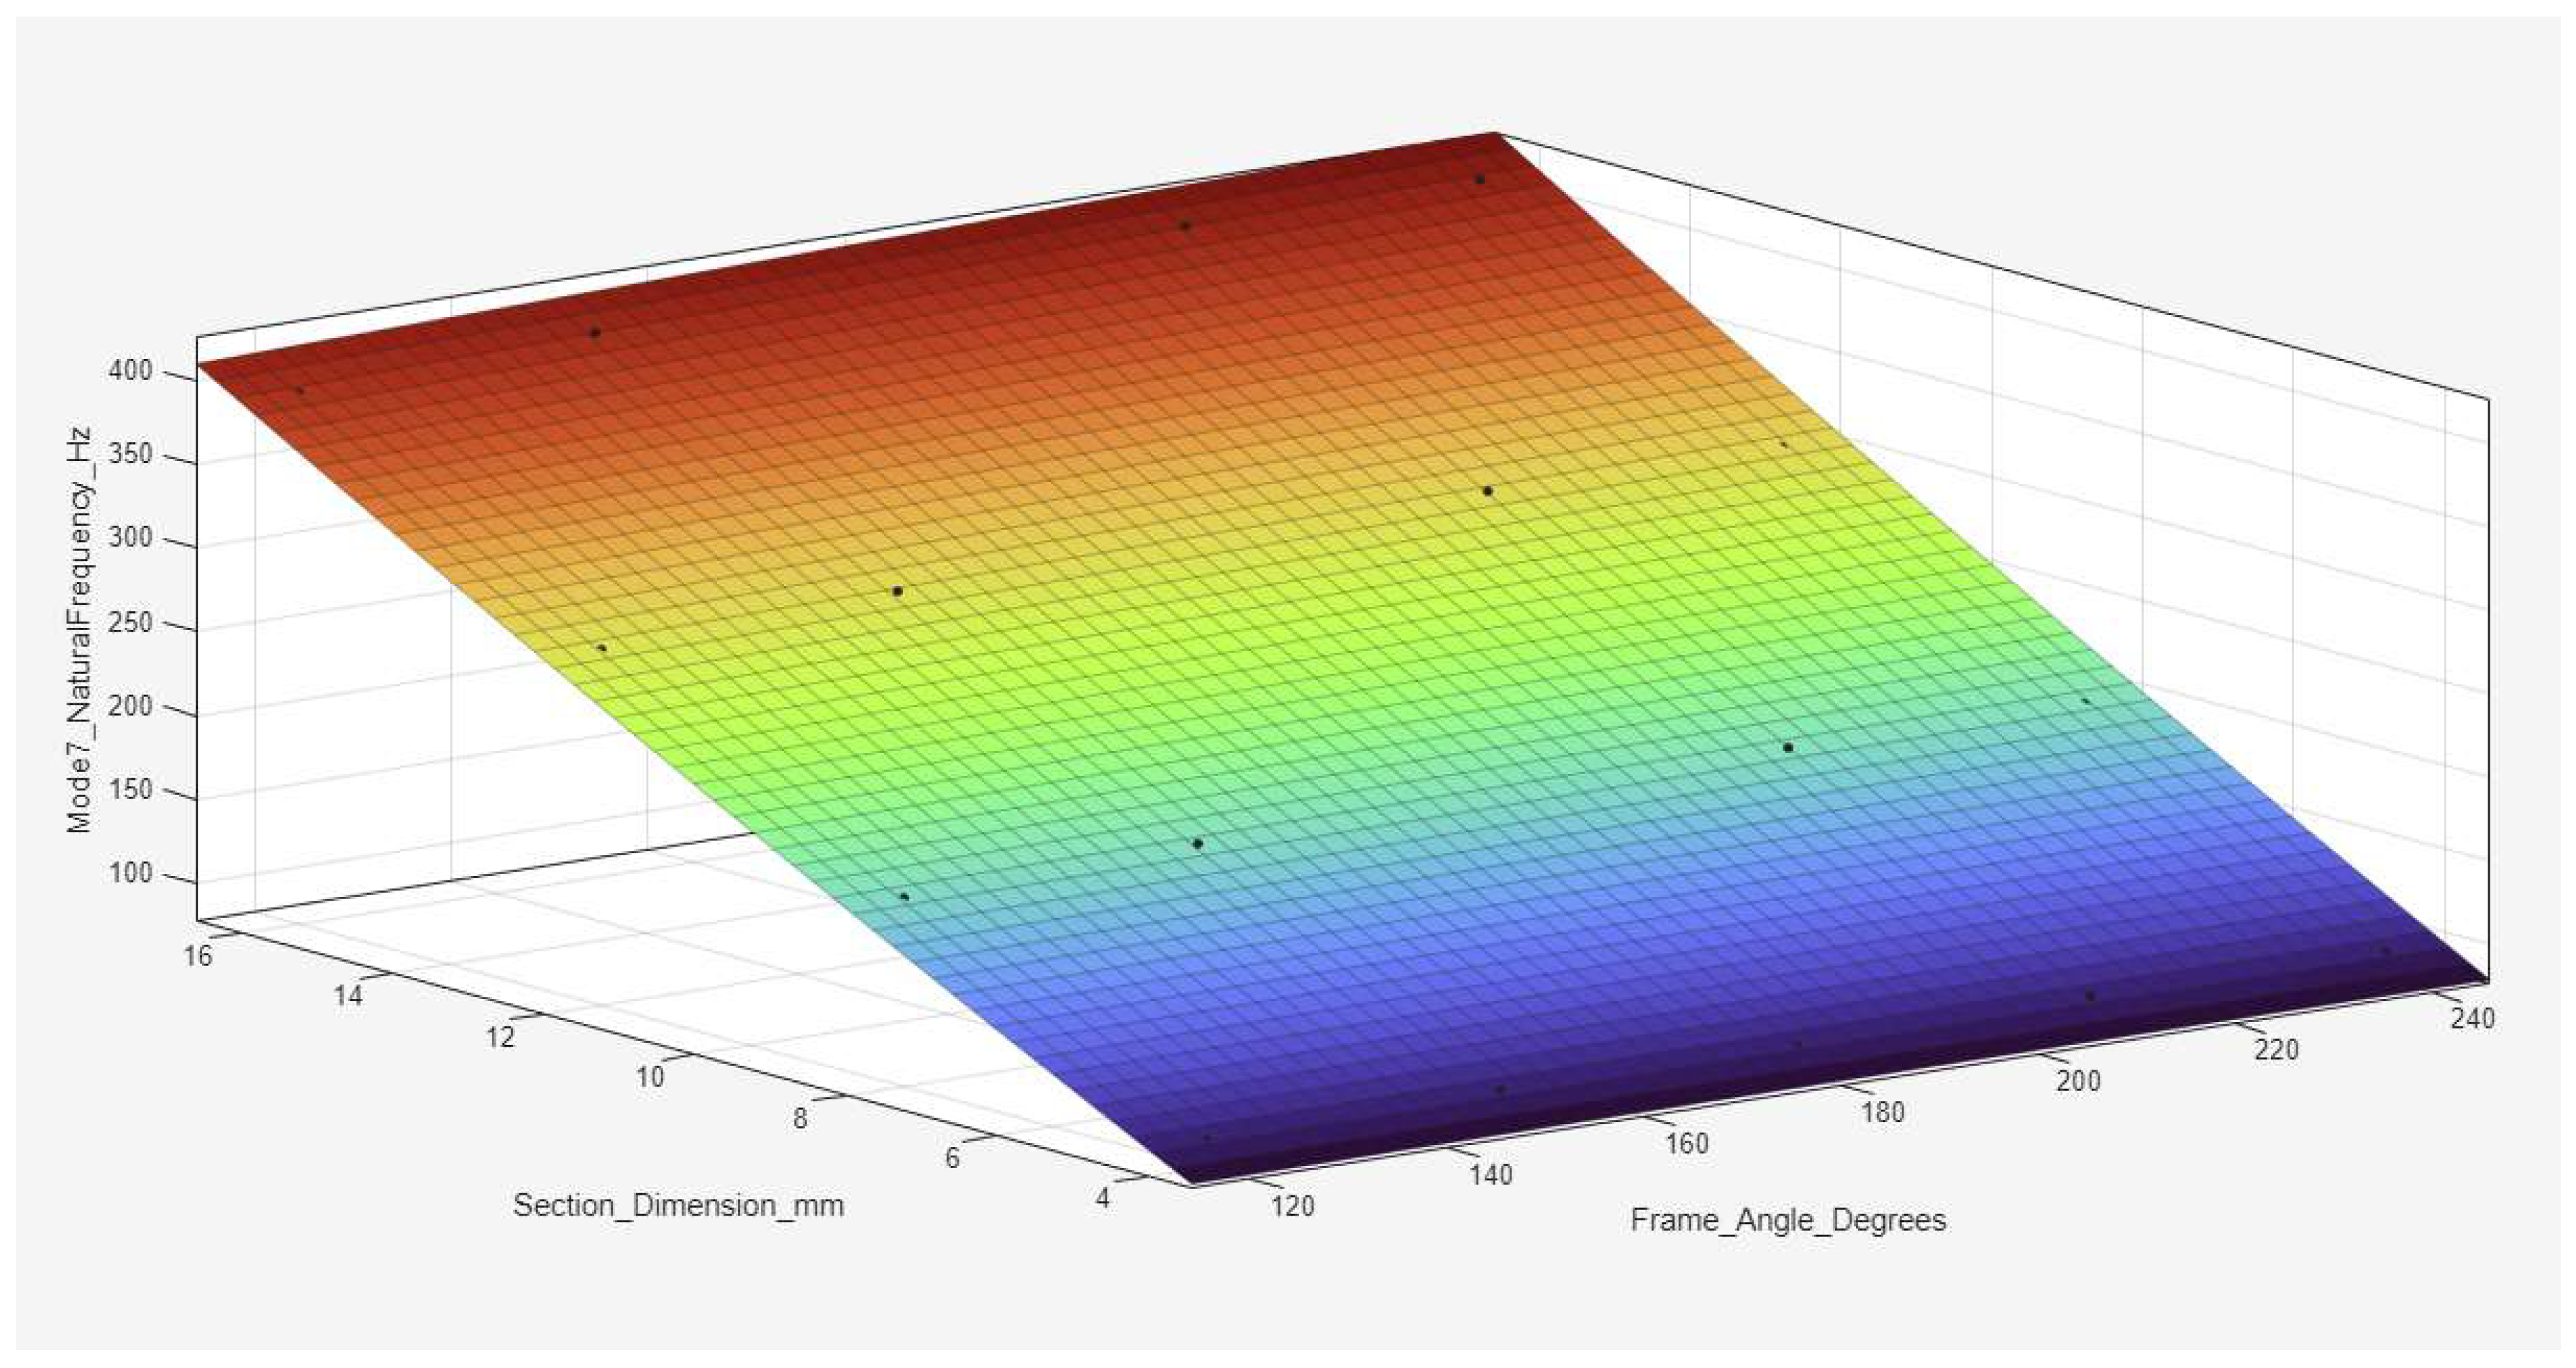
Figure 25.
A quadratic polynomial surface regression plot for Mode 8.
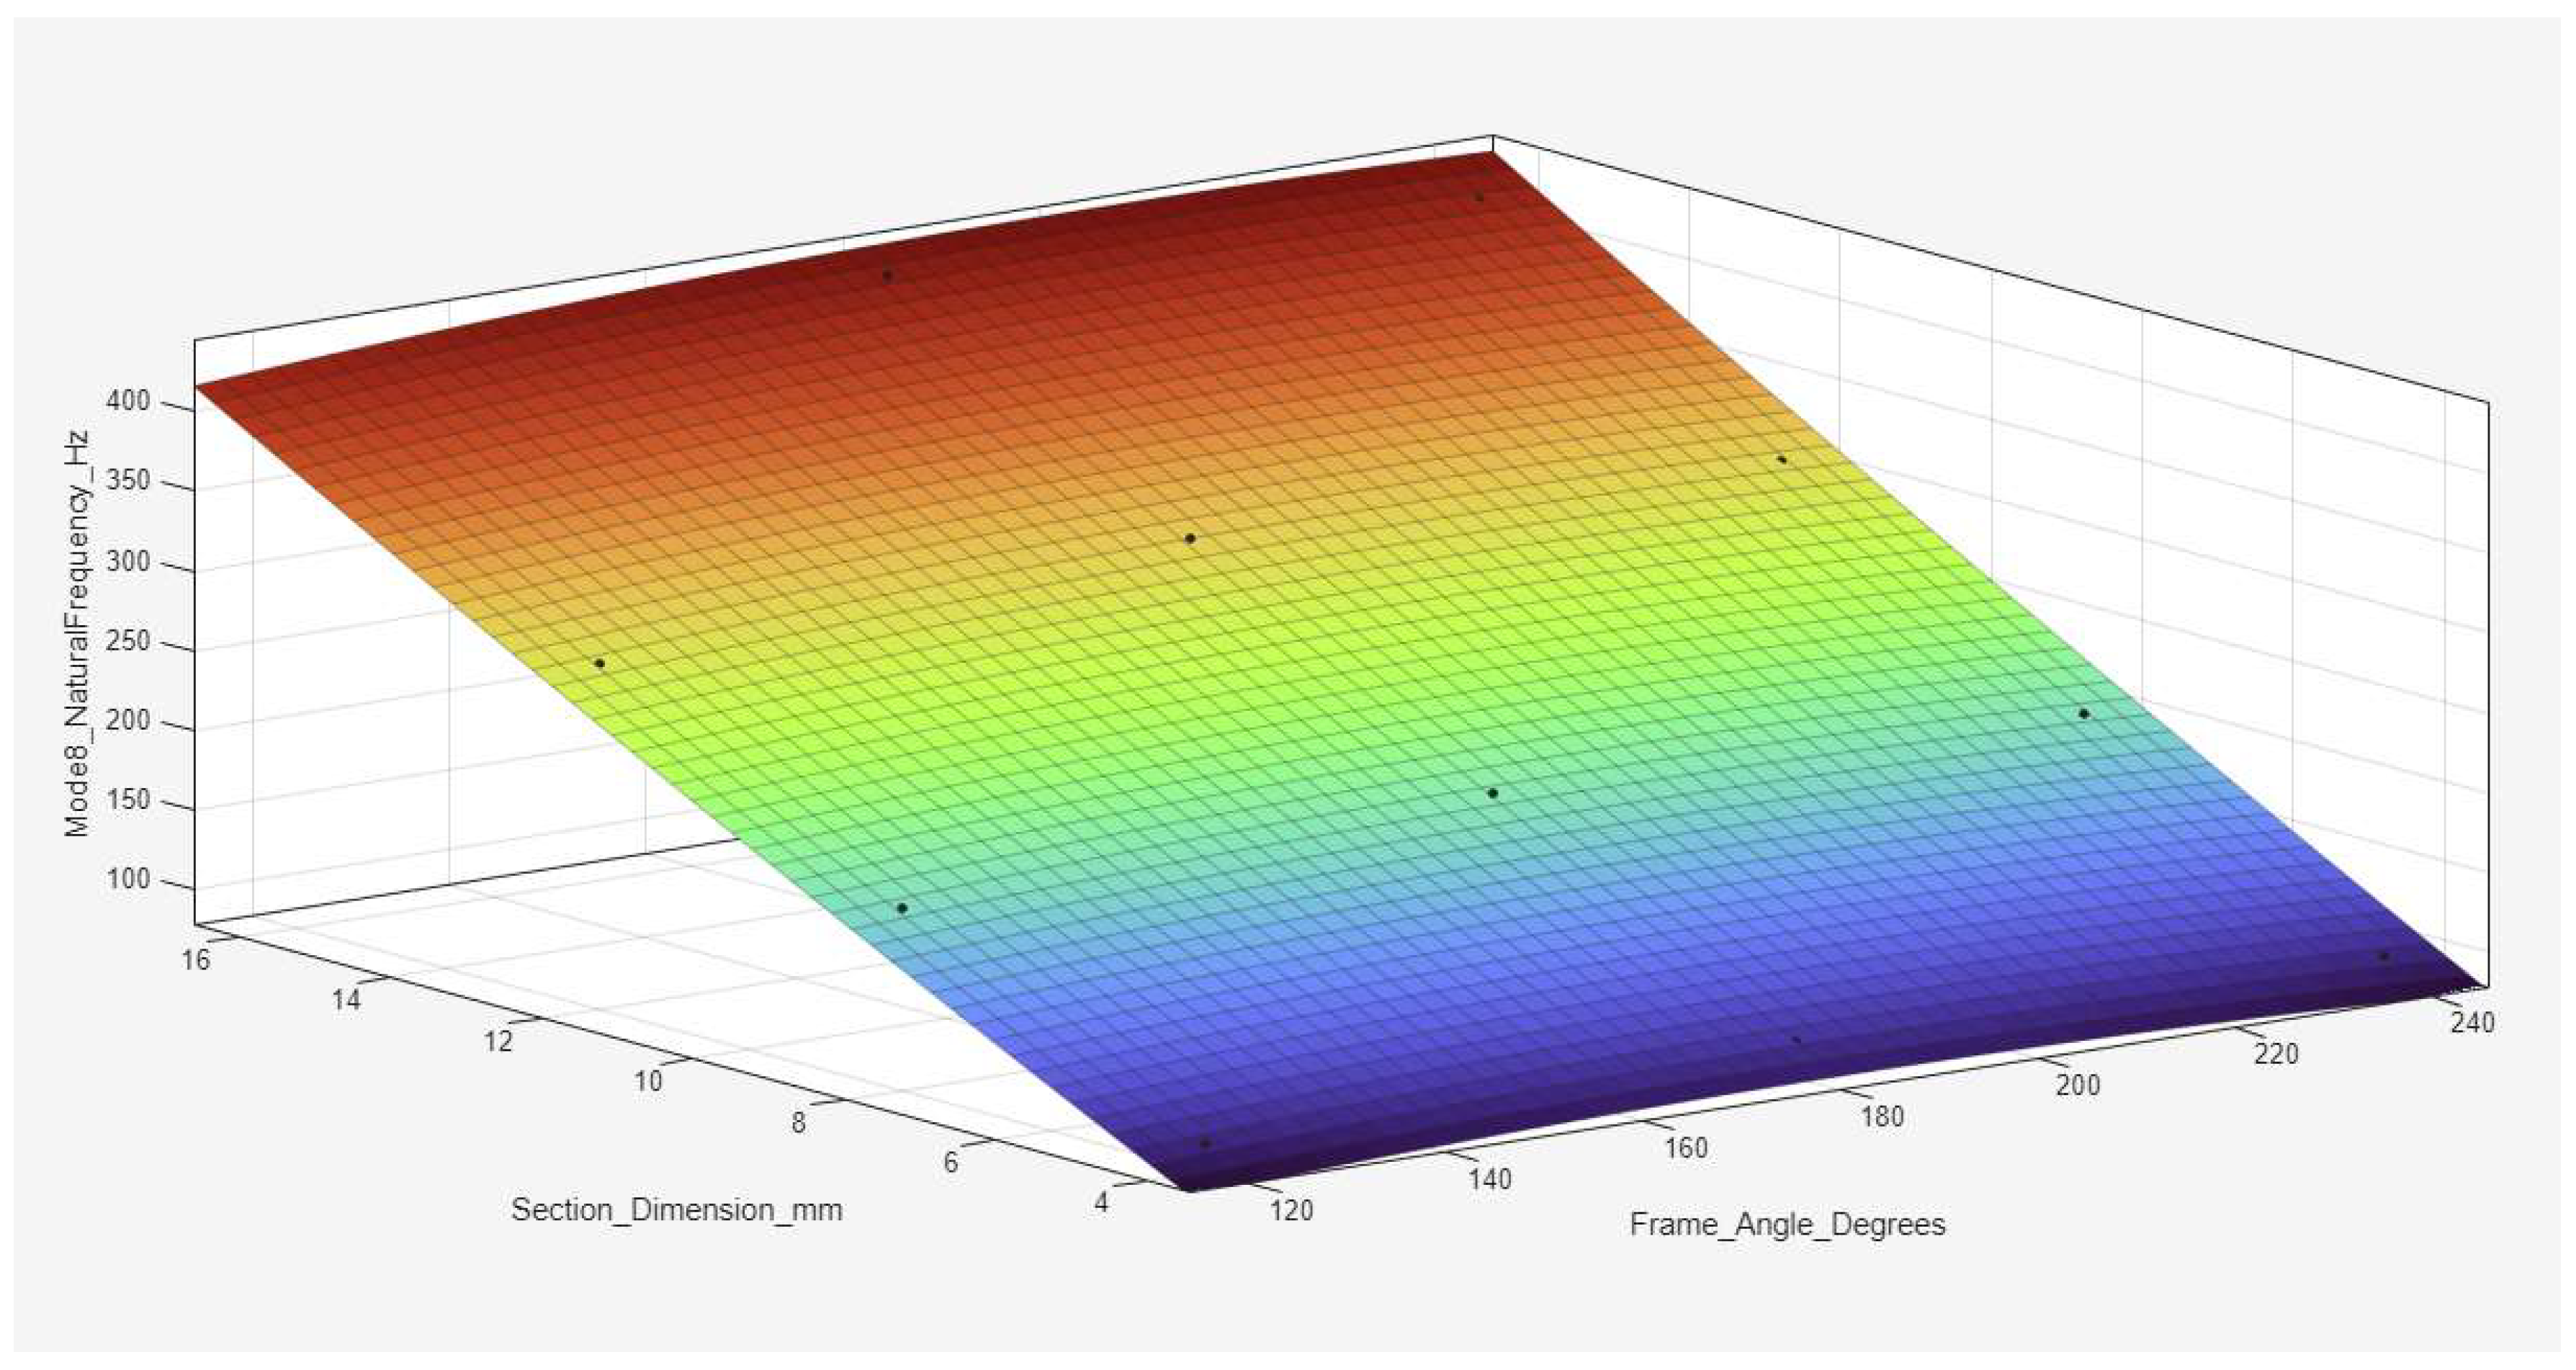
Figure 26.
Workflow diagram for the regression-based design process for re-entrant frames.
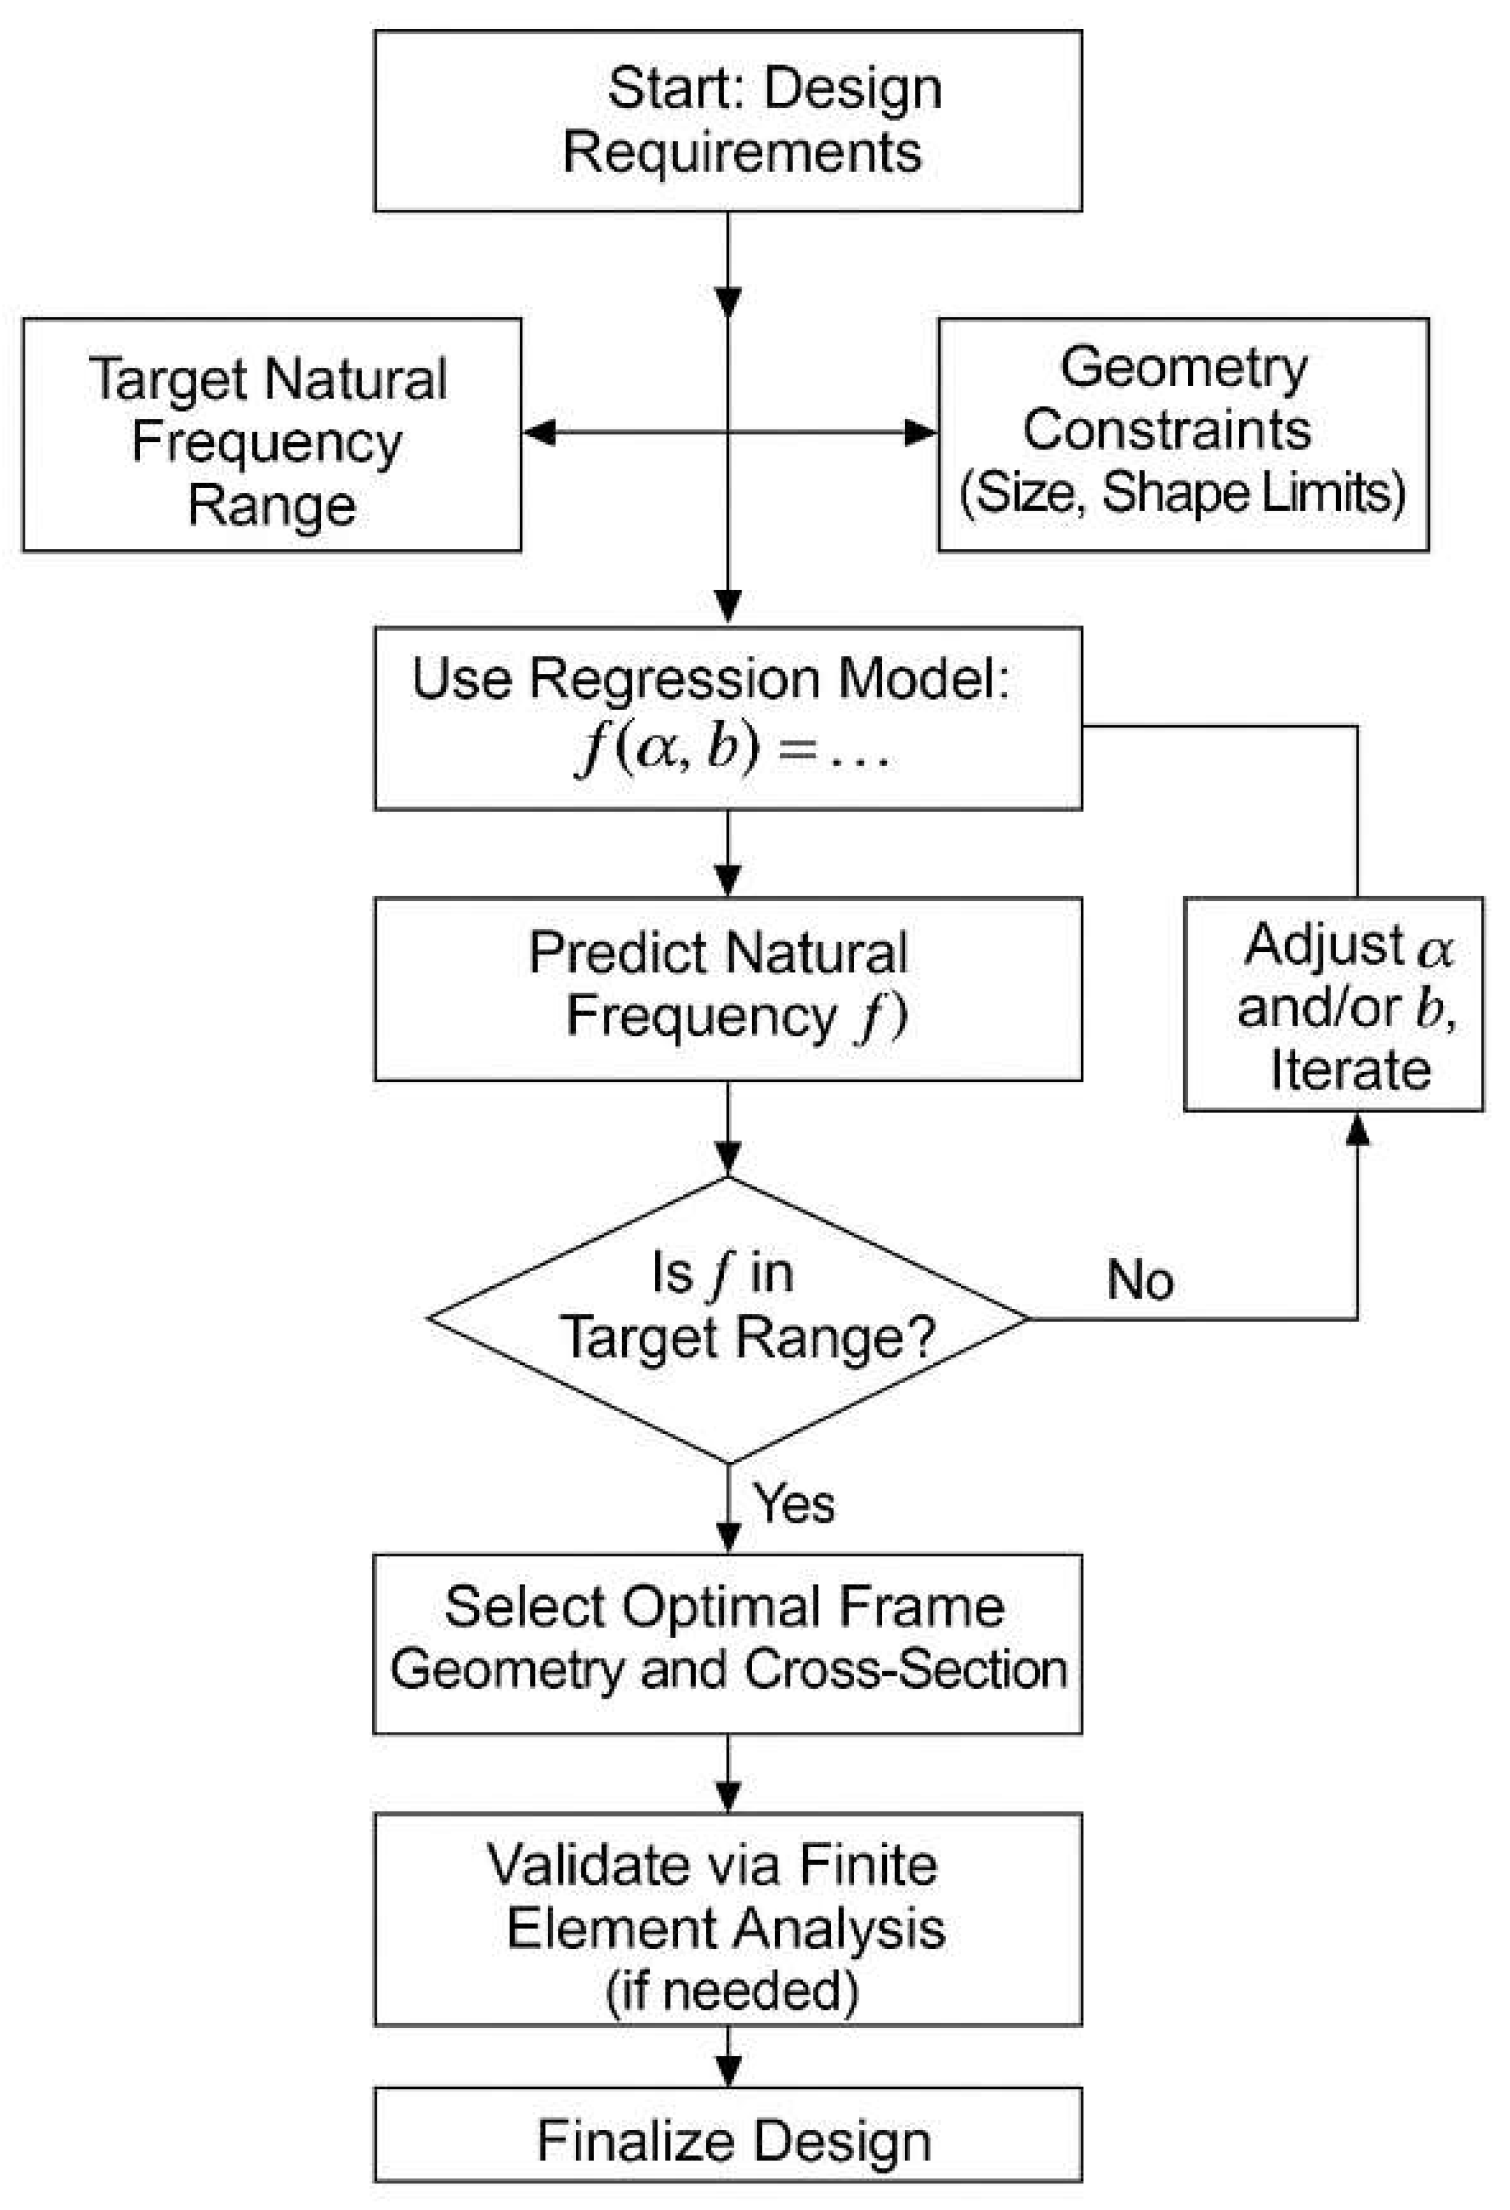
Figure 27.
(a) Mounting the re-entrant test piece to the supporting towers (in red); (b) Location of the accelerometer.
Figure 27.
(a) Mounting the re-entrant test piece to the supporting towers (in red); (b) Location of the accelerometer.
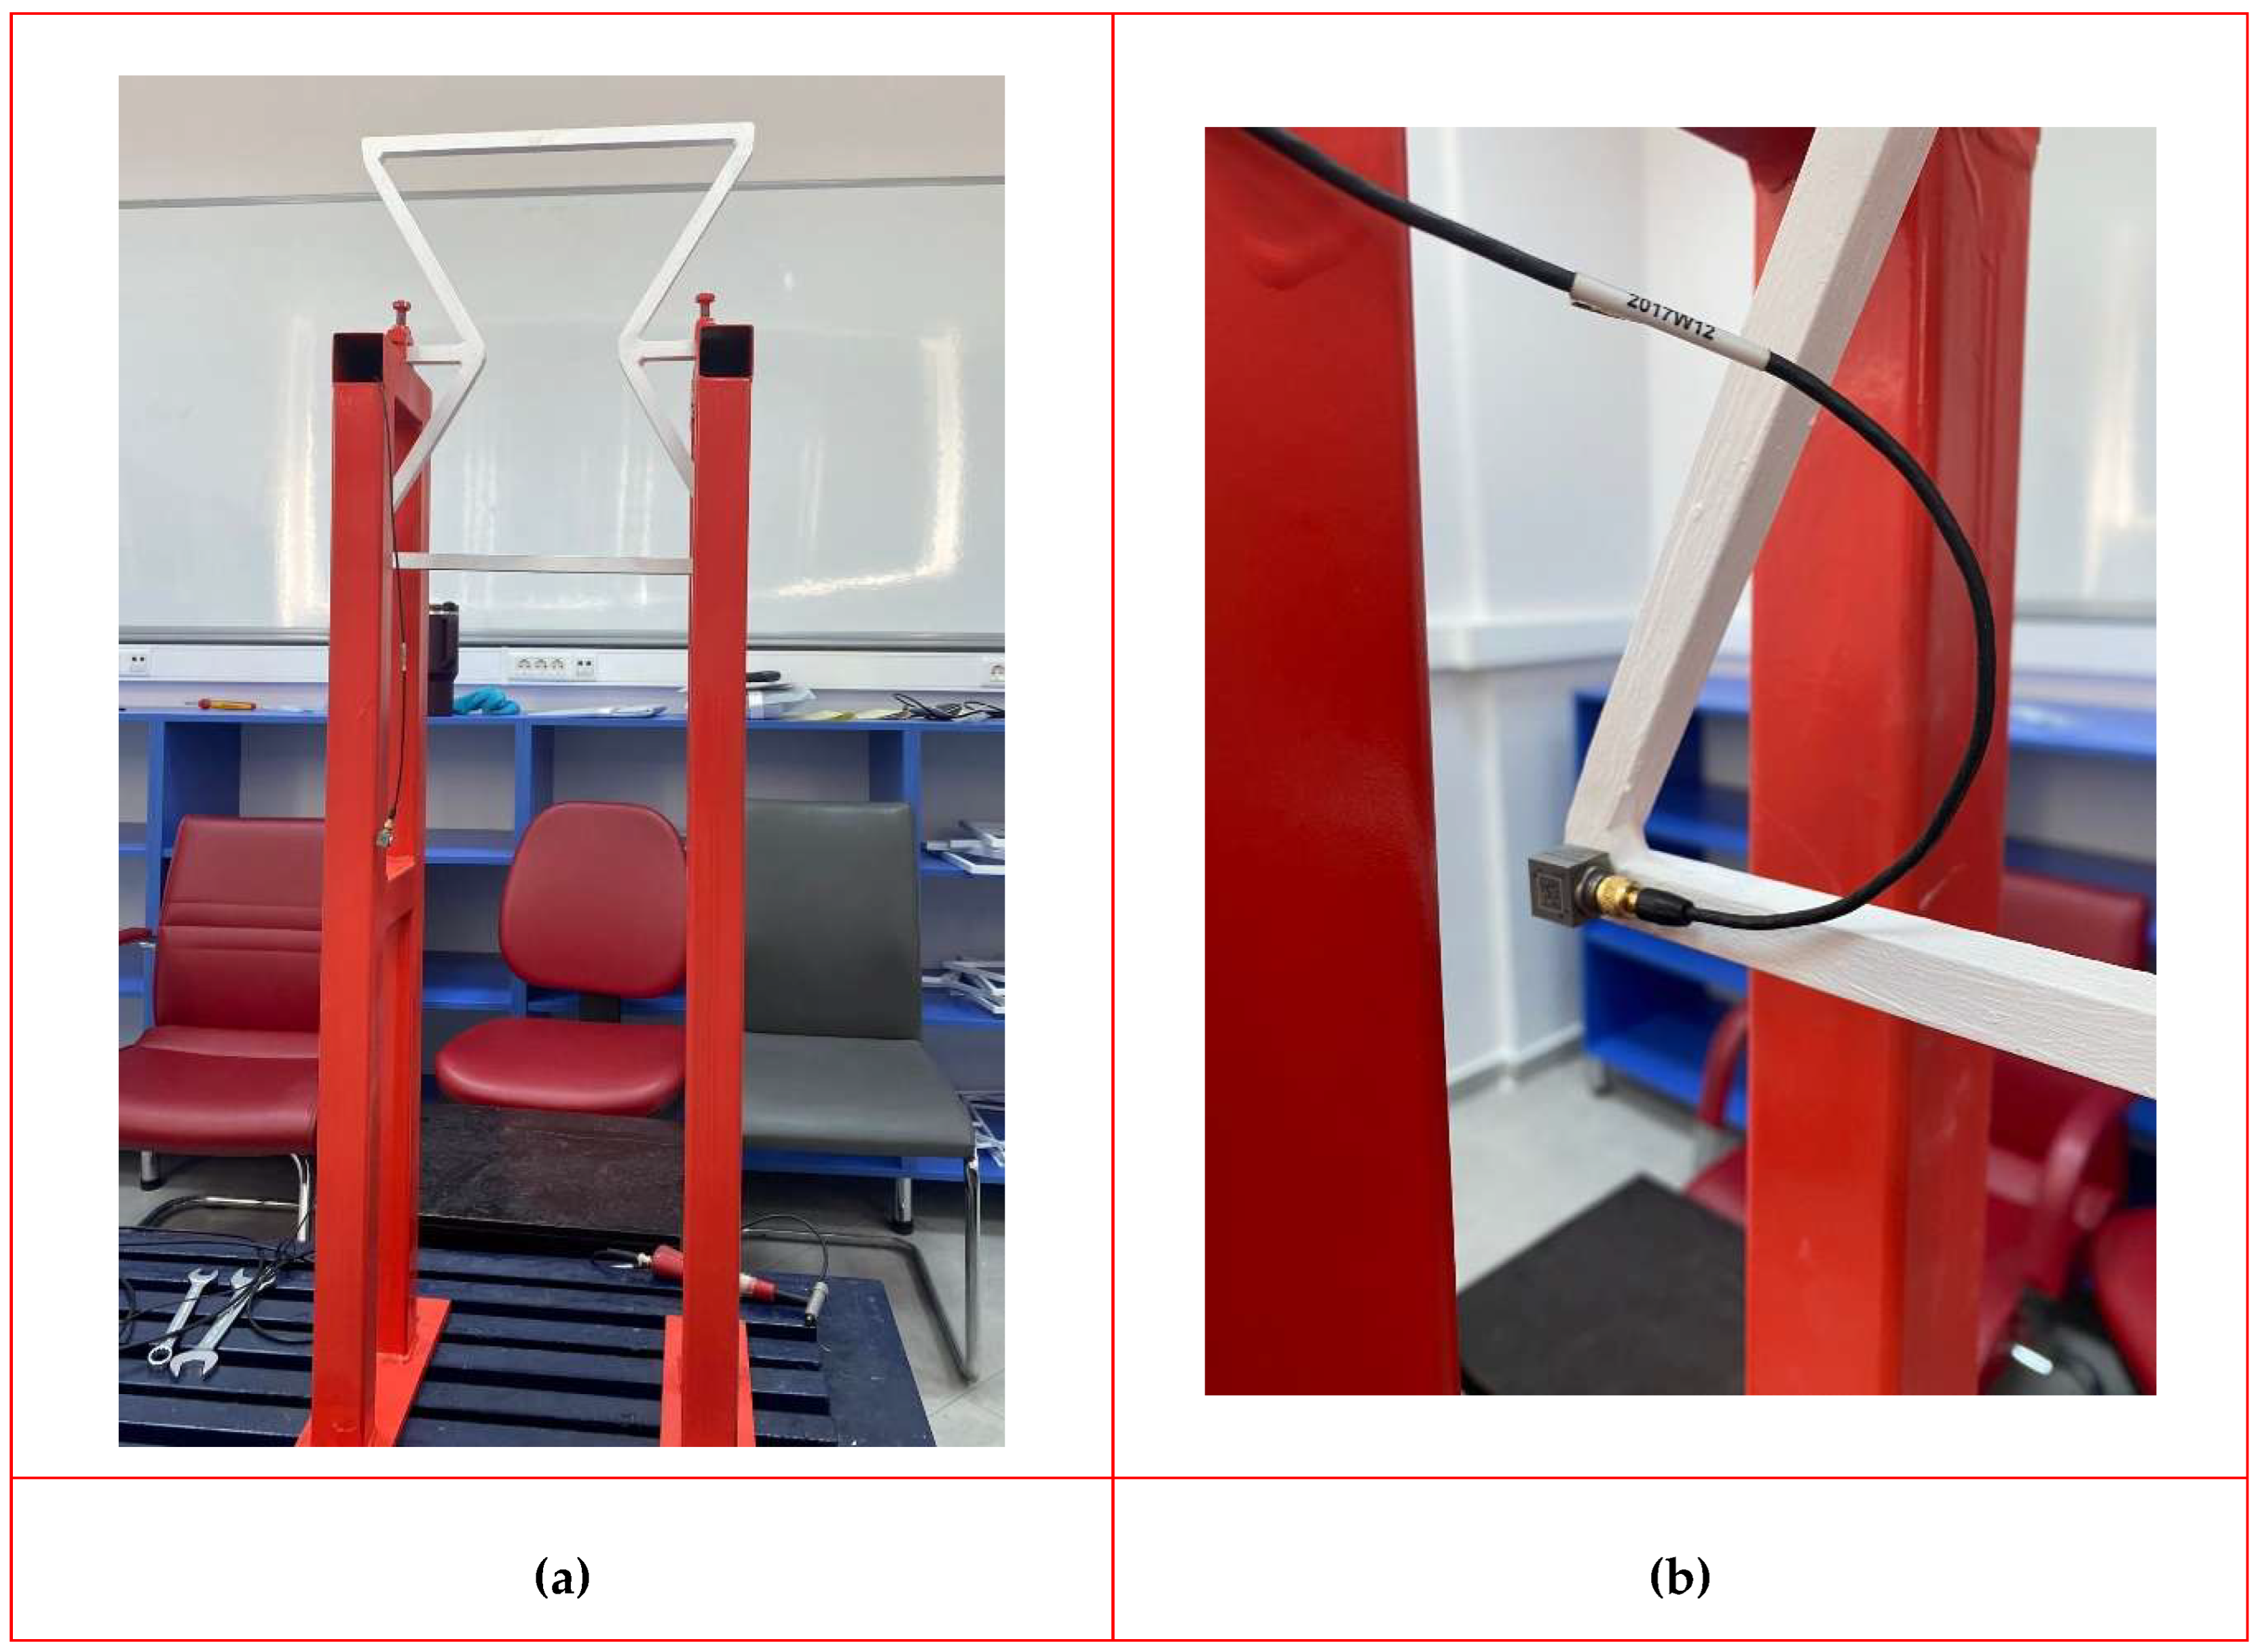
Figure 28.
The experimental setup of a hexagonal test piece.
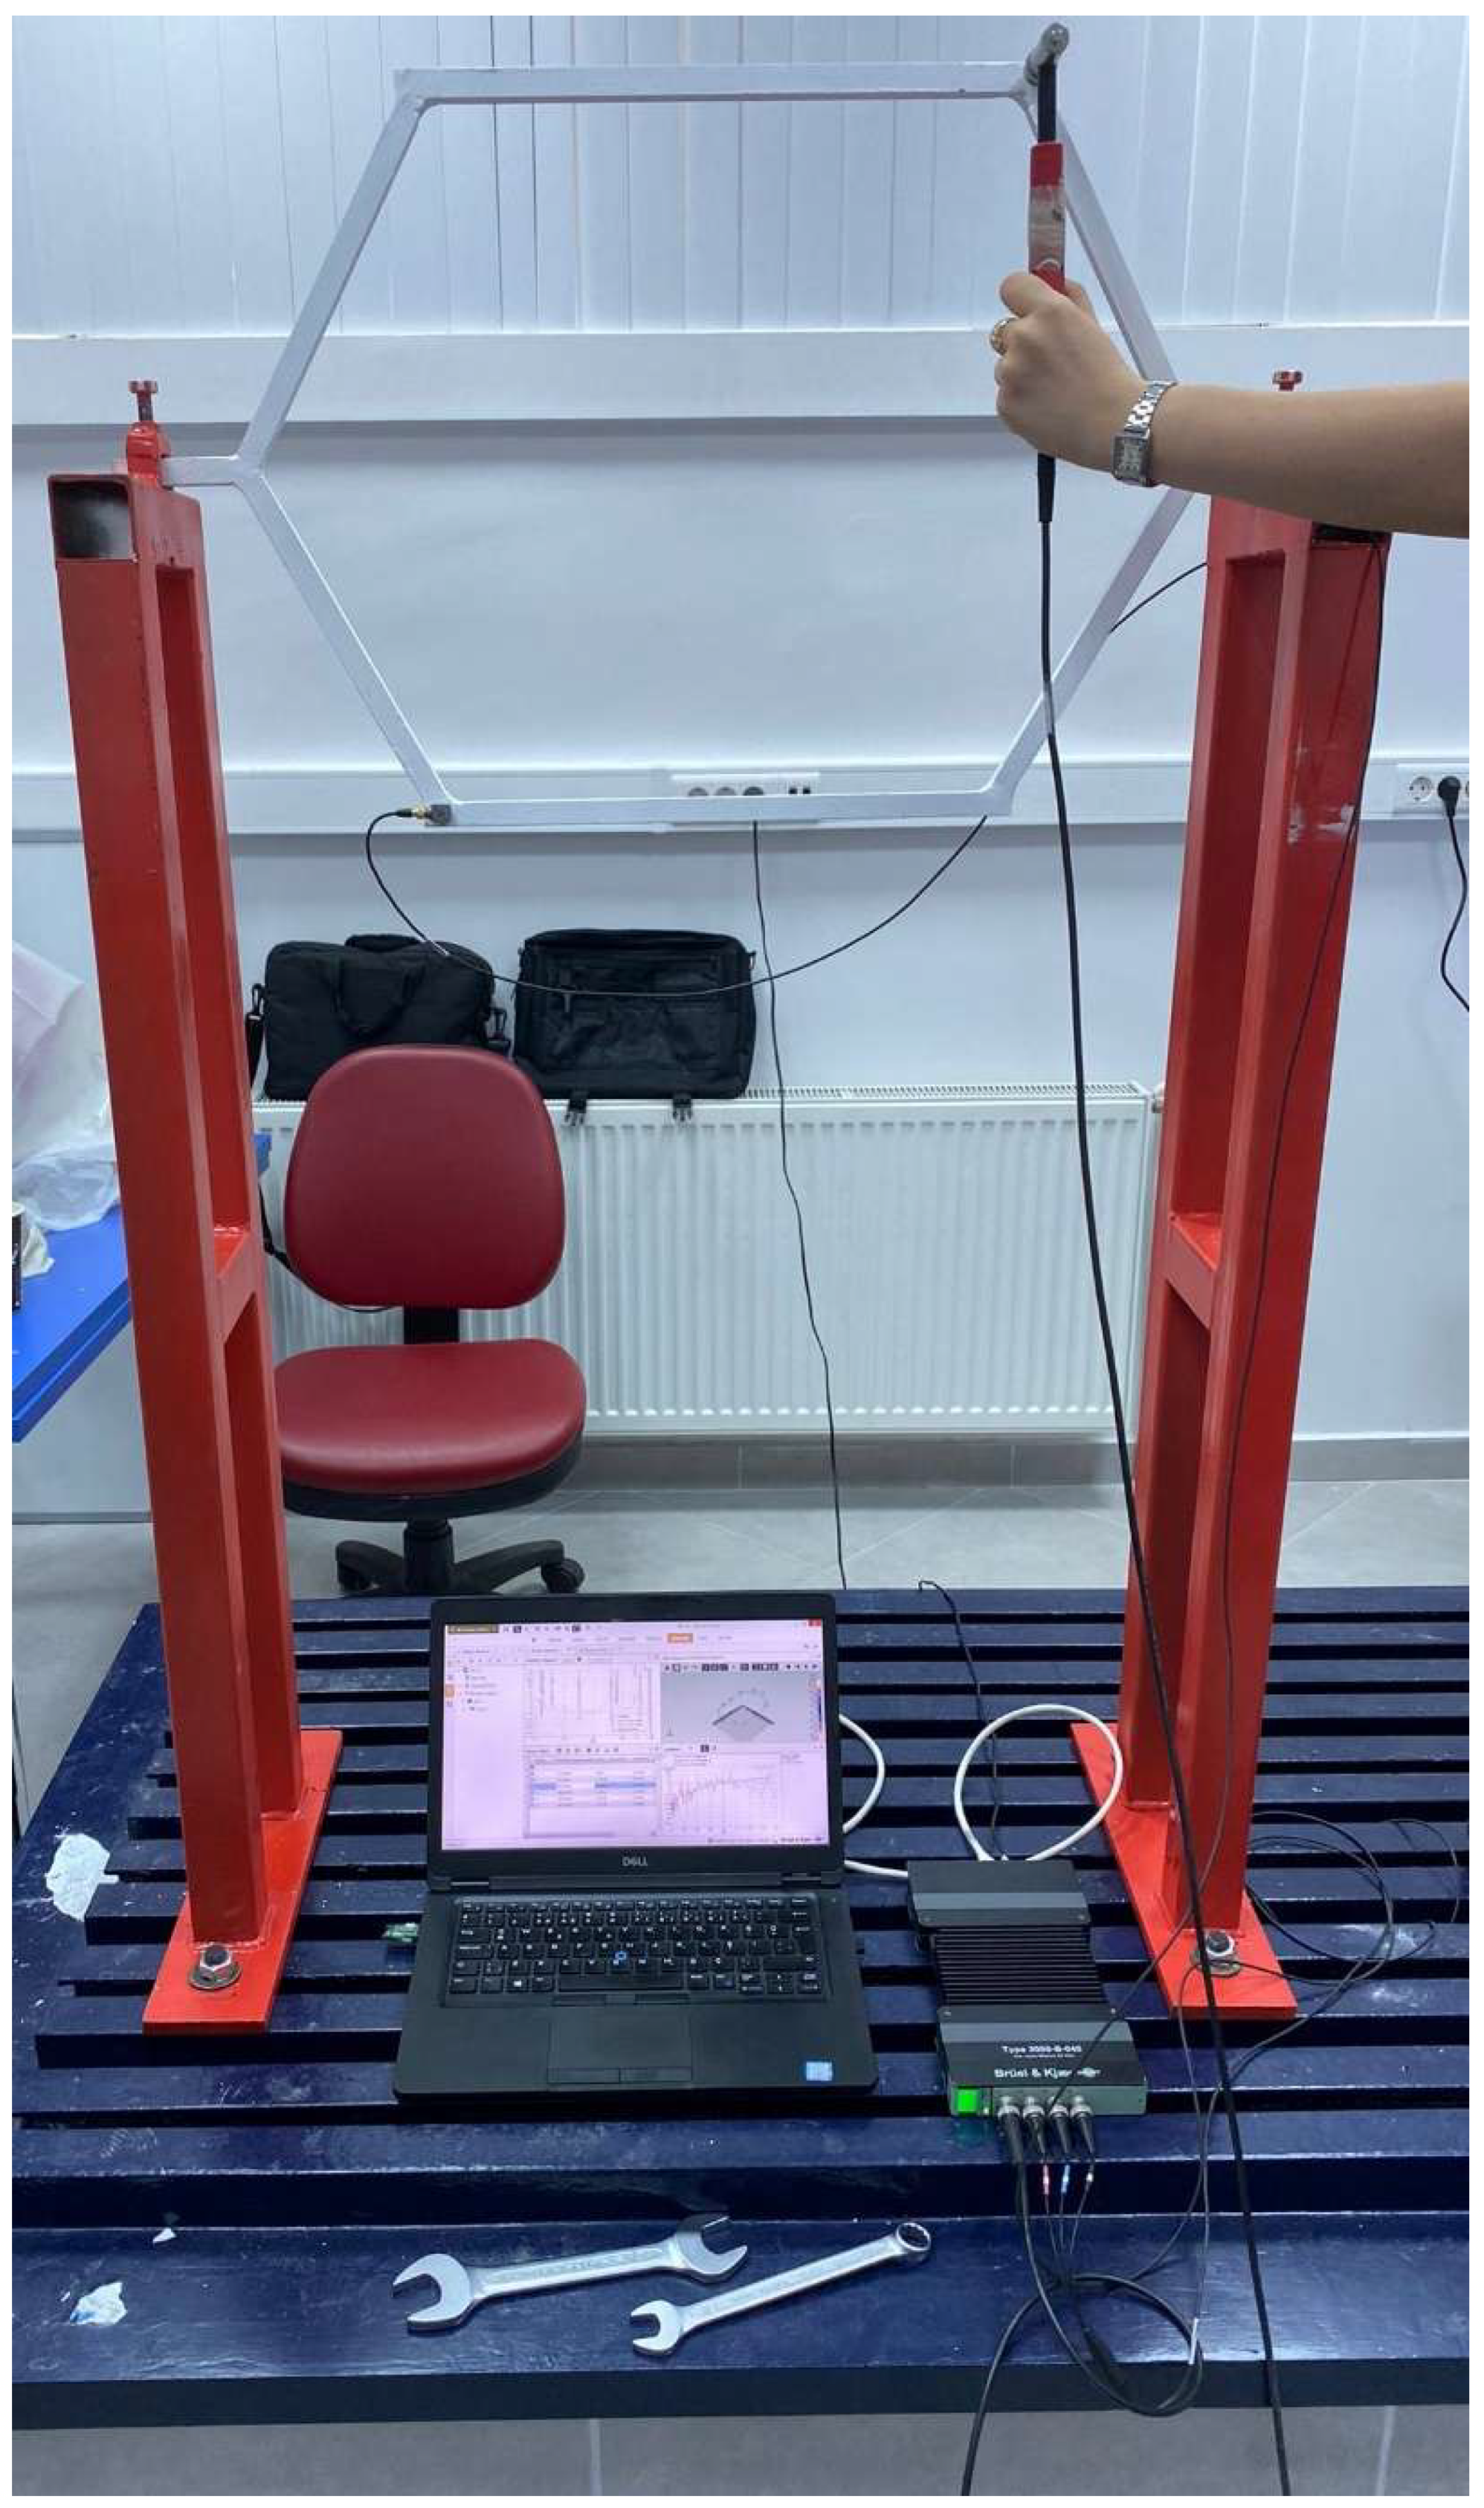
Figure 29.
The measurement setup of the Model 16x16-240.
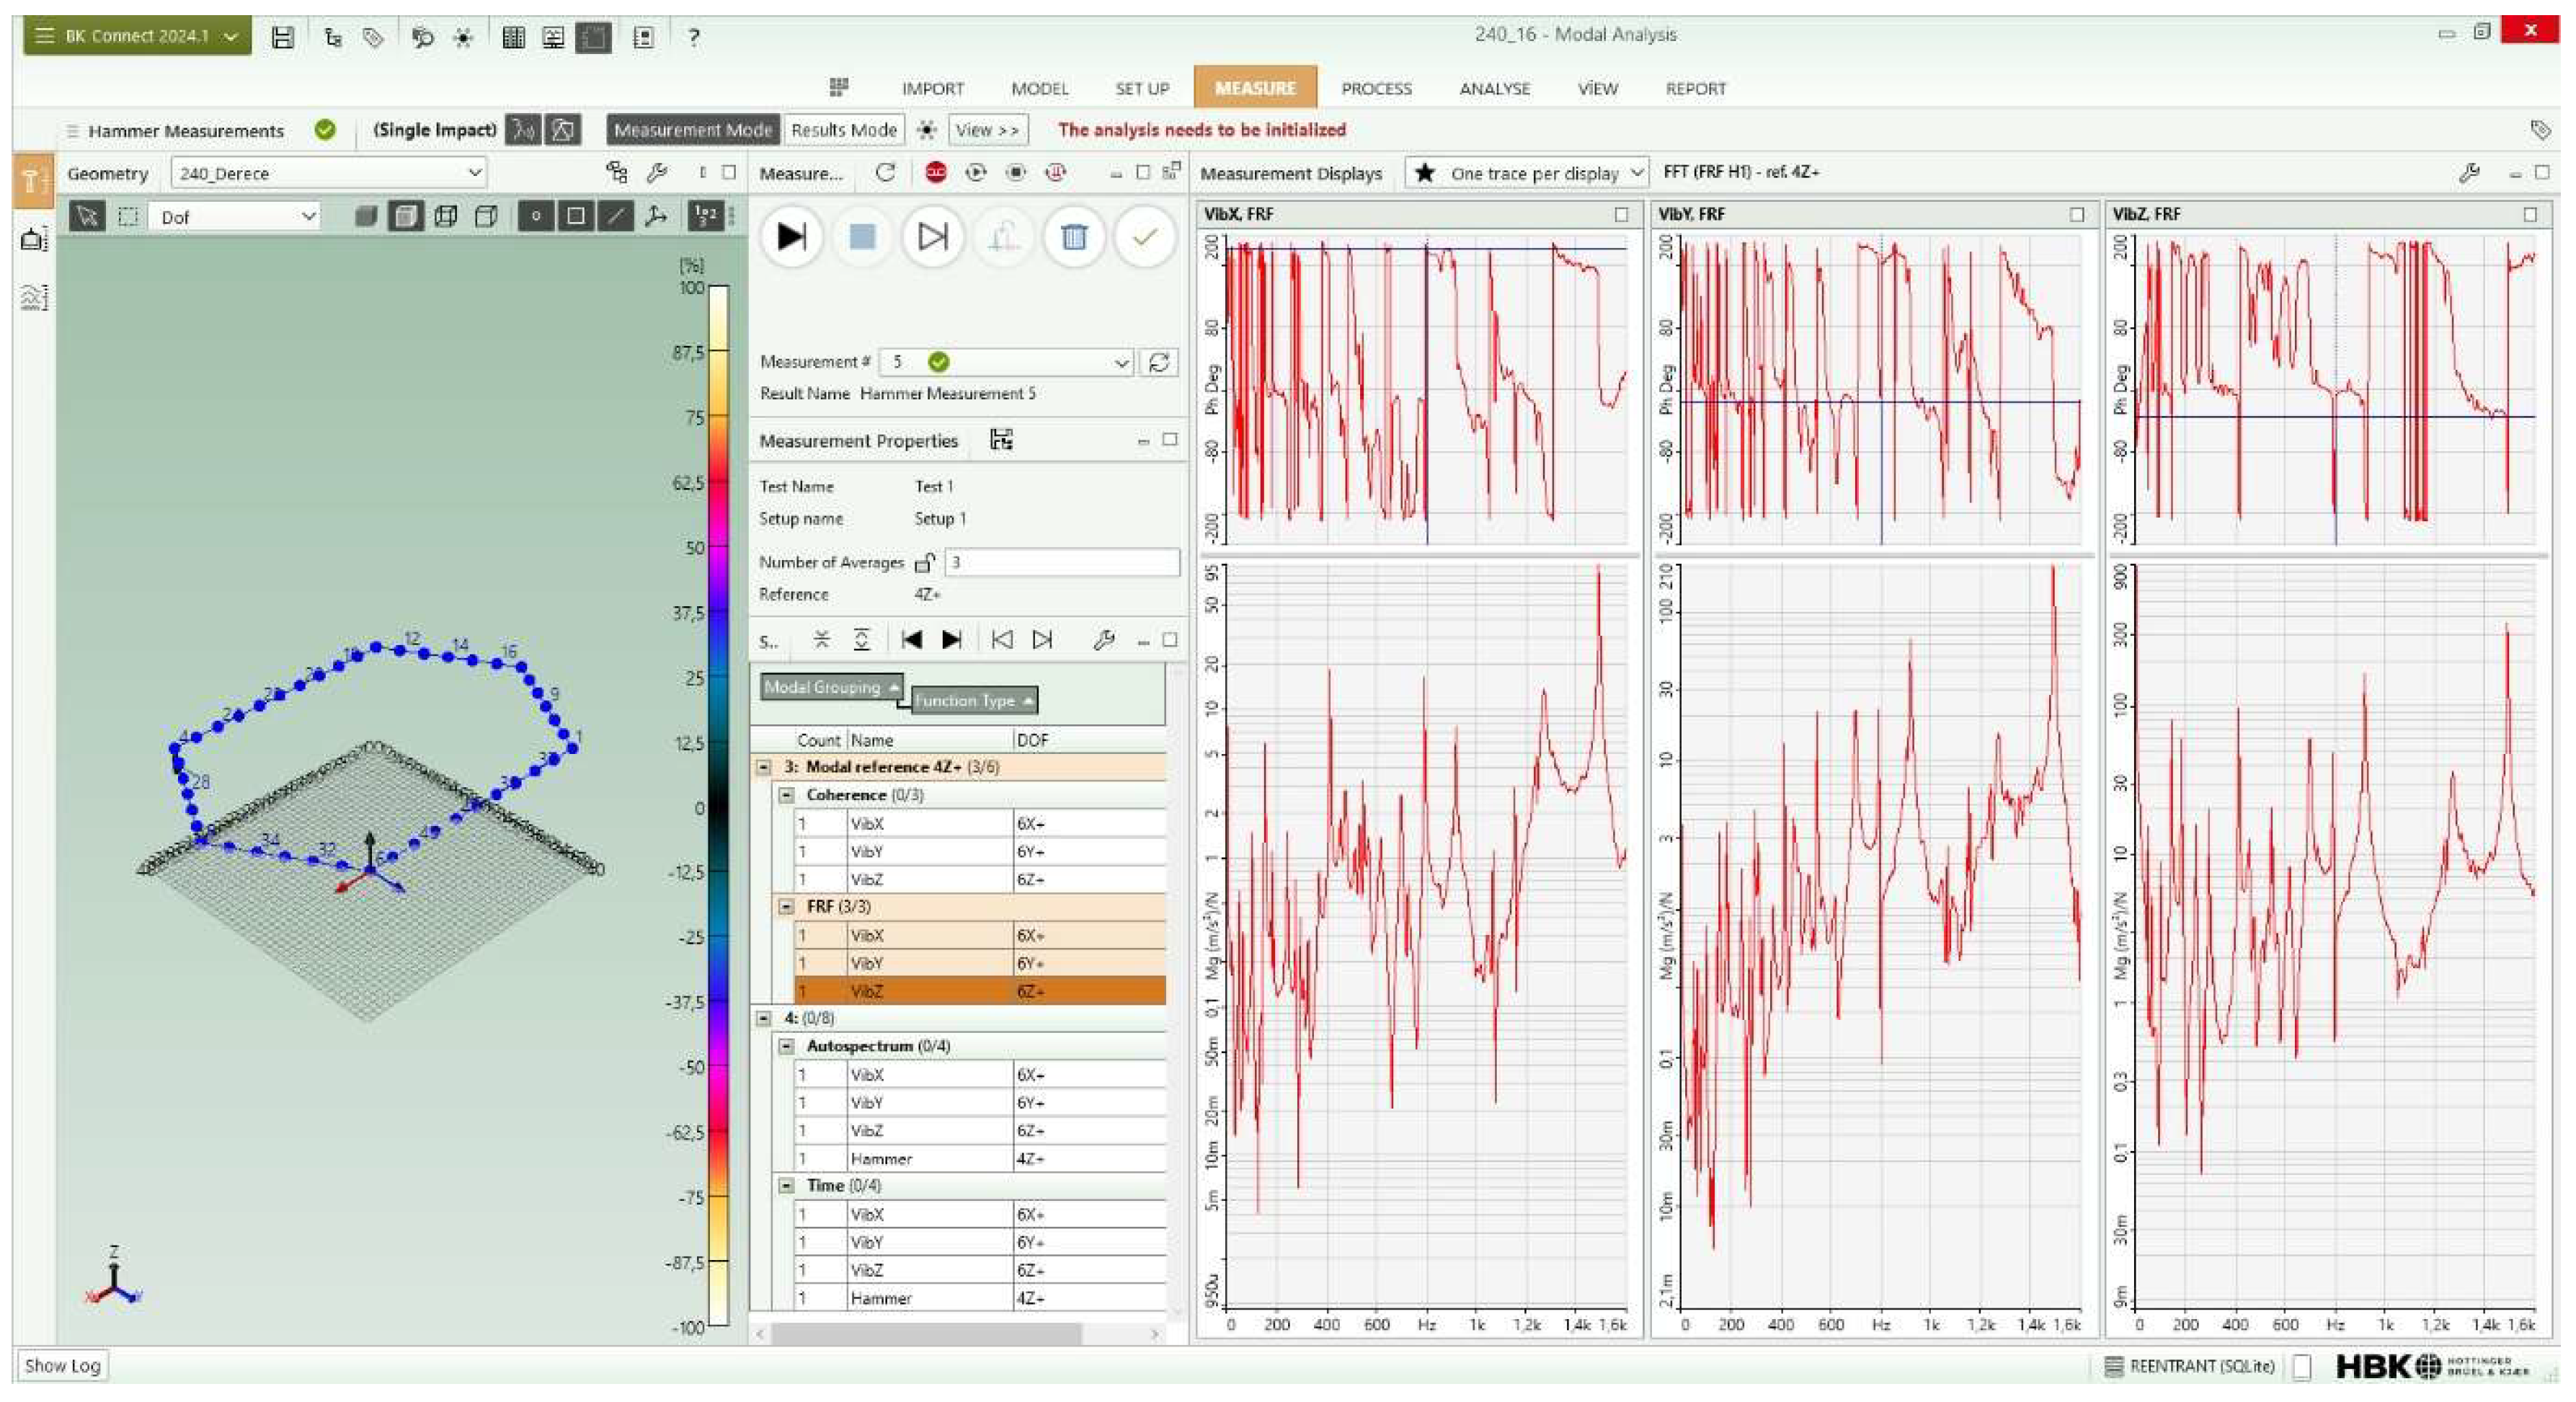
Figure 30.
First eight mode shapes of the Model 16x16-240: (a) Mode 1 (72.37 Hz); (b) Mode 2 (95.48 Hz); (c) Mode 3 (175.97 Hz); (d) Mode 4 (179.40 Hz); (e) Mode 5 (221.88 Hz); (f) Mode 6 (227.18 Hz); (g) Mode 7 (385.70 Hz); (h) Mode 8 (398.18 Hz).
Figure 30.
First eight mode shapes of the Model 16x16-240: (a) Mode 1 (72.37 Hz); (b) Mode 2 (95.48 Hz); (c) Mode 3 (175.97 Hz); (d) Mode 4 (179.40 Hz); (e) Mode 5 (221.88 Hz); (f) Mode 6 (227.18 Hz); (g) Mode 7 (385.70 Hz); (h) Mode 8 (398.18 Hz).
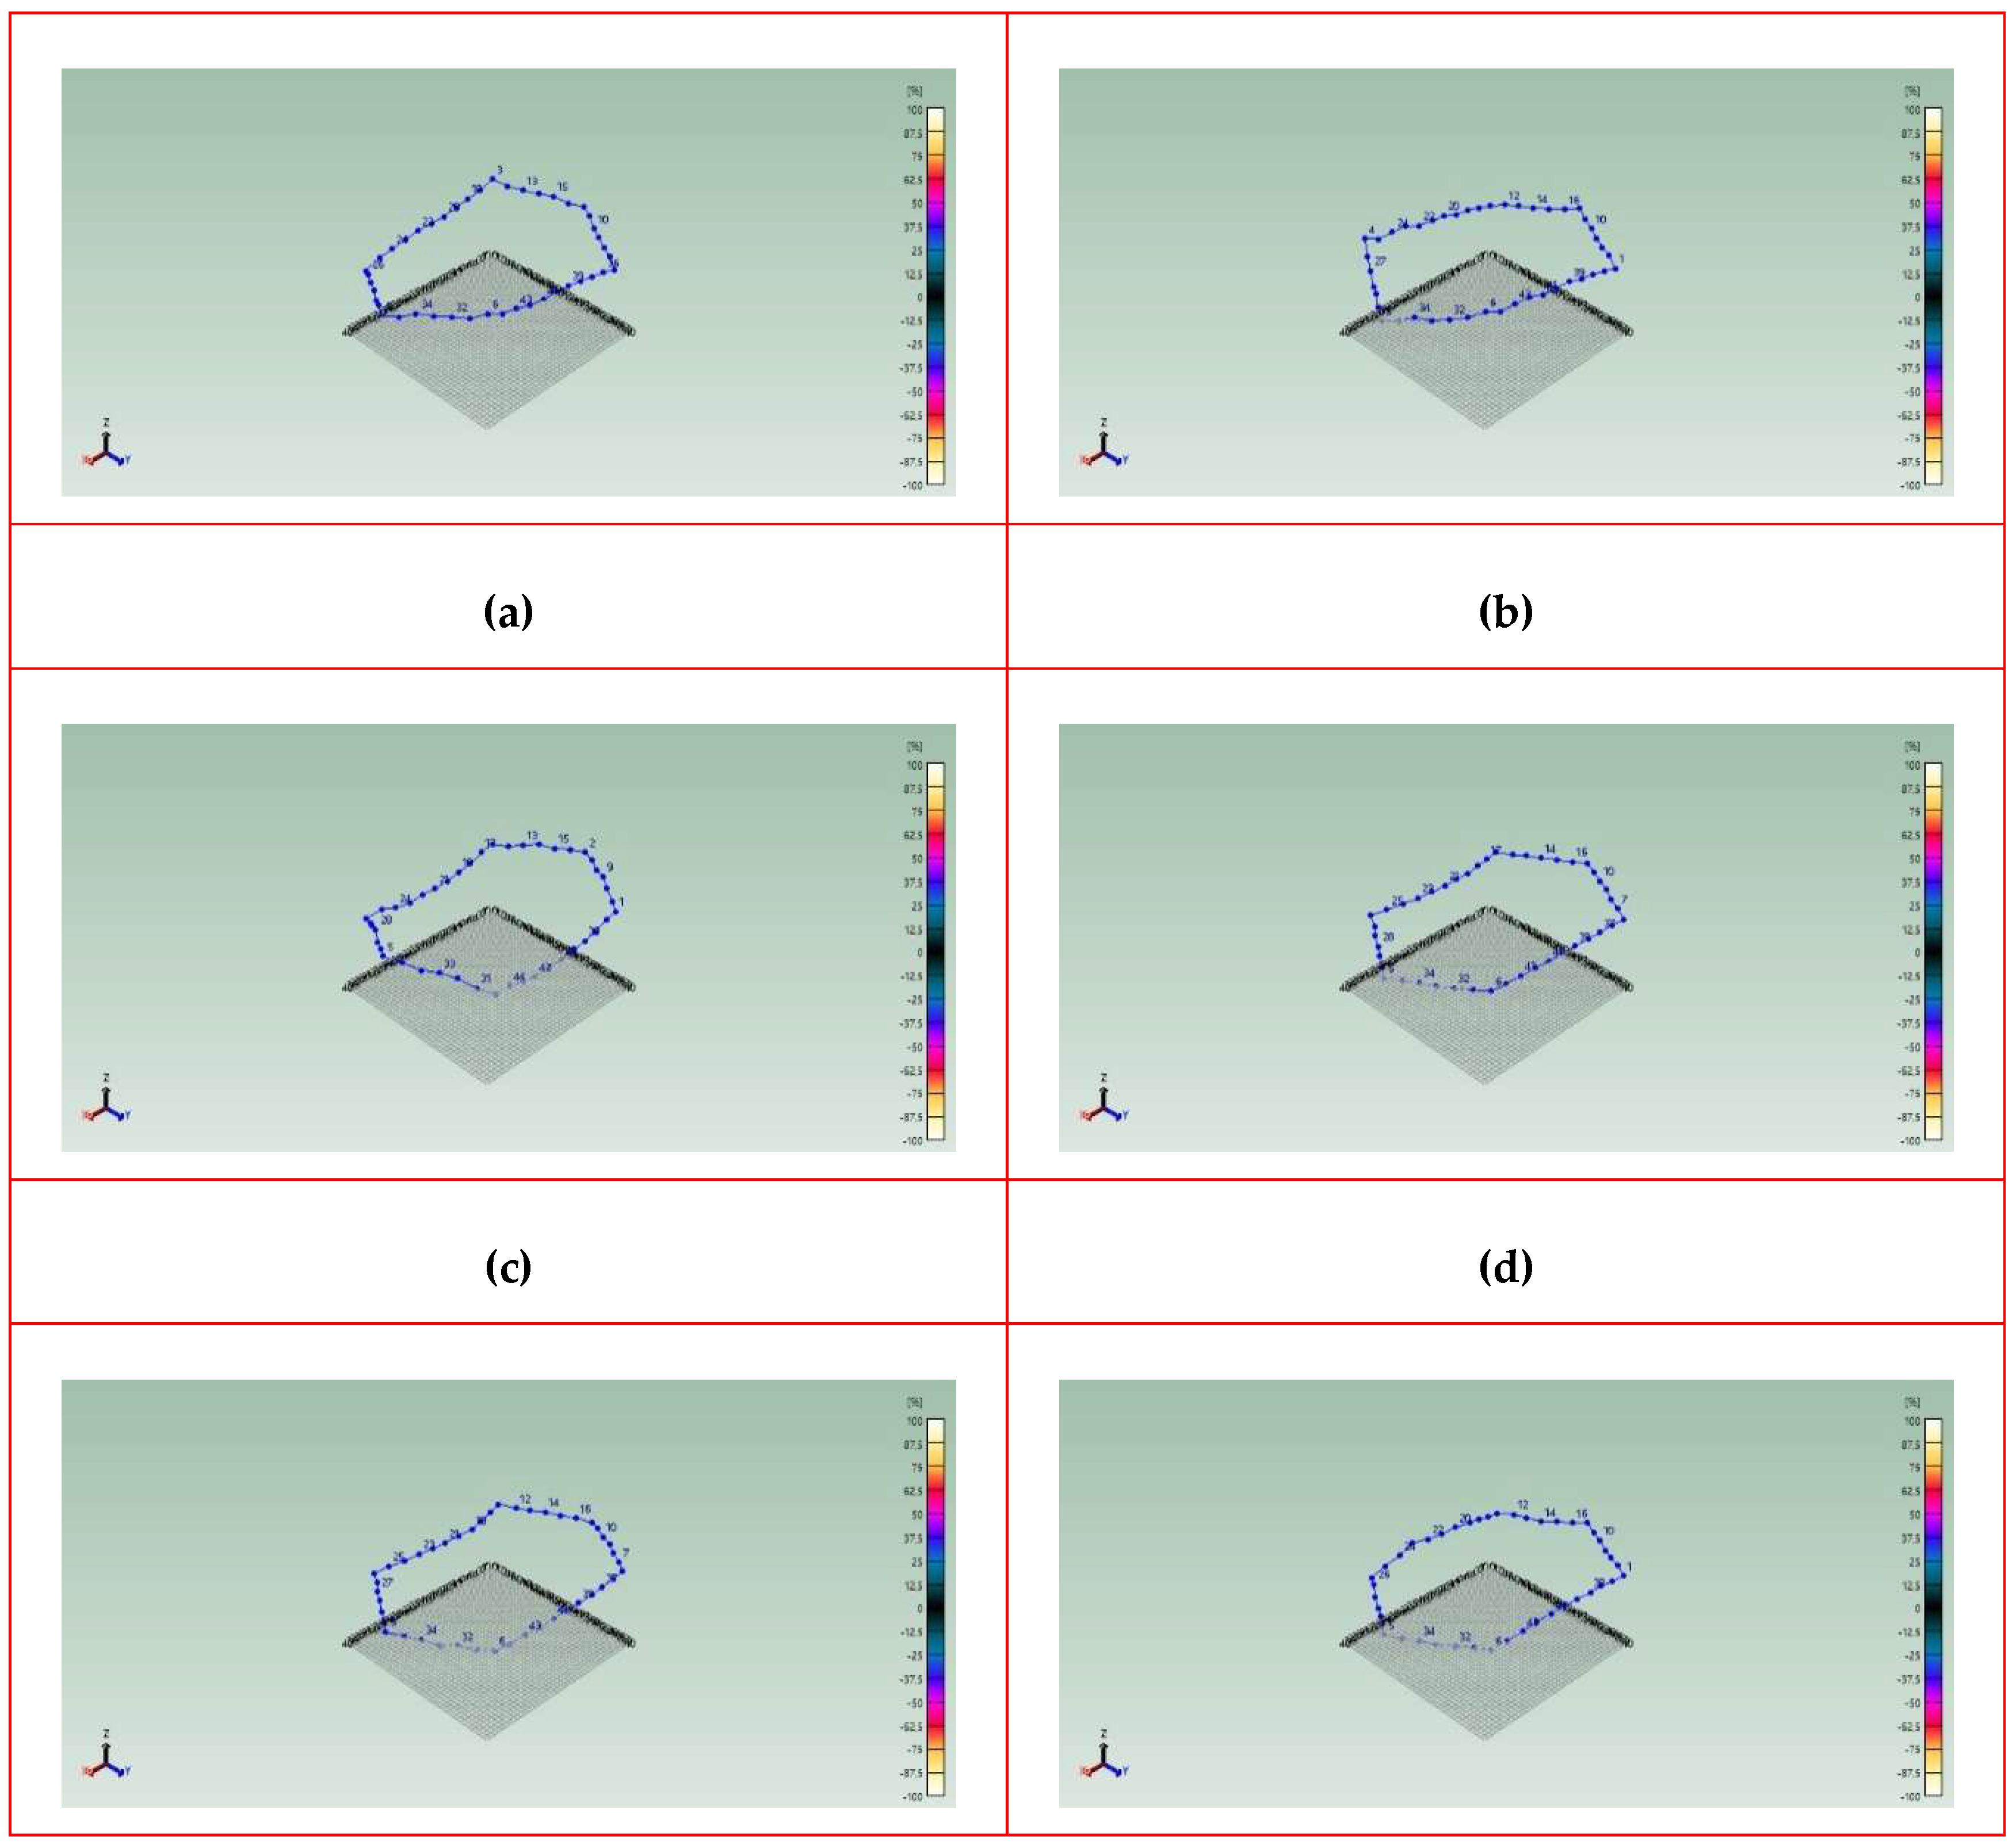
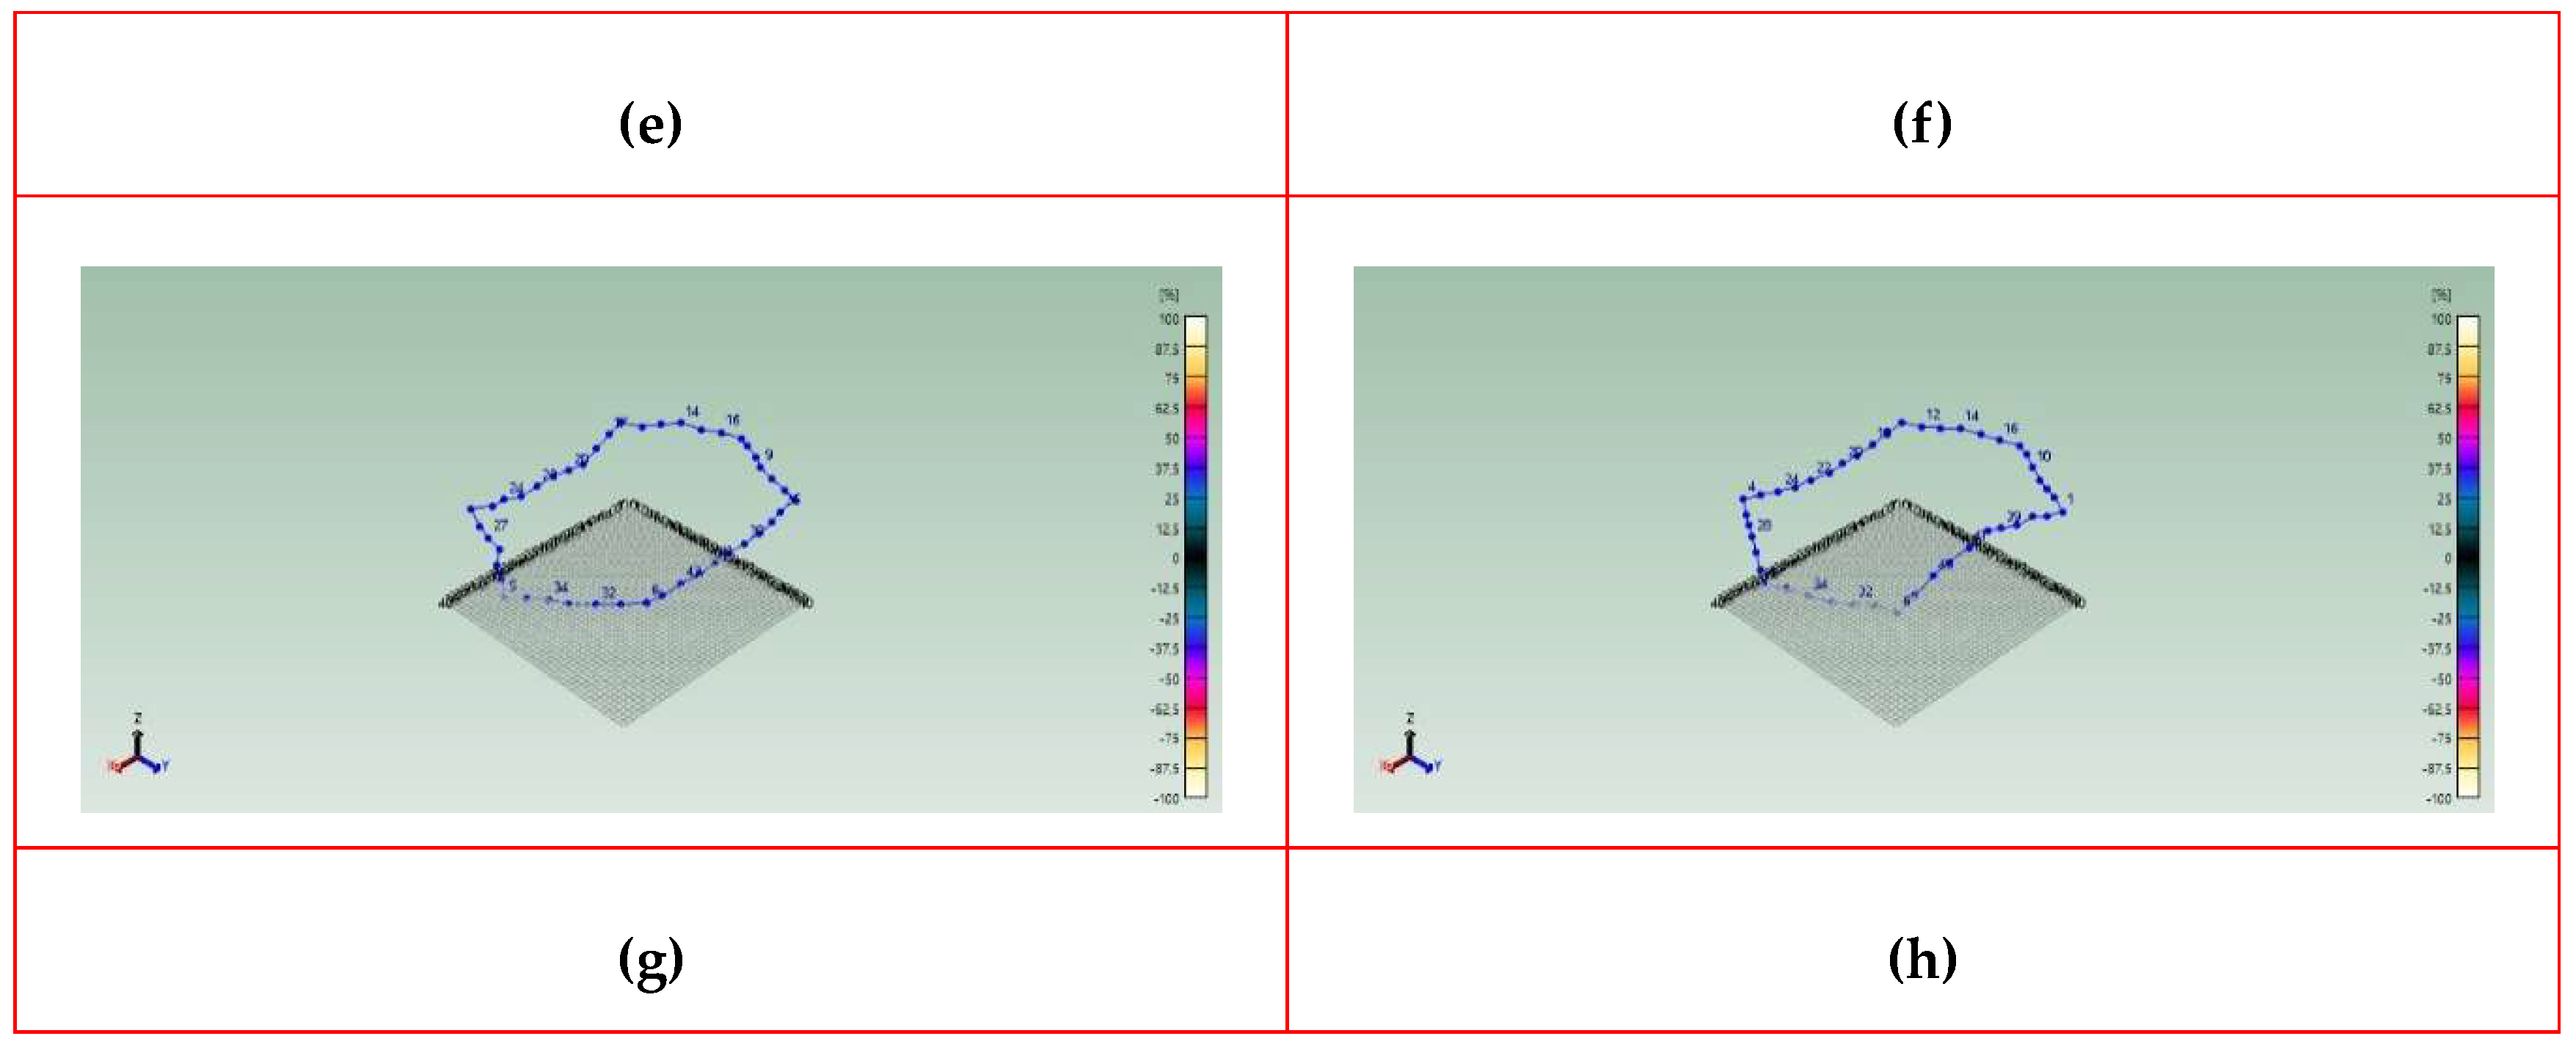

Table 1.
First eight natural frequencies of all frame models (Hz).
| Main Frame Angle (°) |
Beams Cross-Sectional Dimensions (mm) | |||
|---|---|---|---|---|
| 4x4 | 8x8 | 12x12 | 16x16 | |
| 120 | 18.95 26.84 29.82 34.15 38.56 42.46 92.73 94.52 |
39.63 55.52 60.38 70.57 78.61 86.61 189.50 192.81 |
62.59 86.37 91.76 109.97 120.20 132.58 290.15 294.87 |
88.24 119.72 123.89 152.85 163.29 180.41 394.54 400.65 |
| 150 | 19.59 33.25 34.11 39.01 47.91 56.76 95.06 96.89 |
40.57 67.03 69.79 80.09 97.10 114.38 194.05 197.52 |
63.34 101.34 107.30 123.87 147.60 172.93 296.90 301.91 |
88.13 136.16 146.86 170.67 199.33 232.27 403.42 409.90 |
| 180 | 18.32 35.03 35.67 39.23 61.06 70.45 93.31 100.52 |
37.59 71.07 72.49 79.95 123.76 142.24 190.47 205.49 |
58.04 108.18 110.55 122.58 188.10 215.54 291.31 314.78 |
79.76 146.39 149.93 167.18 254.14 290.26 395.65 428.23 |
| 210 | 18.93 28.46 42.45 43.78 56.44 62.79 95.56 97.37 |
38.79 57.88 86.47 89.25 114.10 126.97 196.01 199.55 |
59.81 88.24 132.19 136.89 172.95 192.61 301.18 306.37 |
82.05 119.54 179.72 186.74 232.94 259.51 410.82 417.60 |
| 240 | 17.66 23.21 42.88 43.89 55.51 56.13 93.80 95.63 |
36.10 47.44 87.65 89.43 112.59 114.22 193.58 197.30 |
55.49 72.72 134.43 137.04 171.27 174.44 299.21 304.81 |
75.89 99.08 183.34 186.72 231.54 236.66 410.41 417.81 |
Table 2.
Coefficients of polynomial surface regression.
| Coefficient | Mode 1 | Mode 2 | Mode 3 | Mode 4 | Mode 5 | Mode 6 | Mode 7 | Mode 8 |
| -9.9806 | -179.36 | -13.23 | -26.443 | -230.23 | -367.65 | 2.7946 | -70.482 | |
| 0.0938 | 2.0959 | 0.1797 | 0.2974 | 2.7092 | 4.3355 | 0.0079 | 0.8741 | |
| 5.7418 | 9.4475 | 3.137 | 6.5462 | 6.4102 | 8.907 | 21.231 | 21.788 | |
| -0.0002 | -0.0058 | -0.0006 | -0.0008 | -0.0075 | -0.0121 | -0.0001 | -0.0025 | |
| -0.0076 | -0.0127 | 0.0326 | 0.0166 | 0.0355 | 0.0296 | 0.0101 | 0.0109 | |
| 0.0487 | 0.0372 | 0.0489 | 0.0768 | 0.0451 | 0.0474 | 0.1342 | 0.1366 | |
| 0.9968 | 0.9845 | 0.9942 | 0.9963 | 0.9830 | 0.9794 | 0.9994 | 0.9993 |
Table 3.
Comparison of experimental and numerical natural frequencies.
| Main Frame Angle (°) |
Beams Cross-Sectional Dimensions (mm) | |||||||||||
|---|---|---|---|---|---|---|---|---|---|---|---|---|
| 4x4 | 8x8 | 12x12 | 16x16 | |||||||||
| FEM | EXP | Dis. | FEM | EXP | Dis. | FEM | EXP | Dis. | FEM | EXP | Dis. | |
| 120 | 18.95 26.84 29.82 34.15 38.56 42.46 92.73 94.52 |
18.54 26.53 29.35 33.64 37.66 41.51 90.32 93.33 |
2.178 1.152 1.569 1.483 2.340 2.240 2.600 1.255 |
39.63 55.52 60.38 70.57 78.61 86.61 189.50 192.81 |
38.69 54.24 58.61 68.35 76.54 83.44 183.98 188.83 |
2.382 2.312 2.920 3.154 2.642 3.646 2.912 2.059 |
62.59 86.37 91.76 109.97 120.20 132.58 290.15 294.87 |
60.72 83.86 88.79 106.83 115.40 127.38 279.99 285.43 |
2.990 2.896 3.236 2.852 3.993 3.931 3.516 3.213 |
88.24 119.72 123.89 152.85 163.29 180.41 394.54 400.65 |
85.76 116.62 120.63 146.15 156.51 168.36 368.19 374.14 |
2.810 2.585 2.637 4.389 4.158 6.680 6.678 6.615 |
| 150 | 19.59 33.25 34.11 39.01 47.91 56.76 95.06 96.89 |
19.14 32.59 33.50 38.03 47.35 55.29 92.47 94.71 |
2.291 2.003 1.791 2.530 1.165 2.580 2.718 2.257 |
40.57 67.03 69.79 80.09 97.10 114.38 194.05 197.52 |
39.44 64.89 67.19 77.04 93.46 110.48 187.37 190.66 |
2.783 3.210 3.714 3.819 3.746 3.392 3.442 3.468 |
63.34 101.34 107.30 123.87 147.60 172.93 296.90 301.91 |
61.39 97.07 103.25 119.80 142.08 165.44 285.32 289.34 |
3.083 4.215 3.781 3.277 3.729 4.329 3.900 4.153 |
88.13 136.16 146.86 170.67 199.33 232.27 403.42 409.90 |
86.12 130.86 141.14 164.48 192.16 215.45 378.14 383.24 |
2.276 3.893 3.900 3.628 3.599 7.237 6.286 6.501 |
| 180 | 18.32 35.03 35.67 39.23 61.06 70.45 93.31 100.52 |
17.97 34.21 34.90 38.44 59.22 68.80 90.84 97.96 |
1.899 2.349 2.162 2.007 3.018 2.347 2.641 2.544 |
37.59 71.07 72.49 79.95 123.76 142.24 190.47 205.49 |
36.53 68.77 69.84 77.20 119.07 137.70 184.69 197.50 |
2.821 3.236 3.653 3.439 3.798 3.191 3.035 3.887 |
58.04 108.18 110.55 122.58 188.10 215.54 291.31 314.78 |
55.87 104.05 106.88 118.71 181.07 207.71 280.18 303.35 |
3.730 3.818 3.311 3.154 3.742 3.630 3.822 3.633 |
79.76 146.39 149.93 167.18 254.14 290.26 395.65 428.23 |
76.27 140.64 143.85 159.88 244.17 275.04 372.80 398.41 |
4.376 3.936 4.045 4.367 3.921 5.246 5.784 6.967 |
| 210 | 18.93 28.46 42.45 43.78 56.44 62.79 95.56 97.37 |
18.52 27.83 41.58 42.79 55.42 61.37 93.10 95.04 |
2.153 2.219 2.052 2.264 1.807 2.254 2.573 2.395 |
38.79 57.88 86.47 89.25 114.10 126.97 196.01 199.55 |
37.79 56.26 83.72 86.32 110.39 122.57 188.63 192.35 |
2.582 2.798 3.178 3.283 3.250 3.469 3.763 3.610 |
59.81 88.24 132.19 136.89 172.95 192.61 301.18 306.37 |
57.53 85.11 127.18 132.02 166.25 185.17 289.22 294.87 |
3.815 3.548 3.793 3.566 3.873 3.870 3.972 3.762 |
82.05 119.54 179.72 186.74 232.94 259.51 410.82 417.60 |
78.76 115.13 171.96 178.19 223.68 242.35 386.53 392.95 |
4.008 3.691 4.326 4.568 3.982 6.621 5.904 5.901 |
| 240 | 17.66 23.21 42.88 43.89 55.51 56.13 93.80 95.63 |
17.28 22.66 41.92 42.71 54.39 54.95 91.71 93.45 |
2.147 2.372 2.244 2.680 2.012 2.112 2.231 2.279 |
36.10 47.44 87.65 89.43 112.59 114.22 193.58 197.30 |
34.90 46.11 84.71 86.08 109.02 110.58 186.14 190.43 |
3.310 2.807 3.355 3.744 3.174 3.186 3.844 3.483 |
55.49 72.72 134.43 137.04 171.27 174.44 299.21 304.81 |
53.46 70.20 129.58 132.07 164.38 167.19 288.61 293.04 |
3.663 3.455 3.612 3.619 4.018 4.161 3.522 3.853 |
75.89 99.08 183.34 186.72 231.54 236.66 410.41 417.81 |
72.37 95.48 175.97 179.40 221.88 227.18 385.70 398.18 |
4.633 3.625 4.023 3.907 4.169 4.021 6.026 4.712 |
Disclaimer/Publisher’s Note: The statements, opinions and data contained in all publications are solely those of the individual author(s) and contributor(s) and not of MDPI and/or the editor(s). MDPI and/or the editor(s) disclaim responsibility for any injury to people or property resulting from any ideas, methods, instructions or products referred to in the content. |
© 2025 by the authors. Licensee MDPI, Basel, Switzerland. This article is an open access article distributed under the terms and conditions of the Creative Commons Attribution (CC BY) license (http://creativecommons.org/licenses/by/4.0/).
Copyright: This open access article is published under a Creative Commons CC BY 4.0 license, which permit the free download, distribution, and reuse, provided that the author and preprint are cited in any reuse.


