Submitted:
01 December 2025
Posted:
02 December 2025
You are already at the latest version
Abstract
This paper presents research aimed at detecting and quantifying backlash in the feed motion subsystem of machine tools using positioning accuracy test results. By applying shallow neural networks, we not only estimate backlash magnitude but also analyse the impact of key parameters on its occurrence. This approach enables continuous, data-driven monitoring and prediction of backlash variation, while reducing machine tool calibration time in industrial settings.
The experimental study followed ISO 230-2, using two standard motion methods while monitoring machine and ambient temperature, atmospheric pressure, and humidity. The results show how experimental parameters affect detected backlash. A feed-forward neural network predicts current backlash at specific measurement points.
The results demonstrate high accuracy in backlash estimation, significantly simplifying machine calibration during maintenance and providing a foundation for real-time error compensation.
Keywords:
machine tool
; backlash
; feed motion subsystem
; machine learning
; neural networks
1. Introduction
Modern industrial development strategies worldwide prioritise the enhancement of efficiency and competitiveness of manufacturing systems [1,2]. This particularly applies to machine tools, which represent their key technological components.
A review of research in the field of machine tools indicates that meeting the requirements imposed by industrial production under conditions of growing global competition strongly depends on improving product manufacturing accuracy. Achieving such requirements has been made possible through advancements in machine tool design and by increasing the accuracy of motion generation [3,4].
The earliest studies focused on improving the accuracy of machine tools date back to the first half of the 18th century, when methods for measuring flatness and straightness were first defined [5], along with the establishment of procedures to ensure machining repeatability and positioning accuracy [6].
The automation of mechanical, drive, and control structures in numerically controlled (NC) machine tools, which emerged in the mid-20th century, enabled a significant increase in industrial production quality and productivity. At the same time, it became essential to ensure continuous monitoring and control of production quality. This led to the need for systematic research into the influence of design, operational, and environmental parameters on machine accuracy [7]. As a result of these needs, standardised methods for testing machine tool accuracy were developed and formalised in the early 1970s within ISO and ANSI frameworks [8,9] , establishing a foundation for comparing machine performance characteristics. Around the same period, laser interferometry began to be applied to assess positioning accuracy, the straightness of machine tool axes, and the flatness of reference surfaces [6,10].
Positioning accuracy testing provides detailed insights into machine precision and enables the identification and quantification of linear and rotational axis errors in numerically controlled machine tools. Modern measuring systems based on laser interferometers provide positional resolution of 0.1–1 nm. Such methods enable precise error classification and the calibration of machine tool components [11].
Research conducted over the past two decades has laid the foundation for the active compensation of errors in the feed motion subsystems of machine tools [5]. In most cases, these approaches increase the number of monitored parameters during testing and apply artificial intelligence methods to accurately determine calibration factors and enable real-time error correction during machine operation.
This paper presents a segment of research aimed at identifying the causes and consequences of inaccuracies in the feed motion subsystem of machine tools using artificial intelligence methods. The experiments were conducted in accordance with ISO 230-2 standards for machine tool positioning accuracy testing, with the addition of supplementary parameters that influence accuracy or that may result from processes that cause characteristic errors. The tests were performed to create a database of positioning accuracy results for one or more machines under various operating conditions (different speeds, external influences, etc.), serving as a basis for assessing the applicability of artificial intelligence in determining calibration parameters for machine tools during maintenance and in real-time operation [12] via Edge Computing technologies.
The working hypothesis of this study is that regular maintenance of machine tools, combined with the application of machine learning methods, can provide a basis for predicting certain categories of errors in machine tools. This leads to significant improvements by reducing calibration time and increasing the precision of calibration parameter estimation. Furthermore, it enables partial real-time error compensation via digital twin technology. The paper presents results on predicting backlash in the feed motion subsystem, which is one of the most common systematic errors in machine tools.
The paper is structured as follows: this section provides an overview of the research context and objectives. Section 2 discusses the issue of backlash in the feed motion subsystem, the causes of its occurrence, and its impact on machine tool performance. It also describes the methodology for positioning accuracy testing and the experimental setup used for backlash determination. Section 3 presents the advantages of applying machine learning methods for selecting the most influential parameters and predicting backlash magnitude, as well as the architecture of the neural network developed for backlash prediction following positioning accuracy tests. Section 4 presents the results of experimental testing, the description of the database used for neural network training, and the resulting predictions. Section 5 discusses the theoretical and experimental methods employed and the applicability of the results. Finally, the conclusions summarise the main findings and highlight the prospects for their industrial implementation.
2. Materials and Methods
2.1. Backlash in the Feed Motion Subsystem of Machine Tools
The feed motion subsystem of a machine tool plays a key role in forming the tool path relative to the workpiece. Consequently, the accuracy of motion trajectories and the repeatability of movements largely depend on the design and operational condition of the components of this subsystem. It consists of three main groups of components: mechanical, drive, and control.
In modern systems, multiple variants of mechanical and drive configurations exist; however, for light and medium-duty machine tools, the most commonly used configuration includes a servo motor as the primary drive element, a mechanical transmission composed of a ball screw and nut (for converting rotary to linear motion), and sliding or rolling guide elements (Figure 1) [13].
Manufacturing, assembly, and operational inaccuracies within this subsystem directly affect the positioning accuracy of the machine’s slide or spindle, and consequently the accuracy and repeatability of machining operations [14,15]. The causes of such inaccuracies include:
- mechanical inaccuracies due to manufacturing or assembly errors and elastic deformation during motion,
- wear of components in the feed motion assembly,
- thermal deformation under operating conditions,
- mechanical oscillations during changes in feed rate along curved paths,
- inadequate maintenance, poor lubricant quality, and other random causes, and
- drive-induced inaccuracies.
Modern control systems enable machine calibration using compensation values for multiple types of errors, determined through standardised testing procedures. The number and complexity of compensation routines that can be implemented depend on the control unit's memory and processing capabilities.
Backlash in the feed motion subsystem is one of the most pronounced systematic errors in machine tools. It can be compensated in every modern control system through a single numerical correction value added to or subtracted from the programmed position when the direction of motion changes. Some control system manufacturers also define the backlash compensation sign (positive or negative) to indicate the direction or location of the backlash. The principle of backlash direction definition in a nut (a)-and-screw (b) drive system is shown in Figure 2.
The left diagram illustrates a subsystem with an indirect measurement setup, where backlash occurs within the screw-nut assembly; the right diagram shows a subsystem with a direct measurement setup, where backlash appears within the measurement transmission components.
2.2. Testing the Positioning Accuracy of the Numerically Controlled Axes of Machine Tools and Determining the Backlash Value
The positioning accuracy of a numerically controlled machine tool axis is the deviation between the actual and programmed positions of the tool or workpiece carrier during repeated bidirectional positioning along that axis. The testing procedure allows for the quantitative determination of multiple types of axis errors and provides a foundation for calibration. This procedure is defined by several national and international standards, including ISO 230-2, ASME B5.54, JIS B6336, and IEC 61189-5-504, as well as by the VDI/DGQ 3441:1982 recommendations.
All these standards define test procedures based on determining the actual position of the work table (slide) or spindle using a laser interferometer with environmental compensation, and comparing the measured values with those programmed into the control system.
Positioning accuracy tests provide quantitative and qualitative information on the magnitude of systematic and random errors in the feed motion subsystem. The results enable the identification of error sources and the planning of maintenance interventions.
According to ISO 230-2, the testing is performed under workshop conditions while ensuring:
- unloaded machine operation with stable thermal and lubrication conditions,
- environmental parameters (temperature, humidity, pressure) close to reference values with continuous monitoring and compensation,
- use of certified measuring equipment with defined uncertainty [11], and
- adaptation of the testing procedure to the specific machine (number of measurement points, feed rate, etc.).
The testing involves measuring the position of an optical element (an interferometer or retroreflector) mounted on the moving part of the machine—typically the table—and comparing it with the programmed position. Figure 3 shows the setup of the measuring equipment for positioning accuracy testing.
Each measurement cycle includes positioning between defined points at a constant speed, with five repetitions in each direction at each position. Two motion paths are prescribed by the standard: linear (Figure 4a) and pendulum (Figure 4b). The number of measurement points, typically greater than six, depends on machine characteristics and measurement objectives [17].
The laser head is mounted on a tripod or similar stand, allowing fine alignment with the measurement axis, ideally positioned to enable testing of multiple axes without repositioning.
2.2.1. Processing of Positioning Accuracy Test Results
The results consist of measured positions at defined measurement points in both positive and negative travel directions, as certain mechanical imperfections exhibit directional behaviour. Data processing includes calculating deviations between target and actual positions and a range of standardised statistical parameters, equally applicable to linear and rotary axes.
Positioning accuracy testing for individual axes is performed on the selected axis over the maximum available segment of its total stroke (end positions are often inaccessible due to the dimensions of the measuring equipment), for "m" measuring points (positions). If necessary, the test can include only one part of the measured axis (to diagnose the condition of the elements of the feed motion subsystem on a machine that operates for a long time in a single workspace segment).
Testing is performed along the available portion of the axis travel, avoiding areas inaccessible to measurement equipment. Measurement points are evenly spaced, and in each, the moving element stops at least ten times from both directions, yielding n measured values for each reference point j.
Key terms are defined as:
- Pi: reference (programmed) position,
- Pij: actual measured position at the i-th and j-th reference point,
- Xij = Pij – Pi: deviation from the target position.
From these, several parameters are derived, including:
- mean of measured values,
- central deviation value at bidirectional positioning,
- maximum and average deviation ranges,
- unidirectional and bidirectional repeatability,
- unidirectional and bidirectional systematic positioning errors (E), and
- maximum bidirectional error (M).
The results are presented both in tabular and graphical form (Figure 5).
These data allow the identification of systematic and random errors, their spatial distribution, and the implementation of corrective actions. Random and progressive systematic errors are corrected by maintenance, while stable systematic errors are compensated numerically through software calibration. This can be realised within the maintenance process by removing the causes of random errors and certain causes of systematic errors. In addition, it is possible to numerically compensate systematic errors that do not show a progressive increase (usually caused by the type of machine, assembly errors, or wear of elements of the feed motion subsystem).
It is important to note that the standard itself does not define methods for identifying specific error types (e.g., backlash in the screw–nut assembly, axis inclination, etc.), as these depend on the machine’s design. Such determinations are made through diagram analysis (Figure 5 and Figure 8) and supplementary calculations.
2.2.2. Determination of Backlash in the Feed Motion Subsystem
To achieve the research objectives, it was necessary to quantify backlash in the feed motion assembly. Most commercial CNC control systems treat backlash as a scalar value used for compensation during direction reversal.
All positioning accuracy tests in this research were performed using both the linear and pendulum motion methods defined by ISO 230-2. The pendulum method involves alternating movements between measurement points across the entire measuring range, capturing deviations that include both systematic and random errors as well as backlash (Figure 6).
The linear method involves unidirectional movement with position measurements at each defined point (Figure 7). After completion, the direction is reversed, and the procedure is repeated:
In this case, backlash manifests only at the beginning and end of travel.
After the measurement, the backlash was determined as part of the feed movement at all central measurement points, except the end ones, by subtracting the deviation in positioning measured by the pendulum and linear methods for each point.
The endpoints are excluded, as backlash cannot be reliably determined there.
3. Application of Machine Learning in Backlash Estimation
Backlash in the feed motion subsystem is a systematic error that appears during movement along specific machine tool axes. It primarily depends on machine design, component characteristics (screw–nut, rack–and–pinion, etc.), wear level, thermal expansion, and the position and type of measurement system. While the influence of some parameters can be estimated from physical characteristics, environmental and operational variations may cause significant deviations.
Research in this domain generally follows two directions:
- development of standardised methods for accurate backlash determination for machine calibration, and
- creation of software tools for real-time backlash estimation and compensation based on operational parameters such as power, noise, or vibration.
In both cases, advanced software solutions that account for numerous influencing parameters—design, operational, environmental, and measurement-related—are essential. Machine learning methods have proven particularly effective [18,19,20], as they enable the integration of diverse input data, improve diagnostic precision, and support prediction and compensation of mechanical errors [21]. , as they enable the integration of diverse input data, improve diagnostic precision, and support prediction and compensation of mechanical errors [22].
Under controlled testing conditions defined by standardised procedures that minimise measurement uncertainty, machine learning techniques provide an optimal solution for estimating backlash values suitable for machine calibration [23,24]. These methods establish mathematical relationships between influencing parameters [25,26], enabling rapid prediction of compensation factors during calibration or machine operation.
In the present study, a shallow feedforward neural network was used to estimate variations in backlash values within the feed motion subsystem, based on positioning accuracy test results. Input parameters included not only the measured deviations from programmed positions but also machine and environmental parameters such as travel speed, machine and ambient temperature, air pressure, and humidity.
Given the number of potential inputs and the nature of backlash as a systematic error, previous studies have emphasised the advantages of feedforward neural networks [18]. Therefore, the experimental model employed a network with eight input nodes, one output node, and two hidden layers containing eight neurons each. The network was developed, trained, validated, and tested using MATLAB software. Figure 9 presents the schematic of the neural network used.
4. Results of Experimental Research
The experimental investigations conducted within this research included a series of positioning accuracy measurements along individual axes of the FM38 horizontal machining center installed at the Faculty of Technical Sciences, University of Novi Sad.
The accuracy testing was performed using a specialised measurement system for machine tool calibration—HP 5526A, based on a laser interferometer, while continuously monitoring external conditions, including ambient temperature, atmospheric pressure, and humidity, as well as the temperature of the machine’s ball screw (measured using a contact probe integrated into the measuring system).
For the portion of the experiment used to form the neural network training database and to verify the research hypothesis presented in this paper, an experimental plan was developed to measure the positioning accuracy of individual axes of the Heidenreich & Harbeck FM38 machining center, following the procedure defined by ISO 230.
The linear axes of this machine use a recirculating ball screw and nut drive. The experimental plan was designed using the Taguchi method, with parameters given in Table 1.
Analysis of deviations from programmed positions obtained with different motion methods at each measurement point allows determination of backlash values, as described in Section 2.2.2, providing the necessary output data for training and validating the neural network.
Testing of the FM38 machining center produced a training dataset consisting of measurement results collected at different positions along the test axis. The database included the following parameters: programmed slide position (measurement point), feed rate, measured positions for both motion methods, deviations between measured and programmed positions in both travel directions, machine and ambient temperature, pressure, and humidity. Each measurement was repeated three times for each feed rate.
Additionally, the database included statistical parameters defined by ISO 230-2, necessary both for generating standardised test reports and for identifying characteristic errors. The complete dataset comprised 432 measurement points per axis.
Backlash determination and neural network formation were based on data obtained from the X-axis, ensuring the inclusion of machine-specific structural and operational characteristics. Table 2 presents an excerpt from the measurement database.
The initial step in data processing was the training of the neural network. The Levenberg–Marquardt backpropagation algorithm was used for training, with 70% of the available data reserved for this phase. The mean squared normalised error (MSE) function was used to evaluate deviations from expected values and to adjust network parameters.
Validation and testing were performed on 15% of the remaining data each. The neural network achieved optimal performance at the 27th epoch out of 33 total training iterations. Figure 10 shows the network performance during the training phase.
The deviations between the predicted and true backlash values in the feed motion assembly during training, validation, and testing are shown in Figure 11.
The trained neural network was then tested using a sample of 80 data points. The backlash values obtained in the feed motion subsystem of the FM38 machining center ranged from 0.9μm to 5 μm. Figure 12 presents the graphical representation of the test results.
Figure 13 presents the regression results for the neural network's training, validation, and test phases.
5. Discussion
The application of artificial intelligence techniques for predicting parameters of complex mechatronic systems—such as CNC machine tools—requires a critical assessment of the obtained results. This is particularly important when estimating parameters that can significantly affect machine performance. The results, therefore, must be analysed from several perspectives:
- the influence of measurement uncertainty (both equipment and environmental) on backlash prediction,
- the influence of individual input parameters on prediction results,
- the accuracy and robustness of predicted backlash values, and
- the applicability of the defined procedure in real industrial environments.
To verify the validity of the conducted measurements, the measurement uncertainty was evaluated in accordance with ISO 230-9:2005[27]
The measuring equipment was adjusted according to manufacturer specifications to minimise potential error sources, such as misalignment error, Abbe error, and lost motion. During measurements, the laboratory temperature was maintained at 21 °C ± 2 °C. The measurement duration per axis did not exceed 30 minutes. The measuring instruments were not recalibrated prior to testing; therefore, the manufacturer's uncertainty values were used.
The optical alignment was maintained within 1 mm of the tested axis, with repeatability steps of 50 mm and maximum deviation gradients of 50 µm/m. Environmental variation errors were considered according to [28]. The laser interferometer is positioned to minimise the path error. Table 2 shows the obtained uncertainty values for the farthest measurement point of the examined axis. The laser measurement system used includes automatic ambient compensation and automatic expansion coefficient compensation. uM Device, iuE Device are considered null. For steel, a thermal expansion coefficient of α = 0.012 μm/mm ◦C was used, and the uncertainty range was set to Δα = 0.002 μm/mm oC, following ISO recommendations.
The He–Ne laser source with a Zeeman-split dual-frequency output (HP 5500C) was used in conjunction with an optical interferometer and retroreflector. Table 3 shows the influential measurement uncertainty parameters for the used equipment.
Uncertainty parameters are also determined based on the measurement length. The obtained values are presented in Table 4.
The results showed that the influence of environmental and instrumental factors on measurement uncertainty was minimal under the given conditions.
Another critical issue concerns the influence of individual measured parameters on the neural network’s output. To identify the most relevant parameters, a weighted k-nearest neighbours (k-NN) classification algorithm was used. Validation achieved 98.8% accuracy. Figure 14 presents the ANOVA-based influence scores of the analysed parameters, expressed as –log(p) values.
Table 5 summarizes the ANOVA scores for each testing parameter.
From these results, it can be concluded that most selected parameters are relevant for determining backlash in the feed motion subsystem. The most significant parameters are position, deviation from the commanded position, and feed rate, while environmental parameters have a considerably smaller impact.
The test results for 60 data samples correspond to the actual backlash values of a machine tool equipped with a recirculating ball screw and a preloaded nut after a defined operational period. The obtained backlash range indicates that no mechanical adjustment of the nut is currently required; numerical compensation is sufficient.
Observed point-to-point variations include both systematic and structural errors not explicitly covered by this study, which can be corrected in the subsequent calibration cycle.
The conducted research demonstrates that machine learning, specifically feedforward neural networks, can accurately predict backlash values in feed motion assemblies. The analysis also revealed that input parameters dependent on measured position accuracy strongly influence results, confirming the potential of this method for predictive maintenance based on a machine’s historical measurement data.
This approach significantly reduces calibration time and improves the accuracy of backlash compensation for specific machine tool axes. Moreover, it indicates the possibility of extending the same methodology to rotary axes.
Additionally, the applied testing and analysis procedures suggest the feasibility of real-time monitoring of ball screw condition in modern CNC machine tools. However, such implementation requires integrated active and reference measurement systems and appropriate upgrades to the control system.
6. Conclusions
The research presented in this study highlights the importance of artificial intelligence applications in the maintenance and operation of machine tools. The initial hypothesis—that the machine tool calibration process can be significantly improved through machine learning methods while fully complying with ISO 230-2 testing procedures—has been confirmed.
Furthermore, applying a similar methodology while continuously monitoring additional parameters (e.g., energy or dynamic data) has strong potential for automatic real-time calibration by correcting compensation values. This trend aligns with the growing adoption of Edge Computing-based feedback systems in the modern machine tool industry.
Future research, building on the database and methodology established here, will focus on identifying other systematic and random errors that occur during machine operation. The ultimate objectives include the development of automatic calibration applications for machine tools based on the tracking of key influencing parameters, and the implementation of digital twin–based systems for intelligent, self-correcting machine tool calibration.
Author Contributions
Conceptualization, S.T.; methodology, S.T., M.Z., and S.Z.; software, S.T.; validation, M.Z. and A.B.; investigation, S.T. and S.Z.; resources, S.T.; writing—original draft preparation, S.T.; writing—review and editing, S.Z.; visualization, S.T. and S.Z.; supervision, M.Z. All authors have read and agreed to the published version of the manuscript..
Funding
This research has been supported by the Ministry of Science, Technological Development and Innovation (Contract No. 451-03-137/2025-03/200156) and the Faculty of Technical Sciences, University of Novi Sad through project “Scientific and Artistic Research Work of Researchers in Teaching and Associate Positions at the Faculty of Technical Sciences, University of Novi Sad 2025” (No. 01-50/295) and University of Belgrade Faculty of Mechanical Engineering by contract no. 451-03-137/2025-03/200105 for 2025.
Data Availability Statement
The original data presented in the study are openly available at URI: https://oblak.uns.ac.rs/index.php/s/ffeSGHBo5WN4TfB (accessed on 26 November 2025).
Acknowledgments
We appreciate the anonymous reviewers’ and editorial team members’ suggestions and comments. Thanks for the support of the fund projects mentioned above.
Conflicts of Interest
The authors declare no conflict of interest.
References
- Li, L. China's manufacturing locus in 2025: With a comparison of “Made-in-China 2025” and “Industry 4.0”. Technological Forecasting and Social Change 2018, 135, 66–74. [Google Scholar] [CrossRef]
- Terzi, A.; Sherwood, M.; Singh, A. European industrial policy for the green and digital revolution. Science and Public Policy 2023, 50, 842–857. [Google Scholar] [CrossRef]
- Aguado, S.; Pérez, P.; Albajez, J.A.; Velázquez, J.; Santolaria, J. Inaccuracy of machine tools due to verification conditions. Measurement 2022, 188, 110629. [Google Scholar] [CrossRef]
- Wang, L.; Han, J.; Tang, Z.; Zhang, Y.; Wang, D.; Li, X. Geometric Accuracy Design of High Performance CNC Machine Tools: Modeling, Analysis, and Optimization. Chinese Journal of Mechanical Engineering 2025, 38, 87. [Google Scholar] [CrossRef]
- Schwenke, H.; Knapp, W.; Haitjema, H.; Weckenmann, A.; Schmitt, R.; Delbressine, F. Geometric error measurement and compensation of machines—An update. CIRP Annals 2008, 57, 660–675. [Google Scholar] [CrossRef]
- Weck, M. Werkzeugmaschinen Fertigungssysteme 1: Maschinenarten und Anwendungsbereiche; Springer Berlin Heidelberg: 2013.
- Zhang, Z.; Jiang, F.; Luo, M.; Wu, B.; Zhang, D.; Tang, K. Geometric error measuring, modeling, and compensation for CNC machine tools: A review. Chinese Journal of Aeronautics 2024, 37, 163–198. [Google Scholar] [CrossRef]
- ISO. ISO 230-1: Test code for machine tools – Geometric accuracy. 1973.
- ANSI. ANSI B5.54: Methods for Performance Evaluation of NC Machine Tools. 1975.
- Bryan, J.B. A simple method for testing measuring machines and machine tools Part 1: Principles and applications. Precision Engineering 1982, 4, 61–69. [Google Scholar] [CrossRef]
- Tabakovic, S.; Zeljkovic, M.; Zivanovic, S.; Budimir, A.; Dimic, Z.; Kosarac, A. Calibration of a Hybrid Machine Tool from the Point of View of Positioning Accuracy. Applied Sciences 2024, 14, 5275. [Google Scholar] [CrossRef]
- Rosemeyer, J.; Pinzone, M.; Metternich, J. Digital Assistance Systems to Implement Machine Learning in Manufacturing: A Systematic Review. Machine Learning and Knowledge Extraction 2024, 6, 2808–2828. [Google Scholar] [CrossRef]
- Altintas, Y.; Verl, A.; Brecher, C.; Uriarte, L.; Pritschow, G. Machine tool feed drives. CIRP Annals 2011, 60, 779–796. [Google Scholar] [CrossRef]
- Ma, J.; Lu, D.; Zhao, W. Assembly errors analysis of linear axis of CNC machine tool considering component deformation. The International Journal of Advanced Manufacturing Technology 2016, 86, 281–289. [Google Scholar] [CrossRef]
- Wang, L.; Liu, X.; Tian, W.; Zhang, D. Geometric Accuracy Design and Tolerance Allocation of Precision Horizontal Machining Centers. Machines 2025, 13, 187. [Google Scholar] [CrossRef]
- Ramesh, R.; Mannan, M.A.; Poo, A.N. Error compensation in machine tools — a review: Part I: geometric, cutting-force induced and fixture-dependent errors. International Journal of Machine Tools and Manufacture 2000, 40, 1235–1256. [Google Scholar] [CrossRef]
- ISO. ISO 230-2:2014 Test code for machine tools-Part 2: Determination of accuracy and repeatability of positioning of numerically controlled axes. 2014.
- Wang, K.-S.; Li, Z.; Braaten, J.; Yu, Q. Interpretation and compensation of backlash error data in machine centers for intelligent predictive maintenance using ANNs. Advances in Manufacturing 2015, 3, 97–104. [Google Scholar] [CrossRef]
- Azamfar, M.; Li, X.; Lee, J. Intelligent ball screw fault diagnosis using a deep domain adaptation methodology. Mechanism and Machine Theory 2020, 151, 103932. [Google Scholar] [CrossRef]
- Benker, M.; Zaeh, M.F. Condition monitoring of ball screw feed drives using convolutional neural networks. CIRP Annals 2022, 71, 313–316. [Google Scholar] [CrossRef]
- Gao, W.; Ibaraki, S.; Donmez, M.A.; Kono, D.; Mayer, J.R.R.; Chen, Y.-L.; Szipka, K.; Archenti, A.; Linares, J.-M.; Suzuki, N. Machine tool calibration: Measurement, modeling, and compensation of machine tool errors. International Journal of Machine Tools and Manufacture 2023, 187, 104017. [Google Scholar] [CrossRef]
- Xie, Z.; Yu, D.; Zhan, C.; Zhao, Q.; Wang, J.; Liu, J.; Liu, J. Ball screw fault diagnosis based on continuous wavelet transform and two-dimensional convolution neural network. Measurement and Control 2023, 56, 518–528. [Google Scholar] [CrossRef]
- Kumbhar, M.; Bandaru, S.; Karlsson, A. Condition Monitoring of a Machine Tool Ballscrew Using Wavelet Transform based Unsupervised Learning. Procedia CIRP 2024, 130, 342–347. [Google Scholar] [CrossRef]
- Soori, M.; Arezoo, B.; Dastres, R. Machine learning and artificial intelligence in CNC machine tools, A review. Sustainable Manufacturing and Service Economics 2023, 2, 100009. [Google Scholar] [CrossRef]
- Kosarac, A.; Tabakovic, S.; Mladjenovic, C.; Zeljkovic, M.; Orasanin, G. Next-Gen Manufacturing: Machine Learning for Surface Roughness Prediction in Ti-6Al-4V Biocompatible Alloy Machining. Journal of Manufacturing and Materials Processing 2023, 7, 202. [Google Scholar] [CrossRef]
- Kosarac, A.; Mladjenovic, C.; Zeljkovic, M.; Tabakovic, S.; Knezev, M. Neural-Network-Based Approaches for Optimization of Machining Parameters Using Small Dataset. Materials 2022, 15, 700. [Google Scholar] [CrossRef] [PubMed]
- ISO. ISO/TR 230-9:2005, Test code for machine tools, Part 9: Estimation of measurement uncertainty for machine tool tests according to series ISO 230, basic equations. 2005, 24.
- Quan, L.; Zhao, W. Uncertainty analysis of motion accuracy on single-axis feed drive systems. Advances in Mechanical Engineering 2024, 16, 16878132231222790. [Google Scholar] [CrossRef]
Figure 1.
Feed motion subsystem of a machine tool.
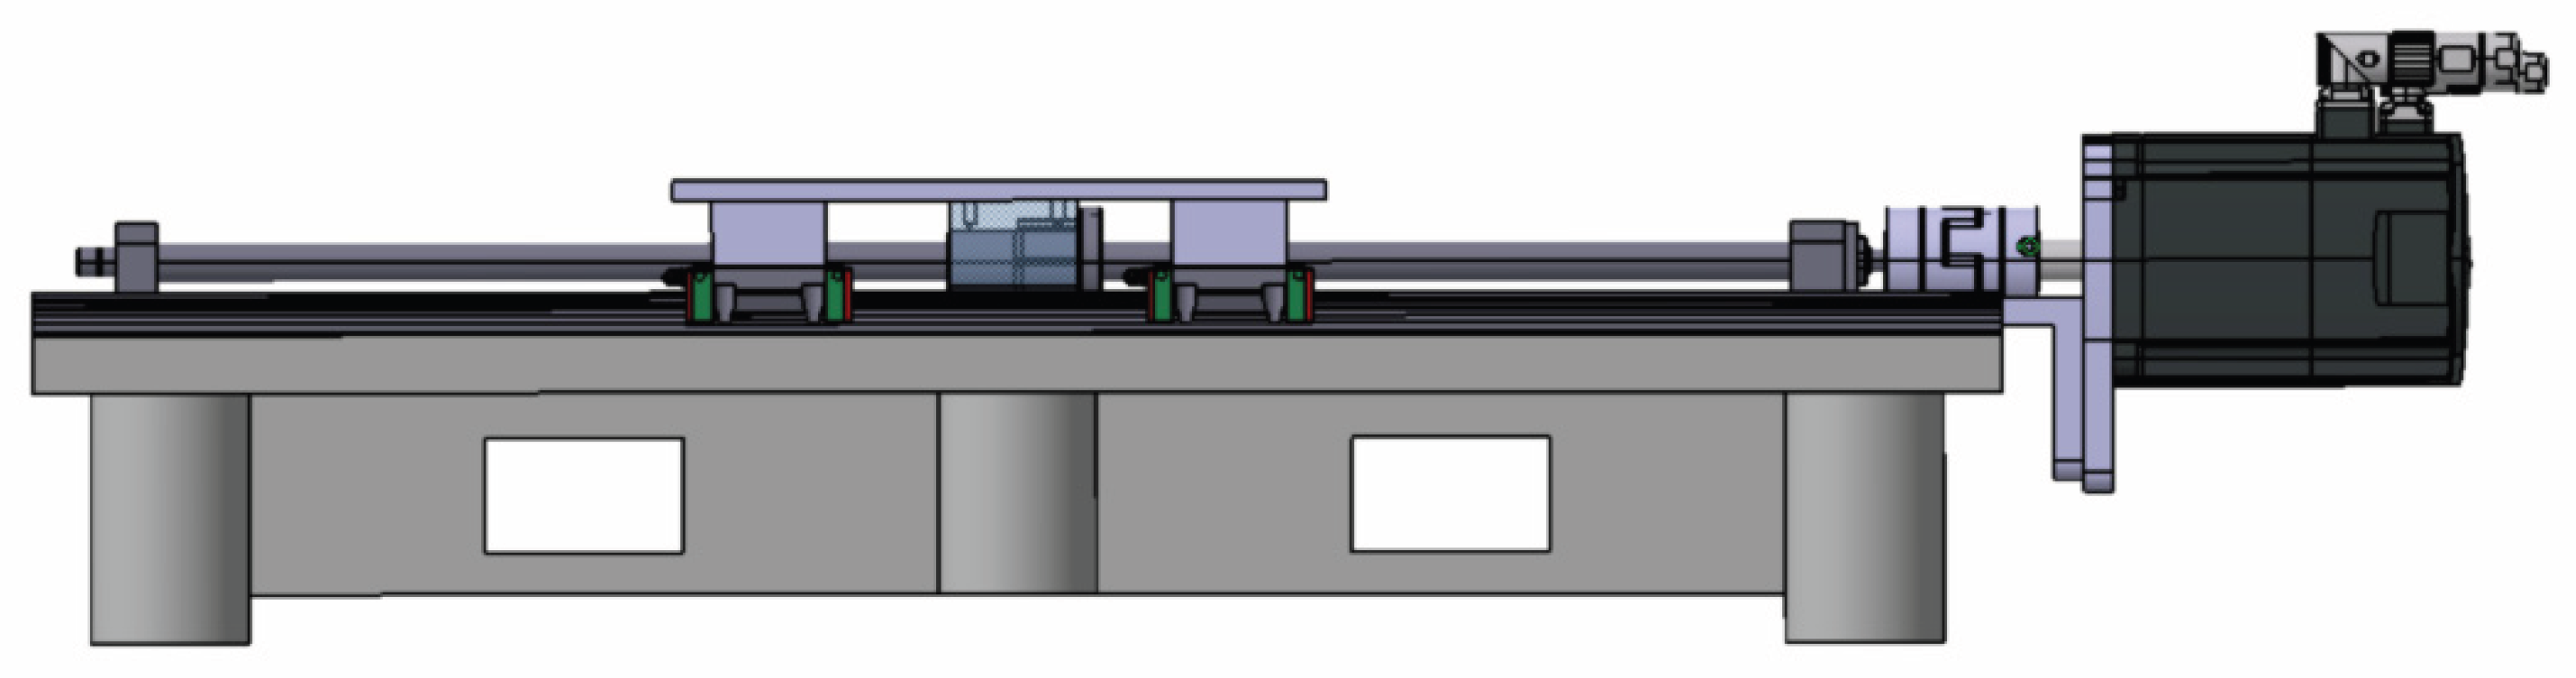
Figure 2.
Backlash occurrence in the feed motion subsystem.
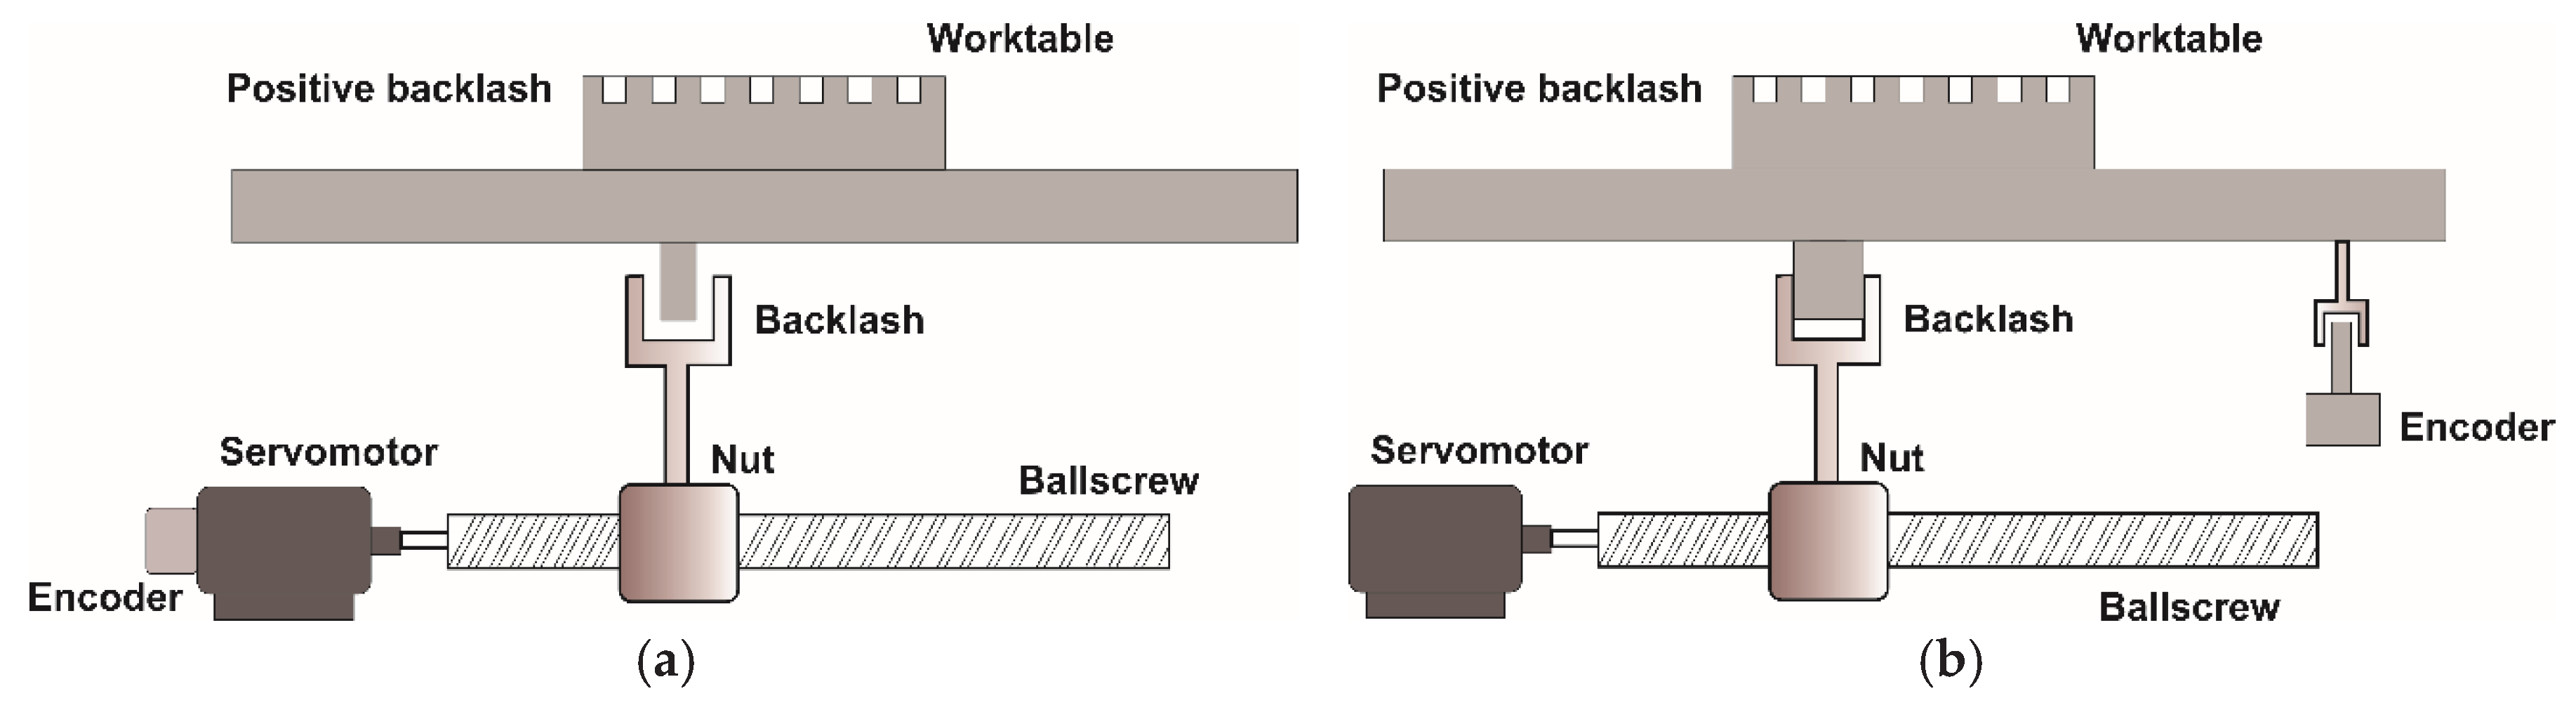
Figure 3.
Arrangement of measuring equipment during positioning accuracy testing.
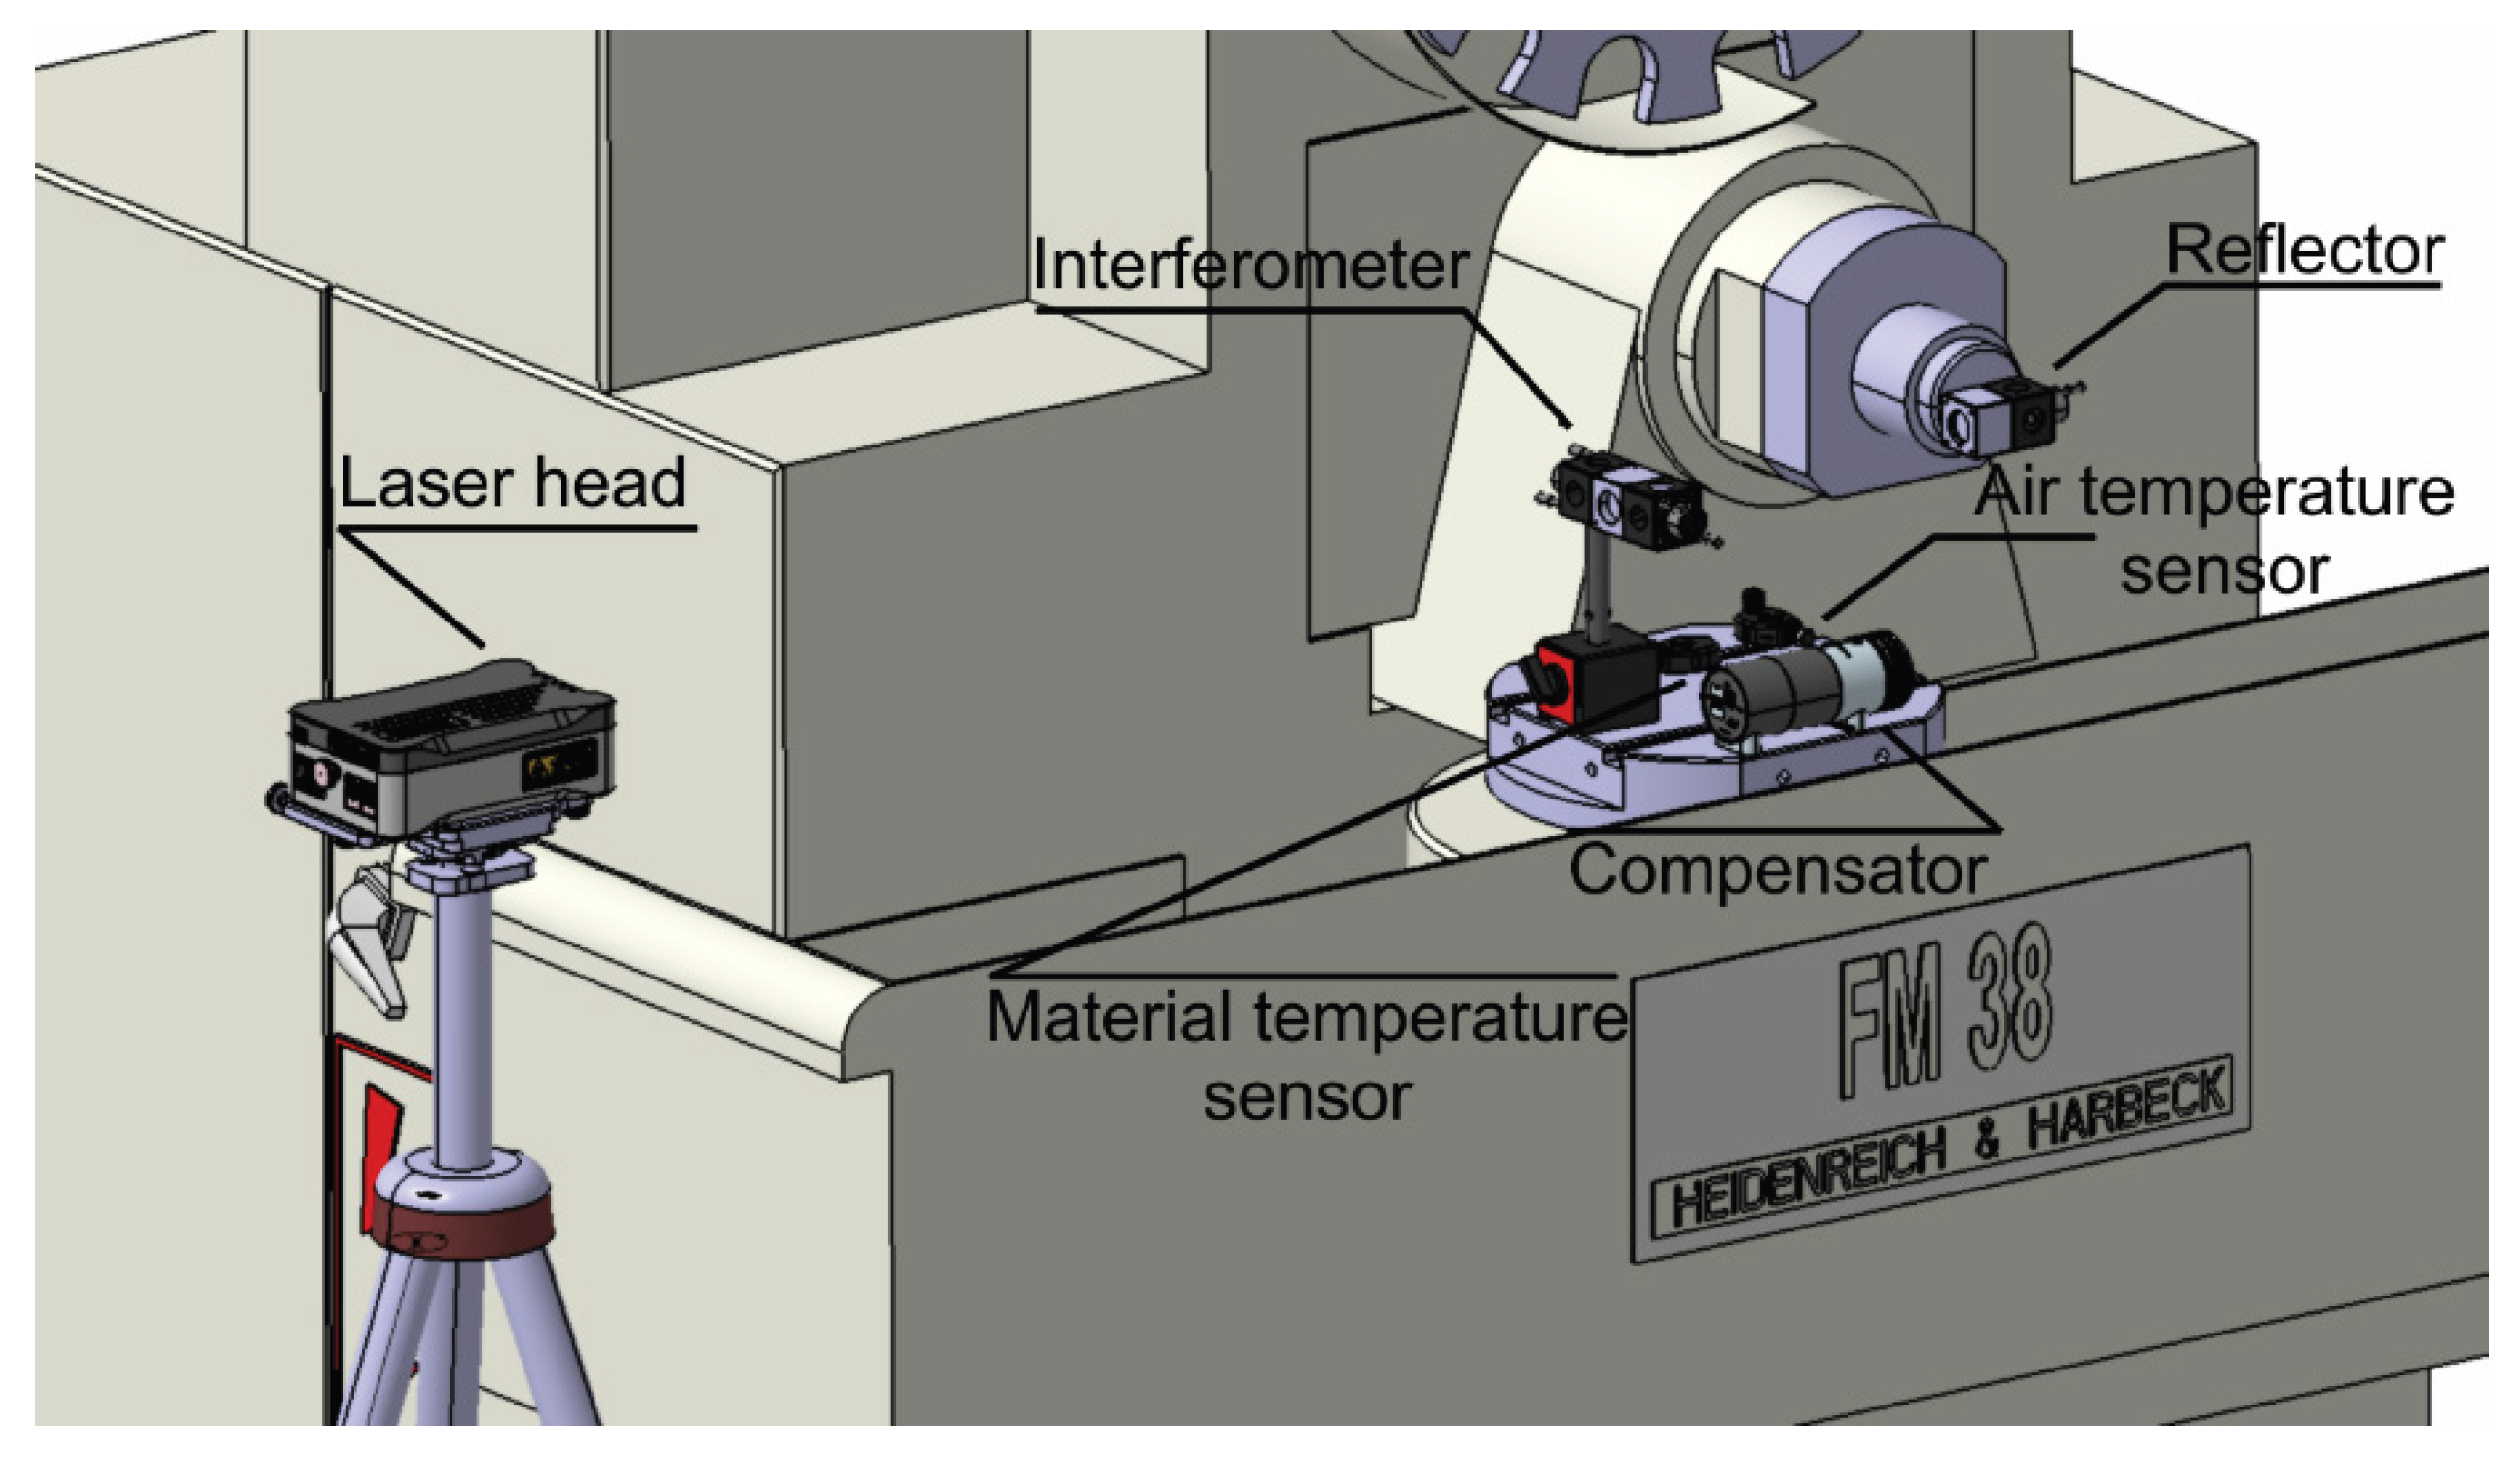
Figure 4.
Linear (a) and pendulum (b) motion cycles for positioning accuracy testing.
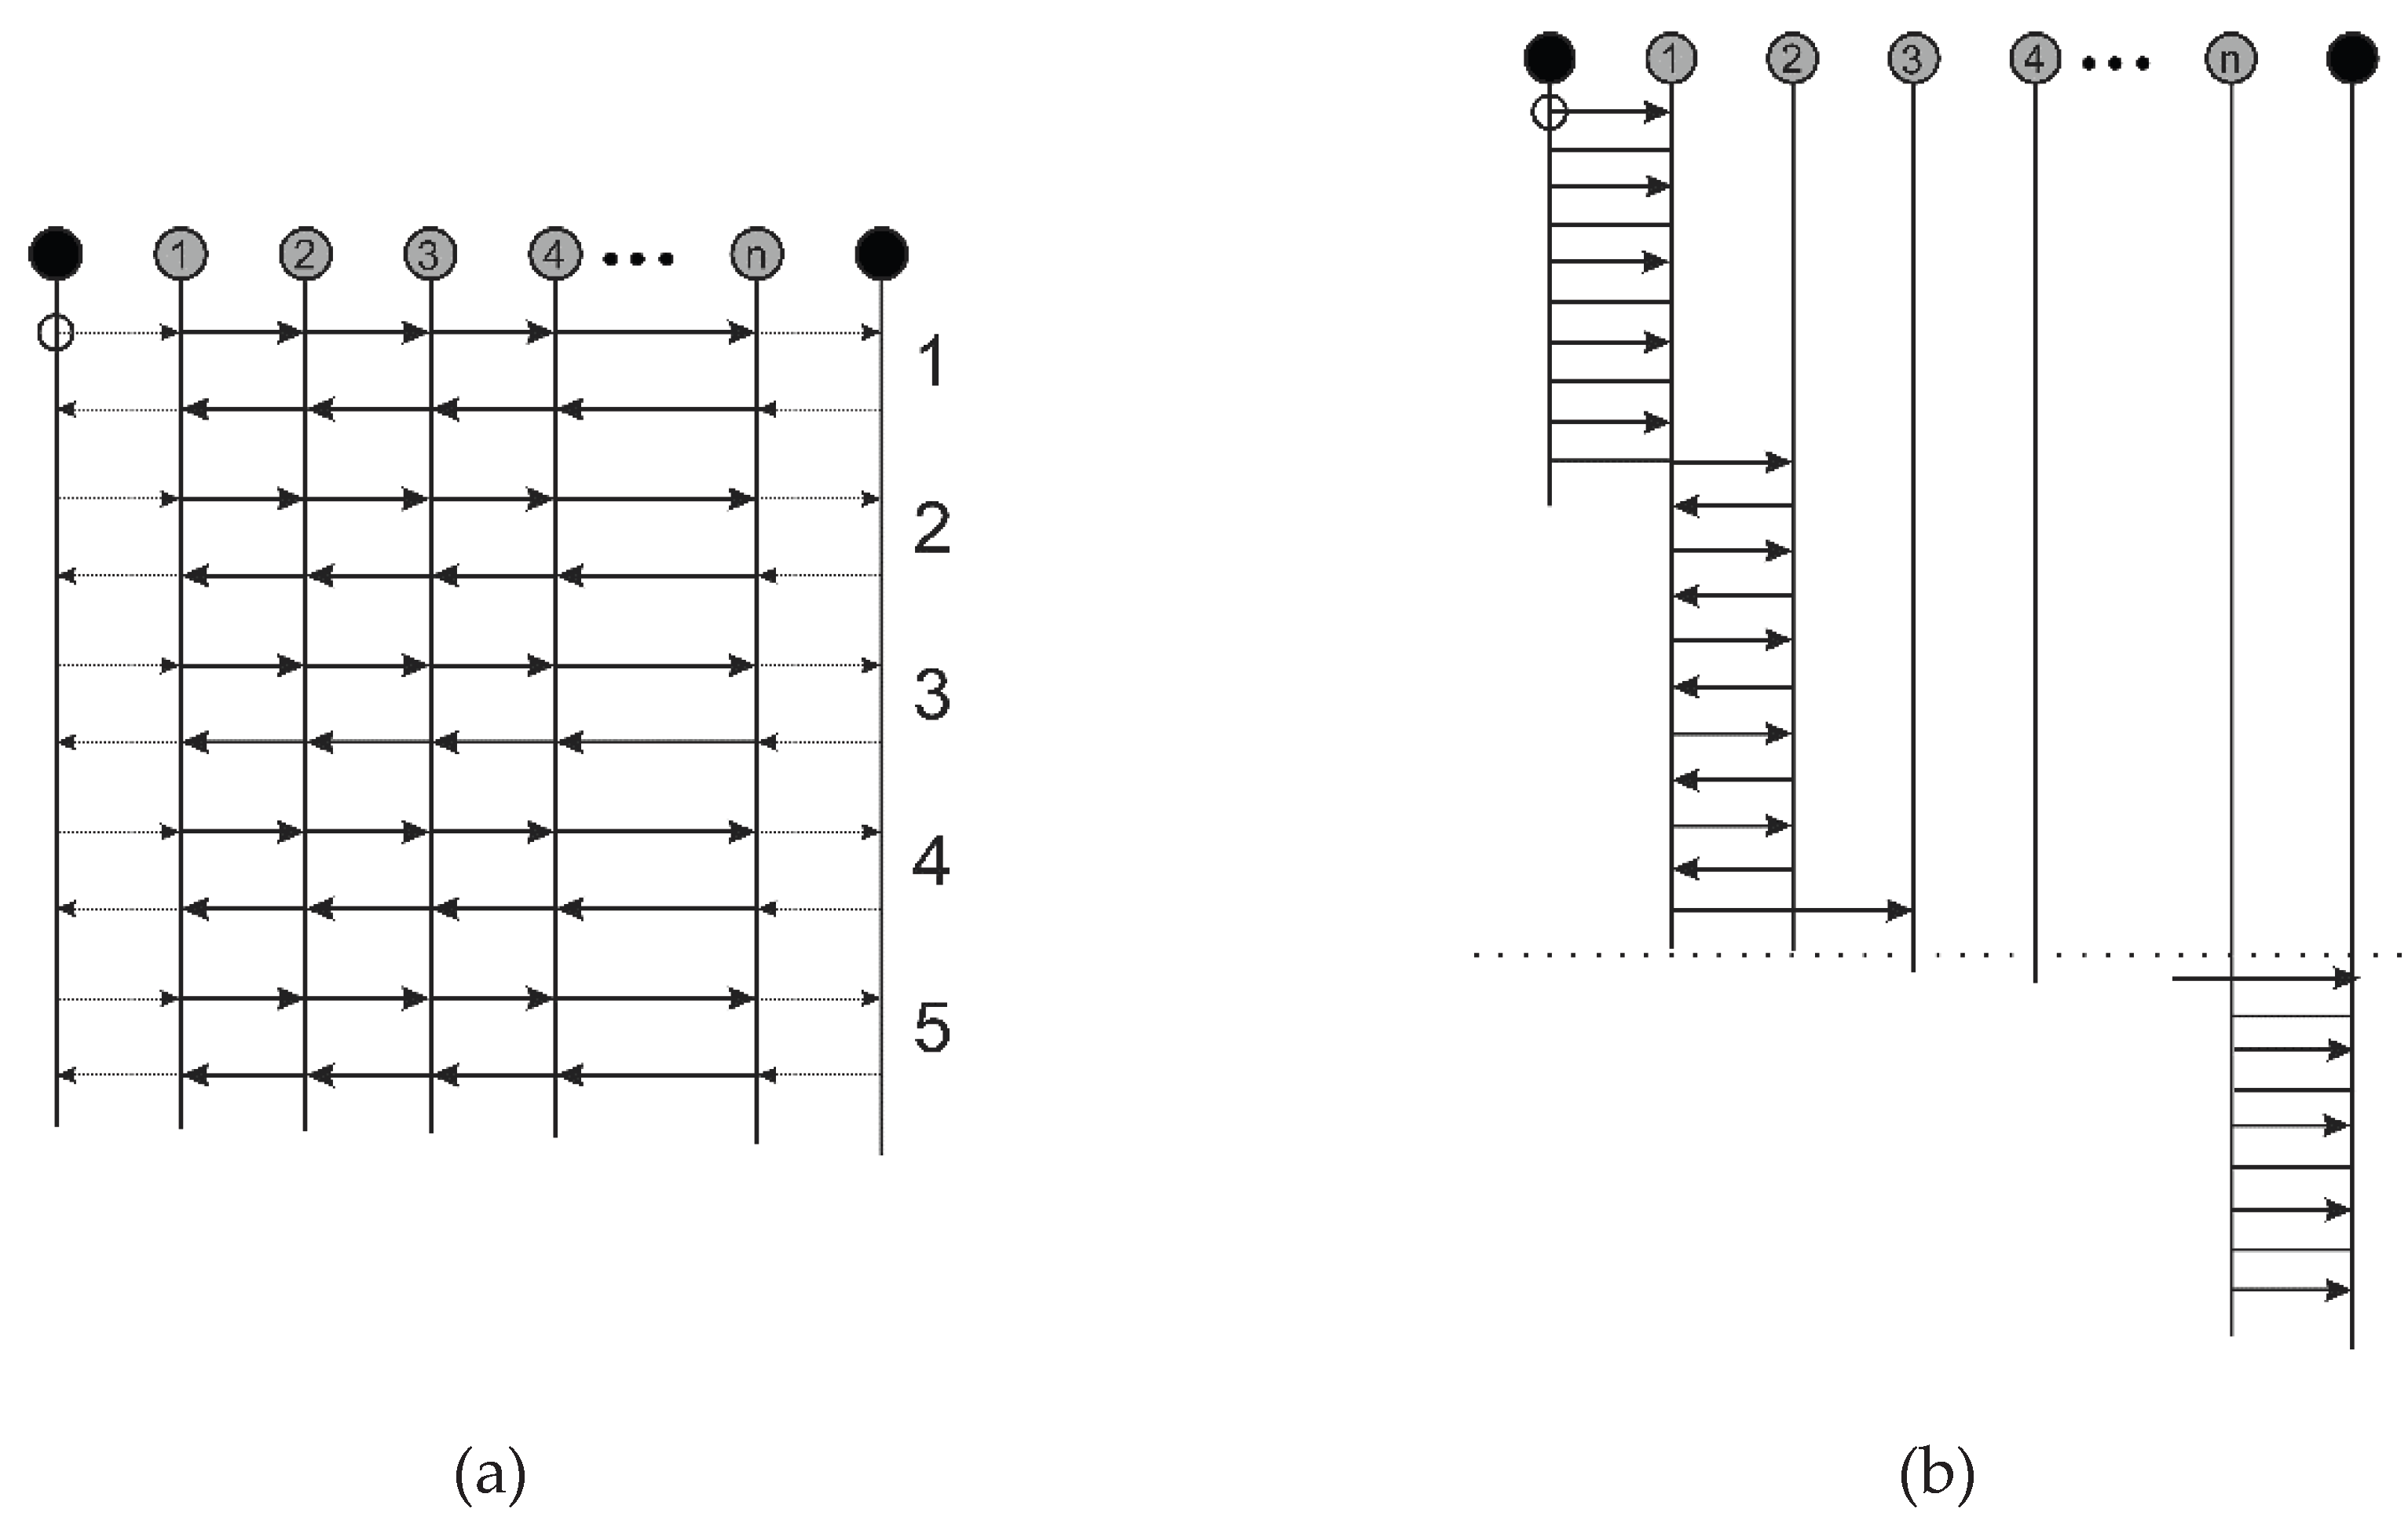
Figure 5.
Example of positioning accuracy test results.
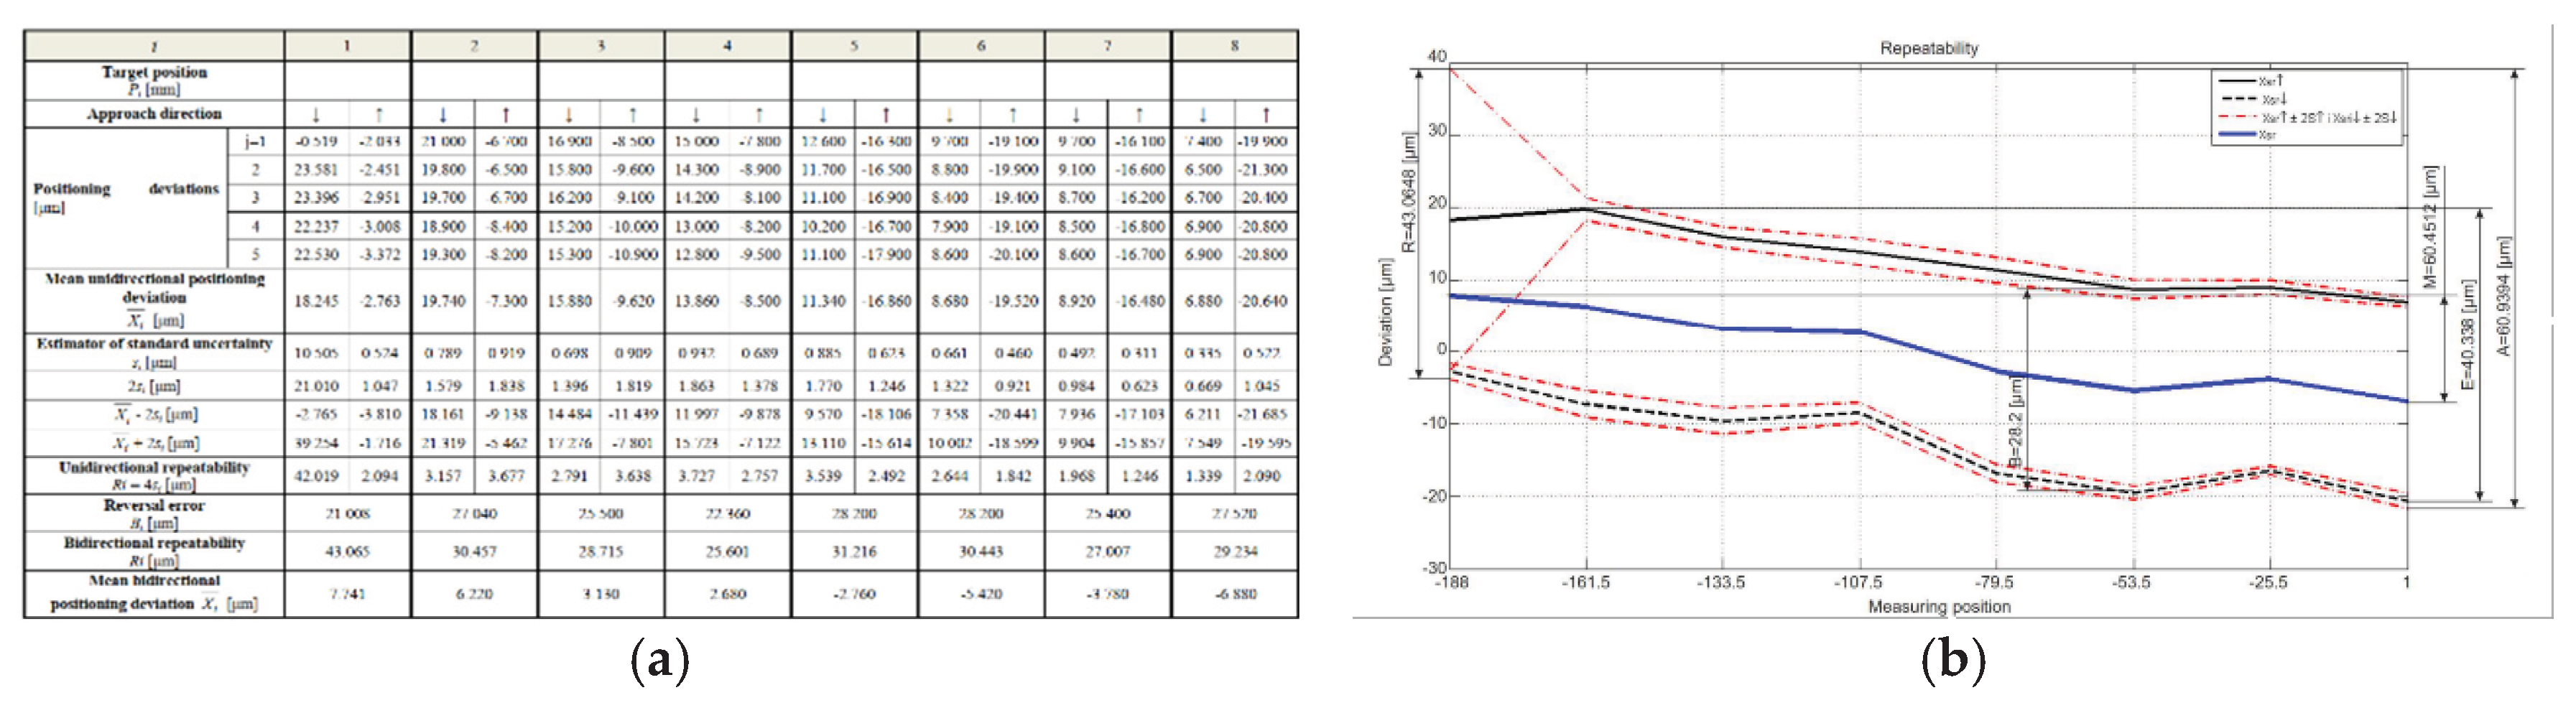
Figure 6.
Backlash effect in pendulum motion method.
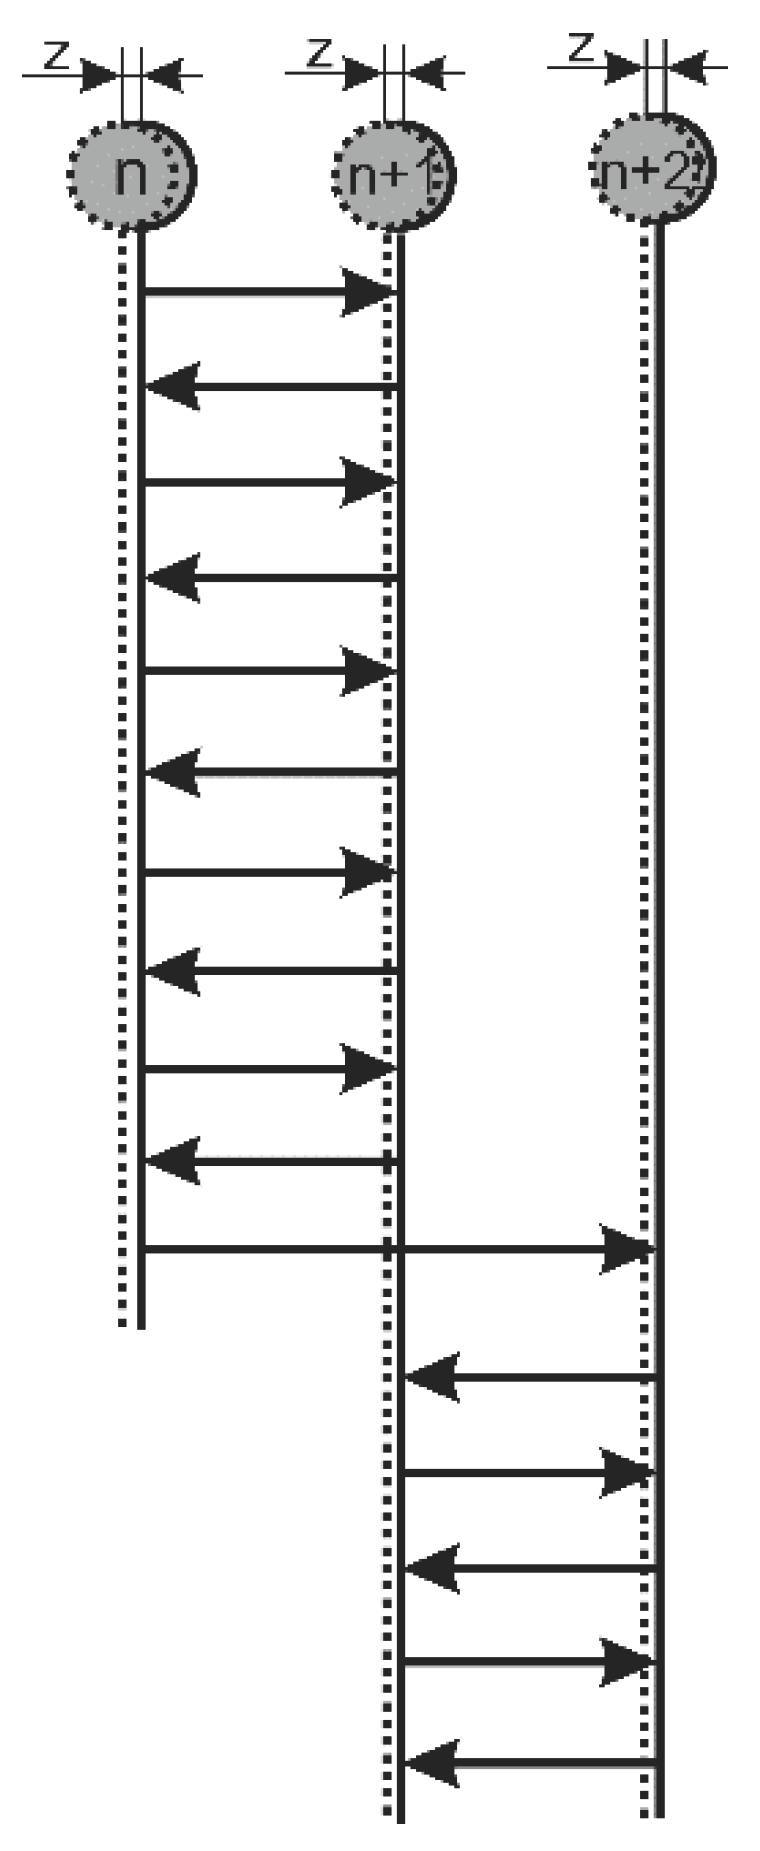
Figure 7.
Backlash effect in linear motion method.
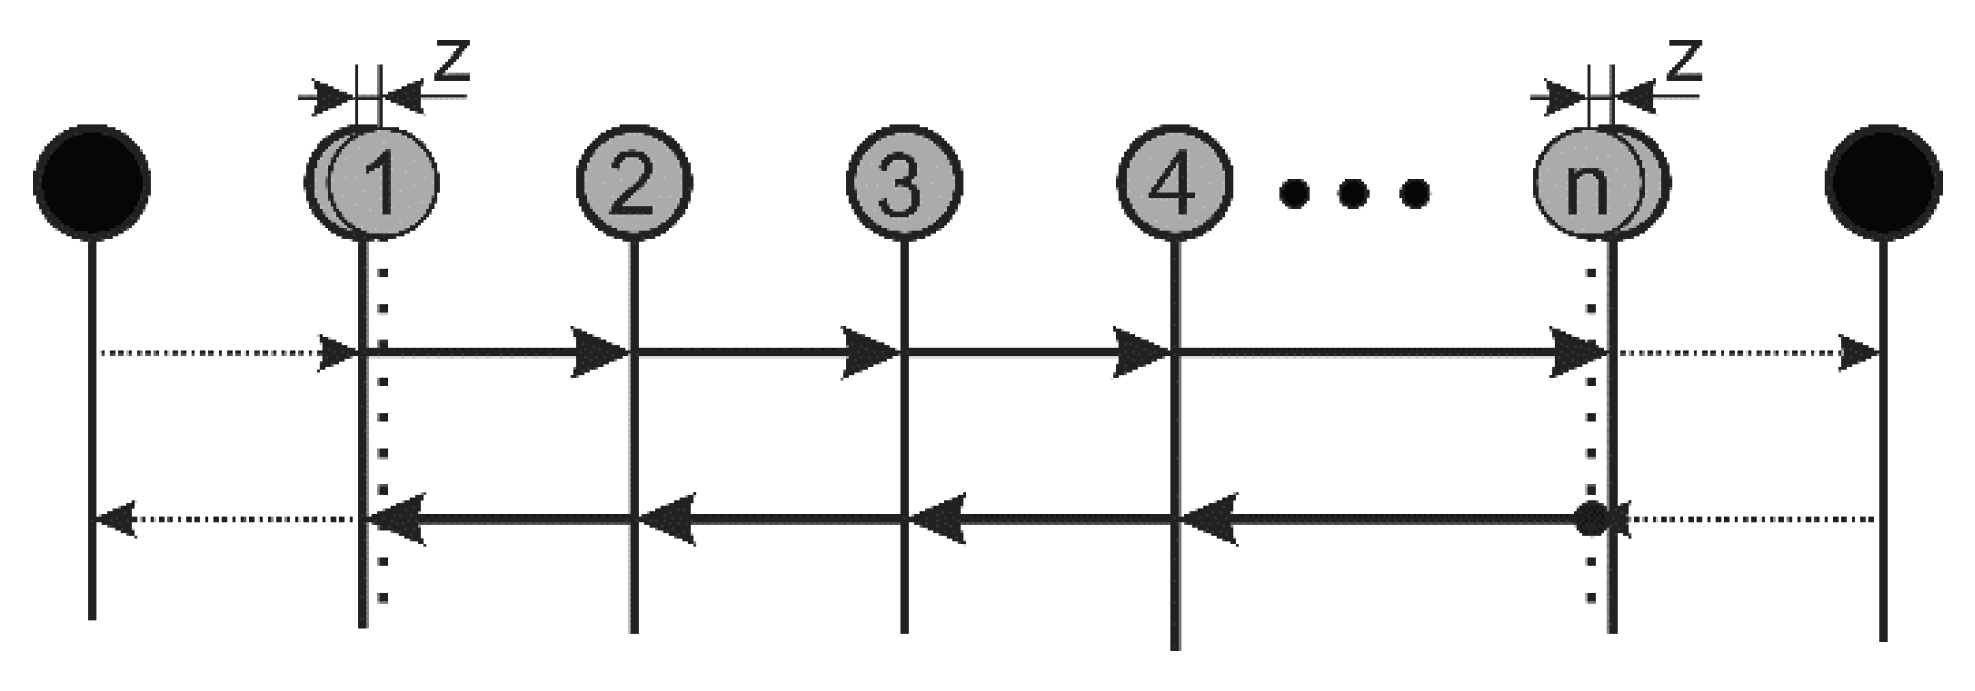
Figure 8.
The impact of the changing the direction of movement on the test result.
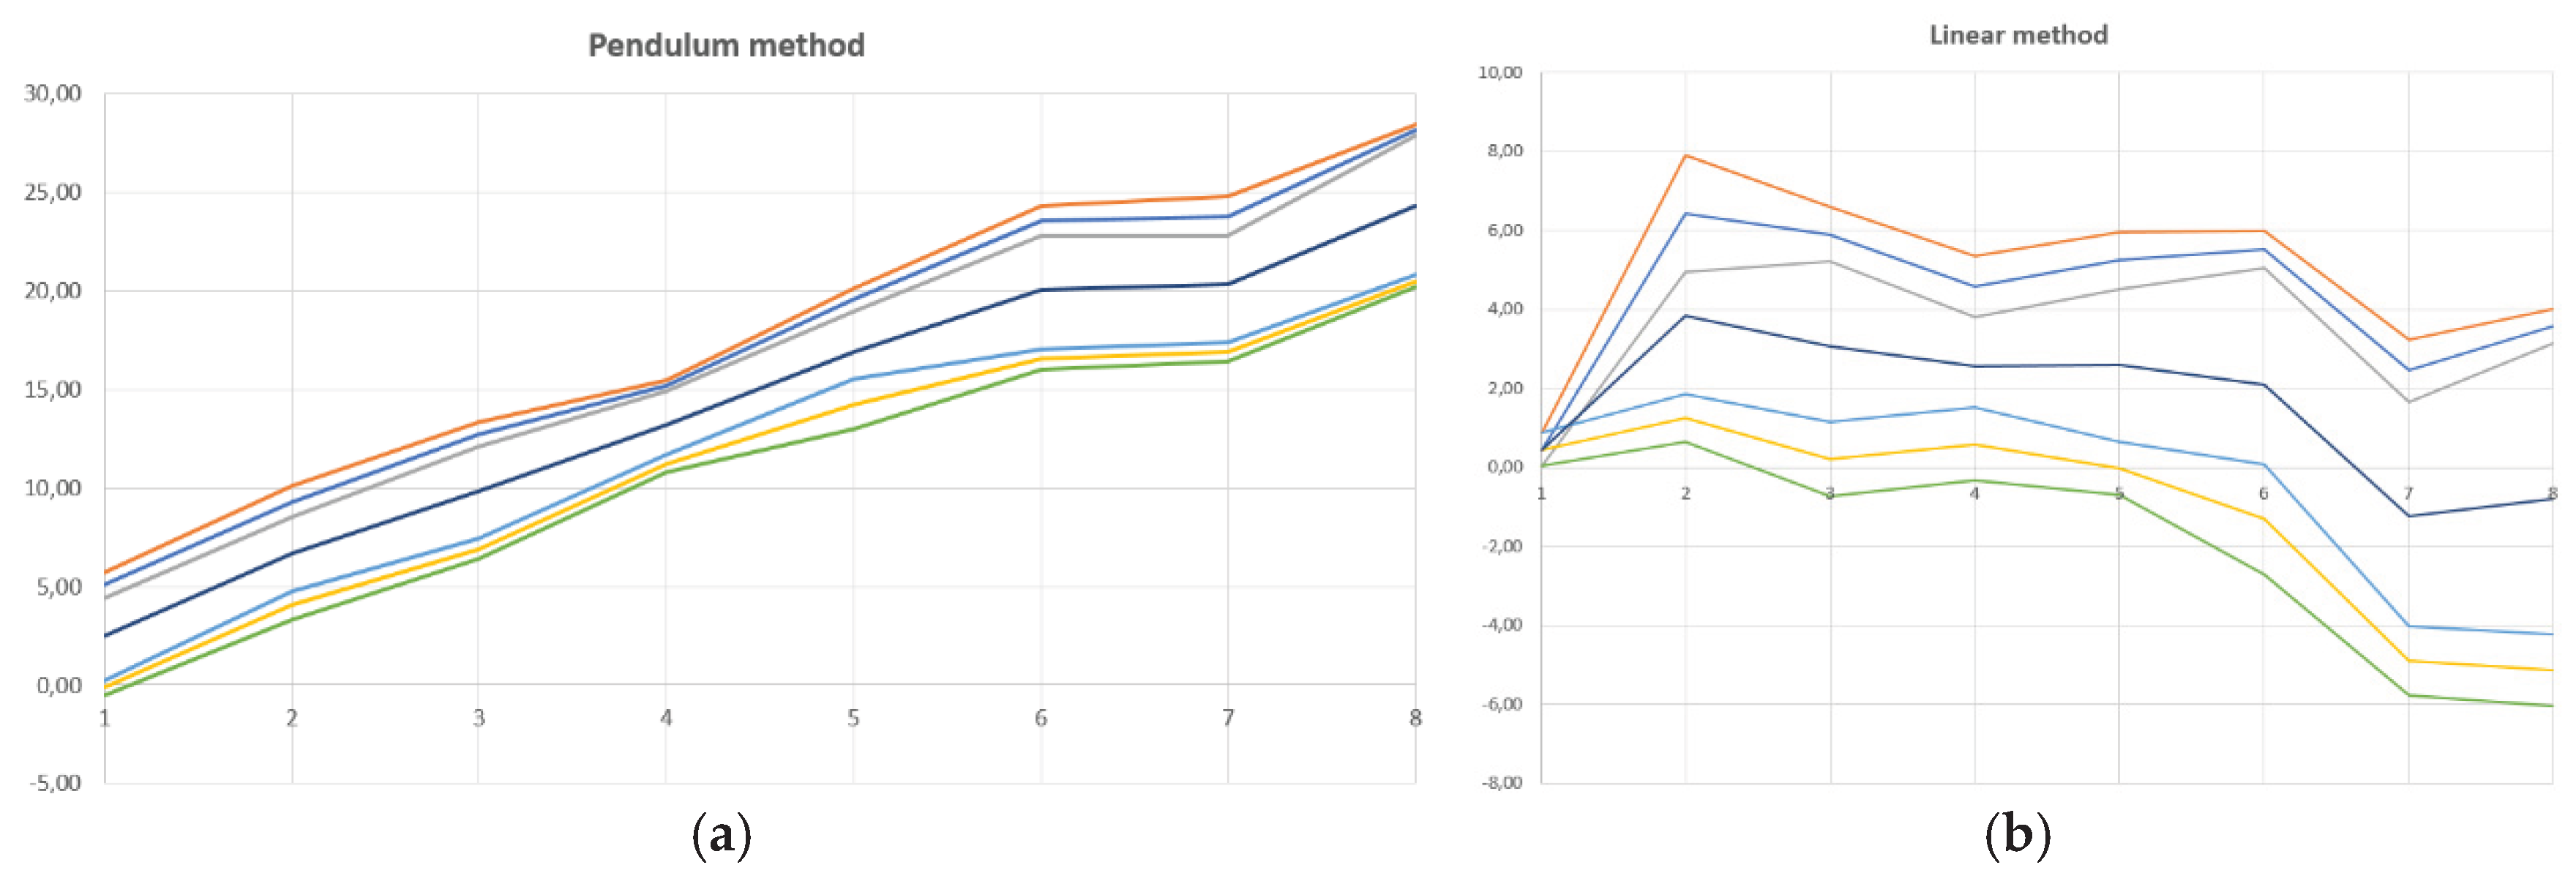
Figure 9.
Schematic representation of the applied neural network.
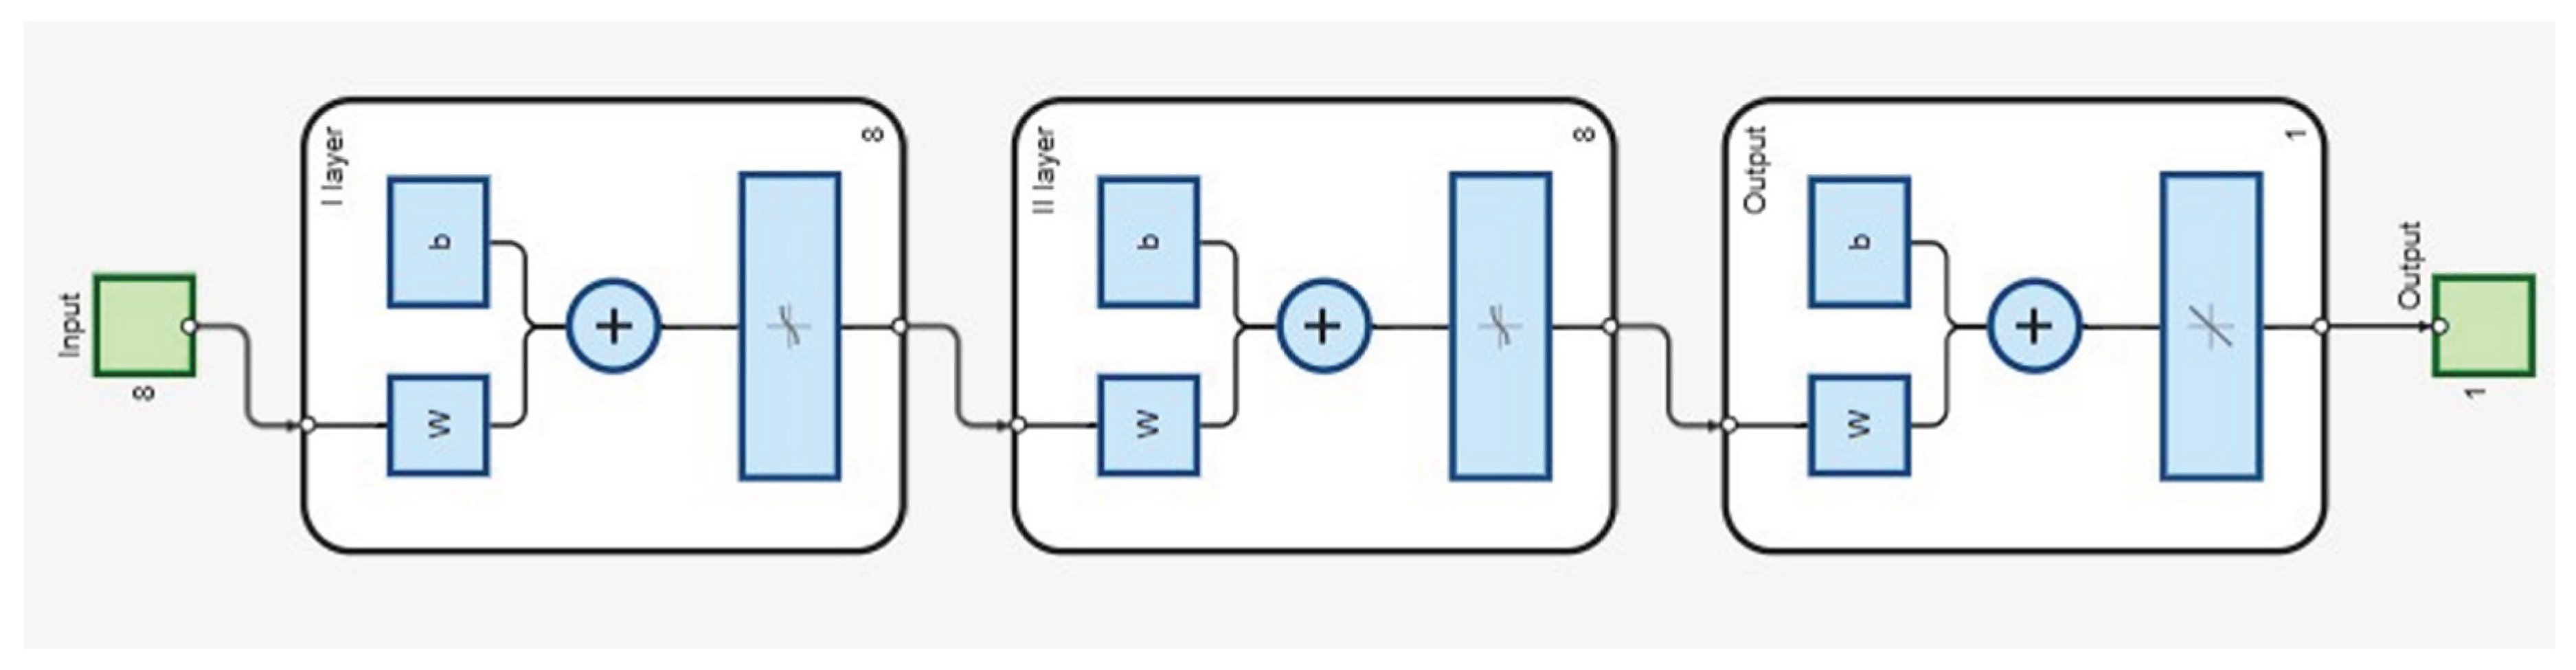
Figure 10.
Neural network validation during training.
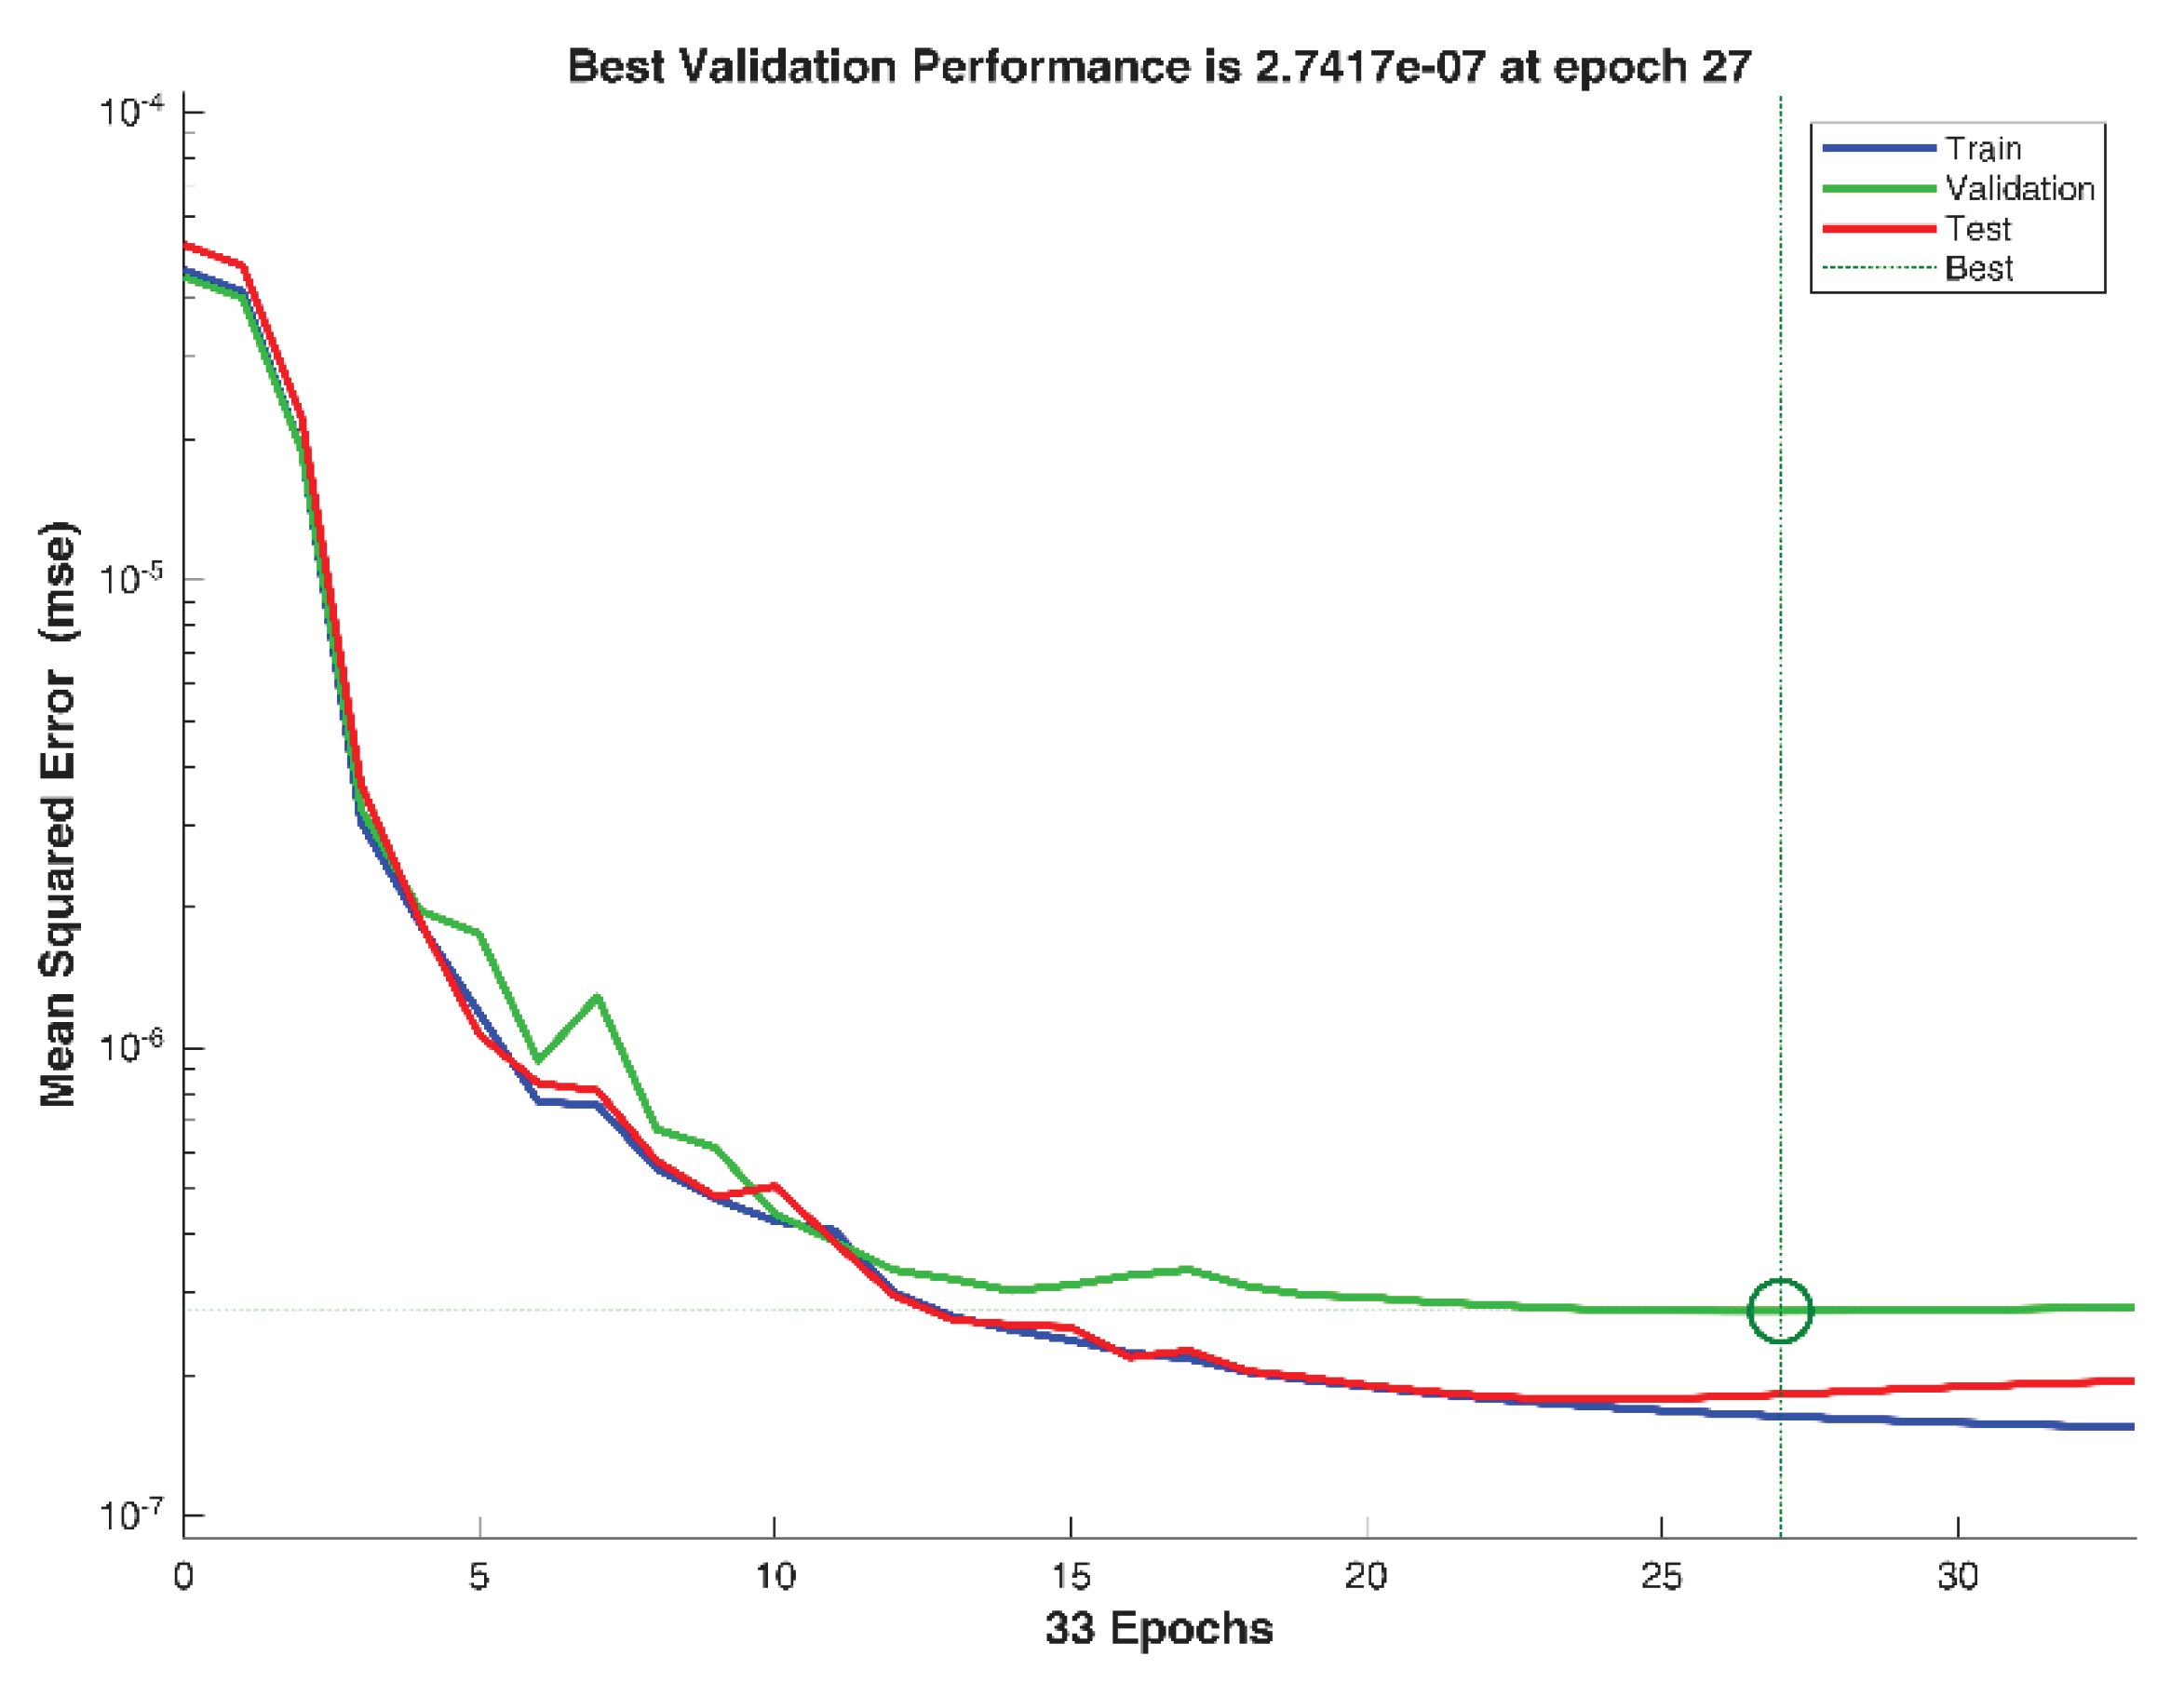
Figure 11.
Deviation of predicted backlash values from reference.
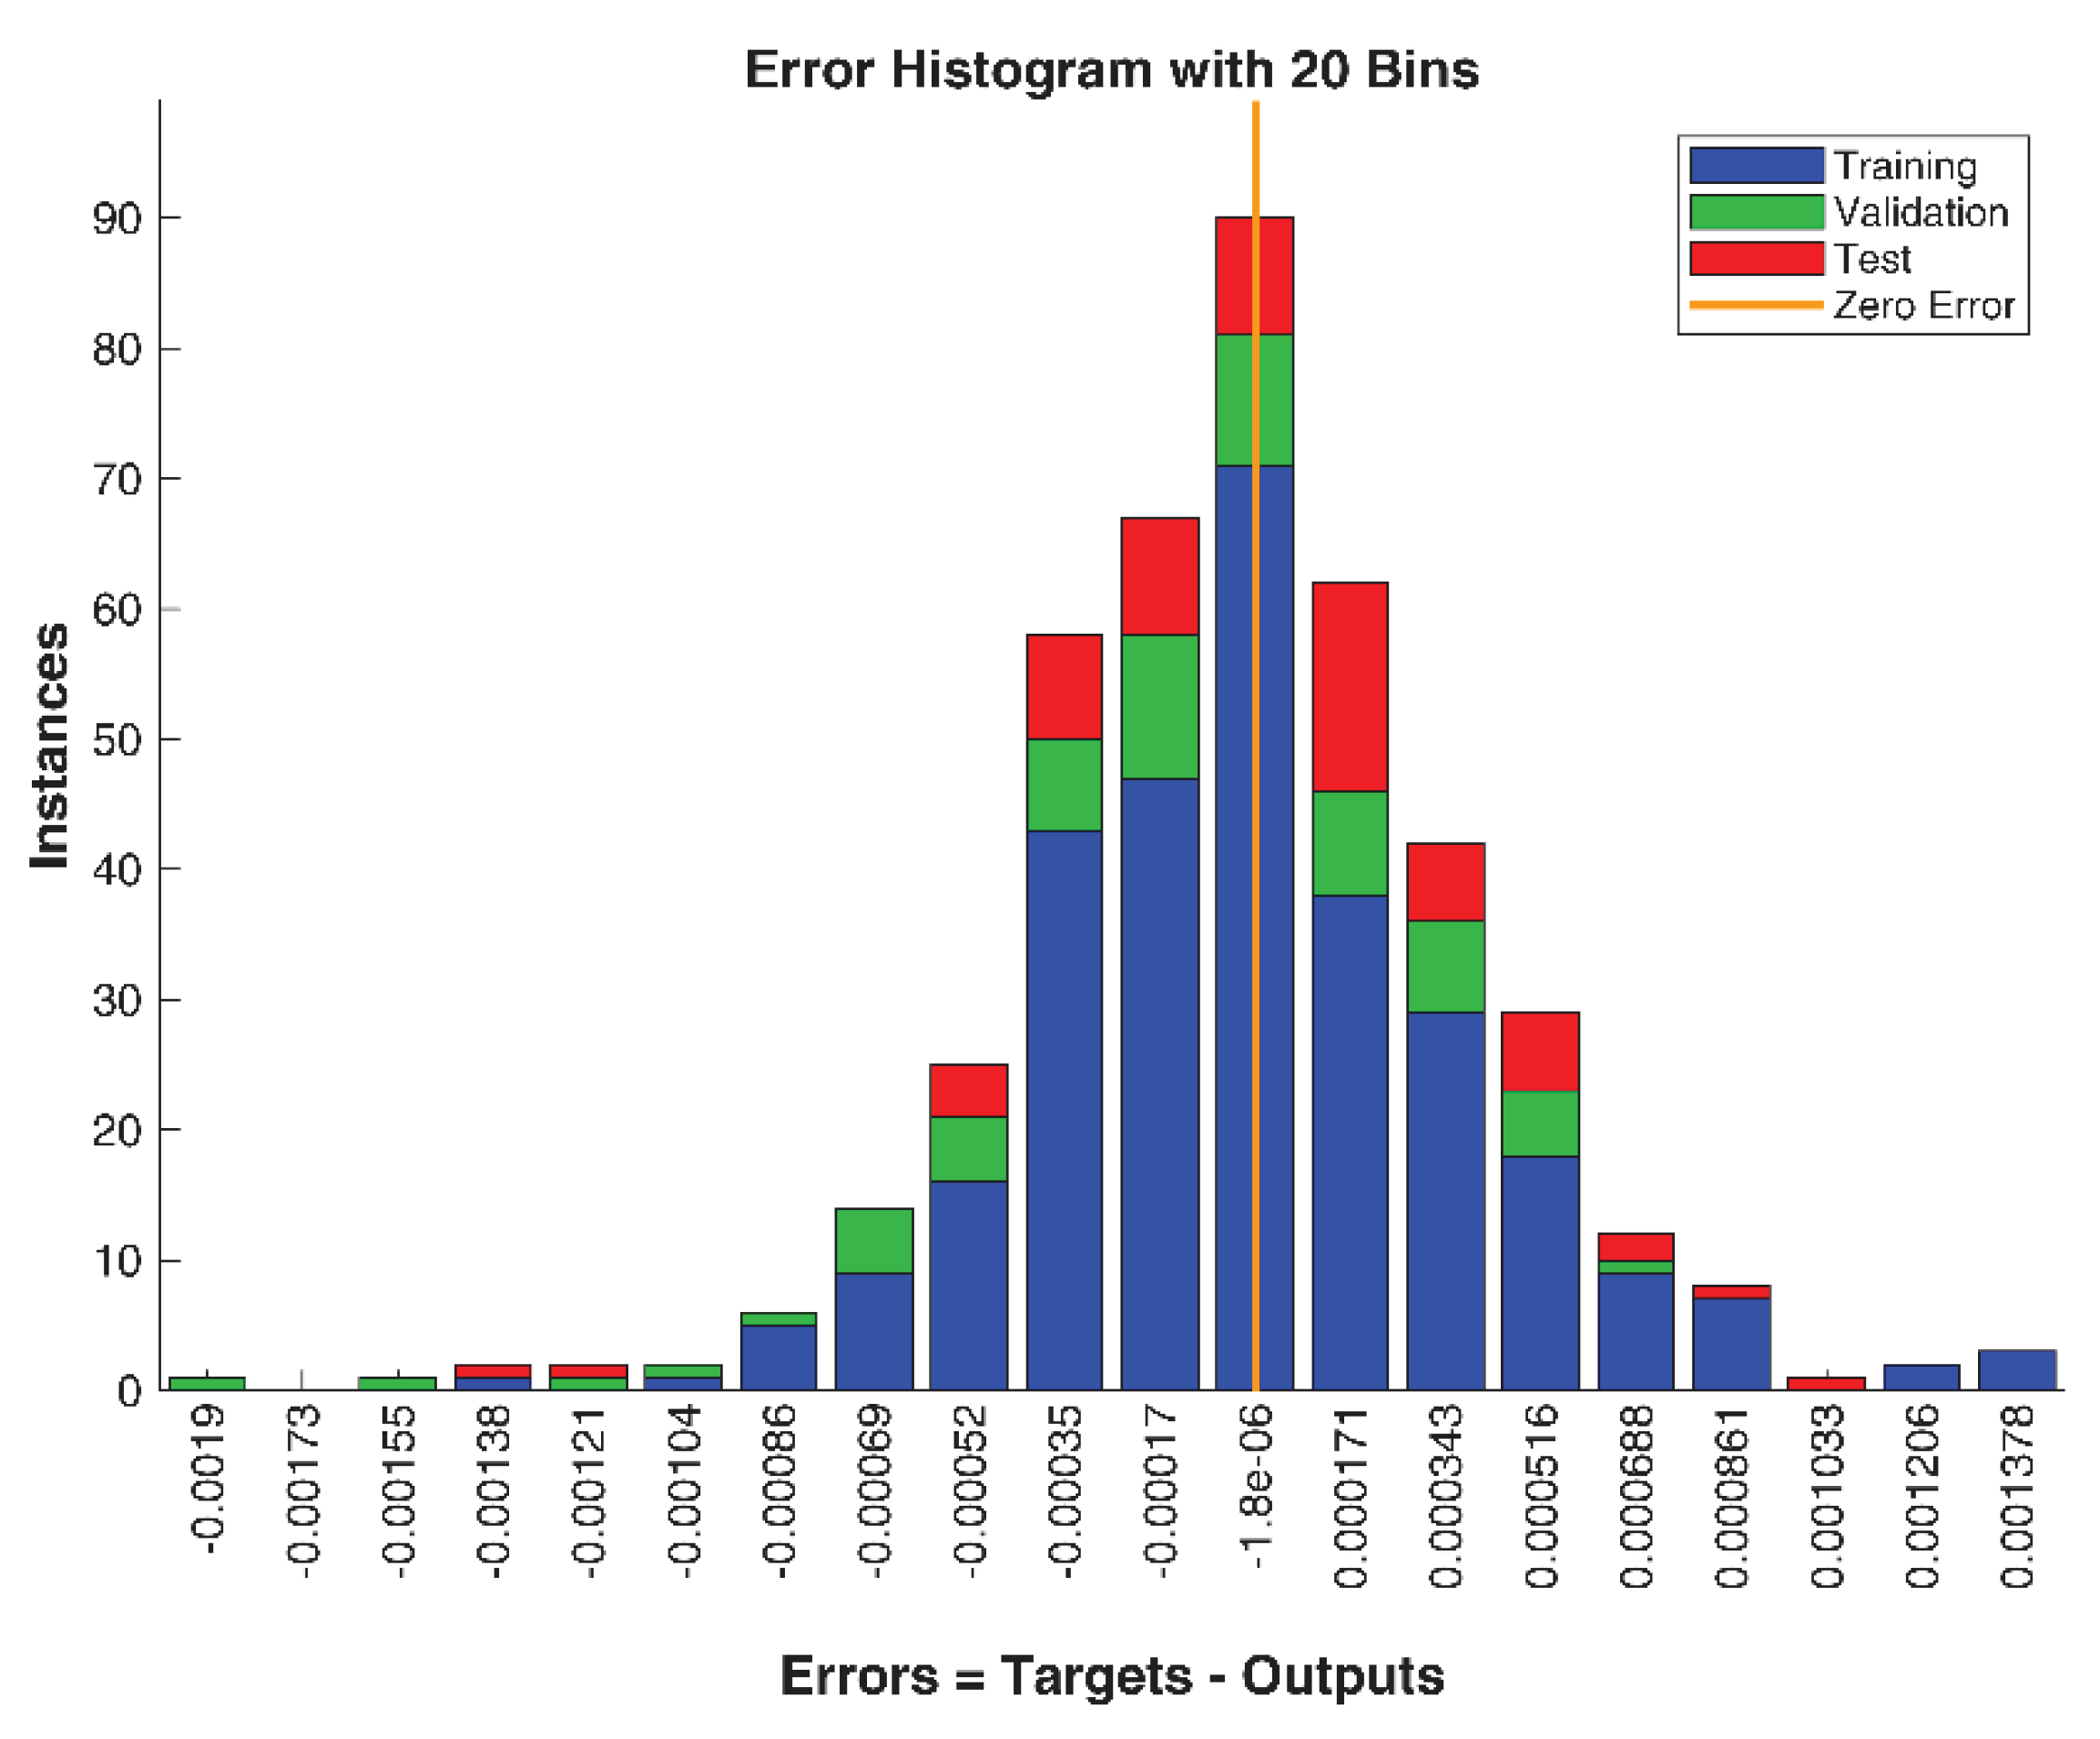
Figure 12.
Neural network test results.
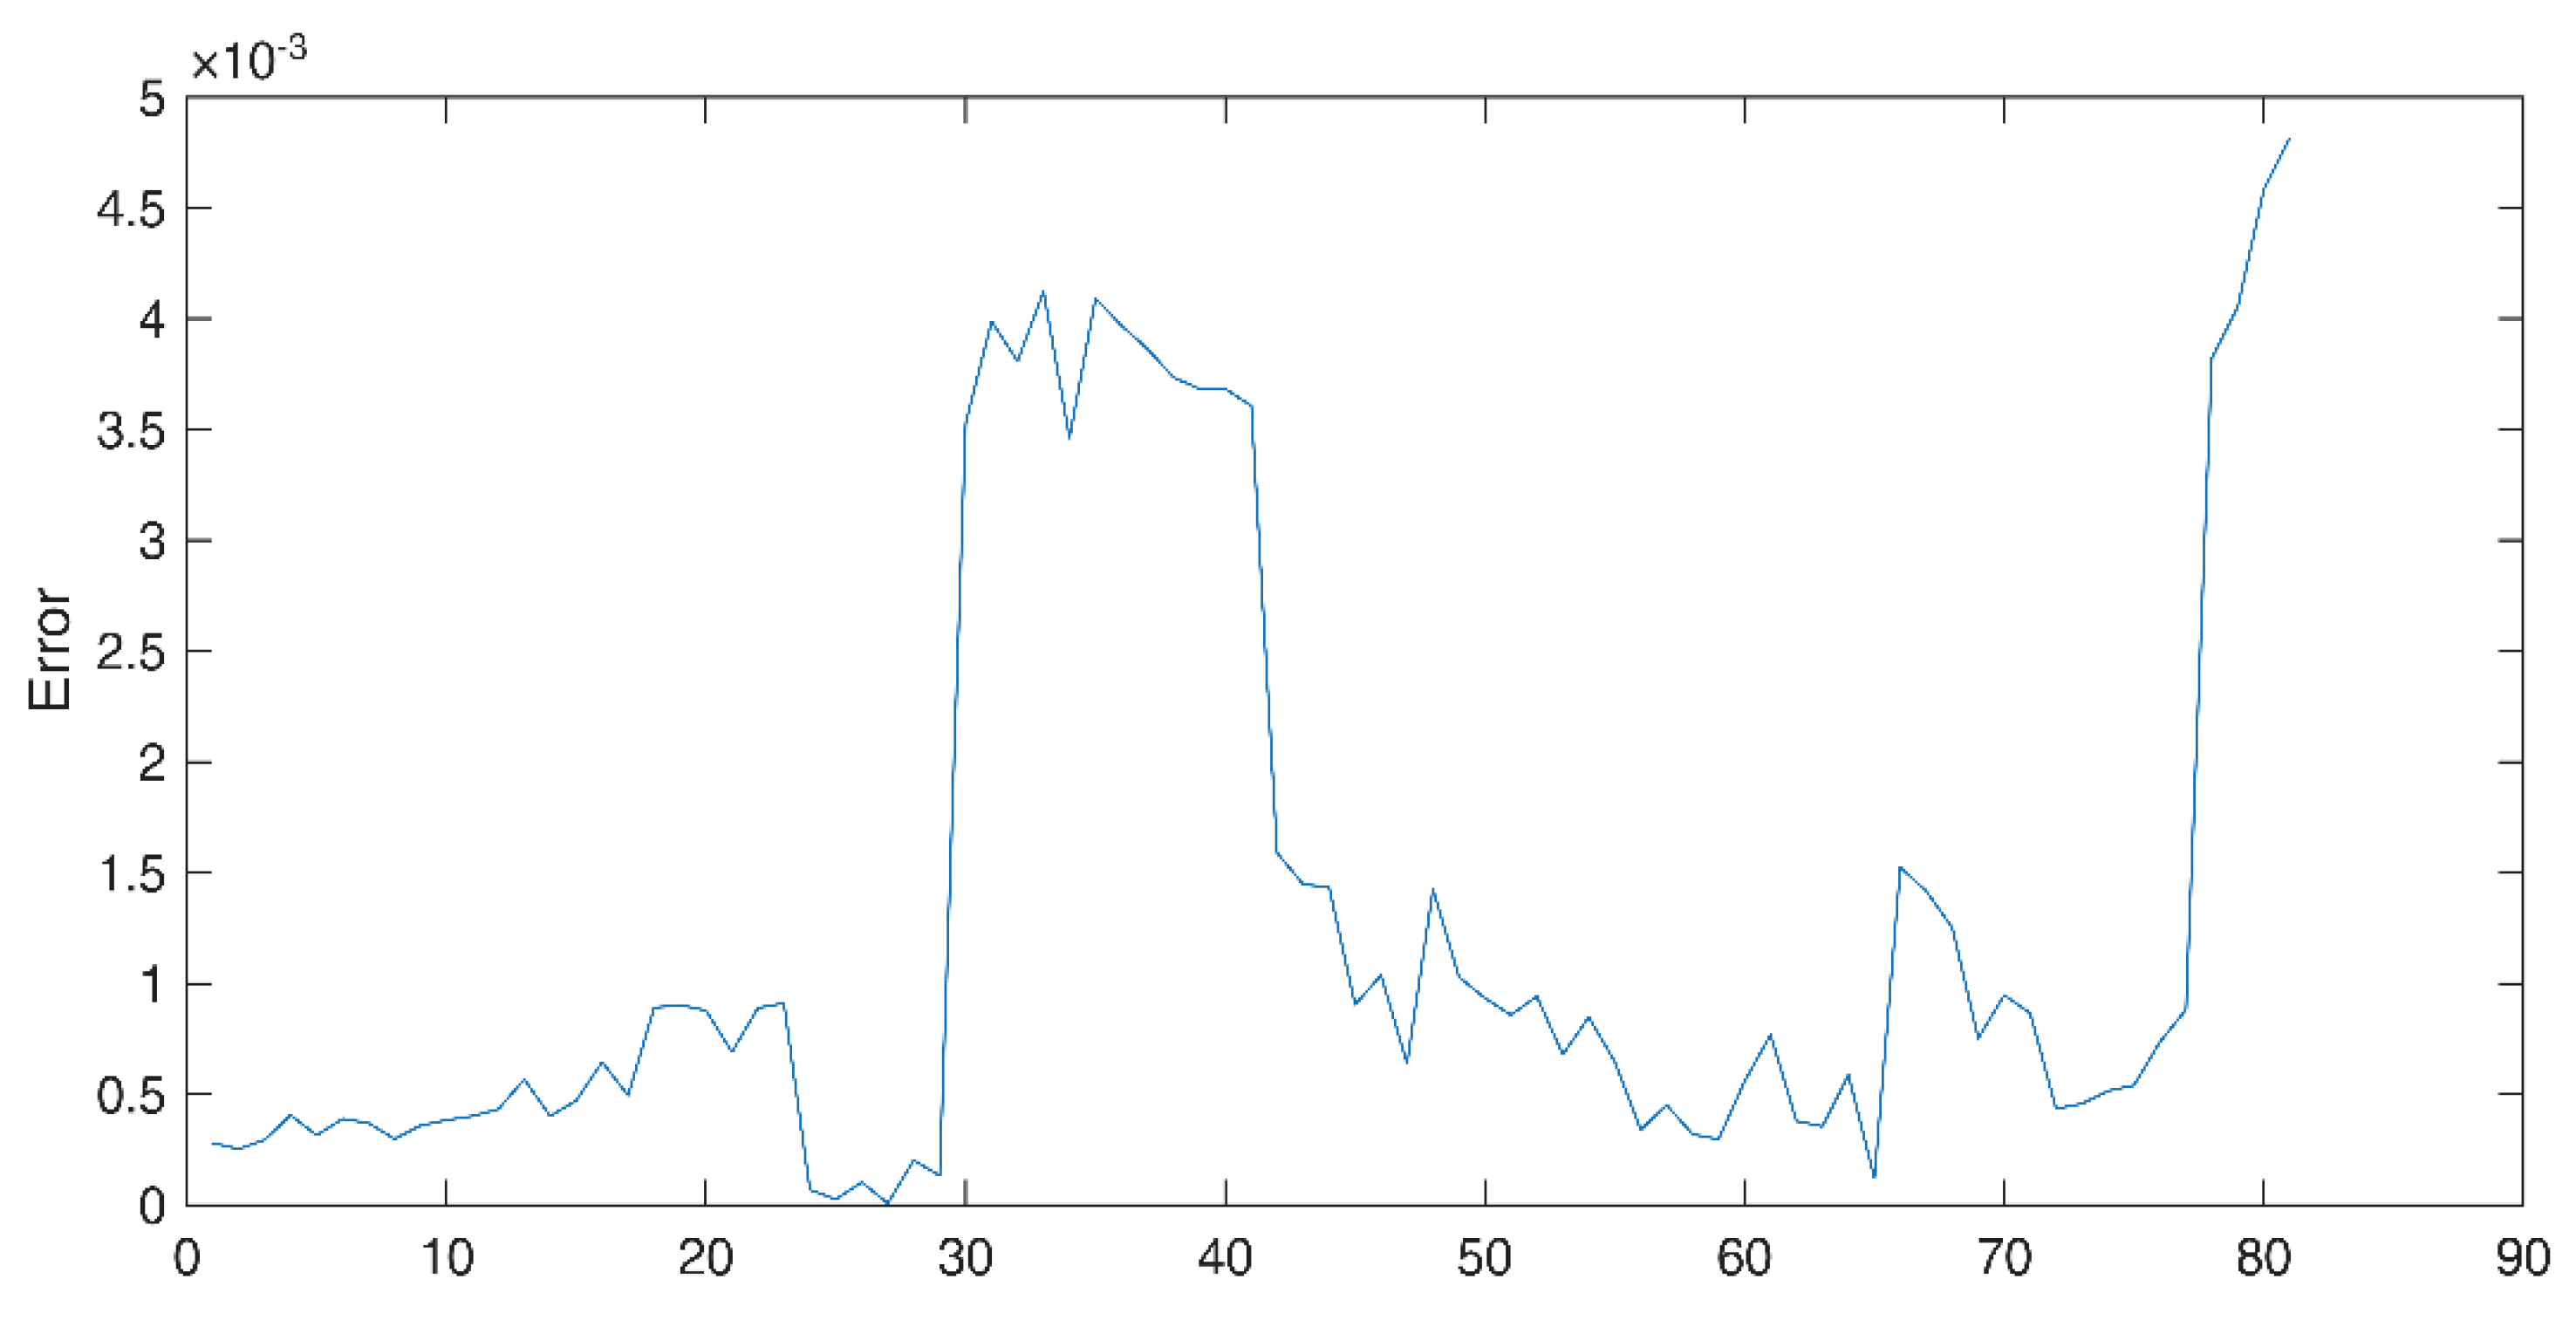
Figure 13.
Regression results for the neural network across phases.
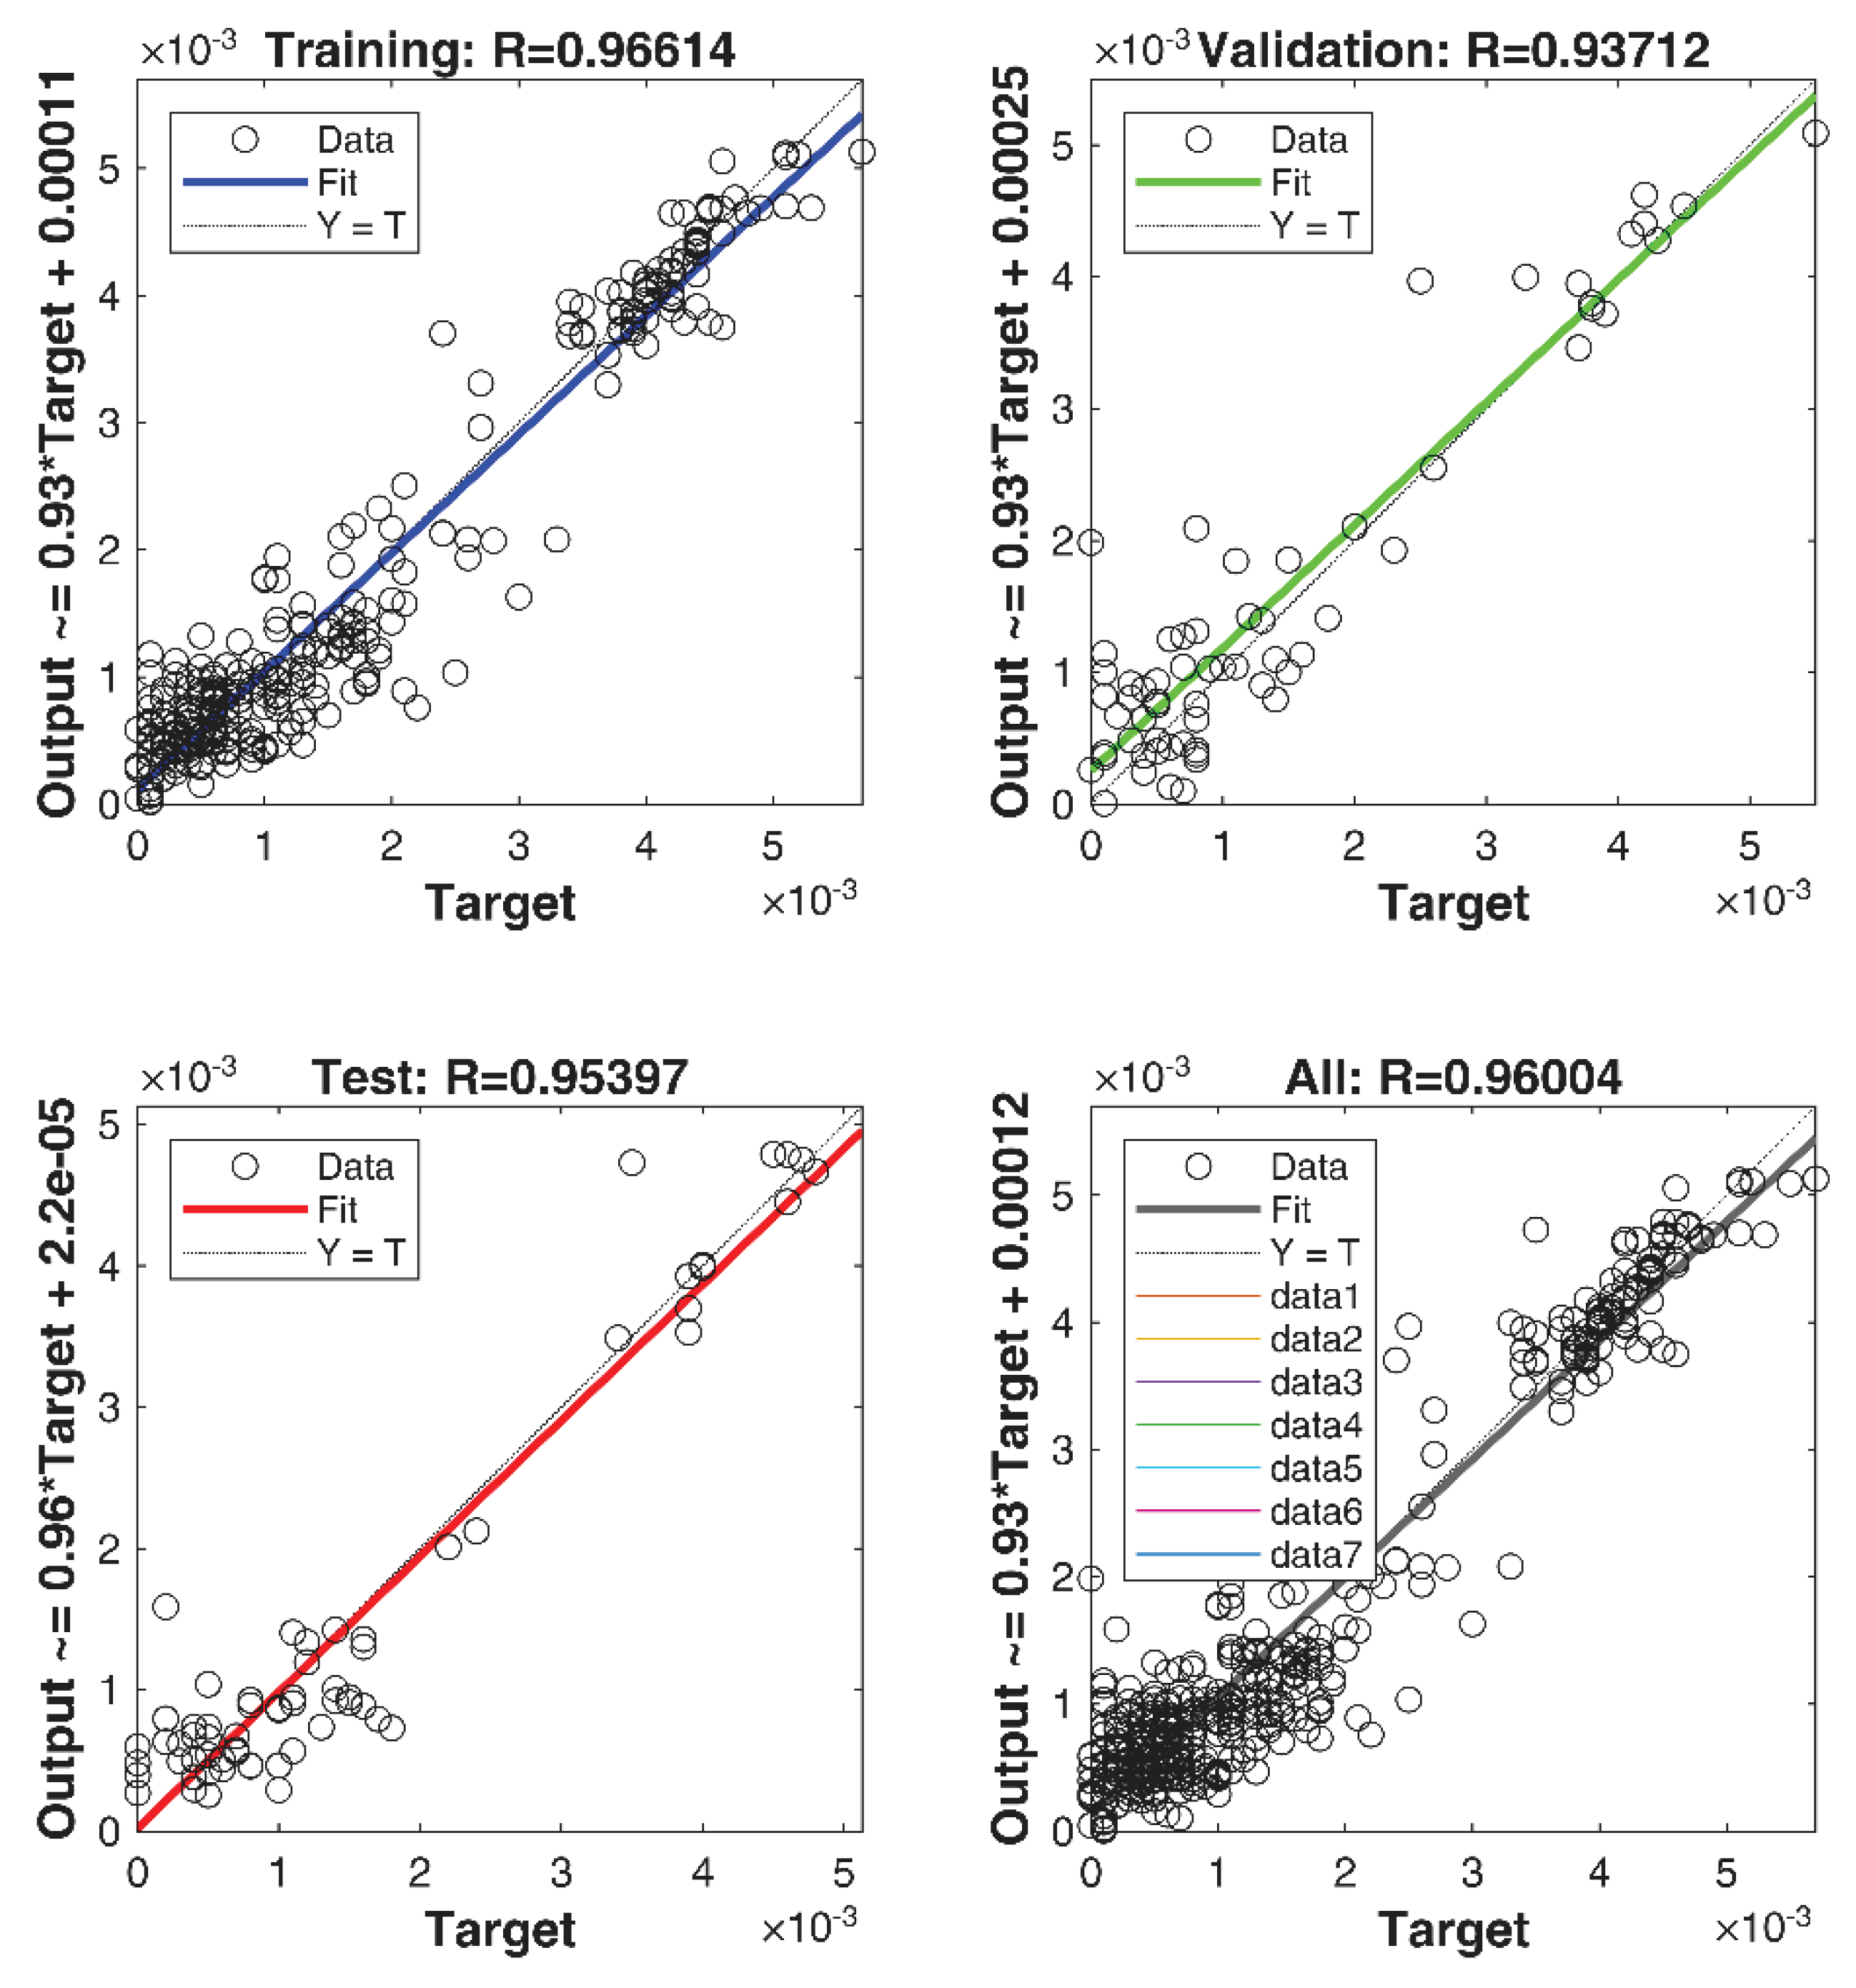
Figure 14.
Influence of input parameters based on ANOVA analysis.
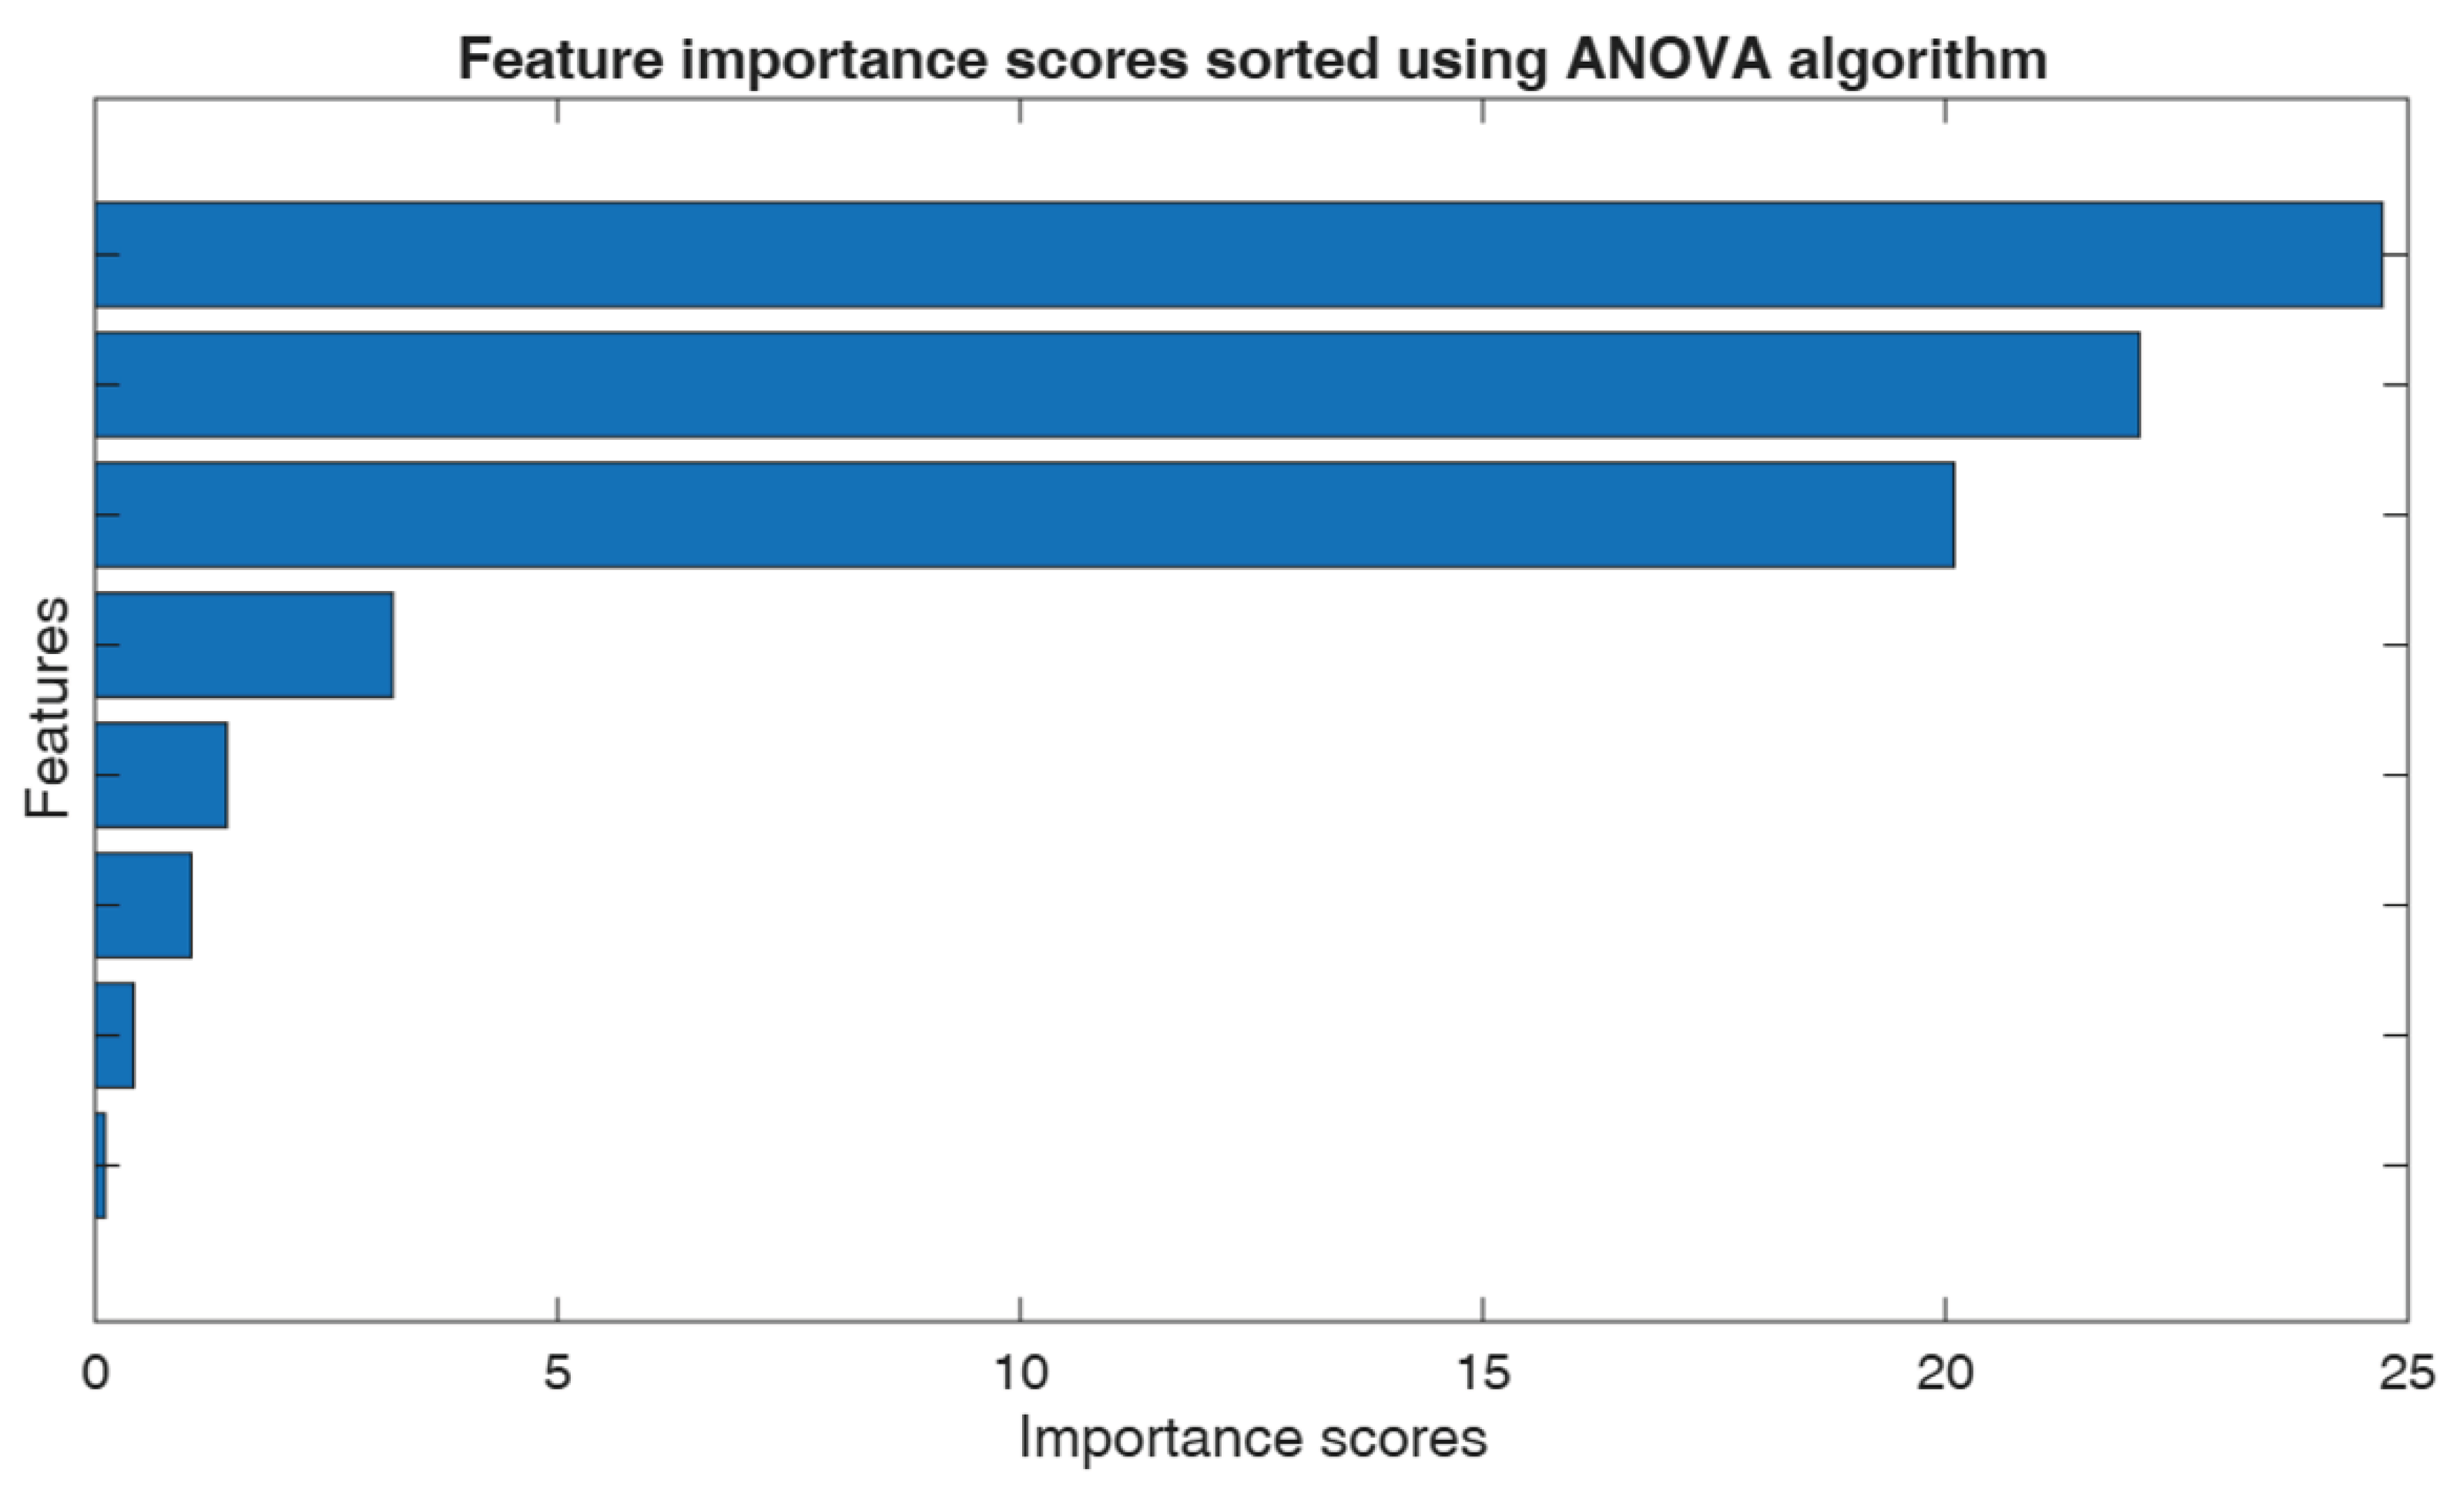

Table 1.
Measurement plan parameters.
| Number of measurement points along the axis | 8 (0–350 mm) |
|---|---|
| Feed rates | 3 (200, 500, and 1200 mm/min) |
| Motion methods | 2 (linear and pendulum) |
| Dwell time at each point | 3, 5, and 7 s |
| Measured parameters | Machine temperature, ambient temperature, atmospheric pressure, air humidity |
Table 2.
Example of the measured value database.
| No | Pos. [mm] | Dev_lin_f [mm] |
Dev_lin_r [mm] | Speed [mm/min] | T_e [°C] |
... | Dev_pend_f [mm] |
Dev_pend_r [mm] |
|---|---|---|---|---|---|---|---|---|
| 1 | 0 | -0.0001 | -0.0001 | 200 | 21.6 | … | 0.0028 | 6.96E-05 |
| 2 | 0 | -0.00064 | -0.00064 | 200 | 21.6 | … | 0.003929 | 0.000261 |
| ... | ... | ... | ... | ... | ... | ... | ... | ... |
| 180 | 250 | 249.9828 | 249.9765 | 500 | 26.9 | ... | 250.024 | 250.0181 |
| 181 | 250 | 249.9831 | 249.9767 | 500 | 26.9 | ... | 250.0243 | 250.0173 |
| ... | ... | ... | ... | ... | ... | ... | ... | ... |
| 430 | 350 | 349.9747 | 349.9668 | 1200 | 19.7 | ... | 350.0373 | 350.0292 |
| 431 | 350 | 349.9745 | 349.9664 | 1200 | 19.7 | ... | 350.0374 | 350.0297 |
Table 3.
Table of influential parameters of measurement uncertainty.
| Device - uD | X axis | units |
|---|---|---|
| L - measurement length | 360 | mm |
| a - accuracy | 3.4 | ppm |
| uaccuracy | 0.1963 | μm |
| Wavelength stability | 0.04 | ppm |
| uwavelength | 0.0023 | μm |
| udevice.estimate | 0.1986 | μm |
| r - resolution | 0.1 | μm |
| uresolution | 0.0289 | μm |
| uD | 0.2007 | μm |
| Misalignment - uM | ||
| Misalignment | 1 | mm |
| γ - angle | 0.2865 | ° |
| ΔLm - misalignment | 2.5000 | μm |
| uM | 0.7217 | μm |
| Temperature - uT | ||
| Standard uncertainty of sensor | 0.7 | °C |
| u(Θ)calculated | 0.2021 | °C |
| uM.Machine tool | 0.4850 | μm |
| uM.Device | 0 | μm |
| TM - Machine temperature | 24 | °C |
| ΔT | 4 | °C |
| u(α) | 0.0006 | μm/mm°C |
| uE.Machine tool | 0.4619 | μm |
| uE.Device | 0 | μm |
| uT | 0.6697 | μm |
| Environmental variation - uEVE | ||
| EVE - drift | 1 | μm |
| uEVE | 0.2887 | μm |
| Repeatability of the setup - uS | ||
| OABBE | 50 | mm |
| Dangle | 50 | μm/m |
| ΔLS | 3.5355 | μm |
| uS | 1.0206 | μm |
| At the measuring length - uP | ||
| uP | 1.4610 | μm |
Table 4.
Uncertainty values of the measurement parameters.
| Measurement parameters | X axis | units. |
|---|---|---|
| n - number of cycles | 5 | - |
| U(R+, R-) | 1,15 | μm |
| U(B) | 4,12 | μm |
| U(R) | 4,27 | μm |
| U(E,E+,E-) | 2,88 | μm |
| U(M) [n=10] | 2,87 | μm |
| U(A) | 3,33 | μm |
Table 5.
ANOVA scores of influencing parameters.
| Parameter | ANOVA score (–log(p)) |
|---|---|
| Position | 24.724 |
| Negative-direction deviation | 22.099 |
| Positive-direction deviation | 20.093 |
| Feed rate | 3.217 |
| Machine temperature | 1.424 |
| Ambient temperature | 1.040 |
| Atmospheric pressure | 0.417 |
| Air humidity | 0.108 |
Disclaimer/Publisher’s Note: The statements, opinions and data contained in all publications are solely those of the individual author(s) and contributor(s) and not of MDPI and/or the editor(s). MDPI and/or the editor(s) disclaim responsibility for any injury to people or property resulting from any ideas, methods, instructions or products referred to in the content. |
© 2025 by the authors. Licensee MDPI, Basel, Switzerland. This article is an open access article distributed under the terms and conditions of the Creative Commons Attribution (CC BY) license (http://creativecommons.org/licenses/by/4.0/).
Copyright: This open access article is published under a Creative Commons CC BY 4.0 license, which permit the free download, distribution, and reuse, provided that the author and preprint are cited in any reuse.


