1. Introduction
In cyclic sports such as general running and more intense short-distance sprinting, spatiotemporal parameters have long been a major focus of research, with ground contact (GC) characteristics being among the most relevant [
1,
2]. The athletic 100m sprint comprises distinct phases, in each of which GC time plays a crucial role in determining performance. [
3]. Beyond their intrinsic biomechanical significance, GC events serve as temporal reference points that enable the identification and synchronization of additional biomechanical parameters characterizing athletic performance [
1,
2,
4,
5]. A GC is hereby defined as the interval between two events: the initial contact (IC) of the foot with the ground and its’ subsequent toe-off or terminal contact (TC) [
4]. GC events are measured with a variety of systems including insole pressure sensors, embedded force platforms, consumer-grade cameras, highspeed-cameras, photoelectric bars or inertial measurement systems (IMUs) [
4]. IMUs are small, portable and wireless wearables containing accelerometers and gyroscopes [
1]. Assessing running gait in a laboratory setting often does not reflect real-world scenarios and IMUs advantageously offer a good way to assess sprinting in real-life conditions [
6,
7,
8]. However, IMUs are still used mainly indoors, on a treadmill at prescribed speeds or over small distances only [
6]. Recent studies found that the accuracy of GC time detection using IMU is affected by the speed of movement [
4]. In sprinting especially in the phase of acceleration caution is warranted as IMU GCs can show reduced validity and reliability [
9]. A review of Mendicino et al. (2025) found 37 studies about IMU GC detection in high-impact sports, 28 examined running and only 3 focused on athletic sprinting tasks [
4].
100m track sprinting can generally be divided into the start, an acceleration phase, a phase of maximum speed and a deceleration phase [
10]. Traditionally, the acceleration phase has been described as spanning approximately from zero up to 30-50m [
11]. More recent studies split the acceleration phase into an initial acceleration from 0 to 10m and an acceleration transition phase from 10 to 30m [
10,
12]. Newest research examined the acceleration on a step-specific level. The acceleration changes after the initial phase of 1
st-3
th step (initial acceleration), containing mostly step frequency adaptations, to the 5
th to 14
th-16
th step (acceleration transition), a phase of focused step length increase, to the step 16
th and ongoing (maximum speed), when the trunk gets into his most upright position [
13,
14,
15,
16,
17]. The acceleration is generally the phase were kinematic stride parameters change most dynamically in a sprint which, not only but also, influences GCs [
17]. In the 1
st step the GC accounts for 77.4% of the stance which decreases until the 8
th step were flight time and GC time are balanced [
17].
To obtain GCs from IMUs Mendicino et al. (2025) found 71 different detection algorithms in their literature review from which 67 relied on heuristic or rule-based algorithms and 4 on machine or deep learning approaches [
4]. Heuristic and rule-based algorithms claim that different maxima and minima or thresholds, sometimes within certain time-windows, in IMU data represent the IC and TC [
18]. Caution must be taken with the accuracy of heuristic or rule-based algorithms as the minima, maxima, thresholds and time-windows may fluctuate due to athlete specific anthropometry, movement technique [
19], the segment of IMU attachment and at varying and changing speed levels [
4]. Therefore, the claim that heuristic models exactly represent IC and TC may not be true for all steps which can be advantageous for machine or deep learning approaches where the GC events can be trained directly with the validation measurement system.
Applying heuristic algorithms Blauberger et al. (2021) found mean absolute GC time deviations of 5.46 ± 4.55 ms in elite sprinters up to 100m runs [
20]. The algorithm failed to detect 6.47% of the GC in the initial acceleration phase (first five steps) while performing better in other running phases (0.56%) except the last five steps (13.33%). Another study of maximum accelerated sprinting (0-10m) found mean deviations of -71 ± 70.3 ms limits of agreement (LOA) with a 93% GC detection rate [
21]. Comparing IMUs against force plates in 50m maximum accelerated sprinting Van den Tillaar et al. observed significant differences with a mean bias of 3ms (moderate correlation) and 4ms (trivial correlation) using IMUs sampling at 1000Hz and 240Hz, while no information about LOA or detection failure rate was given [
22]. Purcell et al. (2006) reported -8 ± 17.64 ms for the first step, -2 ± 9.8 ms for the third and 0 ± 1.96 ms for the fifth step in maximum sprints [
23]. In a study about the maximum velocity phase the mean differences were -2.5 ± 4.8 ms (LOA: -11.8 to 6.8ms) at an algorithm detection rate of 95,7% [
19] or within mean differences of ± 5 ms and LOA approximately at 15-30ms for elite and amateur sprinters [
24]. Machine or deep learning approaches for GC detection detected 97% of GC contacts during different gait tasks without quality assessment using a Beta Process Auto Regressive Hidden Markov Model [
25]. A bidirectional long short-term memory network achieved 5 ± 42 ms (mean differences and LOA) in comparison with GC times of force sensing insoles at running speeds ranging from 2 to 6 m/s while the IC and TC detection had higher variability at increased speeds [
26]. Machine learning algorithms have not yet been comprehensively validated for sprint-specific analyses although demonstrating comparable accuracy relative to heuristic-based approaches.
Deep learning architectures, such as convolutional neural networks (CNNs) and long short-term memory networks (LSTM), are particularly well-suited for high-dimensional or time-series data and have demonstrated promising performance in time-series classification (TSC) tasks [
27]. CNNs can be defined as both convolution based and also as a class of Deep Learning based algorithms for TSC when the deep learning architecture contains convolutions [
28]. These CNNs have already been used in TSC for EMG pattern recognition [
29], snowboard halfpipe jump detection [
30] or lower limb joint kinematics estimation in gait [
31,
32]. One-dimensional CNNs (1D-CNN) are the most prominent and suitable for extracting temporal information [
33]. Different CNN architectures exist, e.g. U-Net, Fully Convolutional Network, ResNet or InceptionTime [
30,
34]. Although the development in this area is fast, inception-based models like InceptionTime architectures are widely used and have been shown to be superior performing for many TSC tasks [
28,
34,
35].
The purpose of this study is to evaluate the potential of a deep learning 1D-CNN for detecting GC events (IC, TC) and GC times, with a specific focus on the acceleration phase of the athletic sprint, which has not yet been examined using deep learning methods.
2. Materials and Methods
2.1. Subjects
Twelve sprint-trained athletes (19.7 ± 3.7 yrs; 1.78 ± 0.11 m; 68.6 ± 9.5 kg; 6 female, 6 male; 100m personal bests of 11.30 ± 0.42 s (male) and 12.19 ± 0.48 s (female)) completed three 60 m sprints off the starting block interspersed with 20-minute rest intervals. Athletes’ velocity development was measured with a 1080sprint 2 (1080 Motion Inc, Austin, USA) with a 1.5kg minimum resistance attached at the hip of the athlete, however, the velocity is not used in this study. The first 15m of the 60m sprints were analyzed which equals the phase of highest acceleration [
36] while capturing the initial acceleration phase and parts of the acceleration transition phase [
10,
12,
13,
14,
17]. The tests were integrated into the athletes’ regular training schedule, with their coach supervising pre-run preparations. Informed consent was obtained from all athletes prior to their participation. The study was conducted in accordance with the Declaration of Helsinki for which procedures were approved by the Otto-von-Guericke University Ethics Committee (Reference number: 27/25).
2.2. Data Collection and Preparation
6DOF gyroscope and accelerometer data were collected from two IMUs (Vicon Motion Systems Ltd., Oxford, UK) at 1125Hz. IMUs were attached laterally to the left and right shank respectively using latex straps. Resultant acceleration (aRES) and angular velocity (ωRES) data were computed from the raw tri-axial IMU (x, y, z) data and subsequently resampled to 250 Hz. Three synchronized high-speed cameras (Baumer Holding AG, Frauenfeld, Suisse) positioned at 0, 5 and 10m captured video footage at 250fps from a 90° sagittal perspective.
The IMU dataset consisted of two sensors per athlete yielding a total of 70 athlete–run–leg combinations. Data from run 3 of athlete 1 were excluded due to a sensor data download failure. IMU data were trimmed to the running phase, from block release to after the final contact, based on holistic known IMU ground contact patterns. In the 250 fps high-speed videos the GCs, defined as the first and last frames showing foot contact with the ground, were identified for each run. The video GCs were converted into a binary time series ∈ {0, 1}, where 1 indicated ground contact and 0 the flight phase. For IMU–video synchronization, the maximum vertical heel drop was defined as the moment immediately following touchdown when the heel exhibited its greatest downward displacement between consecutive video frames. This event was assumed to correspond to a peak in aRES recorded by the shank-mounted IMU. All identified GC events were subsequently cross-correlated between IMU and video time points to ensure precise temporal alignment across the entire sprint trial, even in the presence of minor measurement noise or labeling inaccuracies in individual GC events. The dataset of synchronized binary video GCs and IMU data per run was used for the training of the 1D CNN.
2.3.1. D Deep Convolutional Neural Network
In general, 1D-CNNs were shown to be successful in IMU event detection [
18,
29,
30]. In a comparison of different 1D CNN architectures the InceptionTime architecture consistently showed superior performance for TSC [
28,
37].
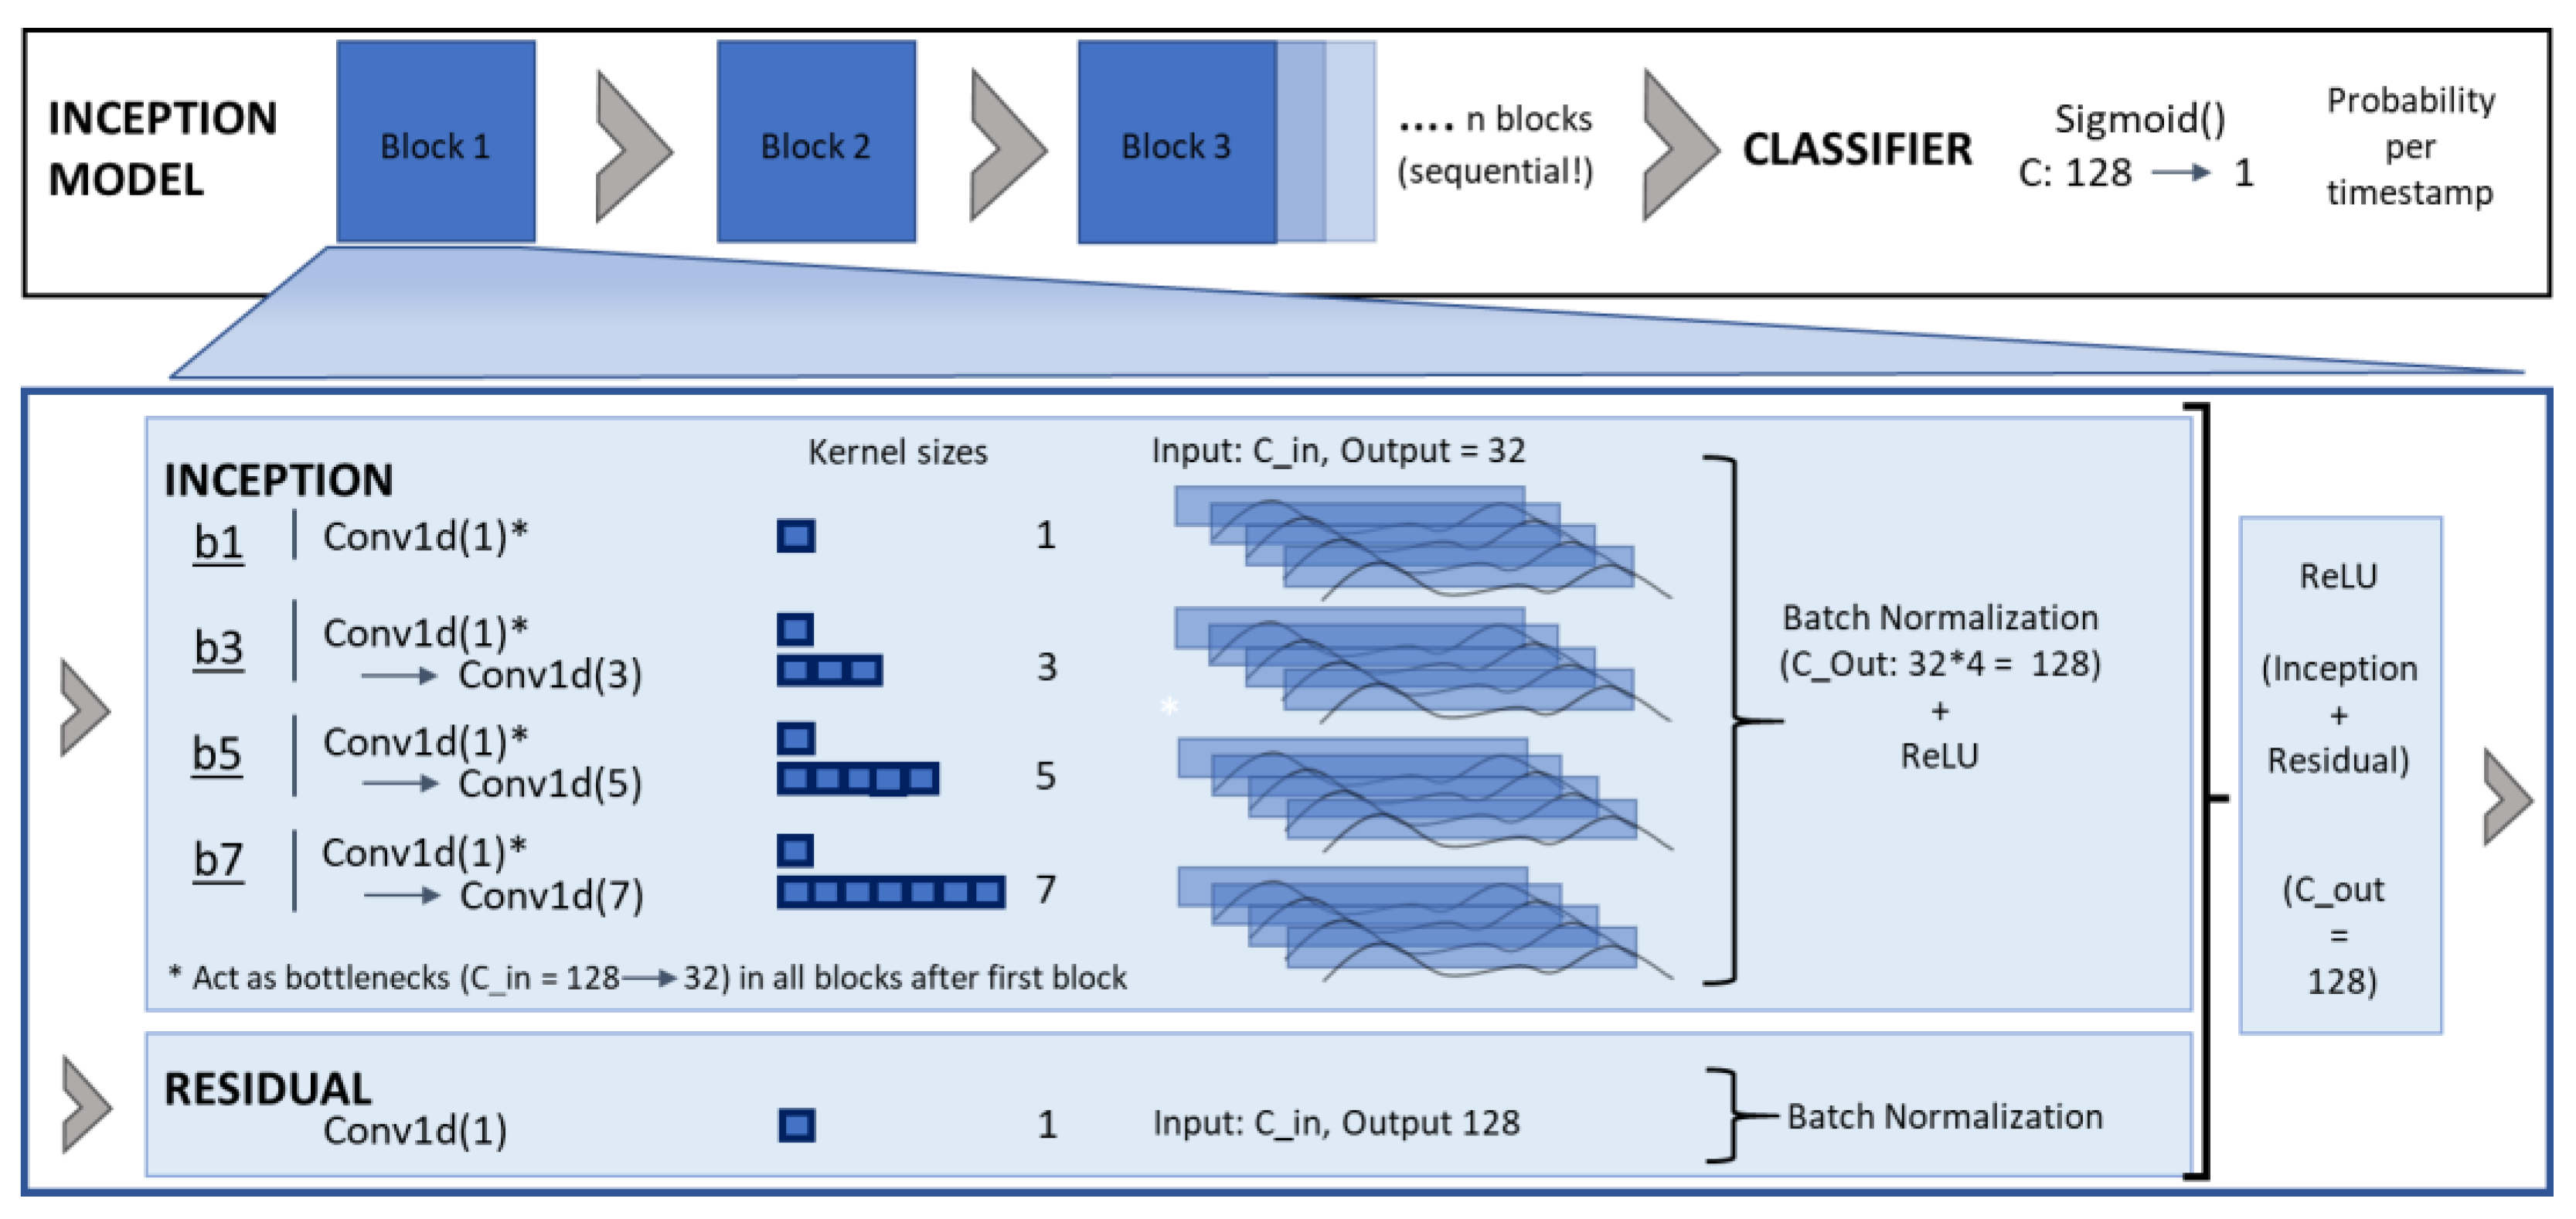
The InceptionTime model is a deep neural network for TSC, built from three stacked inception blocks each containing three inception modules
I(x) and, for stable calculation a residual block,
R(x) [
27]. The concept of these inception blocks was used for the proposed model. It was built with one inception module
I(x) and its corresponding residual
R(x) per block (
Figure 1) with a number of several subsequent blocks in the model. Resulting in the formulas for each block output:
In the InceptionTime each inception module
I(x) consists of three parallel convolutional branches that capture temporal features at different receptive field sizes (kernel) [
27]. To expand this feature in the proposed model four kernels with sizes k ∈ {
1, 3, 5, 7} were applied to improve capture of both short- and long-term characteristics in the IMU data (4).
In the first block, the model receives two input channels
aRES and ω
RES (C=2). Each branch expands this to 32 channels [
27] to have a more detailed resolution for their explicit convolutional kernels to detect underlying patterns (
Figure 1). The outputs of the four parallel branches are concatenated, yielding 128 channels per time step. To maintain dimensional consistency for the residual connection, the block input is projected via a 1×1 convolution (4)
[
27] followed by batch normalization
(Figure 1). This projected residual
R(x), is then summed up with the output of the inception module
I(x). The final block output is obtained via a ReLU activation (3). In subsequent blocks, the
convolutions (4, 5) within each branch act as bottlenecks which comprises the input from the dimension of 128 to 32 for reduced computational effort and more dense pattern extraction, before the branch-specific temporal convolutions (
Figure 1) [
27].
After all subsequent inception blocks, a classifier is applied to generate the output probabilities at each individual timestep (
Figure 1). All convolutional operations are one-dimensional and applied along the temporal axis, such that each time step is transformed independently across channels while preserving the sequence length. The lightweight classifier consists of a pointwise 1×1 convolution
followed by a sigmoid activation (6). It maps the 128 per timestep channel feature representation of the last inception block to a single probability per timestep.
2.4. Dataset
The collected synchronized binary video GC – IMU dataset per run was used for model training. Video GCs served as ground-truth (GT) labels for ground contact. Input features were the synchronized a
RES and ω
RES IMU channels (C = 2). CNNs require fixed-length inputs but the complete runs have different time-length data [
37]. While different approaches like padding, truncation or normalizing exist to solve the time-length issue they all compromise the original data [
37]. Gorges et al. (2024) showed that slicing the data in windows is a successful approach to avoid fixed-length problems while they also state that the window size should be hyperparameter tuned regarding the classification task of the model [
30]. Therefore, features and labels were split into fixed-length windows that overlapped with a certain stride and values for these parameters were defined during hyperparameter training. The i-th window is:
Incomplete windows at the end of runs (< window size T) were discarded to ensure fixed-length input segments for model training. The features were min–max scaled to the range [−1.5, 1.5] for each run to ensure comparability across runs, steps, leg sides, and athletes due to large variations in touchdown peak magnitudes. The final dataset is:
with N representing the total number of windows across all athletes, runs and leg sides. For evaluation, the model predicted probabilities were reassembled into the original continuous time series by averaging values across overlapping window strides.
2.5. Dataset split
In biomechanics, model performance needs to be assessed not only in controlled laboratory settings but also for real-life scenarios, making a split into training, validation, and test datasets essential [
38]. The dataset was partitioned on an athlete-specific basis. Data from athletes 2–11 were used for training and validation, while athletes 1 and 12 were reserved exclusively as unseen test subjects. Within the training–validation group, runs 1 and 2 were assigned to training (TRAIN) and run 3 to validation (VAL). The test dataset (TEST) contained the two available runs of athlete 1 and all three runs of athlete 12. This design enabled the evaluation of model generalization to both familiar (VAL) and unseen (TEST) athlete-specific movement patterns in ground contact detection from IMU signals.
2.6. Model Training and Hyperparameter Tuning
In total the TRAIN consisted of 40 IMU data streams (10 athletes × 2 runs × 2 legs) of synchronized aRES and ωRES signals, each paired with their respective ground-truth labels. Hyperparameter tuning was performed using Weights & Biases (W&B, wandb.ai) to optimize model performance. The tuned parameters included window size ∈ [25, 50, 75, 100, 150, 200], stride ∈ [5,10,15,20,25,30], number of subsequent inception blocks ∈ [6,9,12,15,18,21], and learning rate ∈ [0.01, 0.001, 0.0001]. Combinations with stride ≥ window size were skipped. The tuning objective was to minimize the mean Hausdorff distance for the VAL. Training was performed using the Adam optimizer for a maximum of 30 epochs and a batch size of 50. Early stopping was applied based on the validation binary cross-entropy loss, terminating training if the loss did not improve for five consecutive epochs to avoid overfitting.
2.7. Evaluation and Metrics
Model performance was evaluated on a VAL (10 athletes × 2 legs = 20 datastreams) and the independent TEST set (10 datastreams) predictions. Model probability outputs were binarized (PRED) using a threshold of 0.5, with probabilities below 0.5 classified as no ground contact = 0 and those equal to or above 0.5 as ground contact = 1. Ground contact detection was assessed in two aspects. First, transitions between flight and contact were evaluated. These were calculated as turning points from 0→1 and 1→0 in the binary GT or PRED. The mean and median Hausdorff distances (in frames) were computed between predicted and true transitions (= IC or TC events). Second, GC times were defined as continuous periods where the signal equaled 1 for GT and PRED respectively (= duration from IC until TC). Precision, recall and the Rand Index were computed for each datastream, with precision and recall based on GCs as event and the Rand Index representing agreement in GC time (in frames).
Metrics were computed before and after a post-processing step. As noted by Gorges et al. [
30], 1D CNN outputs for TSC can occasionally produce very short false prediction spikes. These may mislead Hausdorff metrics and resolve in incorrect interpretations. To address this, predicted ground contacts shorter than 12 frames (48 ms), which are approximately half of the shortest elite 100m sprinting GC times (> 90 ms) [
20] and therefore cannot represent an actual athlete foot touchdown, were converted to non-predictions (binary = 0). Additionally, incomplete window predictions at the start or end of each data stream were reset to 0 to ensure clean predictions across the run.
2.8. Statistics
Following model evaluation, the deep learning approach for ground contact detection was statistically benchmarked against the video-based ground truth, using only the postprocessed model predictions. Stepwise mean ground contact times for GT and PRED were reported using descriptive statistics (mean ± SD). Normality (Shapiro–Wilk) and homogeneity (Levene’s) tests indicated non-normal distributions for VAL GT, VAL PRED, and TEST GT, leading to the use of non-parametric tests. Differences were examined using the Wilcoxon signed-rank test (
p < 0.05), with effect sizes (ES) interpreted as <0.2 trivial, 0.2–0.49 small, 0.5–0.79 medium, and ≥0.8 large [
39]. Bland–Altman plots were constructed to examine systematic and proportional bias for GC time, with heteroscedasticity defined as
r² > 0.1; mean differences + LOA and mean absolute deviations ± SD were reported [
40]. IC and TC event detection accuracy in GT and PRED was examined in boxplots. Concurrent GC time validity was assessed using Spearman’s correlation (ρ <0.1 trivial, 0.1–0.3 small, 0.3–0.5 moderate, 0.5–0.7 large, 0.7–0.9 very large, >0.9 almost perfect) [
41]. Finally, linear regression plots supported by mean absolute percentage error (MAPE) and root mean square error (RMSE) parameters illustrate the linear relationship between the model GC times PRED and the GT measurements. All statistical analyses were performed in Python (SciPy Stats library).
3. Results
The results of the 1D CNN model, its’ performance metrics and the statistical evaluation of the model as a tool for defining GCs in sprint acceleration are presented here.
3.1. Hyperparameter Tuning
Hyperparameter optimization revealed that the model achieved optimal predictive performance when configured with 18 inception blocks, using input windows of 100 data points and a stride of 15 (
Table 1).
3.2. Model Metrics
The performance of the model respective to the TEST and VAL data is assessed using different metrics (
Table 2).
The mean and median hausdorff distances for the VAL remained stable, whereas both metrics improved for the TEST following postprocessing (
Table 2). After postprocessing, mean and median Hausdorff distances were ≤ 1.5 frames (≤ 6 ms). Prior to postprocessing, the precision metric for the TEST indicated a small number of falsely predicted ground contact events, reflected by precision values slightly below 1. Postprocessing effectively eliminated these false positives, resulting in 100% event detection precision and recall for both VAL and TEST datasets. The Rand Index exceeded 0.977, demonstrating near-perfect alignment between predicted and true ground contact times. As expected, the Rand Index was unaffected by postprocessing, since this procedure does not alter correctly predicted contact segments. All subsequent analyses were conducted on the postprocessed data.
3.3. Performance Values
The GC times exhibited a clear trend of progressively shorter durations with increasing step number (
Table 3). The largest deviations in mean GC times were observed for the first, fourth, eighth, and ninth steps, whereas the remaining steps showed comparatively small variations, indicating overall consistency across the sprint sequence. GT values were generally lower in the TEST, also displaying the shortest mean GC time of 98 ± 4ms at step 9 (
Table 3).
3.4. GC Detection Method Evaluation
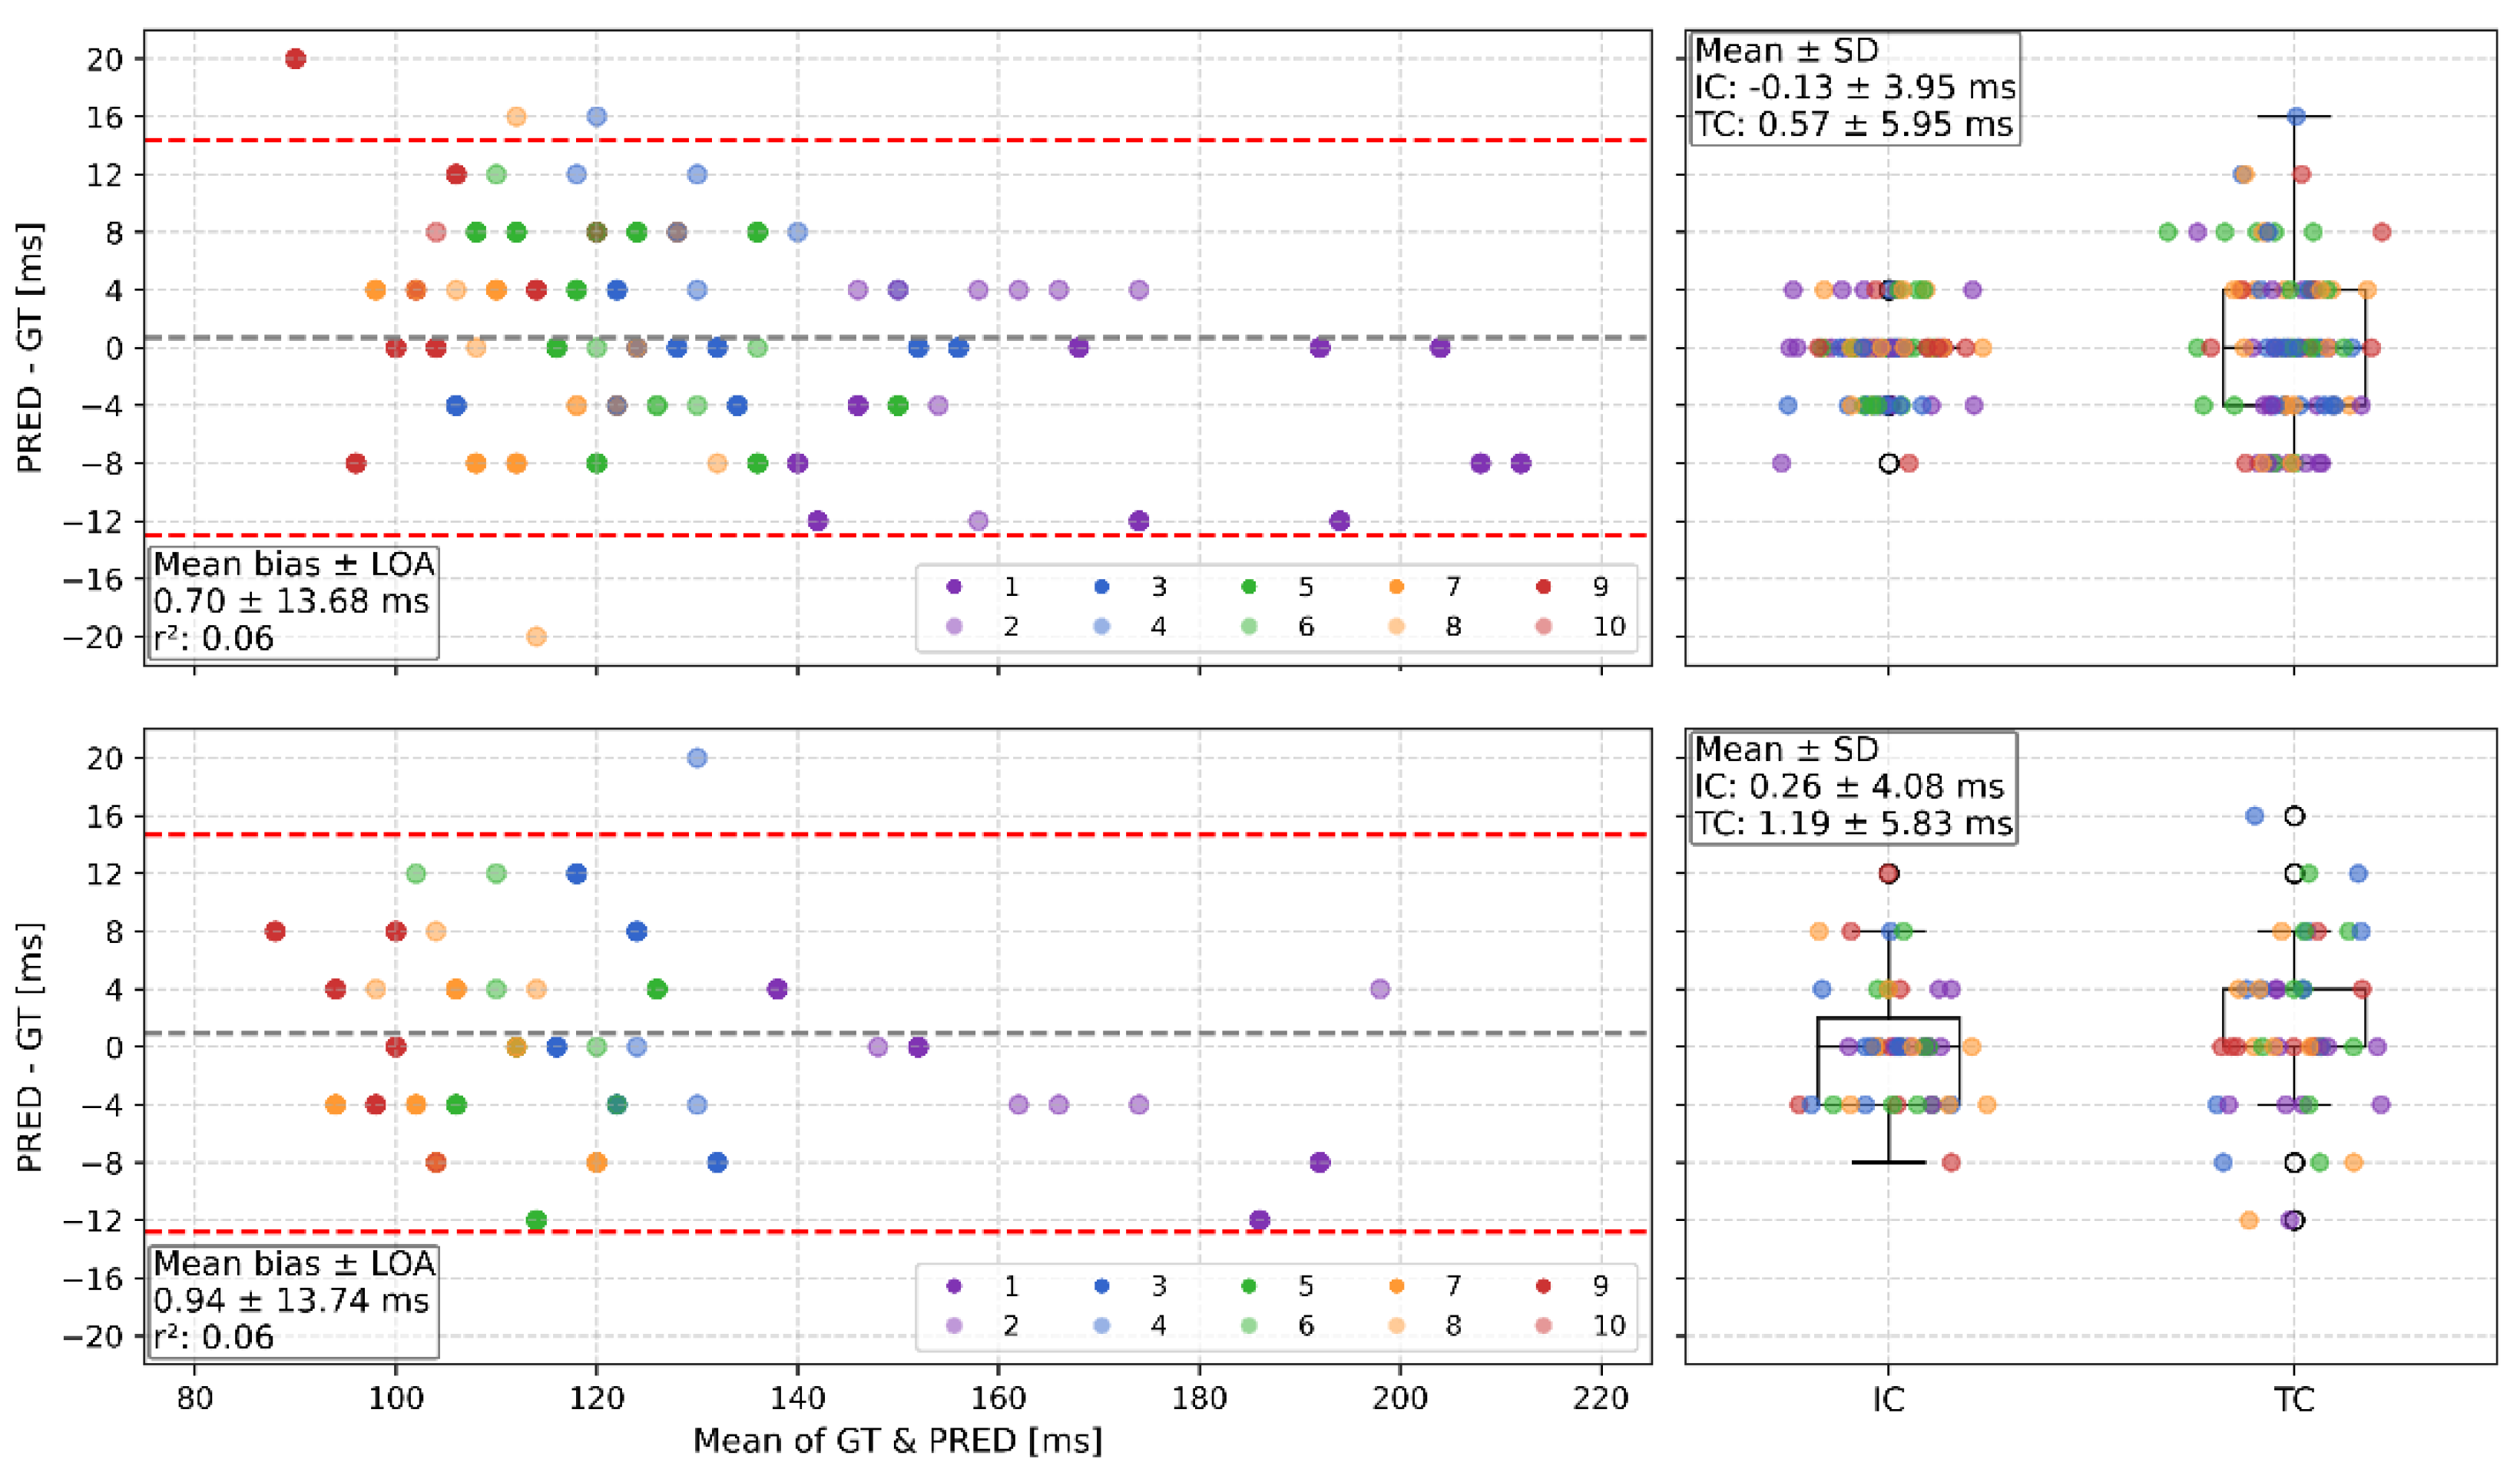
The Bland-Altman figures for GC times reveal similar mean differences below 1 ms and LOA around +15 and -13 ms for both VAL and TEST condition (
Figure 2, left) which are not statistically significant (
Table 4). The boxplots show a lower mean and standard deviation for differences between PRED and GT for IC than in TC events in both VAL and TEST (
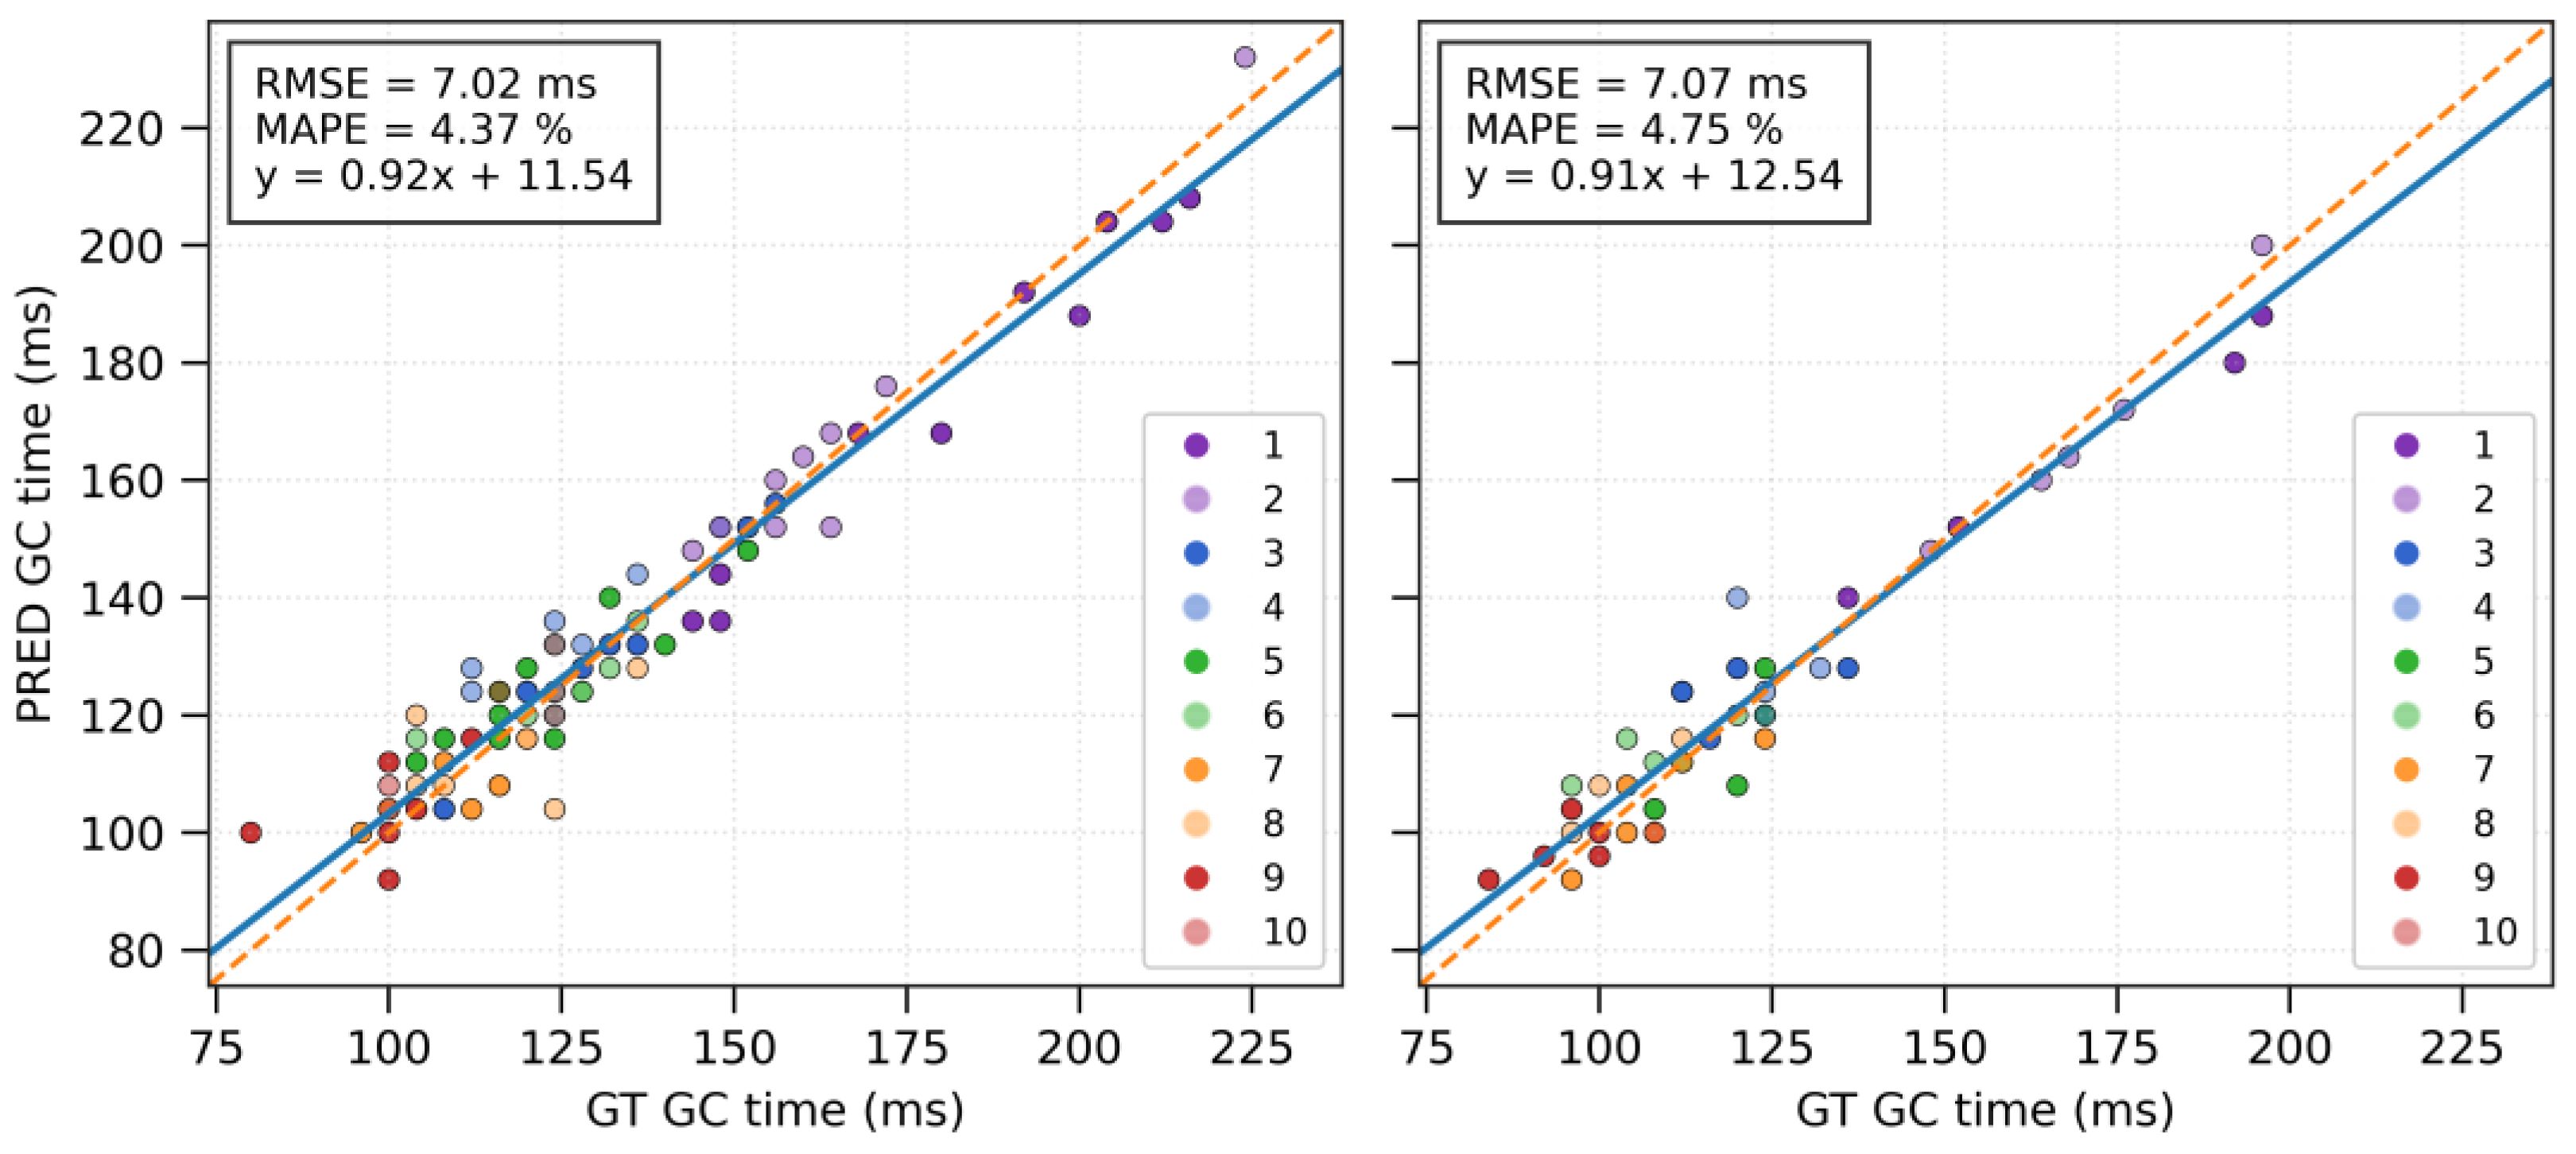
Figure 2, right). Between GT and PRED in both settings the correlations are significantly almost perfect (> 0.90), MAPE values below 5% and RMSE around 7 ms across the varying GC times (Figure 4).
Figure 3.
Left (VAL) and right (TEST) plots illustrate the linear relationship between the model predictions and the ground-truth GC measurements obtained from video recordings. Individual points are color-coded according to the step index, while the dashed line represents the ideal identity line. Both systems were synchronized and sampled at 250 Hz, yielding a temporal resolution of 4 ms per frame. This discrete resolution explains the grid-like points pattern.
4. Discussion
A deep learning 1D CNN based on inception modules was trained to assess the detection of GC events and GC times during the acceleration phase of maximum sprinting.
The model was hyperparameter-tuned for window-size, stride, inception blocks and learning rate. The model performs best with 18 blocks, the second highest of all possible blocks ∈ [
6,
9,
12,
15,
18,
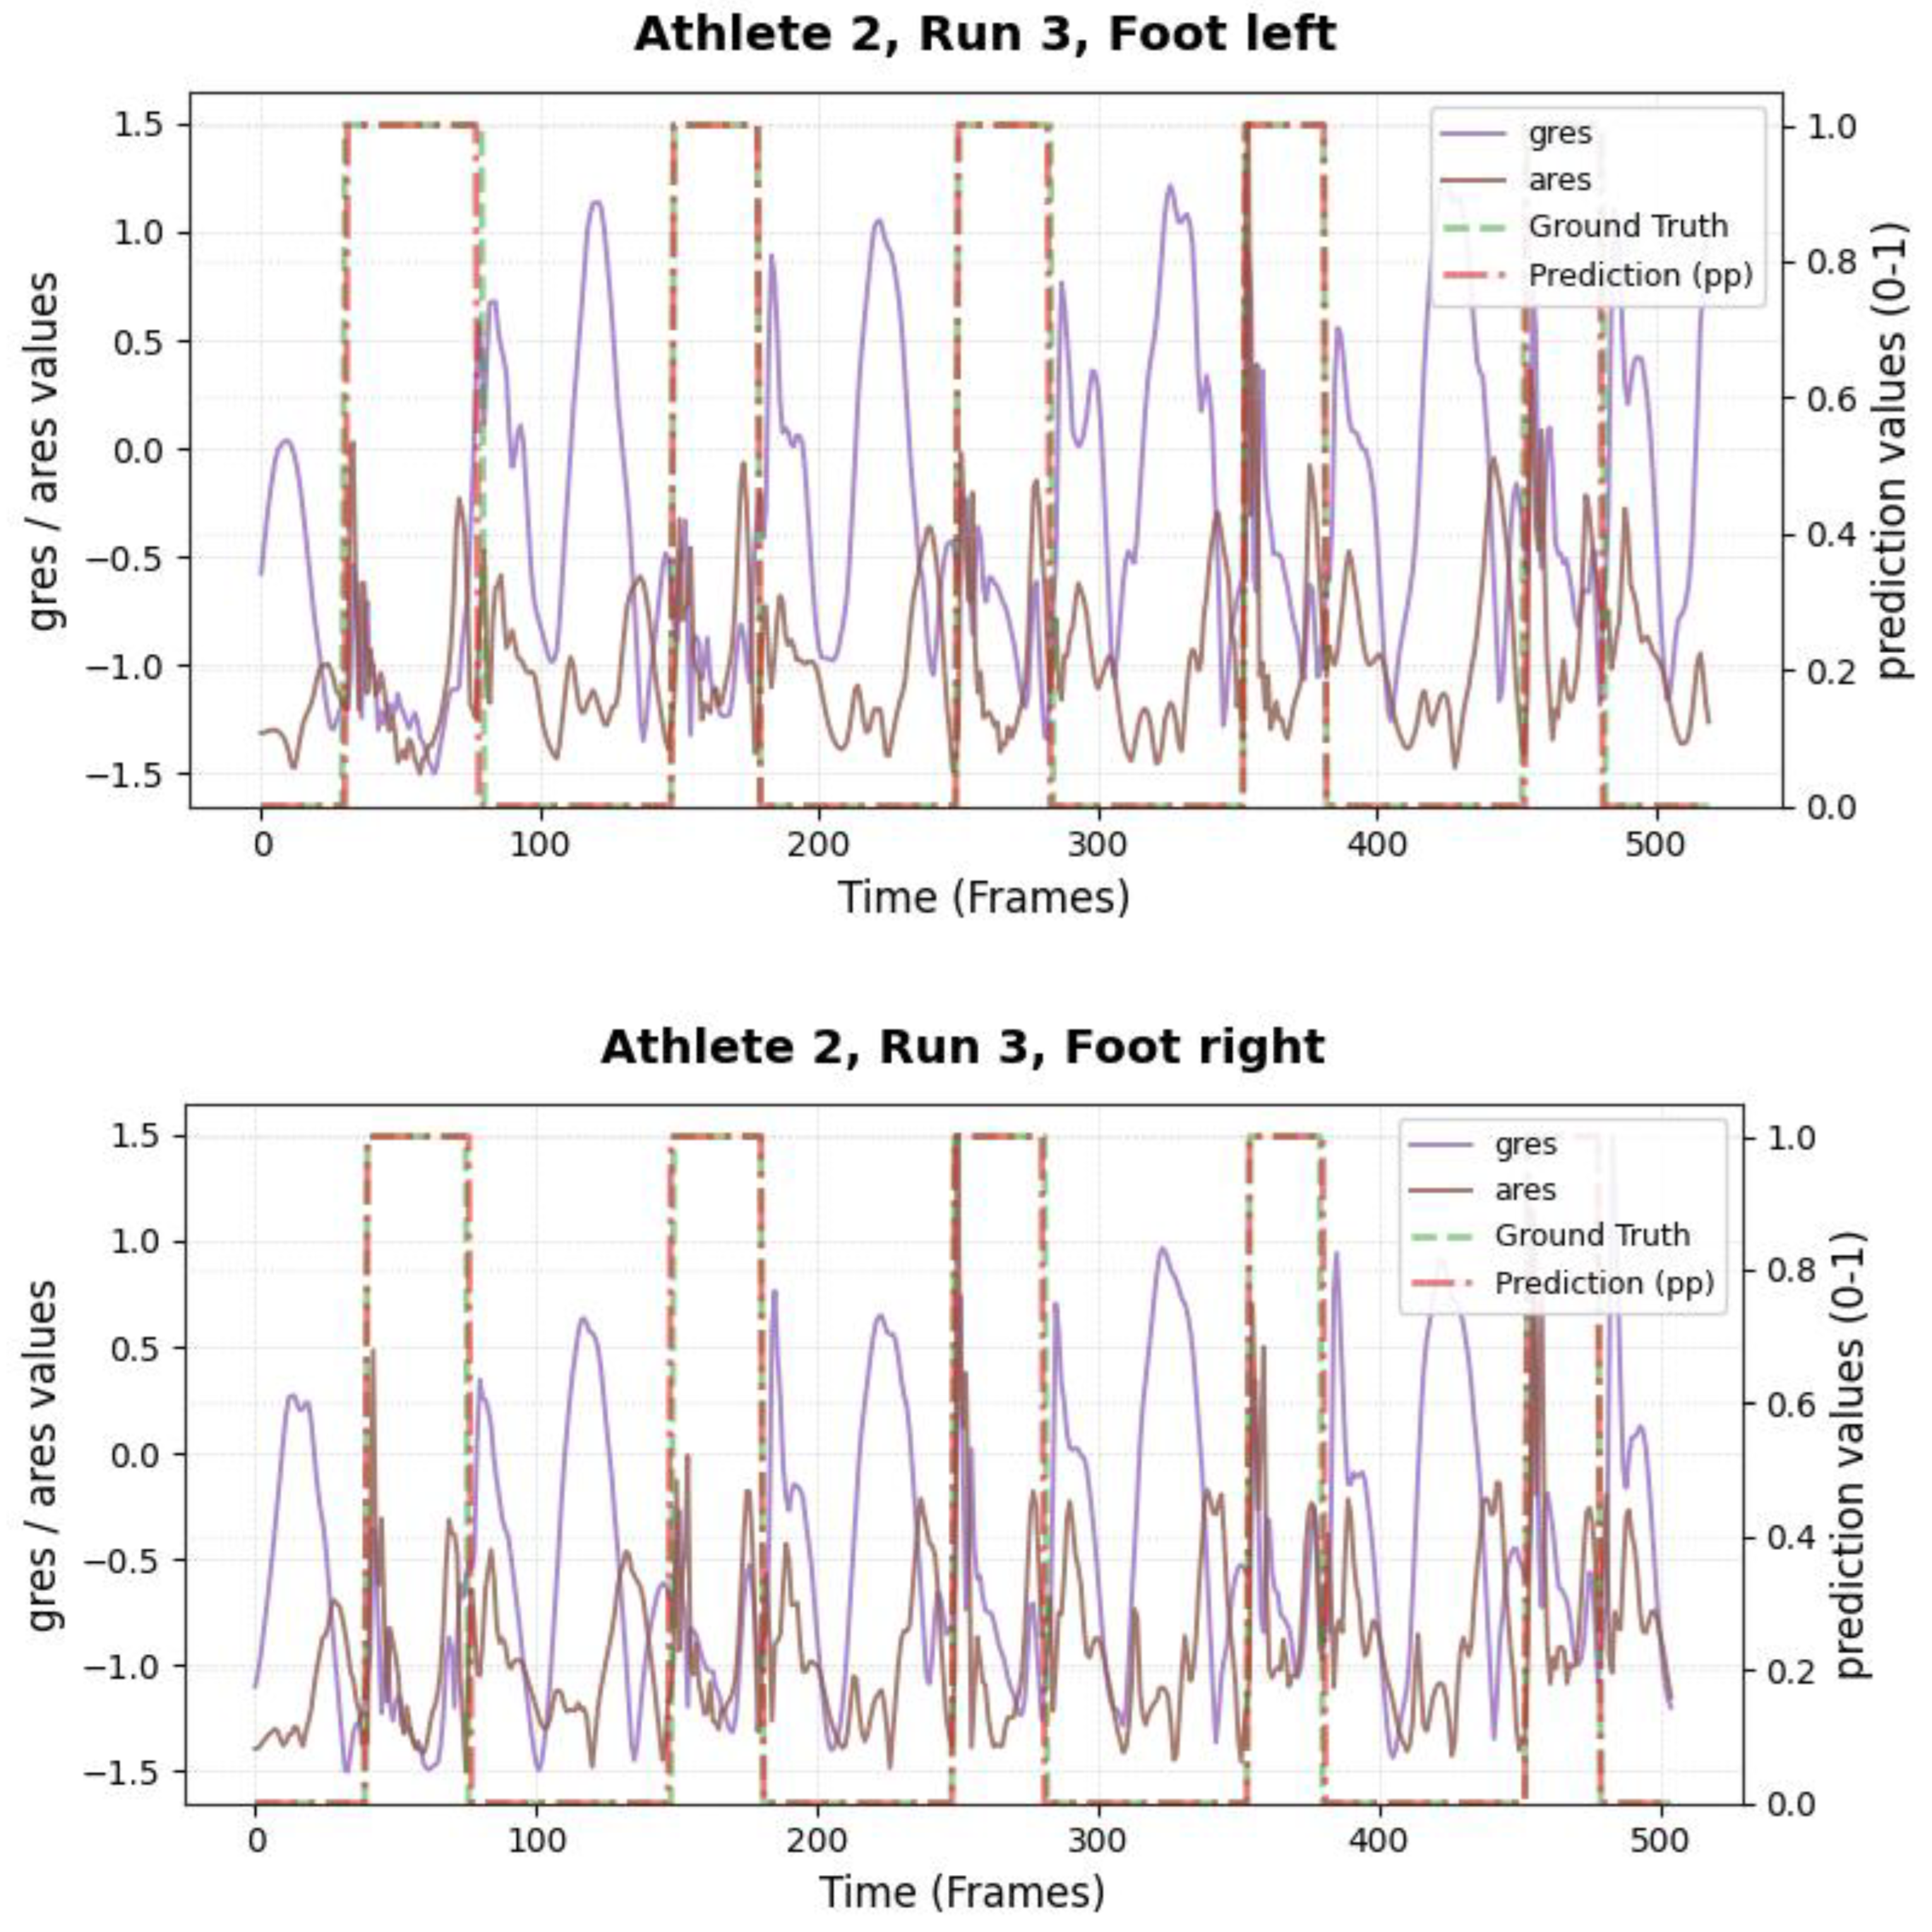
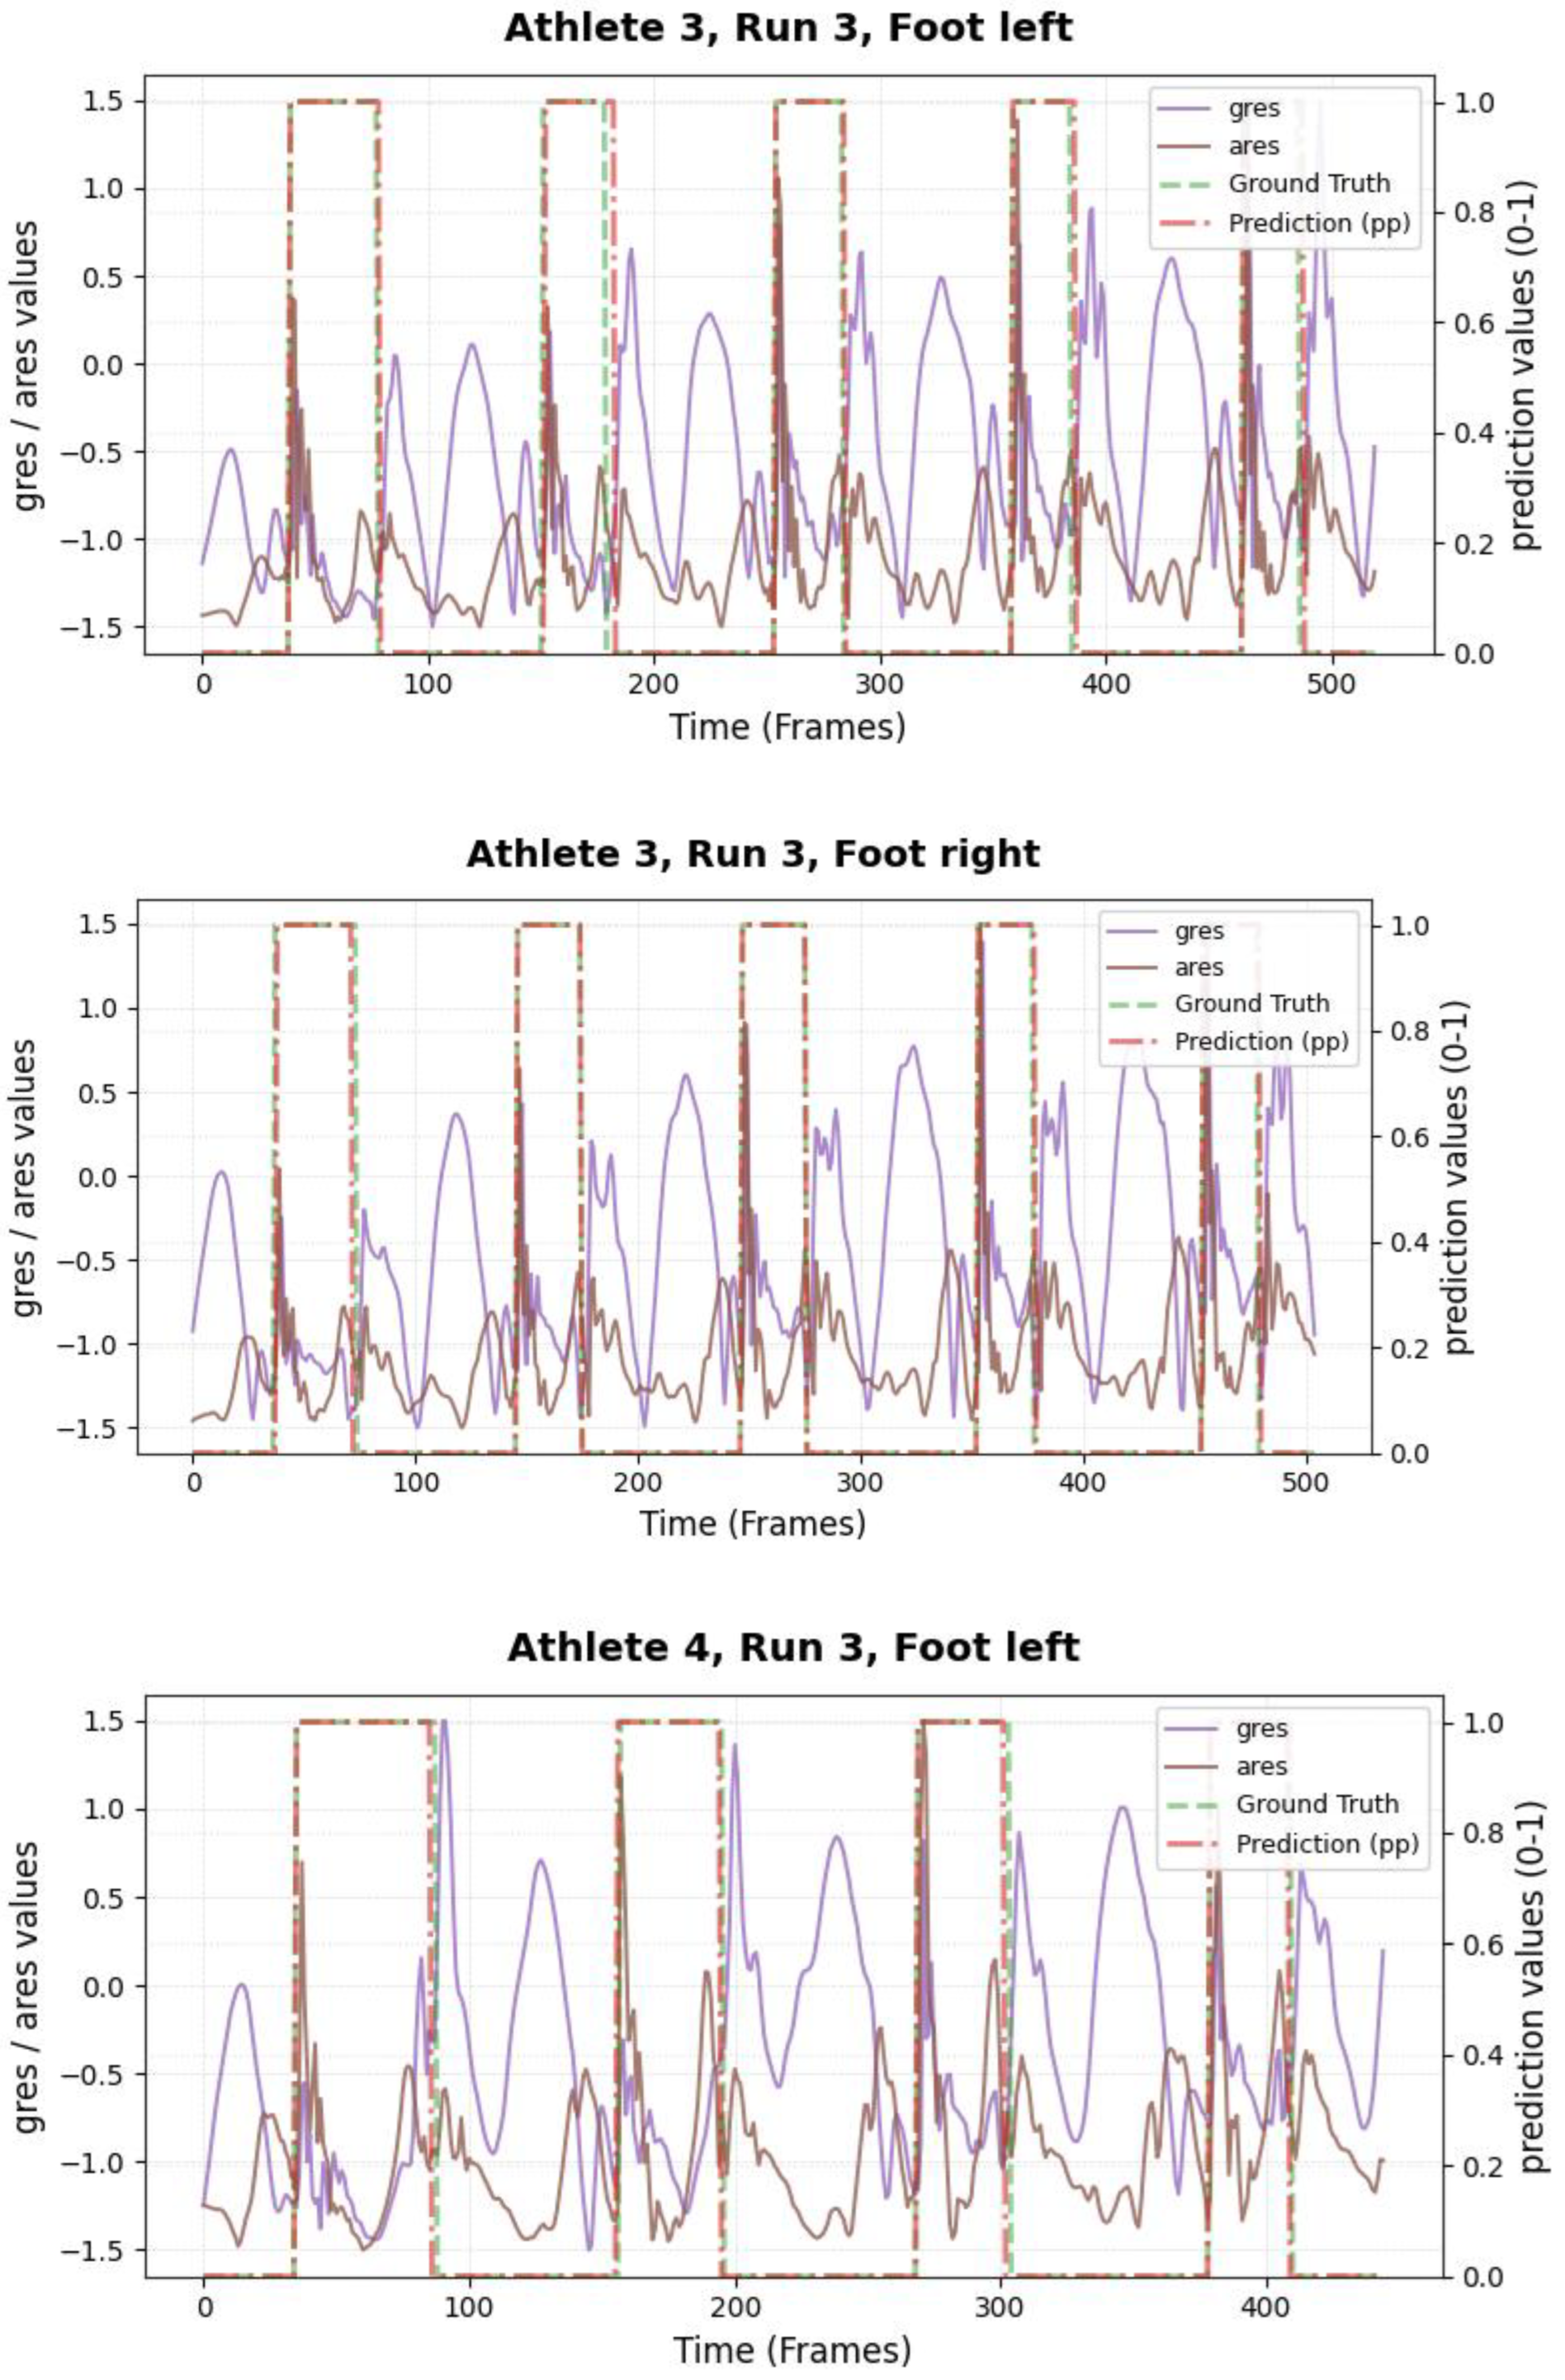
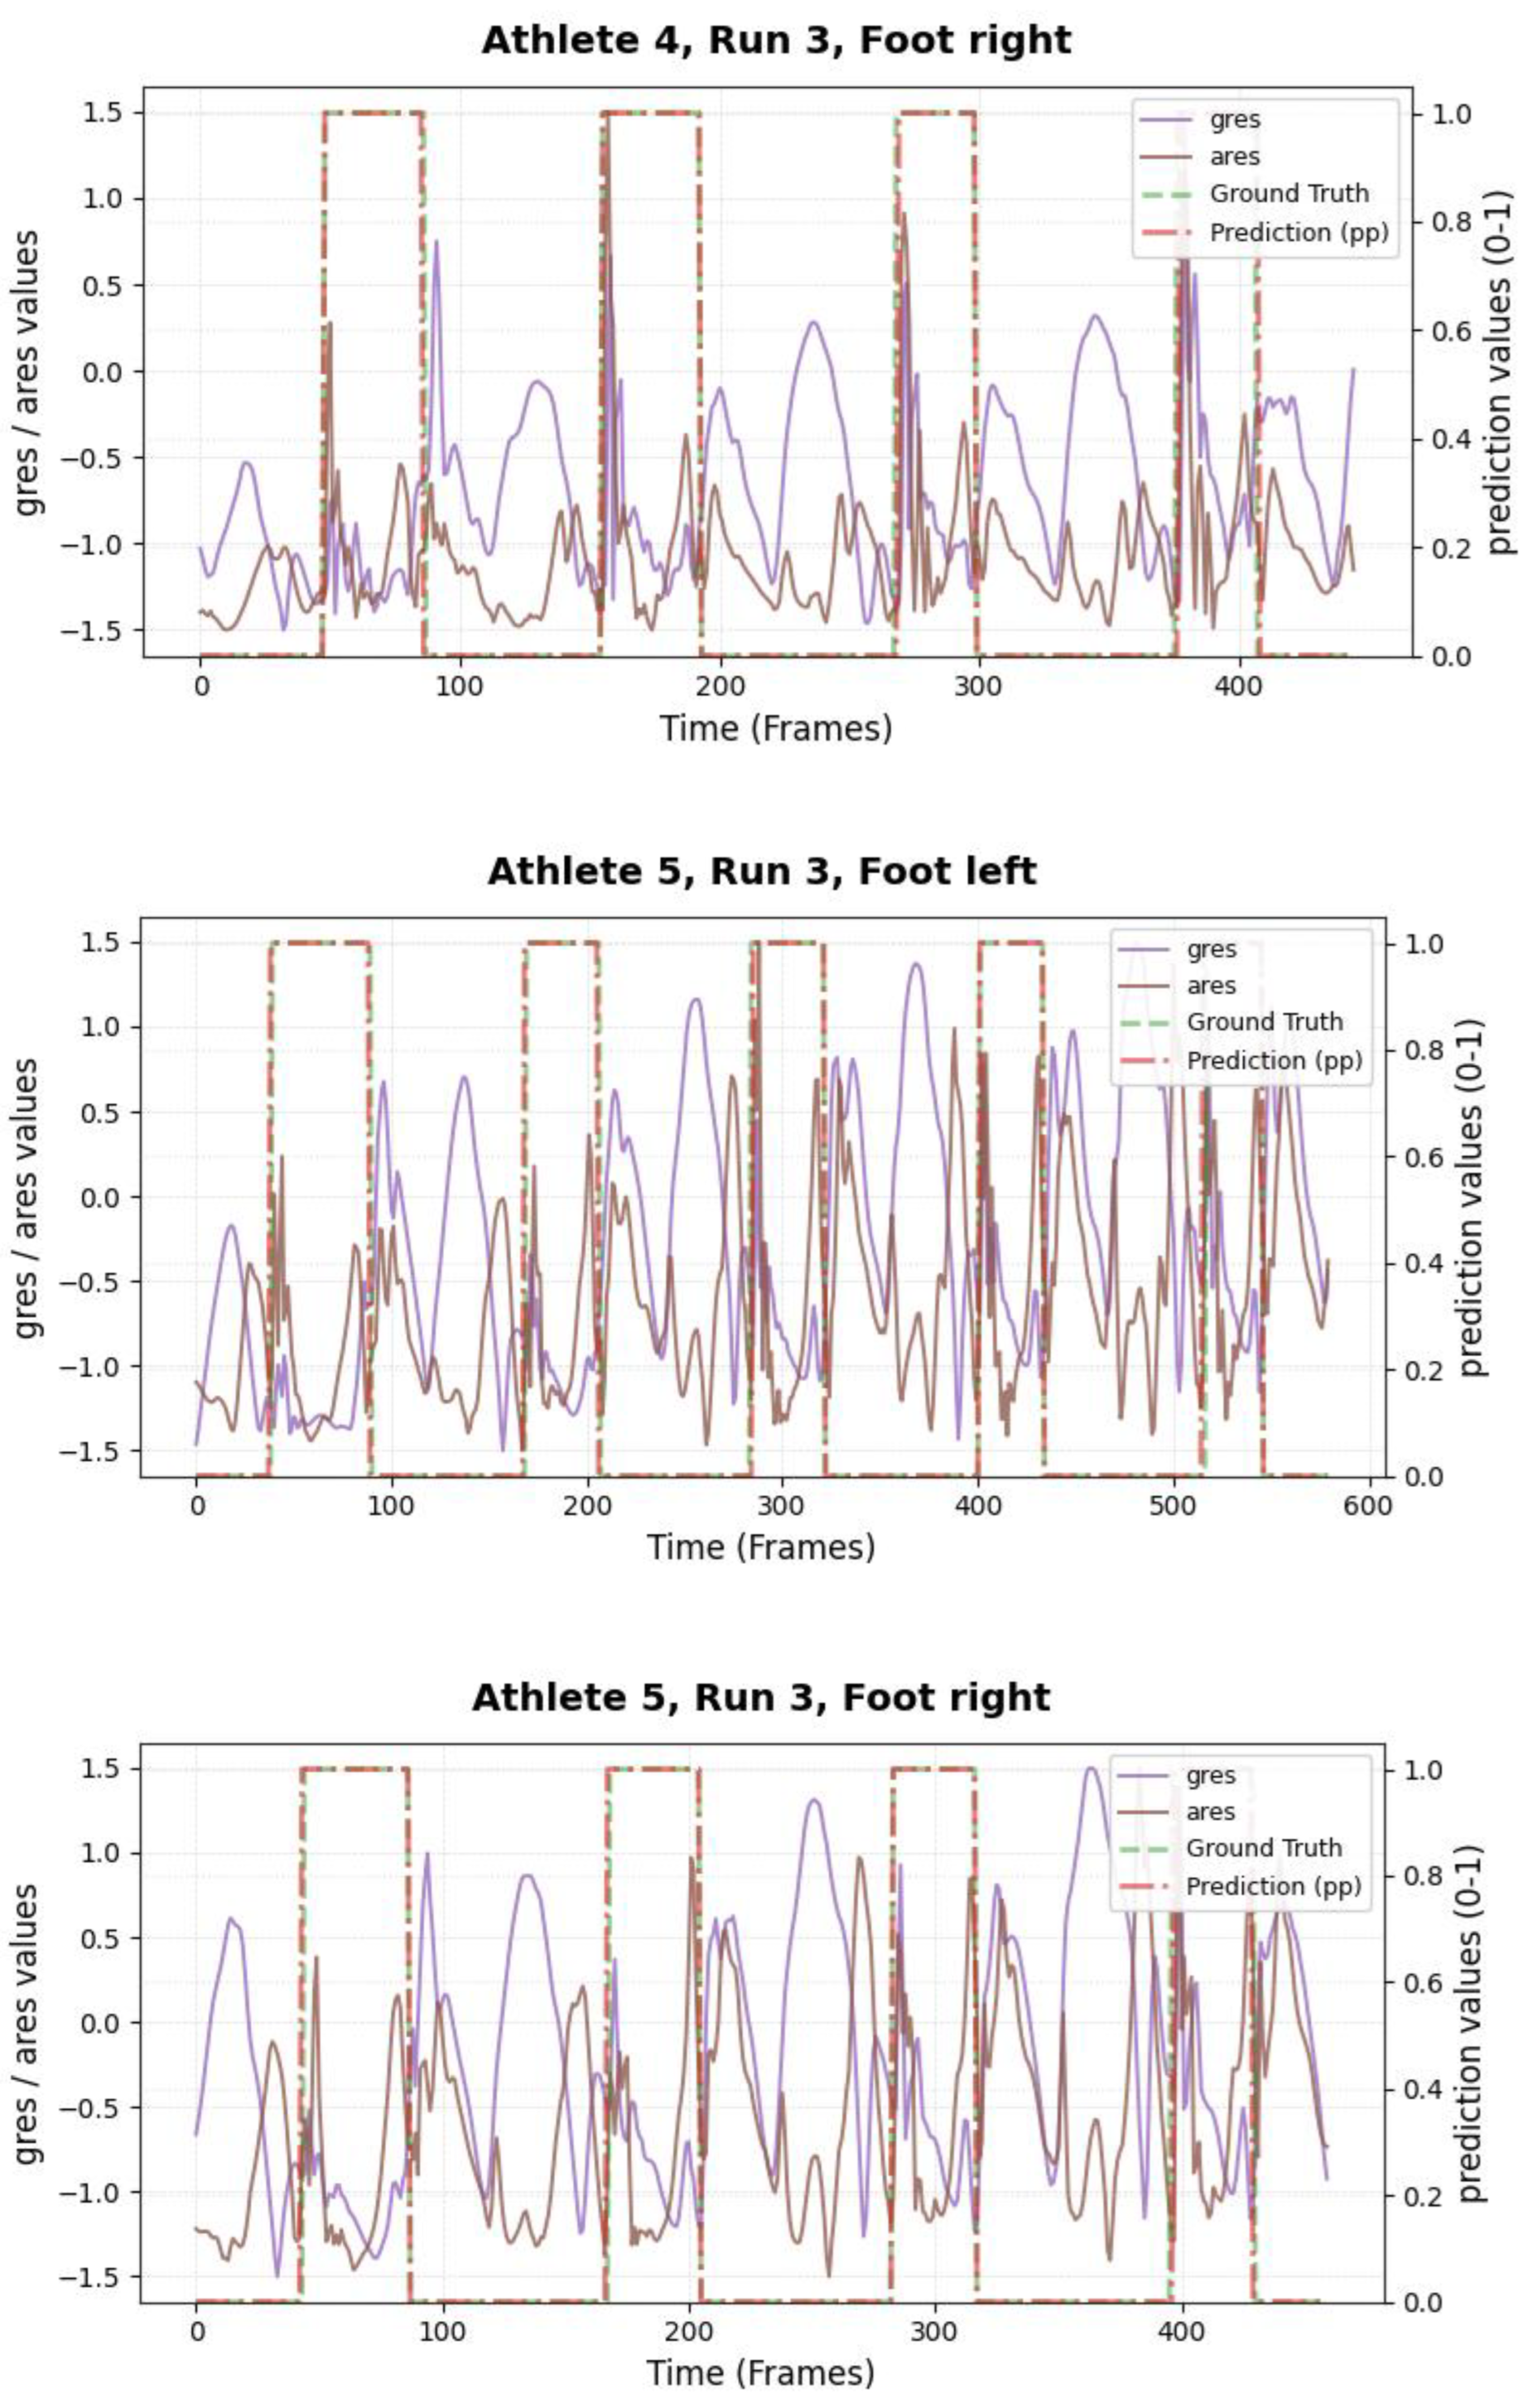
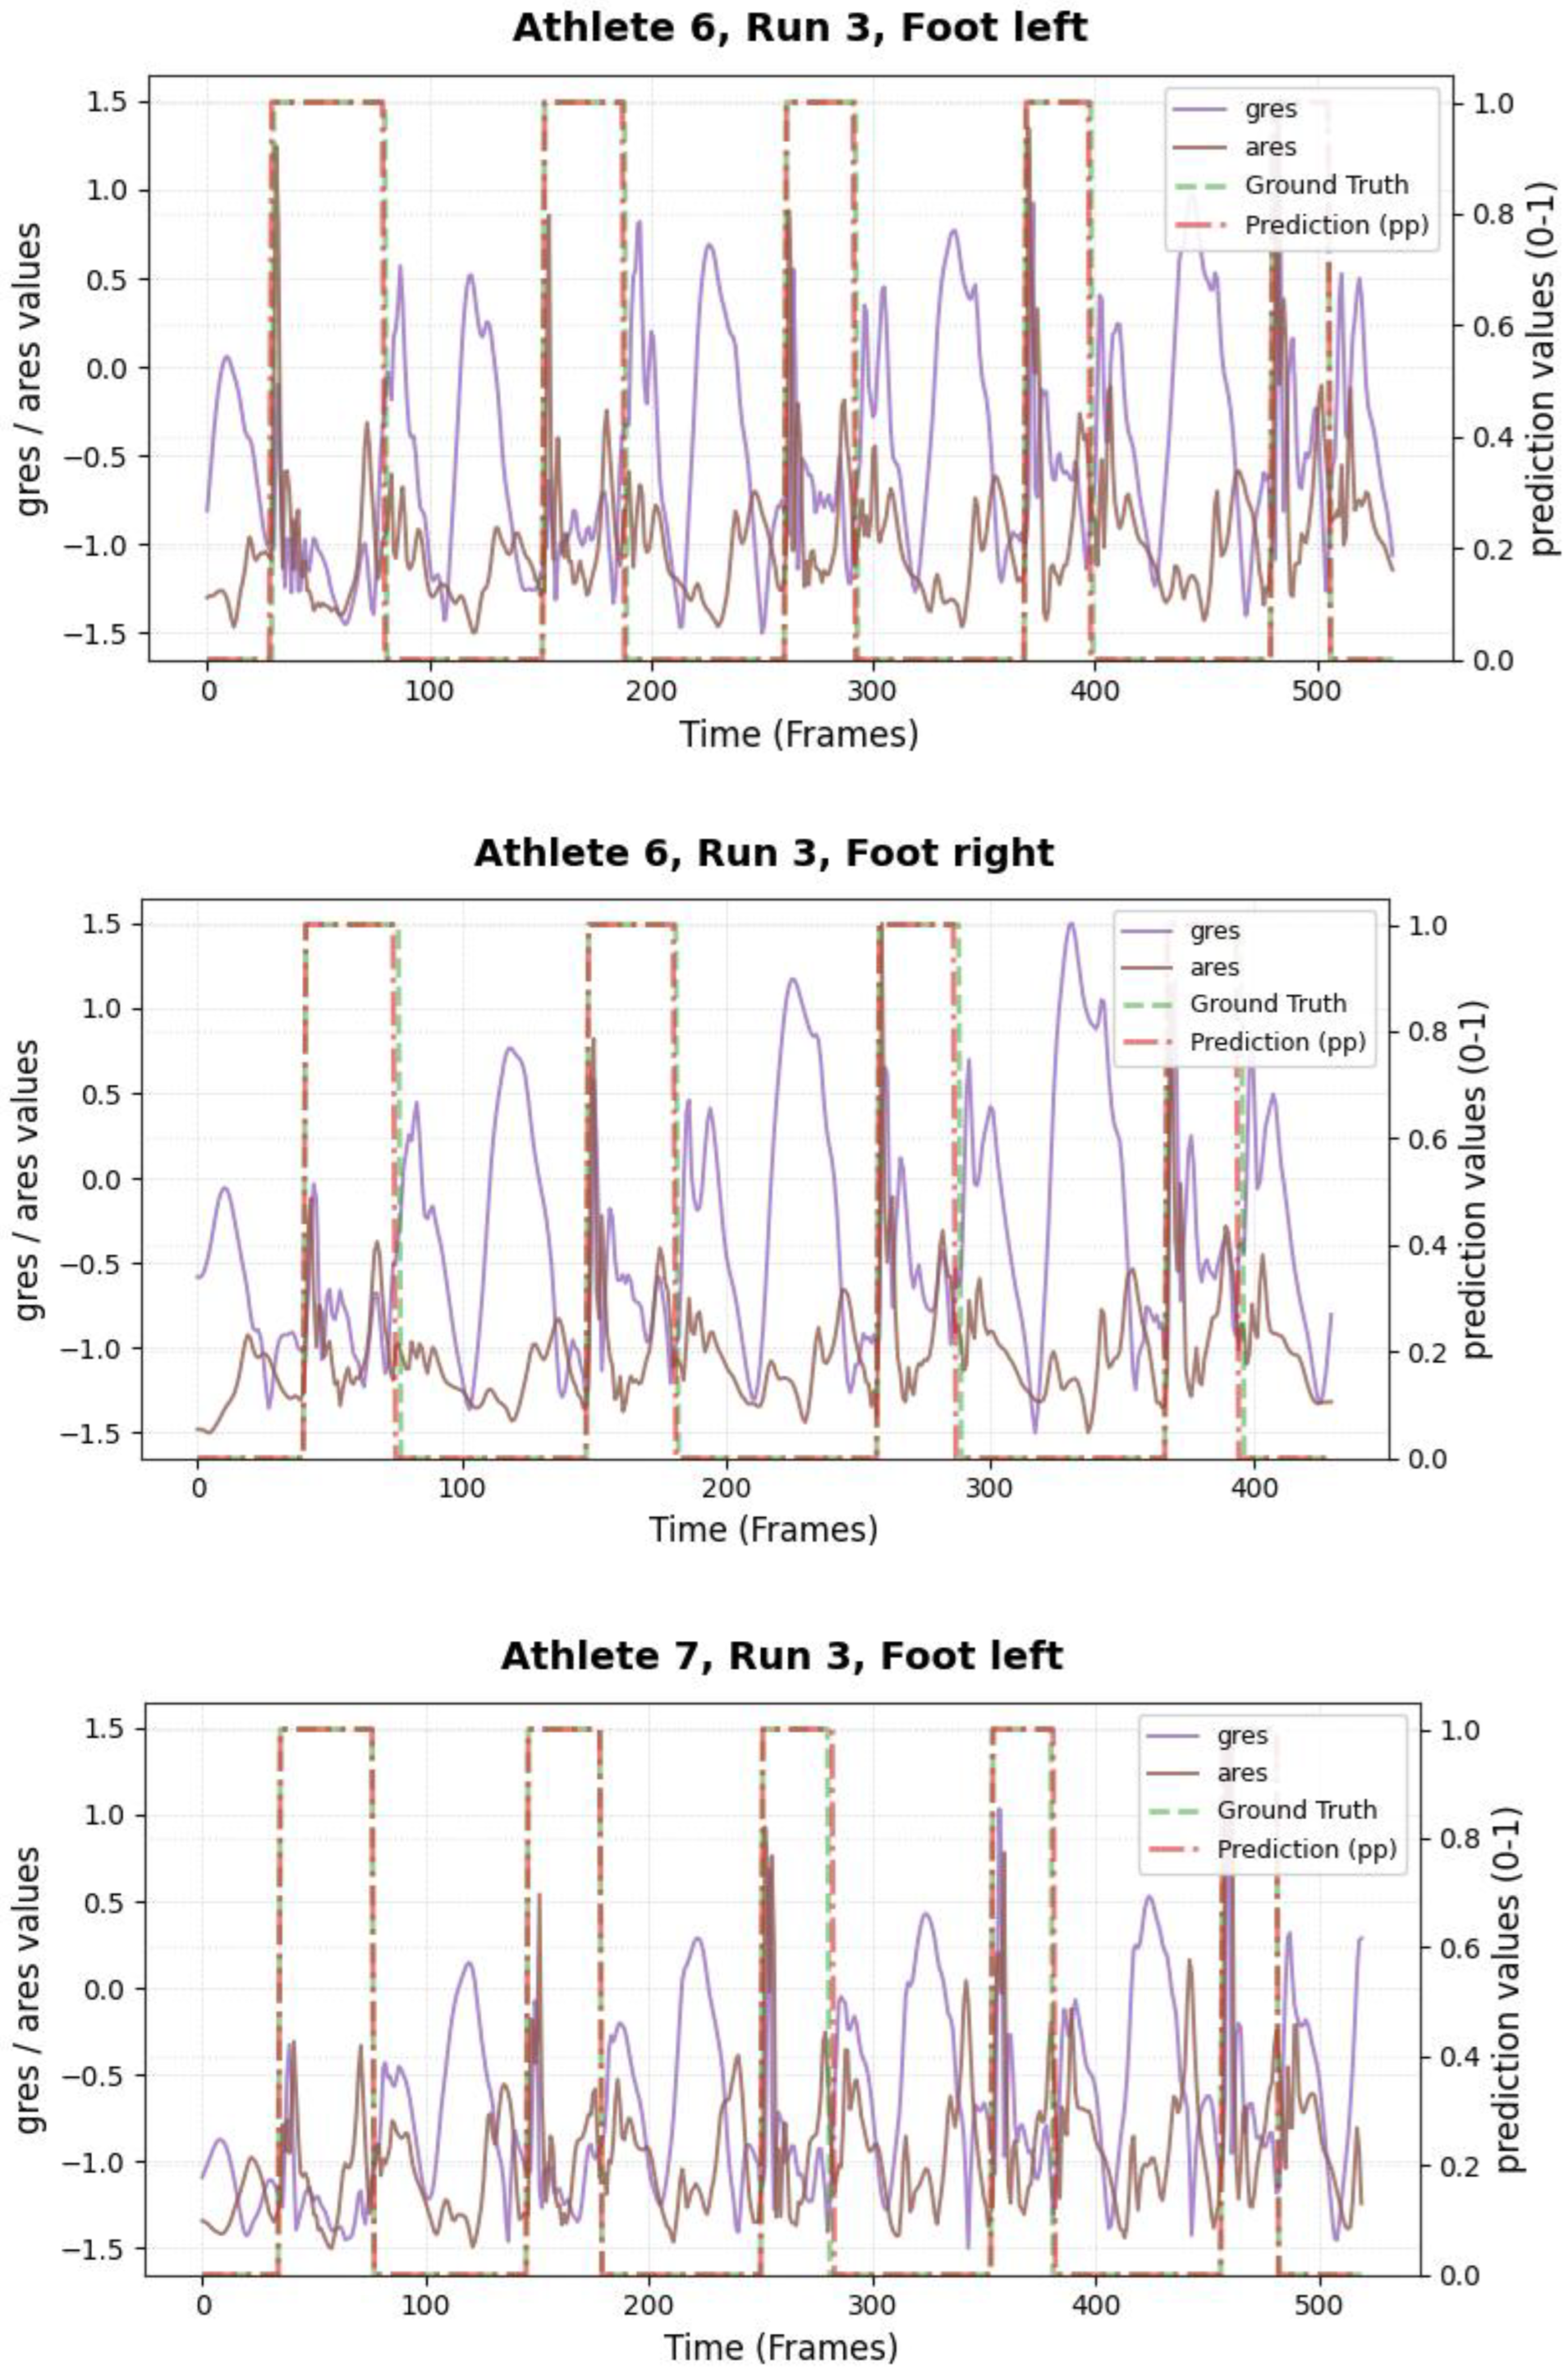
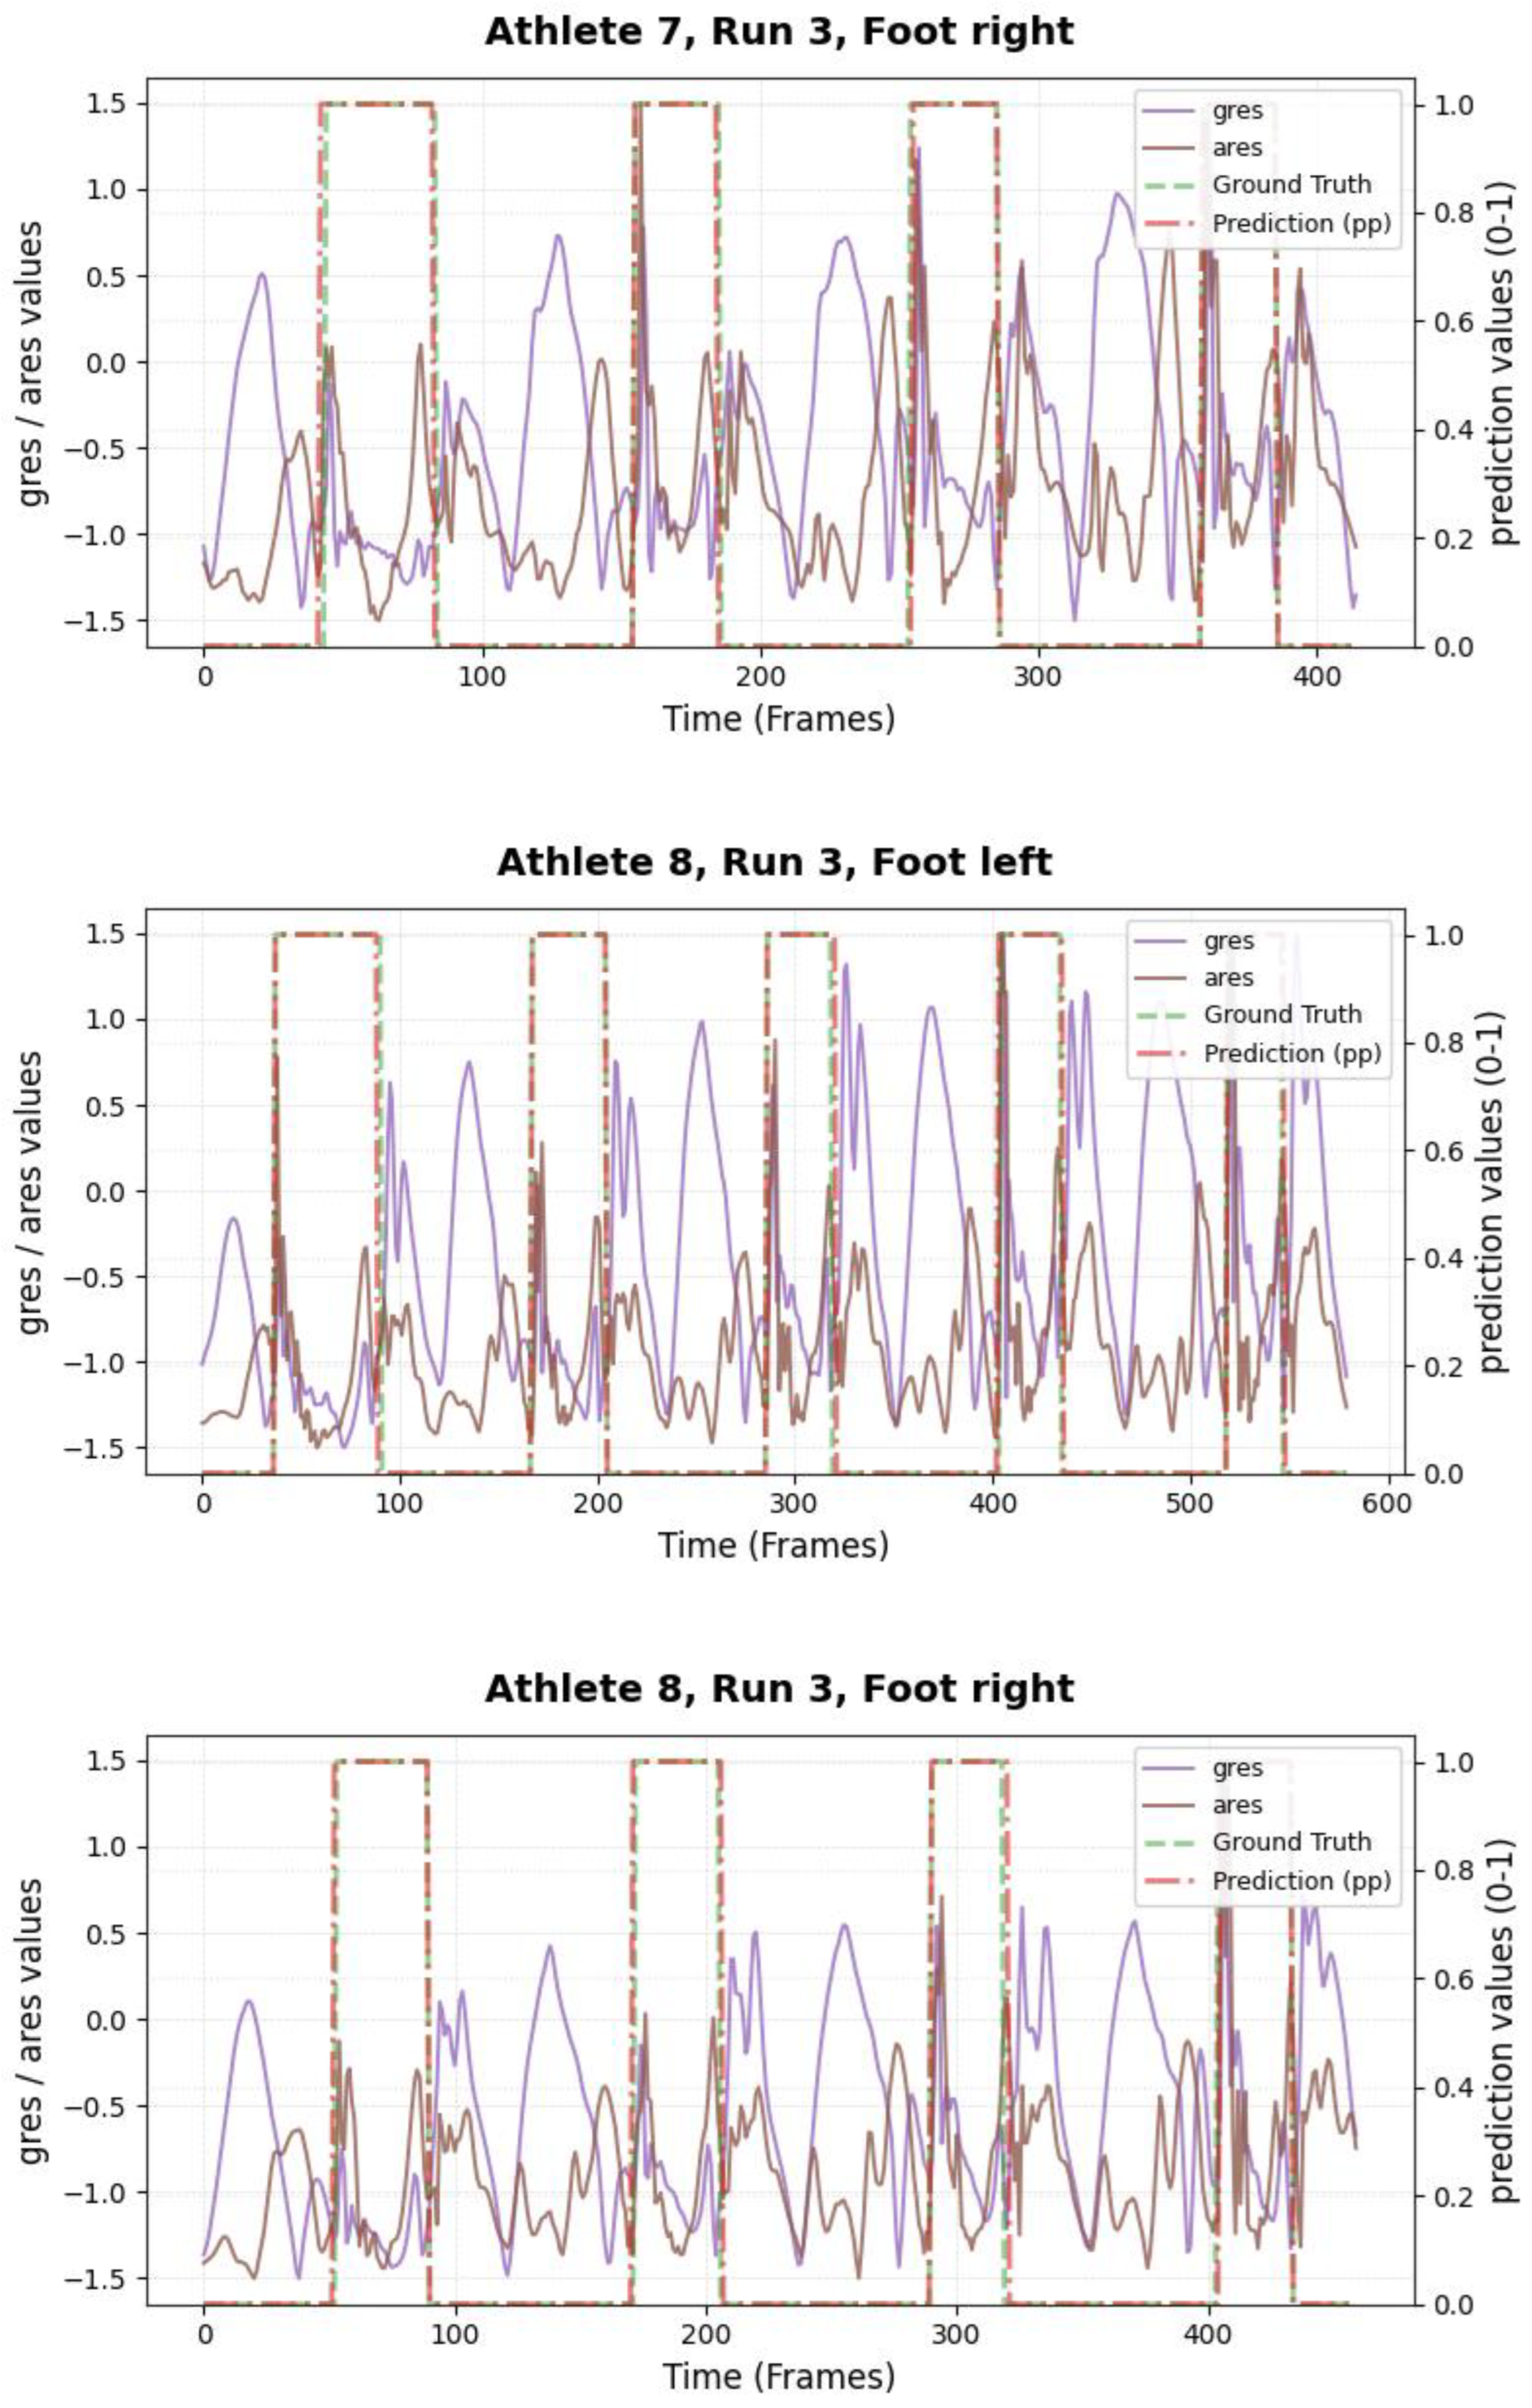
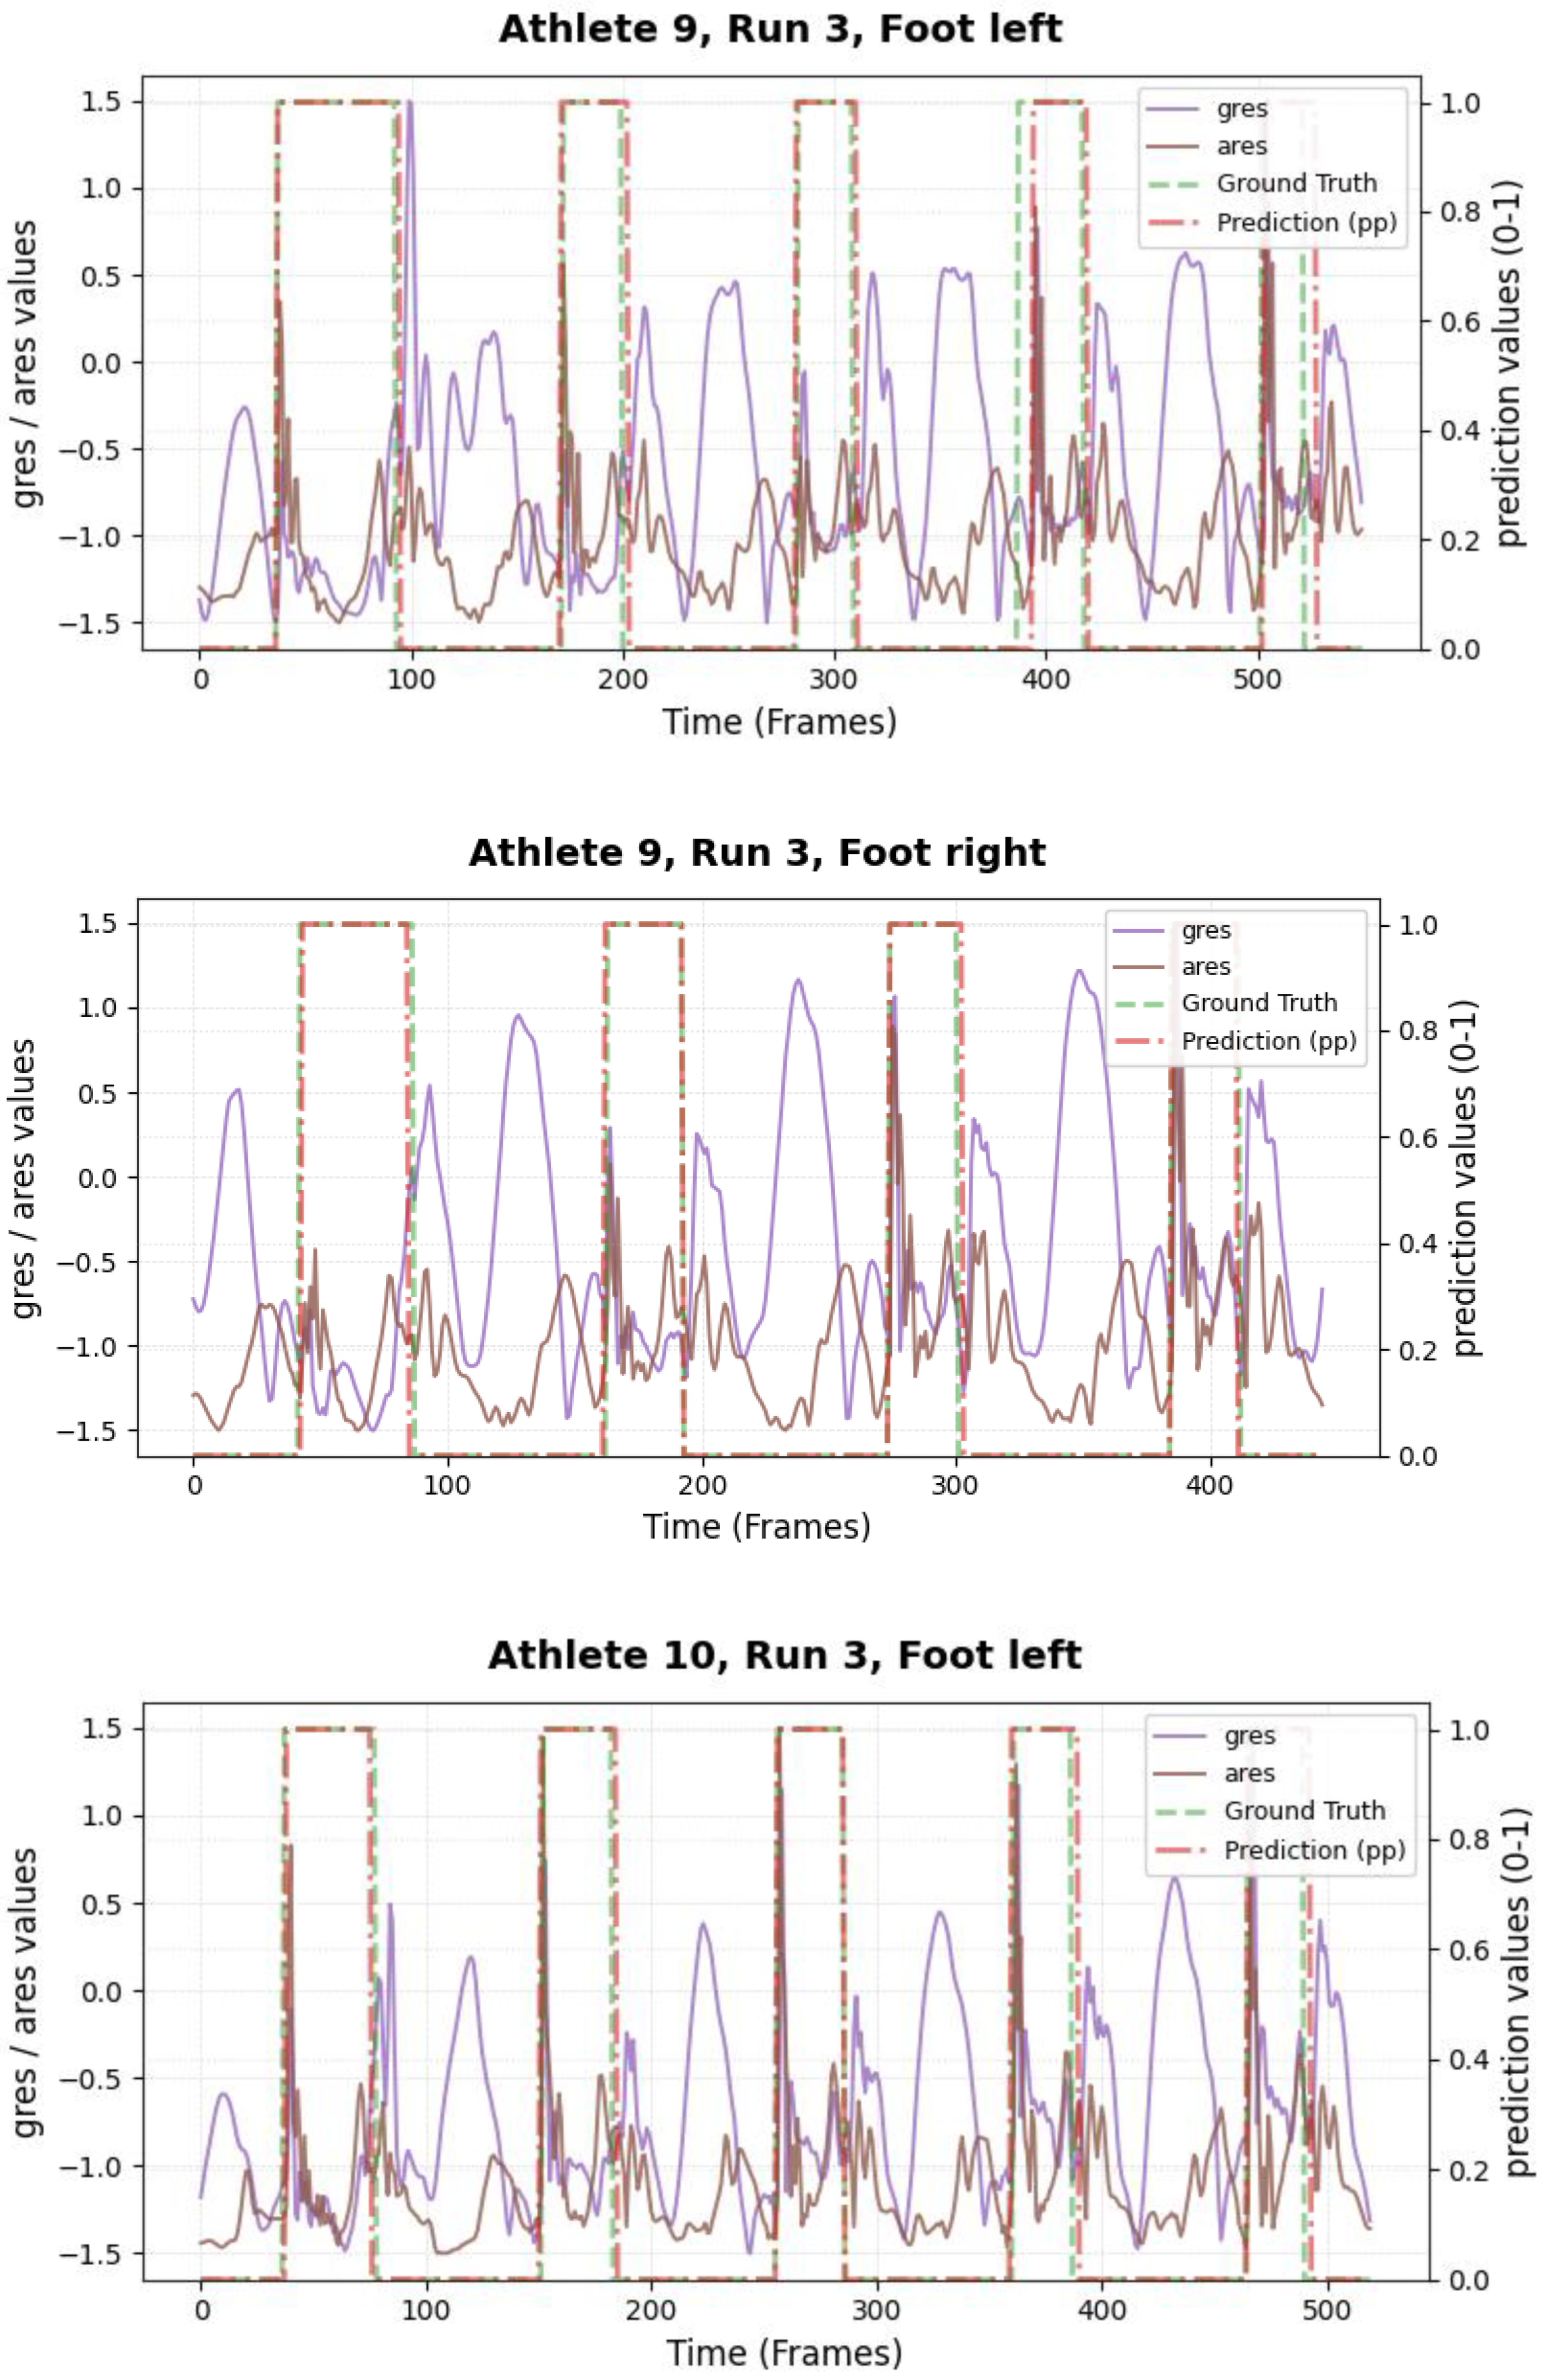
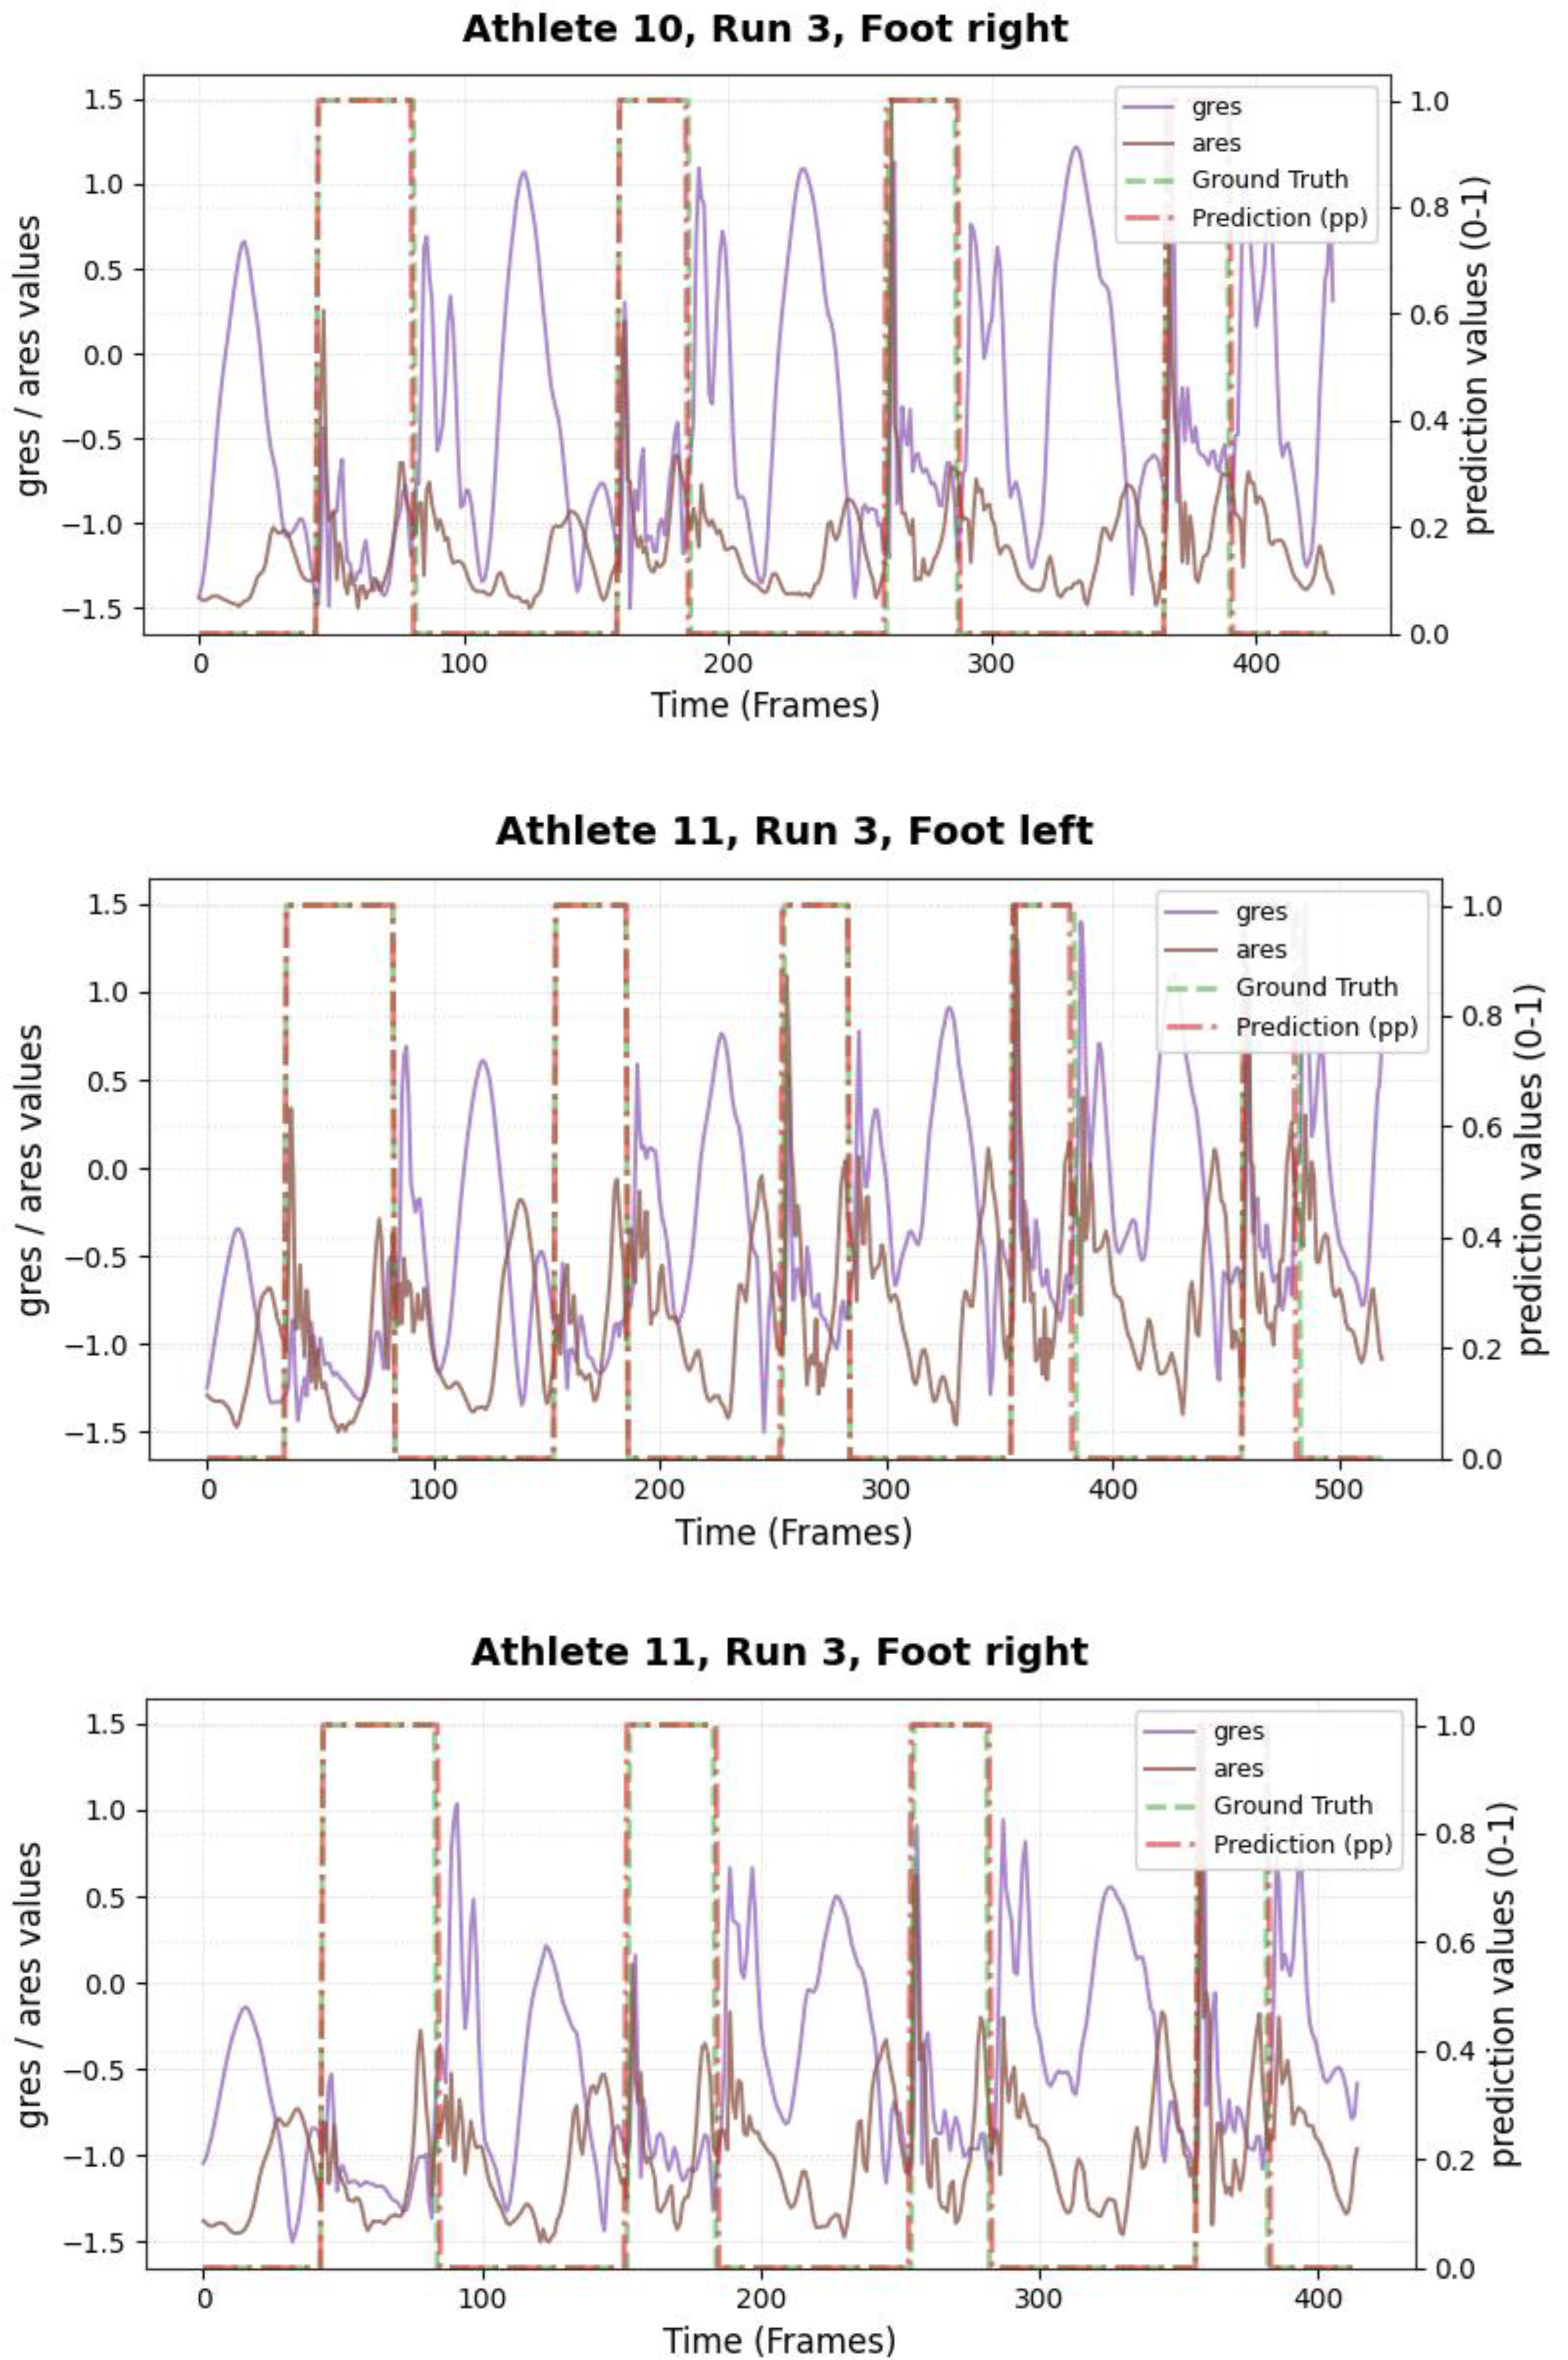
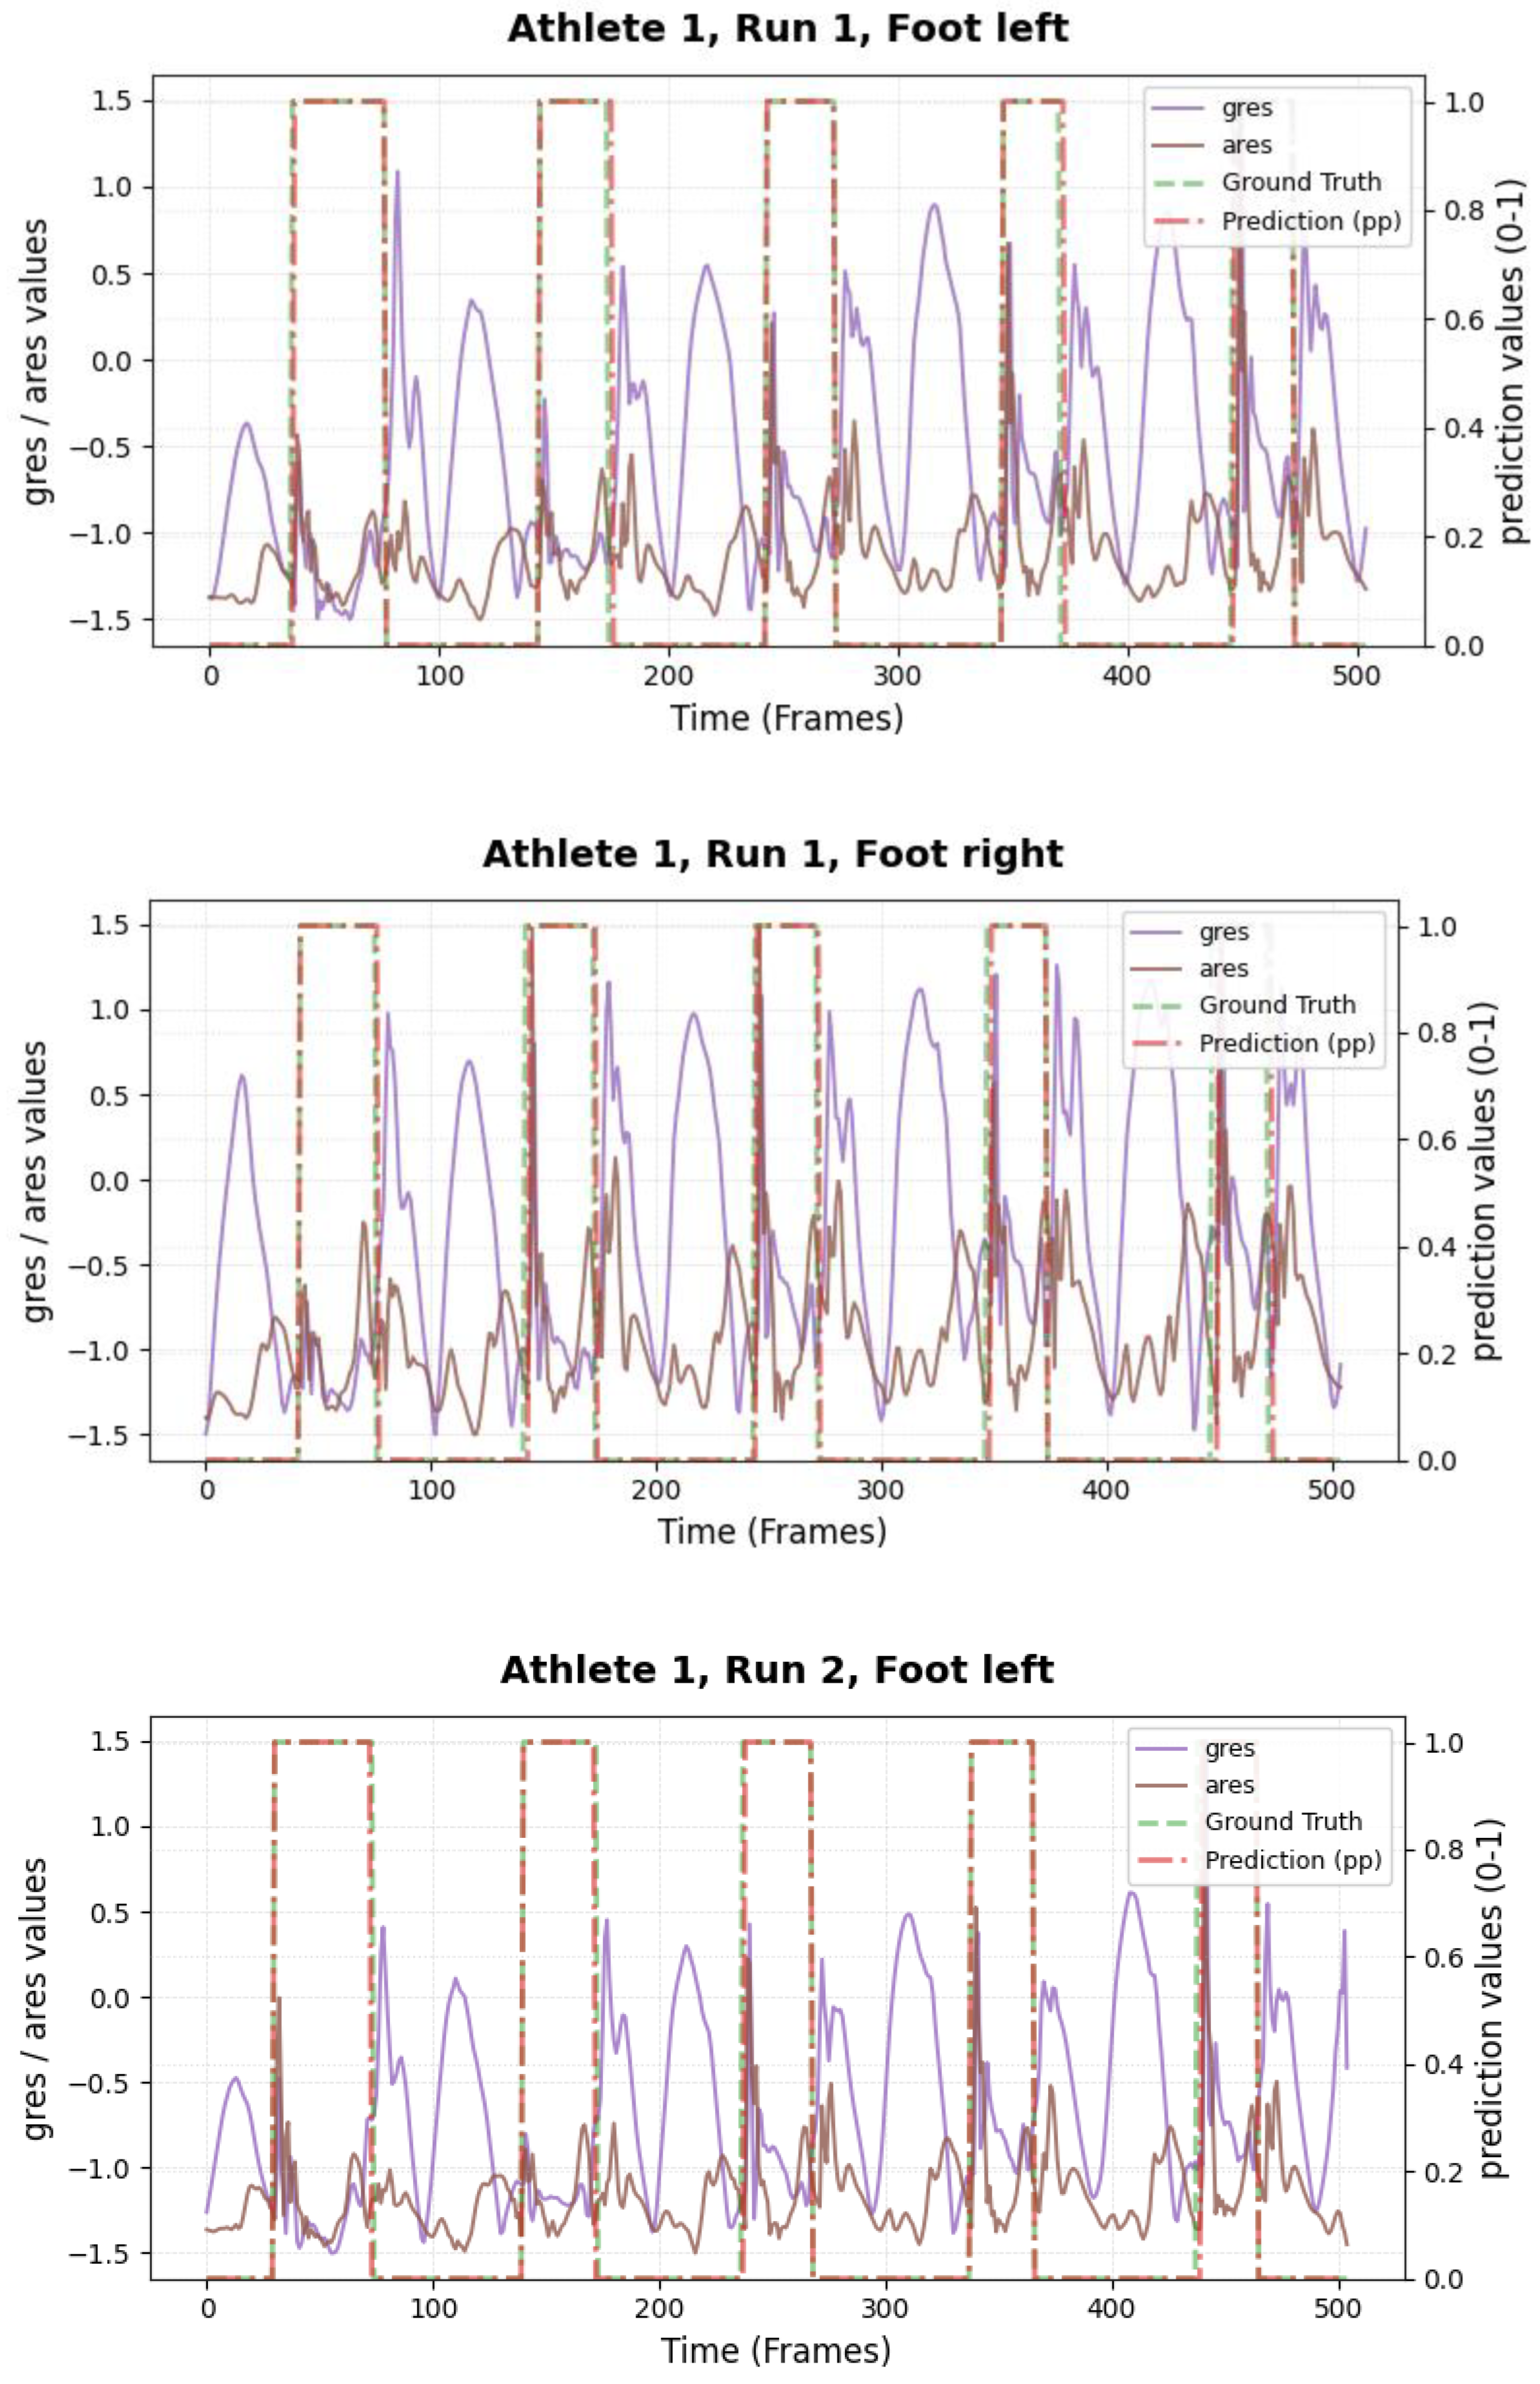
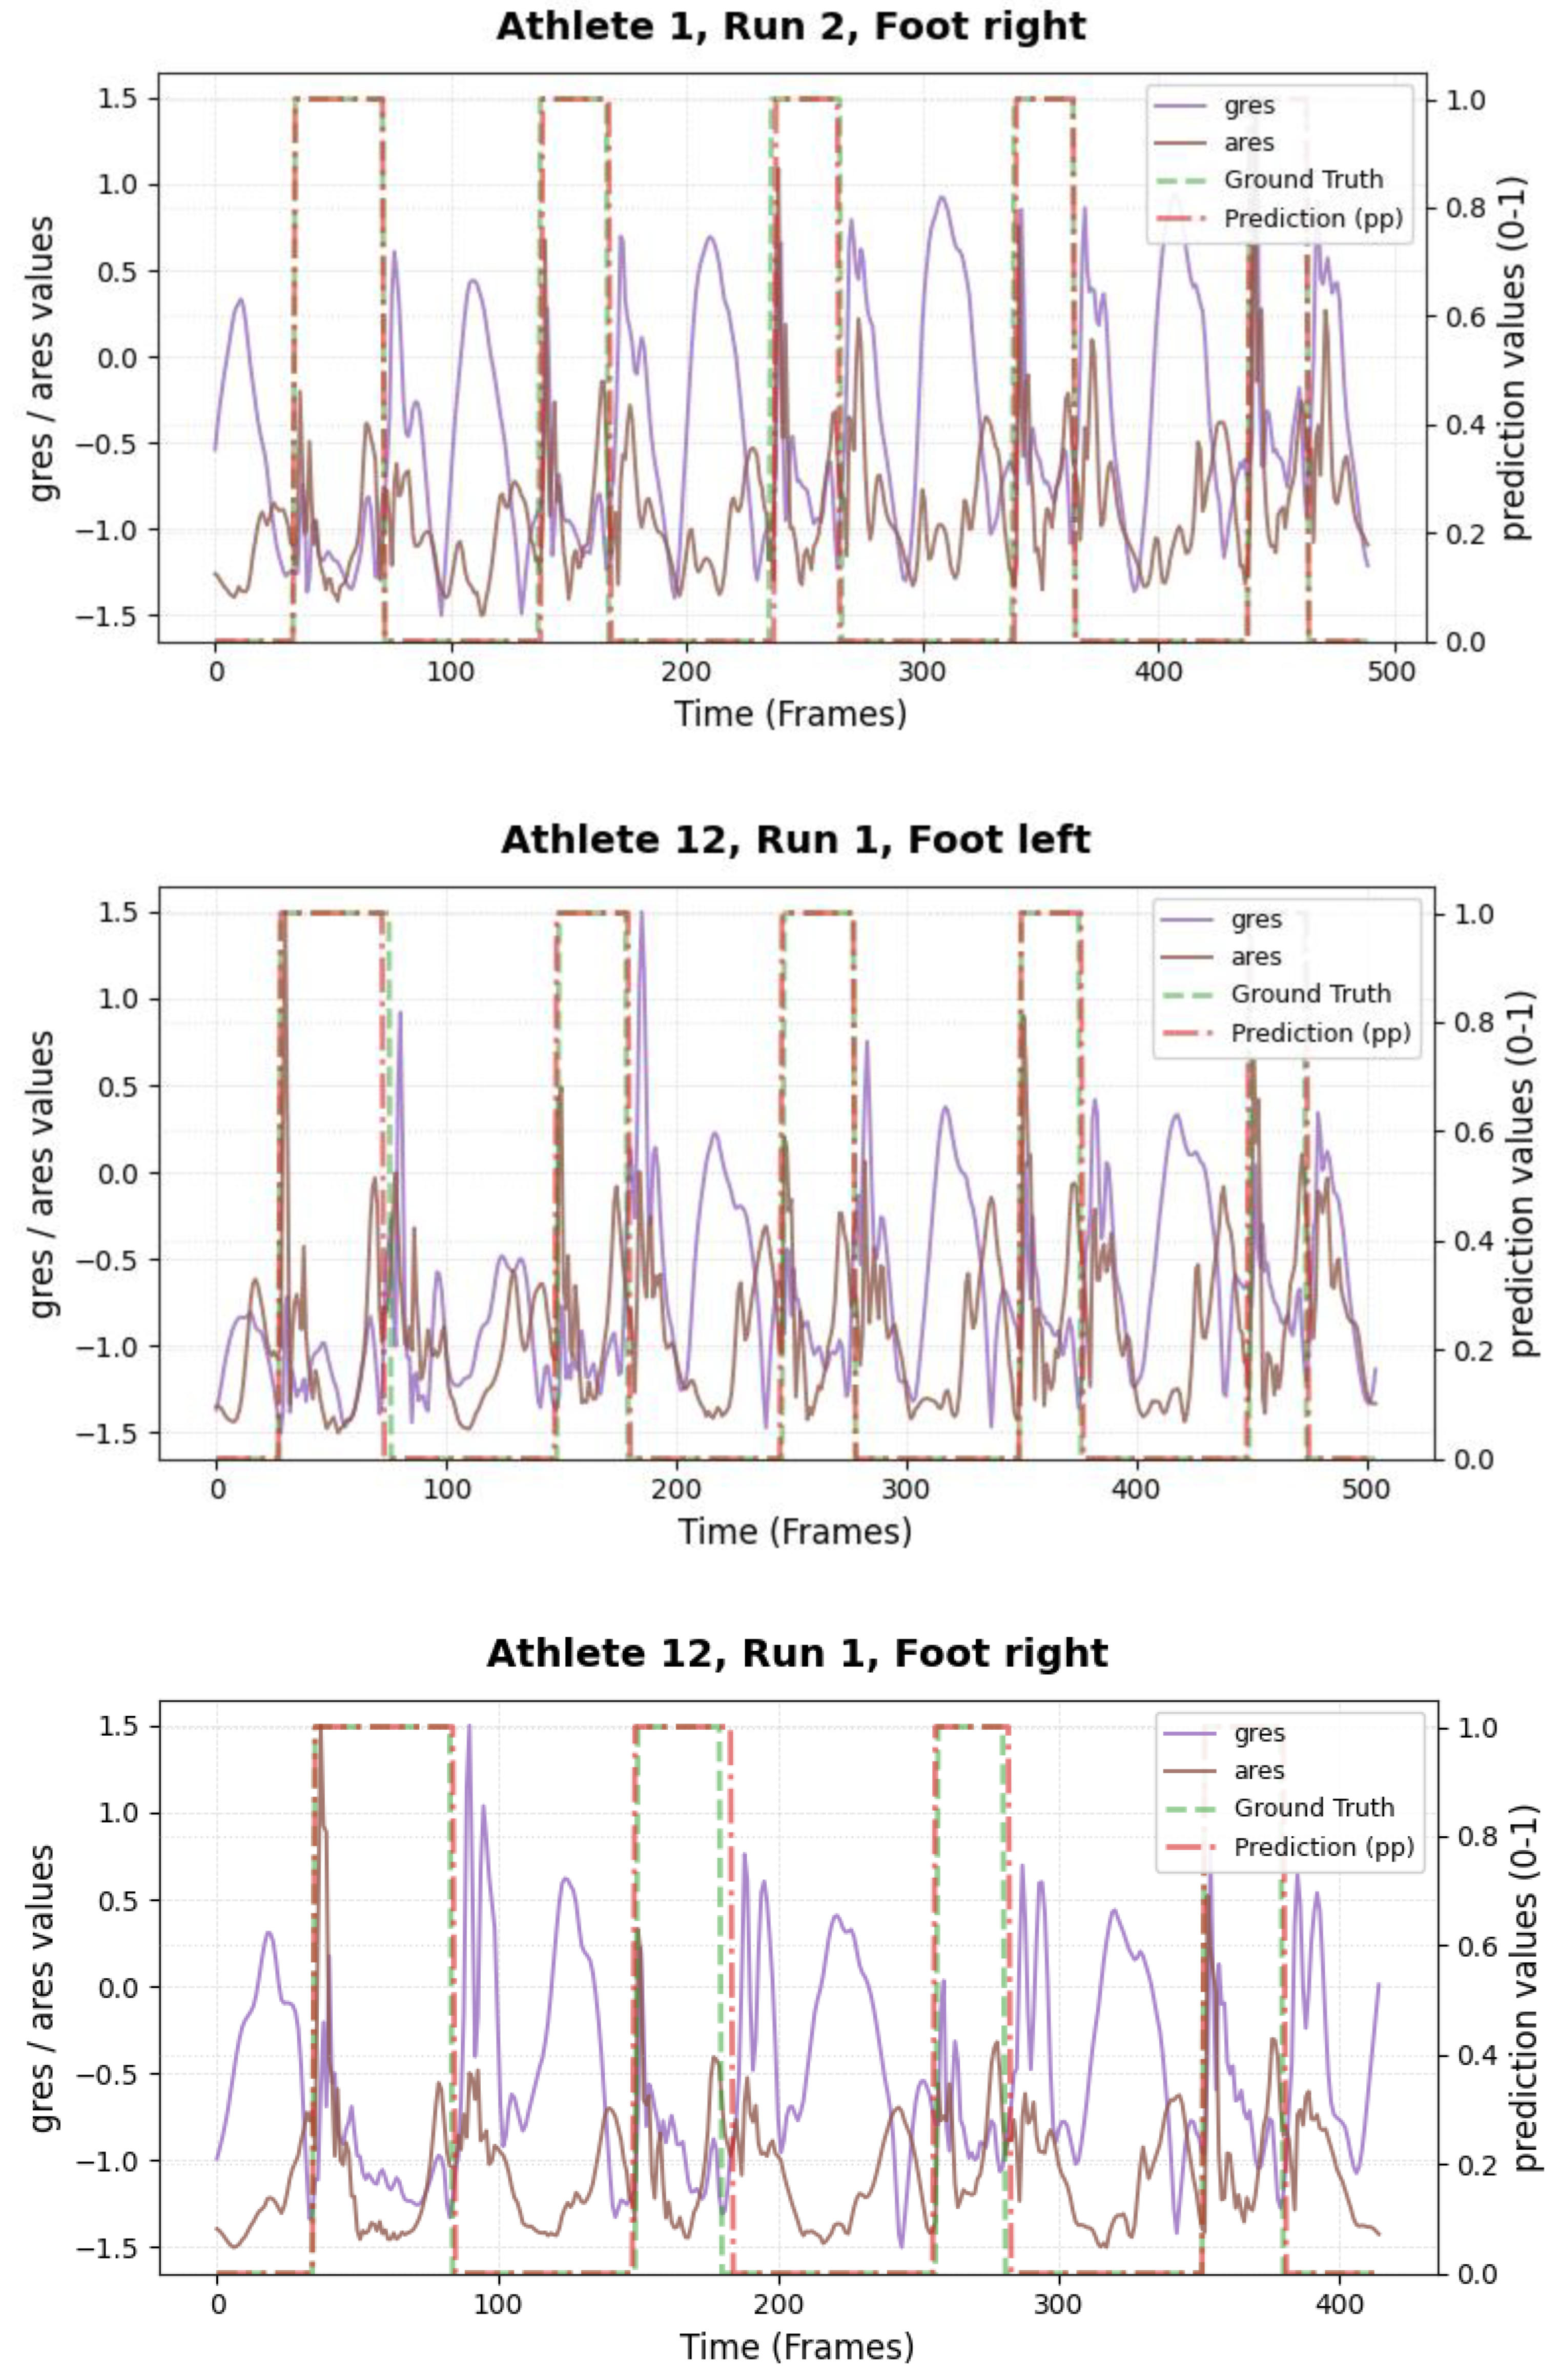
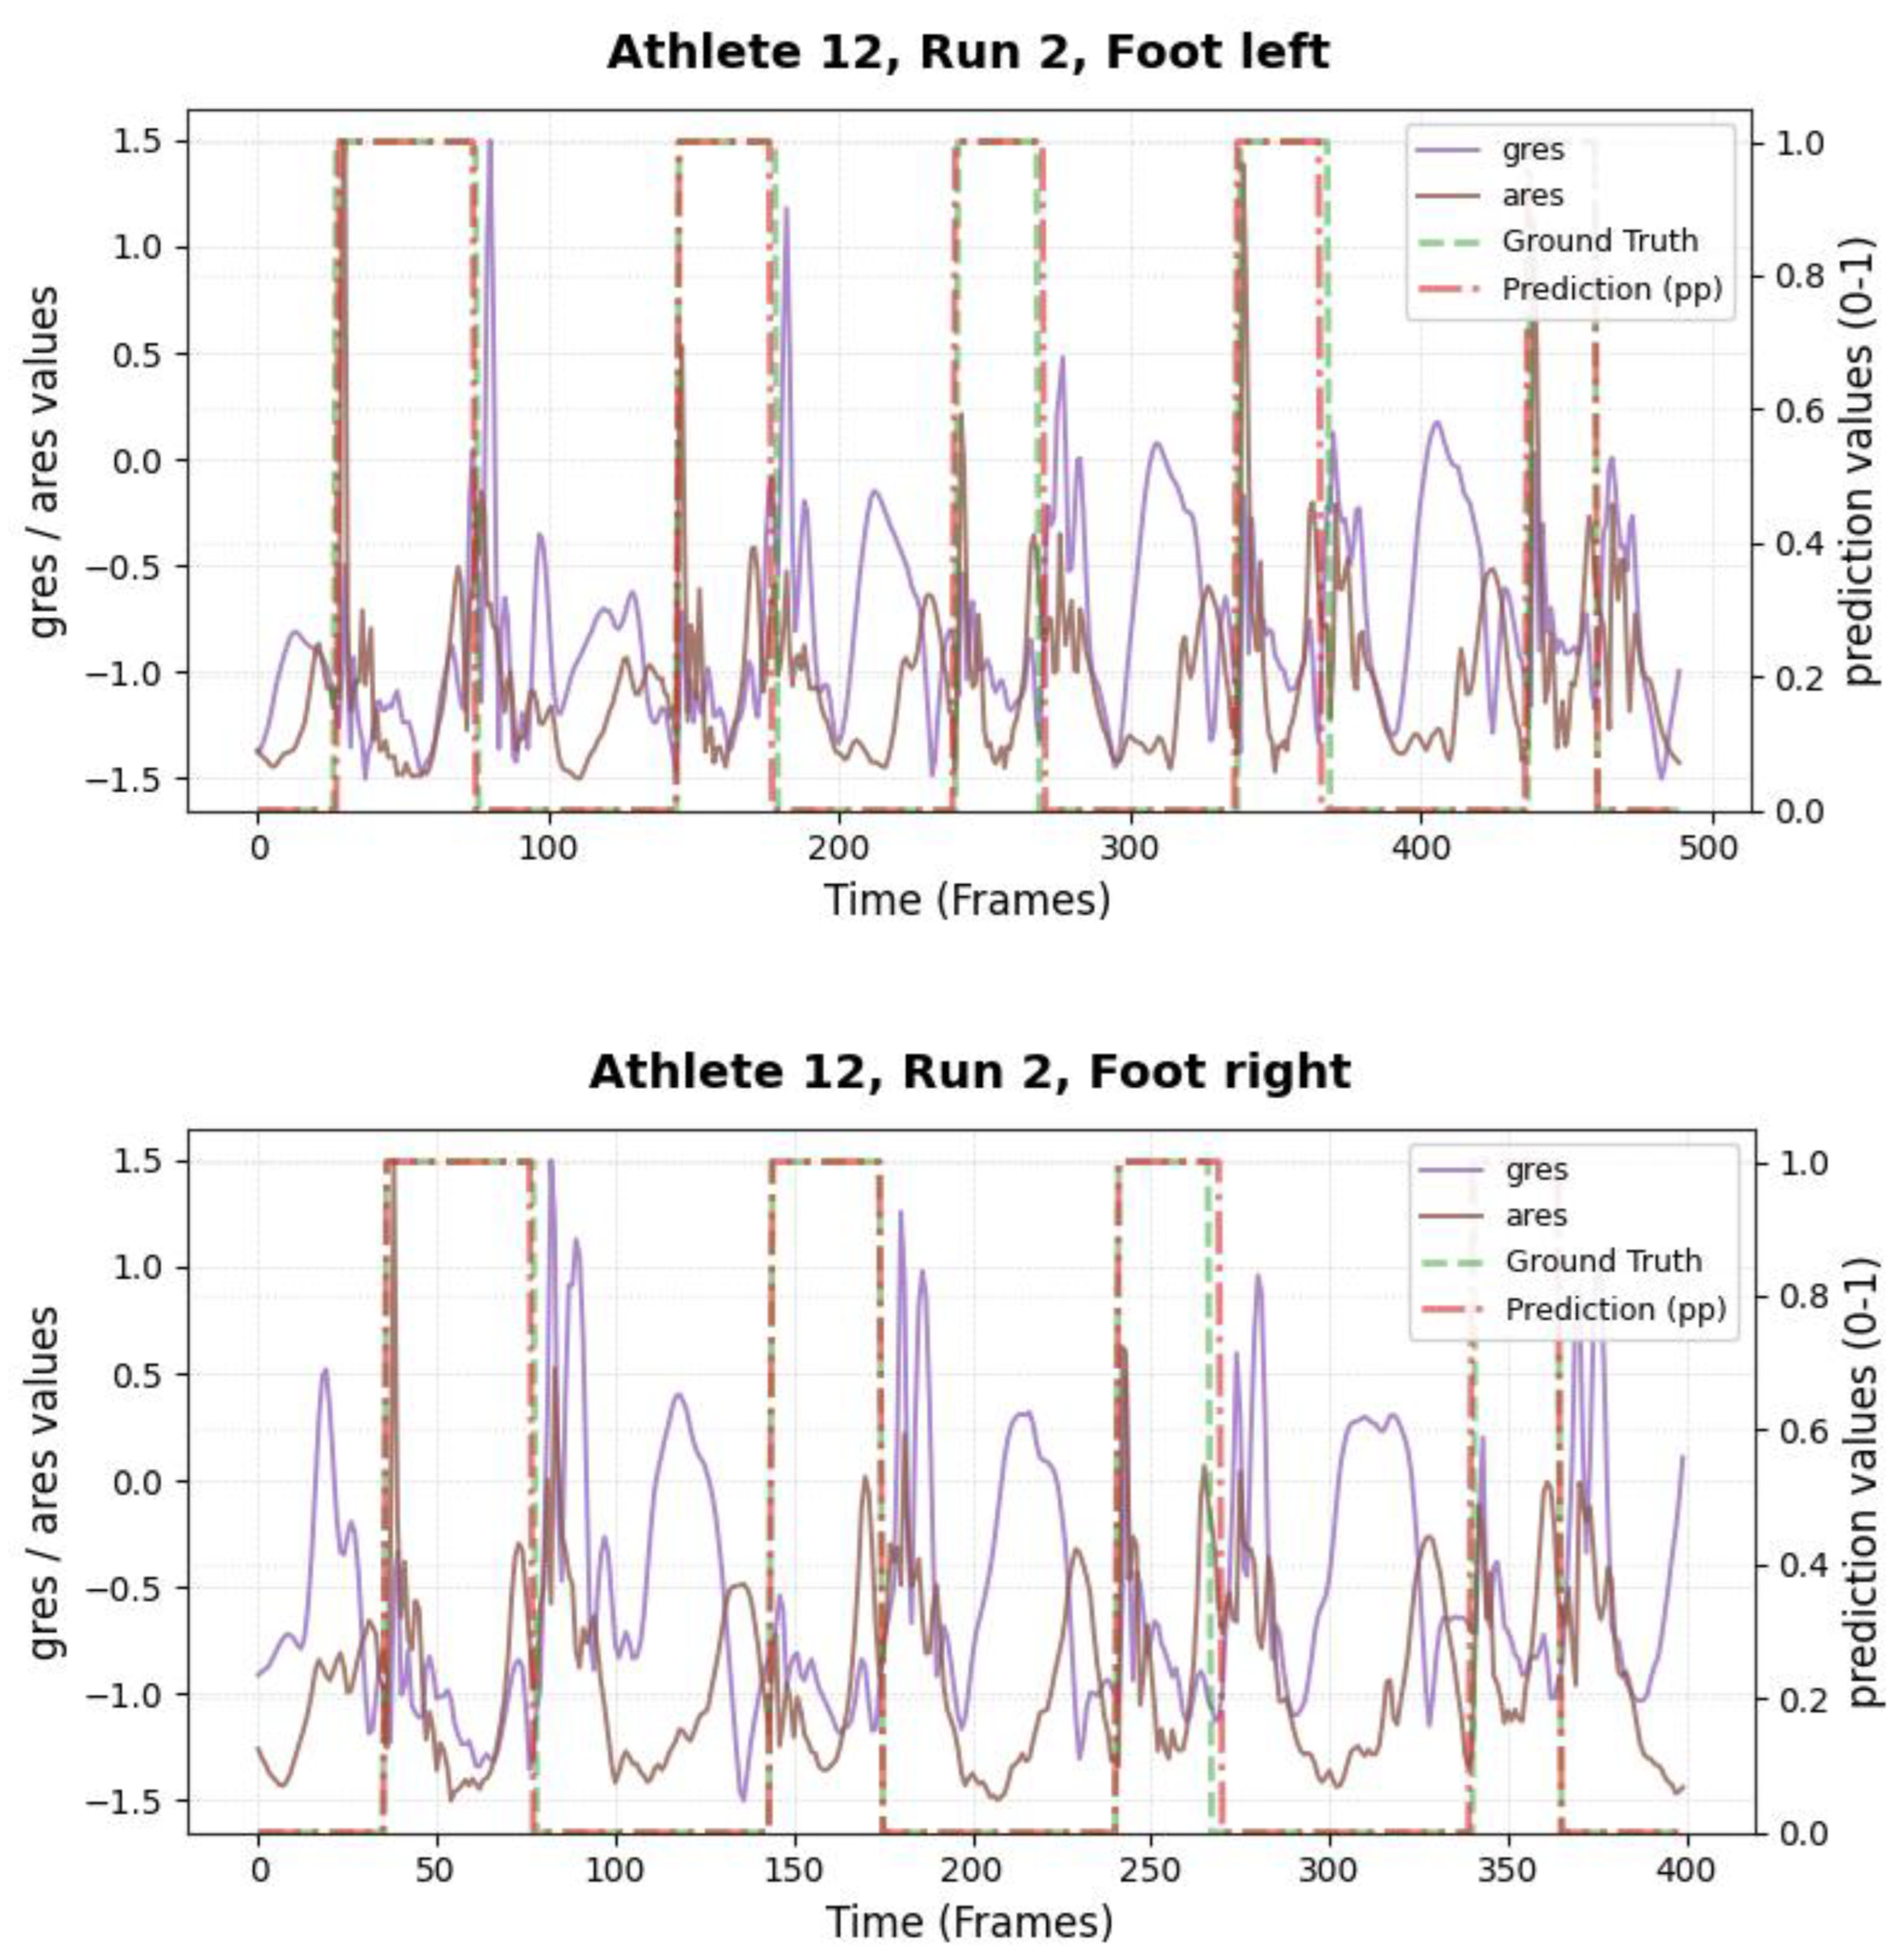
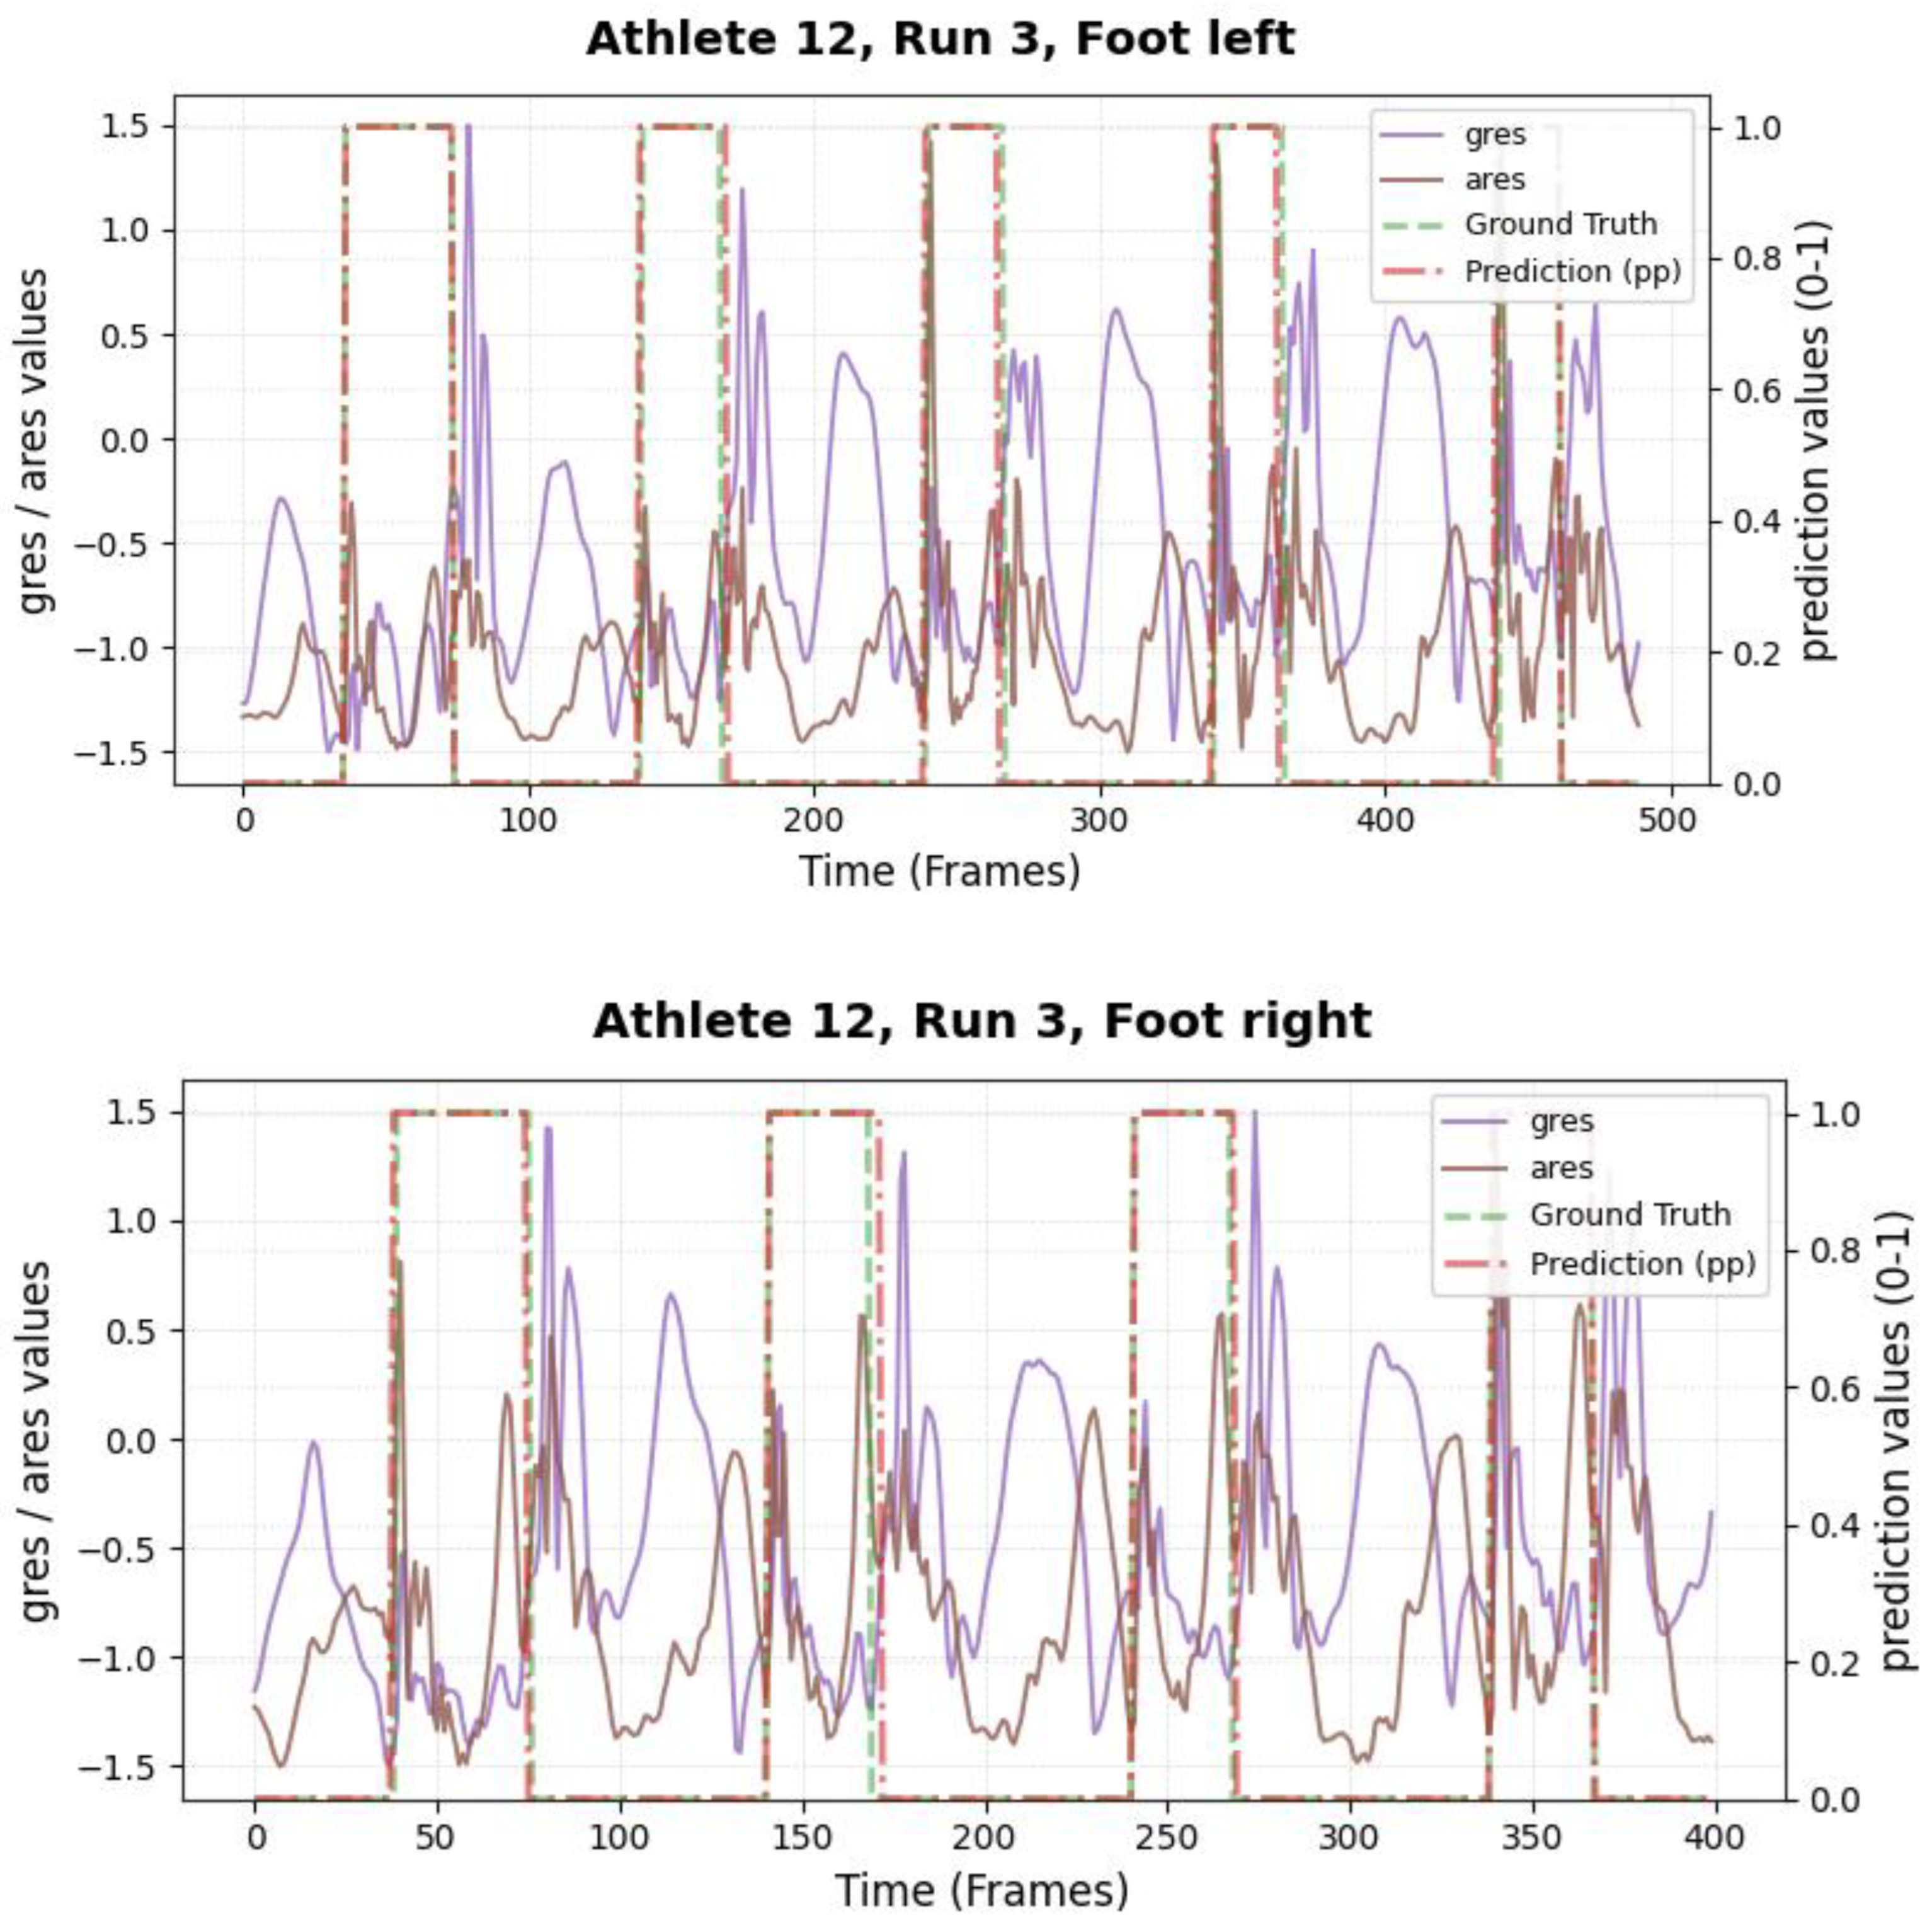
21] pregiven for the hyperparameter tuning, combined with the greatest learning rate of 0.01. With 18 blocks the model apparently benefitted from a deep learning for better performance. The window parameters were tuned to an optimum at a size of 100 datapoints and a stride of 15. Compared to the average contact time of athletes in this study (VAL: 132 ± 30 ms, TEST: 123 ± 31 ms) the window represents more than triple GC time at the measured 250Hz sampling rate (100 datapoints equal 400ms). Visual inspection of the complete run data (
Appendix A) indicates that the 100 datapoints window might correspond more closely to the full step cycle, encompassing both GC and flight phases. Gorges et al. (2024) pre-defined their window size according to the length of the classification task and achieved accurate results [
30], while recommending to hypertune the parameter. This study confirms that selecting a window size that captures the full cycle of the task may be beneficial for the model. Looking at the metrics mean and median hausdorff, precision and rand-index, the suggested model performs very well for GC event classification in time-series, although the TEST needed postprocessing to optimize the mean Hausdorff distance. The VAL was relatively stable, in the context of hyperparameter optimization, with the objective to minimize the mean Hausdorff distance. Nevertheless, it could be advisable to apply the preprocessing step prior to the computation of the optimized metric. This ensures that model selection is based on the most representative evaluation of predictive performance, rather than being influenced by easily removable false predictions.
The model achieved mean differences of .70 with LOA 14.39 to -12.98 ms in the VAL and .94 with LOA: 14.68 – 12.81 ms in the TEST and their and mean absolute deviations 5.36 ± 4.55 ms (VAL), 5.53 ± 4.35 ms (TEST). Reflecting a < 5 % MAPE for GC times prediction in both VAL and TEST therefore providing reliable measurement accuracy. The IC and TC boxplots (
Figure 2) reveal the remaining deviations are more based on inaccuracies in the TC detection which is coherent with previous literature [
4,
25]. In comparison with heuristic algorithms for GC detection in sprinting the model performs similar or better than current research. Across all running phases in elite sprinters 100m runs mean absolute time deviations of 5.46 ± 4.55 ms were observed [
20]. In 50m maximum accelerated sprinting two IMU systems with sampling frequency of 240Hz and 1000Hz had a significant mean bias of 4 ms (trivial correlation) and 3 ms (moderate correlation) for the step-specific mean ground contact times compared against force plates [
22]. Research for the maximum speed phase showed mean differences of -2.5 ± 4.8 ms (LOA: -11.8 to 6.8 ms) [
19] or within a range of ± 5 ms and LOA approximately at 15-30ms for elite and amateur sprinters [
24]. A focused analysis of the acceleration phase reveals that the proposed model achieves performance similar, or superior to previously reported approaches. Purcell et al. (2006) reported -8 ± 17.64 ms for the first step, -2 ± 9.8 ms for the third and 0 ± 1.96 ms for the fifth step in maximum sprints [
23] and Miranda-Oliveira et al. (2023) mean deviations of -71 ± 70.3 ms (LOA) for steps within the first 10m [
21]. A machine learning algorithm (bidirectional LSTM) also performed worse than the proposed algorithm with 5 ± 42 ms mean difference and LOA [
26].
The proposed model achieved a GC event detection rate of 100% in both the VAL and TEST datasets after postprocessing. To the best of the authors’ knowledge, no previous study has reported a comparable detection rate for ground contact events in sprinting. The reference detection rates range between 93 and 98% over all phases [
19,
20,
21,
23]. Furthermore, detection rates within the initial acceleration phase, as examined in this study, are typically even lower, e.g. missing 6.47% for the first 5 steps or 7% in the first 10m [
20,
21]. Even machine-learning approaches specifically developed for ground contact detection, rather than for GC time accuracy optimization, have reported failure rates of around 3% [
25].
Heuristic approaches, which rely on pattern interpretation within IMU signals, cannot ensure that the detected events truly correspond to those in the reference system. This limitation arises from athlete specific movement technique [
19], the segment of IMU attachment and especially at varying and changing speed levels as minima, maxima, thresholds and time-windows may fluctuate [
4]. Deep learning models based on a synchronized video reference used for model training could provide a better basis for correct GC detection, especially in high-speed sprinting. In future studies this can further be enhanced by athlete-individual model refinement. High-speed video is next to force plates with a low on-step threshold currently the gold standard as a reference tool for GC event detection [
22]. Caution must be taken in elite sports with photoelectronic methods as they introduce a physically induced error of measuring not ground contact but the foot crossing a photoelectronic barrier which is always a certain distance above ground. Ultimately, the accuracy and the preferred reference method is likely to be dependent on the running surface and might differ between track & field, team sports with natural or artificial grass, sports hall indoor or even iced surfaces as in bobsleigh or skeleton.
Accurate GC time measurement is more important in maximum effort sprinting than in regular running or gait as GC times are shorter. Minimum mean GC time was 94 ± 6 ms in the TEST at step 9 and can come down to 90 ms in elite sprinters [
20]. For higher accuracy the sampling frequency appears to be crucial. Frame perfect detections of both IC and TC events mean the true event is within up to ± 2 frame if it is at the edges of the time between the two event defining frames (up to 1 frame too early for IC and 1 too late for TC). For 94 ms GC this equals to an error percentage up to: 2 / sampling frequency step (in ms) / 94 ms. The true GC time error percentage is therefore less but up to 21.3% at 100Hz, 8.5% at 250Hz, 4.3% at 500Hz and 2.1% at 1000Hz at frame perfect detection. To ensure being within an 10% error range in short GC times < 100 ms, as observed in maximum sprinting and at elite level, it is therefore recommended to measure at least with 200Hz (= 5 ms frame-to-frame). This study’s sampling rate for both video and IMU were 250Hz incorporating 4-8 ms (< 8.5%) inaccuracies at frame exact level.
The synchronization approach employed in this study was based on the interpretation of foot and corresponding sensor movement during running. Although the applied multi-step cross-correlation method eliminates systematic synchronization errors, it cannot guarantee perfect alignment at a sampling rate of 250 Hz. Remaining, likely unsystematic errors might have undermined the model accuracy as it unsystematically changed the reference GT data points for model learning. Future studies should aim to ensure a more precise synchronization task or implement a dedicated technical synchronization mechanism, although latest is a challenge for portable systems like IMUs as most wireless systems contain a certain degree of signal delay.
The deep learning 1D CNN model applied in this study was based on using inception blocks [
27]. The performance was better than previously used ML models, however, the computational cost of the proposed, or any deep learning, model is referenced as comparably high [
28]. As the literature in TSC is evolving very fast [
28] future models could be used with less computational effort when delivering the same accuracy results. This would allow an easier transfer in real-world applications, which should be the ultimate goal of each GC detection algorithm and IMU usage in applied sprinting, although currently most are only used indoors or on treadmills [
6].
The model was trained on data of different athletes and different steps. Athletes’ sprinting biomechanics may have been slightly affected by the 1.5 kg resistance applied by the attached 1080 Sprint device for velocity measurements. However, this is not expected to have influenced the ground contact detection results. Owing to the measurement settings with a small intra-athlete sample size the data is not large enough to fully conduct an athlete or step-specific statistical analysis. Future research could build on this and conduct research on higher sample sizes to gain further insights on athlete or step-specific patterns and model prediction accuracies.
5. Conclusions
The proposed model, after postprocessing, achieved a 100% GC detection rate in the acceleration phase of a sprint, outperforming both heuristic and previously published machine learning approaches. The observed mean absolute deviations and limits of agreement match the values reported in current state-of-the-art GC time detection studies over all sprinting phases and surpass the values reported specifically for the more challenging condition of the acceleration phase. The model additionally maintained consistent performance between VAL and TEST datasets, suggesting robust generalization and transferability to real-life application. With ongoing advances in time-series classification models, researchers should remain attentive to emerging architectures that offer comparable accuracy with greater efficiency. Combined with broader datasets across athletes and sprint phases, these developments could further enhance model generalization.
In summary, the findings highlight the strong potential of deep learning–based time-series models for IMU-driven GC detection in acceleration phase of sprinting. Such models represent a promising step toward reliable, field-applicable biomechanical monitoring tools for sprint performance analysis.
Author Contributions
Conceptualization, F.F., T.M. and J.E-N.; data curation, F.F. and T.M.; formal analysis, F.F.; funding acquisition, J.E-N.; investigation, F.F., T.M.; methodology, F.F.; project administration, J.E-N.; resources, J.E-N.; software: F.F.; supervision, Felix Fried, T.M., J.E-N..; validation, F.F. and T.M.; visualization, F.F.; writing—original draft preparation, F.F..; writing—review and editing, F.F., T.M. and J.E-N.; All authors have read and agreed to the published version of the manuscript.
Funding
This Project was supported by the Federal Ministry for Economic Affairs and Climate Action (BMWK) on the basis of a decision by the German Bundestag. The project was part of the Central Innovation Program for SMEs – project for R&D cooperation projects by the Federal Ministry for Economic Affairs and Climate Action (BMWK); grant number: KK5119803BM3, granting institution: AiF Projekt GmbH.
Institutional Review Board Statement
The study was conducted in accordance with the Declaration of Helsinki, and approved by the Institutional Ethics Committee of Otto-von-Guericke University (protocol code 27/25 and date of approval 10.03.2025)
Informed Consent Statement
Informed consent was obtained from all subjects involved in the study.
Data Availability Statement
Acknowledgments
We acknowledge the support from the athletes, coaches and employees of the Olympic Training Center in Sachsen-Anhalt e.V. and FC Magdeburg athletics club, Magdeburg, Germany. During the preparation of this manuscript/study, the author(s) used ChatGPT V5 for the purposes of vibe coding assistance and english article text improvement. The authors have reviewed and edited the output and take full responsibility for the content of this publication.
Conflicts of Interest
The authors declare no conflicts of interest. The funders had no role in the design of the study; in the collection, analyses, or interpretation of data; in the writing of the manuscript; or in the decision to publish the results.
Abbreviations
The following abbreviations are used in this manuscript:
| GC |
Ground contact |
| IC |
Initial contact |
| TC |
Terminal contact |
| IMU |
Inertial measurement unit |
| 1D-CNN |
One-dimensional convolutional neural network |
| CNN |
Convolutional neural network |
| LSTM |
Long short-term memory network |
| TSC |
Time series classification |
| aRES
|
Resultant acceleration |
| ωRES
|
Resultant angular velocity |
| GT |
Ground Truth |
| PRED |
Prediction |
| TRAIN |
Training dataset |
| VAL |
Validation dataset |
| TEST |
Test dataset |
| pp |
postprocessed |
| ES |
Effect size |
| LOA |
Limits of agreement |
Appendix A
A.1. Athlete – Run – Leg Specific Data and Model Predictions for VAL
A.2. Athlete – Run – Leg Specific Data and Model Predictions for TEST
References
- Camomilla, V.; Bergamini, E.; Fantozzi, S.; Vannozzi, G. Trends Supporting the In-Field Use of Wearable Inertial Sensors for Sport Performance Evaluation: A Systematic Review. Sensors 2018, 18, 873. [Google Scholar] [CrossRef]
- Haugen, T.; Seiler, S.; Sandbakk, Ø.; Tønnessen, E. The Training and Development of Elite Sprint Performance: an Integration of Scientific and Best Practice Literature. Sports Med. Open 2019, 5, 44. [Google Scholar] [CrossRef]
- Moura, T.B.M.A.; Leme, J.C.; Nakamura, F.Y.; Cardoso, J.R.; Moura, F.A. Determinant biomechanical variables for each sprint phase performance in track and field: A systematic review. International Journal of Sports Science & Coaching 2024, 19, 488–509. [Google Scholar] [CrossRef]
- Mendicino, M.; Palha de Araújo dos Santos, José Miguel; Margheriti, P. ; Zaffagnini, S.; Di Paolo, S. Detection of Foot Contact Using Inertial Measurement Units in Sports Movements: A Systematic Review. Applied Sciences 2025, 15, 10250. [Google Scholar] [CrossRef]
- Haugen, T.; McGhie, D.; Ettema, G. Sprint running: from fundamental mechanics to practice-a review. Eur J Appl Physiol 2019, 119, 1273–1287. [Google Scholar] [CrossRef] [PubMed]
- Benson, L.C.; Räisänen, A.M.; Clermont, C.A.; Ferber, R. Is This the Real Life, or Is This Just Laboratory? A Scoping Review of IMU-Based Running Gait Analysis. Sensors (Basel, Switzerland) 2022, 22. [Google Scholar] [CrossRef] [PubMed]
- Adesida, Y.; Papi, E.; McGregor, A.H. Exploring the Role of Wearable Technology in Sport Kinematics and Kinetics: A Systematic Review. Sensors (Basel, Switzerland) 2019, 19. [Google Scholar] [CrossRef]
- Bailey, G.P.; Harle, R. Assessment of Foot Kinematics During Steady State Running Using a Foot-mounted IMU. Procedia Engineering 2014, 72, 32–37. [Google Scholar] [CrossRef]
- Macadam, P.; Cronin, J.; Neville, J.; Diewald, S. Quantification of the validity and reliability of sprint performance metrics computed using inertial sensors: A systematic review. Gait & Posture 2019, 73, 26–38. [Google Scholar] [CrossRef]
- Debaere, S.; Jonkers, I.; Delecluse, C. The contribution of step characteristics to sprint running performance in high-level male and female athletes. J. Strength Cond. Res. 2013, 27, 116–124. [Google Scholar] [CrossRef]
- Mero, A.; Komi, P.V.; Gregor, R.J. Biomechanics of sprint running. A review. Sports Med. 1992, 13, 376–392. [Google Scholar] [CrossRef]
- Maćkała, K.; Fostiak, M.; Kowalski, K. Selected determinants of acceleration in the 100m sprint. J. Hum. Kinet. 2015, 45, 135–148. [Google Scholar] [CrossRef]
- Lieres Und Wilkau, H.C. von; Irwin, G.; Bezodis, N.E.; Simpson, S.; Bezodis, I.N. Phase analysis in maximal sprinting: an investigation of step-to-step technical changes between the initial acceleration, transition and maximal velocity phases. Sports Biomechanics 2020, 19, 141–156. [Google Scholar] [CrossRef]
- Nagahara, R.; Matsubayashi, T.; Matsuo, A.; Zushi, K. Kinematics of transition during human accelerated sprinting. Biol Open 2014, 3, 689–699. [Google Scholar] [CrossRef] [PubMed]
- Nagahara, R.; Matsubayashi, T.; Matsuo, A.; Zushi, K. Kinematics of the thorax and pelvis during accelerated sprinting. J. Sports Med. Phys. Fitness 2018, 58, 1253–1263. [Google Scholar] [CrossRef]
- Nagahara, R.; Naito, H.; Morin, J.-B.; Zushi, K. Association of acceleration with spatiotemporal variables in maximal sprinting. Int J Sports Med 2014, 35, 755–761. [Google Scholar] [CrossRef] [PubMed]
- M. Coh; K. Tomazin. Kinematic analysis of the sprint start and acceleration from the blocks, 2006.
- Hurtado-Perez, A.E.; Toledano-Ayala, M.; Cruz-Albarran, I.A.; Lopez-Zúñiga, A.; Moreno-Perez, J.A.; Álvarez-López, A.; Rodriguez-Resendiz, J.; Perez-Ramirez, C.A. Use of Technologies for the Acquisition and Processing Strategies for Motion Data Analysis. Biomimetics (Basel) 2025, 10. [Google Scholar] [CrossRef] [PubMed]
- Schmidt, M.; Rheinländer, C.; Nolte, K.F.; Wille, S.; Wehn, N.; Jaitner, T. IMU- based Determination of Stance Duration During Sprinting. Procedia Engineering 2016, 147, 747–752. [Google Scholar] [CrossRef]
- Blauberger, P.; Horsch, A.; Lames, M. Detection of Ground Contact Times with Inertial Sensors in Elite 100-m Sprints under Competitive Field Conditions. Sensors 2021, 21, 7331. [Google Scholar] [CrossRef]
- Miranda-Oliveira, P.; Branco, M.; Fernandes, O. Accuracy and Interpretation of the Acceleration from an Inertial Measurement Unit When Applied to the Sprint Performance of Track and Field Athletes. Sensors 2023, 23, 1761. [Google Scholar] [CrossRef] [PubMed]
- van den Tillaar, R.; Nagahara, R.; Gleadhill, S.; Jiménez-Reyes, P. Step-to-Step Kinematic Validation between an Inertial Measurement Unit (IMU) 3D System, a Combined Laser+IMU System and Force Plates during a 50 M Sprint in a Cohort of Sprinters. Sensors 2021, 21, 6560. [Google Scholar] [CrossRef]
- Purcell, B.; Channells, J.; James, D.; Barrett, R. Use of accelerometers for detecting foot-ground contact time during running. BioMEMS and Nanotechnology II 2006, 6036, 603615. [Google Scholar] [CrossRef]
- Bergamini, E.; Picerno, P.; Pillet, H.; Natta, F.; Thoreux, P.; Camomilla, V. Estimation of temporal parameters during sprint running using a trunk-mounted inertial measurement unit. Journal of Biomechanics 2012, 45, 1123–1126. [Google Scholar] [CrossRef]
- Donahue, S.R.; Hahn, M.E. Feature Identification With a Heuristic Algorithm and an Unsupervised Machine Learning Algorithm for Prior Knowledge of Gait Events. IEEE Trans. Neural Syst. Rehabil. Eng. 2022, 30, 108–114. [Google Scholar] [CrossRef]
- Donahue, S.R.; Hahn, M.E. Estimation of gait events and kinetic waveforms with wearable sensors and machine learning when running in an unconstrained environment. Sci Rep 2023, 13, 2339. [Google Scholar] [CrossRef]
- Ismail Fawaz, H.; Lucas, B.; Forestier, G.; Pelletier, C.; Schmidt, D.F.; Weber, J.; Webb, G.I.; Idoumghar, L.; Muller, P.-A.; Petitjean, F. InceptionTime: Finding AlexNet for time series classification No. 6, 2019. Available online: https://arxiv.org/pdf/1909.04939.
- Middlehurst, M.; Schäfer, P.; Bagnall, A. Bake off redux: a review and experimental evaluation of recent time series classification algorithms. Data Min Knowl Disc 2024, 38, 1958–2031. [Google Scholar] [CrossRef]
- Xu, M.; Chen, X.; Sun, A.; Zhang, X.; Chen, X. A Novel Event-Driven Spiking Convolutional Neural Network for Electromyography Pattern Recognition. IEEE Trans. Biomed. Eng. 2023, 70, 2604–2615. [Google Scholar] [CrossRef] [PubMed]
- Gorges, T.; Davidson, P.; Boeschen, M.; Hotho, A.; Merz, C. IMU Airtime Detection in Snowboard Halfpipe: U-Net Deep Learning Approach Outperforms Traditional Threshold Algorithms. Sensors (Basel, Switzerland) 2024, 24. [Google Scholar] [CrossRef]
- Chow, D.H.K.; Tremblay, L.; Lam, C.Y.; Yeung, A.W.Y.; Cheng, W.H.W.; Tse, P.T.W. Comparison between Accelerometer and Gyroscope in Predicting Level-Ground Running Kinematics by Treadmill Running Kinematics Using a Single Wearable Sensor. Sensors (Basel, Switzerland) 2021, 21. [Google Scholar] [CrossRef]
- Hur, B.; Baek, S.; Kang, I.; Kim, D. Learning based lower limb joint kinematic estimation using open source IMU data. Sci Rep 2025, 15, 5287. [Google Scholar] [CrossRef] [PubMed]
- Mohammadi Foumani, N.; Miller, L.; Tan, C.W.; Webb, G.I.; Forestier, G.; Salehi, M. Deep Learning for Time Series Classification and Extrinsic Regression: A Current Survey. ACM Comput. Surv. 2024, 56, 1–45. [Google Scholar] [CrossRef]
- Ismail-Fawaz, A.; Devanne, M.; Berretti, S.; Weber, J.; Forestier, G. Look into the LITE in deep learning for time series classification. Int J Data Sci Anal 2025, 20, 4029–4049. [Google Scholar] [CrossRef]
- Foumani, N.M.; Miller, L.; Tan, C.W.; Webb, G.I.; Forestier, G.; Salehi, M. Deep Learning for Time Series Classification and Extrinsic Regression: A Current Survey, 2023. Available online: http://arxiv.org/pdf/2302.02515.
- Majumdar, A.S.; Robergs, R.A. The Science of Speed: Determinants of Performance in the 100 m Sprint. International Journal of Sports Science & Coaching 2011, 6, 479–493. [Google Scholar] [CrossRef]
- Lee, H.; Shin, D. Beyond Information Distortion: Imaging Variable-Length Time Series Data for Classification. Sensors (Basel, Switzerland) 2025, 25. [Google Scholar] [CrossRef]
- Halilaj, E.; Rajagopal, A.; Fiterau, M.; Hicks, J.L.; Hastie, T.J.; Delp, S.L. Machine learning in human movement biomechanics: Best practices, common pitfalls, and new opportunities. Journal of Biomechanics 2018, 81, 1–11. [Google Scholar] [CrossRef]
- Cohen, J. Statistical Power Analysis for the Behavioral Sciences; Routledge, 2013, ISBN 9780203771587.
- Martin Bland, J.; Altman, D. STATISTICAL METHODS FOR ASSESSING AGREEMENT BETWEEN TWO METHODS OF CLINICAL MEASUREMENT. The Lancet 1986, 327, 307–310. [Google Scholar] [CrossRef]
- Hopkins, W.G.; Marshall, S.W.; Batterham, A.M.; Hanin, J. Progressive statistics for studies in sports medicine and exercise science. Med. Sci. Sports Exerc. 2009, 41, 3–13. [Google Scholar] [CrossRef]
|
Disclaimer/Publisher’s Note: The statements, opinions and data contained in all publications are solely those of the individual author(s) and contributor(s) and not of MDPI and/or the editor(s). MDPI and/or the editor(s) disclaim responsibility for any injury to people or property resulting from any ideas, methods, instructions or products referred to in the content. |
© 2025 by the authors. Licensee MDPI, Basel, Switzerland. This article is an open access article distributed under the terms and conditions of the Creative Commons Attribution (CC BY) license (http://creativecommons.org/licenses/by/4.0/).