Submitted:
01 December 2025
Posted:
02 December 2025
You are already at the latest version
Abstract
This paper explores the market linkage from the two perspectives of the correlation structure and risk contagion between internet finance and traditional finance. Using the time-varying t-Copula-GARCH model, the paper measures the correlation between internet finance and traditional financial markets including stocks, banks, and bonds. It also applies the BP structural breakpoint test to verify and analyze the risk contagion between internet finance and traditional finance. The empirical analysis shows that the return rates of internet finance, stocks, banking, and bond markets exhibit characteristics of “sharp peaks and fat tails.” Comparatively, internet finance and stock markets have stronger linkage, while the linkage with the banking market is weaker, and the bond market is the weakest. The linkage among stock, bond, and banking markets tends to be positive, indicating that the rise of the internet financial market can, to some extent, boost the stock and banking markets. The relevance between the internet financial market and the bond market is weak and unstable. The results of the structural breakpoint test further confirm the evident risk contagion effects among internet finance, stocks, bonds, and banking markets in traditional finance.
Keywords:
internet finance
; traditional finance
; risk linkage
; t-Copula-GARCH model
; structural breakpoint test
1. Introduction
With the continuous penetration of “Internet Plus” and financial innovation concepts, as well as the steady growth of the internet financial market, the risks present in the market have become increasingly complex and diverse. Internet finance not only possesses the financial risks inherent in traditional finance but also contains non-financial risks absent in traditional finance, and its risk transmission speed is faster than that of traditional finance. Against the backdrop of increasingly diversified financial innovation, it is essential to focus on preventing the risk linkage between internet finance and traditional finance. Therefore, it is necessary to measure and analyze the linkage between the internet financial market and the traditional financial market.
There is extensive research on the relationship and influence between internet finance and traditional finance. Some studies believe that internet finance is an innovation of traditional finance, promoting reform and development in traditional finance and contributing to real economic growth [1]. Other works argue that internet finance and traditional finance exhibit both cooperation and competition, though internet finance often holds a leading position [2]. Another viewpoint suggests that, in the long run, internet finance contributes to the development of the stock market by driving long-term competition and investment inflows into stocks and financial markets [3]. Some researchers consider that the influence of internet finance on commercial banks is both positive and negative. On one hand, it impacts business models, intermediary services, and risk management; on the other hand, it can promote structural adjustments and innovation in banking operations [4]. Others argue that internet finance has a moderate influence on bank profitability, with variations depending on the types of banks [5]. The above studies examine various aspects of the relationship and influence between internet finance and traditional finance, but few provide quantitative analysis.
Existing studies on the linkage between internet finance and traditional finance mostly stay at the level of mechanism analysis and rarely adopt quantitative approaches. Therefore, this paper draws on quantitative methods used in the traditional financial market to measure linkage [6–11], employing the time-varying t-Copula function to estimate the correlation structure between internet finance and traditional financial sectors such as stocks, banking, and bonds. Considering the characteristics of financial market data distribution in the Copula margins, the GARCH model is used for fitting. Structural breakpoint tests are then conducted on the correlation structure to determine whether risk contagion exists in the market.
2. Related Work
Research on financial risk linkage has traditionally centered around the co-movement and volatility transmission between financial markets. Foundational theories suggest that market interdependence often masquerades as contagion, necessitating robust empirical models to distinguish them [12–14]. This has led to the application of advanced econometric models such as structural breakpoint testing [15,16], DCC-GARCH [17], and asymmetric Copula models [18], which enable fine-grained tracking of time-varying and nonlinear dependencies across financial variables [19,20].
To accurately capture tail dependencies and systemic linkages, Copula theory has been extensively adopted. The t-Copula and mixed Copula frameworks allow modeling of fat-tailed and skewed return distributions, which are common in financial markets [21–23]. These models offer better performance than traditional correlation-based approaches, especially when applied to datasets with structural breaks or volatility clustering [24,25].
Parallel to these econometric advances, the growing complexity of internet finance has reshaped traditional risk structures. Recent studies emphasize how digital financial platforms influence stock and bond markets through structural innovation and information dissemination [26,27]. The duality of competition and cooperation between digital and traditional finance has introduced new dimensions to systemic risk evaluation [28–30]. Financial reforms driven by internet finance have also affected the profitability and strategic positioning of commercial banks [31,32], particularly in areas such as risk transmission and service decentralization [33,34].
Simultaneously, the development of data-driven techniques has transformed financial risk modeling. Machine learning models—especially deep learning frameworks—have shown strong capacity for structured anomaly detection, time-series forecasting, and volatility estimation [35–37]. These include knowledge-enhanced systems, federated contrastive learning, and meta-learning for fraud detection, which are particularly useful in high-dimensional, imbalanced financial environments [38–40].
Applications of multi-agent reinforcement learning (MARL) in finance have emerged as an efficient way to optimize dynamic resource allocation and policy adaptation under uncertain market conditions [41–43]. This approach extends to credit risk analysis, microservice optimization, and cloud-native orchestration, where collaborative agents evolve within complex financial ecosystems [44,45].
In the context of financial natural language processing (FinNLP), large language models (LLMs) have enabled advanced tasks such as financial summarization, text generation, and document classification [46-48]. These models integrate modular adapters, structural priors, and contrastive alignment to enhance performance and robustness across domains [49–51]. Although these methodologies often originate from broader AI research, their underlying mechanisms—such as sequence modeling, structure-aware attention, and knowledge graph reasoning—are highly relevant to structured financial risk detection.
Together, these strands of research contribute a multidimensional understanding of financial market risk and digital innovation. Building on these foundations, the present study applies the time-varying t-Copula-GARCH model and structural breakpoint testing to quantitatively examine the risk contagion and correlation structure between internet finance and traditional financial markets, with a focus on stock, banking, and bond sectors.
3. Theoretical Analysis
3.1. Copula Function
The core idea of the Copula function is that a joint distribution can be decomposed into marginal distributions and a Copula function. Essentially, the Copula function can be regarded as a linking function, which connects the joint distribution function with the marginal distributions of each variable, thus characterizing the dependence structure between variables. The main content of Sklar’s theorem is:
Let be the joint distribution of the marginal distributions and . If and are continuous, there exists a unique Copula function such that:
Once the joint distribution is known, the corresponding Copula function can be obtained by combining the marginal distributions. Both and follow uniform distributions on [0,1].
3.2. Copula-GARCH Model
This paper refers to the research in [52,53], which employs GARCH models to fit marginal distributions and then selects appropriate Copula functions to construct the Copula-GARCH model. Considering parameter estimation and information loss, this paper sets the GARCH model as GARCH(1,1). Two assumptions are made for the residuals: one is normal distribution, and the other is t-distribution. As this study focuses on the relationship between internet finance and traditional finance, only the bivariate Copula function is involved. The Copula-GARCH model is expressed as follows:
Assuming are two return series following the GARCH model, the GARCH(1,1) model is:
Here, denotes any bivariate Copula function, and represent the standard normal and t-distribution functions for the residuals estimated from the GARCH model.
3.3. Time-Varying Copula-GARCH Model
This paper uses the time-varying t-Copula function to depict the changing dependency structure among different financial markets, specifically referring to equations (8) and (9), where the function is set as the t-Copula function. The t-Copula function is based on the t-distribution, enabling the depiction of time-varying correlation. Although other forms of Copula functions can also describe changing dependency structures, this paper mainly focuses on symmetric dependency and thus uses the t-Copula function. The bivariate t-Copula is defined as:
In Equation (10), denotes the linear correlation between internet finance and traditional financial markets, and d is the degrees of freedom of the t-Copula function.
Since the parameters of the Copula function may vary over time, time-varying Copula models provide a more accurate depiction of dynamic correlation structures. This paper uses the DCC (Dynamic Conditional Correlation) model proposed in [54] to describe this process:
In Equation (11), is the standardized residual series from the Copula model, and is the unconditional covariance matrix of the residuals. As the Copula function is bivariate, is a 2 × 2 correlation matrix, and its elements are the time-varying correlation coefficients. The DCC(1,1) model requires the condition:
The parameter estimation of the Copula function commonly uses a two-step maximum likelihood method, which is adopted here. The first step estimates the marginal distribution parameters , and the second step estimates the parameters of the Copula function based on the estimated marginals. The likelihood function for the bivariate t-Copula function used in this paper is:
Here, d is the degrees of freedom, the marginal distributions, and R the correlation matrix. The parameters d, , and are obtained from equations (11) and (13).
3.4. BP Structural Breakpoint Test
This paper adopts the structural break test proposed in [55], which tests for structural breaks in the correlation between internet finance and traditional finance to determine the presence of risk contagion. The test rationale is as follows: First, assume no structural breaks in the time series and conduct a hypothesis test. If the null hypothesis is rejected, structural breaks are presumed to exist. Second, test whether there are breakpoints (i.e., m structural breaks). The breakpoints are identified if the sum of squared residuals under breakpoints is significantly smaller than that under m breakpoints. If not, the procedure stops.
In this paper, let be the dynamic correlation series calculated from the Copula function for the internet finance and stock, bank, and bond markets. If m structural breakpoints exist, the equation is:
where , is the mean of each segment. The goal of the test is to find the breakpoints that minimize:
Following [19], this paper sets the maximum number of breakpoints .
4. Empirical Analysis
4.1. Data Sources and Preliminary Analysis
4.1.1. Data Sources
This paper mainly analyzes the linkage relationships among the internet financial market and the traditional financial markets of banking, stocks, and bonds. The “CSI Internet Finance Index” is selected to represent the internet financial market in China. The “CSI Internet Finance Index” is a stock index comprising 86 listed companies engaged in internet finance-related businesses.
The “SSE Composite Index,” “CSI Aggregate Bond Index,” and “CSI Bank Index” are selected to represent the traditional financial markets of stocks, bonds, and banking, respectively. To ensure consistency among different indices, this paper selects the period from July 2, 2012 to September 1, 2020, and uses the daily closing prices corresponding to the index dates to calculate returns. A total of 1990 observations are obtained. The data is sourced from the Wind database. Based on the closing prices adjusted for rights, the logarithmic daily returns are calculated as follows:
Here, represents the return rate of the financial market, including internet finance, stock, banking, and bond markets in this study. is the closing price of market i on day t, and is the closing price of market i on the previous trading day.
4.1.2. Descriptive Statistical Analysis
This paper conducts a descriptive statistical analysis of return rates in the internet finance market, stock market, banking market, and bond market. The results are shown in Table 1.
From the results in Table 1, it can be seen that the internet finance market has significantly higher mean, median, and volatility in return rates compared to the stock, banking, and bond markets. Higher returns are often accompanied by higher risks, indicating that internet finance carries higher risk relative to traditional finance.
Examining the skewness, kurtosis, and the kernel density curves in Figure 1, the return series in all four financial markets exhibit the characteristic of “peakedness and fat tails.” The JB test statistic shows a p-value of 0 for all four markets, indicating that the return series in these financial markets do not follow a normal distribution.
4.1.3. Stationarity Test
To avoid spurious regression in the research results, it is necessary for return series to satisfy the condition of stationarity. For the internet finance market, stock market, banking market, and bond market, the stationarity of the return series is determined using unit root tests. The test results are shown in Table 2.
The p-values of the unit root tests for the four financial markets are all less than 0.01, indicating rejection of the null hypothesis at the 1
4.2. t-Copula-GARCH Model Fitting and Analysis
4.2.1. Fitting of Marginal Distributions
This paper uses the GARCH(1,1) model and fits the residuals to both normal and t-distributions. Based on the AIC or SC information criteria, the optimal marginal distribution is selected according to the parameter significance and model effectiveness.
From the fitting results, the GARCH(1,1)–t model performs better than the GARCH(1,1)–N model in terms of parameter significance and AIC, SC criteria, indicating that the residuals are better described by the t-distribution. Additionally, the ARCH–LM test p-values are all greater than 0.05, which confirms the validity of the constructed GARCH model. Therefore, the GARCH(1,1)–t model is selected to fit the marginal distribution of the Copula function. The fitting results are shown in Table 3.
The parameter estimates of the marginal distributions are reported in Table 4.
4.3. Establishment of the t-Copula Function
The residual series of the return rates from the internet finance market, stock, bond, and banking markets are modeled using GARCH(1,1)–t models. Standardized residuals are then processed via probability integral transformation to convert them into uniformly distributed variables in the (0,1) interval. This transformation is achieved using the empirical cumulative distribution function (empirical CDF), defined as:
Here, T denotes the total number of observations. The transformed series is tested using the Kolmogorov–Smirnov (K–S) test for uniformity. The resulting p-values are all greater than 0.05, so the null hypothesis cannot be rejected at the 5
4.3.1. Parameter Estimation of the t-Copula Function
Based on the fitted marginal distributions and transformed series, both static and time-varying t-Copula functions are estimated. The results are presented in Table 5.
As shown in Table 5, regardless of whether static or time-varying t-Copula functions are used, all parameters are statistically significant at the 1% level. In the three time-varying models, the values of are small but significant, indicating the time-varying dependency structure is relatively stable. The values of are large, showing strong persistence in the dependency between the internet finance market and the other three financial markets.
Comparing static and time-varying models, the time-varying models have better fit based on both AIC and BIC values. The log-likelihood values of time-varying models are also higher than those of static models. Overall, the time-varying t-Copula function outperforms the static one.
Based on the time-varying Copula models, the dynamic correlation coefficients between the internet finance market and the other three markets can be calculated. Table 6 summarizes the descriptive statistics of the dynamic correlations, and Figure 2 presents their evolution over time.
It can be seen that the internet finance market is most strongly correlated with the stock market, followed by the banking market, and least with the bond market. The mean dynamic correlation with the stock market is 0.8161, with a median of 0.8486. This is much higher than its correlation with banking (mean: 0.4608, median: 0.4709) and bonds (mean: -0.0324, median: -0.0151).
The banking correlation shows higher fluctuation, suggesting potential hidden risk factors. The correlation with bonds is weak and shows greater directional change over time. From Figure 2, the dynamic correlations mostly remain positive from July 2012 to September 2020, suggesting generally positive correlations among these markets.
4.4. BP Structural Breakpoint Test
Based on the dynamic correlation series between the internet finance market and the other three markets, this paper adopts the structural break test method proposed in [56] to detect structural breakpoints. If the correlation series exhibits breakpoints, it indicates that there is a risk contagion effect among different financial markets. In other words, when one market experiences a risk event, the risk may spread to others.
Using EViews 11, the number and timing of structural breaks in the dynamic correlation series are determined. The results are shown in Figure 2 and Table 7.
This paper interprets the structural breakpoints from the perspective of the development of the internet finance market and risk contagion. As shown in Table 7, there are four structural breakpoints between the internet finance market and the stock, banking, and bond markets, indicating that risk contagion exists between internet finance and traditional financial markets.
In summary, there is clear evidence of risk contagion between the internet finance market and traditional financial markets. Among them, the linkage between the internet finance market and the stock and banking markets is more significant, showing strong risk interdependence. Although the bond market exhibits weaker correlation, since June 2018, the trend of increasing dynamic correlation has become more apparent.
5. Conclusion
This paper investigates the risk linkage between the internet finance market and traditional stock, banking, and bond markets using the time-varying t-Copula–GARCH model. The main conclusions are as follows:
(1) After performing descriptive statistics on the return rates of the four financial markets, it is found that all markets exhibit the characteristic of “peakedness and fat tails.” Through comparison between static and time-varying t-Copula models, the time-varying model performs better. Based on the estimated parameters, the persistence parameter in the time-varying t-Copula model is relatively high for the relationships between the internet finance market and the stock, banking, and bond markets. This indicates that the linkage between the internet finance market and the other three markets is relatively persistent.
(2) According to the dynamic correlation coefficients estimated between the internet finance market and the stock, banking, and bond markets, the strongest correlation is observed with the stock market, followed by the banking market, and the weakest with the bond market. The correlations between the internet finance market and the stock and banking markets are generally positive, meaning the development of internet finance can promote the development of the stock and banking markets to a certain extent. The correlation with the bond market, although weaker, includes both positive and negative directions, with both being relatively small in magnitude. However, since June 2018, the negative correlation has shown signs of strengthening. Therefore, investors may consider the bond market as a risk-hedging tool when risks arise in the internet finance market.
This paper applies the BP structural breakpoint test to further verify the presence of risk contagion among the internet finance market and the stock, banking, and bond markets. It confirms that there are contagion effects between these markets. In particular, the linkage between the internet finance market and the stock market is the strongest. Against the backdrop of preventing systemic financial risk, more attention should be paid to the monitoring and early warning of risk spillover between these two markets.
References
- Yu, Y. The impact of Internet finance on the development strategy of traditional finance in China[D]. Harbin Institute of Technology, Harbin, China, 2015.
- Mo, Y. Competition and cooperation between traditional finance and Internet finance. Finance Monthly 2014. [Google Scholar]
- Wang C, Wang L. Internet finance, stock market and macroeconomy—empirical research based on SVAR model. Contemporary Finance and Economics 2018. [Google Scholar]
- Xu, Y. Development strategy research on commercial banks under the Internet finance environment[D]. Huazhong University of Science and Technology, Wuhan, China, 2019.
- Chen, H. Impact of Internet finance on profitability of different types of commercial banks in China[D]. Southwestern University of Finance and Economics, Chengdu, China, 2019.
- Joe, H. Multivariate Models and Dependence Concepts[M]. Boca Raton: Chapman & Hall/CRC, 1997.
- Nelsen R, B. An Introduction to Copulas[M]. New York: Springer, 1999.
- Wu M, Zhang Y. Dependence and portfolio risk analysis of company bond and stock markets. Price Theory and Practice 2019. [Google Scholar]
- Wu K, He W, Zheng W. Dependence structure of China’s financial industry—based on Copula mixed model. Journal of Chongqing University (Natural Science Edition) 2019, 33. [Google Scholar]
- Lin, Y. Risk contagion and regulation in China’s P2P online lending industry[D]. South China University of Technology, Guangzhou, China, 2018.
- Yin Z, Zhu J, Zhang R. Time-varying dependence analysis of capital markets in China based on t-Copula model. Modern Management Science 2019, 39. [Google Scholar]
- Forbes K J, Rigobon R. No contagion, only interdependence: measuring stock market comovements. The Journal of Finance 2002, 57, 2223–2261. [Google Scholar] [CrossRef]
- Kaminsky G L, Reinhart C M. On crises, contagion, and confusion. Journal of International Economics 2000, 51, 145–168. [Google Scholar] [CrossRef]
- Morales L, Andreosso-O’Callaghan B. The global financial crisis: world market or regional contagion effects? International Review of Economics & Finance 2014, 29, 108–131. [Google Scholar] [CrossRef]
- Bai J, Perron P. Estimating and testing linear models with multiple structural changes. Econometrica 1998, 66. [Google Scholar] [CrossRef]
- Bai J, Perron P. Computation and analysis of multiple structural change models. Journal of Applied Econometrics 2003, 18. [Google Scholar]
- Patton A, J. Modelling asymmetric exchange rate dependence. International Economic Review 2006, 47, 527–556. [Google Scholar] [CrossRef]
- Engle, R. Dynamic conditional correlation—A simple class of multivariate GARCH models. Journal of Business & Economic Statistics 2002, 20, 339–350. [Google Scholar]
- Diebold F X, Yilmaz K. Better to give than to receive: predictive directional measurement of volatility spillovers. International Journal of Forecasting 2012, 28, 57–66. [Google Scholar] [CrossRef]
- Liu X, Qin Y, Xu Q, Liu Z, Guo X, Xu W. Integrating knowledge graph reasoning with pretrained language models for structured anomaly detection[EB/OL]. arXiv:2511.00462, 2025.
- Xu Q, Xu W, Su X, Ma K, Sun W, Qin Y. Enhancing systemic risk forecasting with deep attention models in financial time series. In Proceedings of the 2025 2nd International Conference on Digital Economy, Blockchain and Artificial Intelligence; 2025; pp. 340–344. [Google Scholar]
- Chen X, Gadgil S U, Gao K, Hu Y, Nie C. Deep learning approach to anomaly detection in enterprise ETL processes with autoencoders[EB/OL]. arXiv:2511.00462, 2025.
- Meng R, Wang H, Sun Y, Wu Q, Lian L, Zhang R. Behavioral anomaly detection in distributed systems via federated contrastive learning[EB/OL]. arXiv:2506.19246, 2025.
- Yao G, Liu H, Dai L. Multi-agent reinforcement learning for adaptive resource orchestration in cloud-native clusters[EB/OL]. arXiv:2508.10253, 2025.
- Zou Y, Qi N, Deng Y, Xue Z, Gong M, Zhang W. Autonomous resource management in microservice systems via reinforcement learning. In Proceedings of the 2025 8th International Conference on Computer Information Science and Application Technology; 2025; pp. 991–995. [Google Scholar]
- Li Y, Han S, Wang S, Wang M, Meng R. Collaborative evolution of intelligent agents in large-scale microservice systems[EB/OL]. arXiv:2508.20508, 2025.
- Hanrui F, Yi Y, Xu W, Wu Y, Long S, Wang Y. Intelligent credit fraud detection with meta-learning: addressing sample scarcity and evolving patterns[EB/OL]. 2025.
- Pan S, Wu D. Trustworthy summarization via uncertainty quantification and risk awareness in large language models[EB/OL]. arXiv:2510.01231, 2025.
- Xue P, Yi Y. Integrating context compression and structural representation in large language models for financial text generation. Journal of Computer Technology and Software 2025, 4. [Google Scholar]
- Wang Y, Wu D, Liu F, Qiu Z, Hu C. Structural priors and modular adapters in the composable fine-tuning algorithm of large-scale models[EB/OL]. arXiv:2511.03981, 2025.
- Zheng J, Zhang H, Yan X, Hao R, Peng C. Contrastive knowledge transfer and robust optimization for secure alignment of large language models[EB/OL]. arXiv:2510.27077, 2025.
- Lyu S, Wang M, Zhang H, Zheng J, Lin J, Sun X. Integrating structure-aware attention and knowledge graphs in explainable recommendation systems[EB/OL]. arXiv:2510.10109, 2025.
- Jiang M, Liu S, Xu W, Long S, Yi Y, Lin Y. Function-driven knowledge-enhanced neural modeling for intelligent financial risk identification[EB/OL]. 2025.
- Chiang C F, Li D, Ying R, Wang Y, Gan Q, Li J. Deep learning-based dynamic graph framework for robust corporate financial health risk prediction[EB/OL]. 2025.
- Song X, Huang Y, Guo J, Liu Y, Luan Y. Multi-scale feature fusion and graph neural network integration for text classification with large language models[EB/OL]. arXiv:2511.05752, 2025.
- Liu R, Zhang R, Wang S. Graph neural networks for user satisfaction classification in human-computer interaction[EB/OL]. arXiv:2511.04166, 2025.
- Lyu N, Wang Y, Cheng Z, Zhang Q, Chen F. Multi-objective adaptive rate limiting in microservices using deep reinforcement learning[EB/OL]. arXiv:2511.03279, 2025.
- Xu Z, Xia J, Yi Y, Chang M, Liu Z. Discrimination of financial fraud in transaction data via improved Mamba-based sequence modeling[EB/OL]. 2025.
- Wang Y, Fang R, Xie A, Feng H, Lai J. Dynamic anomaly identification in accounting transactions via multi-head self-attention networks[EB/OL]. arXiv:2511.12122, 2025.
- Vives, X. The impact of FinTech on banking. European Economy 2017, 97–105. [Google Scholar]
- Thakor A, V. Fintech and banking: what do we know? Journal of Financial Intermediation 2020, 41, 100. [Google Scholar] [CrossRef]
- Bollaert H, Lopez-de-Silanes F, Schwienbacher A. Fintech and access to finance. Journal of Corporate Finance 2021, 68, 101941. [Google Scholar] [CrossRef]
- Philippon, T. The fintech opportunity[R]. NBER Working Paper w2 2476, 2016. [Google Scholar]
- Yu, Y. The impact of Internet finance on the development strategy of traditional finance in China[D]. Harbin Institute of Technology, 2015.
- Mo, Y. Competition and cooperation between traditional finance and Internet finance. Finance Monthly 2014. [Google Scholar]
- Wang C, Wang L. Internet finance, stock market and macroeconomy—empirical research based on SVAR model. Contemporary Finance and Economics 2018. [Google Scholar]
- Xu, Y. Development strategy research on commercial banks under the Internet finance environment[D]. Huazhong University of Science and Technology, 2019.
- Chen, H. Impact of Internet finance on profitability of different types of commercial banks in China[D]. Southwestern University of Finance and Economics, 2019.
- Joe, H. Multivariate Models and Dependence Concepts[M]. Boca Raton: Chapman & Hall/CRC, 1997.
- Nelsen R, B. An Introduction to Copulas[M]. New York: Springer, 1999.
- Wu K, He W, Zheng W. Dependence structure of China’s financial industry—based on Copula mixed model. Journal of Chongqing University (Natural Science Edition) 2019, 33. [Google Scholar]
- Hu, J. Dependence structures in Chinese and U.S. financial markets: a time-varying conditional Copula approach. Applied Financial Economics 2010, 20. [Google Scholar] [CrossRef]
- Liu X, Wang F. Risk correlation measurement of Shanghai–Shenzhen stock markets using t-Copula–GARCH model—based on skew t distribution. Journal of Chongqing University (Social Sciences Edition) 2017, 31. [Google Scholar]
- Engle, R.F. Dynamic conditional correlation—A simple class of multivariate GARCH models. Journal of Business and Economic Statistics 2002, 20, 339–350. [Google Scholar] [CrossRef]
- Bai J, Perron P. Estimating and testing linear models with multiple structural changes. Econometrica 1998, 66, 47–78. [Google Scholar] [CrossRef]
- Bai J, Perron P. Computation and analysis of multiple structural change models. Journal of Applied Econometrics 2003, 18, 1–22. [Google Scholar] [CrossRef]
Figure 1.
Kernel Density Curves of Return Rates in Four Financial Markets.
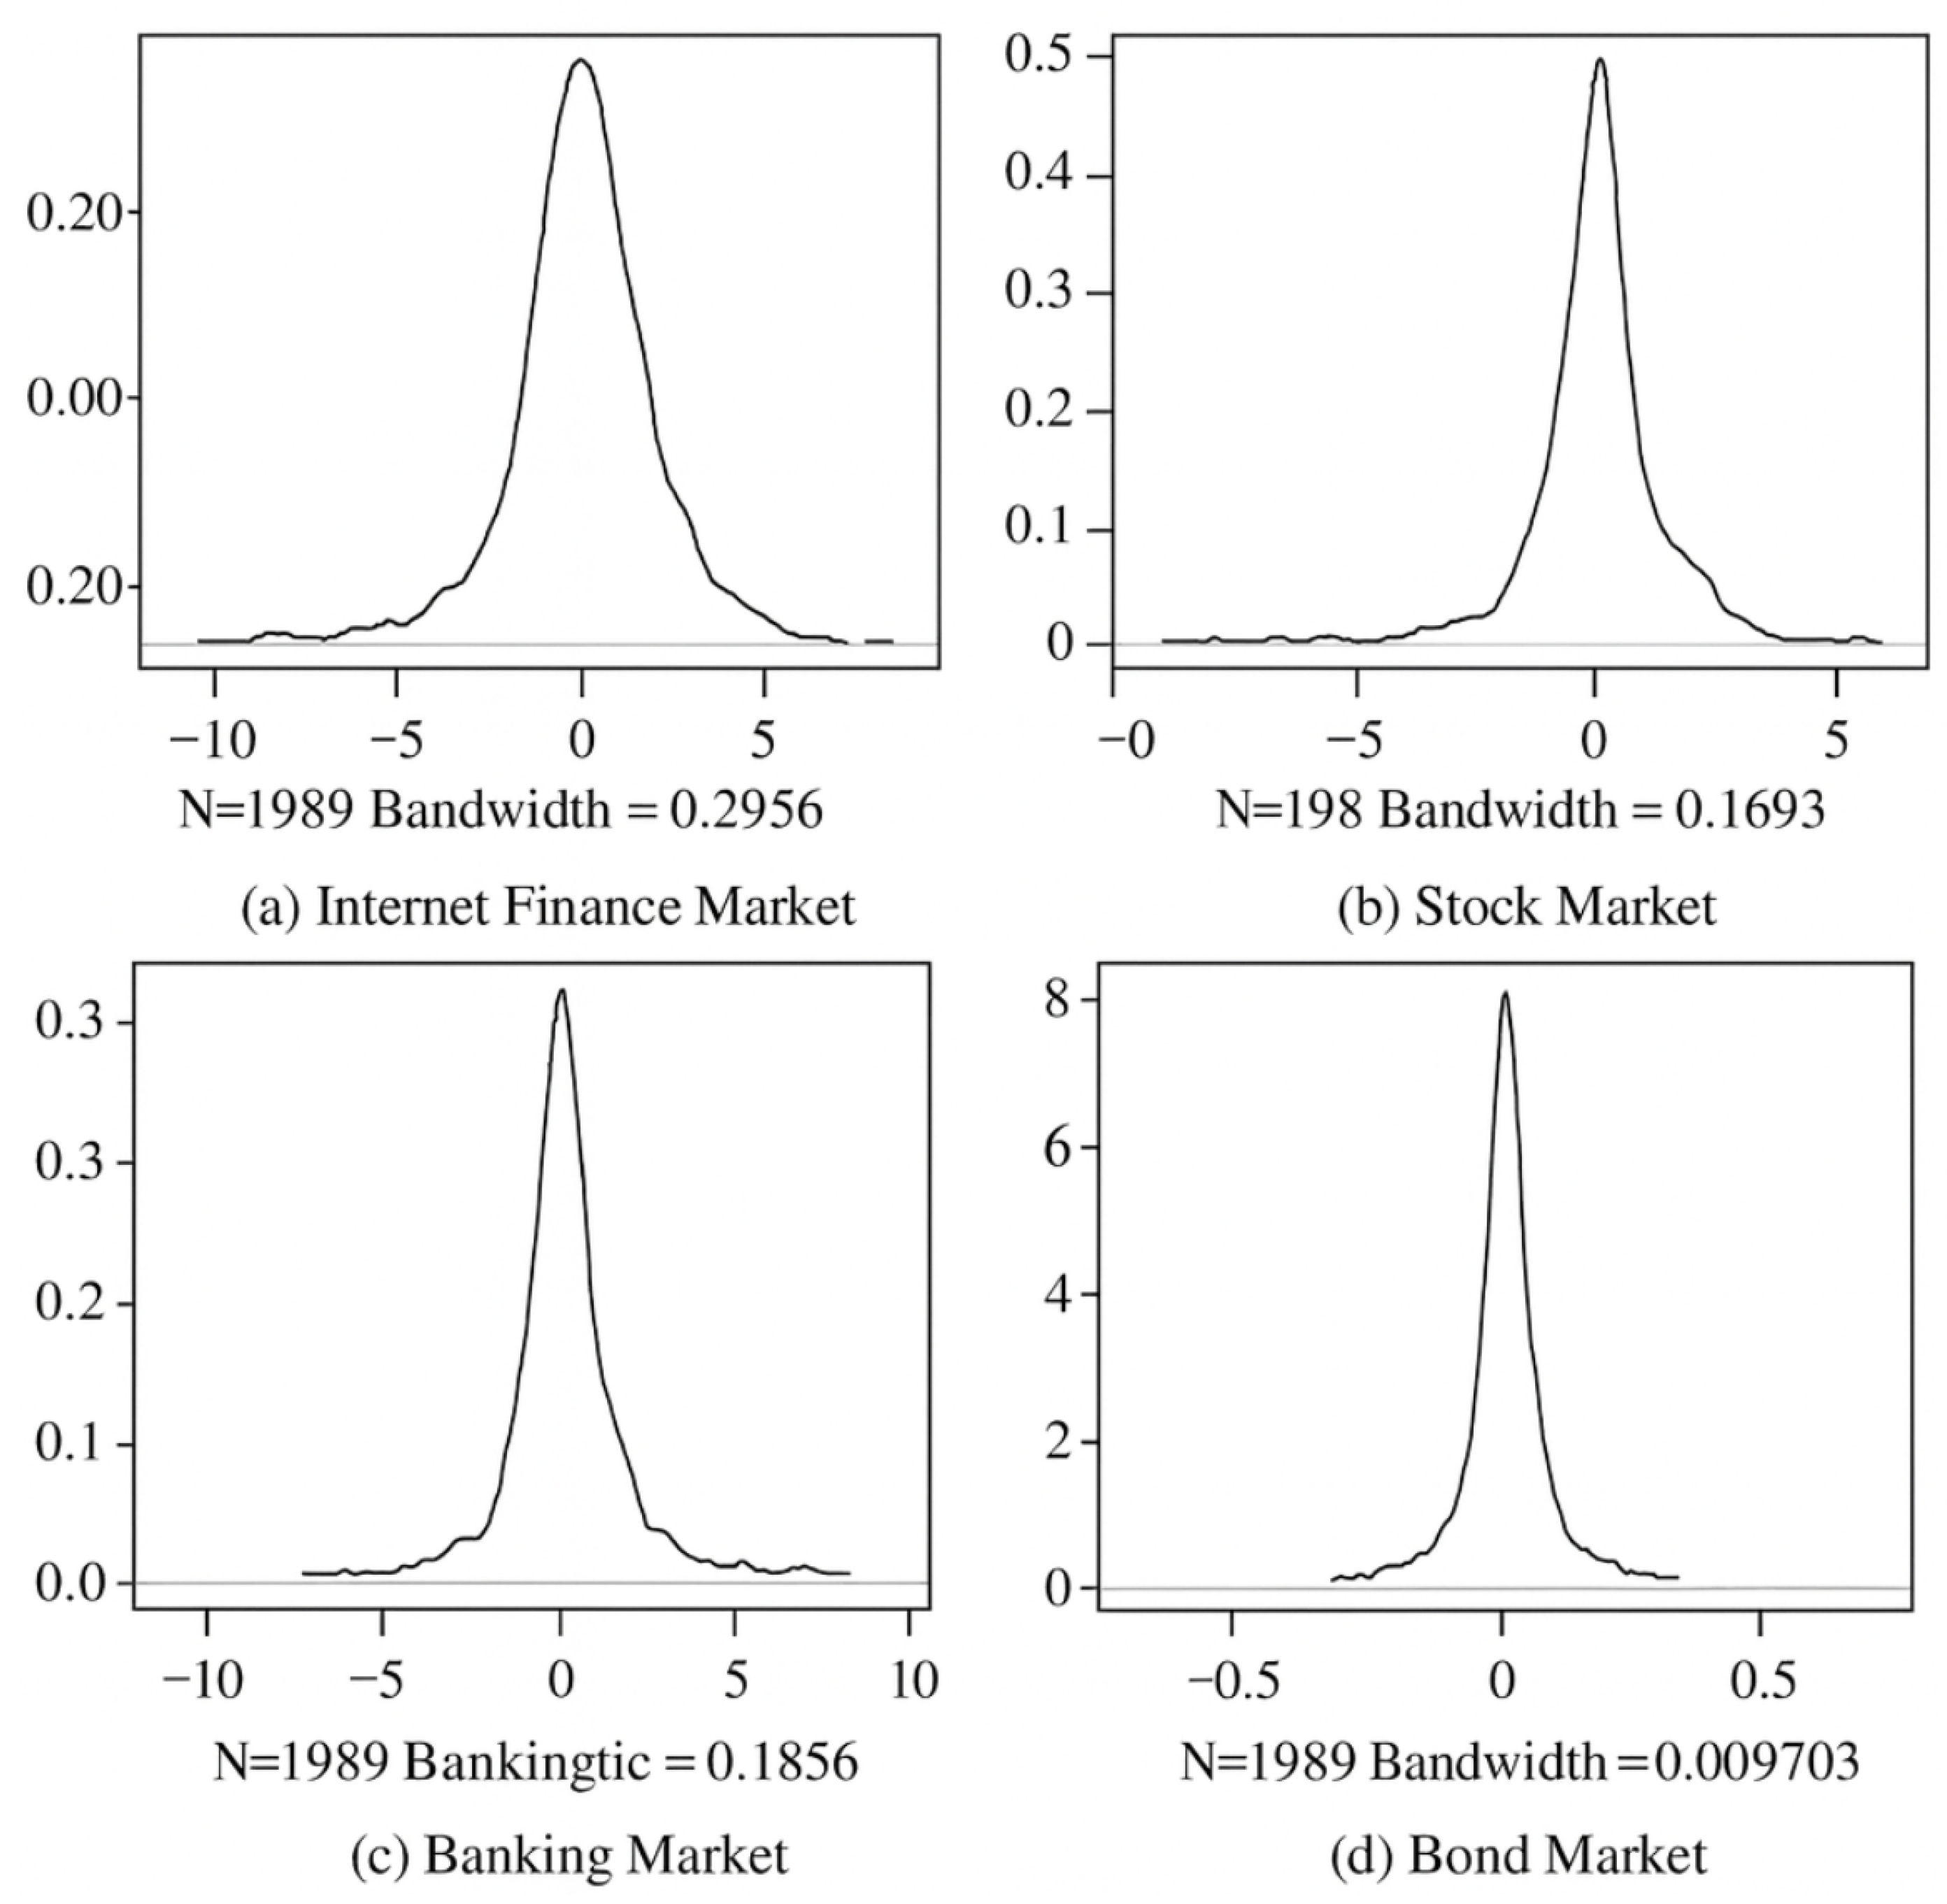
Figure 2.
Illustration of Structural Breakpoints in Dynamic Correlation Coefficients.
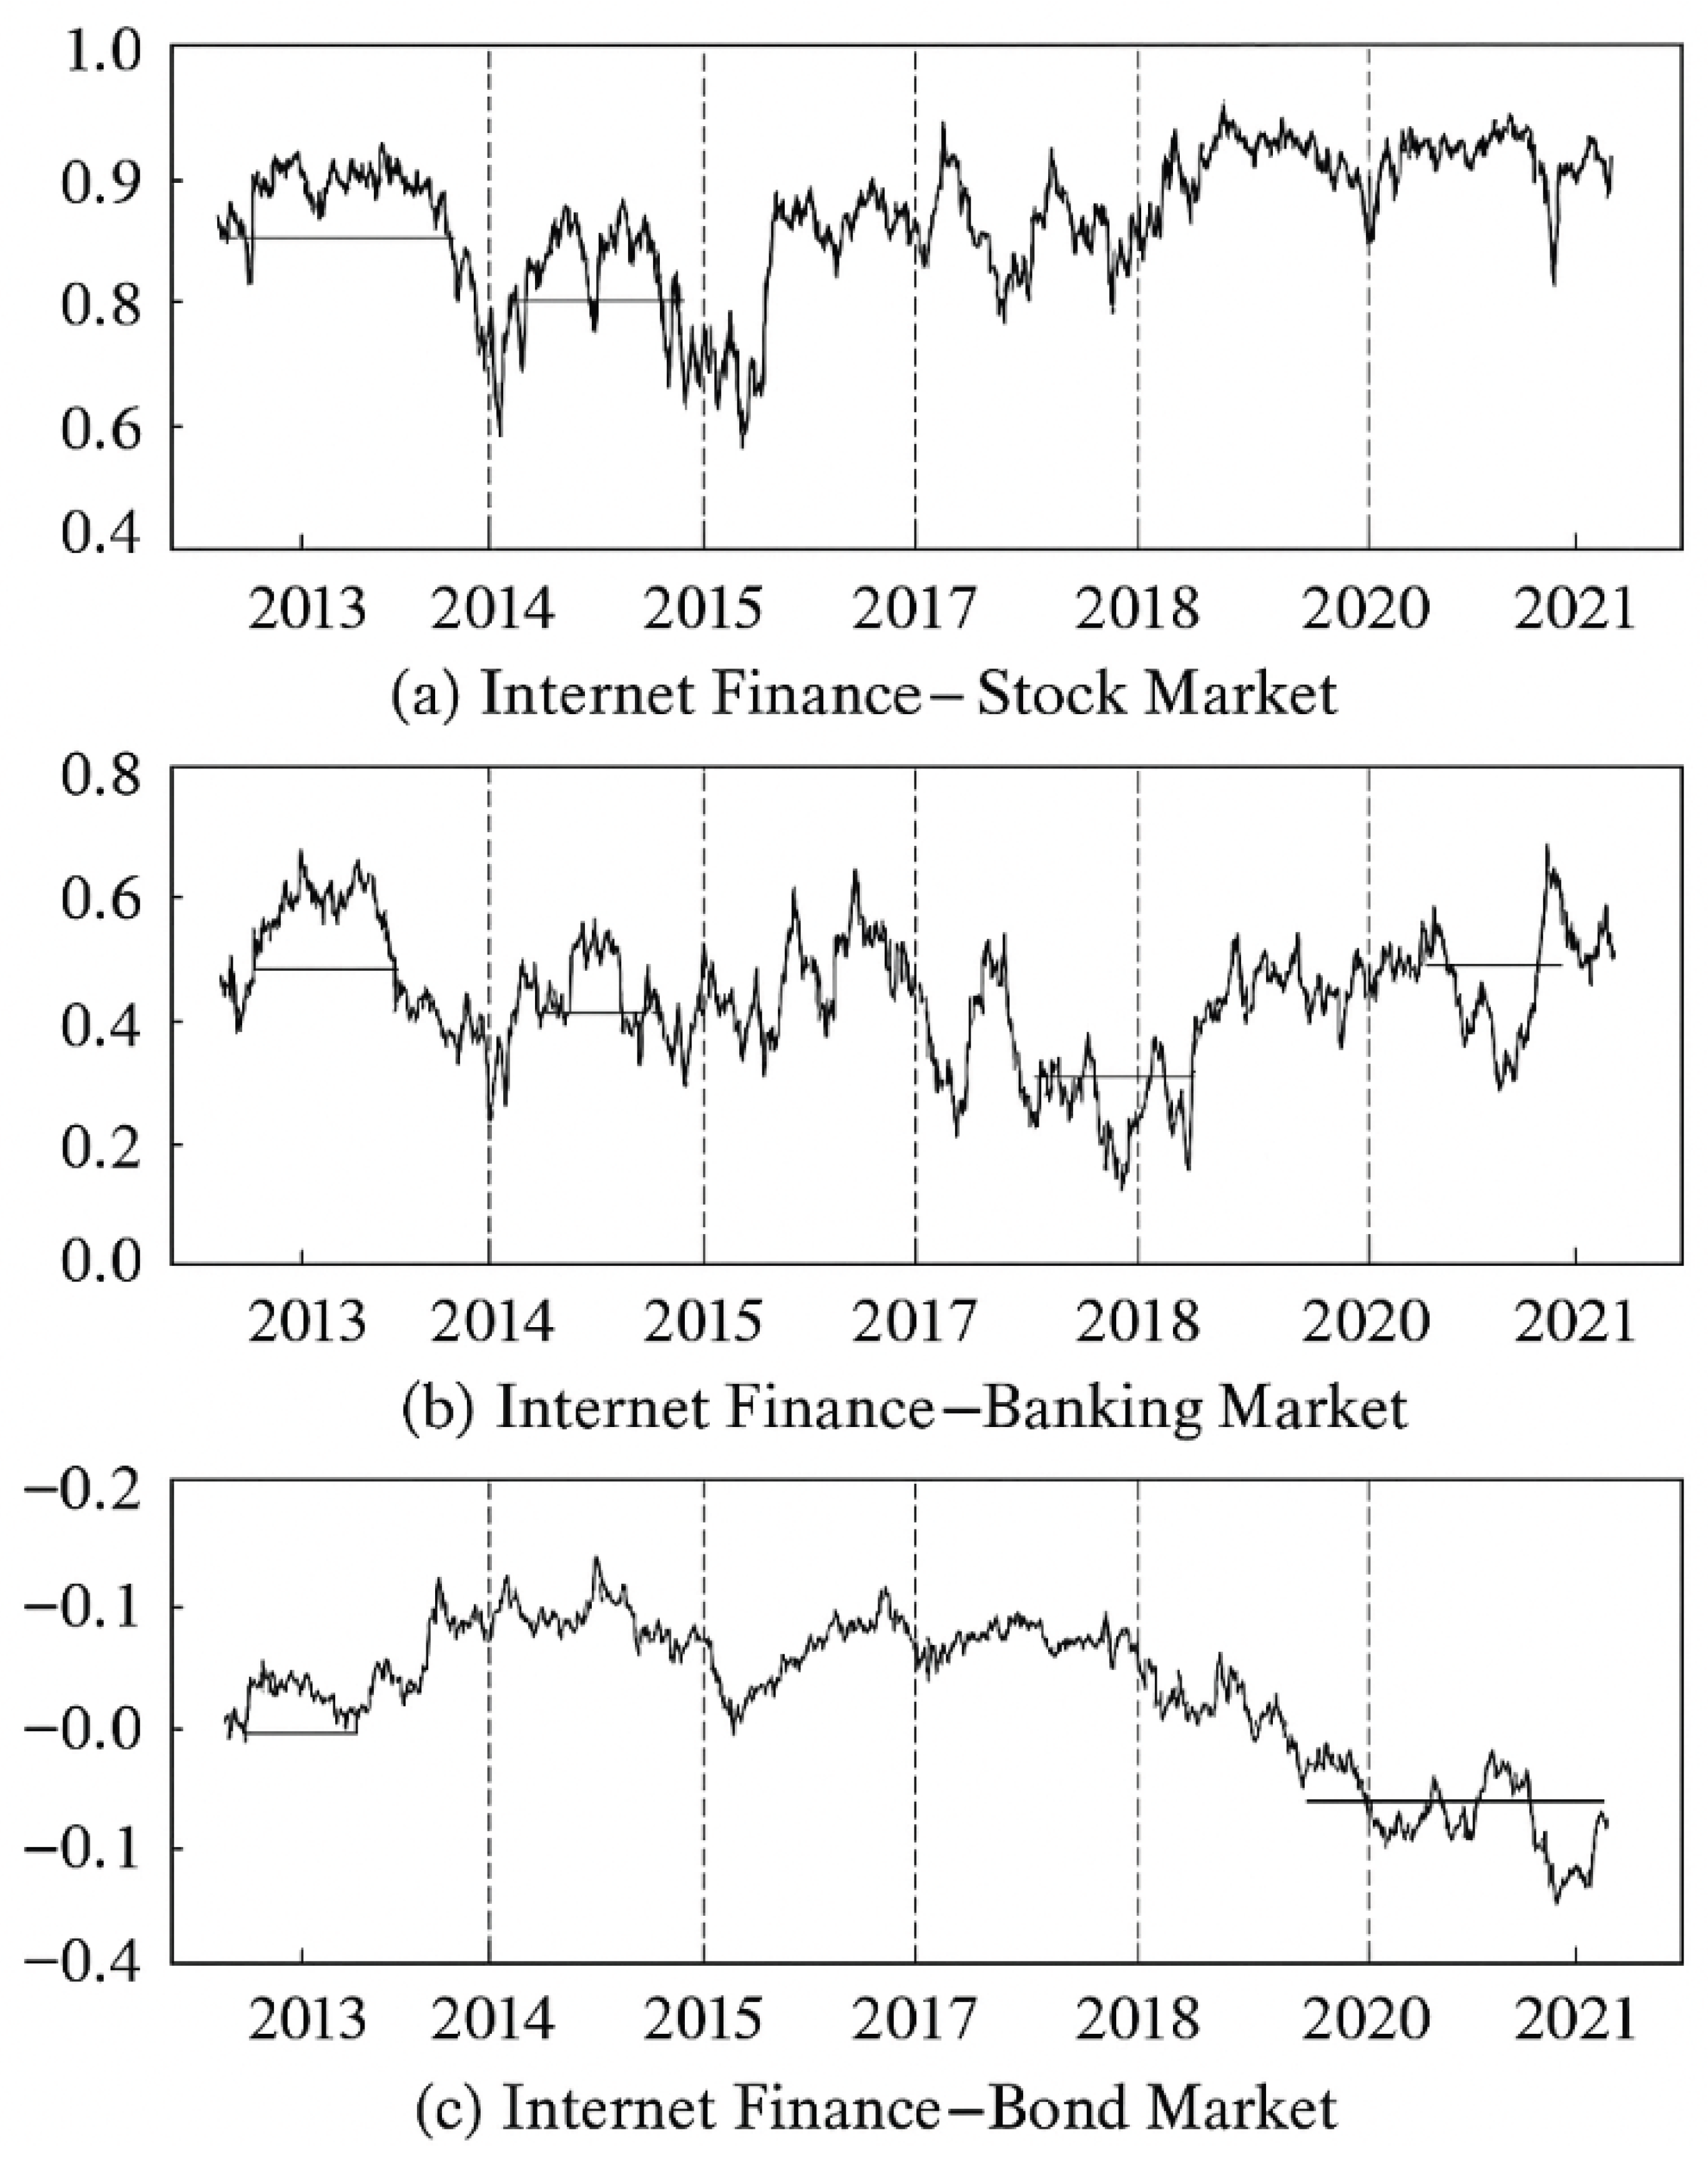

Table 1.
Descriptive Statistical Analysis Results.
| Statistic | Internet Finance | Stock | Banking | Bond |
|---|---|---|---|---|
| Mean | 0.0598 | 0.0215 | 0.0293 | 0.0171 |
| Median | 0.0978 | 0.0683 | -0.0393 | 0.0184 |
| Max | 7.9763 | 5.6036 | 6.8485 | 0.7073 |
| Min | -10.1682 | -8.8729 | -10.5019 | -0.6888 |
| Std. Dev. | 1.9762 | 1.3983 | 1.5493 | 0.0835 |
| Skewness | -0.5944 | -1.0571 | 0.0723 | 0.1665 |
| Kurtosis | 5.8021 | 10.0072 | 10.0444 | 15.3348 |
| JB P-value | 0.0000 | 0.0000 | 0.0000 | 0.0000 |
Table 2.
Stationarity Test Results.
| Series | ADF Statistic | Critical Values | P-value | ||
|---|---|---|---|---|---|
| 1% | 5% | 10% | |||
| Internet Finance | -41.1122 | -3.4334 | -2.8628 | -2.5675 | 0.0000 |
| Stock Market | -42.3374 | -3.4334 | -2.8628 | -2.5675 | 0.0000 |
| Banking Market | -44.4917 | -3.4334 | -2.8628 | -2.5675 | 0.0000 |
| Bond Market | -25.5197 | -3.4334 | -2.8628 | -2.5675 | 0.0000 |
Table 3.
Fitting Results Under Different Residual Distributions.
| Market | Model | AIC | SC | ARCH–LM P-value |
|---|---|---|---|---|
| Internet Finance | GARCH(1,1)–N | 3.9908 | 4.0020 | 0.4258 |
| GARCH(1,1)–t | 3.9329 | 3.9469 | 0.5259 | |
| Stock Market | GARCH(1,1)–N | 3.1458 | 3.1570 | 0.4074 |
| GARCH(1,1)–t | 3.0240 | 3.0380 | 0.1638 | |
| Banking Market | GARCH(1,1)–N | 3.4041 | 3.4154 | 0.8496 |
| GARCH(1,1)–t | 3.2394 | 3.2534 | 0.7715 | |
| Bond Market | GARCH(1,1)–N | -2.4393 | -2.4280 | 0.6312 |
| GARCH(1,1)–t | -2.6388 | -2.6247 | 0.6763 |
Table 4.
Parameter Estimation Results of Marginal Distributions.
| Parameter | Internet Finance | Stock | Banking | Bond |
|---|---|---|---|---|
| 0.0688** | 0.0517*** | -0.0224 | 0.0187*** | |
| (p-value) | (0.0405) | (0.0073) | (0.2960) | (0.0000) |
| 0.0230** | 0.0128*** | 0.0448*** | 0.0009*** | |
| (p-value) | (0.0424) | (0.0076) | (0.0013) | (0.0000) |
| 0.0523*** | 0.0662*** | 0.1011*** | 0.5460*** | |
| (p-value) | (0.0000) | (0.0000) | (0.0000) | (0.0000) |
| 0.9445*** | 0.9327*** | 0.8994*** | 0.4875*** | |
| (p-value) | (0.0000) | (0.0000) | (0.0000) | (0.0000) |
Note: Values in parentheses are p-values. *, **, *** indicate significance at the 10%, 5%, and 1% levels, respectively.
Table 5.
Parameter Estimation Results of the t-Copula Function Between Financial Markets.
| Parameter | Internet Finance–Stock | Internet Finance–Banking | Internet Finance–Bond | |||
|---|---|---|---|---|---|---|
| Static | Time-Varying | Static | Time-Varying | Static | Time-Varying | |
| d | 4.9941*** | 10.9845*** | 4.2008*** | 5.4145*** | 7.241*** | 7.8917*** |
| – | 0.0498*** | – | 0.0227*** | – | 0.0078*** | |
| – | 0.9446*** | – | 0.9629*** | – | 0.9899*** | |
| AIC | -2218.058 | -3249.067 | -525.665 | -569.756 | -35.6495 | -55.6064 |
| BIC | -2212.463 | -3240.512 | -520.087 | -559.327 | -30.541 | -38.8202 |
| Log-likelihood | 1123.058 | 1631.984 | 287.832 | 287.878 | 18.825 | 30.803 |
Note: *** indicates significance at the 1% level.
Table 6.
Descriptive Statistics of Dynamic Correlation Coefficients.
| Market | Static Corr. | Mean | Median | Max | Min | Std. Dev. |
|---|---|---|---|---|---|---|
| Stock Market | 0.8147 | 0.8161 | 0.8486 | 0.9575 | 0.4436 | 0.1038 |
| Banking Market | 0.4395 | 0.4608 | 0.4709 | 0.7673 | 0.0449 | 0.1335 |
| Bond Market | -0.0381 | -0.0324 | -0.0151 | 0.1939 | -0.3309 | 0.1177 |
Table 7.
Results of Structural Breakpoint Test.
| Pair | Breakpoints |
|---|---|
| Internet Finance – Stock | 2013-09-25, 2015-07-20, 2016-11-24, 2018-06-20 |
| Internet Finance – Banking | 2013-09-25, 2015-06-23, 2016-12-13, 2018-07-23 |
| Internet Finance – Bond | 2013-10-09, 2015-06-30, 2016-09-13, 2018-06-20 |
Disclaimer/Publisher’s Note: The statements, opinions and data contained in all publications are solely those of the individual author(s) and contributor(s) and not of MDPI and/or the editor(s). MDPI and/or the editor(s) disclaim responsibility for any injury to people or property resulting from any ideas, methods, instructions or products referred to in the content. |
© 2025 by the authors. Licensee MDPI, Basel, Switzerland. This article is an open access article distributed under the terms and conditions of the Creative Commons Attribution (CC BY) license (http://creativecommons.org/licenses/by/4.0/).
Copyright: This open access article is published under a Creative Commons CC BY 4.0 license, which permit the free download, distribution, and reuse, provided that the author and preprint are cited in any reuse.


