
Submitted:
18 March 2023
Posted:
20 March 2023
You are already at the latest version
Abstract
We analyze the upside and downside risk connectedness among international stock markets. We characterize the connectedness among international stock returns using the Diebold and Yilmaz spillover index approach and compute the upside and downside value-at-risk. We document that the connectedness level of the downside risk is higher than that of the upside risk and that stock markets are more sensitive when the stock market declines. We also find that specific periods (e.g., the global financial crisis, the European debt crisis, and the COVID-19 turmoil) intensify the spillover effects across international stock markets. Our results demonstrate that the EU, Ger-many, and the US acted as net transmitters of dynamic connectedness; however, Japan (JP), China (CH), and India (IN) acted as net receivers of dynamic connectedness during the sample period. These findings provide significant new information to policymakers and market participants.
Keywords:
risk connectedness
; network approach
; value-at-risk
; international stock market
; extreme risk
1. Introduction
In recent decades, there has been a significant increase in economic and financial interdependence alongside the liberalization of financial markets. Most companies worldwide import some of their intermediate inputs from foreign companies and obtain capital funds from foreign investors. In today’s interconnected world, events in a country can quickly affect the global economy. Thus, when markets are connected, if one sector faces risk, this risk can affect others through strong links and contagion mechanisms, potentially causing the risk of spreading to the entire stock market [1,2,3,4].
For years, the global stock market has continued to fluctuate under the influence of geopolitical risk, energy price fluctuation, economic and monetary policies of large countries, infectious diseases, and financial shocks such as the global financial crisis (GFC) and the European debt crisis (EDC); and the impact of these events has been easily transmitted between markets. Therefore, over the past few decades, researchers have focused on spillover effects between international stock markets [5,6,7,8,9,10,11,12,13,14].
Therefore, many researchers have conducted studies on the methodology, structure, and dynamics of these spillover effects [14,15,16,17,18,19,20,21,22]. However, most of these studies explored the overall spillover effects using returns and volatility and ignored the spread of tail risk. Although the overall spillover effects of stock market returns are important, in some cases, extreme risk spillovers are more important. Extreme risks are unlikely to occur because of extreme stock market events. Once they occur, they have a tremendous spillover effect on the stock market and economy as a whole. When market participants invest in international stock markets, it is crucial to understand the intensity and direction of the extreme risk connectedness between the markets as a whole.
Inspired by the growing financial literature focused on identifying risk networks in the financial system [13,23,24,25], these studies aim to identify the international stock price network and uncover the primary risk contributor and intensity of the interconnectedness of extreme risk within the network. Understanding the structure and dynamics of connectedness in the international stock market network by measuring extreme risk spillovers is of great significance, as this information is crucial for identifying early signs of systemic risk and enhancing the stock price network’s resilience to systemic events. This information is also useful in terms of profit and loss management and systematic risk management, as it provides new information for assessing portfolio diversification opportunities and making decisions [14].
Recently, a few studies investigated the connectedness between tail risks [26,27]. A previous study analyzed the connectedness of downside risks, whereas empirical analysis of upside risks is scarce. Upside risks, similar to downside risks, are another type of systemic financial risk, as they can lead to future losses and high uncertainties [28]. In addition, market participants’ ability to respond to market changes because of different information is bound to vary depending on upside and downside risks. Thus, analyzing and comparing upside and downside extreme risks together is useful in stabilizing the stock market network and helping investors’ risk management strategies. In this context, it is worth investigating the connectedness of upside and downside risks between international stock markets.
Our findings provide evidence that the degree of connectedness is higher for downside risks than for upside risks. Moreover, in the dynamic results, we find that the magnitude of connectedness is more significant in the case of downside risks. Furthermore, we find convincing evidence that specific periods (e.g., the GFC, EDC, and COVID-19 pandemic) intensify risk spillover effects across international stock markets. Net connectedness also showed that developed stock markets, such as those in Germany, the EU, and the US, were net transmitters of risk to all other markets, whereas Asian stock markets, including China, India, and Japan, were net receivers for upside and downside risks during the sample period.
Our study contributes to the existing literature in the following ways: First, we investigate the extreme risk connectedness of international stock markets based on the network approach, which differs from bivariate approaches such as the correlation and Granger causality approaches, which focus on the relationship between the two markets. Second, we identify an international stock network from extreme risk connectedness using a value-at-risk (VaR) measurement, which contrasts previous studies that focus on the overall linkage of returns and volatility. To achieve our objective, we use the Glosten-Jagannathan-Runkle Generalized AutoRegressive Conditional Heteroskedasticity (GJR-GARCH) model [29] to calculate the VaR for stock market returns and apply Diebold and Yilmaz’s methods [30,31] to examine extreme risk connectedness in the international stock market network. Third, we measure downside and upside risks together, which can consider the asymmetry of connectedness in the upside and downside risks. This study differs from previous studies that have only examined negative risks by considering both downside and upside risks. Finally, we examine how the COVID-19 pandemic affects risk connectedness, as our sample period includes the duration of the pandemic.
Our results present new evidence of how each market plays a role in the connectedness of extreme risks within the international stock market network. These findings are significant for policymakers and market participants who attempt to stabilize the financial market, manage risks and portfolio diversification, and make investment decisions. To the best of our knowledge, this study is the first to investigate connectedness in an extreme-risk network using the VaR of international stock markets.
2. Relevant Literature Review
For the past few years, the literature on risk connectedness in international stock markets has explored the interdependence of risks across stock markets globally. Several studies have found that risk connectedness tends to escalate during periods of market stress, such as financial crises. Studies have also found that the degree of risk connectedness between stock markets can vary depending on the specific markets considered and the time period studied. Overall, the literature highlights the need to better understand the risk connectedness in international stock markets to inform investment strategies and public policy decisions. Let us examine previous studies on this subject more closely.
2.1. Financial risk network at the firm or sector level
The interconnectedness of financial risks within a firm or sector occurs when a firm’s financial risk has an indirect or direct influence on the financial risks of other firms within the same sector. For example, if a firm in a sector experiences financial difficulties, this can lead to a cascade of financial losses throughout the sector because of exposure to common risk factors such as supplier disruptions or declining market demand. At the firm level, financial risk networks can be used to analyze and manage the interdependence of various financial risks, such as credit, liquidity, and market risks. Firms can use this information to identify and address sources of systemic risk and make informed investment decisions. At the sector level, a financial risk network analysis can inform public policy decisions aimed at promoting stability and resilience in the financial system.
Many studies have analyzed the formation and structure of financial risk networks at the firm or sector level. Among others, in a study on the stock market in China, Wu [32] identified the financial, industrial, and energy sectors as the most significant contributors to systemic risk, whereas Wu et al. [33] determined that the industrial sector had the greatest systemic importance among the Chinese stock market sectors. Additionally, Zhang et al. [34] examined the tail risk network of Chinese sectoral markets and analyzed systemic risk linkages using the conditional VaR (CoVaR) approach. Arreola Hernandez et al. [35] explored the interdependence structure of the bank return network of emerging and developed Asia-Pacific countries. Ngene [36] explored asymmetric and time-varying volatility spillovers among US sector equities. Wu et al. [37] analyzed systemic risk connectedness in a network of global energy companies and revealed that US stock market volatility and financial market sentiment are the major drivers of time-varying risks. Shen et al. [38] investigated risk spillovers within Chinese sectors using the generalized variance decomposition framework of the vector autoregression (VAR) model.
2.2. Financial risk network using a bivariate approach
To measure the network connectedness among financial markets, researchers have used various methods, such as correlation analysis, the Granger causality approach, the transfer entropy approach, and the variance decomposition of the VAR model. The most popular method in financial network analysis is calculating pairwise correlations. In a network, markets (sectors, institutions, or firms) are nodes, and correlations are links. For example, Chi et al. [39] built a network of US-listed stocks using the calculated cross-correlations of price returns and trading volumes. Giroud and Mueller [40] used correlations to construct internal networks of firms and examined the transmission of local shocks across regions in the US through these networks. Zhou et al. [41] investigated special stock price behaviors in the Chinese A-share stock market using correlation-based stock networks.
The Granger causality network identifies causality by detecting the presence of information flow in a linear relationship, as proposed by Granger [42]. As this approach has the advantage of being based on statistical tests, many studies have applied this model. For example, by applying the Granger causality network, Billio et al. [43] analyzed the connectedness and system risk of four types of finance and insurance sectors, and Výrost et al. [44] analyzed the network between 20 stock markets. Wang et al. [45] employed VaR and Granger causality risk test to construct an extreme risk spillover network that measured the connectedness among financial institutions and quantified the extent of extreme risk spillovers.
The Granger causality approach only considers the direction of causality and not the degree of causality in terms of the magnitude of information flow. If the quantity of information flow between the two markets is of greater importance, the transfer entropy approach becomes more relevant. A transfer entropy approach is a useful tool for quantifying information transfer within a network numerically [46]. Since Schreiber [47] proposed the concept of transfer entropy, it has been applied in many fields. Sensoy et al. [48] applied the transfer entropy method to investigate the intensity and direction of the information flow between stock prices and foreign exchange rates in emerging countries. Gong et al. [49] analyzed stock market connectedness and found that the total connectedness of the market increased during periods of crisis. Nicola et al. [50] used daily stock data from 74 listed US banks and investigated the US bank network. García-Medina and Luu Duc Huynh [51] examined the predictive power of the determinants of Bitcoin prices by employing the transfer entropy approach. Tiwari et al. [52] applied transfer entropy to investigate the information flow between government bonds and stock markets in the G7 countries.
If tail risks are crucial, then the copula approach is suitable for building a tail-dependence network. For example, Münnix and Schäfer [53] investigated the statistical dependencies in the US stock market using a copula approach and revealed that many dependencies are from the tails of the marginal distributions. Changqing et al. [54] explored risk contagion between international and Chinese stock markets using a dynamic copula model and revealed that risk contagion is identified by lower tail dependence. Xixi et al. [55] utilized copula tail correlation to construct a complex network of the Chinese stock market and analyzed the network structure of the market. Wen et al. [56] employed a copula model to investigate the edge information of a stock price network.
2.3. Financial market risk network using a multivariate system approach
The pairwise correlation and Granger causality approaches focus only on bivariate linkage and thus fail to measure overall systemic connectedness. The VAR approach can analyze the relationship in a multivariate system as a whole. Diebold and Yilmaz (hereafter, DY) [15,30,31] suggest the most popular model of the VAR approach. Diebold and Yilmaz [31] suggested a network topology employing the variance decomposition method. They constructed stock returns and volatility networks by measuring the time-varying connectedness of the stock return volatilities of major US financial institutions using variance decomposition.
The DY approach has been applied to spillover studies on several financial markets. For example, Mensi et al. [57] examined the risk spillovers and hedging characteristics between precious metals and currency markets at three-time horizons using the DY index method. Using a DY spillover index approach, Arreola Hernandez et al. [58] investigated the spillovers between a portfolio of precious metal commodities and equity markets. Kang et al. [59] constructed a system of oil, gold, and US equity sector markets to explore the spillover effects in the system by employing the DY spillover index method.
Recently, several techniques have been developed to improve the DY method. Demirer et al. [60] introduced the Least Absolute Shrinkage and Selection Operator (LASSO) method into high-dimensional networks to overcome the limitations of the VAR model in constructing low-dimensional networks. They construct a network of publicly traded subsets of the world’s top 150 banks. Du et al. [27] also investigated multiscale tail risk spillovers across global stock markets at different frequencies by employing LASSO-based network connectedness. Baruník and Křehlík [61] introduced the DY framework, which used the spectral representation of variance decompositions to measure the connectedness between financial variables resulting from heterogeneous frequency responses to shocks. Baruník and Kocenda [62] applied an extended DY approach to high-frequency intraday data and examined the total, asymmetric, and frequency connectedness between oil and foreign exchange markets. Youssef et al. [14] used the time-varying parameter VAR (TVP-VAR) of the DY method and investigated the dynamic connectedness between the eight stock indices affected by the COVID-19 pandemic. They also analyze how economic policy uncertainty affects this connectedness. Chatziantoniou et al. [63] examined sectoral stock market connectedness in India by employing a TVP-VAR connectedness approach and revealed that connectedness was strongest during the GFC. Zhou et al. [64] used a TVP-VAR DY model, constructed a network in Chinese sectoral stock markets, and analyzed sectoral risk spillovers based on high-frequency data. Alshater et al. [65] explored the connectedness among several regional FinTech indices and analyzed how the Russia-Ukraine war affected the dynamic spillover using the TVP-VAR DY and time-frequency connectedness network approaches.
Some studies have focused on measuring the system risk in a financial network. Adrian and Brunnermeier [66] introduced the CoVaR method to measure system risk according to the institutions’ leverage, size, and maturity mismatch. Al-Yahyaee et al. [67] used a CoVaR and ΔCoVaR approach and studied the systemic risk among the Sharia, Sukuk, and Gulf Cooperation Council (GCC) stock markets. Wu et al. [68] analyzed the tail risks of 28 stock markets using the conditional autoregressive value-at-risk model.
In addition, by applying the dynamic model averaging approach, Dong et al. [7] explored how the interdependent structures between economic factors and stock markets changed during the COVID-19 outbreak. Their findings revealed that the dependence structures experienced significant changes during the COVID-19 outbreak and that economic factors had a stronger impact on developed stock markets than on emerging Asian markets. Hanif et al. [69] analyzed connectedness spillover effects, and nonlinear dependence between European emission allowance prices and clean/renewable energy sector equity indices by employing the time-frequency DY model and TVP copula approaches.
Remarkably, previous studies have mainly concentrated on examining the connectedness of downside risks and have not considered upside risks and asymmetry in risk connectedness. In the stock market network, upside risk connectedness is another type of systemic risk, which can lead to future losses and high uncertainty [28]. In this context, it is important to measure and analyze the upside and downside risk connectedness together and utilize the information in policy-making for stock market stabilization and international investors’ risk management. There have been several studies on this topic. Baruník et al. [70] suggested a method to estimate asymmetries in volatility spillovers and revealed that asymmetries emerge because of bad and good volatility in the US stock market. BenSaïda [71] investigated asymmetric volatility spillovers across the G7 stock markets and discovered that asymmetric connectedness is time-varying. Li [72] dissected the influence of COVID-19 on global stock markets by employing the DY approach and discovered that volatility spillovers are time-varying, crisis-sensitive, and asymmetric. Mensi et al. [73] investigated the asymmetric volatility connectedness among stock markets by analyzing high-frequency data from 16 stock markets and found that bad volatility dominates good volatility. Mensi et al. [74], employing the DY spillover index, investigated the dynamic asymmetric volatility connectedness among US equity sector markets and revealed that the network of connectedness among sectors demonstrates asymmetric behaviors. Using high-frequency data from the COVID-19 period, Shahzad et al. [75] analyzed asymmetric volatility spillovers among Chinese stock markets and discovered that bad volatility spillover shocks dominate good volatility spillover shocks.
As mentioned in previous studies, various models have been applied and analyzed between markets (or industries) to analyze the risk spillover effects in many studies. However, the model for calculating the extreme risks was not applied, and the analysis of the spillover effect was insufficient when applying the upper risk. Therefore, this study provides a new framework for computing networks and connectedness by applying the VaR model, which can estimate extreme risks (upside and downside risks).
3. Data and Method
3.1. Data
To discover international stock market risk connectedness, we analyze the daily prices of 10 stock markets: the United States (US), Japan (JP), China (CH), Hong Kong (HK), India (IN), the European Union (EU), Germany (GE), the United Kingdom (UK), Switzerland (SW), and Canada (CA). The sample consists of ten stock markets between January 5, 2000, and July 30, 2022, with 4,579 observations. Daily returns are calculated as the logarithmic difference between two consecutive daily prices. All data were obtained from Infomax (https://news.einfomax.co.kr).
Table 1 displays the summary statistics for all the stock returns. The UK, HK, and the EU had the lowest mean returns, whereas IN exhibited the highest mean returns. In addition, according to the standard deviation (Std. Dev), CH was the riskiest market, followed by GE and IN. By contrast, SW had the lowest risk, followed by CA and the US. Because skewness has a negative value, all countries, except HK, are skewed to the left. It also has excessive kurtosis in all stock markets, indicating a thick-tailed leptokurtic distribution. According to the Jarque-Bera (J-B) statistics that test normality, all stock market returns deviate from a normal distribution. We conducted an augmented Dickey–Fuller (ADF) test to determine the presence of unit roots in each return series. The results are presented in the final column. All the stock market returns are stationary at the 1% level. Figure 1 shows the returns for the 10 stock markets. As demonstrated, the returns of all stock markets experienced abrupt fluctuations during the GFC and the COVID-19 pandemic. The financial crisis and pandemic had a greater impact on the American and European stock markets than on the Asian markets.
3.2. Methodology
VaR is widely used to calculate the risk for stock markets, and a common approach to VaR measures is to use econometric models. Thus, to estimate the upside and downside VaR of stock markets, we use the ARMA-GJR-GARCH model. The upside and downside risks for the log-returns of the stock markets are given as follows:
Equations (1) and (2) are the upside and downside risk equations, where and represent the average returns and the standard deviation of stock market returns, respectively. and are the and quantiles of a Student- distribution with degrees of freedom, respectively.
The approach used in this study was developed by Diebold and Yilmaz [30,31] and is widely applied in many areas of economic analysis. Based on this approach, we analyze the risk connectedness of international stock markets using the VaR obtained in Equations (1) and (2). This approach relies on the use of the VAR model and generalized forecast error variance decomposition (GFEVD). This approach analyzes the total, directional, and net connectedness among international stock markets. The VAR model with variables is expressed as
where is the vector of endogenous variables at time . is a matrix of autoregressive coefficients, and is the vector of the error terms. This VAR model can be expressed in terms of the vector moving average (VMA) model as follows:
where is the vector of the coefficients of the moving average. This coefficient was used to generate the variance decomposition. Thus, the -step ahead GFEVD was calculated using the generalized approach proposed by Koop et al. [76] and Pesaran and Shin [77]. The variable ’s contribution of variable to -step-ahead GFEVD for variable is defined as
where is the standard deviation of the equation in the VAR model, and ∑ is the variance matrix of the error vector . is the selection vector, which has values equal to 1 for element , and 0 elsewhere. is a moving average coefficient matrix with lag .
However, the row sums of the variance decomposition matrix are not necessarily equal to 1. Thus, the normalized -step ahead GFEVD can be expressed as
where and . is the variance share of the other variables. Using Equation (6), we construct several types of connectedness indices. The total risk-connectedness index is calculated as follows:
Additionally, we can gauge the directional spillovers of risks. The FROM directional connectedness estimates risk spillovers from all other stock markets to stock market as
The TO directional connectedness estimates risk spillovers from stock market to all other stock markets as
In addition, the net total directional connectedness of risks for stock market can be computed as the difference between Equations (9) and (8) and is expressed as
This index determines whether a given stock market is a recipient or transmitter of risk. If , the risk of stock market affects the stock market risk more than is affected by all other stock market risks. If , then the opposite is true. Finally, the net pairwise directional connectedness of risk is calculated using the following formula:
4. Empirical Results
4.1. Upside and downside VaR measurement results
Using the GJR-GARCH (1,1) model, we measure the downside and upside risks associated with all the stock markets. Figure 1 shows the upside and downside VaRs of the ten international stock markets. Based on the figures, the changes in VaR estimates for downside and upside risks appear to be symmetrical over time. Additionally, the downside and upside VaRs underwent significant fluctuations during the initial phases of the GFC and the COVID-19 pandemic. However, during the COVID-19 outbreak, CH and HK experienced relatively small fluctuations compared to other countries. In particular, CH shows great fluctuations between 2015 and 2016 because of the stock market bubble and the decline in the economic growth rate.
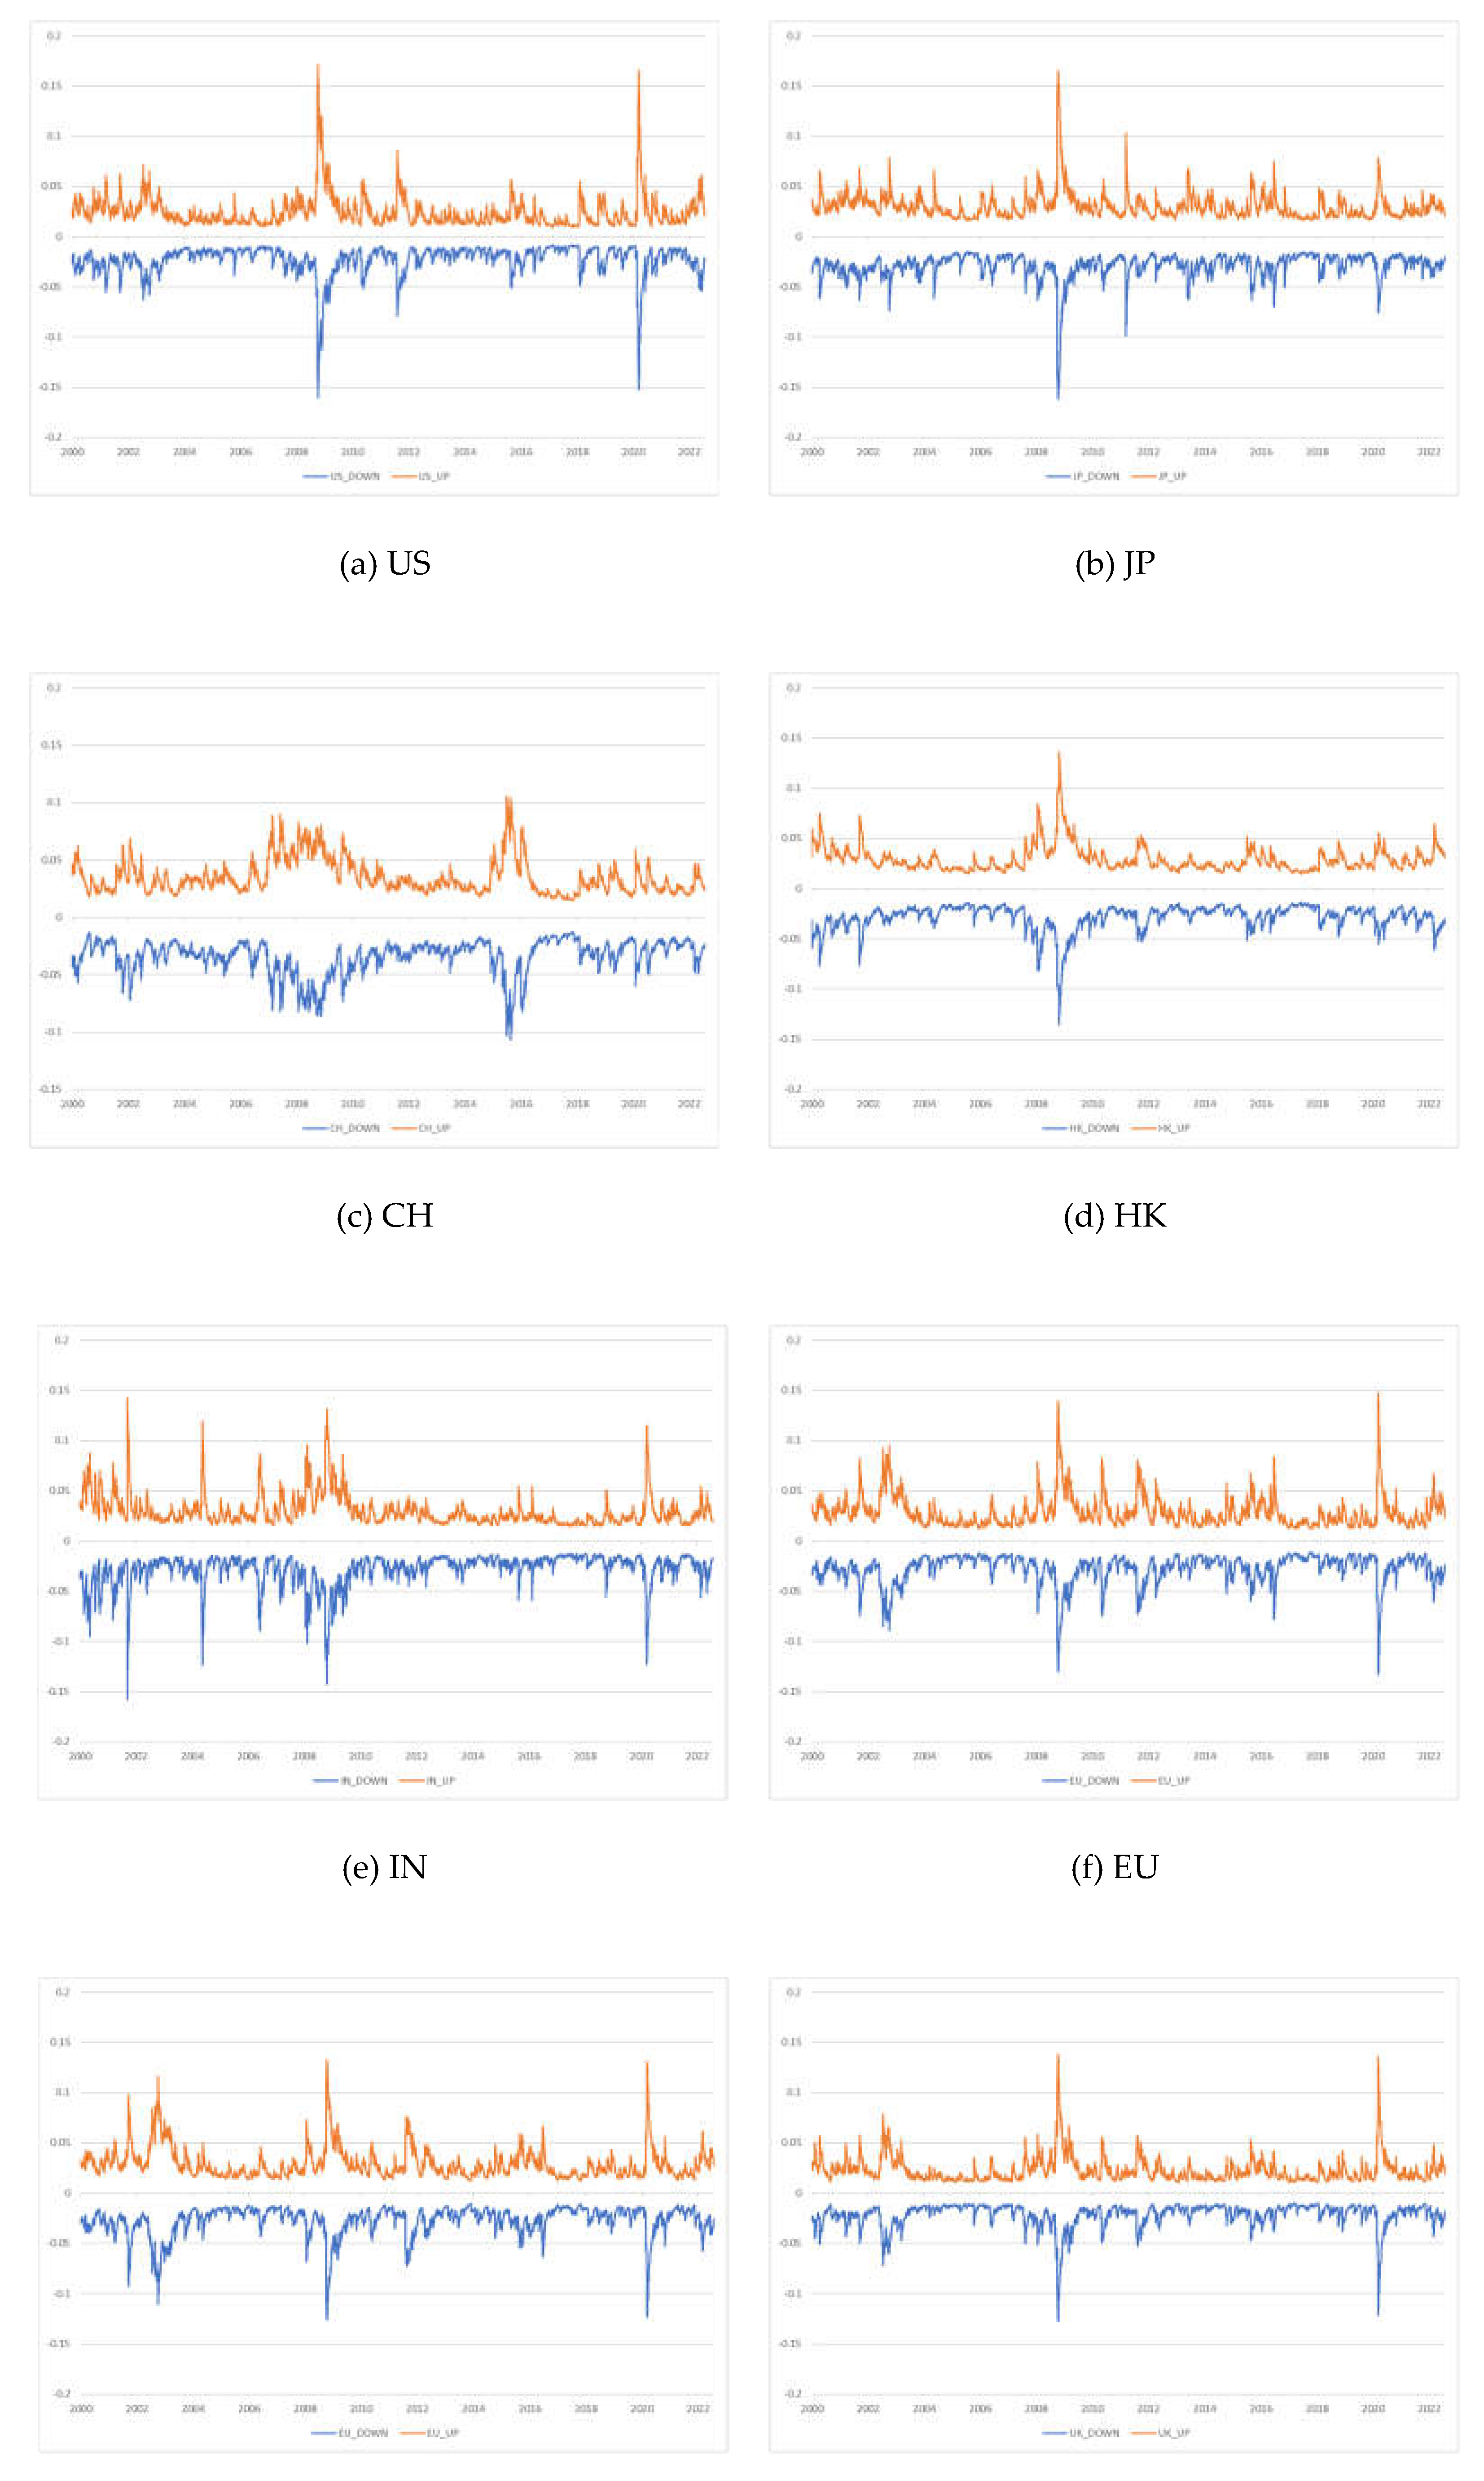
Figure 2.
Dynamics of the downside and upside VaRs.
4.2. Connectedness results
The results in this section were calculated using the VAR model and a 10-step ahead GFEVD. The risk connectedness results based on VaR among the 10 global stock markets are presented in Table 2 and Table 3. The finding presented in Table 2 for upside risk shows that the total upside risk connectedness reaches 68.99%, which suggests a high level of risk contagion in international stock markets. We find that the US, EU, GE, UK, SW, and CA are net risk transmitters, whereas the remaining stock markets are risk receivers. GE is the highest transmitter of connectedness, whereas the EU is the highest receiver of connectedness. By contrast, CH is the least transmitter and receiver of connectedness in the risk network. CH has the highest contribution of risk to its own market (67.02%), whereas, in the case of other stock markets, its own market risk connectedness is approximately 20%–30%. According to Table 3, the total downside risk connectedness reached 69.66%. We find that the US, EU, GE, UK, SW, and CA are net risk transmitters, whereas the remaining stock markets are risk receivers. This is similar to the results in Table 2. In addition, CH is high (72.29%) according to the contribution of risk to its own market. This indicates that the risk of CH is influenced more by its own risks than by external market risks in the upside and downside risks.
By comparing Table 2 and Table 3, we obtain some noteworthy results. First, the degree of total connectedness for downside risks is relatively higher than that for upside risk connectedness, indicating a high level of risk contagion for downside risks. Therefore, downside risks have a greater impact on connectedness strength than upside risks in an international stock market network. In addition, the risk contribution to one’s own stock market is higher for downside risks.
Second, there is a change in the connectedness between some stock markets. Our results show that the risk transmission of major stock markets to other markets reduces the downside risk. For example, the TO directional risk connectedness of the US fell from 90.82% (Table 2) to 83.48% (Table 3). This result persists for five stock markets (US, JP, the EU, GE, and the UK), whereas for other stock markets, the TO directional risk connectedness increases. In contrast, the FROM directional risk connectedness of the US increased in the case of downside risks from 74.12% (Table 2) to 75.14% (Table 3).
Third, these results display that while the importance of Asian stock markets in the global economy is growing, the influence of Asian stock markets on developed stock markets remains relatively insignificant. The results also confirm the importance of distinguishing between upside and downside risks when analyzing risk connectedness and risk management.
Figure 3 displays the estimation results of the net pairwise directional connectedness within the international stock market network. The size of a circle (or node) indicates the level of connectedness. If the circle's color is red, it denotes that the stock market is a risk transmitter; if it is green, it implies that the stock market is a risk receiver. The arrow (or link) indicates the direction of risk connectedness, whereas the thickness of the arrows indicates the intensity of the net pairwise connectedness. For upside risks, the net connectedness of GE is the largest, followed by the EU and the UK. Thus, the European stock market is the network's major market for pairwise risk connectedness. However, CH and IN have been shown to act as risk receivers. Figure 3(b) illustrates that the net risk connectedness of the stock market remains unchanged even at downside risks. The intensity of net pairwise connectedness from developed countries (GE, the EU, and the UK) to other countries appears similar in both upside and downside risk networks. However, this connectedness between Asian countries is lower in the case of downside risk networks. The findings revealed that the degree of connectedness depends on the risk situation. It is also observed that the developed stock markets are closely associated with both risk networks.
To investigate how extreme risk connectedness between international stock markets varies over time, we estimate the dynamic connectedness of extreme risk using the rolling-window method. We chose 200 days (approximately one year) as the rolling window length.
The time-series plot in Figure 4 illustrates the total connectedness within the upside and downside risk networks over time. Blue and gray indicate the results for the downside and upside risks, respectively. Overall, we observe that, in the case of downside risks, the strength of connectedness is larger; however, we can conclude that movements and magnitudes in the total connectedness for upside and downside risks are similar. The total connectedness for the upside and downside risk networks varies over time but is higher than 50% during the sample period. We observe higher total connectedness during specific periods (e.g., the GFC, EDC, and the COVID-19 pandemic). Our analysis reveals that the total connectedness within both networks reached the highest level (over 87%) during the GFC, followed by the COVID-19 pandemic. These results indicate that international stock markets are strongly associated with crises.
To better understand the time-varying movements of connectedness, we investigate net connectedness, which reveals information about the direction of connectedness for the 10 stock markets. A positive value refers to a transmitter of risk to other stock markets, and negative values are the opposite. Figure 5 shows the net dynamic connectedness between international stock markets for upside and downside risks. The plot distinguishes between upside and downside risks using gray and blue, respectively. We observed that all stock markets showed significant time-varying patterns; however, they were found to have a greater magnitude on the stock market in the case of downside risks. Each stock market shows this pattern because it is event-driven or affected by the way it responds to crises, economic characteristics, and geographical proximity. Overall, the US, the EU, GE, and the UK are the net transmitters; and JP, CH, HK, and IN are the net receivers of upside and downside risks. These results indicate that the European stock markets are less affected by spillover effects from other stock markets and confirm that the German stock market has the greatest influence on other stock markets. This finding aligns with the results of Youssef [14] and Zhang [78,79]. Thus, the developed stock markets continued to be net transmitters of risk during the sample periods, except for SW and CA, whereas Asian stock markets were net receivers. Although the importance of Asian stock markets has been growing recently, their influence on developed countries is relatively weak and has not increased significantly over time.
5. Conclusions
This study analyzes the dynamic connectedness of the international stock market network based on extreme risks (upside and downside risks) measured using the VaR. To the best of our knowledge, this is the first study to examine an extreme-risk network in international stock markets. We applied the DY model and used daily prices between January 5, 2000, and July 30, 2022.
This study obtained the following results: First, for the static analysis approach, the connectedness level of downside risks is relatively higher than that of upside risks, which implies that international stock markets are more sensitively associated with the fall of global stock prices. The dynamic results also show that the magnitude of connectedness is more significant in the case of downside risks, indicating that stock market networks are more likely to transmit downside risks. This finding is similar to the results of BenSaïda [71] which finds that stock markets transmit more bad volatility than good volatility. Second, reveal that economic crisis periods (e.g., the GFC, EDC, and the COVID-19 pandemic) intensify risk spillover effects across international stock markets. This indicates that the international stock market network is strengthened during the crisis period. Third, the results of the net dynamic connectedness of extreme risks show that the EU, GE, and the US act as net transmitters of dynamic spillovers, whereas JP, CH, and IN act as net receivers of dynamic spillovers. GE is the most influential international stock market in the world. Thus, developed stock markets are net transmitters of risk for all other markets, whereas Asian stock markets are net receivers of upside and downside risks.
These findings provide significant new information to policymakers and market participants. Under upside and downside risks, policymakers and risk managers should devise measures to stabilize the stock market and minimize the risk impact on the global stock market. Investors need risk management skills to minimize losses. Our analysis will be valuable for investors in mitigating significant losses and developing strategies for long-term profitability.
Author Contributions
All the authors contributed to the entire process of writing this paper. K.-H.C. and S.-M.Y. conceived the idea and designed the structure of this paper, K.-H.C. collected and examined the data and devised the methodology, K.-H.C. wrote the draft of Section 1, Section 2 and Section 3, S.-M.Y. wrote Section 4 and Section 5, and S.-M.Y. performed a final revision of the entire paper.
Funding
This work was supported by the Ministry of Education of the Republic of Korea and the National Research Foundation of Korea (NRF-2020S1A5B8103268).
Data Availability Statement
All data that support the findings of this study are obtained from Infomax (https://news.einfomax.co.kr).
Conflicts of Interest
The authors declare no conflict of interest.
References
- Abdul Karim, B.; Shabri Abd. Majid, M. Does trade matter for stock market integration? Studies in Economics and Finance 2010, 27(1), 47–66. [Google Scholar] [CrossRef]
- Albuquerque, R.; Loayza, N.; Servén, L. World market integration through the lens of foreign direct investors. Journal of International Economics 2005, 66(2), 267–295. [Google Scholar] [CrossRef]
- Bracker, K.; Docking, D.S.; Koch, P.D. Economic determinants of evolution in international stock market integration. Journal of Empirical Finance 1999, 6(1), 1–27. [Google Scholar] [CrossRef]
- Zhang, W.; Zhuang, X.; Wang, J.; Lu, Y. Connectedness and systemic risk spillovers analysis of Chinese sectors based on tail risk network. North American Journal of Economics and Finance 2020, 54, 101248. [Google Scholar] [CrossRef]
- Arreola Hernandez, J.; Kang, S.H.; Jiang, Z.; Yoon, S.-M. Spillover network among economic sentiment and economic policy uncertainty in Europe. Systems 2022, 10(4), 93. [Google Scholar] [CrossRef]
- Dong, X.; Li, C.; Yoon, S.-M. Exogenous shocks, dynamic correlations, and portfolio risk management for the Asian emerging and other global developed and emerging stock markets. Applied Economics 2020, 52(43), 4745–4764. [Google Scholar] [CrossRef]
- Dong, X.; Song, L.; Yoon, S.-M. How have the dependence structures between stock markets and economic factors changed during the COVID-19 pandemic? North American Journal of Economics and Finance 2021, 58, 101546. [Google Scholar] [CrossRef]
- Gupta, R.; Guidi, F. Cointegration relationship and time varying co-movements among Indian and Asian developed stock markets. International Review of Financial Analysis 2012, 21, 10–22. [Google Scholar] [CrossRef]
- Hanif, W.; Hernandez, J.A.; Troster, V.; Kang, S.H.; Yoon, S.-M. Nonlinear dependence and spillovers between cryptocurrency and global/regional equity markets. Pacific-Basin Finance Journal 2022, 74, 101822. [Google Scholar] [CrossRef]
- Hardouvelis, G.A.; Malliaropulos, D.; Priestley, R. EMU and European stock market integration. Journal of Business 2006, 79(1), 365–392. [Google Scholar] [CrossRef]
- Hedström, A.; Zelander, N.; Junttila, J.; Uddin, G.S. Emerging market contagion under geopolitical uncertainty. Emerging Markets Finance and Trade 2020, 56(6), 1377–1401. [Google Scholar] [CrossRef]
- BenSaïda, A.; Hernandez, J.A.; Litimi, H.; Yoon, S.-M. The influence of oil, gold and stock market index on US equity sectors. Applied Economics 2022, 54(6), 719–732. [Google Scholar] [CrossRef]
- Wu, F. Stock market integration in East and Southeast Asia: The role of global factors. International Review of Financial Analysis 2020, 67, 101416. [Google Scholar] [CrossRef]
- Youssef, M.; Mokni, K.; Ajmi, A.N. Dynamic connectedness between stock markets in the presence of the COVID-19 pandemic: Does economic policy uncertainty matter? Financial Innovation 2021, 7, 13. [Google Scholar] [CrossRef] [PubMed]
- Diebold, F.X.; Yilmaz, K. Measuring financial asset return and volatility spillovers, with application to global equity markets. Economic Journal 2009, 119(534), 158–171. [Google Scholar] [CrossRef]
- Zhou, X.; Zhang, W.; Zhang, J. Volatility spillovers between the Chinese and world equity markets. Pacific-Basin Finance Journal 2012, 20(2), 247–270. [Google Scholar] [CrossRef]
- Tsai, I.C. Spillover of fear: Evidence from the stock markets of five developed countries. International Review of Financial Analysis 2014, 33, 281–288. [Google Scholar] [CrossRef]
- Liow, K.H. Volatility spillover dynamics and relationship across G7 financial markets. North American Journal of Economics and Finance 2015, 33, 328–365. [Google Scholar] [CrossRef]
- Cepoi, C.O. Asymmetric dependence between stock market returns and news during COVID-19 financial turmoil. Finance Research Letters 2020, 36, 101658. [Google Scholar] [CrossRef]
- Su, X. Measuring extreme risk spillovers across international stock markets: A quantile variance decomposition analysis. North American Journal of Economics and Finance 2020, 51, 101098. [Google Scholar] [CrossRef]
- Izzeldin, M.; Muradoğlu, Y.G.; Pappas, V.; Sivaprasad, S. The impact of Covid-19 on G7 stock markets volatility: Evidence from a ST-HAR model. International Review of Financial Analysis 2021, 74, 101671. [Google Scholar] [CrossRef] [PubMed]
- Liu, Y.; Wei, Y.; Wang, Q.; Liu, Y. International stock market risk contagion during the COVID-19 pandemic. Finance Research Letters 2022, 45, 102145. [Google Scholar] [CrossRef] [PubMed]
- Acharya, V.; Engle, R.; Richardson, M. Capital shortfall: A new approach to ranking and regulating systemic risks. American Economic Review 2012, 102(3), 59–64. [Google Scholar] [CrossRef]
- Andrieş, A.M.; Ongena, S.; Sprincean, N.; Tunaru, R. Risk spillovers and interconnectedness between systemically important institutions. Journal of Financial Stability 2022, 58, 100963. [Google Scholar] [CrossRef]
- Cui, X.; Yang, L. Systemic risk and idiosyncratic networks among global systemically important banks. International Journal of Finance & Economics. 2022, forthcoming. [CrossRef]
- Nguyen, L.H.; Nguyen, L.X.; Tan, L. Tail risk connectedness between US industries. International Journal of Finance & Economics 2021, 26(3), 3624–3650. [Google Scholar] [CrossRef]
- Du, Y.; Zhang, X.; Ding, Z.; Yang, X. Multiscale tail risk connectedness of global stock markets: A LASSO-based network topology approach. Complexity 2022, 2022, 7635144. [Google Scholar] [CrossRef]
- Tian, M.; Jiang, Y.; Wang, B.; Dong, Y.; Chen, Y.; Shi, B. Downside and upside risk spillovers from commercial banks into China’s financial system: A new copula quantile regression-based CoVaR model. Economic Research-Ekonomska Istraživanja 2023, 36(1), 2120037. [Google Scholar] [CrossRef]
- Glosten, L.R.; Jagannathan, R.; Runkle, D.E. On the relation between the expected value and the volatility of the nominal excess return on stocks. Journal of Finance 1993, 48(5), 1779–1801. [Google Scholar] [CrossRef]
- Diebold, F.X.; Yilmaz, K. Better to give than to receive: Predictive directional measurement of volatility spillovers. International Journal of Forecasting 2012, 28(1), 57–66. [Google Scholar] [CrossRef]
- Diebold, F.X.; Yılmaz, K. On the network topology of variance decompositions: Measuring the connectedness of financial firms. Journal of Econometrics 2014, 182(1), 119–134. [Google Scholar] [CrossRef]
- Wu, F. Sectoral contributions to systemic risk in the Chinese stock market. Finance Research Letters 2019, 31, 386–390. [Google Scholar] [CrossRef]
- Wu, F.; Zhang, D.; Zhang, Z. Connectedness and risk spillovers in China’s stock market: A sectoral analysis. Economic Systems 2019, 43(3–4), 100718. [Google Scholar] [CrossRef]
- Zhang, D.; Hu, M.; Ji, Q. Financial markets under the global pandemic of COVID-19. Finance Research Letters 2020, 36, 101528. [Google Scholar] [CrossRef] [PubMed]
- Arreola Hernandez, J.; Kang, S.H.; McIver, R.P.; Yoon, S.-M. Network interdependence and optimization of bank portfolios from developed and emerging Asia Pacific countries. Asia-Pacific Financial Markets 2021, 28(4), 613–647. [Google Scholar] [CrossRef]
- Ngene, G.M. What drives dynamic connectedness of the US equity sectors during different business cycles? North American Journal of Economics and Finance 2021, 58, 101493. [Google Scholar] [CrossRef]
- Wu, F.; Zhang, D.; Ji, Q. Systemic risk and financial contagion across top global energy companies. Energy Economics 2021, 97, 105221. [Google Scholar] [CrossRef]
- Shen, Y.-Y.; Jiang, Z.-Q.; Ma, J.-C.; Wang, G.-J.; Zhou, W.-X. Sector connectedness in the Chinese stock markets. Empirical Economics 2022, 62(2), 825–852. [Google Scholar] [CrossRef]
- Chi, K.T.; Liu, J.; Lau, F.C. A network perspective of the stock market. Journal of Empirical Finance 2010, 17(4), 659–667. [Google Scholar] [CrossRef]
- Giroud, X.; Mueller, H.M. Firms' internal networks and local economic shocks. American Economic Review 2019, 109(10), 3617–3649. [Google Scholar] [CrossRef]
- Zhou, Y.; Chen, Z.; Liu, Z. Dynamic analysis and community recognition of stock price based on a complex network perspective. Expert Systems with Applications 2023, 213, 118944. [Google Scholar] [CrossRef]
- Granger, C.W.J. Investigating causal relations by econometric models and cross-spectral methods. Econometrica 1969, 37(3), 424–438. [Google Scholar] [CrossRef]
- Billio, M.; Getmansky, M.; Lo, A.W.; Pelizzon, L. Econometric measures of connectedness and systemic risk in the finance and insurance sectors. Journal of Financial Economics 2012, 104(3), 535–559. [Google Scholar] [CrossRef]
- Výrost, T.; Lyócsa, Š.; Baumöhl, E. Granger causality stock market networks: Temporal proximity and preferential attachment. Physica A 2015, 427, 262–276. [Google Scholar] [CrossRef]
- Wang, G.-J.; Xie, C.; He, K.; Stanley, H.E. Extreme risk spillover network: Application to financial institutions. Quantitative Finance 2017, 17(9), 1417–1433. [Google Scholar] [CrossRef]
- Shannon, C.E. A mathematical theory of communication. Bell System Technical Journal 1948, 27(3), 379–423. [Google Scholar] [CrossRef]
- Schreiber, T. Measuring information transfer. Physical Review Letters 2000, 85(2), 461–464. [Google Scholar] [CrossRef] [PubMed]
- Sensoy, A.; Sobaci, C.; Sensoy, S.; Alali, F. Effective transfer entropy approach to information flow between exchange rates and stock markets. Chaos, Solitons & Fractals 2014, 68, 180–185. [Google Scholar] [CrossRef]
- Gong, C.; Tang, P.; Wang, Y. Measuring the network connectedness of global stock markets. Physica A 2019, 535, 122351. [Google Scholar] [CrossRef]
- Nicola, G.; Cerchiello, P.; Aste, T. Information network modeling for US banking systemic risk. Entropy 2020, 22(11), 1331. [Google Scholar] [CrossRef]
- García-Medina, A.; Luu Duc Huynh, T. What drives bitcoin? An approach from continuous local transfer entropy and deep learning classification models. Entropy 2021, 23(12), 1582. [Google Scholar] [CrossRef]
- Tiwari, A.K.; Jena, S.K.; Abakah, E.J.A.; Yoon, S.-M. Does the dynamics between government bond and equity markets validate the adaptive market hypothesis? Evidence from transfer entropy. Applied Economics 2023, forthcoming. [Google Scholar] [CrossRef]
- Münnix, M.C.; Schäfer, R. A copula approach on the dynamics of statistical dependencies in the US stock market. Physica A 2011, 390(23–24), 4251–4259. [Google Scholar] [CrossRef]
- Changqing, L.; Chi, X.; Cong, Y.; Yan, X. Measuring financial market risk contagion using dynamic MRS-Copula models: The case of Chinese and other international stock markets. Economic Modelling 2015, 51, 657–671. [Google Scholar] [CrossRef]
- Xixi, L.; Qiang, W.; Suling, J. Analysis of topological properties of complex network of Chinese stock based on Copula tail correlation. Paper presented at the 2017 International conference on service systems and service management, 2017.
- Wen, F.; Yang, X.; Zhou, W.X. Tail dependence networks of global stock markets. International Journal of Finance & Economics 2019, 24(1), 558–567. [Google Scholar] [CrossRef]
- Mensi, W.; Hernandez, J.A.; Yoon, S.-M.; Vo, X.V.; Kang, S.H. Spillovers and connectedness between major precious metals and major currency markets: The role of frequency factor. International Review of Financial Analysis 2021, 74, 101672. [Google Scholar] [CrossRef]
- Arreola Hernandez, J.; Kang, S.H.; Yoon, S.-M. Spillovers and portfolio optimization of precious metals and global/regional equity markets. Applied Economics 2022, 54(20), 2320–2342. [Google Scholar] [CrossRef]
- Kang, S.H.; Hernandez, J.A.; Rehman, M.U.; Shahzad, S.J.H.; Yoon, S.-M. Spillovers and hedging between US equity sectors and gold, oil, Islamic stocks and implied volatilities. Resources Policy 2023, 81, 103286. [Google Scholar] [CrossRef]
- Demirer, M.; Diebold, F.X.; Liu, L.; Yilmaz, K. Estimating global bank network connectedness. Journal of Applied Econometrics 2018, 33(1), 1–15. [Google Scholar] [CrossRef]
- Baruník, J.; Křehlík, T. Measuring the frequency dynamics of financial connectedness and systemic risk. Journal of Financial Econometrics 2018, 16(2), 271–296. [Google Scholar] [CrossRef]
- Baruník, J.; Kocenda, E. Total, asymmetric and frequency connectedness between oil and forex markets. CESifo Working Paper, No. 7756, Center for Economic Studies and ifo Institute (CESifo), Munich, 2019. [CrossRef]
- Chatziantoniou, I.; Gabauer, D.; Marfatia, H.A. Dynamic connectedness and spillovers across sectors: Evidence from the Indian stock market. Scottish Journal of Political Economy 2022, 69(3), 283–300. [Google Scholar] [CrossRef]
- Zhou, D.-h.; Liu, X.-x.; Tang, C.; Yang, G.-y. Time-varying risk spillovers in Chinese stock market–New evidence from high-frequency data. North American Journal of Economics and Finance 2023, 64, 101870. [Google Scholar] [CrossRef]
- Alshater, M.M.; Polat, O.; El Khoury, R.; Yoon, S.-M. Dynamic connectedness among regional FinTech indices in times of turbulences. Applied Economics Letters 2023, forthcoming. [Google Scholar] [CrossRef]
- Adrian, T.; Brunnermeier, M.K. CoVaR. American Economic Review 2016, 106(7), 1705–1741. [Google Scholar] [CrossRef]
- Al-Yahyaee, K.H.; Shahzad, S.J.H.; Mensi, W.; Yoon, S.-M. Is there a systemic risk between Sharia, Sukuk, and GCC stock markets? A ΔCoVaR risk metric-based copula approach. International Journal of Finance & Economics 2021, 26(2), 2904–2926. [Google Scholar] [CrossRef]
- Wu, J.; Zhang, C.; Chen, Y. Analysis of risk correlations among stock markets during the COVID-19 pandemic. International Review of Financial Analysis 2022, 83, 102220. [Google Scholar] [CrossRef] [PubMed]
- Hanif, W.; Hernandez, J.A.; Mensi, W.; Kang, S.H.; Uddin, G.S.; Yoon, S.-M. Nonlinear dependence and connectedness between clean/renewable energy sector equity and European emission allowance prices. Energy Economics 2021, 101, 105409. [Google Scholar] [CrossRef]
- Baruník, J.; Kočenda, E.; Vácha, L. Asymmetric connectedness on the US stock market: Bad and good volatility spillovers. Journal of Financial Markets 2016, 27, 55–78. [Google Scholar] [CrossRef]
- BenSaïda, A. Good and bad volatility spillovers: An asymmetric connectedness. Journal of Financial Markets 2019, 43, 78–95. [Google Scholar] [CrossRef]
- Li, W. COVID-19 and asymmetric volatility spillovers across global stock markets. North American Journal of Economics and Finance 2021, 58, 101474. [Google Scholar] [CrossRef]
- Mensi, W.; Maitra, D.; Vo, X.V.; Kang, S.H. Asymmetric volatility connectedness among main international stock markets: A high frequency analysis. Borsa Istanbul Review 2021, 21(3), 291–306. [Google Scholar] [CrossRef]
- Mensi, W.; Nekhili, R.; Vo, X.V.; Suleman, T.; Kang, S.H. Asymmetric volatility connectedness among US stock sectors. North American Journal of Economics and Finance 2021, 56, 101327. [Google Scholar] [CrossRef]
- Shahzad, S.J.H.; Naeem, M.A.; Peng, Z.; Bouri, E. Asymmetric volatility spillover among Chinese sectors during COVID-19. International Review of Financial Analysis 2021, 75, 101754. [Google Scholar] [CrossRef] [PubMed]
- Koop, G.; Pesaran, M.H.; Potter, S.M. Impulse response analysis in nonlinear multivariate models. Journal of Econometrics 1996, 74(1), 119–147. [Google Scholar] [CrossRef]
- Pesaran, H.H.; Shin, Y. Generalized impulse response analysis in linear multivariate models. Economics Letters 1998, 58(1), 17–29. [Google Scholar] [CrossRef]
- Zhang, W.; Zhuang, X.; Wu, D. Spatial connectedness of volatility spillovers in G20 stock markets: Based on block models analysis. Finance Research Letters 2020, 34, 101274. [Google Scholar] [CrossRef]
- Zhang, Y.; Chen, R.; Ma, D. A weighted and directed perspective of global stock market connectedness: A variance decomposition and GERGM framework. Sustainability 2020, 12(11), 4605. [Google Scholar] [CrossRef]
Figure 1.
Daily returns of international stock markets.
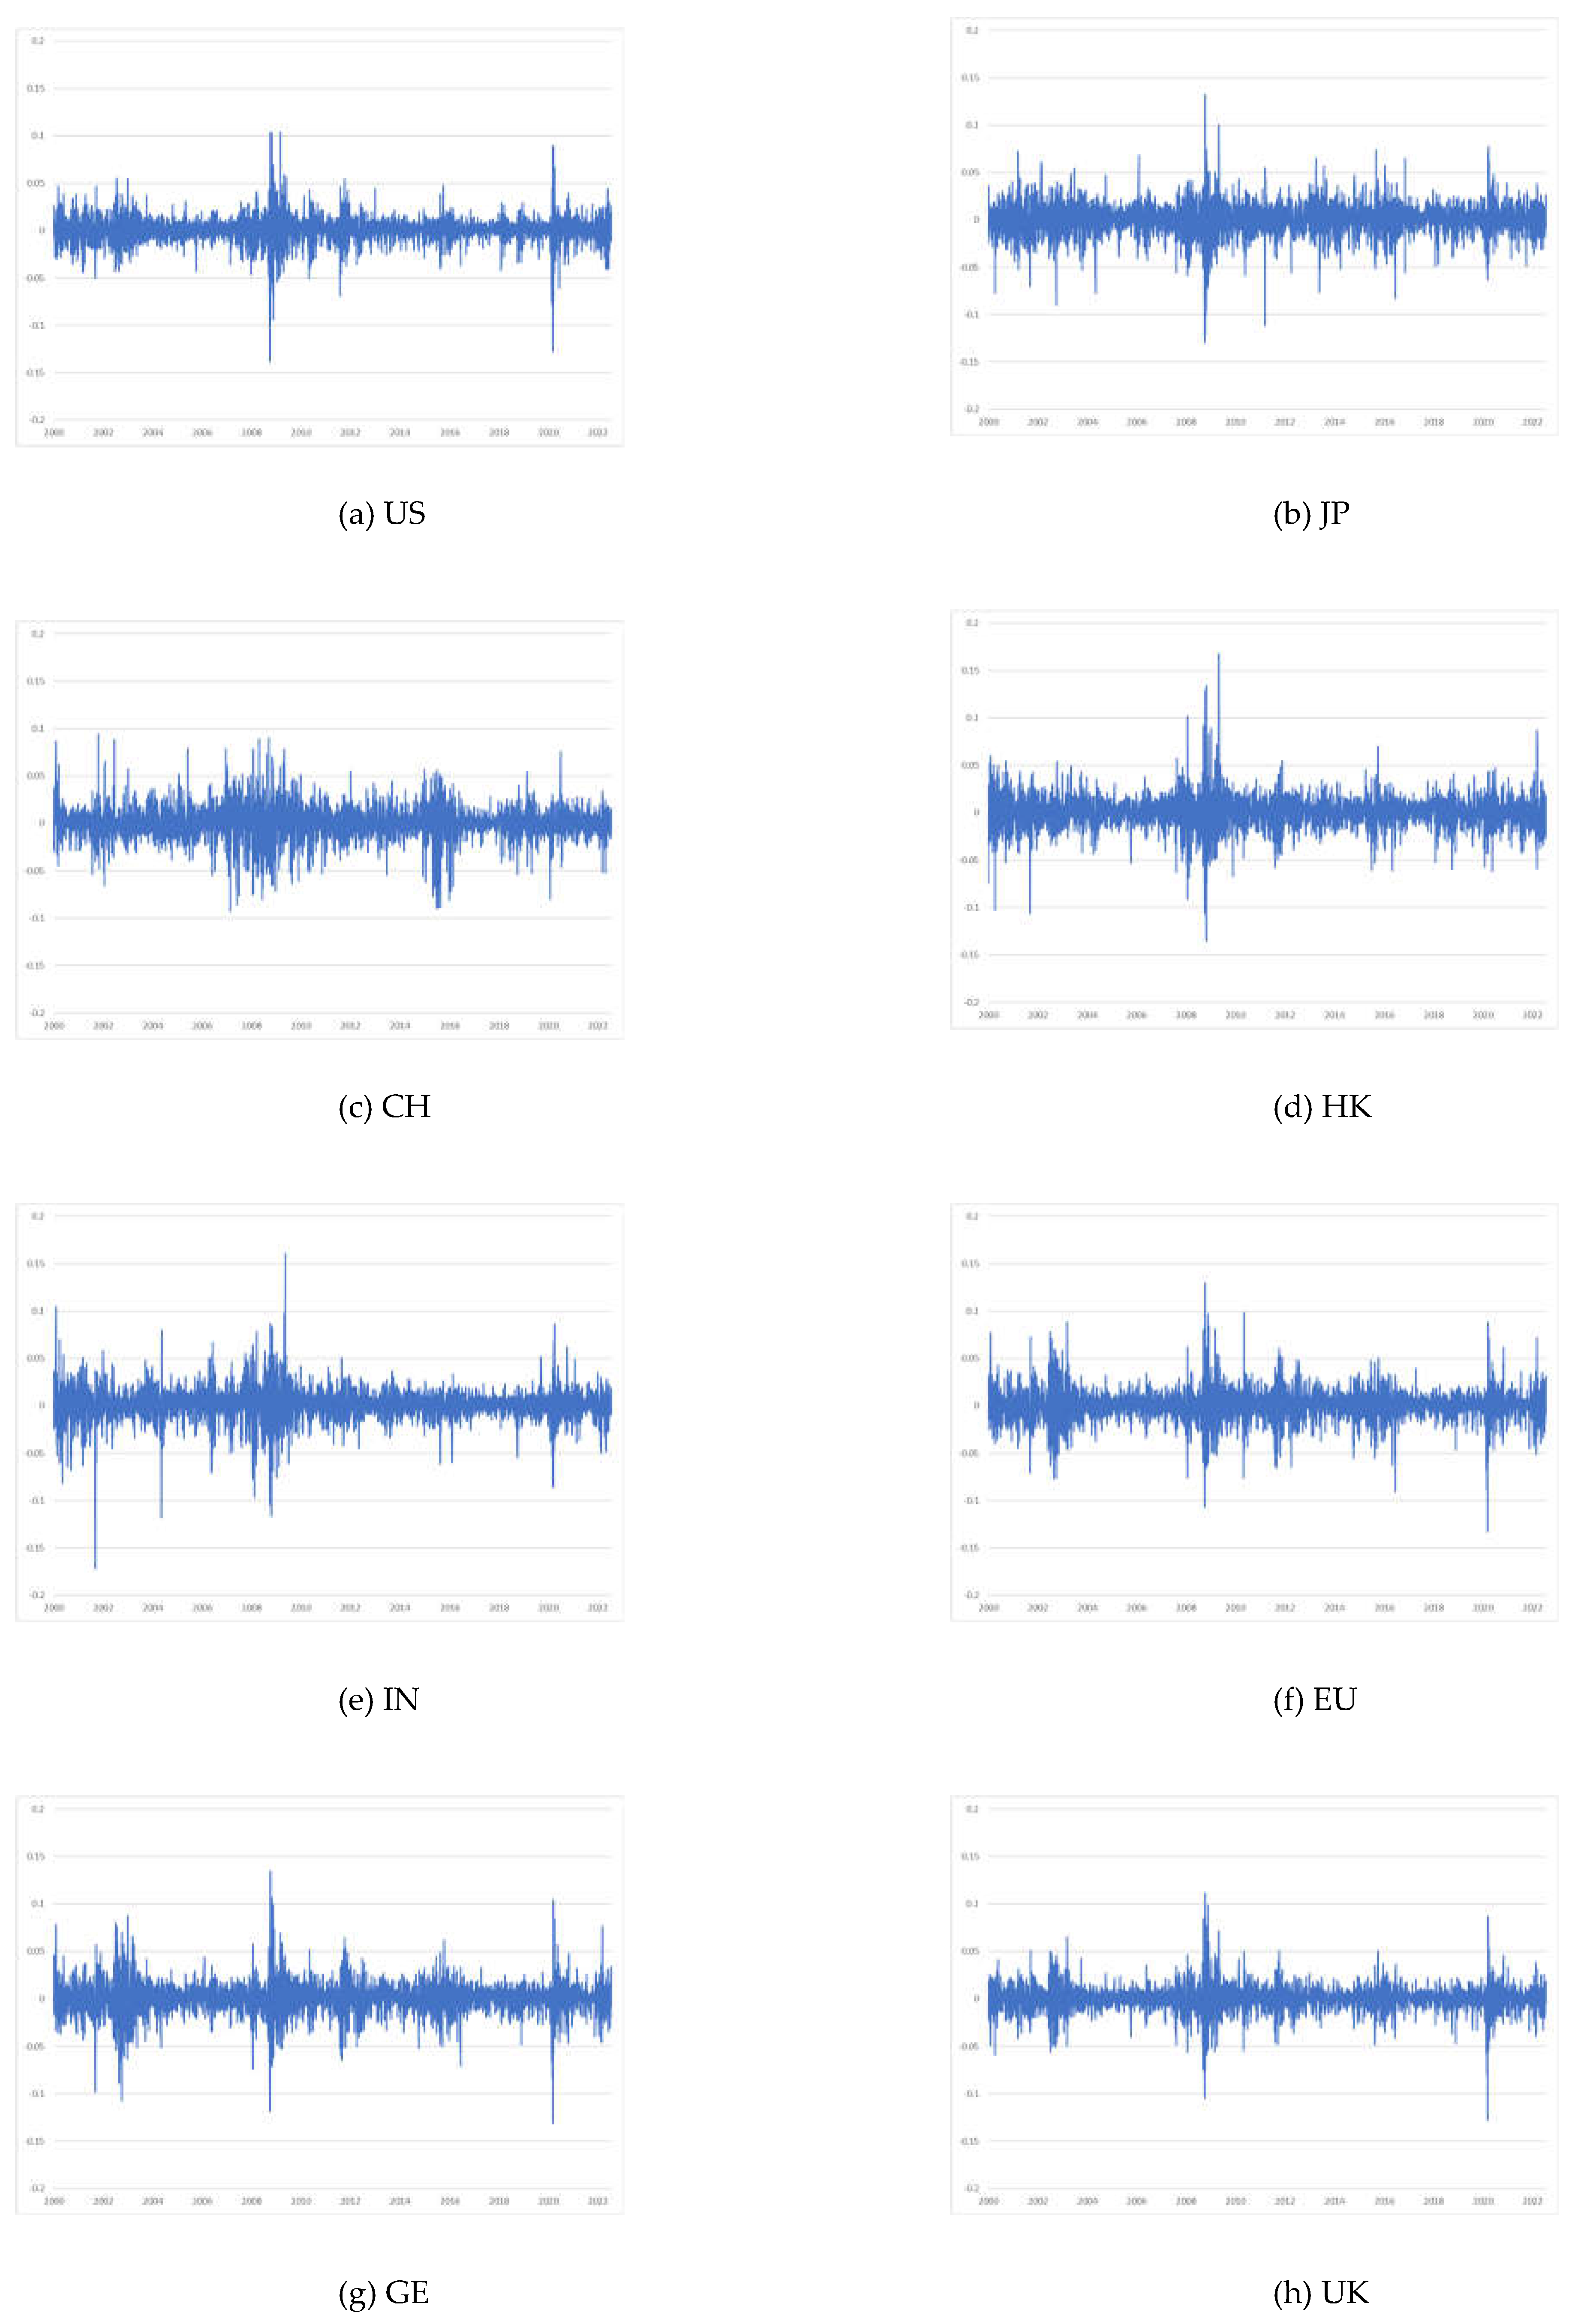
Figure 3.
Net pairwise connectedness within the international stock market networks.
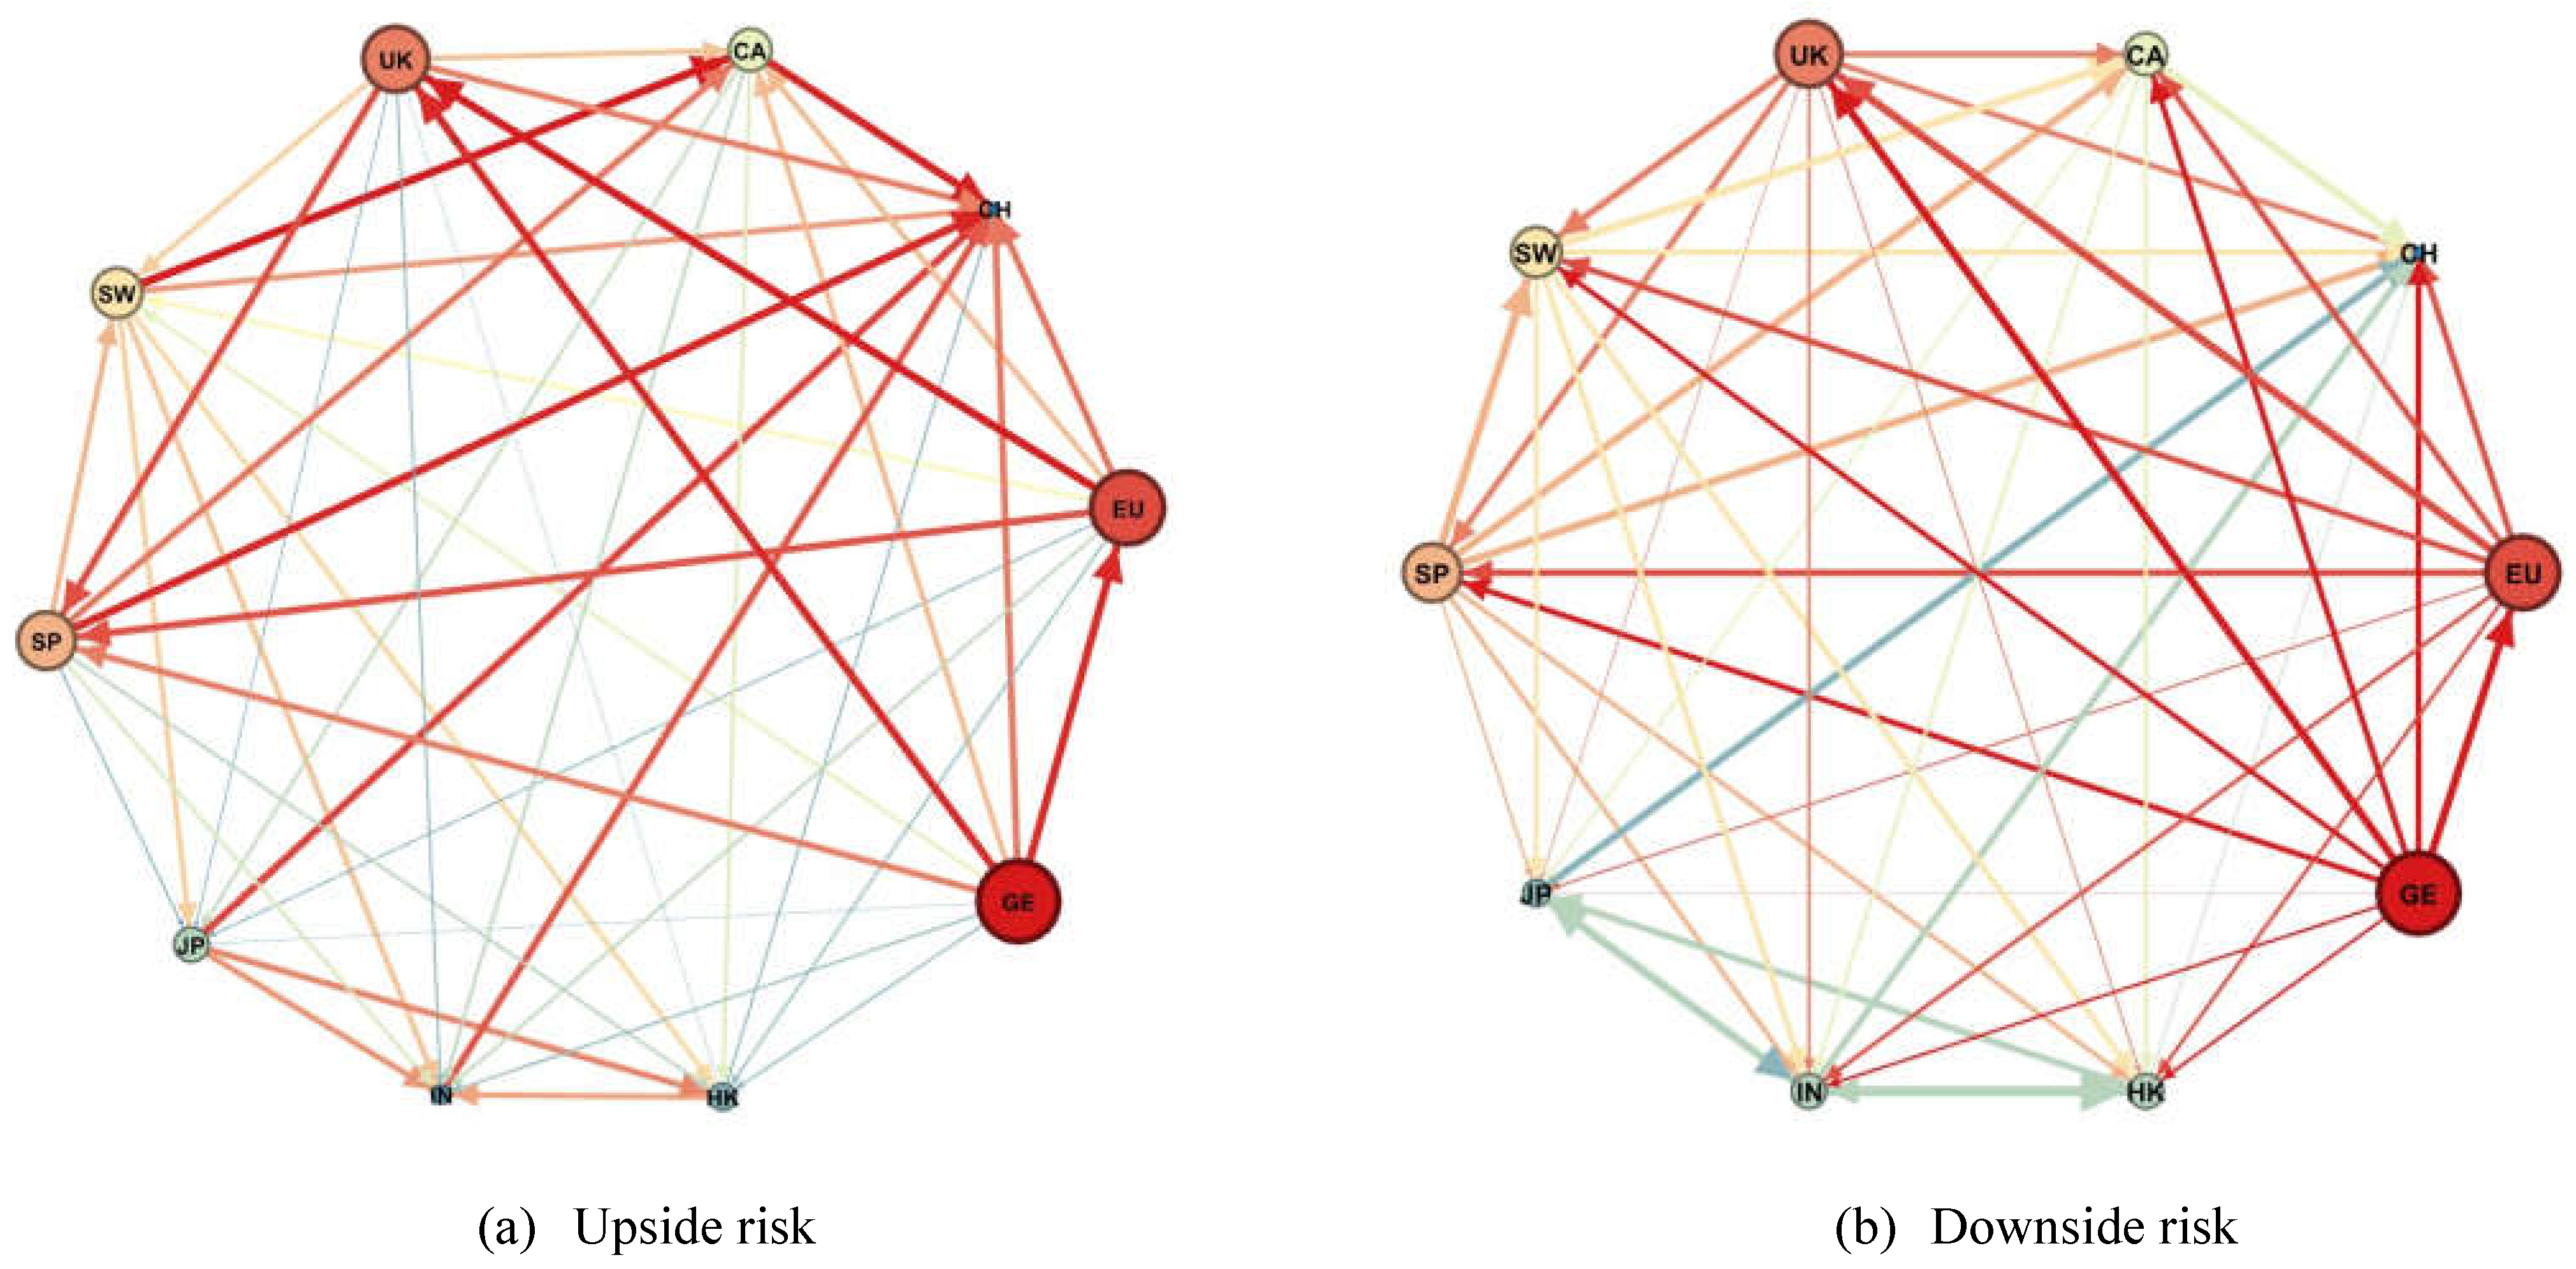
Figure 4.
Total dynamic connectedness for upside and downside risks.
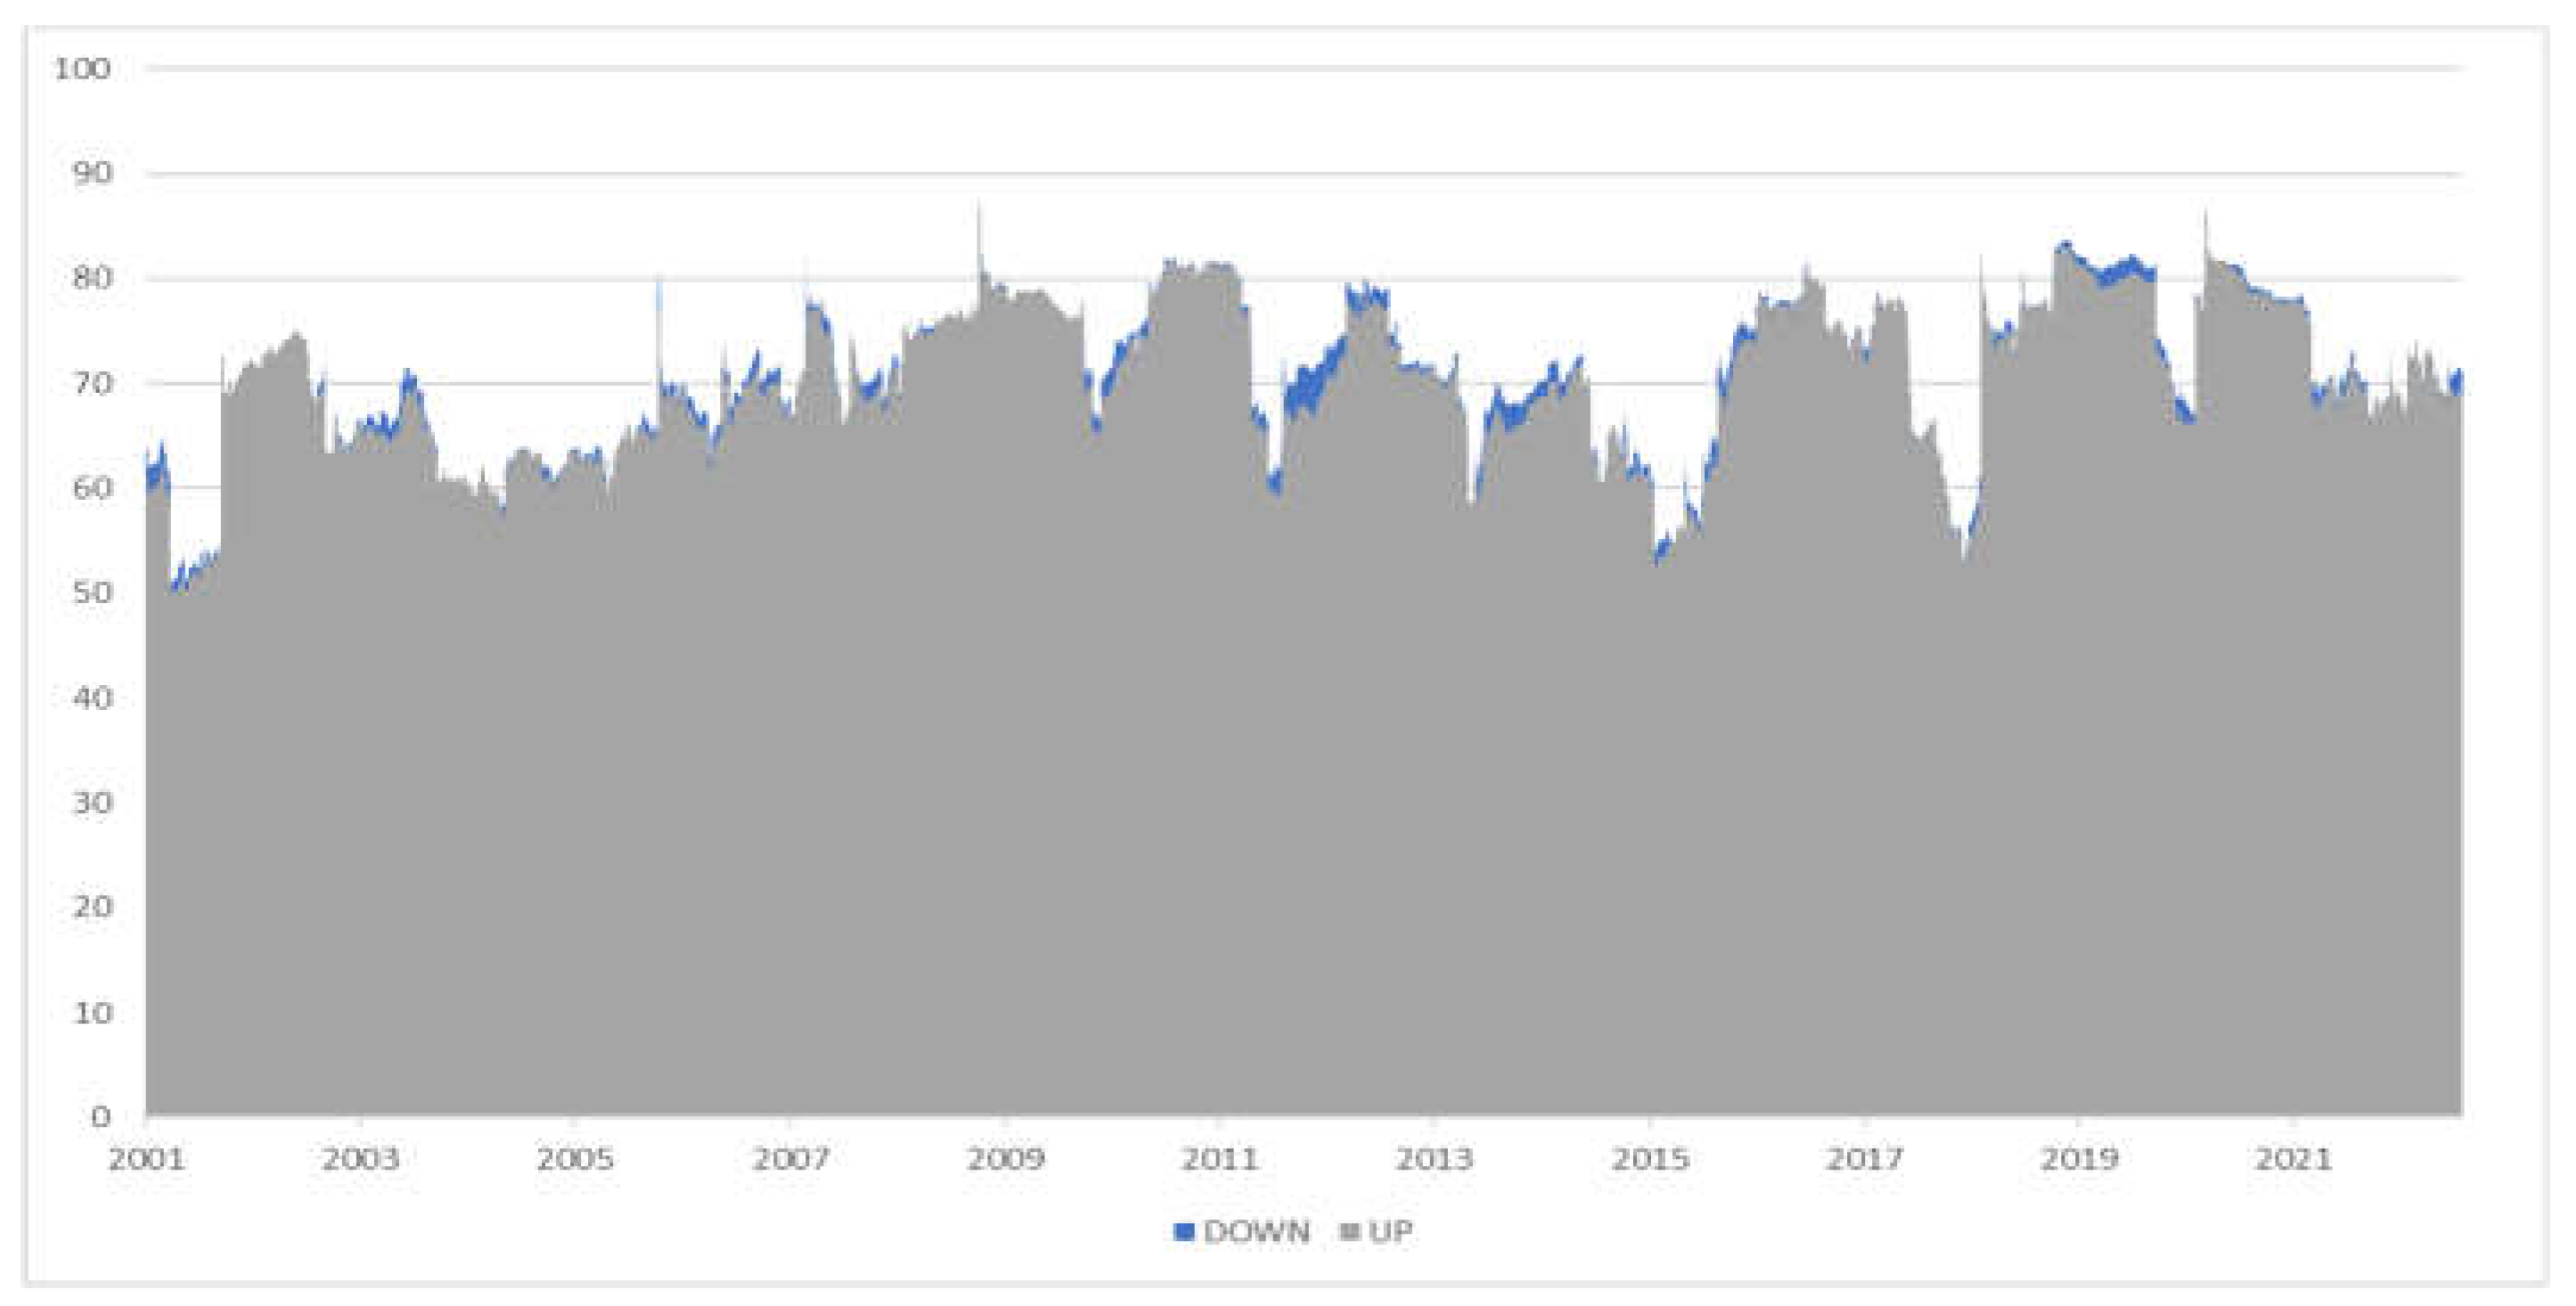
Figure 5.
Dynamics of net connectedness of upside and downside risk networks.
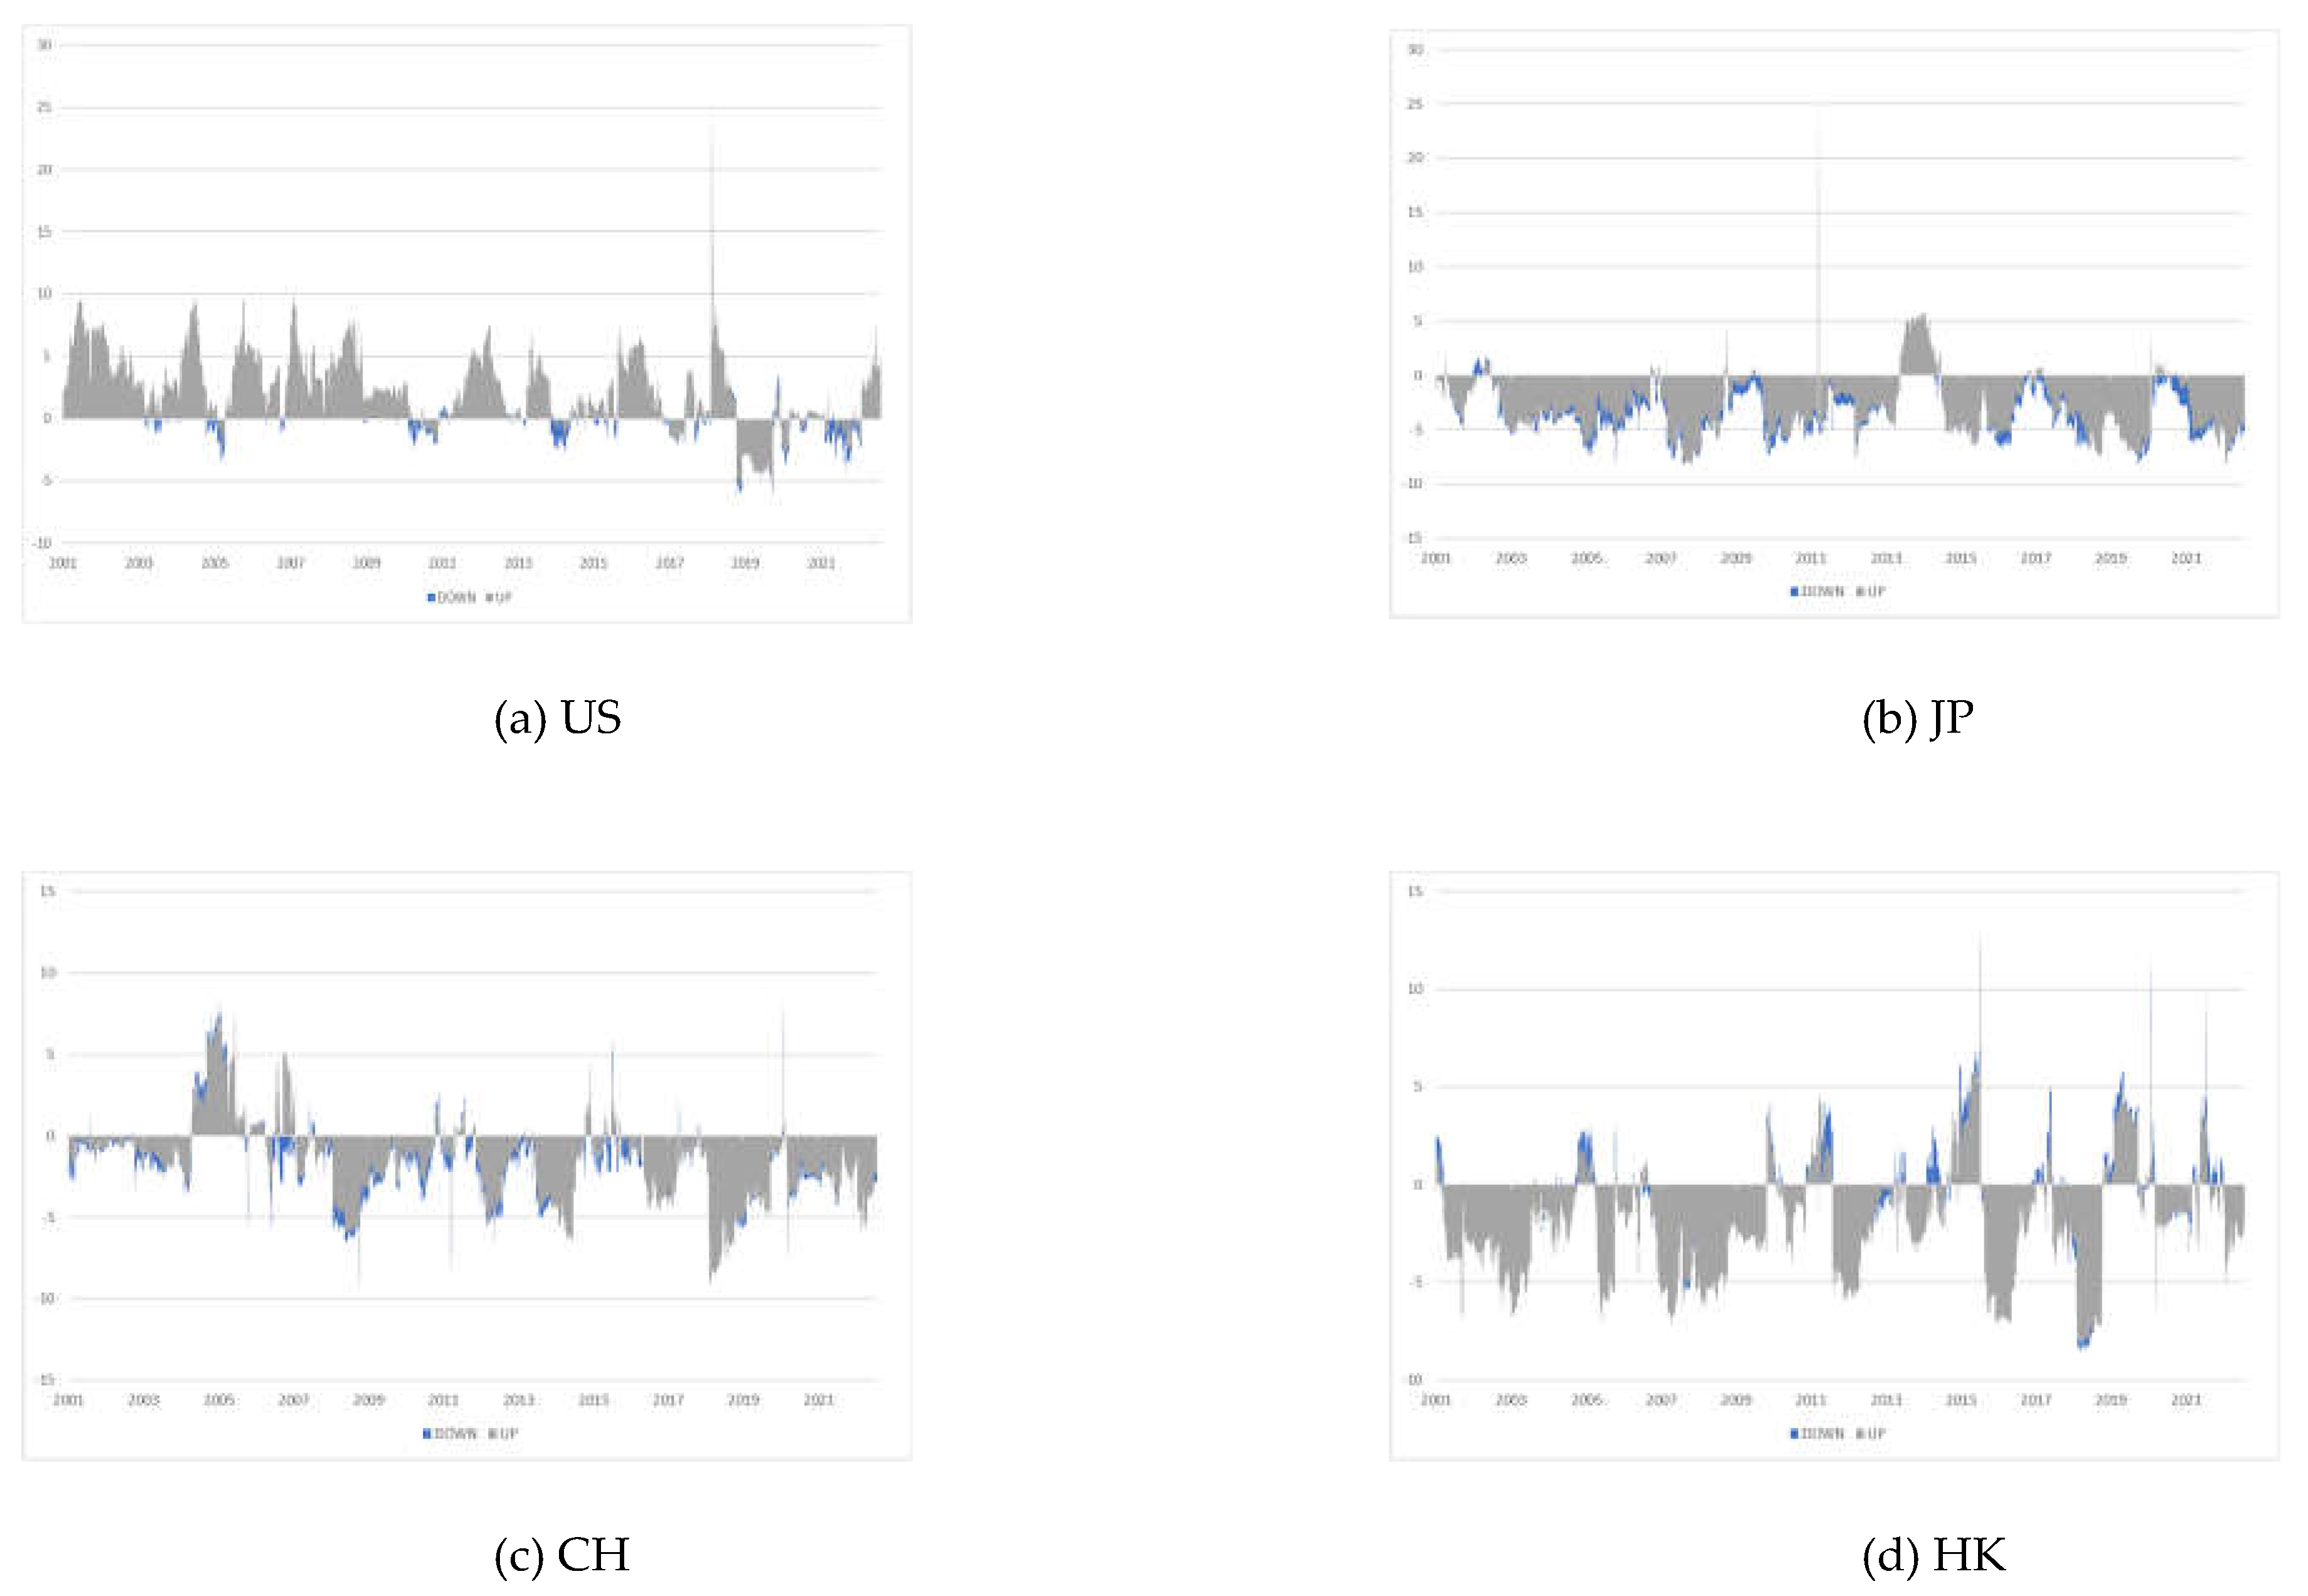
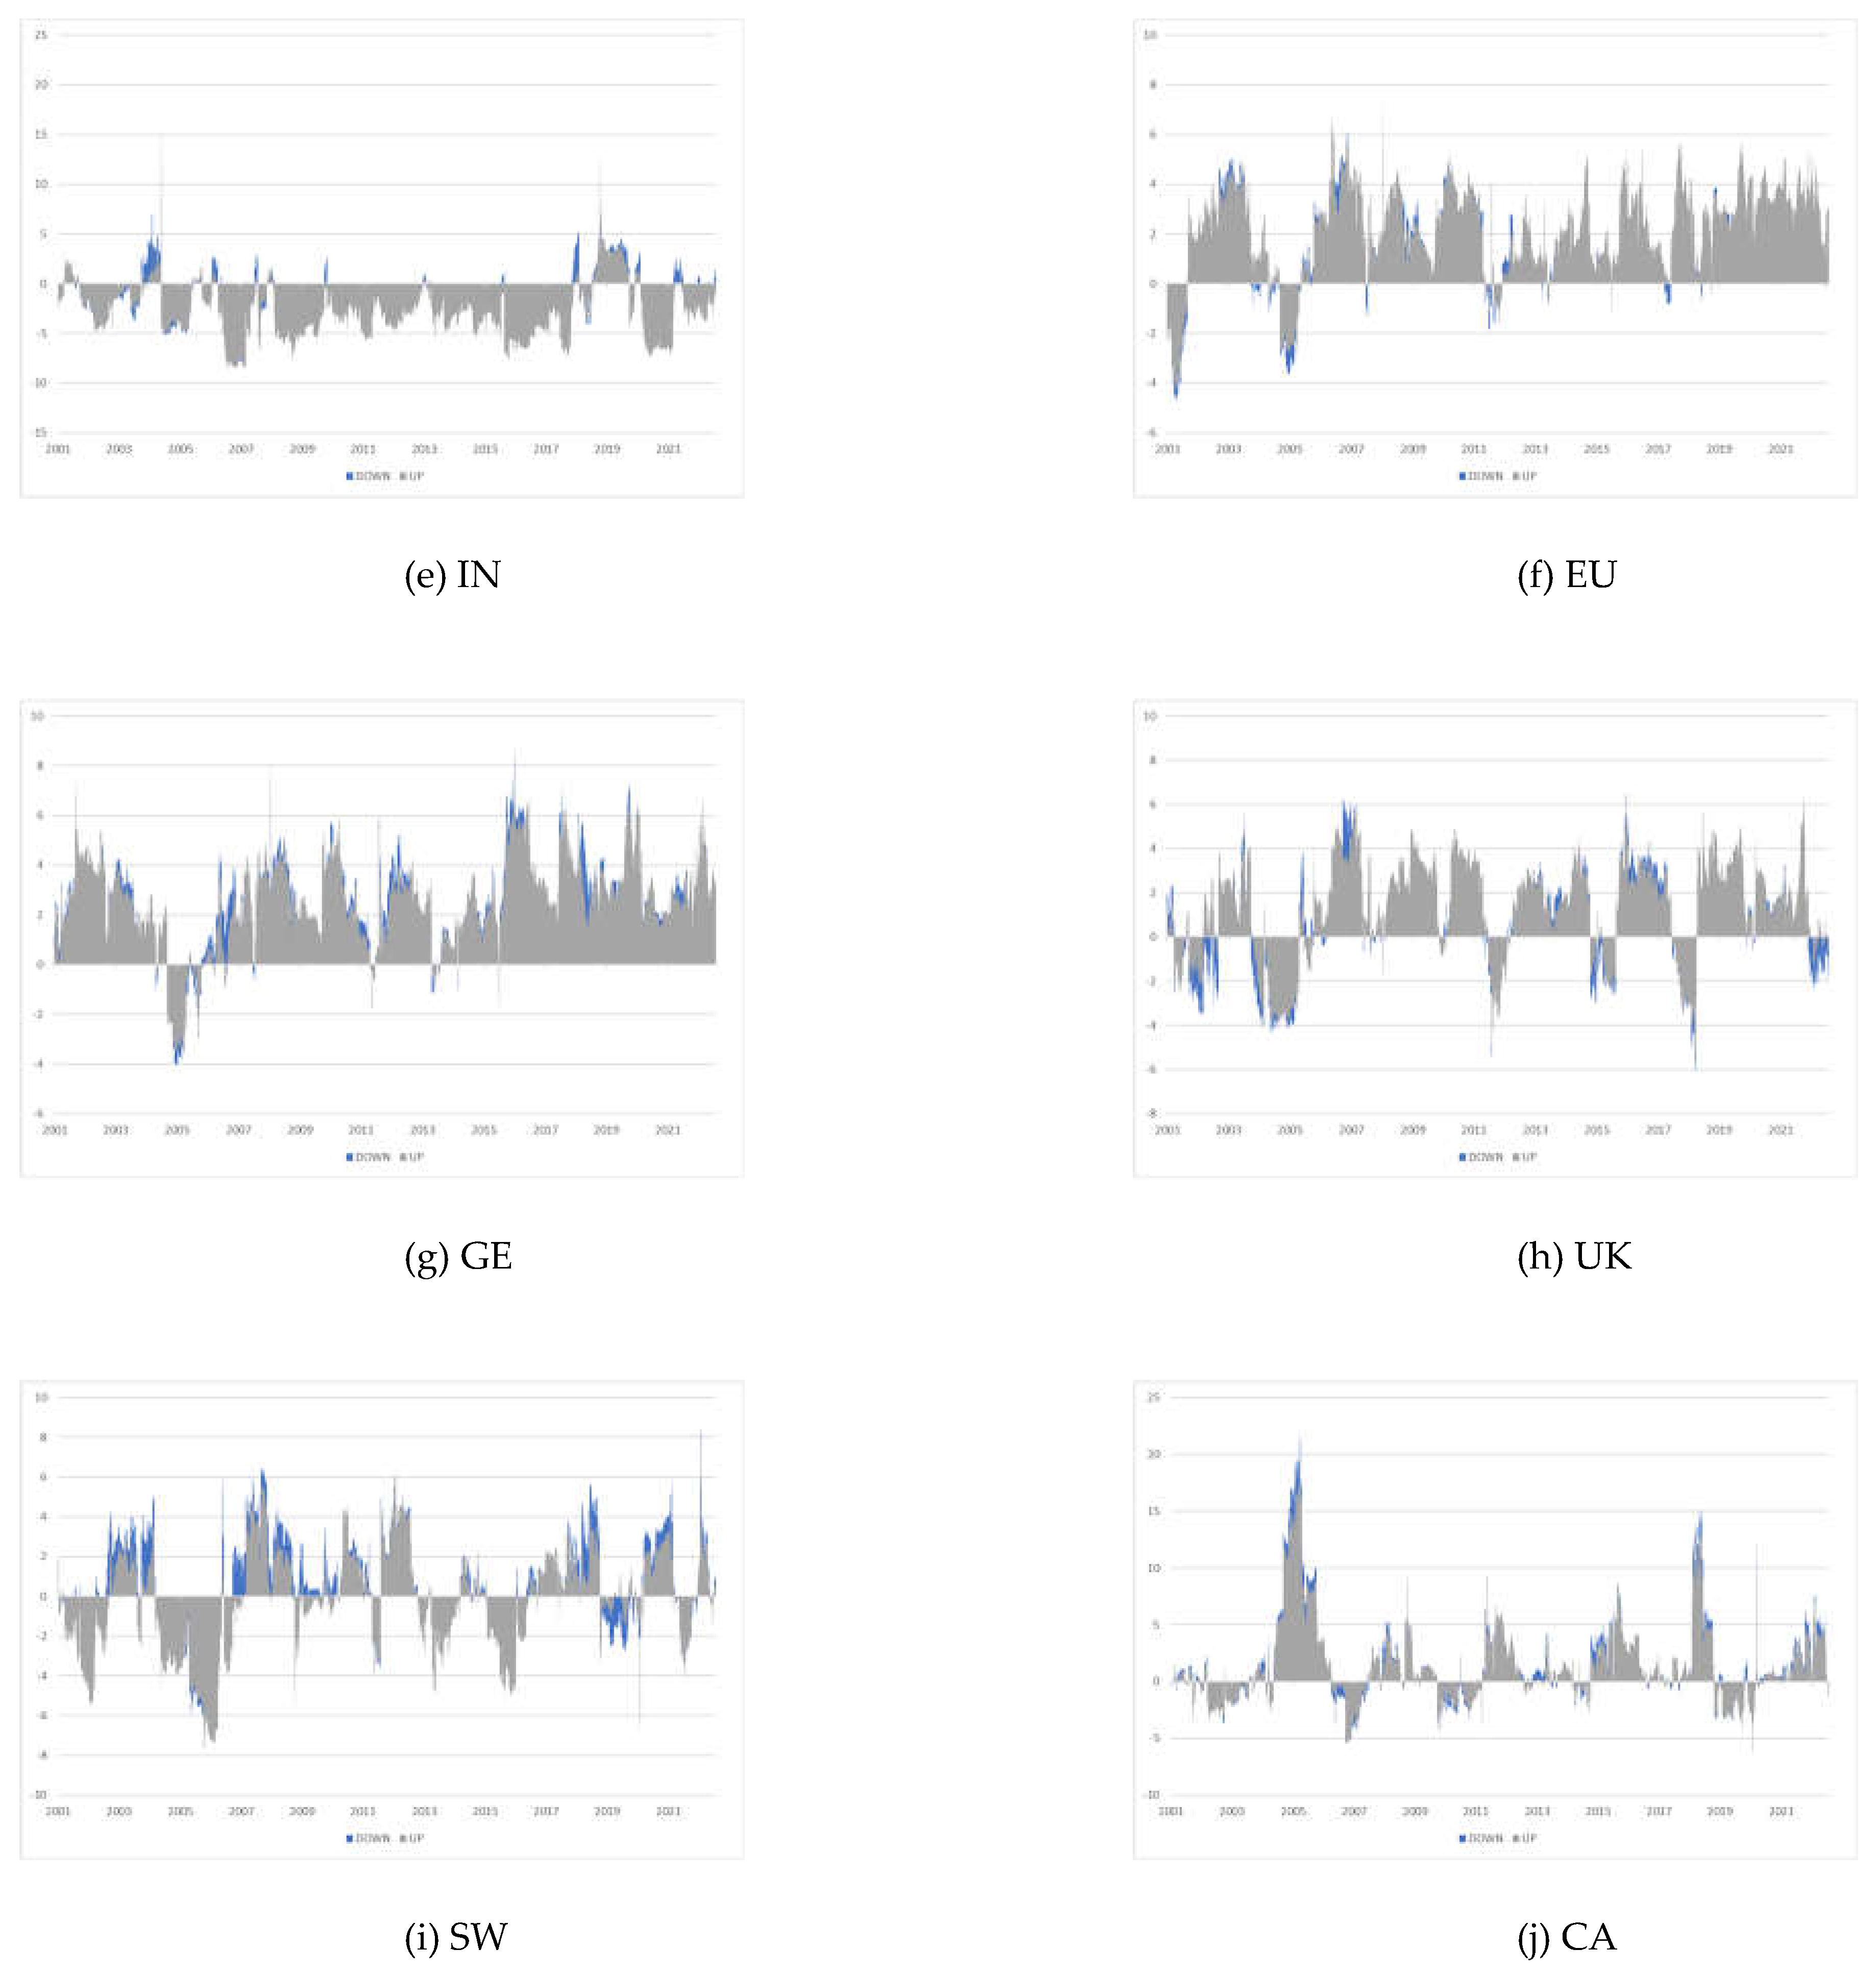

Table 1.
Indicators of the summary statistics.
| Minimum | Maximum | Mean | Standard Deviation | Skewness | Kurtosis | J-B | ADF | |
| US | −0.1378 | 0.1042 | 0.0002 | 0.0136 | −0.5470 | 14.6547 | 26144*** | −32.9848*** |
| JP | −0.1292 | 0.1323 | 0.0001 | 0.0161 | −0.4801 | 9.8654 | 9168*** | −67.6401*** |
| CH | −0.0926 | 0.0940 | 0.0002 | 0.0167 | −0.2386 | 7.6583 | 4183*** | −67.3128*** |
| HK | −0.1358 | 0.1680 | 0.0000 | 0.0161 | 0.1181 | 12.7150 | 18017*** | −66.5190*** |
| IN | −0.1718 | 0.1611 | 0.0005 | 0.0162 | −0.4024 | 13.3090 | 20400*** | −66.2381*** |
| EU | −0.1324 | 0.1295 | 0.0000 | 0.0160 | −0.1547 | 9.5916 | 8308*** | −68.4671*** |
| GE | −0.1305 | 0.1346 | 0.0002 | 0.0163 | −0.1927 | 9.9620 | 9276*** | −32.2282*** |
| UK | −0.1276 | 0.1111 | 0.0000 | 0.0131 | −0.3189 | 12.3819 | 16871*** | −69.8792*** |
| SW | −0.1274 | 0.1576 | 0.0001 | 0.0128 | −0.1021 | 16.2633 | 33571*** | −67.4280*** |
| CA | −0.1700 | 0.1129 | 0.0002 | 0.0125 | −1.1556 | 25.6797 | 99156*** | −32.6103*** |
Notes: The Jarque-Bera normality test is denoted by J-B, while the Augmented Dickey-Fuller unit root test is denoted by ADF. Symbol *** denotes rejection of null hypothesis at 1% significance level.
Table 2.
Connectedness for upside risks in the international stock markets.
| US | JP | CH | HK | IN | EU | GE | UK | SW | CA | From | |
| US | 24.86 | 3.17 | 0.73 | 3.49 | 3.06 | 12.46 | 13.01 | 13.43 | 9.94 | 15.84 | 74.12 |
| JP | 8.73 | 26.25 | 1.38 | 9.07 | 4.75 | 10.47 | 12.05 | 10.45 | 8.45 | 8.40 | 73.33 |
| CH | 1.59 | 2.24 | 67.02 | 10.56 | 3.15 | 3.30 | 3.29 | 3.64 | 3.66 | 1.56 | 27.71 |
| HK | 7.30 | 7.52 | 3.78 | 29.22 | 9.13 | 8.41 | 9.10 | 10.97 | 6.27 | 8.30 | 71.22 |
| IN | 6.82 | 4.89 | 1.52 | 10.80 | 36.85 | 7.14 | 8.58 | 8.27 | 5.53 | 9.58 | 61.82 |
| EU | 10.50 | 4.21 | 0.85 | 3.89 | 2.86 | 21.57 | 19.55 | 15.47 | 13.10 | 8.00 | 78.05 |
| GE | 10.42 | 4.54 | 0.76 | 3.98 | 3.26 | 18.91 | 22.46 | 14.21 | 12.82 | 8.65 | 77.20 |
| UK | 11.14 | 3.59 | 0.94 | 4.66 | 3.29 | 15.81 | 14.84 | 22.34 | 13.33 | 10.05 | 77.53 |
| SW | 10.18 | 4.83 | 0.91 | 3.59 | 2.83 | 15.45 | 16.03 | 14.98 | 24.26 | 6.95 | 76.80 |
| CA | 16.80 | 3.04 | 0.72 | 4.33 | 4.83 | 10.42 | 11.20 | 12.51 | 7.59 | 28.56 | 72.13 |
| To | 90.82 | 43.22 | 10.29 | 45.24 | 28.74 | 105.13 | 109.00 | 106.46 | 74.82 | 76.18 | 68.99 |
| Net | 16.70 | -30.11 | -17.42 | -25.97 | -49.31 | 27.08 | 31.47 | 29.66 | 2.69 | 7.19 |
Table 3.
Connectedness for downside risks in the international stock markets.
| US | JP | CH | HK | IN | EU | GE | UK | SW | CA | From | |
| US | 25.88 | 3.61 | 0.54 | 2.54 | 2.01 | 13.24 | 13.59 | 14.08 | 8.90 | 15.60 | 75.14 |
| JP | 9.87 | 26.67 | 1.06 | 7.14 | 3.58 | 11.12 | 12.48 | 11.03 | 8.53 | 8.52 | 73.75 |
| CH | 1.07 | 2.09 | 72.29 | 9.87 | 3.05 | 2.38 | 2.44 | 2.62 | 3.11 | 1.08 | 32.98 |
| HK | 7.69 | 9.18 | 3.71 | 28.78 | 8.06 | 8.63 | 9.05 | 10.98 | 5.75 | 8.17 | 70.78 |
| IN | 6.59 | 5.88 | 1.73 | 10.59 | 38.18 | 6.81 | 8.10 | 8.25 | 4.80 | 9.08 | 63.15 |
| EU | 11.99 | 4.58 | 0.61 | 2.73 | 1.77 | 21.95 | 20.09 | 16.04 | 12.16 | 8.08 | 78.43 |
| GE | 11.65 | 4.92 | 0.59 | 2.87 | 2.26 | 19.51 | 22.80 | 14.78 | 12.04 | 8.56 | 77.54 |
| UK | 12.88 | 4.06 | 0.69 | 3.40 | 2.18 | 16.44 | 15.39 | 22.47 | 12.29 | 10.19 | 77.66 |
| SW | 11.67 | 5.35 | 0.74 | 2.40 | 1.81 | 16.02 | 16.39 | 15.51 | 23.20 | 6.90 | 75.74 |
| CA | 17.41 | 3.56 | 0.61 | 3.70 | 4.02 | 10.96 | 11.46 | 13.16 | 7.24 | 27.87 | 71.44 |
| To | 83.48 | 38.02 | 11.59 | 54.37 | 37.15 | 102.38 | 107.65 | 103.93 | 80.69 | 77.34 | 69.66 |
| Net | 8.34 | -35.72 | -21.39 | -16.41 | -41.28 | 23.95 | 29.99 | 28.19 | 9.25 | 7.68 |
Disclaimer/Publisher’s Note: The statements, opinions and data contained in all publications are solely those of the individual author(s) and contributor(s) and not of MDPI and/or the editor(s). MDPI and/or the editor(s) disclaim responsibility for any injury to people or property resulting from any ideas, methods, instructions or products referred to in the content. |
© 2023 by the authors. Licensee MDPI, Basel, Switzerland. This article is an open access article distributed under the terms and conditions of the Creative Commons Attribution (CC BY) license (http://creativecommons.org/licenses/by/4.0/).
Copyright: This open access article is published under a Creative Commons CC BY 4.0 license, which permit the free download, distribution, and reuse, provided that the author and preprint are cited in any reuse.


