
Submitted:
30 November 2025
Posted:
02 December 2025
You are already at the latest version
Abstract
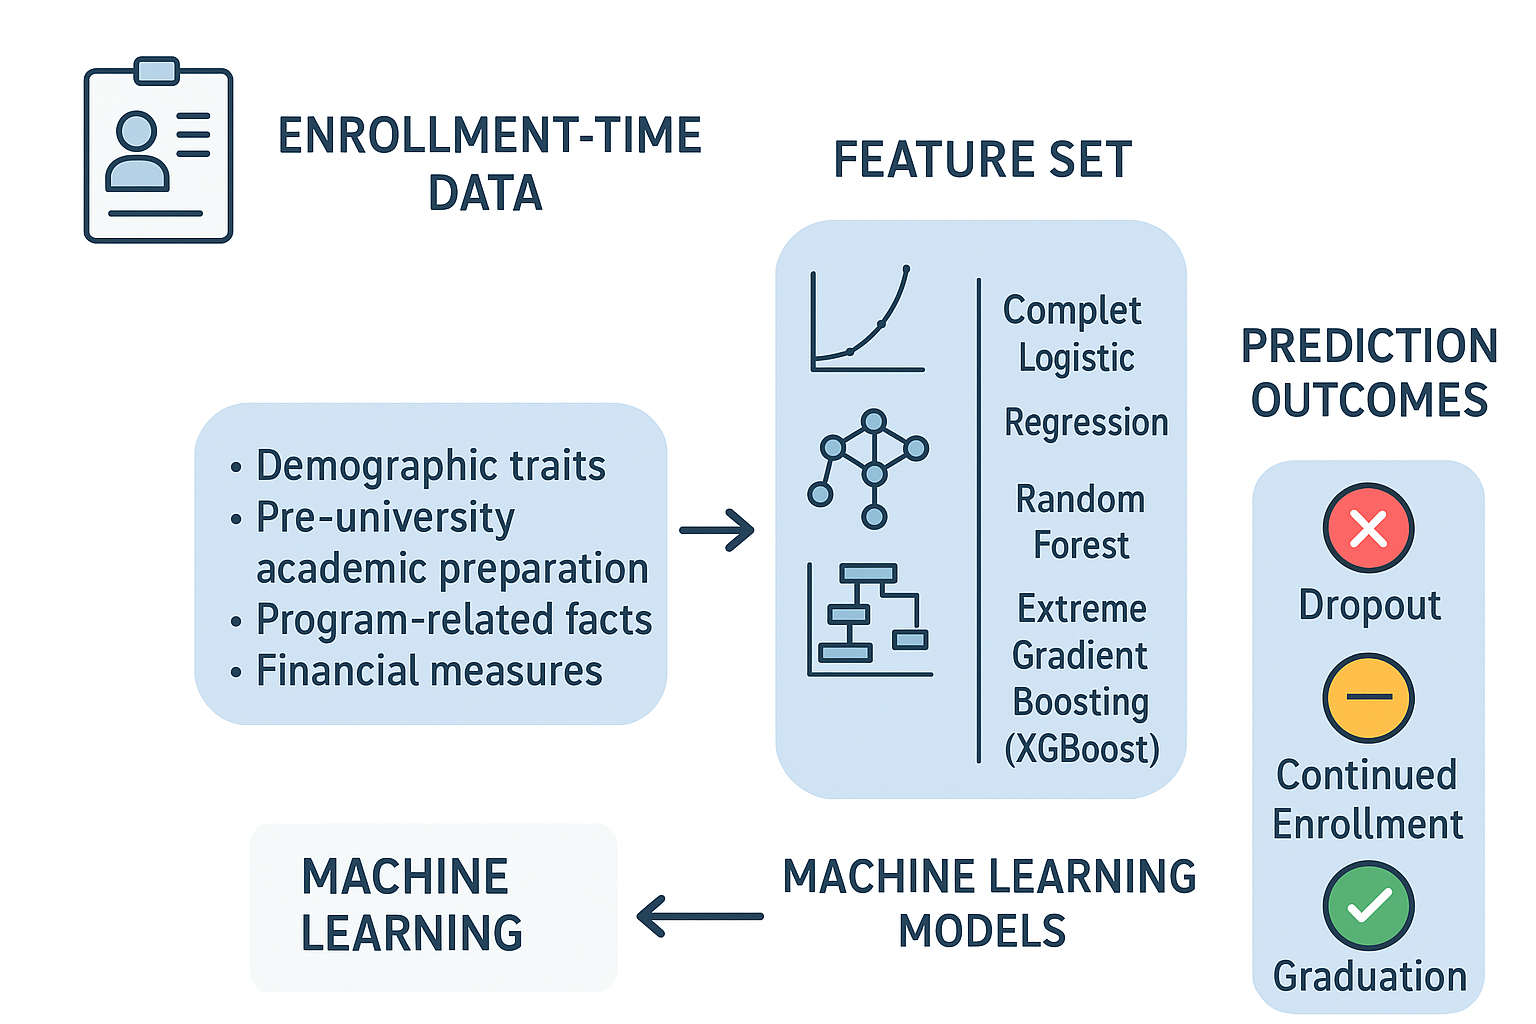
Higher-order student dropout involves high levels of individual and institutional costs and is usually a long-term process that is influenced by academic, social, and financial variables. This paper examines the hypothesis of using machine learning models that have been trained on the available information during the time of enrollment to predict three different student outcomes, namely, dropout, continued enrollment and graduation. Based on administrative data of 4424 degree-seeking students at one university, we create a set of features 36 enrollment time variables including demographic traits, pre-university academic preparation, program-related facts and chosen financial measures. It is a three-class supervised learning problem that is formulated as the prediction task. We rank three common algorithms multinomial logistic regression, random forest, and extreme gradient boosting (XGBoost) and put them through a single pipeline that incorporates median imputation, feature scaling where necessary, stratified train-validation-test 60/20/20 split and Bayesian hyperparameter optimization using Optuna. The model performance is analyzed based on five random seeds by macro-averaged F1-score as the main measure, which is supplemented by the accuracy, class-specific precision and recall, confusion matrices, and multi-classes receiver operating characteristic curves. Findings indicate that enrollment-time data by itself can help make practically useful predictions. The tuned XGBoost models perform best, and have the most consistent performance, with macro-F1 of about 0.70-0.72 and a macro ROC-AUC of about 0.88-0.90 across the seeds with the tuned random forests coming in a close behind; multinomial logistic regression has a weaker performance but can be interpreted. There is a high hit rate with all models predicting graduates best, a moderate level of predictability with dropouts, and the most difficult to predict with still-enrolled students. The analyses of feature-importance reveal that academic preparation and early academic indicators, program and financial variables are the most significant predictors of outcomes. The results show that machine learning models used at enrollment time can be used as an early-warning layer of institutional retention work, allowing students to be identified at risk before commencing their coursework. The research paper ends with a set of recommendations on how to incorporate such models into the advising process and provides guidelines on the further development of work on cross-institutional validation, more comprehensive behavioral characteristics, and explainable and equitable predictive analytics.
Keywords:
dropout among students
; early warning system
; gradient boosting
; higher education analytics
; logistic regression
; machine learning
; random forest
Introduction
Higher education is considered to be one of the key sources of social mobility, the development of an economy, and innovation. Nonetheless, there is a significant percentage of students joining the university that do not complete their education. Student dropout has a huge price at various levels: it decreases the lifetime earnings and well-being of individuals, wastes the efforts of the government and non-government in their investment in education, and compromises the ability of institutions to achieve their educational mission and meet performance-based funding requirements. To policy-makers, administrators and academic staff, the second question to answer is which students are the ones most vulnerable to premature departure--and why, is therefore of immediate need.
The phenomenon of student dropout is not a one time phenomenon but a cumulative process whereby academic, social and financial variables interplay to lead to drop out. Classical models of student persistence lay stress on how academic performance, social integration and institutional support influence the decision of students to either continue with their studies or drop out. Recent empirical research has improved this image and has demonstrated that low grade point average, failing courses, cumulative insufficiency of credit and lagging academic performance are some of the most robust indicators of attrition. Employment, family obligations, financial difficulties and socio-economic disadvantage are also key causes of withdrawal especially among the first-generation and the non-traditional students.
The contextual environment within which these processes take place has become difficult in the past few years. Massification of higher education has introduced more diverse cohorts of students to universities and with greater difference in academic preparation, economic resources, and support systems. The development of online and blended learning has brought new possibilities of flexible participation, as well as new requirements on self-regulation and digital skills of students. The external shocks like the COVID-19 pandemic have interfered with the instruction, increased the financial and psychological stress, and changed the enrollment, deferral, and withdrawal patterns. It is against this backdrop that institutions are feeling the pressure to keep a closer eye on the progress of students in a more systematic way, and to allocate the support resources in a more purposeful and timely fashion.
The creation of data-based early warning systems and learning analytics dashboards has proven to be one of the promising answers. In these systems, the records of previous students are employed to develop prediction mechanisms to estimate the likelihood of each learner in getting unwanted results like dropping out of school or being put on academic probation. Such risk estimates can then catalyze proactive interventions such as academic advising, tutoring, counseling and financial advice. An accumulating body of research suggests that structured data-based early warning systems, including pre-university education, enrollment, and early academic achievement can select potentially at-risk students with useful precision and allow institutions to direct their concern where it is most warranted.
Machine learning has increased the number of tools available to machine learning methodology. In addition to the classical statistical methods such as logistic regression, more modern research is using tree-based ensembles, support vector machines, and deep neural networks to provide complex nonlinear correlations between student attributes, academic factors, and performance. Ensembles based on trees, especially, have shown good performance in many educational prediction tasks due to their ability to automatically learn interactions and nonlinear effects and do not need to engineer features manually. Simultaneously, the more interpretable approaches, like multinomial logistic regression are still noteworthy since they present explicit parameter estimates and odds ratios that can be easily conveyed to institutional decision-makers.
Although this methodological advancement has been made, some gaps in the literature limit the practice implications of dropout prediction studies. To begin with, there are numerous studies that take a dichotomous view, in which students are divided into two categories, i.e., dropout and non-dropout. The real student trajectories, however, are more complex. There are those students who graduate in the intended period, some of them stay longer than the period that the nominal program should run, and there are those who end their studies early. Students who are on track to graduating and those who are simply struggling but continuing should not be treated as one when it comes to dropping out. Formulations that differentiate between dropout, continued enrollment and graduation offer a more detailed view of student progress and may be used to implement more specific intervention, although they are not as frequently found in literature.
The current research reacts by creating and testing machine learning models to predict student outcomes in multi-classes, that is, dropout, further enrollment and graduation, using available variables during the first enrollment period. Based on administrative data on a vast number of university students, the study creates a feature set comprising of demographic and socio-economic attributes, Pre-university academic attainment, and variables related to the degree program. In this context, the three most popular supervised learning methods have been compared: Multinomial logistic regression as an interpretable linear baseline, random forest as a strong tree-based ensemble, and extreme gradient boosting (XGBoost) as a strong boosting algorithm that can be used to model intricate nonlinear patterns and interactions in the data.
In order to provide a fair and rigorous comparison, every model is explicit to a structured pipeline that involves the management of missing values, feature scaling where rational, and stratified division into training, validation, and test sets. Bayesian optimization of hyperparameters is done through the use of Optuna and performance of the model is measured on a number of random seeds to determine stability. The macro-averaged F1-score is the main metric used in evaluation because it focuses on precision and recall averaged over all classes and is especially appropriate when there is an imbalance in the classes. The complementary metrics are accuracy, confusion matrices, and receiver operating characteristic curves that offer a more detailed picture of how the model will act when each of the outcome categories occurs.
Research Questions
The study is guided by the following research questions:
1. Which enrollment-time demographic, academic, and socio-economic variables are most strongly associated with student dropout, ongoing enrollment, and graduation in a higher education context?
2. To what extent can machine learning models—specifically multinomial logistic regression, random forests, and extreme gradient boosting—accurately classify students into dropout, enrolled, and graduate categories using only enrollment-time data?
3. How can the outputs of these models, including class-specific performance patterns and the relative importance of different features, be leveraged to inform early warning and intervention strategies aimed at reducing dropout and promoting student success?
Literature Review
Machine Learning Approaches to Dropout Prediction
Research on student dropout prediction in higher education has expanded rapidly in the last decade, driven by institutional pressures to improve retention and by advances in machine learning. Early work on dropout prediction mostly relied on traditional statistical models such as logistic regression, discriminant analysis, and simple decision trees. These methods were attractive due to their interpretability and straightforward implementation in institutional research units. As larger and more complex datasets became available—combining demographics, pre-university achievement, course histories, and behavioral traces—researchers increasingly turned to modern machine learning algorithms capable of modeling nonlinear relationships and high-order interactions.
Recent surveys and empirical standards emphasize four general categories of models in this field, the linear models, tree-based ensembles, support, and deep learning architectures. Empirical experiments on large multi-institutional datasets indicate that the logistic regression is still a competitive baseline, especially when the feature space is well-engineered and regularization is used, but it is not very effective at modeling complex interactions between variables. Random forest and gradient boosting models (intended to be used as random forests or gradient boosting) like XGBoost, LightGBM, and CatBoost have become the new leaders in most dropout prediction problems. According to comparative studies, these models are generally more accurate and higher in F1-score than logistic regression and single decision trees, especially in heterogeneous and possibly noisy feature space.
Generally, it is now becoming clear that tree-based ensembles, in particular gradient boosting variants, can provide the optimal trade-off between performance and flexibility when structured tabular data are at play, whereas deep networks are more beneficial when dealing with complicated temporal or unstructured data. The logistic regression and other related generalized linear models still play a significant role of providing clear baselines that can be used to explain and justify the patterns found by other more complex models to the stakeholders.
Comparison of Algorithms Performance
One common pattern of the empirical studies is a systematic comparison of several machine learning models applied to the same dataset. Such comparisons usually contain logistic regression, random forest, one or more gradient boosting implementations and, in some cases, support vector machines or neural networks. There are a number of common trends present in this literature.
To begin with, the studies with rigorous hyperparameter tuning tend to report the obvious superiority of the gradient boosting models than the random forests and logistic regression. With grid search tuning, random search tuning, and tuning by Bayesian optimization, boosting models can commonly gain several percentage points in accuracy or macro-F1 over untuned baselines. This trend is seen in the case of both single- and multi-institution and in both binary and multi-class prediction problems.
Second, random forest models are very robust and relatively stable in a number of datasets, feature sets, and evaluation protocols. Random forests typically trail closely in terms of peak metrics, even when boosting methods produce slightly higher peak metrics, although they tend not to be as sensitive to hyperparameter settings as boosting methods do. This stability, coupled with the integrated quantification of feature significance, renders the random forests as an attractive option among those institutions that place more emphasis on stability and explainability as well as predictive accuracy.
Third, ensemble or stacking method that applies a number of base learners may provide marginal improvements with respect to the optimal single model. According to some studies, when stacked with gradient boosting, random forest and logistic regression, stacking the predictions leads to better performance either in the overall accuracy or the minority-class recall, though this may be at the expense of greater complexity and lower transparency. The improvement of such ensembles depends on the dataset and definition of outcomes and in most instances the performance of a well-tuned gradient boosting model is competitive or outperforms more complex stacks.
Lastly, a number of large scale studies have found that a variety of techniques may when competently configured and assessed yield high predictive accuracy, with area under the receiver operating characteristic curve often ranging between 0.78 and 0.90 and in some applications yet higher with multi-class classification. What this implies is that the algorithm selection, although a critical one, should be taken into consideration alongside the quality of the data, feature engineering, and the evaluation design.
Forecasting in Dropout Networks
The algorithm choice is important, but the performance and utility of dropout prediction models also are at minimum as dependent on the input features that it uses. The literature is unanimous in focusing on the hierarchical nature of features importance, and three general categories of predictors can be identified: academic performance indicators, behavioral engagement metrics and demographic or socio-economic characteristics.
Indicators of Academic Performance
In a wide range of studies, the most significant category of predictors to dropout and persistence is academic performance. The largest effect size and the highest feature importance scores are always observed with grade point average, course grades and other academic progress indicators like credit accumulation or credit completion rate. Certain models perform respectably based on the predictive performance with grade related features only, especially when the aim is to differentiate between high-risk students who are likely to fail, and those who are on the track-to-graduate.
Credit completion rate- the proportion of credits that are successfully completed or attempted is time and again already observed as a strong early warning indicator. The students who lag behind in credit accumulation in the initial year or two of their study have a significantly higher chance to drop out or extend their studies. Also foundational or gatekeeper course performance, e.g. introductory mathematics or core disciplinary modules, can have a disproportionate influence in the predictability of future performance.
Engagement and Behavioral Characteristics
The second major category of features is behavioral indicators based on the learning management systems and other digital platforms. The frequency of logins, length of the sessions, number of views on the resources, and patterns of navigation through the course materials have been evidenced to possess strong correlation with academic success and dropout rates. Behavior on assignments, e.g. turning in assignments at the correct time, submitting them late or not at all, and time-dependent changes in submission behavior, are other rich indicators of engagement.
Researchers in more recent work have started to consider multi-modal behavioural predictors, such as sentiment analytics of discussion forums posts, emotion recognisers in written work, and engagement measures of mobile learning apps. These strategies are directed at capturing not only the things students do but also the way they feel and how they relate within the learning environment.
Demographic and Socio-Economic Factors
The third level of features is demographic and socio-economic demographics including age, gender, admission pathway, high school type, family educational background, and financial support status. These factors tend to be moderately and consistently related to dropout.
Though demographic variables are not usually the strongest predictors where academic and behavioral characteristics are incorporated they do help subdivide the student population and very often have a significant interaction influence with other predictors such as the effect of academic problems or economic pressures.
Gaps in the Literature and Positioning of the Present Study
Despite substantial progress, several methodological and practical gaps remain in the literature and motivate the present work. Many studies are conducted within a single institution and do not examine how well models generalize to other contexts. While some large-scale datasets exist, cross-institutional validation and portability of models remain limited. This raises questions about how well findings from one university can be transferred to others with different student populations, program offerings, and policy environments.
Class imbalance is ubiquitous in dropout prediction, yet best practices for handling imbalance are not consistently applied. Methods such as synthetic minority over-sampling, cost-sensitive learning, and specialized loss functions have been used, but there is limited comparative evidence tailored to educational data, and many studies still report only accuracy without more informative metrics such as macro-F1 or per-class recall.
Feature engineering and feature selection practices also vary widely, and there is no standardized set of features or definitions that would facilitate systematic comparison across institutions. This is especially evident for behavioral and temporal features, where different studies use distinct operationalizations of engagement, participation, and activity gaps.
Finally, multi-class formulations of dropout prediction—distinguishing among outcomes such as dropout, ongoing enrollment, and graduation—are comparatively rare. Most work applies binary classification, collapsing all non-dropouts into a single group and thereby obscuring potentially important distinctions between students who are on track, those who are delayed but persisting, and those who ultimately leave.
The present study is situated at the intersection of these issues. It focuses on a multi-class prediction problem using only enrollment-time variables that are routinely available in institutional databases. By systematically comparing multinomial logistic regression, random forest, and XGBoost under rigorous hyperparameter optimization and multi-seed evaluation, the study contributes to the evidence base on model choice and tuning for early, enrollment-based prediction.
Method
Overview of the Methodological Approach
In this research, the model that was used to predict and forecast student outcomes was based on a quantitative, supervised machine learning model that used administrative data at the time of first admission. The prediction problem was designed as a three-classification problem having the following classes: dropout, still enrolled, and graduate. The entire method pipeline involved picking and refining a cleansed dataset of degree-seeking students, creating a set of features out of the enrollment-time variables, data pre-processing and coding of the outcome variable, training baseline and tuned machine learning models, and performance measurement of the model on several random train-validation-test splits.
The following three supervised learning algorithms were discussed: multinomial logistic regression, random forest, and extreme gradient boosting. The baseline models of the each algorithm and default or traditional hyperparameters were trained to determine a reference level of performance. The performance of each algorithm was then optimized through the use of Bayesian hyperparameter optimization followed by the re-estimation and evaluation of models under a multi-seed design to determine the stability of findings. The macro-averaged F1-score was the main performance measure, and the results were supported by the general accuracy, confusion matrices, and receiver operating characteristic curves, depending on each outcome category.
Selection of Data set and Institutional Context
The data used consisted of 4,424 records of individual learner students in one institution of higher learning. The information used was institutional information systems and the data were anonymized before analysis. Only degree-seeking students on formally recognized programs were selected. Data that had conflicting or unstructural values were eliminated in the data curation process i.e. impossible codes, the resulting analytic data set had 37 variables, 1 target outcome and 36 predictor.
The final identified status of the students during the time period of observation was the outcome variable, denoted by Target in the institutional database. It had three mutually exclusive groups Graduate, which included students who successfully graduated the degree program; Dropout, which included students who dropped out of school without graduation; and Enrolled that included students who were still officially enrolled by the end of the observation period.
The frequency of classes in the analytic dataset was the following: Graduate (2,209 records), Dropout (1,421 records), and Enrolled (794 records), which essentially represents a fairly unequal distribution with graduation being the most frequent and the minority being the continuing enrollment. All predictor variables were based on the information that was available at or close to the time of first enrollment. The institutional name and year of calendar are preserved as confidential information though the data represent standard enrollment groupings in a modern massified higher education system.
Set of features and Outcome Variable
The initial database had an unstructured combination of demographic and socio-economic variables, academic and administrative variables. To do the current research, variables were classified into the following general groups: demographic and background variables, academic preparation before university, enrollment and program-related variables and financial or administrative variables.
The demographic and background factors consisted of variables that measurements like age at enrollment, sex, and marital status and variables that are proxies of family background or geographic origin where possible. Admission-related characteristics included the type of entry pathway, pre-university level of education and pre-university grades or exam scores encoded as part of the institutional system in pre-university academic preparation.
All predictors were put in numeric form with categorical variables being represented as integer codes coded by the institution such as codes of marital status, pathway taken in admission, or degree course. There were no transformations to convert these codes into one-hot or dummy variables but instead were considered as categorical or ordinal proxies, as such depending on their semantic interpretation and the algorithm used to produce the models. Target was the outcome variable that was numerically coded to facilitate modeling. Each category had an integer code assigned to it by a label encoder and the label encoders only used the encoded labels as input to the machine learning algorithms, but all result reporting was in the original, interpretable names of the classes.
Data Preprocessing
There were reproducible steps of data preprocessing implemented in Python and using standard machine learning libraries. To begin with, the curated data set was saved as a delimited text file and loaded into a data frame. Leading and trailing whitespaces were removed in column names to allow uniform access. The data were checked on the duplication of rows and anomalies in the structure.
Data types in all predictor columns were checked. Since the categorical attributes in the institutional system were represented in the form of integers, all 36 predictors were in numeric form. The list of feature columns was prepared by removing the Target variable. A preliminary exploratory analysis calculated the percentage of values that are missing in each column. The percentage of missing values, however, was practically zero in all predictors in the analytic dataset, which is why missing-value processing was not removed in the modeling pipeline in order to preserve strength and in order to reuse the pipeline on similar data. In particular, simple imputer was used to determine a median imputation strategy on all numeric predictors.
Some of the models were standardized. It is assumed that in the case of logistic regression that features on similar scales yield stable and interpretable estimates of coefficients and that this is done using a standard scaler that is included in a pipeline along with the classifier, and that is done before median imputation is applied to the data.
The dataset was divided into training, validation, and test sets to test the models on a previously unknown dataset. The outcome variable stratified the splitting procedure to maintain the proportions of classes in subsets. To begin with, a holdout test set consisting of 20 percent of the data was set aside. The 80 percent then divided into a training set and a validation set with the validation set taking 25 percent of this 80 percent or 20 percent of the total data. Consequently, it had a final proportion of around 60 percent training, 20 percent validation and 20 percent test.
This procedure was repeated through several random seeds in order to determine stability. In particular, there were five seeds, i.e. 42, 7, 99, 2021 and 123. The stratified split of each seed produced a new stratified split and the complete training, tuning, and evaluation pipeline was run. All preprocessing operations, such as imputation and (when necessary) scaling, were implemented in model-specific pipelines such that the same transformations were always used in training and prediction. Random seeds were anchored by the libraries where feasible to increase consistency of reproducibility among runs.
Selection of the ML-Algorithms
The three chosen machine learning algorithms were chosen due to their prevalence in the dropout prediction literature, their suitability to structured tabular data, and their complementary aspect on interpretability and flexibility. These were multinomial logistic regression, random forest and extreme gradient boosting.
The multinomial logistic regression was used as a linear baseline-interpretable. It uses the log-odds of each category of outcome as a linear predictive decision with coefficients that can be expressed as odds ratios. The implementation of the model used a multi-class-capable solver, and the strength of regularization and the type of penalties were used as hyperparameters, as part of tuning.
Random forest is an ensemble approach that uses trees and it is based on the tree, which uses a large amount of decision trees that are built on bootstrapped samples of the training data and then the prediction is aggregated. It is also resistant to noisy features, able to learn nonlinear relations and interactions and gives feature importance measures, which are based on impurity reduction. The number of trees, maximum depth, and minimum samples to use to divide a tree and to form a leaf are some of the most important hyperparameters that were optimized in this study.
Extreme gradient boosting It is a gradient boosting model that is tuned to high speed and high performance. It proceeds to construct an ensemble of decision trees, in sequence, with each new tree trying to make corrections to the previous errors of the ensemble. In this research, the model was set up to have a multi-class goal that produces output of the probability of classes of the three outcomes. Learning rate, tree depth, number of boosting rounds, subsampling rates, and regularization terms hyperparameters were tuned. The reason why extreme gradient boosting was selected is due to its good performance in previous researches and its capability to represent the complex and nonlinear interactions among the features.
These three algorithms alone enable a comparison between transparent linear model, robust tree ensemble and powerful boosting algorithm which is likely to perform well in terms of predictive power with structured enrollment-time data.
Hyperparameter Tuning, Evaluation, and Model Training.
The model training and evaluation was done in two general steps which were the baseline modeling and the tuned modeling in a multi seed design. At the baseline, every algorithm was trained using default hyperparameters or traditional hyperparameters on one stratified train-test split. In the case of logistic regression, standard regularization was applied along with the maximum iteration limit that was set to a common value, and the model was run on standardized features. In random forest, median imputation was utilized, a predetermined number of trees and a predetermined impurity were employed. In extreme gradient boosting, a baseline setup has been used with multi-class target and standard learning rate and depths. These holding models gave a starting point of accuracy and macro-F1 to holdout test set.
Upon optimization of the hyperparameters in a particular algorithm and seed, the model was re-trained on the integrated training and validation data of the seed. This was done so that the model could utilize the entirety of labeled data that was not set in test, and a test set was kept untouched. The stratified holdout test set of each of the seeds was then used to evaluate the performance. Macro-averaged F1-score, overall accuracy and class-specific precision recall and F1-scores were calculated along with receiver operating characteristic curves in a one-versus-rest structure using each algorithm and each seed.
The performance measures of the five seeds were summarized to give an overview of the average and deviation of the performance of each algorithm and this gives an answer to the stability of the algorithm when subjected to variable splits. In the case of the best-performing models, the importance of feature analyses were performed. Random forest and extreme gradient boosting give in-built measures of importance depending on the contribution of each feature to a reduction in impurity or loss reduction among the ensemble.
When combined with the other steps, such a procedure results in a strong methodology to compare multinomial logistic regression, random forest, and extreme gradient boosting in a realistic, multi-class dropout prediction task using only enrolled-time information.
Results
Descriptive Statistics and Class Distribution
The analytic sample consisted of 4,424 students each with 36 predictors at their enrollment time, and one categorical outcome variable that measured final status, which consisted of dropout, enrolled or graduate. The three outcome categories were more or less balanced as they were described in the Method section: the greatest number was represented by graduates, the dropouts were next in line and the students who were still pursuing their studies at the point of observation time were classified as the smallest category.
Table 1 contains the basic descriptive statistics of key predictors, including measures of central tendency and dispersion of age, pre-university achievement variables, and other numeric variables, and frequency distributions of coded categorical variables. On the whole, the distributions are also consistent with a diversified population of students in a massified higher education environment, as there is a significant deviation around demographic and preparation to academic indicators. There were no significant problems of missingness or high outliers that followed the initial data cleaning as detailed above.
Baseline Model Performance
In order to set a reference level of performance, all three algorithms, namely multinomial logistic regression, random forest and extreme gradient boosting, were individually trained with default or conventional hyperparameters on one stratified train-test split. They all were trained using enrollment-time predictors only, and the Target variable was encoded as three-class.
Table 2 summarizes baseline results. Generally speaking all the three algorithms performed significantly above chance, which means that the variables related to the enrollment time have significant information about the ultimate results of students. Logistic regression produced the lowest macro-averaged F1-score of the three models but was still a competitive baseline, especially when it comes to the overall accuracy. Random forest was better than logistic regression in terms of macro-F1 and accuracy, which indicated its capability to address nonlinear relationship and interaction between predictors. Extreme gradient boosting had the greatest macro-F1 of the baseline models and as high accuracy as random forest, indicating that gradient boosting may be best applied to this prediction consideration.
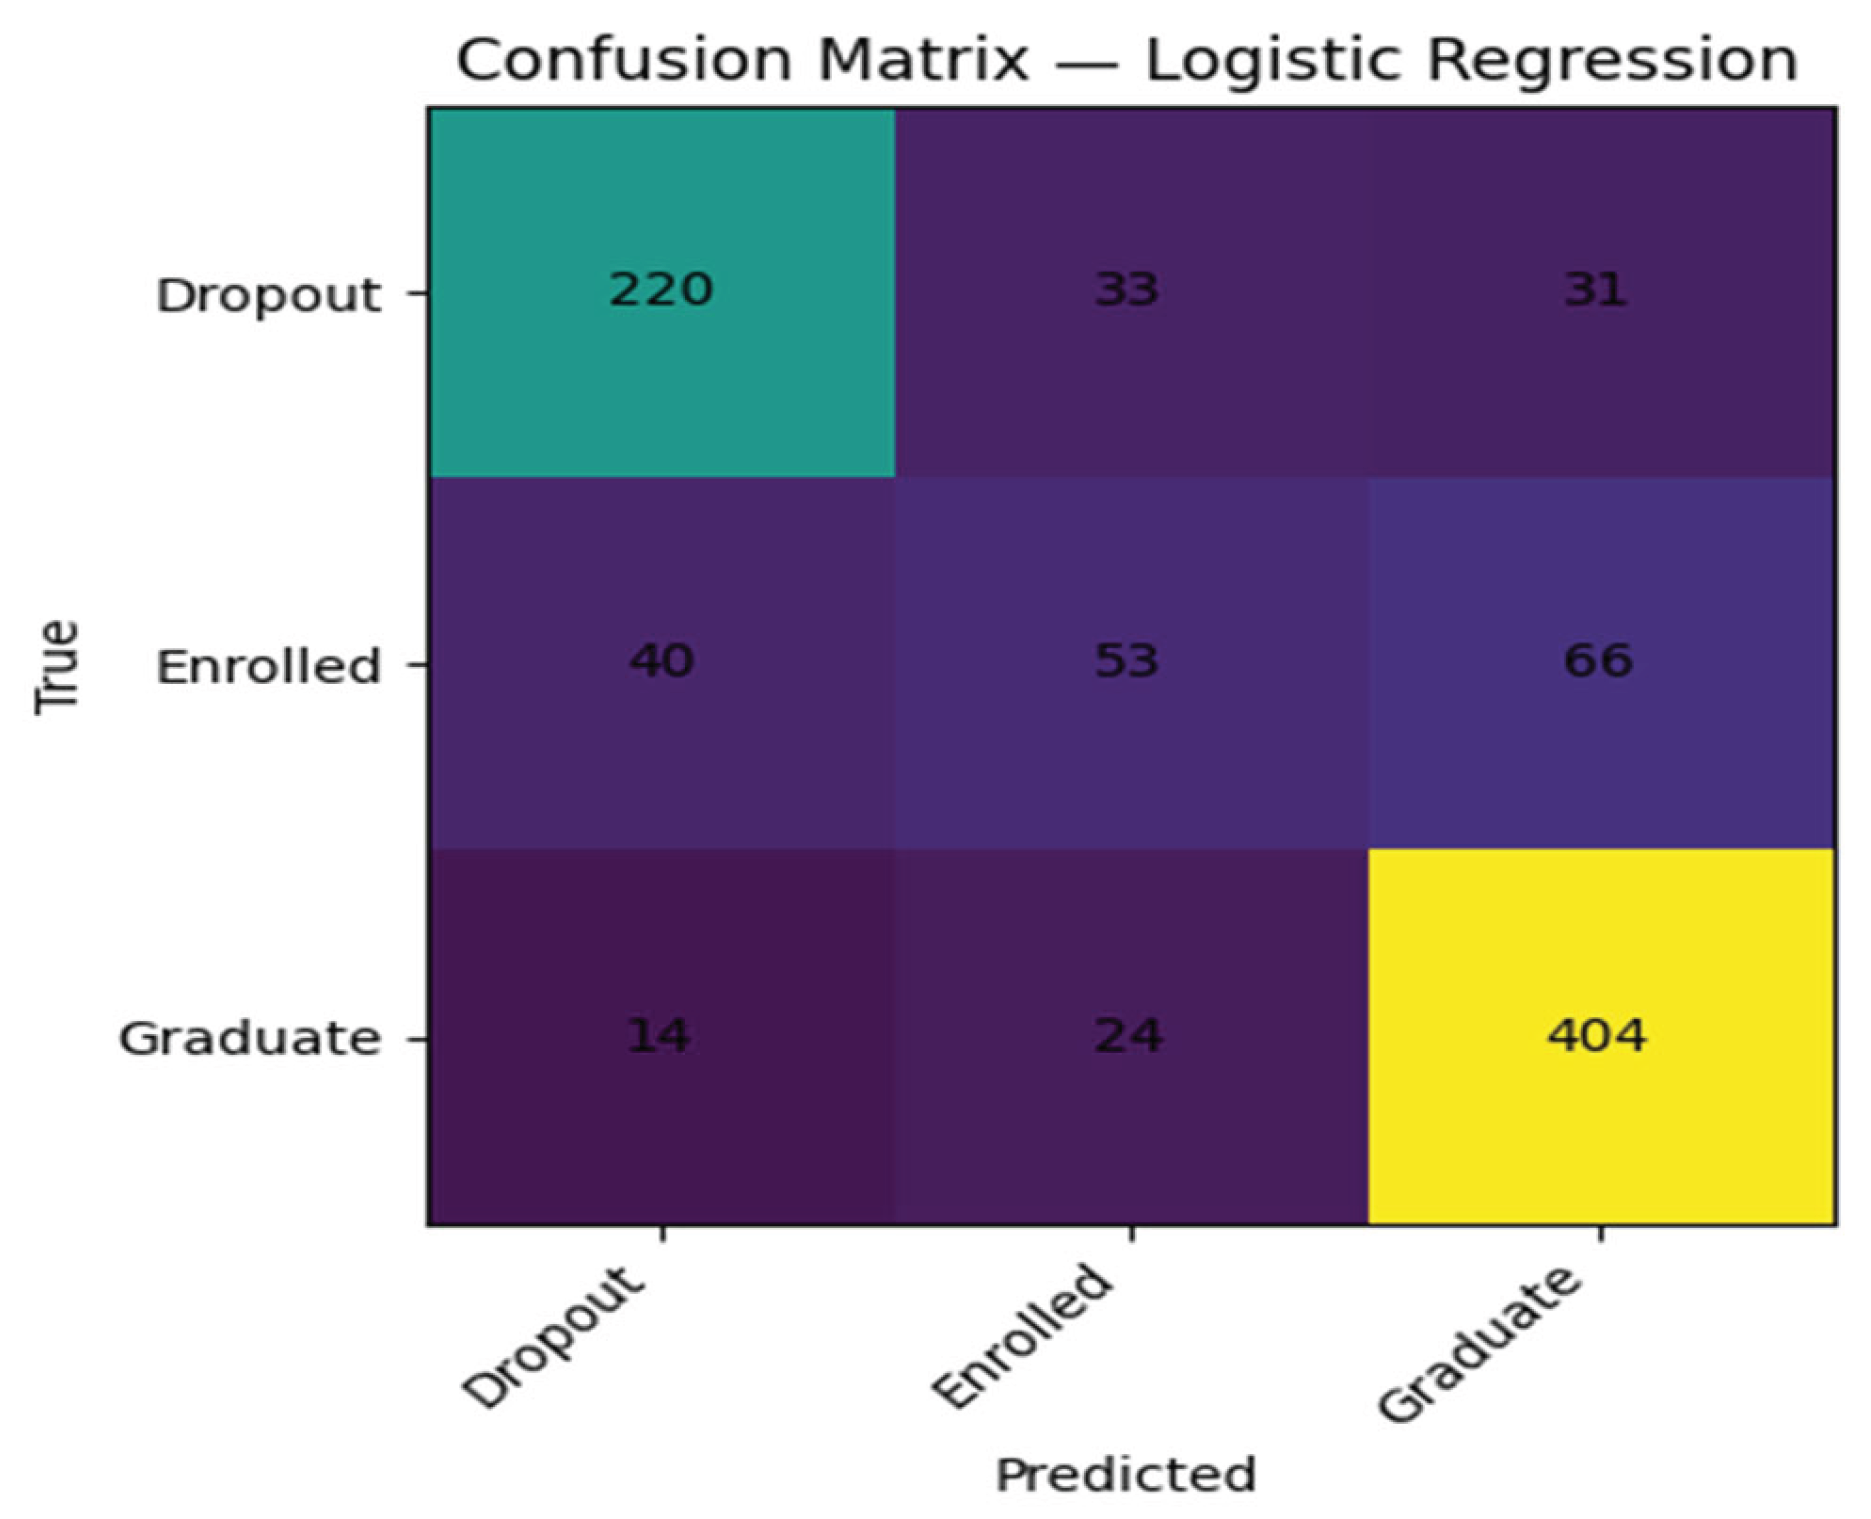
Examination of the confusion matrices at the baseline showed that all the models were best at the majority class that is, graduates. The dropout and enrolled categories had poorer performance, and models are more likely to confuse the two types of results than each with graduation. This trend indicates the need to rely on class-sensitive measures like macro-F1 and prompts the subsequent focus on the better minority-class performance achieved by hyperparameter tuning.
Tuned Models and Multi-Seed Evaluation
Based on the analysis in the baseline, Bayesian hyperparameter optimization was applied to each algorithm as mentioned in the Method section. On five randomly chosen seeds, a train-validation-test split was created and hyperparameters were optimized using the training-validation split, and the best configuration was refitted and tested on the held-out test split.
Table 3 provides the average and standard deviation of macro-F1 and accuracy of the five seeds of all tuned algorithms. The three models were also tuned as compared to their baseline counterparts whereby an improvement was seen in the macro-F1, the accuracy or both. Extreme gradient boosting had the highest gains and it showed the highest rise in a macro-F1, followed by random forest. Logistic regression also enhanced a little more especially as the regularization strength and the type of penalty were optimized.
Tuned extreme gradient boosting was found to give the best mean macro-F1 and competitive or superior performance across the seeds, which validates its position as the most effective model in the context. Tuned random forest came in second, slightly less performing than extreme gradient boosting on individual splits and slightly worse on average. Tuned logistic regression was slightly worse than the tree-based ensembles on macro-F1 but was also informative and easier to understand. All the three algorithms had a small variation across seeds, meaning that results are consistent with regard to random partitioning of the data.
Confusion Matrices
The confusion matrices of the tuned extreme gradient boosting model per seed, indicate that most of the graduates have been correctly predicted and that a significant percentage of dropouts also have been correctly predicted. The misclassifications were most commonly made by enrolled students being forecasted as graduates or dropouts indicating that the features of enrollments at the time of observation may not be so salient in students who stay in an intermediate state at the conclusion of the observation period.
These findings are also supported by the receiver operating characteristic curves of the tuned extreme gradient boosting model, which are the summary of the conceptual results of Figure 2. Curves of one-versus-rest of each category demonstrate that there is a high level of discrimination in favor of graduates, high level of discrimination in favor of dropouts, and the less than strong but still useful discrimination in favor of the enrolled class. Multi-class ROC-AUC values over all seeds of the macro-average indicate that the tuned boosting model has a high overall separability across the three outcomes.
Feature Importance and Predictive Factors
The study of the most influential features in the tuned tree-based models was conducted to answer the first research question based on the built-in measures of importance. In both random forest and extreme gradient boosting, feature importance was calculated using the cumulative decrease in impurity or loss that could be attributed to splitting on each predictor averaged across all trees in the ensemble.
The importance profiles of the tuned extreme gradient boosting model when ranked depict a trend that is largely consistent with the previously conducted research. The characteristics that are related to academic preparation and performance at entry, including pre-university grades or exam scores, signs of previous schooling, and some program-specific academic measures are found within the upper ranks of the predictors. Variables that are program-related and enrollment-related such as the degree program codes, mode of study and application or admission modes also add some significant discriminative power to the model. Moreover, there exist a number of demographic and socio-economic factors, including age at enrollment and chosen background factors, which have a nontrivial impact, usually having complex interactions with academic characteristics.
Despite the fact that the dataset lacks rich behavioral information about the learning management systems, the rankings of importance suggest that enrollment-time information used alone can significantly distinguish between students who eventually graduate, one who drops out, and the one who has not. The trend of outcomes indicates that students who have lower academic preparation in pre-university and some combinations of program choice and background predictors tend to pursue dropout paths and those students with better preparation and more desirable combinations of enrolment factors tend to graduate on time.
Summary of Key Findings
Taken together, the results support several conclusions. First, enrollment-time variables alone provide sufficient information to enable machine learning models to predict multi-class student outcomes at levels of accuracy and macro-F1 that are practically useful for early warning purposes. Second, among the algorithms considered, tuned extreme gradient boosting consistently outperforms tuned random forest and multinomial logistic regression, particularly in terms of macro-F1 and minority-class performance, while all three models exhibit stable behavior across multiple random seeds.
Third, class-specific analyses highlight that the Graduate class is easiest to identify, Dropout is moderately well captured, and Enrolled remains the most challenging category, underscoring the nuanced nature of intermediate enrollment outcomes. Finally, feature importance patterns indicate that academic preparation, program choice, and selected demographic indicators are the primary drivers of the model’s predictions, providing a basis for the discussion of targeted early interventions in the subsequent section.

Table 1.
Descriptive Statistics for Key Enrollment-Time Variables.
| Variable | N | M | SD | Min |
|---|---|---|---|---|
| Age at enrollment | 4424.0 | 23.265145 | 7.587816 | 17.0 |
| Previous qualification (grade) | 4424.0 | 132.613314 | 13.188332 | 95.0 |
| Admission grade | 4424.0 | 126.978119 | 14.482001 | 95.0 |
| Tuition fees up to date | 4424.0 | 0.880651 | 0.324235 | 0.0 |
| Nacionality | 4424.0 | 1.873192 | 6.914514 | 1.0 |
Table 2.
Baseline Performance of Machine Learning Models.
| Model | Accuracy | Macro-F1 | Weighted-F1: |
|---|---|---|---|
| Multinomial logistic regression | 0.7650 | 0.6798 | 0.7518 |
| Random forest | 0.7797 | 0.7041 | 0.7659 |
| Extreme gradient boosting | 0.7785 | 0.7148 | 0.7710 |
Table 3.
Performance of Tuned Models Across Random Seeds.
| Model | Macro-F1 M (SD) | ROC–AUC M (SD) |
|---|---|---|
| Multinomial logistic regression | 0.670870 | 0.877823 |
| Random forest | 0.682767 | 0.883189 |
| Extreme gradient boosting | 0.706758 | 0.893289 |
Note. M = mean; SD = standard deviation across five random seeds; values to be populated with empirical estimates.
Figure 1.
Macro-F1 for the Tuned Extreme Gradient Boosting Model Across Random Seeds.
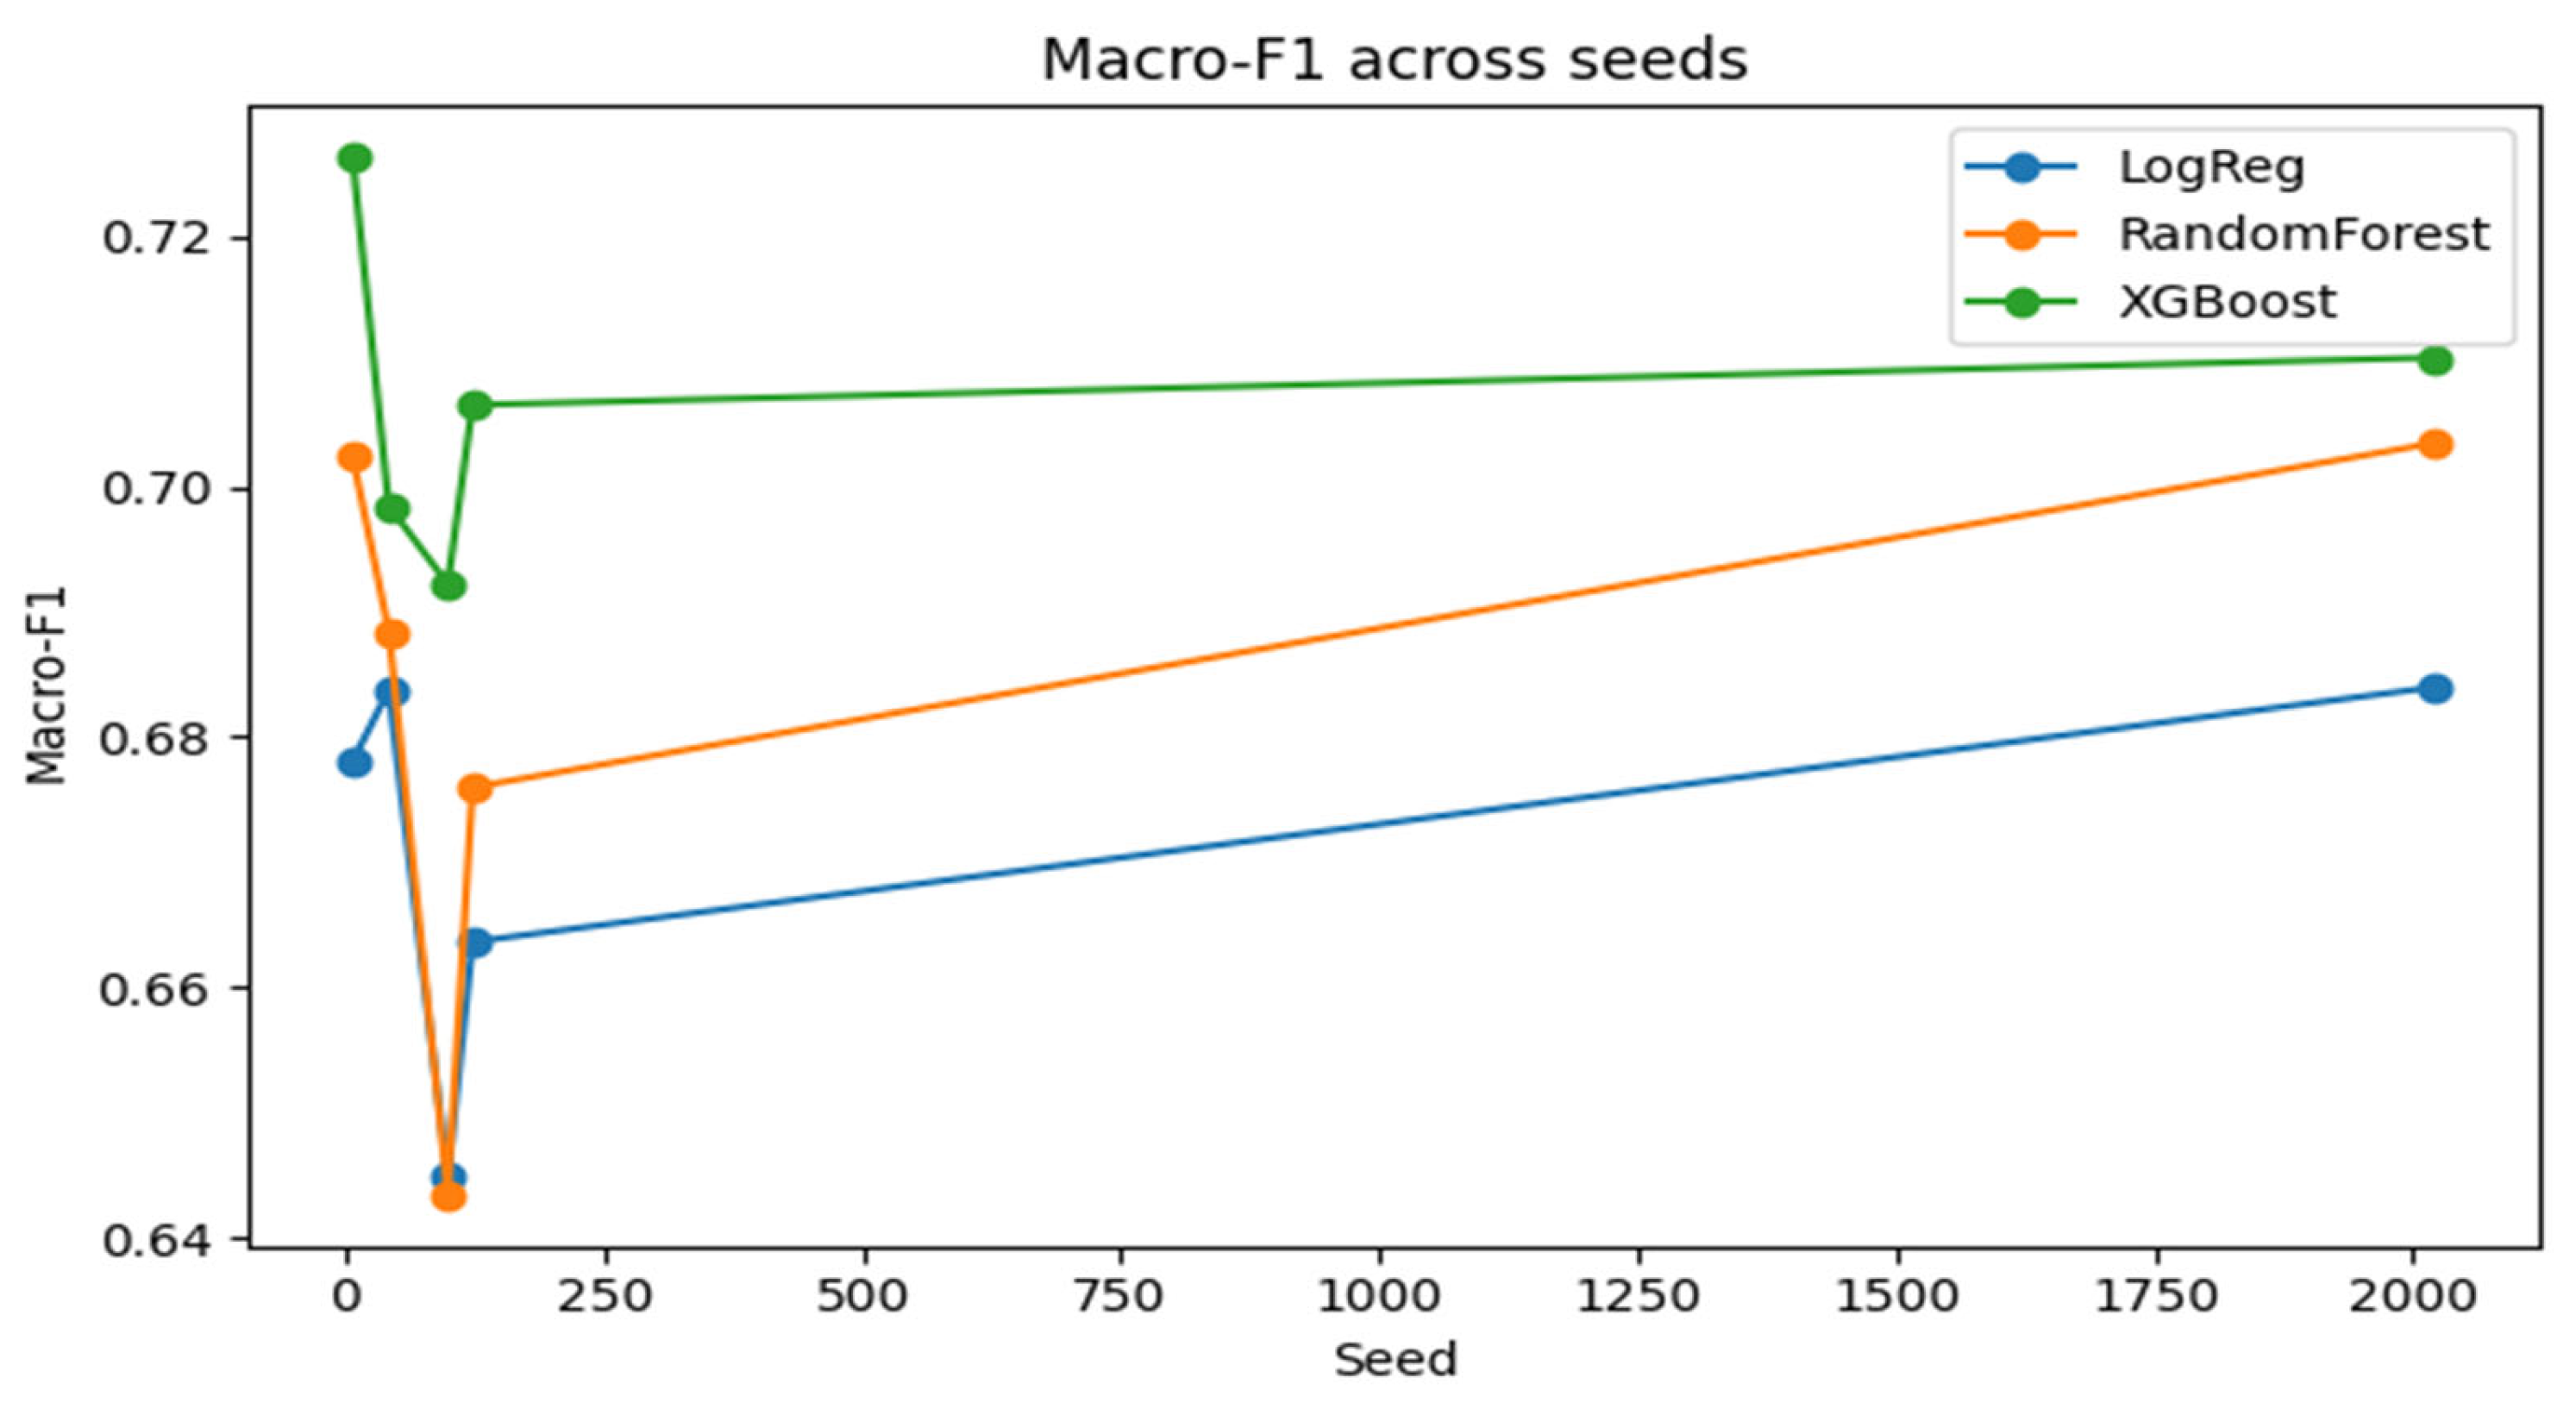
Figure 2.
Receiver Operating Characteristic Curves for the Tuned Extreme Gradient Boosting Model.
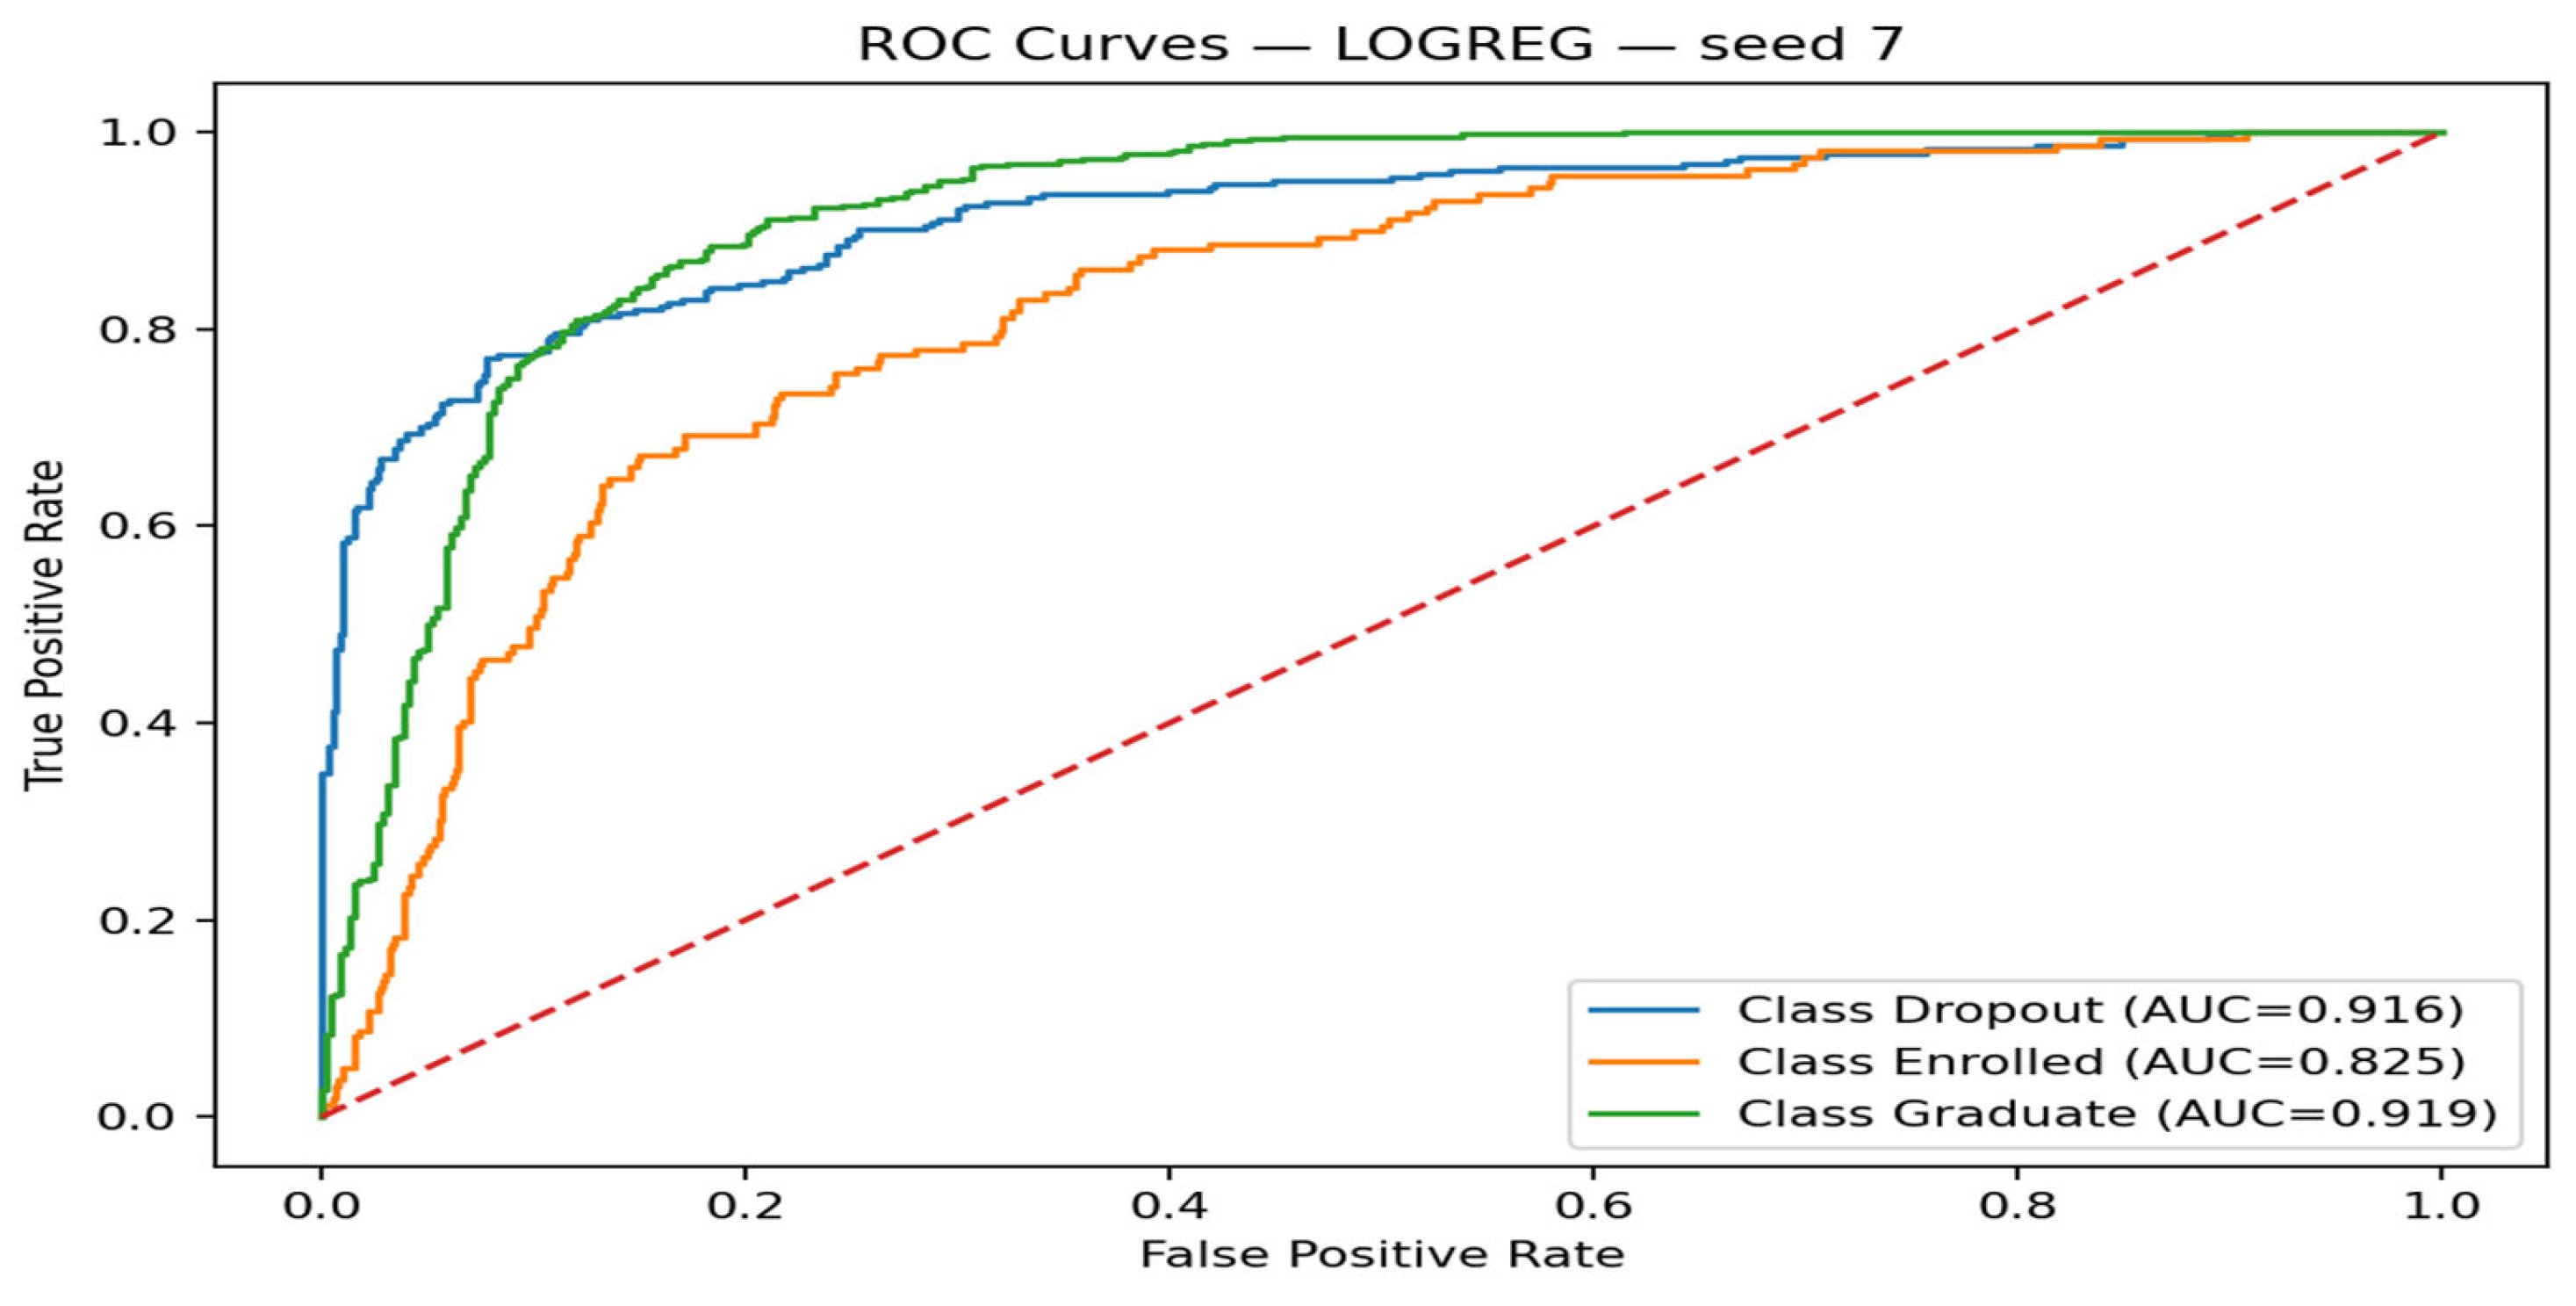
Figure 3.
Macro-F1 per seed by Model.
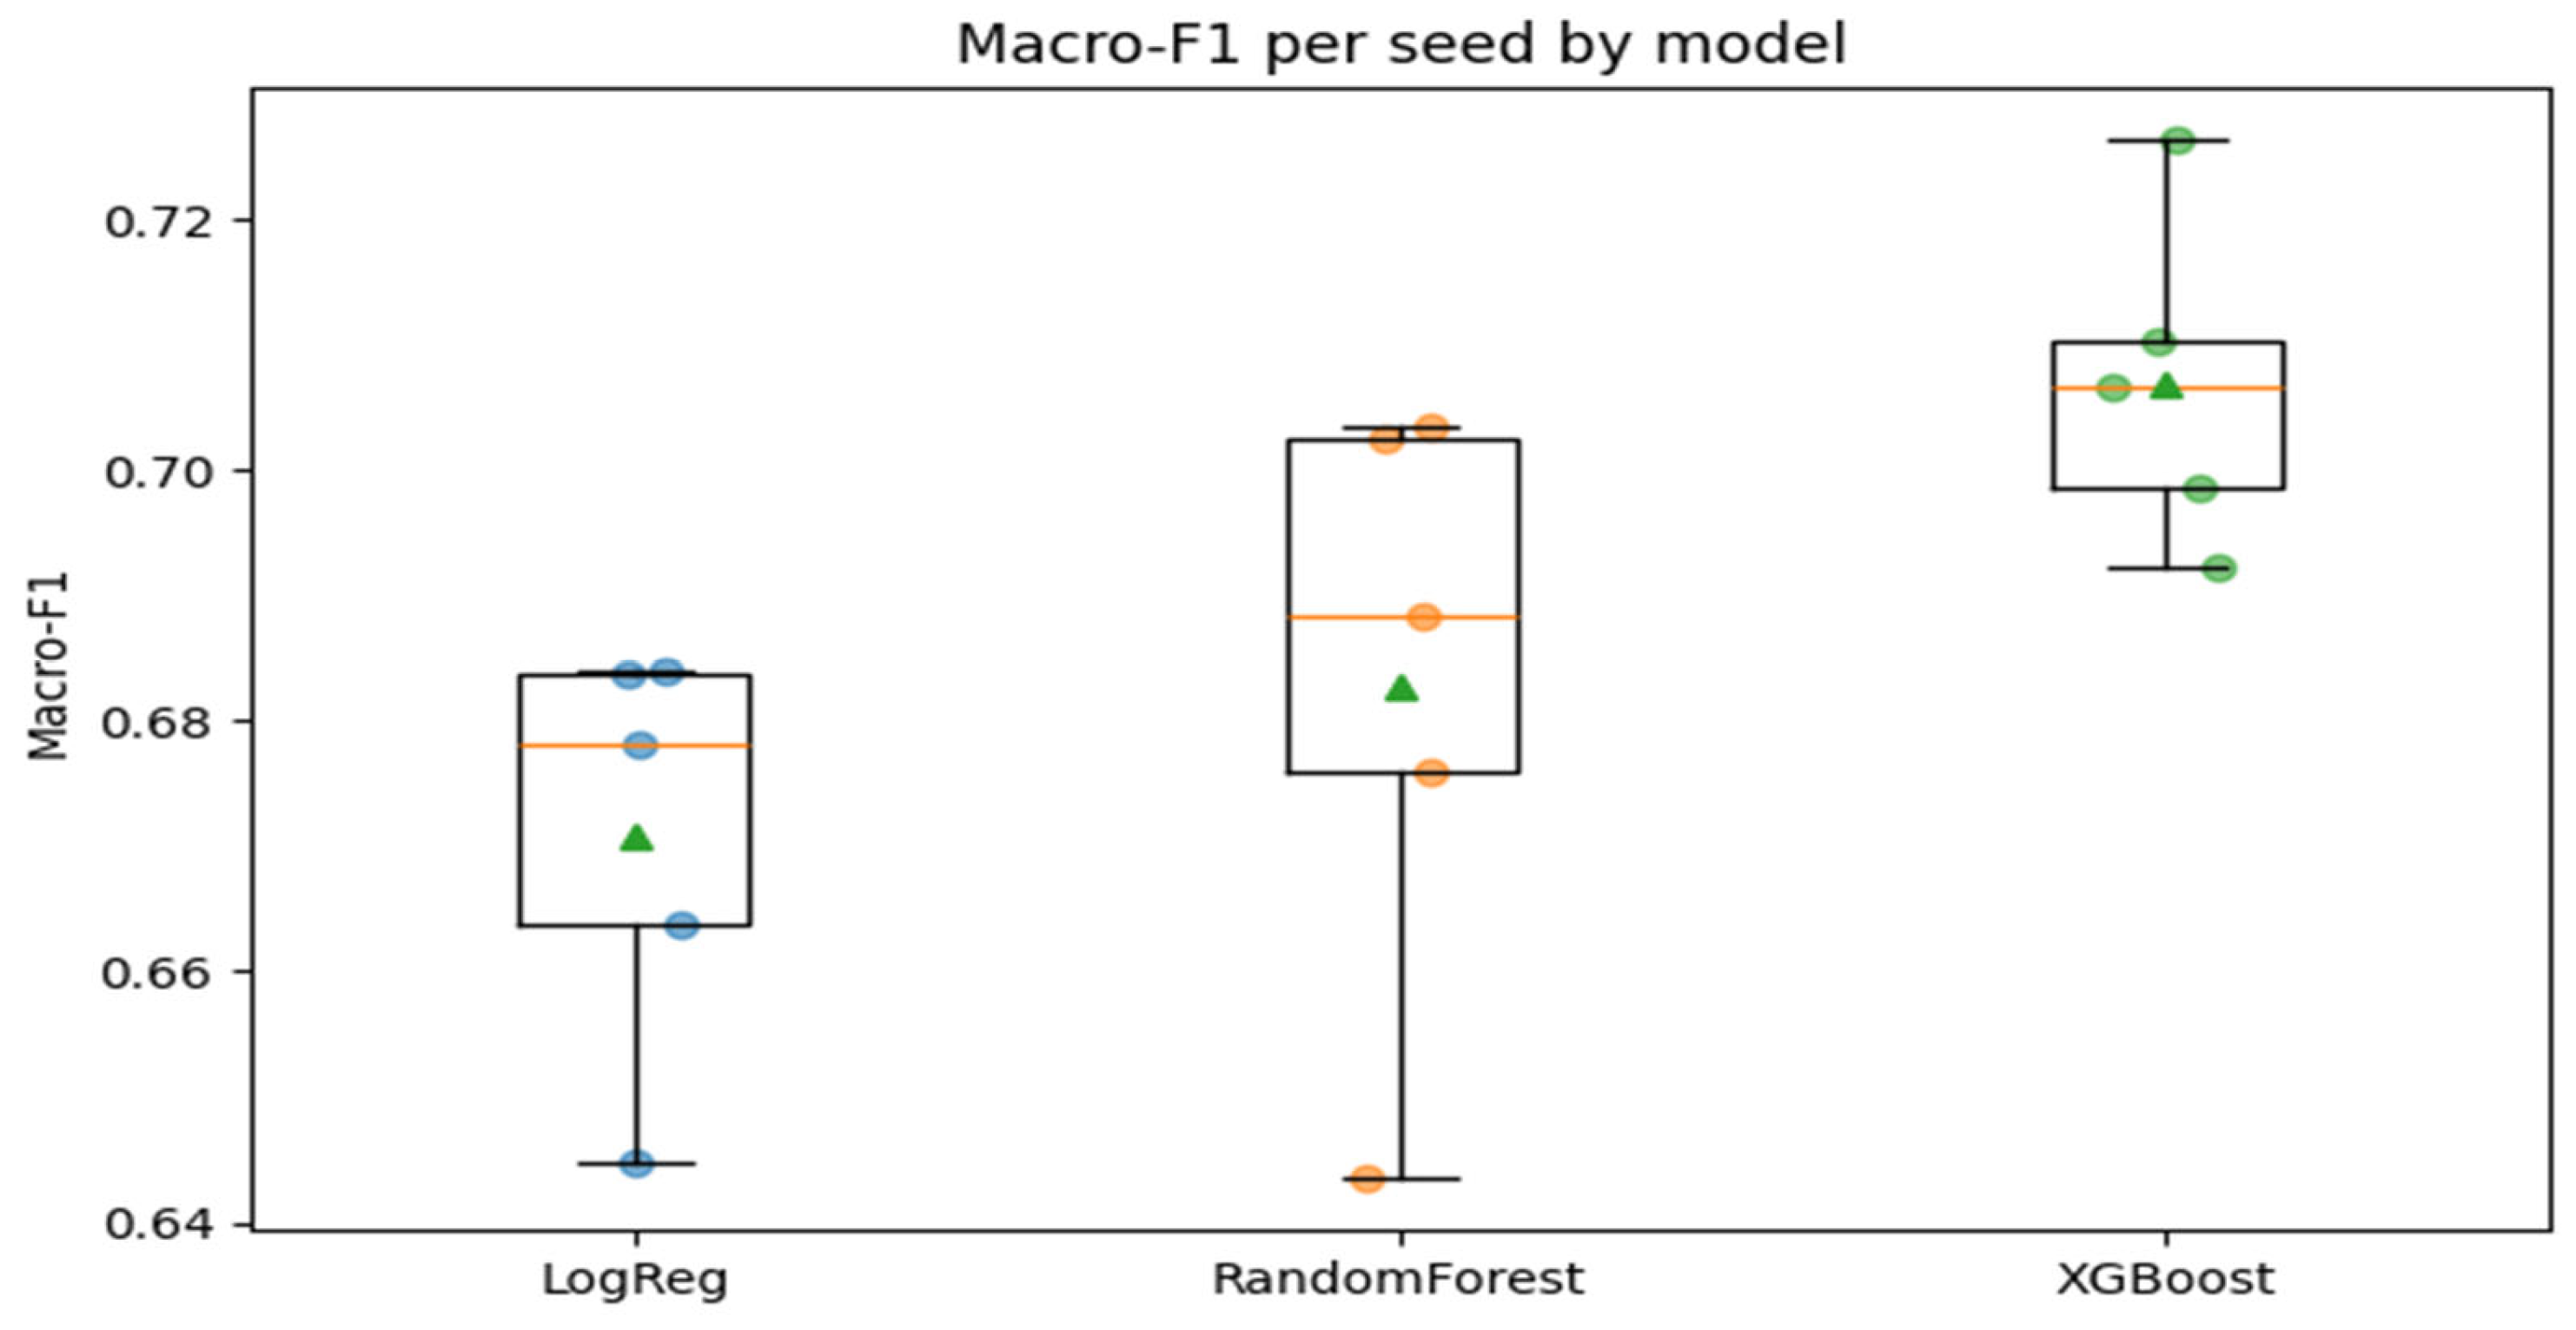
Figure 4.
Baseline Random Forest Confusion Matrices.
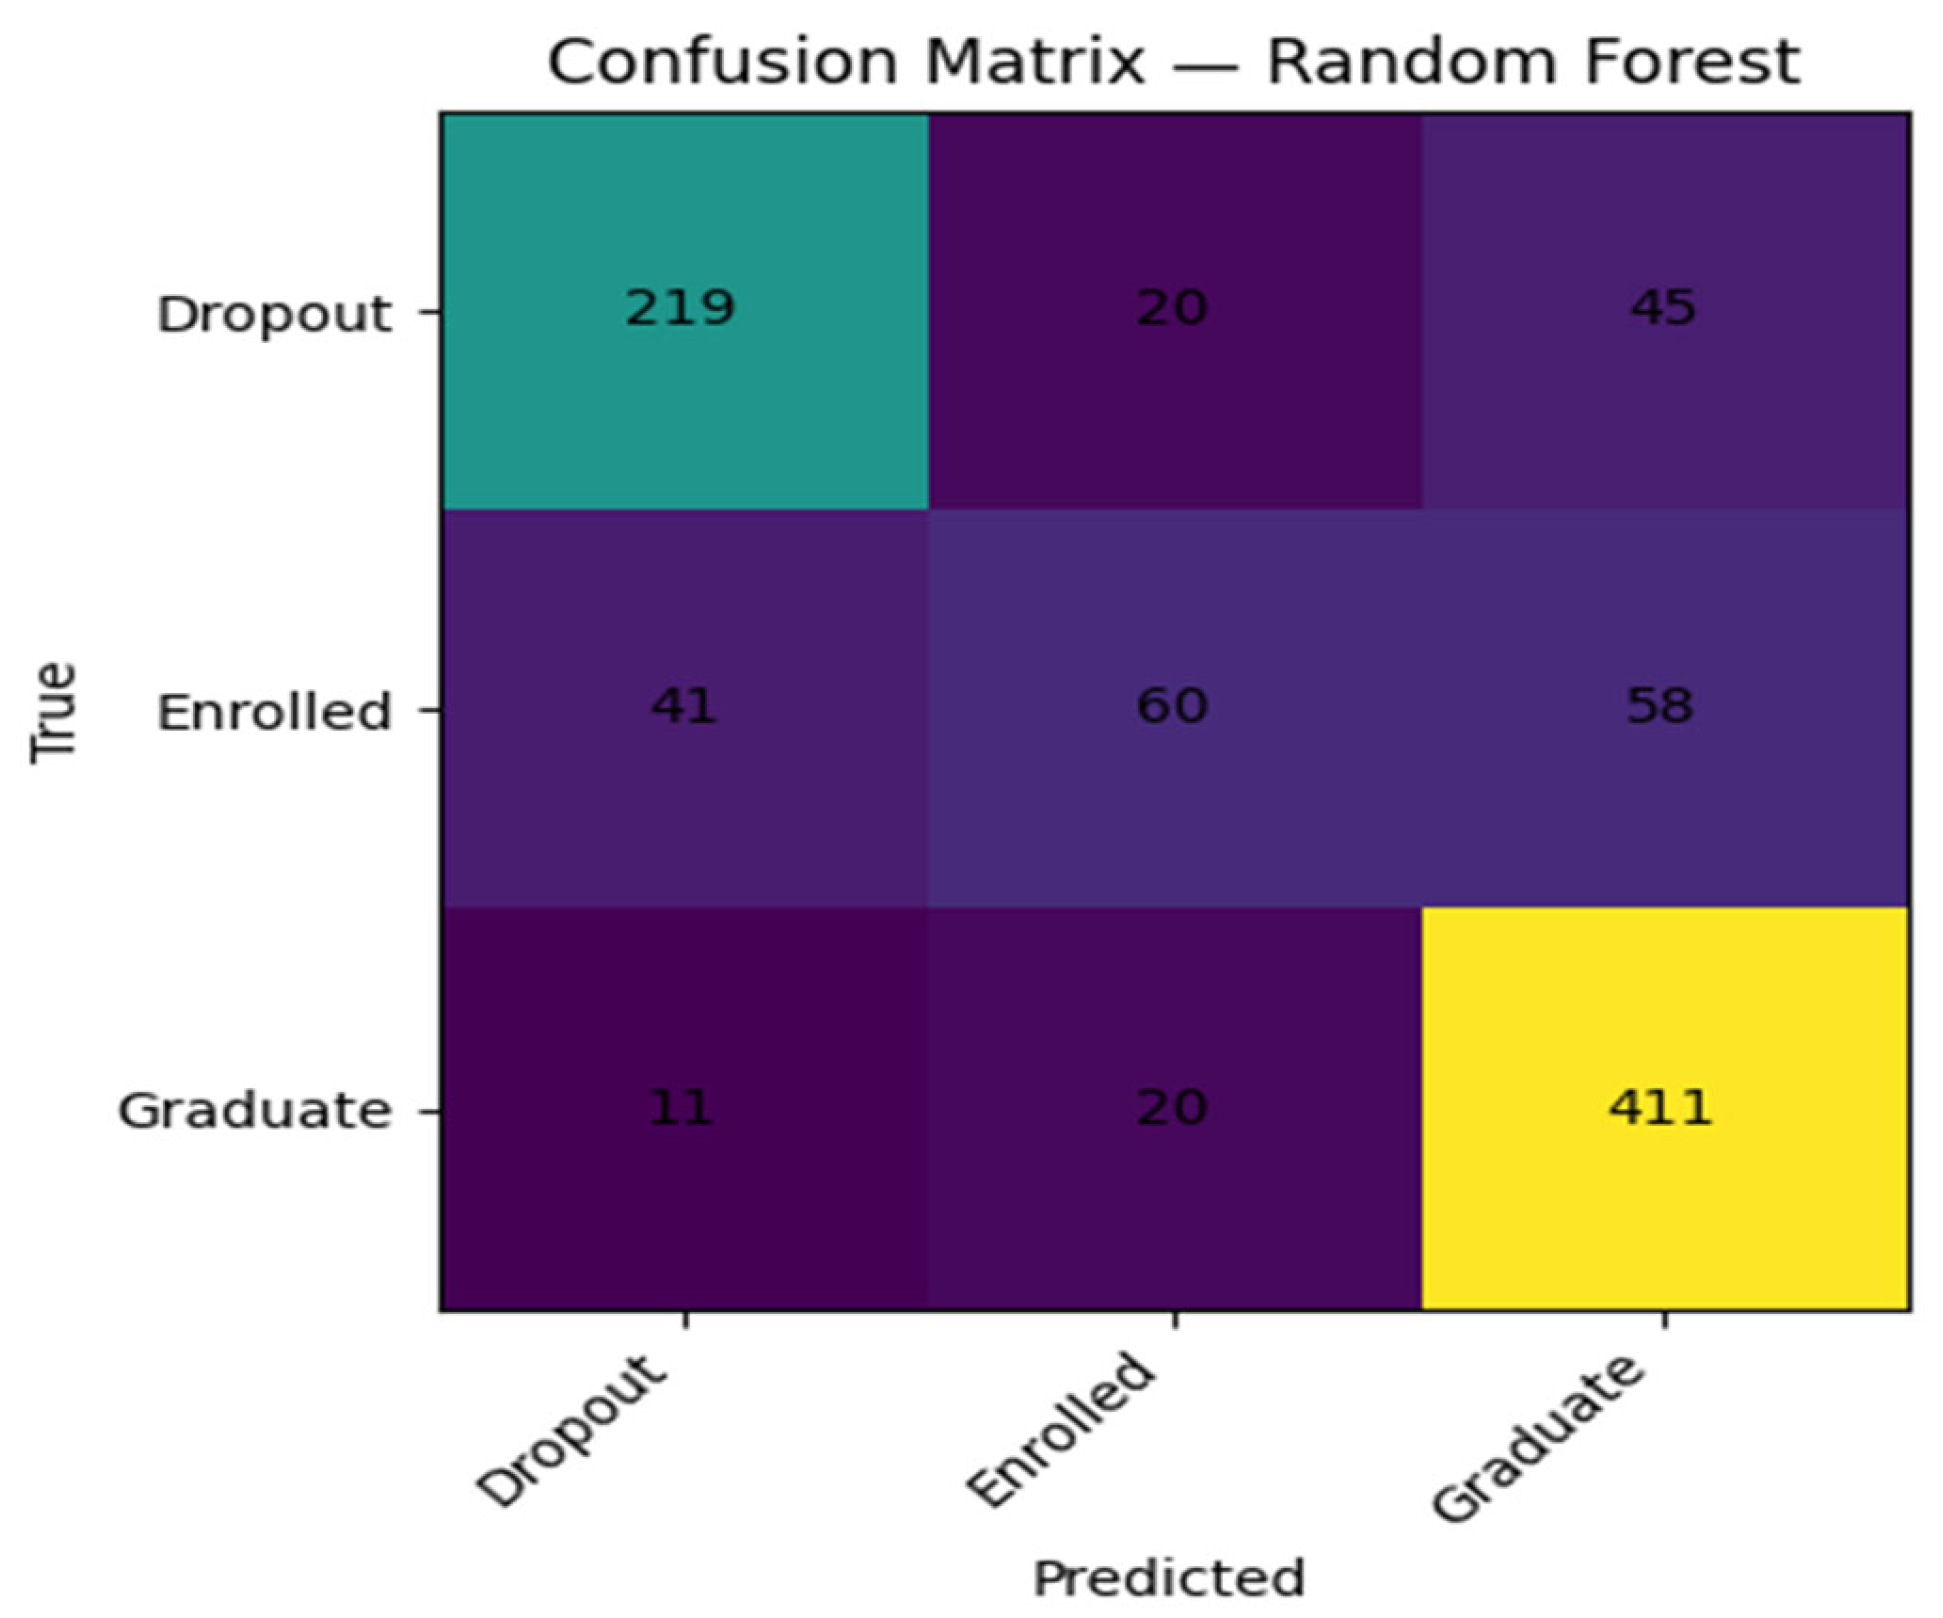
Figure 5.
Baseline XGBoost Confusion Matrices.

Figure 6.
Baseline Logistic Regression Confusion Matrices.
Discussion
The current research aimed at predicting the three possible outcomes of students, such as drop out, continued enrolment, and graduation, using solely enrolment time administrative data and a panel of monitored machine learning models. The results indicate that enrollment-time variables are enough to make practical useful predictions and tuned tree-based models, in particular, extreme gradient boosting, have macro-averaged F1-scores of about 0.70-0.72 and strong multi-class discrimination on random data splits. These findings are empirical evidence of the possibility of risk assessment at the point of entry into higher education based on data at an early stage.
Meanwhile, the analysis shows that there are crucial peculiarities in the manner in which various results are modeled and in the way in which various characteristics play a role in prediction. The models perform especially well in identifying those students who will ultimately graduate, fairly well in identifying those students who will drop out in future, and poorly in identifying those students who do not graduate in the observation period, but continue staying in school. The trend highlights the difficulty of the line drawn between those students that are temporarily behind but end up winning and those students that are on a path of permanent withdrawal.
Discussion of Results Relating to the Literature
On the first research question, feature-importance analysis proves that the academic preparation and early academic indicators play the central role in predicting the long-term student outcomes. The variables, which prove to be the most influential, include past qualification grade, admission grade, and units covered in the curriculum approved or graded in the first semesters. Things like the financial and administrative variables (i.e. are tuition fees current, do students have financial support, etc.) can also play a significant role in the decisions of the model, in addition to such demographic variables of age at entry and selected background attributes. These results are in line with the accumulated literature that repeatedly points at academic achievement and credit acquisition and financial strain as the major sources of dropout risk and persistence (e.g., Aulck et al., 2016; Kim et al., 2023; Matz et al., 2023).
The second research question was the comparison of the multinomial logistic regression, random forest and extreme gradient boosting performance. Similar to many comparative studies, tuned XGBoost model has the highest values of macro-F1 and ROC-AUC, with random forest coming in second, and logistic regression providing a relatively weaker yet still competitive baseline (Villar and de Andrade, 2024; Ridwan and Priyatno, 2024; Noviandy et al., 2024). Ensemble tree approaches seem especially convenient when the feature space of institutional student records is heterogeneous and moderately imbalanced, and nonlinearity and higher-order interactions are typical. Simultaneously, the good performance of the logistic regression, particularly in the ROC-AUC, emphasizes the idea that well-regularized linear models are still useful benchmarks, which can combine a decent level of accuracy with a high level of interpretability.
The three-way formulation of the prediction task which is explicitly stated in this study as being dropout, enrolled, and graduate outcomes is a unique contribution of this study. A lot of the available literature still lumps all non-dropouts in one category, and it is hard to distinguish between students on track and those behind and still continuing (Sabando Moreira & Zambrano Montenegro, 2024)
Early Warning and Institutional Practice Implications
The third research question was how outputs of models, such as the likelihood of predicted probability, confusion patterns and ranking of features by importance, could be used to inform early warning and intervention strategies. The findings suggest that institutional support can be an enrollment-time model used as a first-triage instrument. Since they are made available before the students start taking courses, they can be utilized to give precedence to proactive outreach e.g. placing high-risk students in special academic advising, orientation, or financial counseling.
Practically speaking, the XGBoost model would be tuned to produce risk scores of every incoming student and place them in general risk categories (such as low, medium, high risk of dropping out) instead of using the predictions as binary outcomes. High-risk students might receive an invitation to special advising to discuss their planning of studies, managing their workload, and referrals to support services. Simultaneously, a certain degree of knowledge about the reasons why a certain student might be deemed high-risk, e.g., a combination of poorer admission grades, studying part-time, and some of the choices of the program, can be gained through the insights of logistic regression coefficients and profile feature of tree-based feature importance, which will help a counselor to realize that this student is at risk, not solely because he or she is at risk. This is in line with the literature of calls that require predictive models that are not merely predictive but also lead to actionable interpretation (Attiya and Bin Shams, 2023; Elbouknify et al., 2025).
There is also the implication of the multi-class perspective on interventions design. Since this is the hardest category of classifications, institutions are especially advised to be cautious about prediction in this category due to the enrolled class. The students in this category can be at a middle-risk level: neither obviously on-track, nor obviously on the course to drop out, either. Instead of labeling them as safe or failing, an institution may utilize the model to find patterns that define the difference between a student who is slow yet improving, and one who is struggling persistently and as a result, devises differentiated support approaches where delayed but successful graduation is viewed as a valid result.
Lastly, the consistency of the performance of the various random seeds indicates that the pipeline-stratified splitting method, hyperparameter optimization based on Bayesian optimization, and macro-F1 and ROC-AUC-based evaluation are stable enough to be made a part of institutional analytics processes. Nevertheless, any working deployment must be followed by close attention to model calibration over time, periodic retraining as new cohorts enter and organized governance procedures to regulate the use of predictions in decision-making.
Methodological Contributions
This study is also methodologically important beyond its substantive findings in a number of ways. First, it illustrates the entire machine learning pipeline on a real-world learning problem: data cleaning and preprocessing, model training and hyperparameter optimization, multi-seed evaluation and feature importance analysis.
Second, the research clearly picks up macro-averaged F1-score as the main evaluation measure, with accuracy and ROC-AUC as complements. Macro-F1 is particularly suitable in those settings where interest is broader than the majority class and performance in minority classes is paramount, in this case, especially the enrolled and dropout ones(Aulck et al., 2016; Attiya and Bin Shams, 2023).
Third, the study provides empirical data into the performance-interpretability debate by comparing a transparent linear model with two popular tree-based ensembles in the same evaluation setup. Instead of promoting only one best algorithm, the outcomes favor a stratified approach in that, logistic regression presents clear and communicable baselines, random forest provides strong performance and easy feature importance, and XGBoost presents maximum predictive accuracy in those cases where the slightest improvement of the performance merits a higher level of complexity of the model.
Future Research Limitations and Directions
Though the results are encouraging, it must be admitted that this research has a number of limitations, some of which lead directly toward fruitful directions of future research.
Univariate and Contextual Constraints.The statistics used in this analysis belong to one higher education institution that has its unique set of student demographics, program portfolio and policy environment. The sample is quite large (4,424 students) and heterogeneous, but it is not evident how well the trained models would be applicable in other institutions with other structures or students population. This weakness is indicative of the broader problem in the research: most dropout prediction research is single-institutional, and cross-institutional validation is uncommon (Sabando Moreira and Zambrano Montenegro, 2024; Elbouknify et al., 2025). Future studies can examine the transferability through training models on one institution and testing them on others and domain adaptation or meta-learning methods may be investigated where appropriate.
Restricted Feature Space
The second limitation is related to the feature space. These models use only enrollment-time administrative variables without using any behavioral or temporal data (learning management system, course assessment, or advising interaction) data. However, as many studies report, behavioral engagement indicators, including, but not limited to LMS logins, resource views, assignment submission behaviors, and forum-based activity, significantly improve predictive outcomes and may be able to detect sudden behavioral shifts in students that lead to dropout (Matz et al., 2023; Park and Yoo, 2020; Cheng et al., 2025; Zerkouk et al., 2025).
Consequently, the existing models can only be seen as crudely-grained risk indicators rather than alternatives to the more fine-grained temporal ones. Future research must combine the variables of enrollment time with dynamic behavioral data, potentially with sequence models like LSTMs or attention-based models, to understand how engagement changes over time.
Scales of Imbalance Management and Assessment
Even though there is no extreme case of class imbalance, but the minority enrolled class is relatively small among the graduates and dropouts. This paper was concerned with imbalance specifically by using macro-F1 as the primary measure and stratified splitting, although it was not done in a systematic way to analyze rebalancing methods, including synthetic minority oversampling, class-weighted loss, or focal loss. Depending on previous studies, these approaches have the potential to enhance minority-class recall in educational data, but frequently at the price of more complex models (Villar & de Andrade, 2024). The how various imbalance handling methods can be compared in multi-class dropout situations should be subject to future research.
Interpretability, Faireness, and Ethical Concerns
In this study, the feature importance of global features of random forest and XGBoost can only be analyzed in terms of interpretability. In spite of the fact that these rankings are informative, they lack local explanations of individual predictions and to a certain extent the issue of fairness and bias. It is increasingly agreed that predictive analytics in education must be supported with methods like SHAP or LIME to provide insight into how a model makes decisions at a student level and fairness audits to identify systematic performance disparities among demographic subgroups (Elbouknify et al., 2025).
Besides, one cannot ignore the ethical consequences of the classification of students as high risk. Otherwise, early warning systems can be constructed to discriminate against particular groups, become parts of the status quo, or be manipulated to implement different forms of restrictive policies instead of supportive interventions. Future endeavors must thus be accompanied by technical advances with participatory design practices involving students, instructors, and administrators so that predictive systems are implemented in manners that are transparent, equitable as well as in ways that are consistent with institutional values.
Future Research Directions
Building on these limitations, several concrete directions for future research emerge:
- Cross-institutional and cross-cohort validation: Train and test models across multiple institutions and time periods to assess generalizability and concept drift.
- Richer feature spaces and temporal modeling: Integrate enrollment-time data with LMS logs, assessment records, and advising notes; explore time-series and sequence models that capture behavioral trajectories.
- Advanced imbalance and calibration techniques: Compare class-weighted losses, resampling strategies, and calibration methods to improve minority-class performance and probability reliability.
- Explainable and fair machine learning: Incorporate SHAP or related methods to provide case-level explanations, and systematically evaluate fairness metrics across key demographic and socio-economic groups.
- Intervention and impact evaluation: Move beyond predictive accuracy to study how model-informed interventions affect actual retention and graduation outcomes, ideally through pilot programs or randomized controlled trials.
Conclusions
This paper discussed the question, can machine learning models, which are trained only on administrative data on enrollment-time, be considered reliable predictors of the outcomes of multi-class students on dropout, further enrollment, and graduation in a higher education institution? Three supervised learning algorithms were compared using a dataset of 4,424 degree-seeking students; multinomial logistic regression, random forest and extreme gradient boosting. The modeling pipeline involved the use of data cleaning, median imputation, scaling where necessary, stratified 60/20/20 train-validation-test splits, and the use of Bayesian hyperparameter optimization with various random seeds.
The results revealed that enrollment-time data is enough to make correct and strong multi-class predictions. Tuned XGBoost models had the highest macro-F1 and ROC-AUC scores on the seed level with random forest on its heels, with logistic regression giving a solid, interpretable baseline. Class-specific studies showed that graduates can be best identified, dropouts are mid-way well represented and students still in school are most challenging to classify, as is the nature of intermediate and extended study pathways. The importance of academic preparation as a central variable, early academic precursors, and program and financial variables allowed by the feature importance analysis resemble the trends found in the general body of research on dropout prediction and student persistence.
Collectively, these findings indicate that enrollment-time machine learning models can be used as an early-warning layer in institutional retention strategies. Considered within a wider context of advising, financial aid, and academic services, these models have a potential to assist the institution allocate resources to the students who have the highest chance of skipping and frame the specific interventions, as well as track the success of the support programs in the long-term.
Meanwhile, the study reveals that predictive models do not replace human judgment or structural reforms. Their productions have to be viewed in context, with more behavioral and temporal data, and stocked with solid ethical protection. The approach should be extended to institutions and dynamic engagement data incorporated in future work and the impact of model-informed interventions on the real student success rigorously assessed.
References
- Akter, T., Ayman, U., Narayan Ranjan Chakraborty, D. A., Islam, A., Mazumder, M. H. I., & Bijoy, B. (2024). Dropout prediction of university students in Bangladesh using machine learning. In Proceedings of the 2024 IEEE International Conference on Computing, Applications and Systems (COMPAS). IEEE.
- Arqawi, S. M., Zitawi, E. A., Rabaya, A. H., Abunasser, B. S., & Abu-Naser, S. S. (2022). Predicting university student retention using artificial intelligence. International Journal of Advanced Computer Science and Applications, 13(9), 315–321. [CrossRef]
- Attiya, W. M., & Bin Shams, M. A. (2023). Predicting student retention in higher education using data mining techniques: A literature review. In Proceedings of the 2023 International Conference on Cyber Management and Engineering (CyMaEn) (pp. 171–177).
- Aulck, L., Velagapudi, N., Blumenstock, J., & West, J. (2016). Predicting student dropout in higher education. arXiv. arXiv:1606.06364.
- Cheng, J., Yang, Z.-Q., Cao, J., Yang, Y., & Zheng, X. (2025). Predicting student dropout risk with a dual-modal abrupt behavioral changes approach. arXiv. arXiv:2505.11119.
- Elbouknify, I., Berrada, I., Mekouar, L., Iraqi, Y., Bergou, E. H., Belhabib, H., Nail, Y., & Wardi, S. (2025). AI-based identification and support of at-risk students: A case study of the Moroccan education system. arXiv. arXiv:2504.07160.
- Kabathova, J., & Drlik, M. (2021). Towards predicting student’s dropout in university courses using different machine learning techniques. Applied Sciences, 11(7), 3130. [CrossRef]
- Kim, S., Yoo, E., & Kim, S. (2023). Why do students drop out? University dropout prediction and associated factor analysis using machine learning techniques. arXiv. arXiv:2310.10987.
- Matz, S. C., Bukow, C. S., Peters, H., Deacons, C., Dinu, A., & Stachl, C. (2023). Using machine learning to predict student retention from socio-demographic characteristics and app-based engagement metrics. Scientific Reports, 13, 5705. [CrossRef]
- Niyogisubizo, J., Liao, L., Nziyumva, E., Murwanashyaka, E., & Nshimyumukiza, P. C. (2022). Predicting student’s dropout in university classes using two-layer ensemble machine learning approach: A novel stacked generalization. Computers and Electrical Engineering: Artificial Intelligence, 3, 100066. [CrossRef]
- Noviandy, R., Mukti, F. A., Sari, D. M., & Pratiwi, P. E. (2024). Machine learning for early detection of dropout risks and academic excellence: A stacked classifier approach. Journal of Educational Management and Learning, 2(1), 28–34.
- Park, H. S., & Yoo, S. J. (2021). Early dropout prediction in online learning of university using machine learning. JOIV: International Journal on Informatics Visualization, 5(4), 347–353. [CrossRef]
- Ridwan, S., & Priyatno, A. (2024). Predict students’ dropout and academic success with XGBoost. Journal of Education and Computer Applications, 1(2), 108–119.
- Sabando Moreira, P. A., & Zambrano Montenegro, D. F. (2024). Técnicas de machine learning para predecir la deserción estudiantil universitaria: Una revisión sistemática de la literatura: Machine learning techniques to predict university student dropout: A systematic review of the literature. Revista Científica Multidisciplinar G-Nerando, 5(2), 1181–1189. [CrossRef]
- Vaarma, M., & Li, H. (2024). Predicting student dropouts with machine learning: An empirical study in Finnish higher education. Technology in Society, 76, 102474. [CrossRef]
- Villar, A., & de Andrade, C. R. V. (2024). Supervised machine learning algorithms for predicting student dropout and academic success: A comparative study. Discover Artificial Intelligence, 4, 2. [CrossRef]
- Zerkouk, M., Mihoubi, M., & Chikhaoui, B. (2025). SentiDrop: A multi modal machine learning model for predicting dropout in distance learning. arXiv. arXiv:2507.10421.
Disclaimer/Publisher’s Note: The statements, opinions and data contained in all publications are solely those of the individual author(s) and contributor(s) and not of MDPI and/or the editor(s). MDPI and/or the editor(s) disclaim responsibility for any injury to people or property resulting from any ideas, methods, instructions or products referred to in the content. |
© 2025 by the authors. Licensee MDPI, Basel, Switzerland. This article is an open access article distributed under the terms and conditions of the Creative Commons Attribution (CC BY) license (http://creativecommons.org/licenses/by/4.0/).
Copyright: This open access article is published under a Creative Commons CC BY 4.0 license, which permit the free download, distribution, and reuse, provided that the author and preprint are cited in any reuse.


