
Submitted:
01 December 2025
Posted:
01 December 2025
You are already at the latest version
Abstract
Rapid urbanization in African cities has increased demand for safe and reliable energy infrastructure, with Liquefied Petroleum Gas (LPG) emerging as a leading option for clean cooking. In Nairobi, Kenya, the siting of LPG refill stations is critical to minimizing safety risks and protecting public health. This study applied a GIS-based Multi-Criteria Decision Analysis (MCDA) to identify suitable areas for LPG stations. The analysis integrated land use, elevation, slope, geology and soil data with regulatory and planning constraints. Two approaches were compared: Boolean analysis, which produced a strict exclusion mask identifying 33 restricted zones and weighted overlay (with the exclusion mask applied), which yielded 2439 feasible locations across varying levels of suitability. Peri-urban neighborhoods in Embakasi ward consistently emerged as the most favorable. Validation using high-resolution imagery confirmed the contextual appropriateness and regulatory compliance of selected sites, with weighted overlay achieving 87.1% accuracy and Boolean analysis 85.7%. The findings show that weighted overlay combined with an exclusion mask provides a more flexible and comprehensive framework than rigid Boolean methods balancing safety with regulatory requirements. The study provides evidence-based guidance for expanding LPG infrastructure in rapidly urbanizing cities supporting strategic urban planning while reducing environmental, social and safety risks.
Keywords:
LPG refill stations
; suitability analysis
; GIS-MCDA
; weighted overlay
; Boolean overlay
; urban energy planning
; Nairobi
; Kenya
1. Introduction
Rapid urbanization across African cities has intensified the need for safe, reliable and accessible energy infrastructure with clean cooking fuels such as Liquefied Petroleum Gas
(LPG) becoming increasingly important. Transitioning from traditional biomass and kerosene fuels to LPG is increasingly recognized as vital for reducing household air pollution, mitigating environmental degradation and advancing public health [1,2]. In this context, many countries face significant challenges in ensuring safe and equitable access to LPG. In Kenya, where an estimated 15,000 deaths annually are attributed to air pollution, the government has committed to making LPG the primary cooking fuel for 35% of households under its Vision 2030 and Sustainable Energy for All (SE4All) agenda [2]. Nairobi, the country’s capital, exemplifies these challenges as rapid population growth, land-use competition and informal urban expansion have heightened the need for strategically planned LPG infrastructure.
The importance of siting LPG refill stations extends beyond accessibility to considerations of safety and environmental risk. Poorly located stations have historically contributed to disasters where facilities poorly located resulted in significant loss of life and property [3]. In Ghana, the frequent reports of oil and gas explosions and their devastating social and economic costs have raised concerns about the siting of fuel facilities [4]. Kenya has faced similar challenges including the most recent 2024 Embakasi LPG plant explosion in Nairobi which claimed lives and injured many. This tragic event clearly demonstrated the severe dangers of siting LPG facilities within residential areas [5]. This highlights the need for applying evidence-based siting strategies such as GIS-based suitability analysis to guide the safe and sustainable location of LPG facilities in Nairobi.
Recent studies have demonstrated the effectiveness of GIS-based approaches for spatial suitability analysis in energy infrastructure planning. While some have combined GIS with Multi-Criteria Decision Analysis (MCDA) to evaluate fuel and LPG station locations [3,4,6], others have advanced alternative methods such as multi-objective optimization using Genetic Algorithms under spatial planning constraints [7]. Additionally, compliance-focused GIS studies across Africa reveal persistent gaps between regulatory standards and actual fuel station siting practices. In Kano, Nigeria, Mohammed et al. [8] showed that filling stations were frequently clustered along major roads, with many failing to meet minimum spacing requirements. Similar patterns were observed in Douala, Cameroon, where Batambock et al. [9] found widespread violations of distance regulations, with stations located dangerously close to schools, hospitals and markets. In Kumasi, Ghana, Antwi et al. [10] reported that the majority of fuel and gas stations failed to comply with Environmental Protection Agency (EPA) siting criteria posing serious risks to public health and safety. Beyond Africa, Yahya and Safian [11] used geostatistical analysis in Selangor, Malaysia, to reveal significant clustering of stations in urban hotspots, underscoring broader challenges of uneven distribution and planning inefficiencies. Collectively, these studies highlight the critical role of GIS in auditing compliance and informing safer siting strategies demonstrating the versatility of GIS-based analysis for addressing safety, environmental and regulatory concerns in siting decisions. Despite these advances, Kenya has seen limited application of GIS-MCDA specifically for LPG station planning.
Building on these insights, GIS-based MCDA frameworks offer a practical and adaptable approach for LPG infrastructure planning capable of integrating diverse spatial criteria and regulatory constraints. Boolean constraint models are particularly effective for enforcing exclusion zones by applying binary logic across spatial layers [12,13]. Weighted overlay techniques, by contrast, allow for the prioritization of multiple factors through the assignment of relative weights to reclassified criteria [14], and have been widely applied in spatial suitability analysis across different domains [6,15,16]. Together, these methods enable planners to balance safety, equity and feasibility in siting decisions, particularly in rapidly urbanizing contexts[6,14,15,16].
This study applies a GIS-MCDA framework to identify suitable locations for LPG refill stations in Nairobi by comparing Boolean constraint analysis and weighted overlay incorporating a constraint map. By contrasting the outputs under each method, the study highlights areas in eastern Nairobi as the most promising zones for safe LPG station development. These findings demonstrate how methodological choice influences site identification and provide evidence-based guidance for infrastructure planning and policy in rapidly urbanizing African cities.
2. Materials and Methods
2.1. Study Area
2.1.1. General Description of Study Area
The study was conducted in Nairobi City County, Kenya, the country’s capital and a major economic hub (Figure 1). The County has a total area of 696.1 km², located between longitudes 36o 45’ East and latitudes 1o 18’ South and is bordered by Kiambu, Kajiado and Machakos Counties. It lies at an average altitude of 1,798 meters above sea level [17]. The terrain is characterized by predominantly gentle to moderately steep slopes.
Nairobi City County exhibits a heterogeneous land use structure including residential, commercial, industrial, government and institutional centers, transport and communication infrastructure, hospitality and tourism facilities, informal settlements and peri-urban agriculture [17]. Rapid urbanization has increased demand for infrastructure and services including the growing need for Liquefied Petroleum Gas (LPG) distribution networks as clean cooking adoption expands [18] (pp. 40-60), [19]. The city’s mix of dense urban cores and lower-density outskirts [20] provides a suitable context for evaluating spatial suitability of refill stations considering environmental, regulatory and planning factors relevant to safety. The study area was further delineated using administrative and neighborhood boundaries to guide accurate GIS-based site assessment (see Figure 2).
2.1.2. Neighborhood Framework
Neighborhoods were adopted as the primary spatial units of analysis to capture fine-scale variations in land use and settlement patterns that official wards alone do not reflect. Digitized neighborhoods were delineated within wards to provide a representative framework for data integration and suitability analysis. Digitization primarily followed major roads and rivers visible in OSM. Where boundaries were unclear, high-resolution imagery from Google Maps and Google Earth Pro was used to refine digitization with rooftop patterns and street-level views guiding the identification of settlement types and land uses. Each neighborhood polygon was ensured to include a residential area and was attributed with corresponding ward and sub-county information. Topology rules were applied to eliminate overlaps and gaps ensuring consistency of neighborhood boundaries. The final neighborhood layer (Figure 2) illustrates the subdivision of wards into finer spatial units suitable for analysis.
2.2. Data Sources and Preprocessing
Data used in this study were grouped into two main categories: (i)thematic datasets (Table 1), representing continuous spatial variables and discrete spatial categories and (ii)buffered datasets (Table 2), representing features where suitability was determined by regulatory and planning distances. Supporting datasets used to guide neighborhood digitization and candidate filtering are described in Section 2.2.3.
2.2.1. Thematic Datasets
The study used five thematic datasets (Table 1), including elevation, slope, geology and soil as shown in Figure 3Figure 3. Elevation (a), slope (b), geology(c) and soil(d) thematic layers used in the site-suitability analysis., and land use. Elevation and slope surfaces were derived from the ALOS PALSAR DEM (12.5 m) [28], with gaps filled using SRTM (30 m, resampled to 12.5 m) sourced from [29]. Elevation data helped identify low-lying areas prone to flooding, while slope data excluded steep terrain [7,10]. Geological data from the Southern Kenya Rift map [30], was used to assess ground stability and mitigate risks of landslides, subsidence and seismic activity [7]. Soil texture dataset was obtained from Africa SoilGrids (250 m, 30–60 cm depth) [31], developed and documented by Hengl et al. [32], to evaluate foundation stability and prevent differential settlement in line with KS 1938-3:2020 [33]. Land use was obtained by updating Nairobi’s 2010 dataset [34], with a georeferenced 2012 map [35] (pp. 9-45), to reflect observed changes in Land use patterns. The dataset represents land use types within the study area.
2.2.2. Buffered Datasets
Buffered datasets included: (i) environmental constraints (protected areas, water resources), (ii) Physical infrastructure (power infrastructure, utilities, transport networks) and (iii) social infrastructure (Public institutions/installations e.g. schools, hospitals etc., places of assembly, residential areas and (iv) hazardous facilities). This category also included existing LPG stations which were used to enforce minimum distance constraints and further classified into distance thresholds for the weighted overlay analysis. Buffer distances, sources and rationale are summarized in Table 2.
2.2.3. Supporting Datasets
Supporting datasets included ward boundaries obtained from OSM via Overpass Turbo (https://overpass-turbo.eu/, accessed 15 April 2025), which were supplemented with GADM Level 3 administrative boundaries (https://gadm.org/download_country.html, Version 4.1; accessed 15 April 2025) to address missing wards and guide neighborhood digitization. Building footprints from Google Open Buildings (https://sites.research.google/gr/open-buildings/, accessed 28 July 2025), were employed to filter candidate sites based on a minimum 9.5 m distance to building boundaries. The Nairobi County boundary from Overpass Turbo (accessed 15 April 2025) served as a base map for accurate alignment during neighborhood digitization.
2.2.4. Preprocessing
All datasets were reprojected to WGS 84 / UTM Zone 37S (EPSG:32737) and clipped to the Nairobi County boundary. Buffer zones were generated in Python(Jupyter Notebook v7.2.2) using thresholds from national planning guidelines [36], safety regulations [33] and prior fuel siting studies [7,10]. Land use layer was prepared in ArcMap 10.8.1 by updating the 2010 Nairobi shapefile using a georeferenced 2012 scanned map, with observed land use changes digitized and topological errors resolved. From this layer, residential areas were extracted and combined with OSM residential polygons to form a unified residential layer. Parking areas from OSM polygons and points were merged into a consolidated dataset and buffered with the limitation that point-based buffers produced circular zones not always matching actual extents. Main rivers were digitized from a geo-referenced Afritekt map [22], and supplemented with OSM waterways. Boreholes, wastewater plants and water treatment plants were consolidated from multiple sources while the main dumpsite was digitized in ArcMap. All final layers, including thematic and buffered datasets were rasterized or resampled to a common 12.5 m resolution, using bilinear interpolation for continuous variables (e.g., SRTM elevation) and nearest-neighbor for categorical variables (e.g., soils) with the ALOS PALSAR DEM as the reference grid. The overall workflow, summarizing methodological steps is illustrated in Figure 4.
2.3. Suitability Analysis
2.3.1. Data Reclassification
To support both Boolean and weighted overlay analyses, all input datasets were reclassified into standardized suitability formats following established GIS procedures [13,14]. For the Boolean overlay, buffered and thematic datasets were converted into binary classes, with unsuitable and suitable areas assigned values of 0 and 1 respectively. Buffered areas inside the defined buffer distances were designated unsuitable. For weighted overlay, thematic datasets and LPG proximity distances were reclassified into five ordinal suitability classes (1 = not suitable to 5 = highly suitable), while buffered datasets were retained as binary exclusion masks. The reclassification schemes for both thematic datasets and LPG proximity are summarized in Table 3.
2.3.2. Boolean Overlay Analysis
A binary exclusion mask was generated to identify potential candidate sites by combining all buffered constraint and thematic rasters using a Boolean AND operation following the procedure described by Eastman [13], and subsequent siting studies such as Mohammed et al [16]. The Soil raster was excluded from analysis due to widespread clay coverage. The resulting Boolean raster was converted into candidate site polygons with NoData classified as unsuitable. Candidate polygons were filtered by a 0.0725 ha minimum area and a 9.5 m clearance buffer from buildings, excluding any sites intersecting building footprints to ensure regulatory compliance.
2.3.3. Weighted Overlay Analysis with Exclusion Mask
Weighted overlay analysis was performed by combining reclassified thematic layers and distances from existing LPG refill stations using the Weighted Linear Combination (WLC) method [15]. At each location, the composite suitability score , was calculated as:
Where is the reclassified suitability score of layer and is the normalized weight derived through expert judgment (Table 3). A Boolean exclusion mask was then applied to enforce regulatory and safety constraints, producing a final suitability layer that shows both suitability classes and excluded areas [37,38]. The output was converted to vector format and filtered as described in Section 2.3.2.
2.3.4. Validation
To assess the accuracy of the site-suitability model, the weighted overlay identified a total of 2,906 feasible polygons (2,439 suitable and 467 unsuitable) after applying the minimum area threshold and the 9.5 m safety buffer. From this population, a stratified random sample of 340 sites (suitable candidates = 285, unsuitable = 55) was drawn to ensure representation of both predicted locations. The sample size was calculated using Cochran’s formula for finite populations with a 95% confidence level and 5% margin of error [39], as shown in Equation 2:
where is the required sample size, is population size (total number of feasible polygons), =1.96 (standard normal deviate for 95% confidence), is the expected proportion of suitable sites (0.5 used for maximum variability) and is the desired margin of error.
For Boolean Overlay, all identified candidate sites were validated. Each selected site for both models was manually validated by visually inspecting its location against high-resolution satellite imagery in QGIS. Observed suitability was recorded as 1 = pass, indicating the site’s true condition matched its predicted suitability or 0 = fail, indicating a mismatch between the predicted and actual suitability. These labels were then used to compute standard binary classification metrics including accuracy, confusion matrix and Cohen’s kappa coefficient.
2.3.5. Software and Tools
The analysis combined GIS platforms with Python-based automation. QGIS 3.28.11 was used for initial boundary processing and clipping of the building footprint layer and manual validation of candidate sites against high-resolution satellite imagery (Google Satellite). ArcMap 10.8.1 supported digitization tasks, topology validation and preparation of final maps for reporting. Python 3.12.9 (Jupyter Notebook 7.2.2) served as the primary analytical environment where most preprocessing, reclassification, overlay analyses and suitability statistics were conducted. Key Python libraries included geopandas, shapely and rasterio for spatial operations; numpy and pandas for data processing; and rasterstats for zonal statistics. High-resolution imagery from Google Earth Pro (version 7.3.6.10441) was used to validate neighborhoods during digitization.
3. Results
3.1. Landuse and Reclassification results
The updated land use map of Nairobi County used in the suitability analysis is presented in Figure 5, while Figure 6 illustrates example reclassification outputs. The Boolean reclassification (Figure 6a–6c) categorized the land use, geology and soil layers into binary suitability classes, whereas the weighted reclassification (Figure 6d–6f) transformed the same layers into multi-class suitability maps (1–5), reflecting gradual variations in suitability based on expert-assigned weights. These examples demonstrate the reclassification procedure applied consistently across all buffered and thematic layers used in the analysis.
3.2. Boolean overlay results
3.2.1. Effect of input layers
The widespread clay coverage in the soil raster resulted in most areas of Nairobi being classified as unsuitable (Figure 6c). Its inclusion in the Boolean overlay initially produced 12 candidate sites (Figure 7a),which were reduced to only two candidate sites after filtering (Figure 7b), making the analysis overly restrictive. For this reason, the soil layer was excluded from subsequent Boolean analysis.
3.2.2. Candidate filtering and Spatial distribution
Excluding the soil layer, Boolean analysis identified 525 candidate polygons (Figure 8a), with most of Nairobi classified as unsuitable. After applying the minimum area threshold, clearance buffers and building footprint exclusions, this number was reduced to 33 final candidate polygons (see Figure 8b). All identified candidate polygons were converted into points (Figure 8c–8d).
The spatial distribution of Boolean candidate sites was highly uneven across the city. At the neighborhood scale, the Jomo Kenyatta International Airport area in Embakasi Ward contained the highest concentration with 11 sites (33.3%) representing one-third of all candidates.
At the ward level, Embakasi recorded the largest number of candidates (11), followed by Kasarani with six and Roysambu with four. When aggregated to sub-counties, Embakasi East dominated with 16 candidates (48.5%) nearly half of the total, while Kasarani and Roysambu accounted for seven (21.2%) and four (12.1%) sites respectively. Only single candidates were observed in Dagoretti South, Lang’ata and Makadara sub-counties.
Regionally, the eastern part of Nairobi accounted for 24 candidates (72.7%), while the southern region had none (Figure 9a). Overall, Boolean candidates were limited to 7 of 17 sub-counties, 10 of 85 wards and 14 of 930 neighborhoods, highlighting the narrow geographic footprint of this method. When overlaid with weighted suitability classes, the Boolean-selected sites were found to cluster mainly in moderately suitable areas: 31 out of 33 fell in Class 3, with only two in Class 4 and none in Classes 2 or 5.
3.3. Weighted Overlay Results
3.3.1. Suitability and Candidate filtering
The weighted overlay produced a five-class suitability surface (Figure 10a), with most of western and southern Nairobi classified as unsuitable (dark red). Moderate suitability areas (yellow-green) formed scattered clusters. Highly suitable areas (dark-green) were limited and concentrated in the eastern neighborhoods.
A Boolean exclusion map (Figure 10b) removed 593.2 km² (85.9%) of the study area, substantially reducing the available land for siting LPG stations. The combined weighted suitability and exclusion map (Figure 10c) shows the distribution of suitability classes across the remaining surface, highlighting that many areas initially classified as moderate to high were eliminated by exclusion constraints, leaving fewer viable zones. Conversion of this raster to vector generated 16,505 candidate polygons across Classes 2–5 (Figure 11a). Applying a minimum area threshold and a 9.5 m safety buffer reduced this to 2,439 feasible candidate polygons (Figure 11b), which were subsequently converted into points (Figure 11c). Class 2 (less suitable) dominated with 1,873 sites (76.8%), followed by Class 3 (moderately suitable, 525 sites, 21.5%), Class 4 (suitable, 38 sites, 1.6%) and only 3 sites (0.1%) in Class 5 (highly suitable).
3.3.2. Spatial and Regional Patterns
Candidate sites were unevenly distributed across Nairobi. Embakasi East dominated with 976 sites (40%) followed by Kasarani, Lang’ata, Westlands and Roysambu while two sub-counties contained none. At finer scales, only 42 of 85 wards and 131 of 930 neighborhoods contained candidates, with Jomo Kenyatta International Airport hosting the largest cluster (853 sites). Spatially, these sites were concentrated in peri-urban fringe areas rather than its dense urban core. Regionally, eastern Nairobi accounted for nearly two-thirds of all sites (63.9%), northern areas contributed about one-fifth (19.2%), western areas 16.9% and the southern region had none largely due to the National Park exclusion (Figure 9b). These patterns indicate that feasible locations are largely restricted to the city’s periphery.
3.4. Site-Level Validation
Out of the 340 sampled sites for the weighted overlay, 245 sites predicted as suitable were confirmed as truly suitable, while 51 sites predicted as unsuitable were correctly classified unsuitable. However, 40 sites predicted as suitable were found to be unsuitable and 4 sites predicted as unsuitable were actually suitable. Overall, the weighted overlay suitability model achieved an accuracy of 87.1%, with a kappa coefficient of 0.623, indicating substantial agreement between predicted and observed suitability. Model performance metrics for predicted suitable sites included a recall of 0.984 and precision of 0.860, whereas predicted unsuitable sites showed a recall of 0.560 and precision of 0.927, highlighting higher reliability in identifying suitable candidate locations. For the Boolean overlay, 29 predicted suitable sites were confirmed as truly suitable, while 4 were found to be unsuitable and 1 predicted unsuitable site was actually suitable, yielding an overall accuracy of 85.7%, with a precision of 0.879, recall of 0.967 and F1-score of 0.921 for predicted suitable sites. Figure 12 and 13 illustrate the representative validation of predicted suitable sites for both models, with Figure 12 showing correctly predicted locations and Figure 13 incorrectly predicted locations.
4. Discussion
This study shows that a weighted overlay (WLC) approach with an exclusion mask provides a more flexible and spatially inclusive method for siting LPG refill stations in Nairobi compared with a strict Boolean exclusion model. While the Boolean model produced a small, highly restricted set of 33 candidate sites, the weighted overlay identifies a much larger, more distributed set (2,439 sites) by allowing for varying levels of suitability. This flexibility is crucial especially in dense, rapidly urbanizing environments where land availability is constrained and regulatory buffers or other restricted areas might otherwise discard potentially suitable locations.
Spatially, the weighted overlay improved geographic coverage across administrative units. Boolean candidates were concentrated in only a few sub-counties, wards and neighborhoods. In contrast, the WLC method yielded a more diverse spatial spread with candidate sites distributed across eastern, western and northern Nairobi supporting a more balanced spatial distribution of LPG infrastructure. Zonal comparison further showed that Boolean-selected sites were concentrated in moderately suitable areas (Class 3) with no representation in the lowest (Class 2) or highest (Class 5) categories. This indicates that Boolean exclusion may underutilize optimal sites while over-relying on moderately suitable ones. Similar findings have been reported in other urban contexts. For example, Aslani and Alesheikh [40]conducted a GIS-based site selection study for small gas stations in Tehran, Iran and found that weighted overlay and fuzzy logic produced more optimal solutions than Boolean exclusion alone. Similarly, Hossain [41] applied a weighted overlay approach for fire station siting in Mitter Sill Municipality, highlighting the effectiveness of this method for urban site selection.
Further, the weighted overlay demonstrated slightly higher accuracy (87.1%) and better discrimination between suitable and unsuitable areas compared to the Boolean overlay (85.7%). While the Boolean model provides a simpler binary assessment, the weighted overlay offers more detailed gradation, making it more reliable for precise site selection.
From a policy and planning perspective, the findings suggest that strict Boolean criteria may be too restrictive for urban settings like Nairobi where land availability is already limited. Boolean methods remain essential for enforcing mandatory regulatory limits but their rigidity can discard potentially viable sites. In contrast, weighted overlay provides flexibility by ranking sites according to varying levels of suitability. A practical solution is therefore a hybrid workflow: apply Boolean rules to ensure safety and legal compliance, then use a weighted overlay to prioritize among the remaining areas and identify near-optimal sites that may require further evaluation. This two-stage strategy preserves regulatory compliance while broadening feasible options.
The study, however, has several limitations. First, input data resolution and currency may affect model outcomes. For example, resampled soil and SRTM DEM layers, as well as outdated land-use dataset can misrepresent local conditions and affect suitability scores. Future work should therefore incorporate more recent, original high-resolution datasets rather than resampled coarse data. Second, weight assignment remains subjective despite expert input. Methods such as the Analytic Hierarchy Process (AHP) or fuzzy approaches could be tested to reduce bias and improve robustness. Third, some exclusion masks were simplified: river buffers were derived from centerlines rather than the highest water mark required by planning standards, while buffers for schools, hospitals, other public institutions and places of assembly were buffered from point data instead of their full boundaries. These choices may understate true exclusion areas. Future studies should refine buffer generation using more precise boundary data. Fourth, remote-only validation is limited in confirming land use and accessibility, complementing it with stratified field checks would strengthen reliability. Finally, demand-side factors were not incorporated, and the LPG station dataset was limited to petrol stations offering retail LPG services excluding other outlets. Future research should integrate demand data and a complete inventory of LPG outlets to improve spatial accuracy.
5. Conclusions
This study demonstrates that integrating weighted overlay analysis with exclusion mask provides a balanced framework for LPG site suitability in Nairobi. The approach ensures regulatory compliance while allowing flexibility to rank and compare feasible locations. Such a hybrid method broadens planning options without compromising safety standards, making it a valuable decision-support tool for infrastructure planning in dense, fast-growing urban settings.
Author Contributions
Conceptualization, methodology, writing—review & editing, Dorothy Onchagwa and Felix Mutua; software, validation, formal analysis, investigation, resources, data curation, writing—original draft preparation, visualization, Dorothy Onchagwa; supervision, project administration, Felix Mutua. All authors have read and agreed to the published version of the manuscript.
Funding
This research received no external funding.
Data Availability Statement
The datasets used in this study are from multiple sources. Publicly available datasets are cited in the References and can be accessed via the provided URLs. Digitized and processed datasets will be made available by the corresponding author on request. Restrictions apply to the availability of LPG Refill Station data. These data were obtained from a third-party source and are available from the authors with the permission of the data provider.
Acknowledgments
The authors gratefully acknowledge the Energy and Petroleum Regulatory Authority (EPRA), specifically Daniel Choi, for technical input on factor weights; the Kenya Bureau of Standards (KEBS), particularly Mutuma Muthuri, Ndungu Evanson and Tonui Daisy for guiding access to the relevant LPG standards and the KEBS library staff for facilitating access to the physical standards during our visit. We also thank Maxmillan Mundi for sharing the 2025 Physical Planning Handbook and for directing us to the 2010 land use and roads data and Collins Mido for providing the the petrol station dataset from which the LPG station subset used in this analysis was derived. Special thanks are extended to James Onchagwa, Joyce Onchagwa and Simon Nyambutora for their financial support, which facilitated data collection, and to the Department of Geomatic Engineering and Geospatial Information Systems, Jomo Kenyatta University of Agriculture and Technology, particularly Dr. Nathan Agutu, the Department Chair, for facilitating institutional visits.
Conflicts of Interest
The authors declare no conflicts of interest.
References
- Ihemtuge, T.U.; Aimikhe, V.J. Optimization of Liquefied Petroleum Gas (LPG) Distribution in Nigeria. International Journal of Engineering and Technical Research (IJETR) 2020, 10. [Google Scholar] [CrossRef]
- Van Den Berg, I.C. Kenya’s Strategy to Make Liquefied Petroleum Gas the Nation’s Primary Cooking Fuel 2018.
- Ajman, N.N.; Zainun, N.Y.; Sulaiman, N.; Khahro, S.H.; Ghazali, F.E.M.; Ahmad, M.H. Environmental Impact Assessment (EIA) Using Geographical Information System (GIS): An Integrated Land Suitability Analysis of Filling Stations. Sustainability 2021, 13, 9859. [Google Scholar] [CrossRef]
- Peprah, M. S. , Boye, C. B., Larbi, E. K., & Opoku Appau, P. Suitability Analysis for Siting Oil and Gas Filling Stations Using Multi-Criteria Decision Analysis and GIS Approach–A Case Study in Tarkwa and Its Environs. J. Geomat. 2018, 12, 158–166. [Google Scholar]
- Stop Proliferation of Illegal Gas Facilities in Residential Areas – KARA Available online:. Available online: https://kara.or.ke/stop-proliferation-of-illegal-gas-facilities-in-residential-areas/ (accessed on 1 March 2025).
- Estelaji, F.; Naseri, A.; Keshavarzzadeh, M.; Zahedi, R.; Yousefi, H.; Ahmadi, A. Potential Measurement and Spatial Priorities Determination for Gas Station Construction Using WLC and GIS. futech 2023, 2, 24–32. [Google Scholar] [CrossRef]
- Zhu, J.; Zhu, M.; Chen, L.; Luo, L.; Wang, W.; Zhu, X.; Sun, Y. Multi-Objective Optimization of Urban Gas Station Site Selection Under Territorial Spatial Planning Constraints. IJGI 2024, 13, 375. [Google Scholar] [CrossRef]
- Mohammed, M. U.; Musa, I. J.; Jeb, D. N. GIS-Based Analysis of the Location of Filling Stations in Metropolitan Kano against the Physical Planning Standards. Am. J. Eng. Res 2014, 3, 147–158. [Google Scholar]
- Batambock, S.; Innocent, N.M.; Bitondo, D.; Waffo, A.F.N. Auditing the Siting of Petrol Stations in the City of Douala, Cameroon: Do They Fulfil the Necessary Regulatory Requirements? Adv. sci. technol. eng. syst. j. 2021, 6, 493–500. [Google Scholar] [CrossRef]
- Antwi, R.B.; Okai, S.; Quaye, J.; Ozguven, E.E. Geospatial Analysis of Fuel and Gas Station Distribution: Evaluating the Compliance and Impact of Station Siting on Public Health and Safety in Kumasi, Ghana. CRPASE 2024, 10, 1–19. [Google Scholar] [CrossRef]
- Yahya, M.S.S.; Safian, E.E.M. Gis Based Spatial Distribution Map of Petrol Stations Using Geostatistical Analysis in Selangor Malaysia. IRJMETS 2022, 4, 375–383. [Google Scholar] [CrossRef]
- Shahabi, H.; Allahvirdiasl, H.; Ali Zadeh, M. Application of GIS Models in Site Selection of Waste Disposal in Urban Area. IOSR J Appl Phys 2012, 1, 1–7. [Google Scholar] [CrossRef]
- Eastman, J.R. Multi-Criteria Evaluation and GIS. In Geographical Information Systems: Principles, Techniques, Management and Applications; Wiley, 2005: University of Minnesota, 1999. [Google Scholar]
- Malczewski, J. GIS-based Multicriteria Decision Analysis: A Survey of the Literature. Int. J. Geogr. Inf. Sci. 2006, 20, 703–726. [Google Scholar] [CrossRef]
- Qasimi, A.B.; Toomanian, A.; Nasri, F.; Samany, N.N. Genetic Algorithms-Based Optimal Site Selection of Solar PV in the North of Afghanistan. International Journal of Sustainable Energy 2023, 42, 929–953. [Google Scholar] [CrossRef]
- Mohamed, N.A.; Asfaha, Y.G.; Wachemo, A.C. Integration of Multicriteria Decision Analysis and GIS for Evaluating the Site Suitability for the Landfill in Hargeisa City and Its Environs, Somaliland. Sustainability 2023, 15, 8192. [Google Scholar] [CrossRef]
- Nairobi City County Integrated Development Plan for 2023-2027 – Nairobi City County Assembly 2023.
- World Bank. Kenya Urbanization Review 2016.
- Energy & Petroleum Statistics Report for FY Ended June 30 2024 | Energy and Petroleum Regulatory Authority Available online:. Available online: https://www.epra.go.ke/energy-petroleum-statistics-report-fy-ended-june-30-2024 (accessed on 1 March 2025).
- Ren, H.; Guo, W.; Zhang, Z.; Kisovi, L.M.; Das, P. Population Density and Spatial Patterns of Informal Settlements in Nairobi, Kenya. Sustainability 2020, 12, 7717. [Google Scholar] [CrossRef]
- Hellen, N.M.; Willy, E.M.; James, N.C.; Peter, K.; Dennis, N., Makau; Maurine, C.C.; Gabriel, O.A.; John, B.K. Prevalence, Risk Factors, and Molecular Identity of Giardia Infections in Dogs in Nairobi County, Kenya. J. Vet. Med. Anim. Health 2023, 15, 21–34. [Google Scholar] [CrossRef]
- Afritekt. Land and Water – Resolving the Tensions of Climate Change and Urbanisation in Nairobi’s Largest Slum. Available online: https://afritekt.wordpress.com/2016/01/11/land-and-water-resolving-the-tensions-of-climate-change-and-urbanisation-in-nairobis-largest-slum/ (accessed on 26 June 2025).
- Geofabrik Download. Available online: https://download.geofabrik.de/africa/kenya.html (accessed on 27 May 2025).
- UNESCO Regional Office for Eastern Africa - Kenya Wells OSM. Available online: https://ihp-wins.unesco.org/dataset/kenya-wells-osm (accessed on 26 June 2025).
- Kenya GIS Data | Land Portal. Available online: https://landportal.org/library/resources/kenya-gis-data (accessed on 25 June 2025).
- RCMRD on Africa Geoportal. Available online: https://rcmrd.africageoportal.com/search?collection=dataset (accessed on 30 June 2025).
- Dataset - ENERGYDATA. INFO. Available online: https://energydata.info/dataset/ (accessed on 17 June 2025).
- Japan Aerospace Exploration Agency (JAXA). ALOS PALSAR Radiometric Terrain Corrected (RTC) DEM Available online:. Available online: https://search.asf.alaska.edu/#/ (accessed on 11 July 2025).
- Kenya SRTM 30meters Available online:. Available online: https://geoportal.rcmrd.org/catalogue/#/dataset/484 (accessed on 26 June 2025).
- Guth, A. Maps of the Southern Kenya Rift Available online:. Available online: https://www.geosociety.org/maps/2014-DMCH016/ (accessed on 6 June 2025).
- Leenaars, J.; Hengl, T. Africa SoilGrids - Texture Available online:. Available online: https://data.isric.org (accessed on 7 June 2025).
- Hengl, T.; Heuvelink, G.B.M.; Kempen, B.; Leenaars, J.G.B.; Walsh, M.G.; Shepherd, K.D.; Sila, A.; MacMillan, R.A.; Mendes De Jesus, J.; Tamene, L.; et al. Mapping Soil Properties of Africa at 250 m Resolution: Random Forests Significantly Improve Current Predictions. PLoS ONE 2015, 10, e0125814. [Google Scholar] [CrossRef]
- KS EAS 924-3:2020; Handling, Storage and Distribution of Liquefied Petroleum Gas (LPG) in Domestic, Commercial and Industrial Installations - Code of Practice - Part 3: Liquefied Petroleum Gas Installations Involving Storage Vessels of Individual Water Capacity Exceeding 9000L; KS EAS 924-3:2020; Nairobi, 2020.
- Nairobi, Kenya Land Use 2010 | Data Catalog. Available online: https://datacatalog.worldbank.org/search/dataset/0041743/nairobi-kenya-land-use-2010 (accessed on 26 June 2025).
- Nairobi City County(NCC). The Project on Integrated Urban Development Master Plan for the City of Nairobi in the Republic of Kenya 2014.
- Ministry of Lands, Public Works, Housing and Urban Development, State Department for Land and Physical Planning. Physical and Land Use Planning Handbook 2025.
- Exclude Restricted Locations—ArcGIS Pro | Documentation. Available online: https://pro.arcgis.com/en/pro-app/latest/help/analysis/spatial-analyst/suitability-modeler/exclude-restricted-locations.htm (accessed on 25 September 2025).
- Bhowmick, P.; Mukhopadhyay, S.; Sivakumar, V. A Review on GIS Based Fuzzy and Boolean Logic Modelling Approach to Identify the Suitable Sites for Artificial Recharge of Groundwater. Sch. J. Eng. Tech. 2014, 2, 316–319. [Google Scholar]
- Cochran, W.G. Sampling Techniques; John Wiley & Sons: New York, 1977. [Google Scholar]
- Aslani, M.; Alesheikh, A.A. Site Selection for Small Gas Stations Using GIS. Sci. Res. Essays 2011, 6, 1361–3171. [Google Scholar]
- Hossain, K.T. Suitable Site for a Fire Station: Weighted Overlay Available online:. Available online: https://storymaps.arcgis.com/stories/8e4a036a1d8f427a8869ba53390ec0e2 (accessed on 9 October 2025).
Figure 1.
Study area map showing Nairobi sub-county boundaries and the neighboring counties of Kiambu, Kajiado and Machakos. The area is divided into Northern, Eastern, Southern and Western regions, delineated by major roads (red). Source: Adapted from Hellen et al. [21], based on boundaries from the Independent Electoral and Boundaries Commission, Kenya.
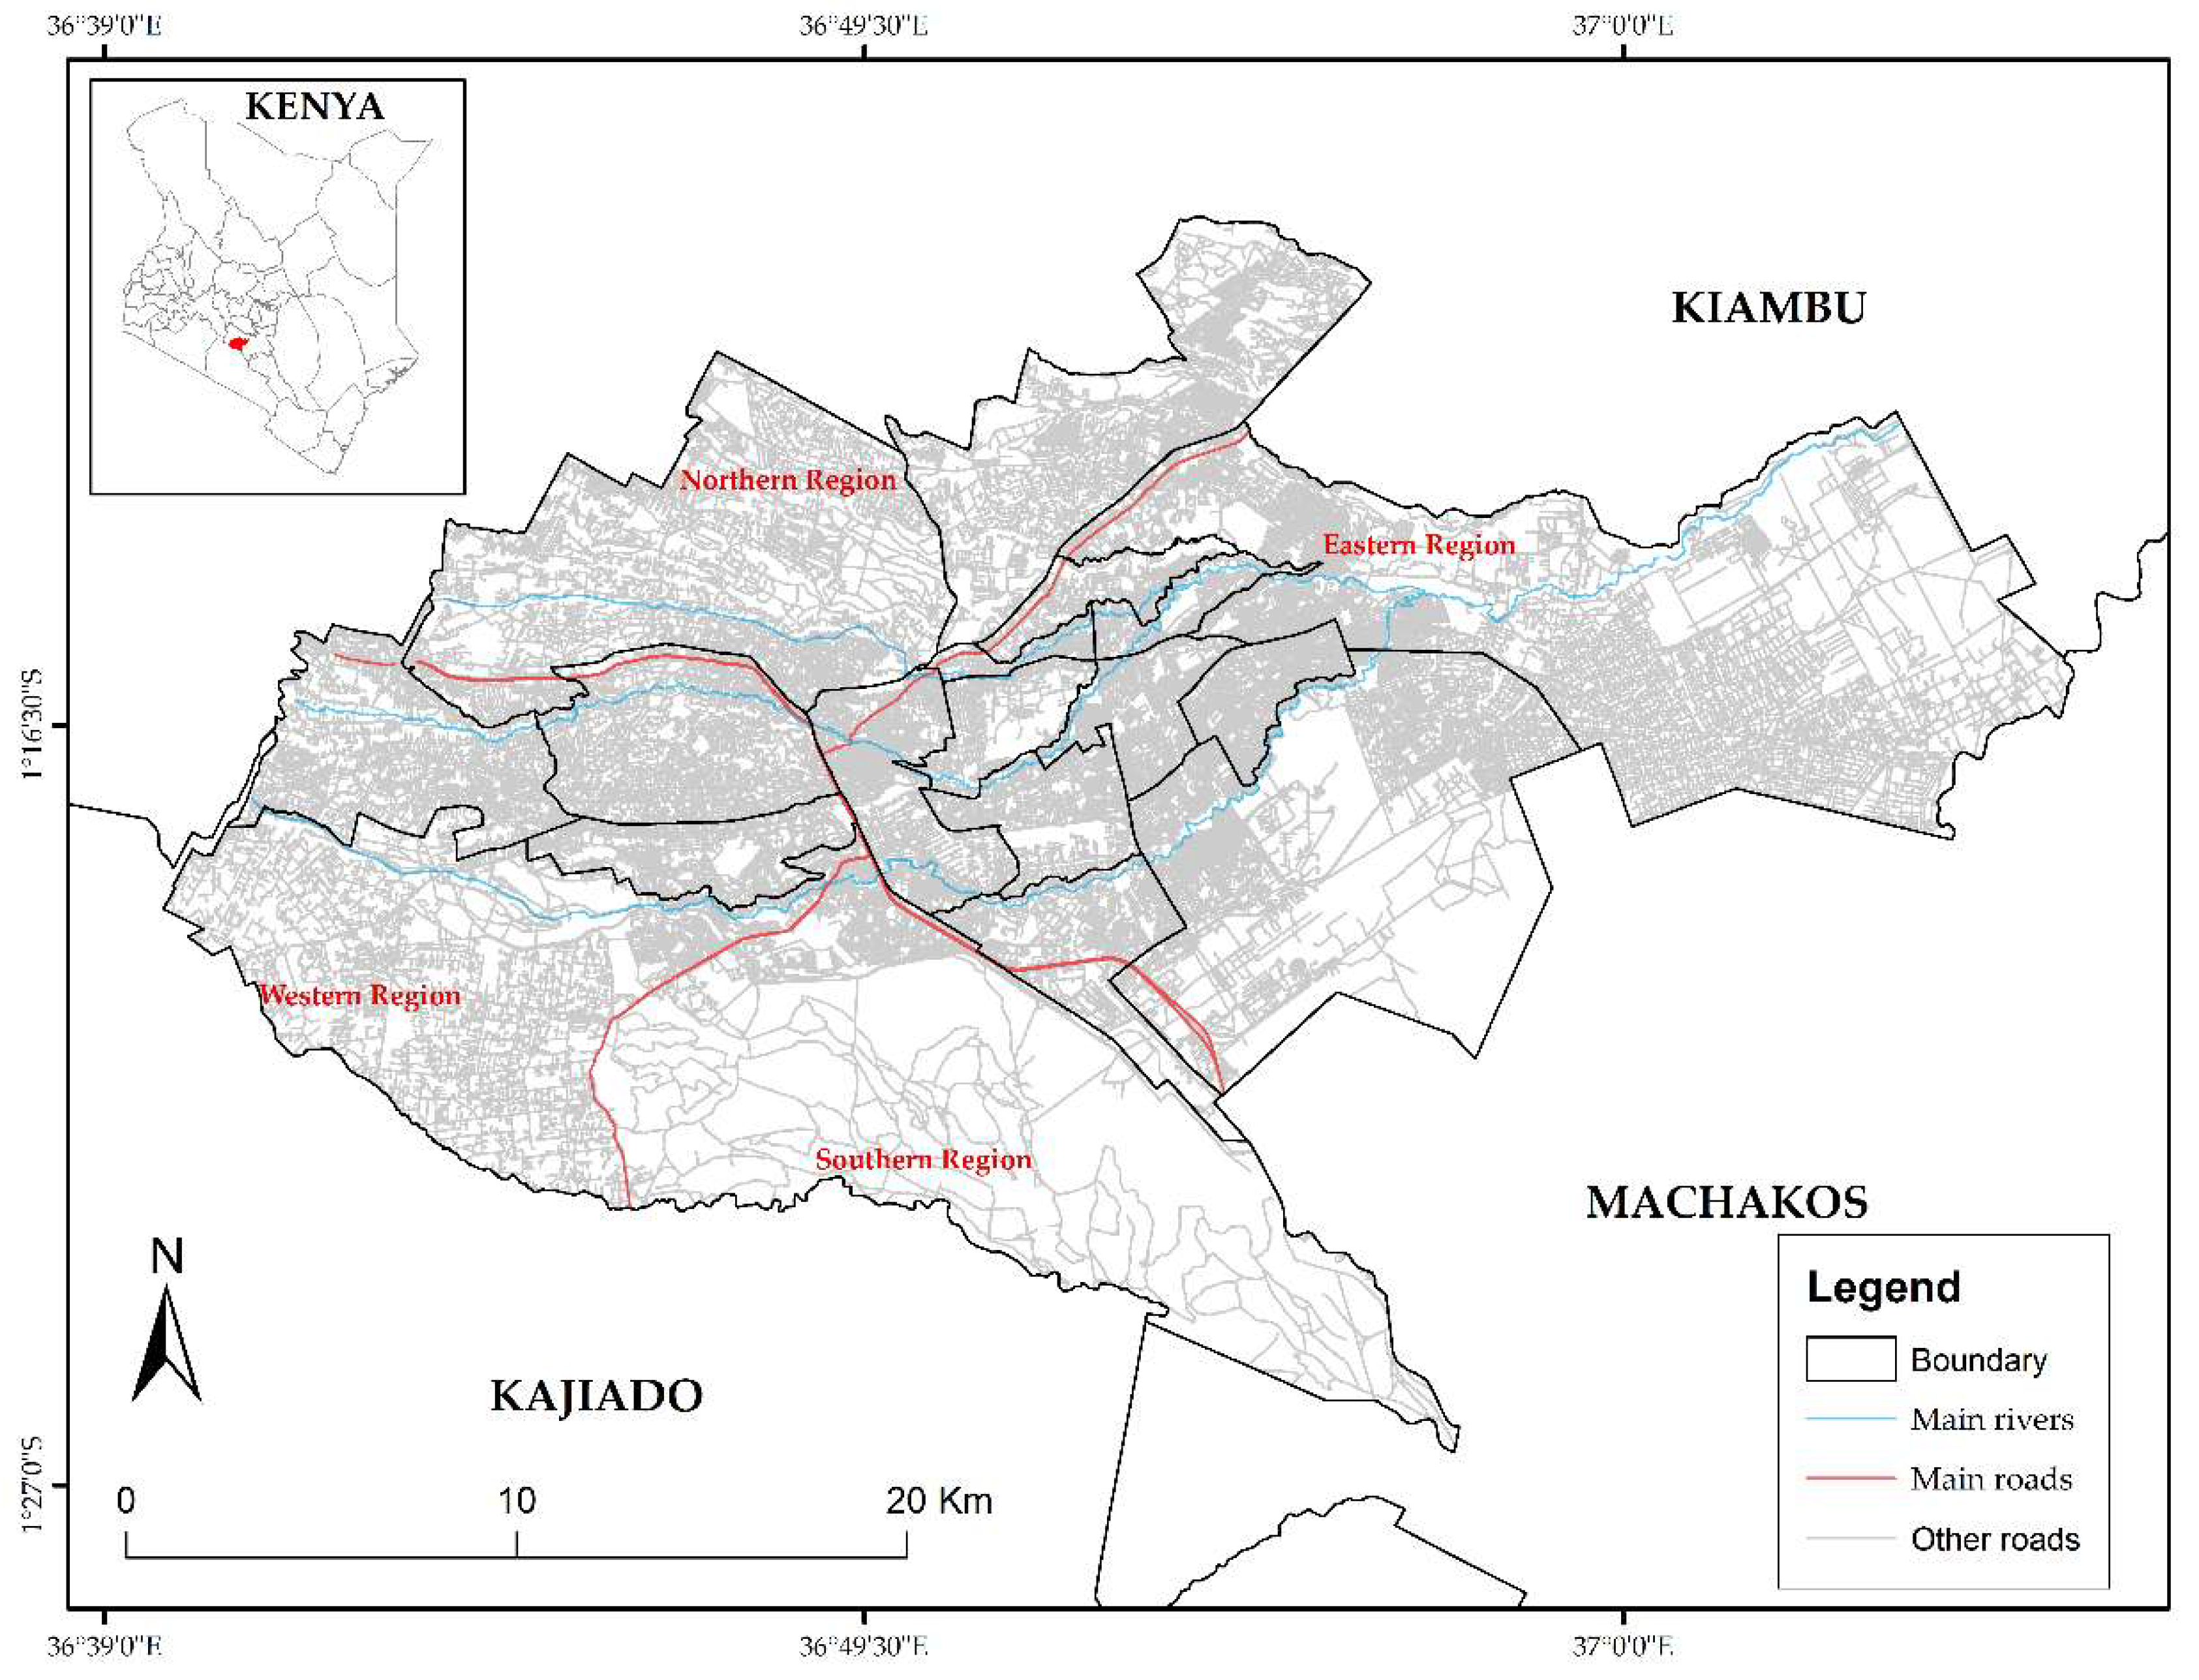
Figure 2.
Study area neighborhoods.
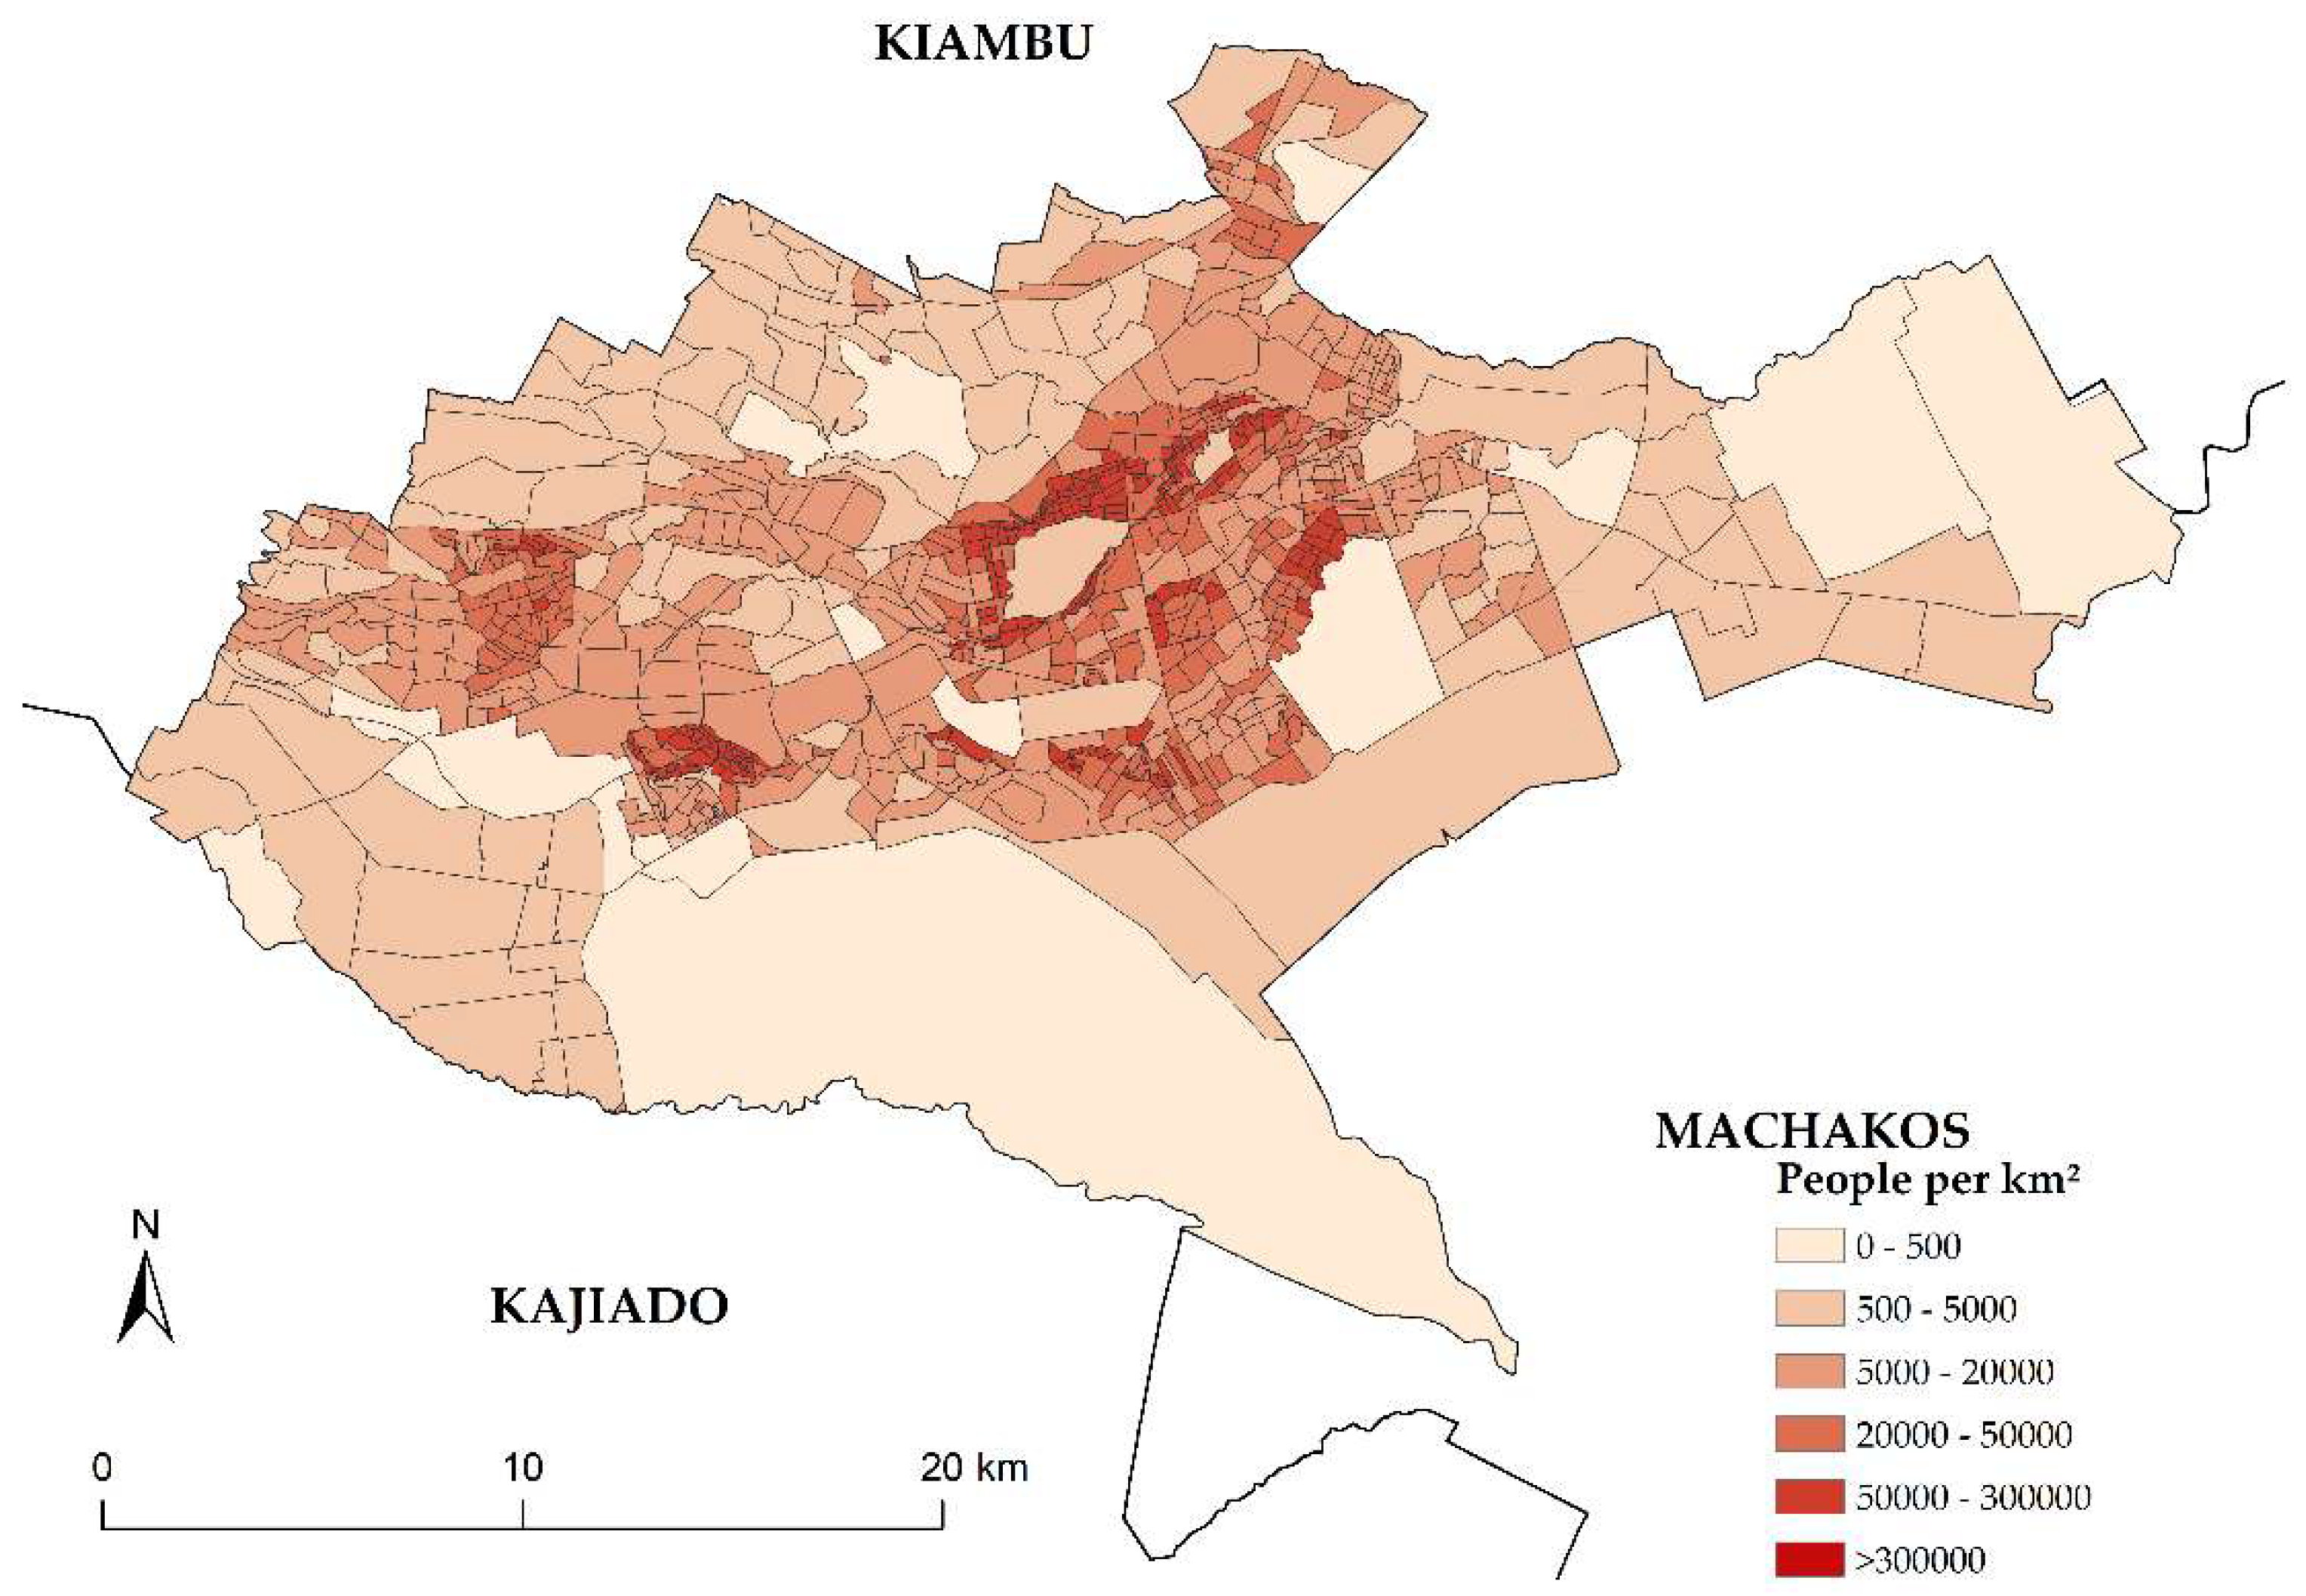
Figure 3.
Elevation (a), slope (b), geology(c) and soil(d) thematic layers used in the site-suitability analysis.
Figure 3.
Elevation (a), slope (b), geology(c) and soil(d) thematic layers used in the site-suitability analysis.
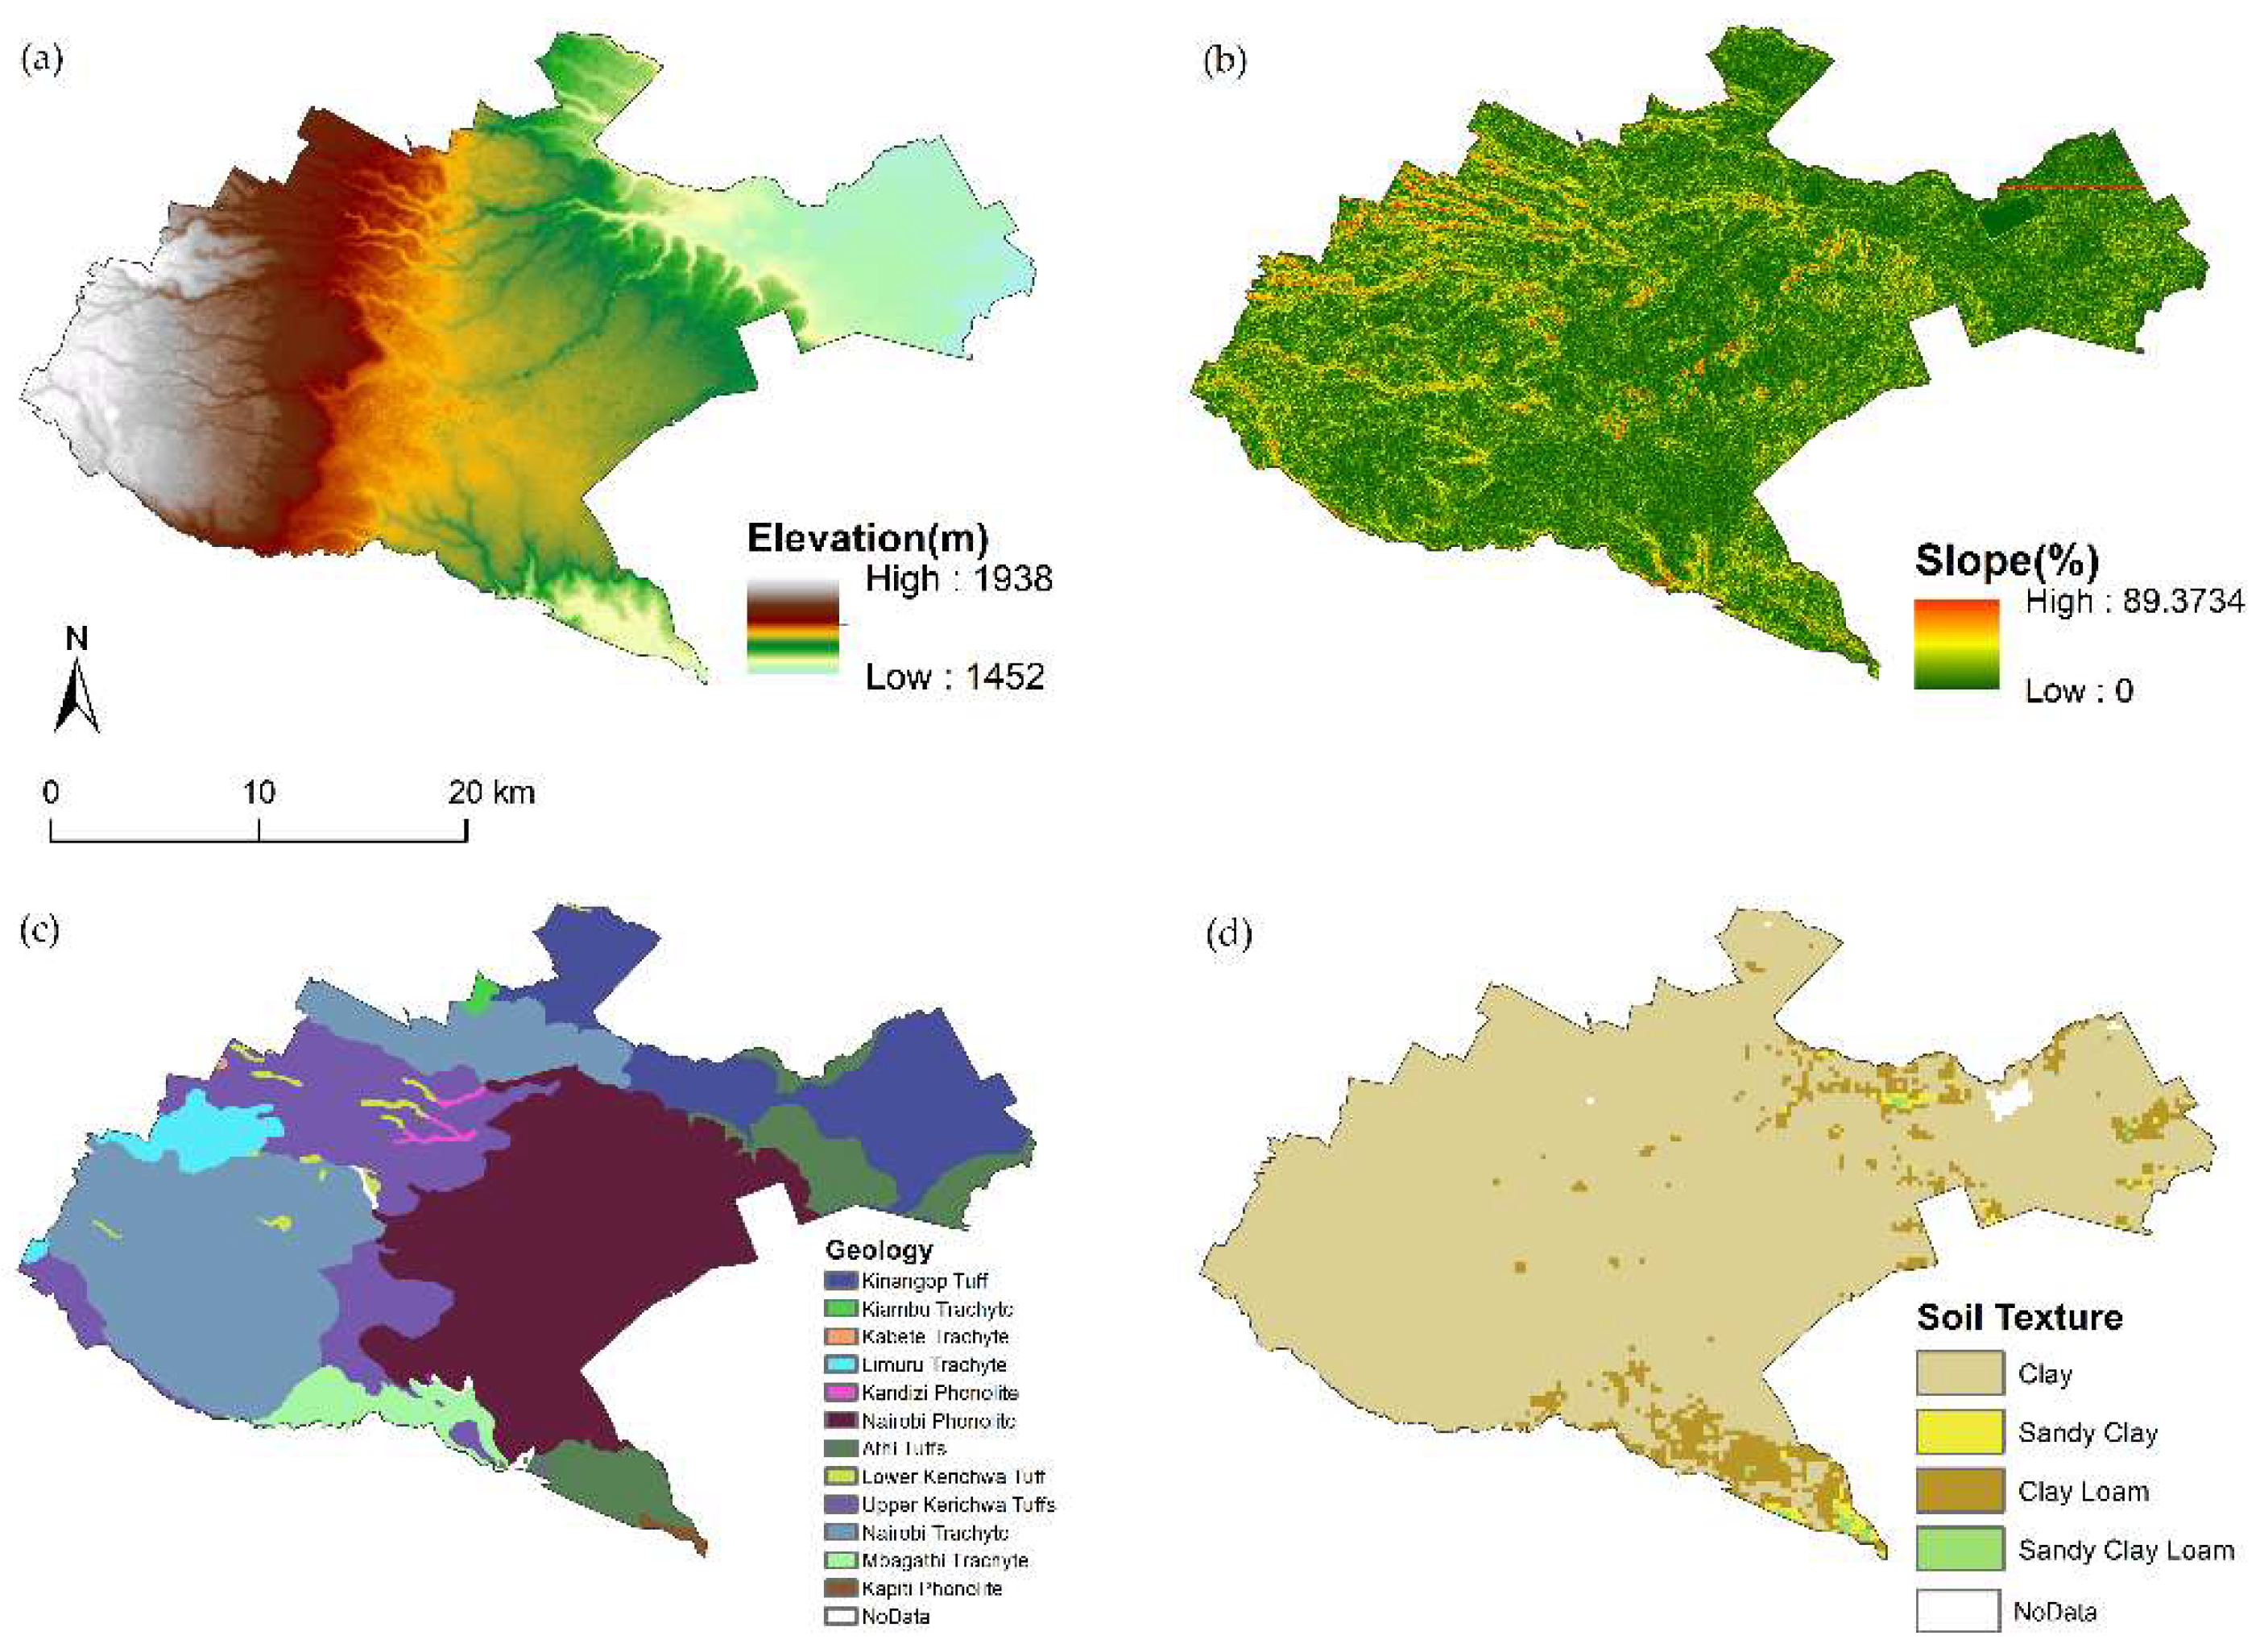
Figure 4.
Study methodology workflow. Light orange boxes represent datasets, while white boxes represent processing steps.
Figure 4.
Study methodology workflow. Light orange boxes represent datasets, while white boxes represent processing steps.
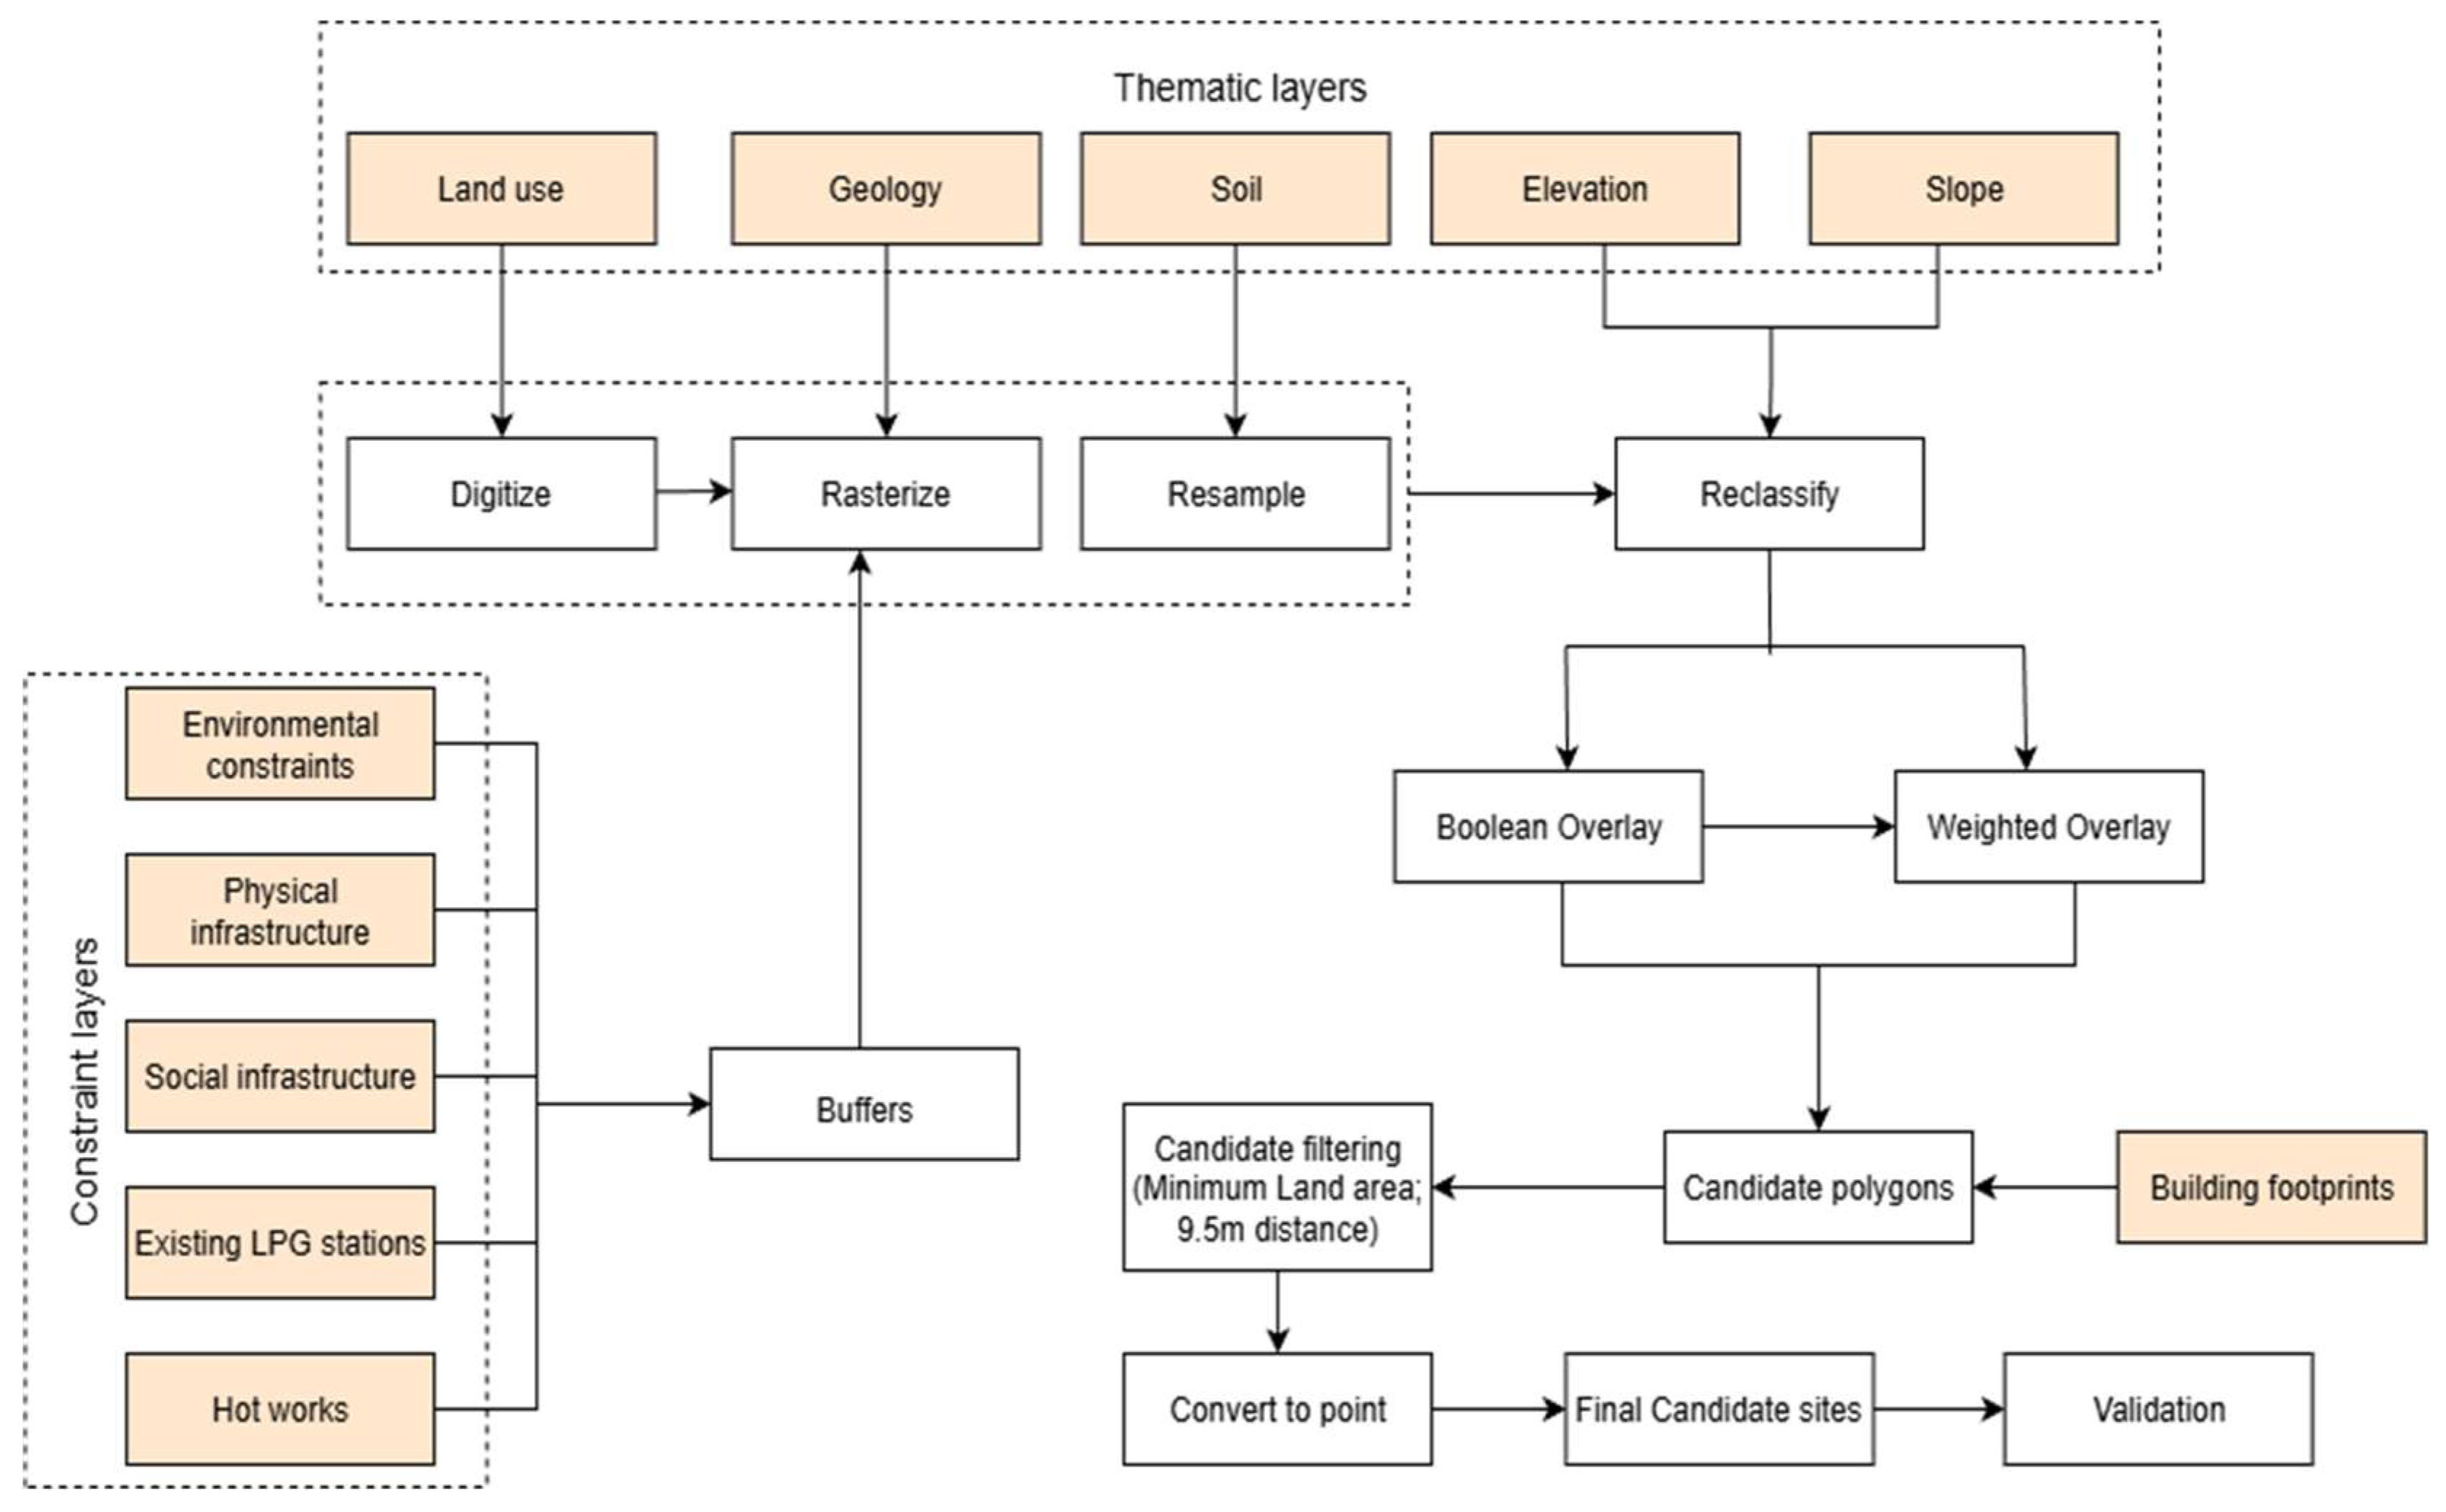
Figure 5.
Land use map of Nairobi County, updated to reflect 2012 land-use changes from the 2010 dataset. Mixed RC = Mixed Residential/Commercial, Agr/Open Space = Agricultural/Open space, Mixed CI = Mixed Commercial/Industrial.
Figure 5.
Land use map of Nairobi County, updated to reflect 2012 land-use changes from the 2010 dataset. Mixed RC = Mixed Residential/Commercial, Agr/Open Space = Agricultural/Open space, Mixed CI = Mixed Commercial/Industrial.
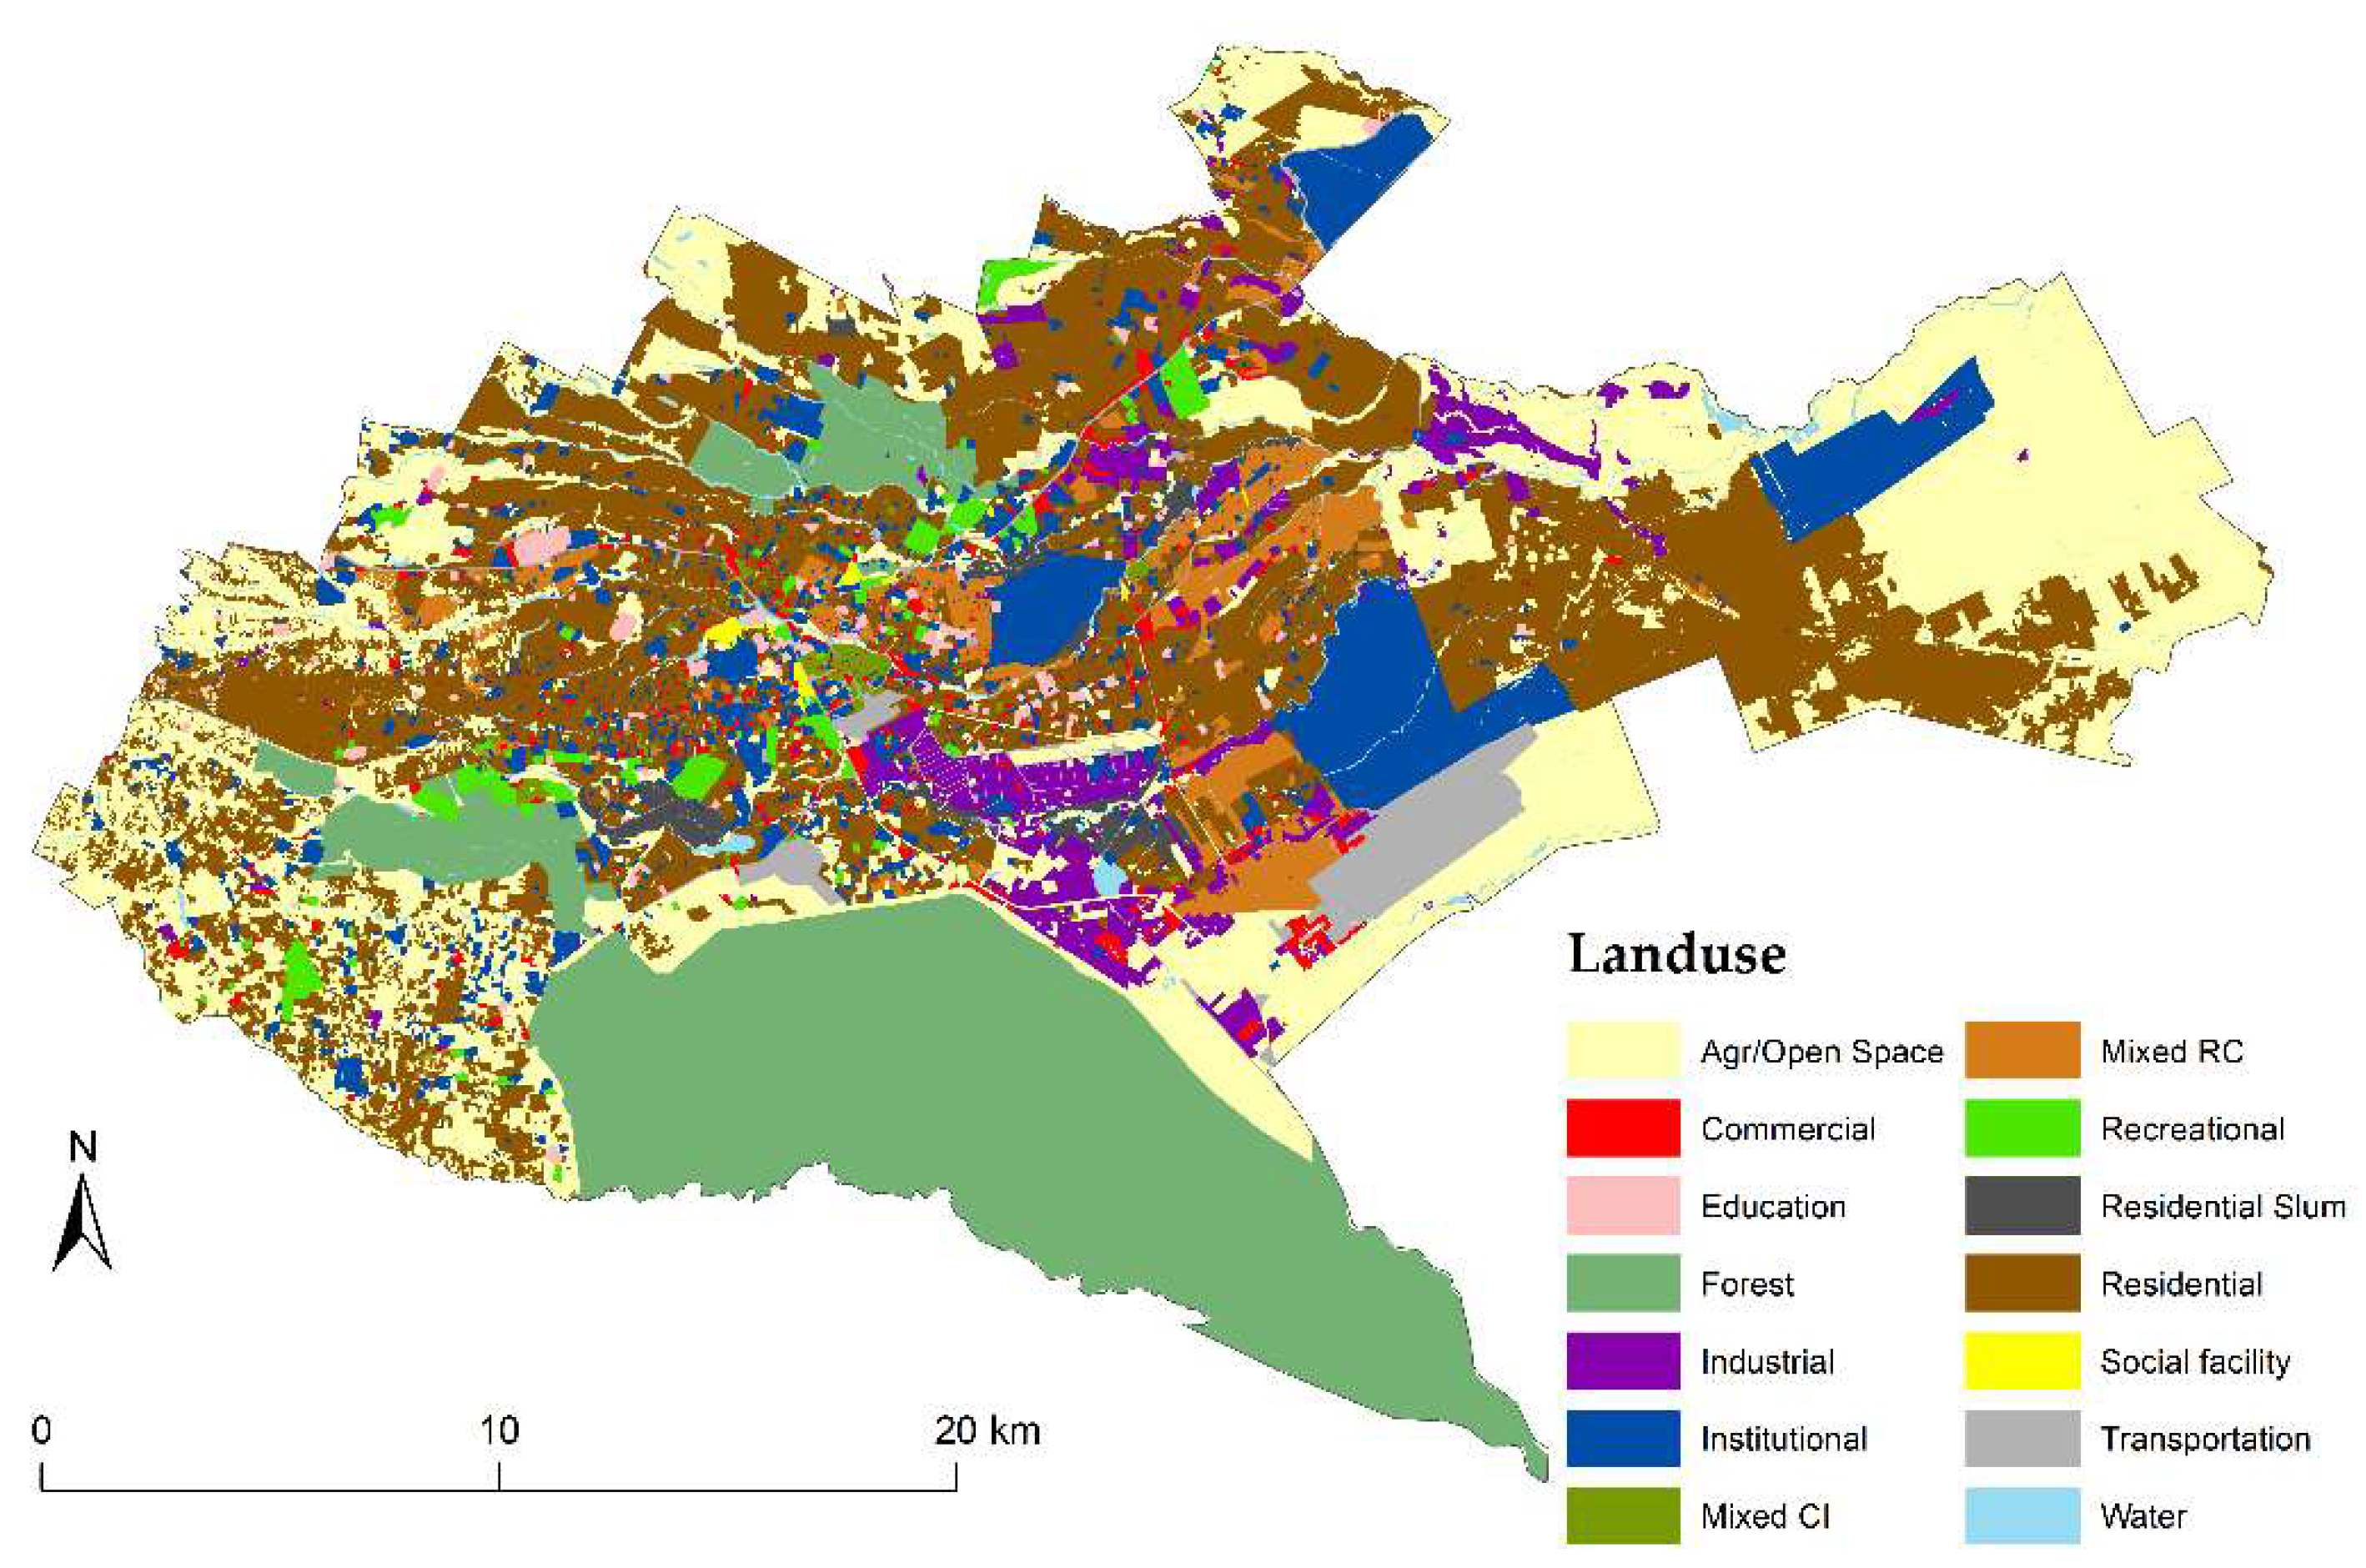
Figure 6.
Example reclassification outputs of the thematic layers. (a–c) Boolean reclassification of land use, geology and soil layers into binary suitability classes. (d–f) Weighted reclassification of the same layers into five suitability classes (1–5).
Figure 6.
Example reclassification outputs of the thematic layers. (a–c) Boolean reclassification of land use, geology and soil layers into binary suitability classes. (d–f) Weighted reclassification of the same layers into five suitability classes (1–5).
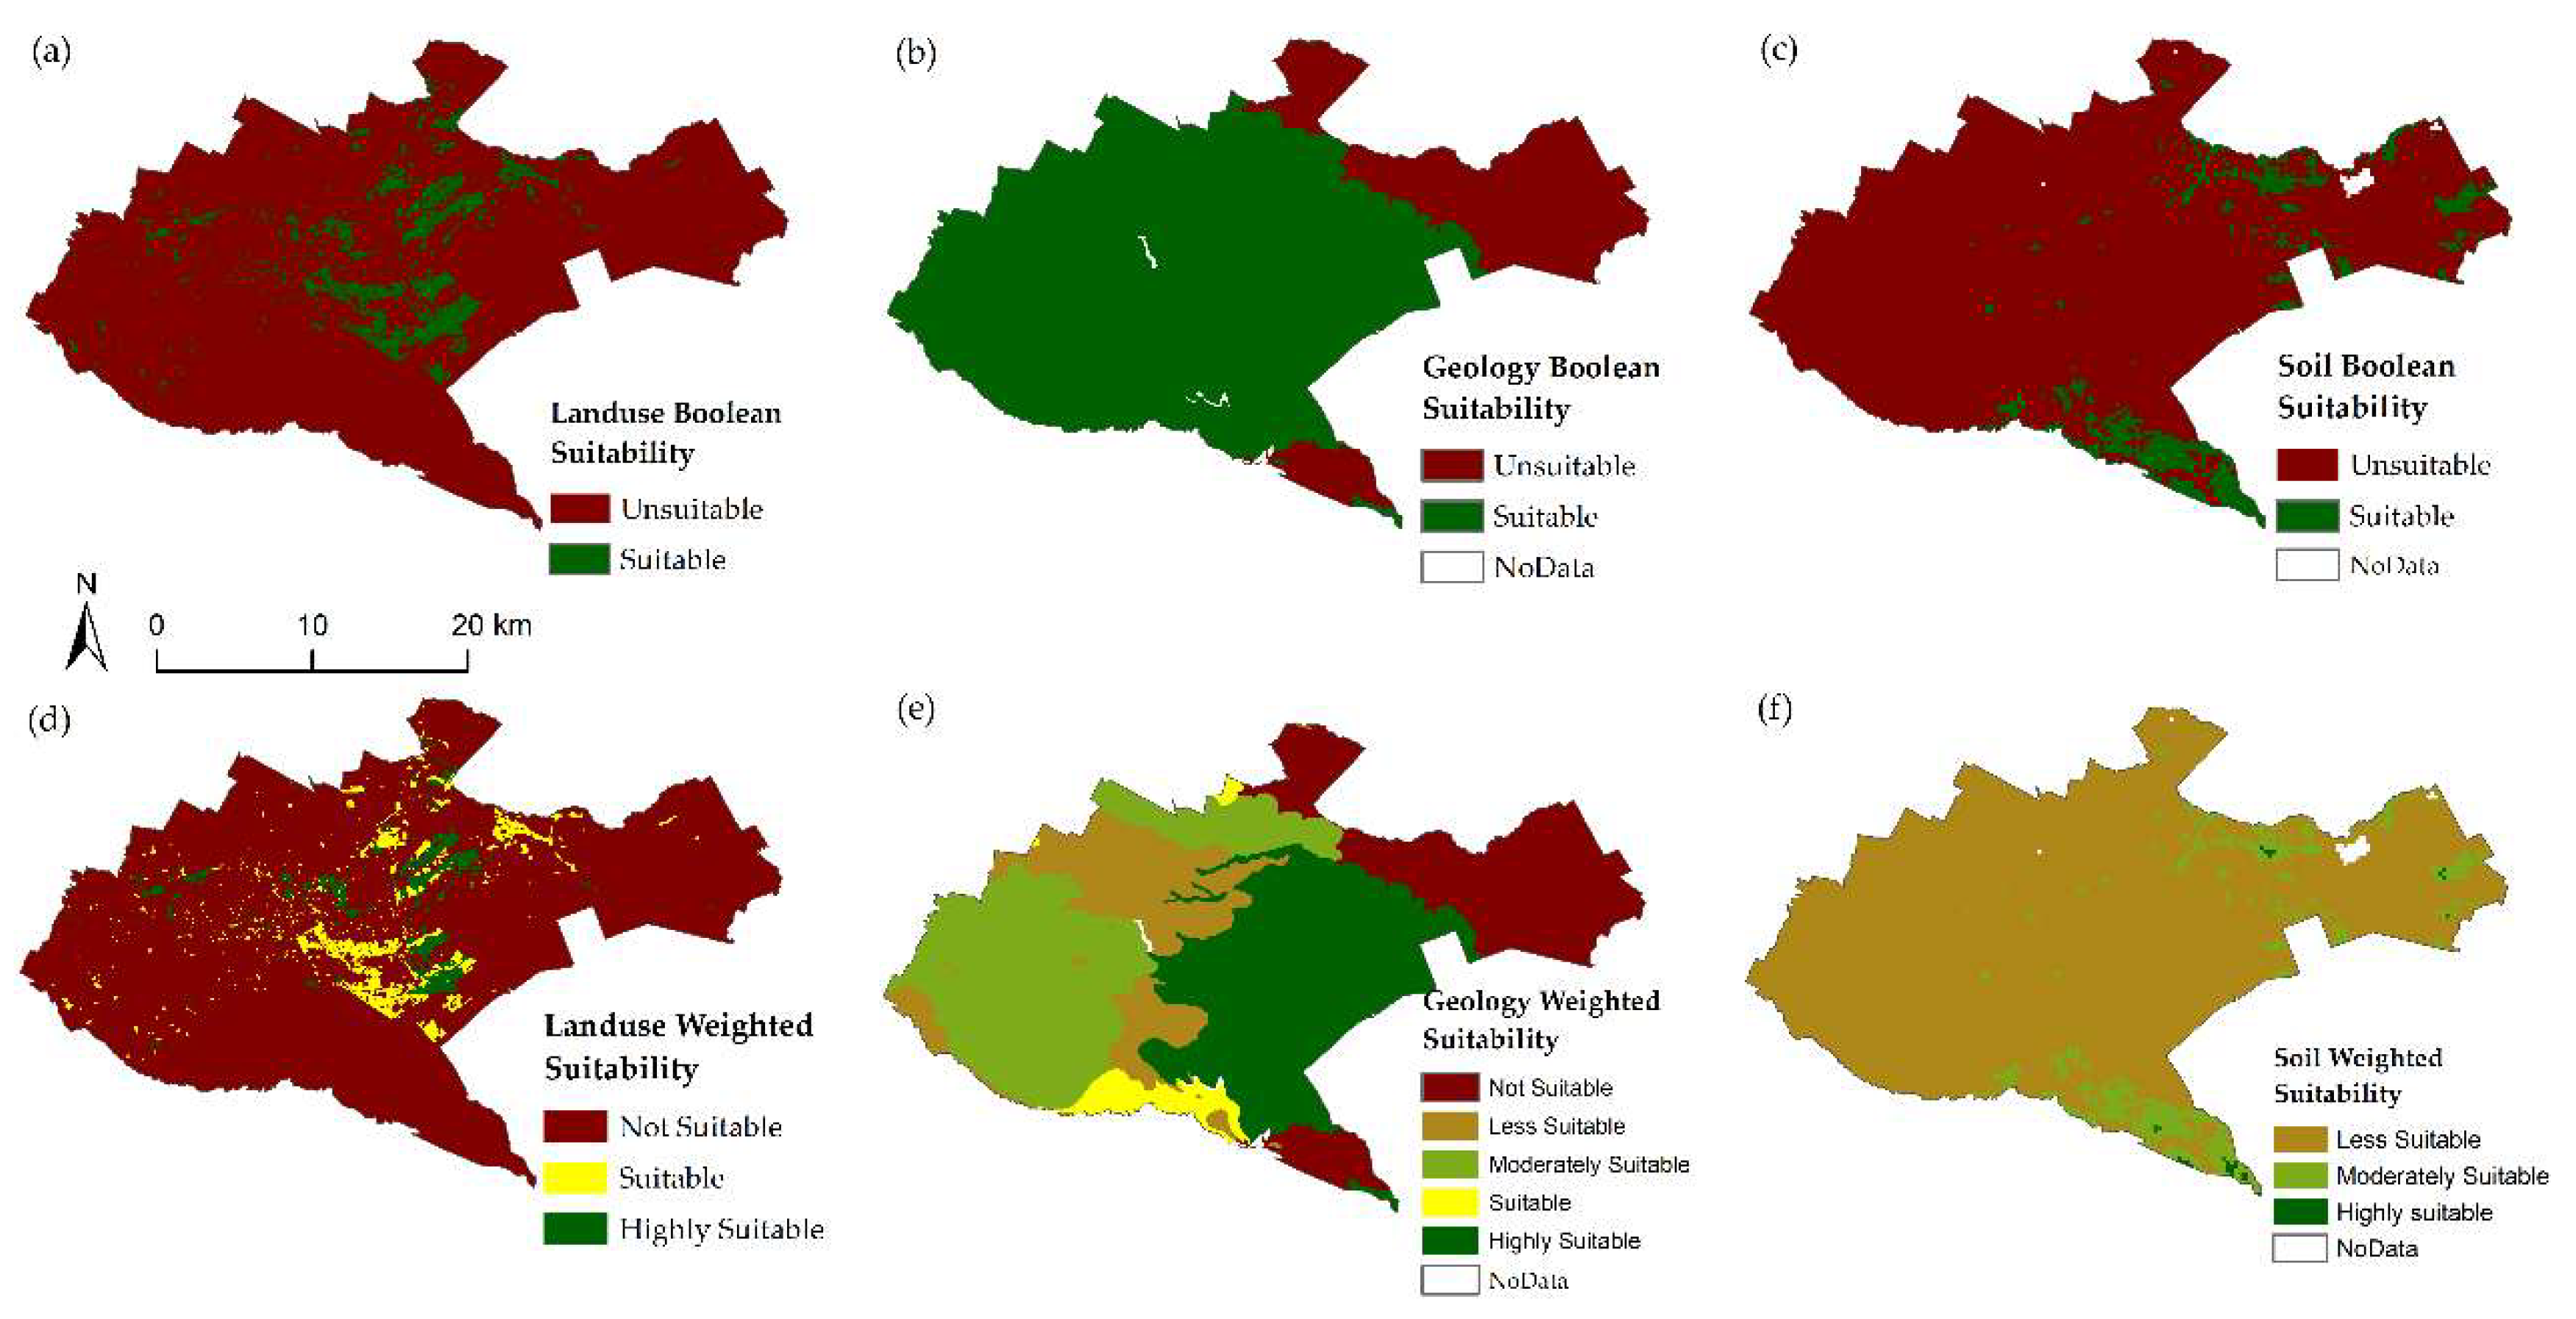
Figure 7.
Effect of the soil layer on Boolean suitability analysis. (a) Initial candidate sites (n = 12), (b) Candidate sites after applying filtering criteria (n = 2).
Figure 7.
Effect of the soil layer on Boolean suitability analysis. (a) Initial candidate sites (n = 12), (b) Candidate sites after applying filtering criteria (n = 2).
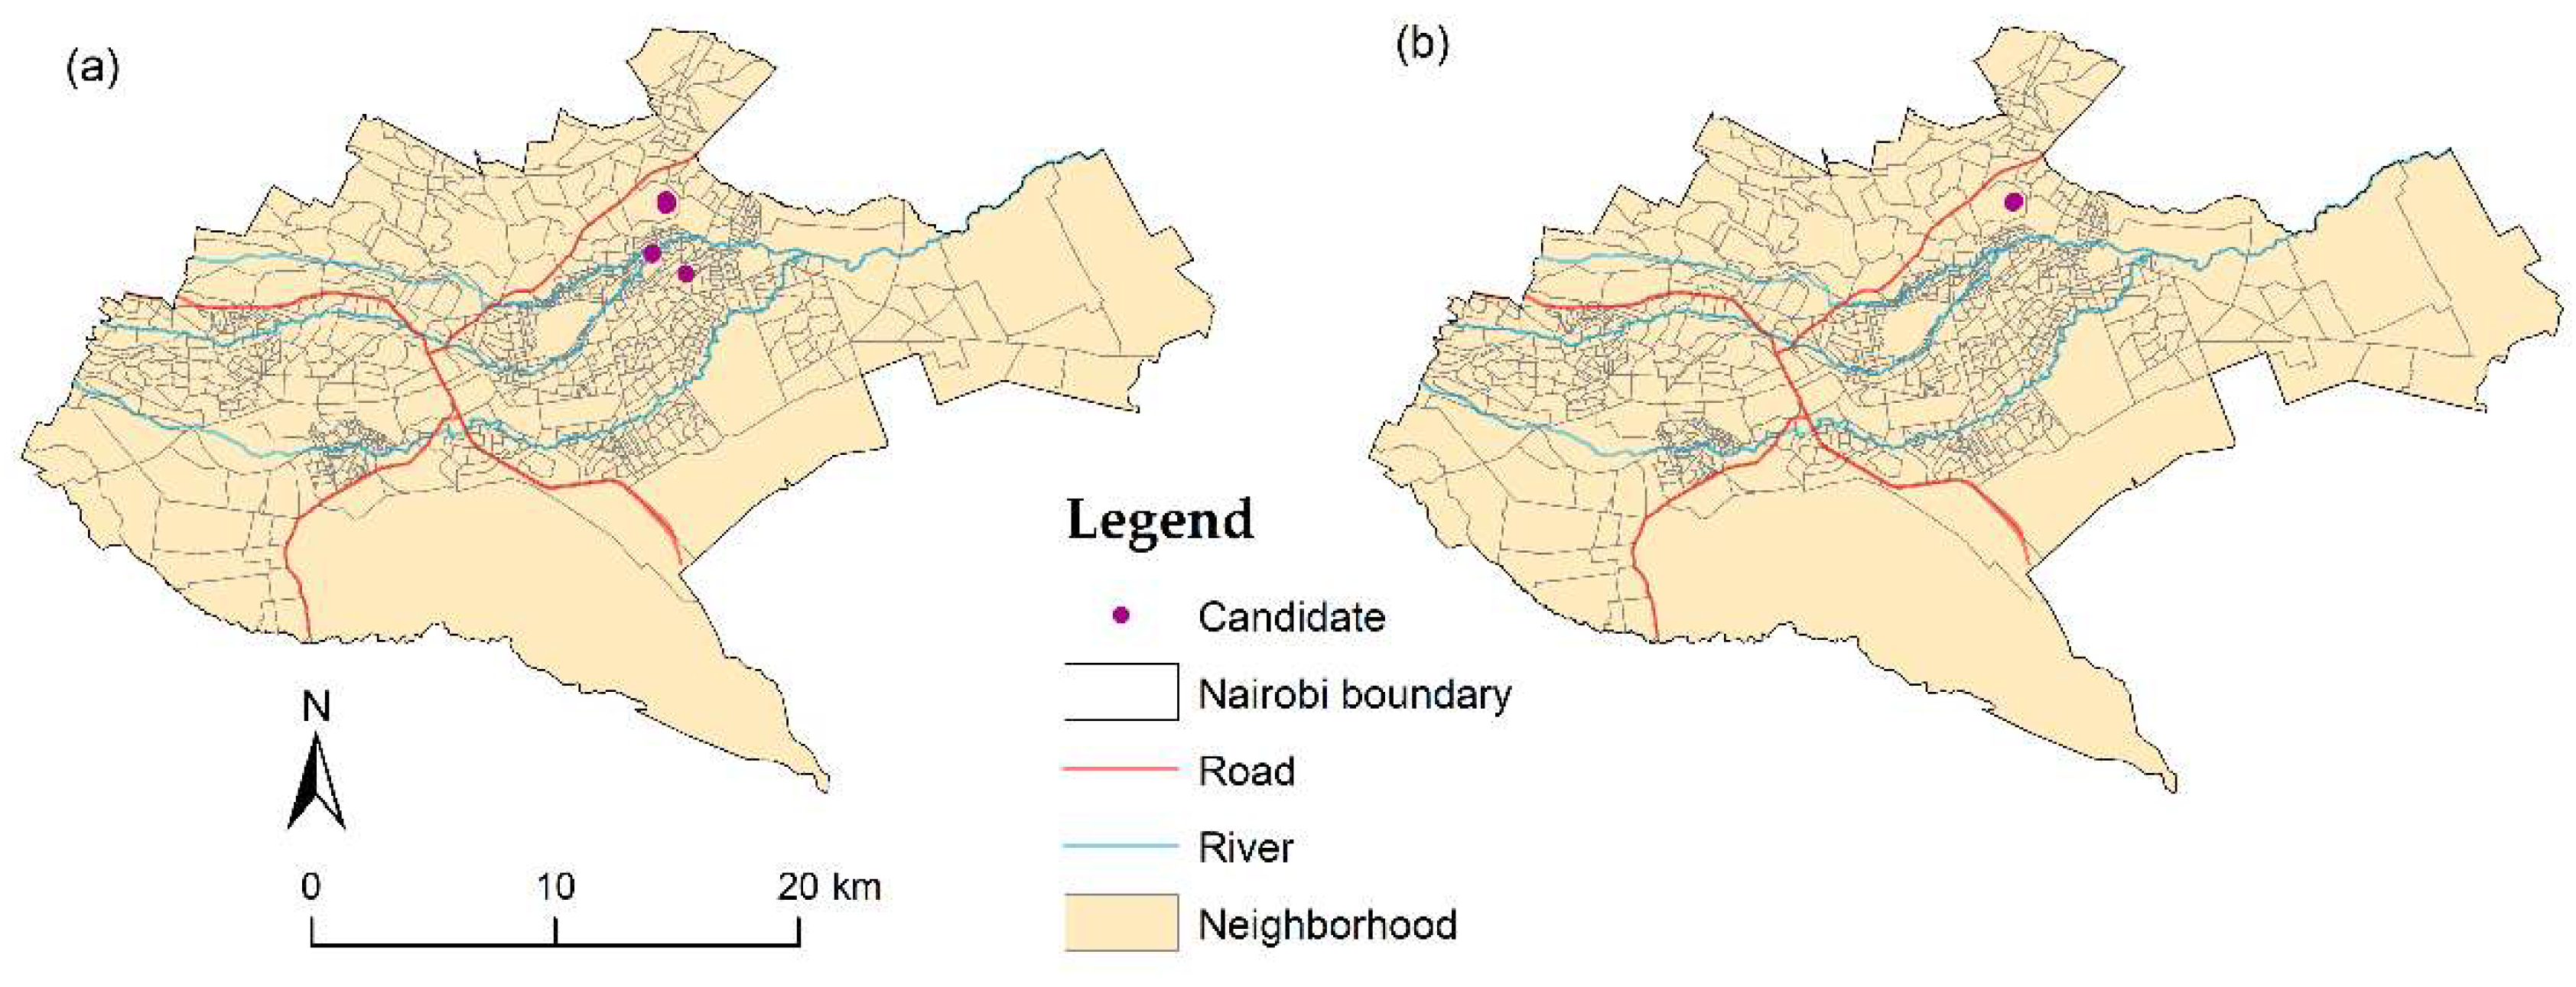
Figure 8.
Boolean overlay candidate sites. (a) shows the initial candidate polygons (n = 525), (b) shows the filtered polygons (n = 33), while (c) and (d) show the corresponding point representations of the initial and filtered candidate sites respectively.
Figure 8.
Boolean overlay candidate sites. (a) shows the initial candidate polygons (n = 525), (b) shows the filtered polygons (n = 33), while (c) and (d) show the corresponding point representations of the initial and filtered candidate sites respectively.
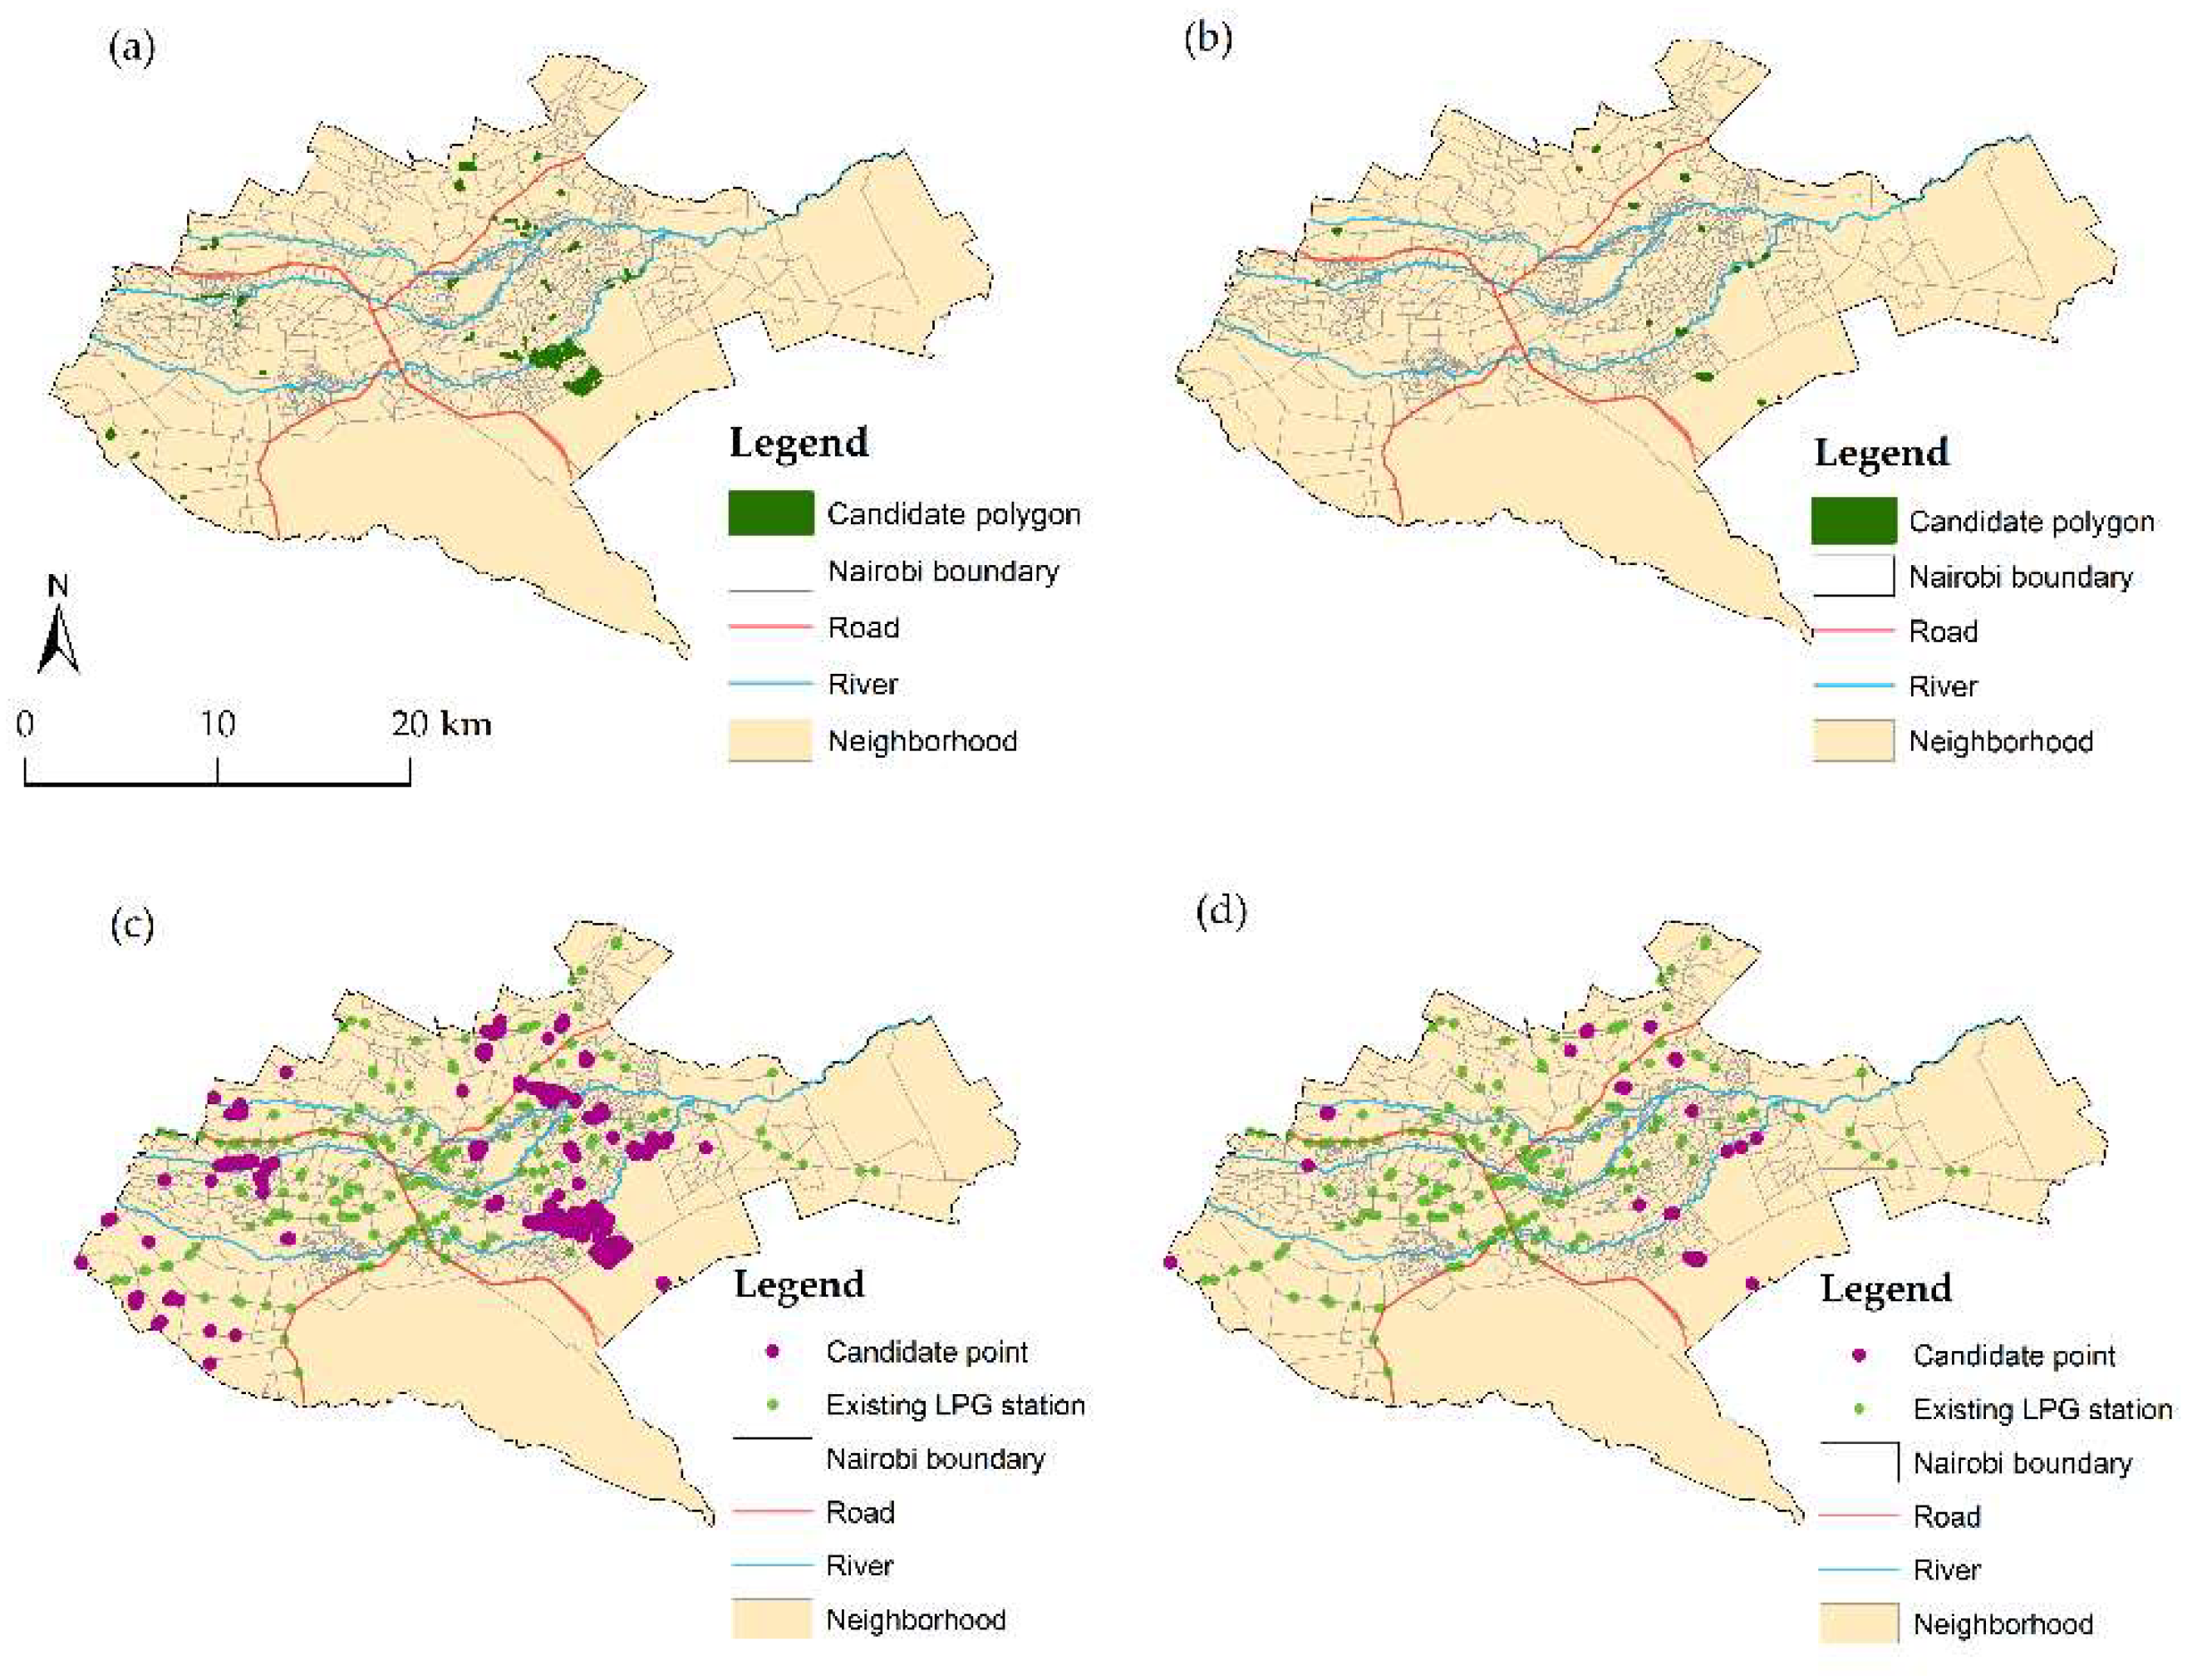
Figure 9.
Regional distribution of LPG candidate sites in Nairobi: (a) Boolean overlay (b) Weighted overlay with exclusion mask applied.
Figure 9.
Regional distribution of LPG candidate sites in Nairobi: (a) Boolean overlay (b) Weighted overlay with exclusion mask applied.
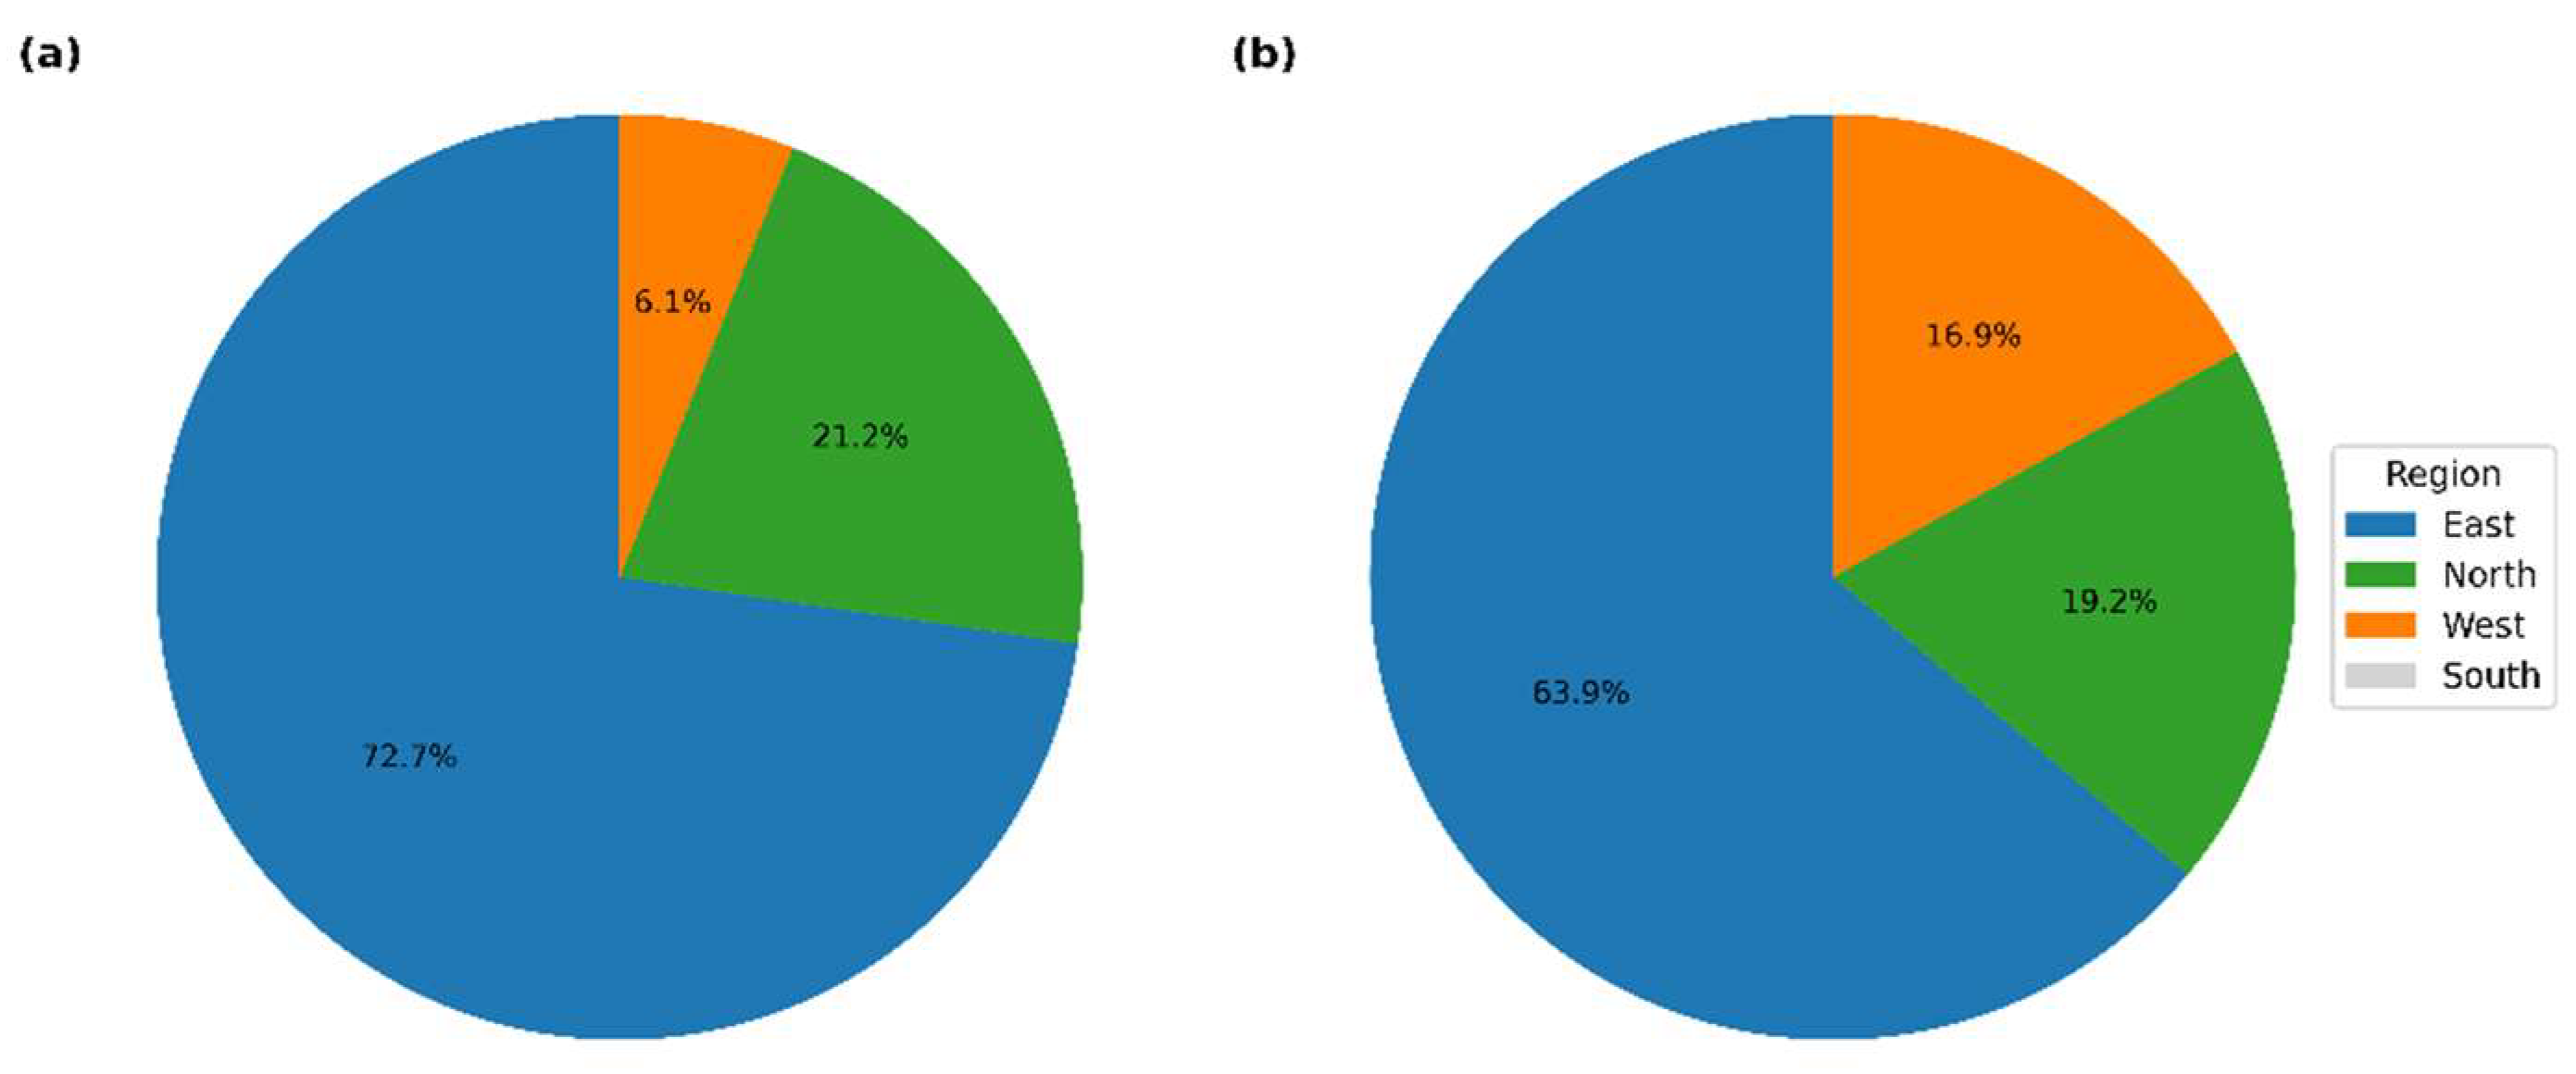
Figure 10.
Weighted suitability and exclusion map for Nairobi: (a) Weighted overlay surface showing suitability classes, (b) Boolean exclusion mask highlighting areas restricted by regulatory and physical constraints, (c) Combined weighted suitability and exclusion map.
Figure 10.
Weighted suitability and exclusion map for Nairobi: (a) Weighted overlay surface showing suitability classes, (b) Boolean exclusion mask highlighting areas restricted by regulatory and physical constraints, (c) Combined weighted suitability and exclusion map.
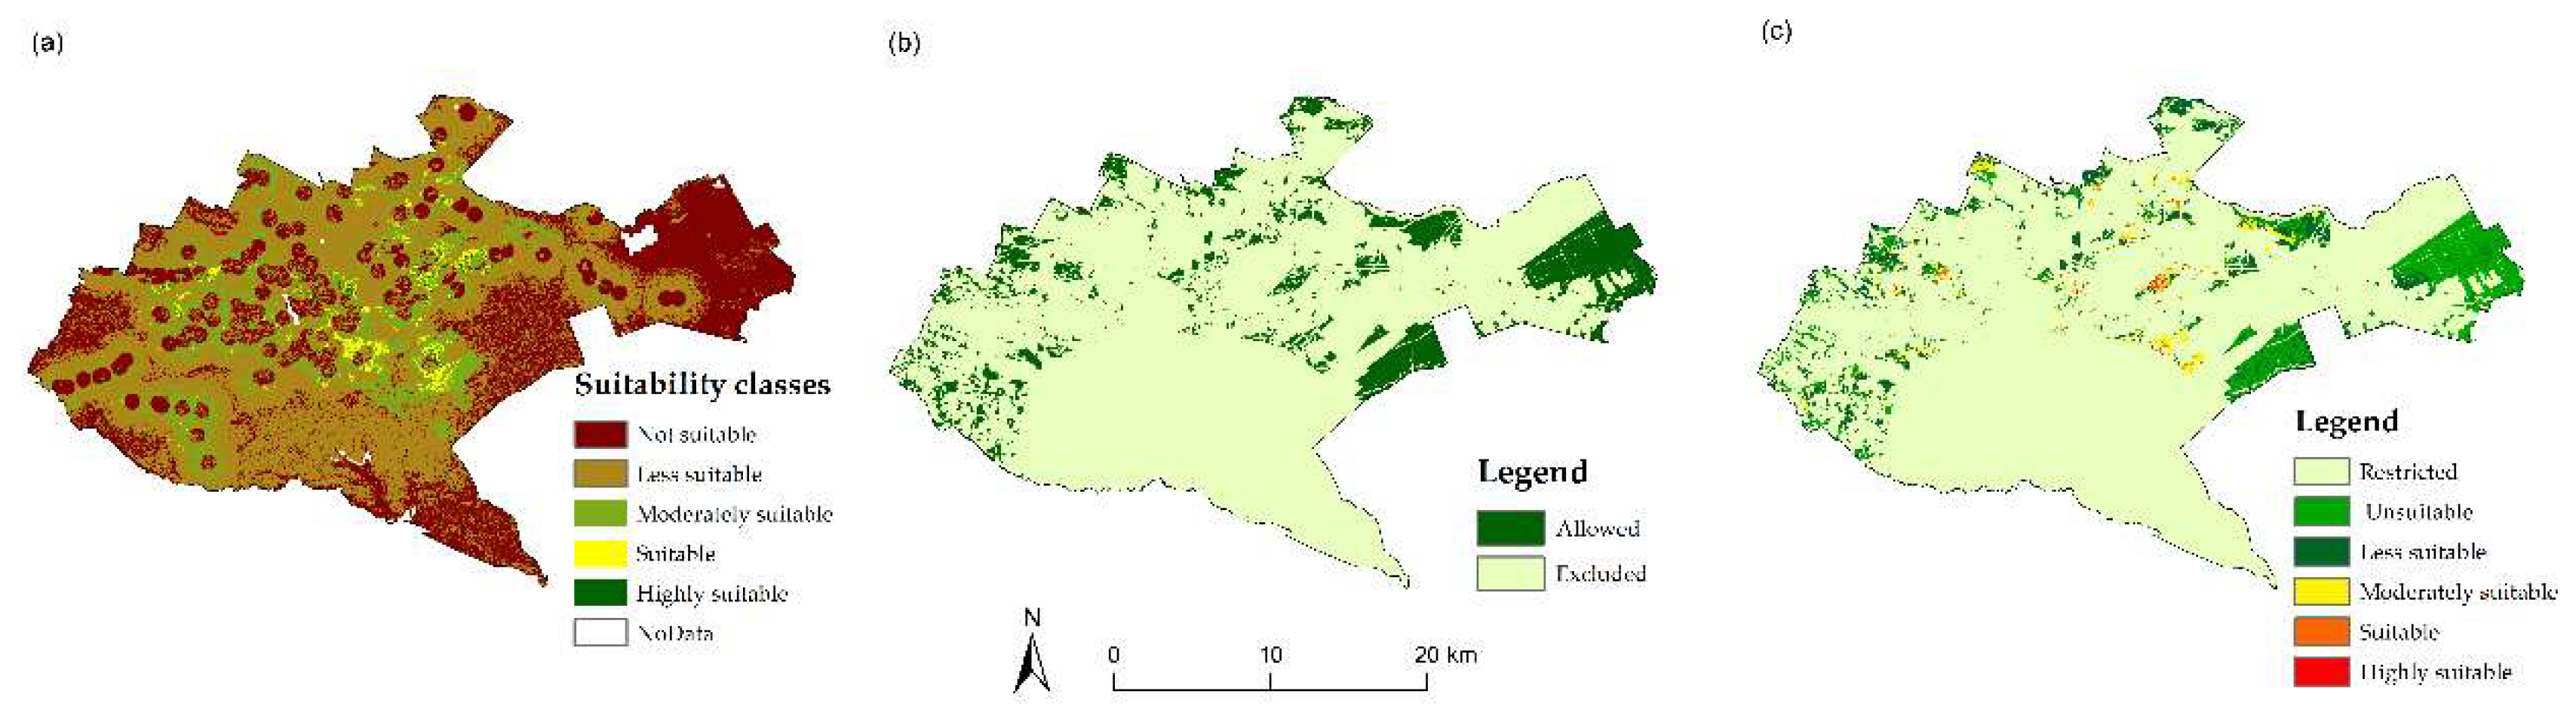
Figure 11.
Weighted Overlay analysis Candidate sites. (a) Initial candidate polygons across Classes 2–5 (n = 16,505), (b) Feasible candidate polygons after applying the minimum area threshold and 9.5 m safety buffer (n = 2,439), (c) Points generated from the filtered candidate polygons.
Figure 11.
Weighted Overlay analysis Candidate sites. (a) Initial candidate polygons across Classes 2–5 (n = 16,505), (b) Feasible candidate polygons after applying the minimum area threshold and 9.5 m safety buffer (n = 2,439), (c) Points generated from the filtered candidate polygons.
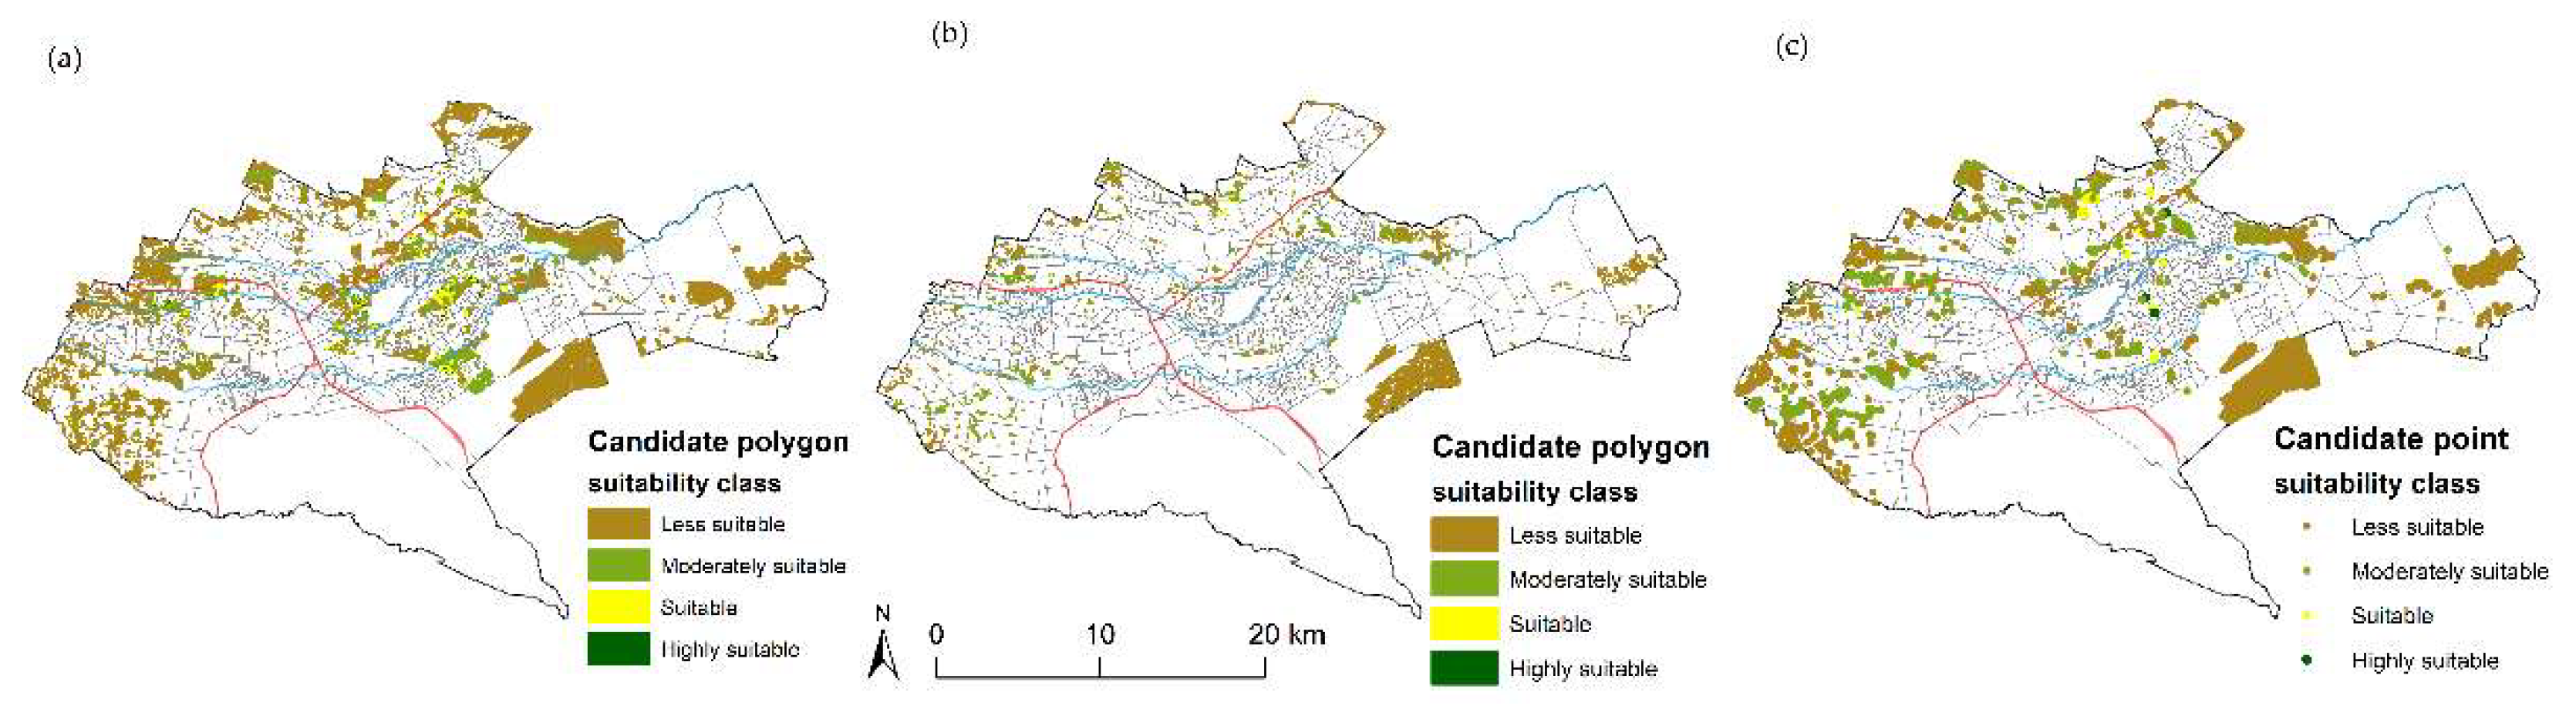
Figure 12.
Correctly predicted candidate sites. (a) shows Boolean overlay sites, while (b)–(f) show weighted suitability sites: (b, c) Class 2 (less suitable), (d, e) Class 3 (moderately suitable) and (f) Class 4 (suitable).
Figure 12.
Correctly predicted candidate sites. (a) shows Boolean overlay sites, while (b)–(f) show weighted suitability sites: (b, c) Class 2 (less suitable), (d, e) Class 3 (moderately suitable) and (f) Class 4 (suitable).
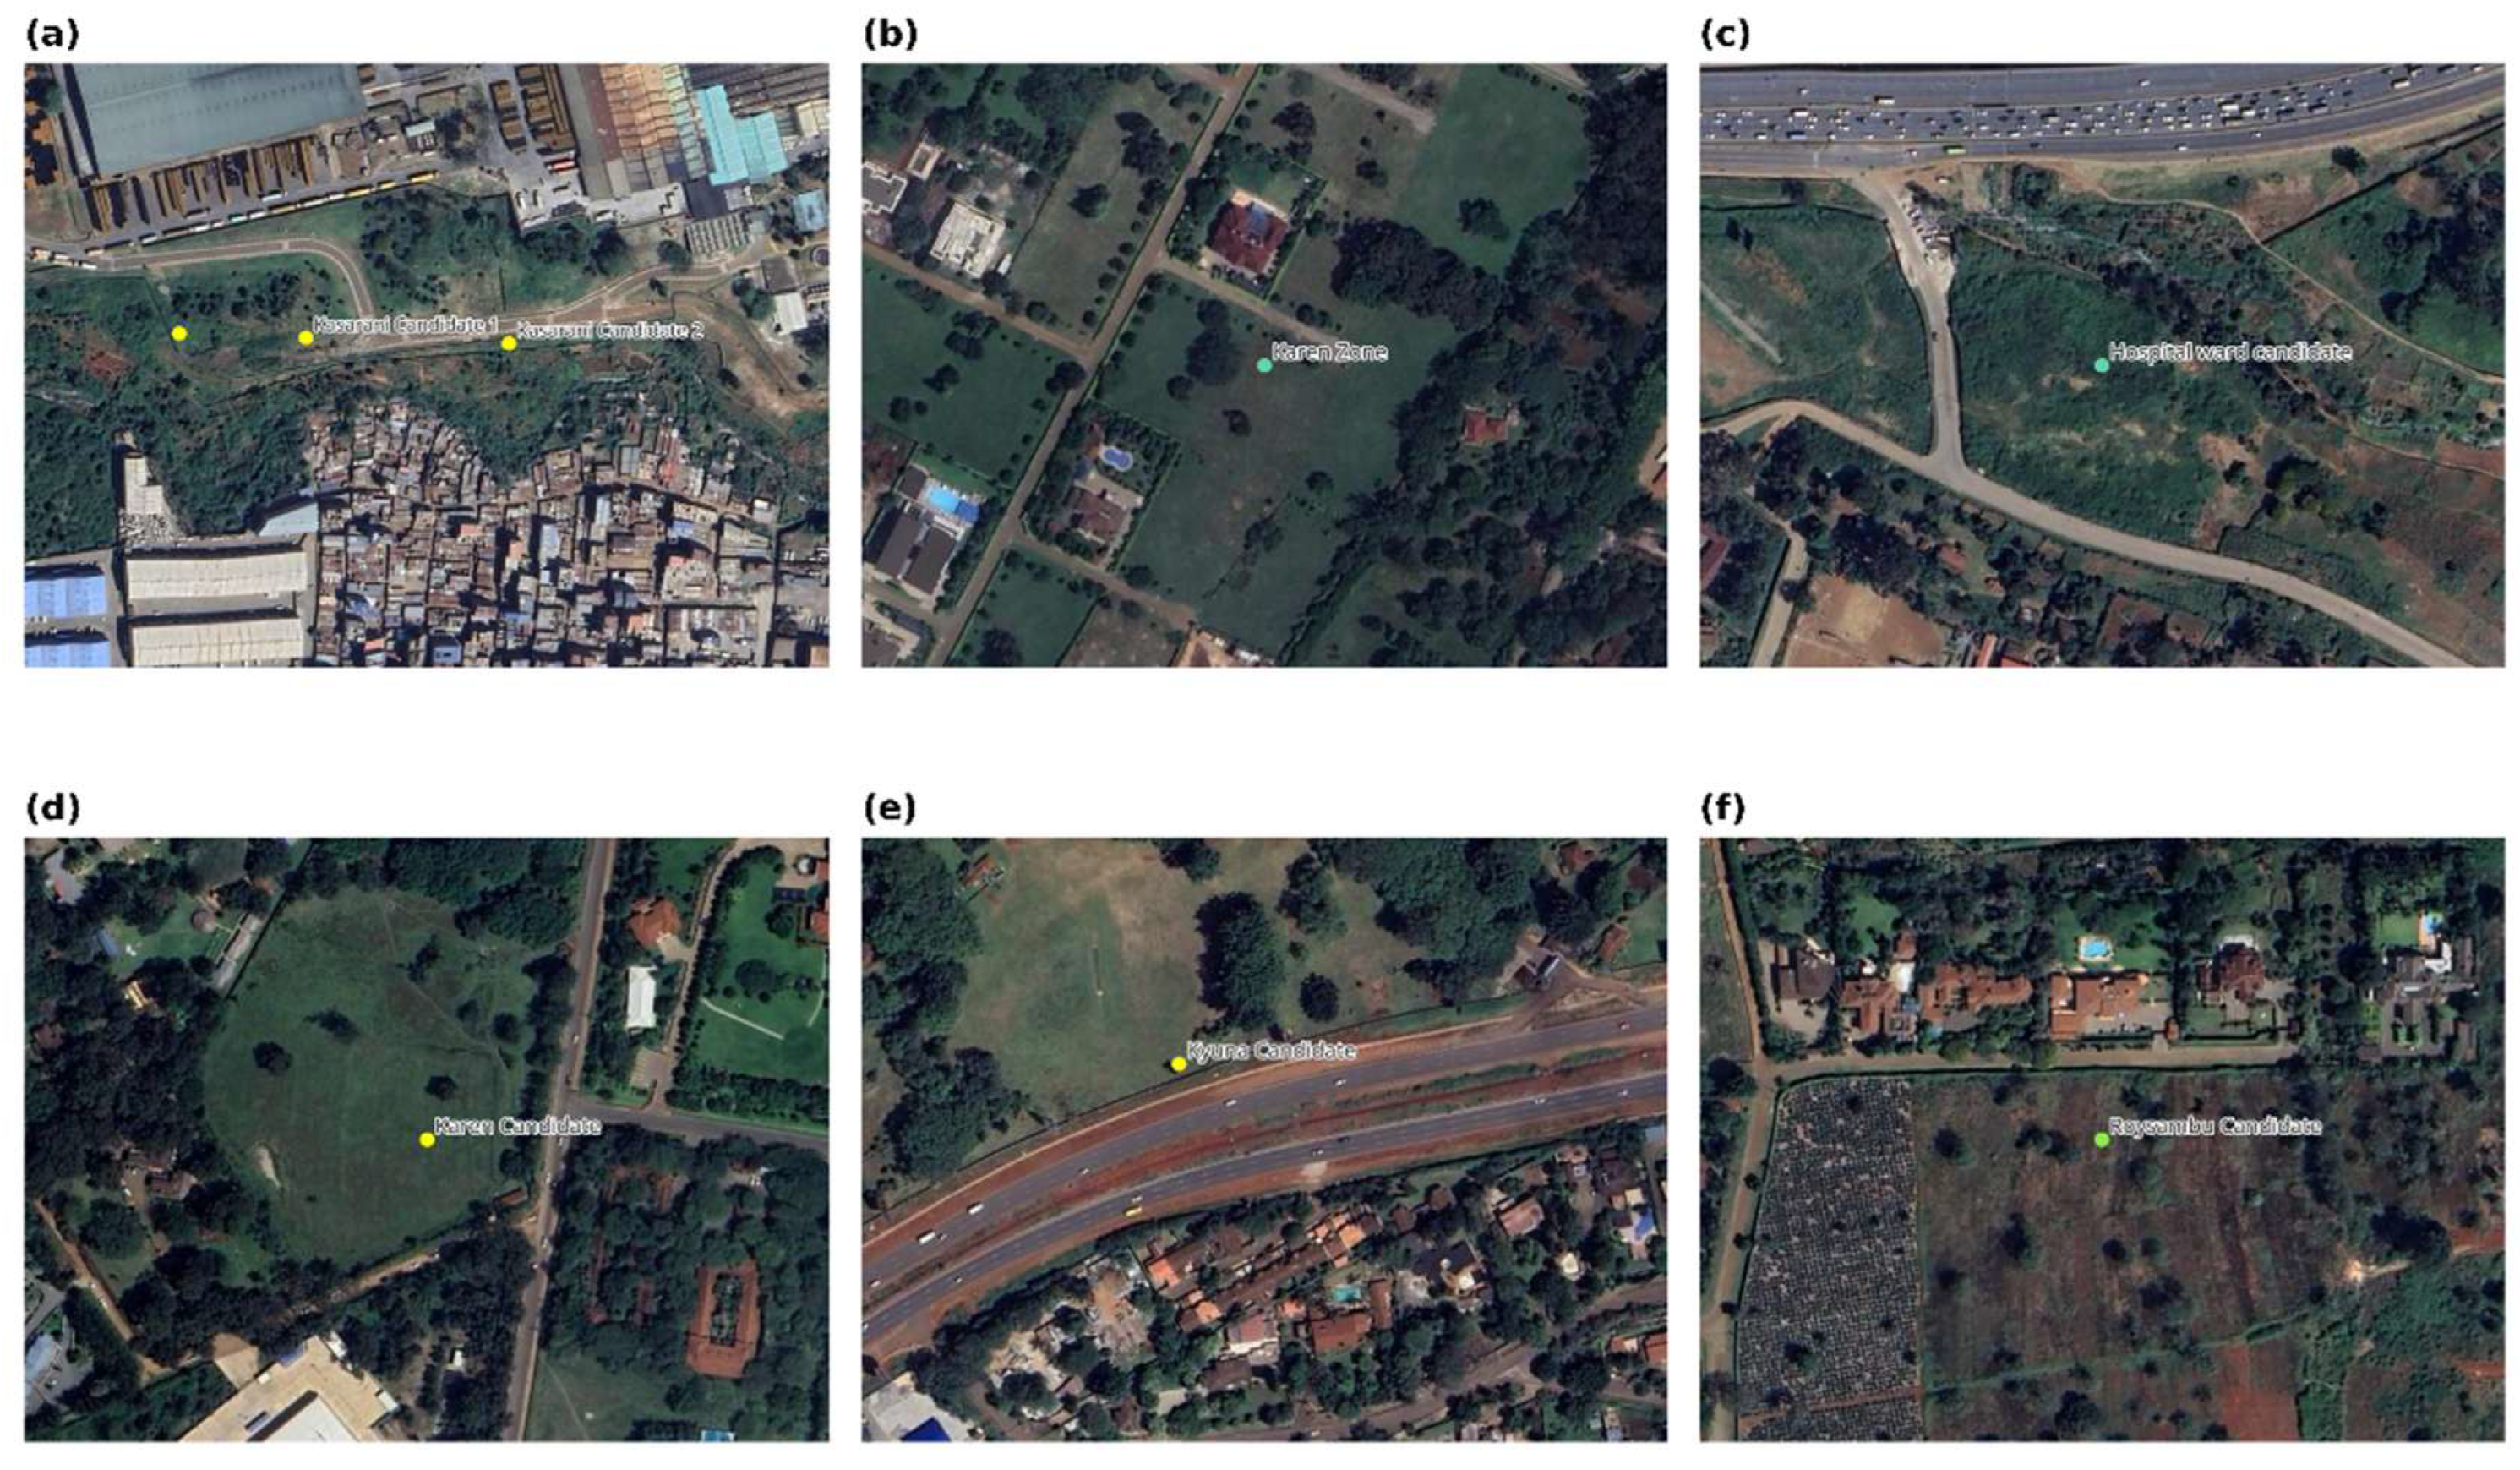
Figure 13.
Incorrectly predicted candidate sites. (a) shows Boolean overlay site, while (b)–(d) show weighted suitability sites: (b) Class 2 (less suitable), (c) Class 3 (moderately suitable) and (d) Class 5 (highly suitable).
Figure 13.
Incorrectly predicted candidate sites. (a) shows Boolean overlay site, while (b)–(d) show weighted suitability sites: (b) Class 2 (less suitable), (c) Class 3 (moderately suitable) and (d) Class 5 (highly suitable).
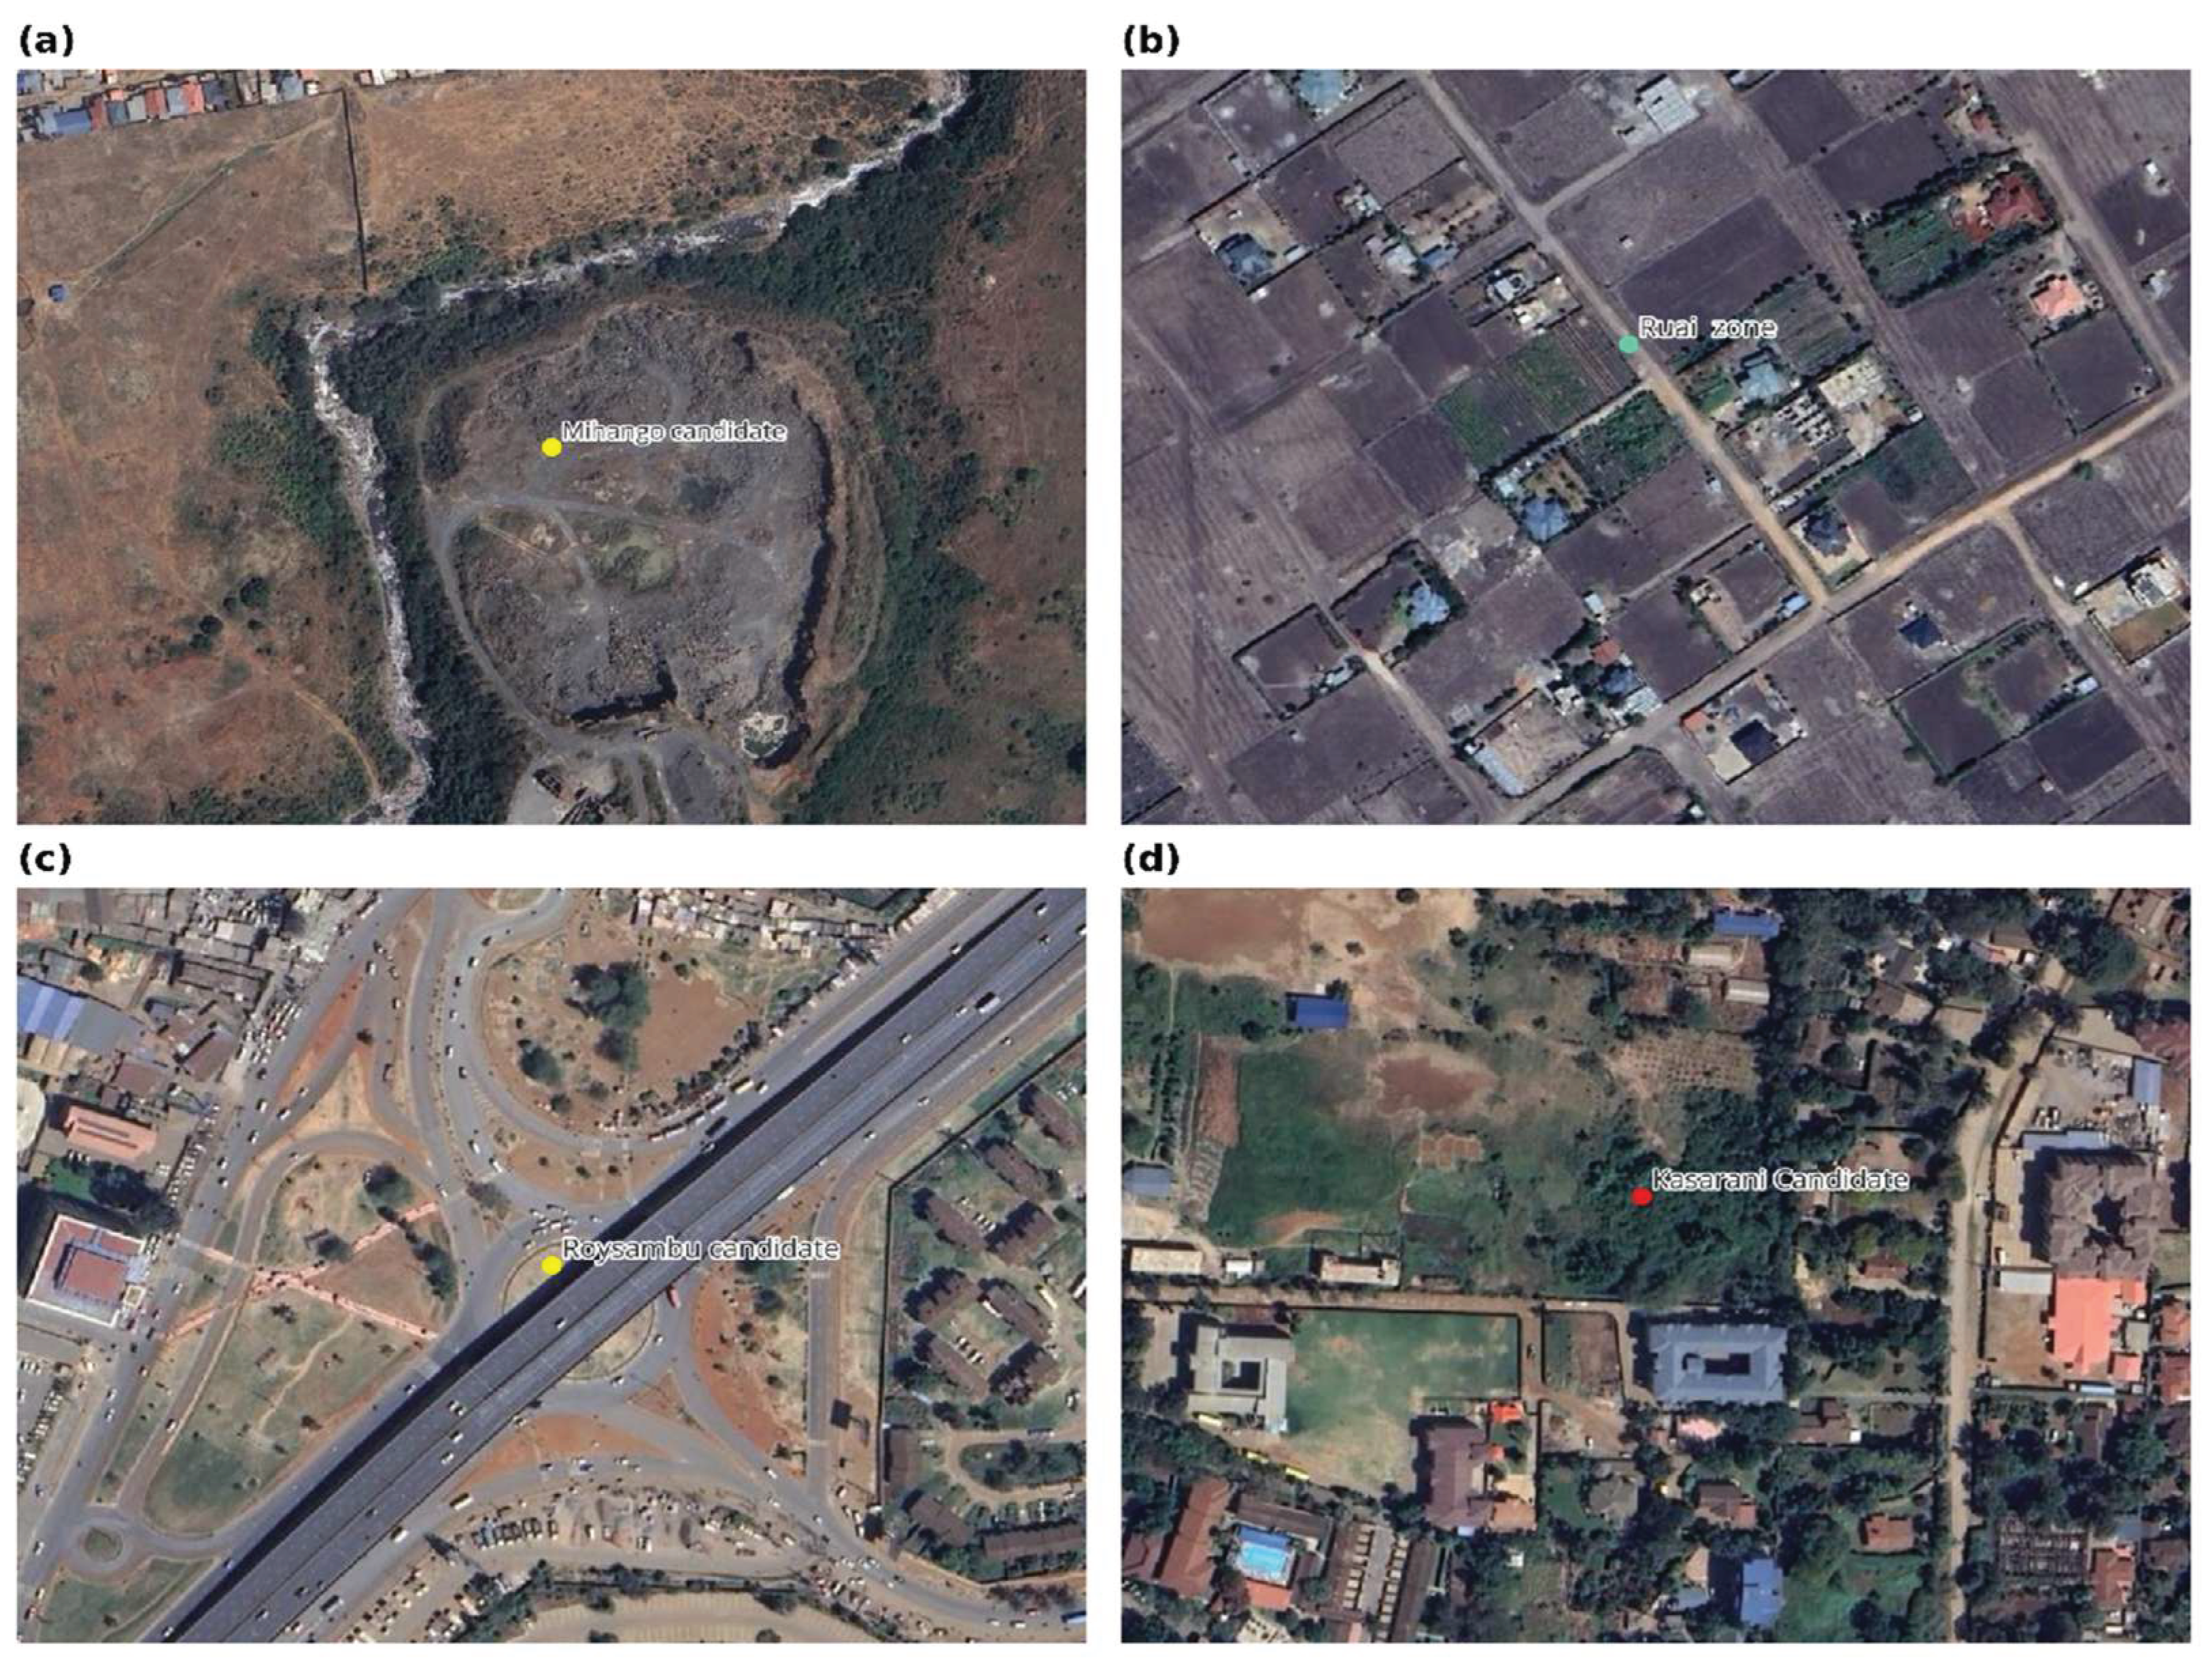

Table 1.
Thematic datasets used in the suitability analysis.
| Dataset | Source | Variable Derived | Purpose |
|---|---|---|---|
| ALOS PALSAR DEM (12.5m) | Alaska Satellite Facility (ASF) https://search.asf.alaska.edu (accessed on 11 July 2025) |
Elevation, Slope | Identify flood-prone lowlands and avoid steep terrain |
| SRTM DEM (30m) | RCMRD Geoportal https://opendata.rcmrd.org (accessed 6 June 2025) |
Elevation | Fill missing data in ALOS PALSAR mosaicked DEM |
| SoilGrids (250m; 30-60cm depth) | ISRIC – World Soil Information https://data.isric.org/ (accessed on 7 June 2025) |
Soil texture | Evaluate foundation stability and risk of differential settlement |
| Nairobi Land use 2010 | World Bank https://datacatalog.worldbank.org/ (accessed on 26 June 2025) |
Land use categories | Identify compatible land uses for LPG stations |
| Geological map 2013 | Guth & Wood (2013) (accessed via GSA Digital Maps: https://www.geosociety.org/maps/2014-DMCH016/ - on 6 June 2025) |
Volcanic rocks |
Assess ground stability |
Table 2.
Buffered datasets used in the suitability analysis.
| Category | Dataset | Buffer distances (m) | Source | Purpose |
|---|---|---|---|---|
| Environmental Constraints | Main rivers | 30 | Digitized from Afritekt map [22], supplemented with OSM [23]. |
Maintain safe separation from environmentally sensitive areas and comply with planning guidelines. |
| Tributaries, Streams | 30 | OpenStreetMap (OSM) [23]. | ||
| Reservoirs | 30 | OpenStreetMap [23]. | ||
| Boreholes/Wells |
10 |
Ministry of Water, Sanitation and Irrigation (2022); OpenStreetMap [23]; OSM processed by UNESCO [24]. | ||
| Wetlands | 200 | World Resources Institute (2017) via Land Portal [25]. | ||
| Forests | 20 |
Kenya Forest Service via RCMRD [26]. | Reduce fire risk | |
| National parks |
5000 |
World Resources Institute (2017) via Land Portal [25]. | Reduce external pressures | |
| Dumpsites | 10 | Digitized by Author | Ensure safe separation from environmentally sensitive area. |
|
| PhysicalInfrastructure | Power plants, Substations, Power lines, Distribution Transformers | Power Plant - 2000; Power lines 5–30; Substation - 50; Transformer - 15 m | Kenya Power and Lighting Company published via EnergyData.info [27]. | Minimize ignition hazards |
| Water Treatment and wastewater treatment plants | Water treatment 300; wastewater 1000 | Digitized, supplemented with OpenStreetMap [23]. | Protect water infrastructure and ensure public health |
|
| Drinking water and Water towers | Drinking water 10; and Water towers 60 | OpenStreetMap [23]. | Ensure safety protection and comply with planning guidelines. | |
| Road Intersections, Parking, Railways, Airports | Intersections & parking 100; Railways 60.96–70 ; Airports 75 | OpenStreetMap [23]. | Ensure safety protection. | |
| Roads |
15 – 110 (by class) |
Kenya Roads Board via EnergyData.info [27]. |
Protect road reserves and prevent encroachment |
|
| Oil Pipeline |
30 |
Kenya Pipeline via EnergyData.info [27]. |
Prevent hazardous encroachment |
|
| SocialInfrastructure | Schools |
75 |
Ministry of Education via EnergyData.info [27]. |
Ensure public safety and comply with regulations. |
| Hospitals |
75 |
Kenya Open Data Portal via EnergyData.info [27]. |
||
| Market, Libraries, police stations, courthouses, hotel, prison, Military, Religious sites, Community Centers, stadiums, Theaters, Auditoriums, Sports grounds, parks |
75 |
OpenStreetMap [23]. |
||
| Residential Areas | 50 | Digitized Nairobi Land use; OpenStreetMap [23]. |
||
| Hot works | Recycling metal, glass, paper | 10 | OpenStreetMap [23]. | Prevent ignition risks |
| Existing LPG stations | Existing LPG stations | 1000 | personal communication | prevent service overlap |
Table 3.
Reclassification and Weighting of Thematic Layers and LPG proximity distances.
| Layer/ Criterion | Class Description | Suitability Class (Weighted Overlay) | Weighted Overlay Reclassification (1-5) | Weight (%) | Boolean Reclassification (0 = Unsuitable, 1 = Suitable) |
|---|---|---|---|---|---|
|
Elevation (m) |
≤ 1500 | Not suitable | 1 | 10 | 0 |
| 1500–1600 | Less Suitable | 2 | 1 | ||
| 1600–1700 | Suitable | 4 | 1 | ||
| 1700–1800 | Highly suitable | 5 | 1 | ||
| >1800 | Moderate | 3 | 1 | ||
| Slope (degrees) | 0–2.9 | Highly Suitable | 5 | 15 | 1 |
| 2.9–5.7 | Moderately Suitable | 3 | 1 | ||
| 5.7- 6.8 | Less suitable | 2 | 0 | ||
| > 6.8 | Not suitable | 1 | 0 | ||
| Soil Texture | Clay | Less suitable | 2 | 5 | 0 |
| Sandy Clay | Moderately suitable | 3 | 1 | ||
| Clay loam | Moderately suitable | 3 | 1 | ||
| Sandy Clay loam | Highly Suitable | 5 | 1 | ||
| Land use | Forest, Agr/Open space, Water, Institutional, Transportation, Residential, Mixed CI, Residential slum, Recreational, Education, Social facility | Not suitable | 1 | 35 | 0 |
| Industrial | Suitable | 4 | 1 | ||
| Commercial | Suitable | 4 | 1 | ||
| Mixed RC | Highly suitable | 5 | 1 | ||
| Geology | Athi Tuffs, Kinangop Tuff | Not suitable | 1 | 5 | 0 |
| Upper Kerichwa Tuffs, Lower Kerichwa Tuff | Less suitable | 2 | 1 | ||
| Nairobi Trachyte, Limuru Trachyte | Moderately suitable | 3 | 1 | ||
| Mbagathi Trachyte, Kabete Trachyte, Kiambu Trachyte | Suitable | 4 | 1 | ||
| Kapiti Phonolite, Nairobi Phonolite, Kandizi Phonolite | Highly Suitable | 5 | 1 | ||
| LPG Station(Distance fromexisting stations) | 0–500m | Not Suitable | 1 | 30 | 0 |
| 500–1000m | Moderately Suitable | 3 | 0 | ||
| 1000–1500m | Highly Suitable | 5 | 1 | ||
| 1500–2000m | Suitable | 4 | 1 | ||
| >2000m | Less Suitable | 2 | 1 |
Disclaimer/Publisher’s Note: The statements, opinions and data contained in all publications are solely those of the individual author(s) and contributor(s) and not of MDPI and/or the editor(s). MDPI and/or the editor(s) disclaim responsibility for any injury to people or property resulting from any ideas, methods, instructions or products referred to in the content. |
© 2025 by the authors. Licensee MDPI, Basel, Switzerland. This article is an open access article distributed under the terms and conditions of the Creative Commons Attribution (CC BY) license (http://creativecommons.org/licenses/by/4.0/).
Copyright: This open access article is published under a Creative Commons CC BY 4.0 license, which permit the free download, distribution, and reuse, provided that the author and preprint are cited in any reuse.


