Submitted:
28 November 2025
Posted:
01 December 2025
You are already at the latest version
Abstract
Background: Aging is a complex multifactorial process characterized by molec- ular and cellular changes. Gene expression patterns alter with age, potentially contributing to age-related decline and disease. The F13A1 gene, encoding coag- ulation factor XIII A subunit, has been implicated in age-related processes, yet its expression dynamics in aging mesenchymal stromal cells (MSCs) remain in- completely characterized. Objective: This study investigates the relationships between F13A1 gene expression, chronological age, and biological sex in human bone marrow-derived MSCs using multivariate statistical approaches. Methods: We analyzed gene expression data from 61 healthy donors (45 female, 16 male; age range 17–84 years) from a publicly available dataset. Bivariate and multivariate statistical analyses, including Pearson correlation, linear regression, t-tests, and multivariate regression models with interaction terms, were performed. Results: F13A1 expression showed a statistically significant positive correlation with age (r = 0.433, p < 0.001), explaining 18.7% of variance. No significant sex difference was observed (p = 0.385). Multivariate analysis confirmed age as the primary predic- tor (adjusted R2 = 0.159), with no significant age × sex interaction (p = 0.114). Age-stratified analysis revealed progressive increases across age groups (one-way ANOVA, p = 0.005). Conclusion: F13A1 expression increases with chronolog- ical age in MSCs independent of sex, suggesting its potential as a biomarker for biological aging in these therapeutically relevant cells.
Keywords:
F13A1
; gene expression
; mesenchymal stromal cells
; aging
; biological aging
; biomarker
; chronological age
1. Introduction
Aging represents a multifaceted biological process involving progressive decline in physiological function, increased disease susceptibility, and ultimately mortality [1]. At the molecular level, aging manifests through alterations in gene expression patterns, genomic instability, telomere attrition, epigenetic modifications, loss of proteostasis, mitochondrial dysfunction, cellular senescence, stem cell exhaustion, and altered intercellular communication [2].
Mesenchymal stromal cells (MSCs) are multipotent progenitor cells with self-renewal and multilineage differentiation capabilities, playing crucial roles in tissue homeostasis and repair [3]. These cells serve as the gold standard for cell-based regenerative therapies due to their therapeutic potential in treating various degenerative conditions. However, age-related changes in MSC function have been extensively documented and implicated in various age-related pathologies [4,5]. Understanding the molecular signatures of aging in MSCs is therefore paramount for optimizing therapeutic applications, particularly in elderly populations where autologous cell therapy may be most needed.
The F13A1 gene encodes the A subunit of coagulation factor XIII, a transglutaminase enzyme critical for blood coagulation, wound healing, and extracellular matrix stabilization [6]. Factor XIII catalyzes the formation of -glutamyl--lysine crosslinks between fibrin molecules, thereby stabilizing blood clots and facilitating tissue repair. Beyond hemostasis, factor XIII participates in diverse biological processes including angiogenesis, bone remodeling, and tissue regeneration [7]. Recent evidence suggests potential roles for F13A1 in age-related processes, though systematic investigations of its expression dynamics during aging in human MSCs have been limited.
Previous transcriptomic analyses of aging MSCs have identified numerous age-associated genes, yet comprehensive characterization of F13A1 in this context remains incomplete [5]. Furthermore, sex-specific differences in gene expression during aging represent an important but underexplored dimension of MSC biology. Given the clinical significance of MSCs in regenerative medicine and the potential relevance of coagulation factors in tissue repair processes, we hypothesized that F13A1 expression might correlate with chronological age in human MSCs and that this relationship might be modulated by donor sex.
The present study leverages a well-characterized public dataset of gene expression profiles from human bone marrow-derived MSCs spanning a wide age range (17–84 years) [5] to conduct comprehensive bivariate and multivariate analyses examining the relationships between F13A1 expression, chronological age, and biological sex.
2. Methods
2.1. Data Source and Study Population
Gene expression data were obtained from the publicly available dataset published by Alves et al. (2012) [5], accessible through the Stemformatics platform (Dataset ID: 6183; GEO accession: GSE39540). This dataset comprises genome-wide expression profiles from human bone marrow-derived MSCs isolated from 61 healthy donors. The study population included 45 female donors (73.8%) and 16 male donors (26.2%), with ages ranging from 17 to 84 years (mean ± SD: 55.2 ± 17.4 years). Female donors had a mean age of 57.8 ± 17.0 years, while male donors averaged 48.0 ± 16.9 years.
MSCs were isolated from bone marrow aspirates obtained from the acetabulum or iliac crest during orthopedic procedures and expanded in vitro under standardized conditions as described in the original publication [5]. All samples were from early passage (passage 2–4) MSCs to minimize in vitro aging effects. Gene expression profiling was performed using Affymetrix Human Genome U133A 2.0 microarrays.
2.2. Data Processing
Raw gene expression data underwent standard normalization procedures. F13A1 gene expression levels (Ensembl ID: ENSG00000003436) were extracted for each sample. Expression values were log2-transformed and normalized across samples. Quality control procedures confirmed that all samples met standard criteria for inclusion in downstream analyses.
2.3. Statistical Analysis
All statistical analyses were performed using Python (version 3.14) with NumPy, pandas, and SciPy libraries, as well as R (version 4.5.2). Statistical significance was defined as for all analyses unless otherwise specified.
2.3.1. Descriptive Statistics
Descriptive statistics, including mean, standard deviation, median, and range, were calculated for age and F13A1 expression levels, both overall and stratified by sex. Sex differences in age distribution were assessed using independent t-tests.
2.3.2. Bivariate Analyses
Age and F13A1 Expression:
The relationship between age and F13A1 expression was evaluated using Pearson correlation analysis to assess linear association. Spearman rank correlation was additionally computed as a non-parametric alternative. Simple linear regression was performed with age as the independent variable and F13A1 expression as the dependent variable. Regression diagnostics included assessment of residual normality (Shapiro-Wilk test), homoscedasticity, and autocorrelation (Durbin-Watson statistic).
Sex and F13A1 Expression:
Sex differences in F13A1 expression were evaluated using independent samples t-tests. Levene’s test was used to assess equality of variances. As a non-parametric alternative, the Mann-Whitney U test was also performed. Effect sizes were quantified using Cohen’s d.
2.3.3. Multivariate Analyses
Multiple linear regression models were constructed to assess the independent and joint effects of age and sex on F13A1 expression:
Model 1 (Bivariate):
Model 2 (Multivariate, main effects):
Model 3 (Multivariate with interaction):
where Sex was coded as a binary variable (male = 1, female = 0). Model comparisons were performed using F-tests to evaluate the incremental contribution of sex (Model 2 vs. Model 1) and the age × sex interaction term (Model 3 vs. Model 2).
2.3.4. Age-Stratified Analysis
To examine age-related patterns more granularly, donors were categorized into four age groups: <30 years, 30–50 years, 50–70 years, and >70 years. One-way analysis of variance (ANOVA) was performed to test for differences in F13A1 expression across age groups.
All statistical code and detailed methodology are available upon request.
3. Results
3.1. Study Population Characteristics
The final analytic cohort comprised 61 donors with complete data. Descriptive statistics are presented in Table 1. The cohort showed substantial heterogeneity in both age and F13A1 expression levels. Female donors were slightly older on average than male donors (57.8 vs. 48.0 years), though this difference was not statistically significant (t = 1.93, p = 0.058).
3.2. Bivariate Analysis: Age and F13A1 Expression
Pearson correlation analysis revealed a statistically significant positive correlation between chronological age and F13A1 expression (r = 0.433, p = 0.00050; Figure 1). This moderate positive correlation indicates that F13A1 expression tends to increase with advancing donor age. The Spearman rank correlation coefficient ( = 0.396, p = 0.00159) confirmed this relationship using a non-parametric approach.
Simple linear regression analysis demonstrated that age significantly predicted F13A1 expression (F(1,59) = 13.59, p = 0.00050), with age alone explaining 18.7% of the variance in F13A1 levels (R2 = 0.187; adjusted R2 = 0.174). The regression equation was:
The positive slope ( = 0.0256, SE = 0.00694) indicates that for each additional year of age, F13A1 expression increases by approximately 0.026 log2 units. This coefficient was statistically significant (t = 3.69, p = 0.00050), with a 95% confidence interval of [0.0117, 0.0395].
3.3. Bivariate Analysis: Sex and F13A1 Expression
Independent samples t-test revealed no statistically significant difference in F13A1 expression between female and male donors (t(59) = 0.875, p = 0.385). Female donors exhibited a mean F13A1 expression of 8.271 ± 0.998, while male donors showed a mean of 8.008 ± 1.125 (mean difference = 0.263). The effect size was small (Cohen’s d = 0.255), indicating minimal practical significance. Levene’s test confirmed homogeneity of variances (W = 0.059, p = 0.809). The non-parametric Mann-Whitney U test corroborated this finding (U = 387.0, p = 0.664).
Figure 2.
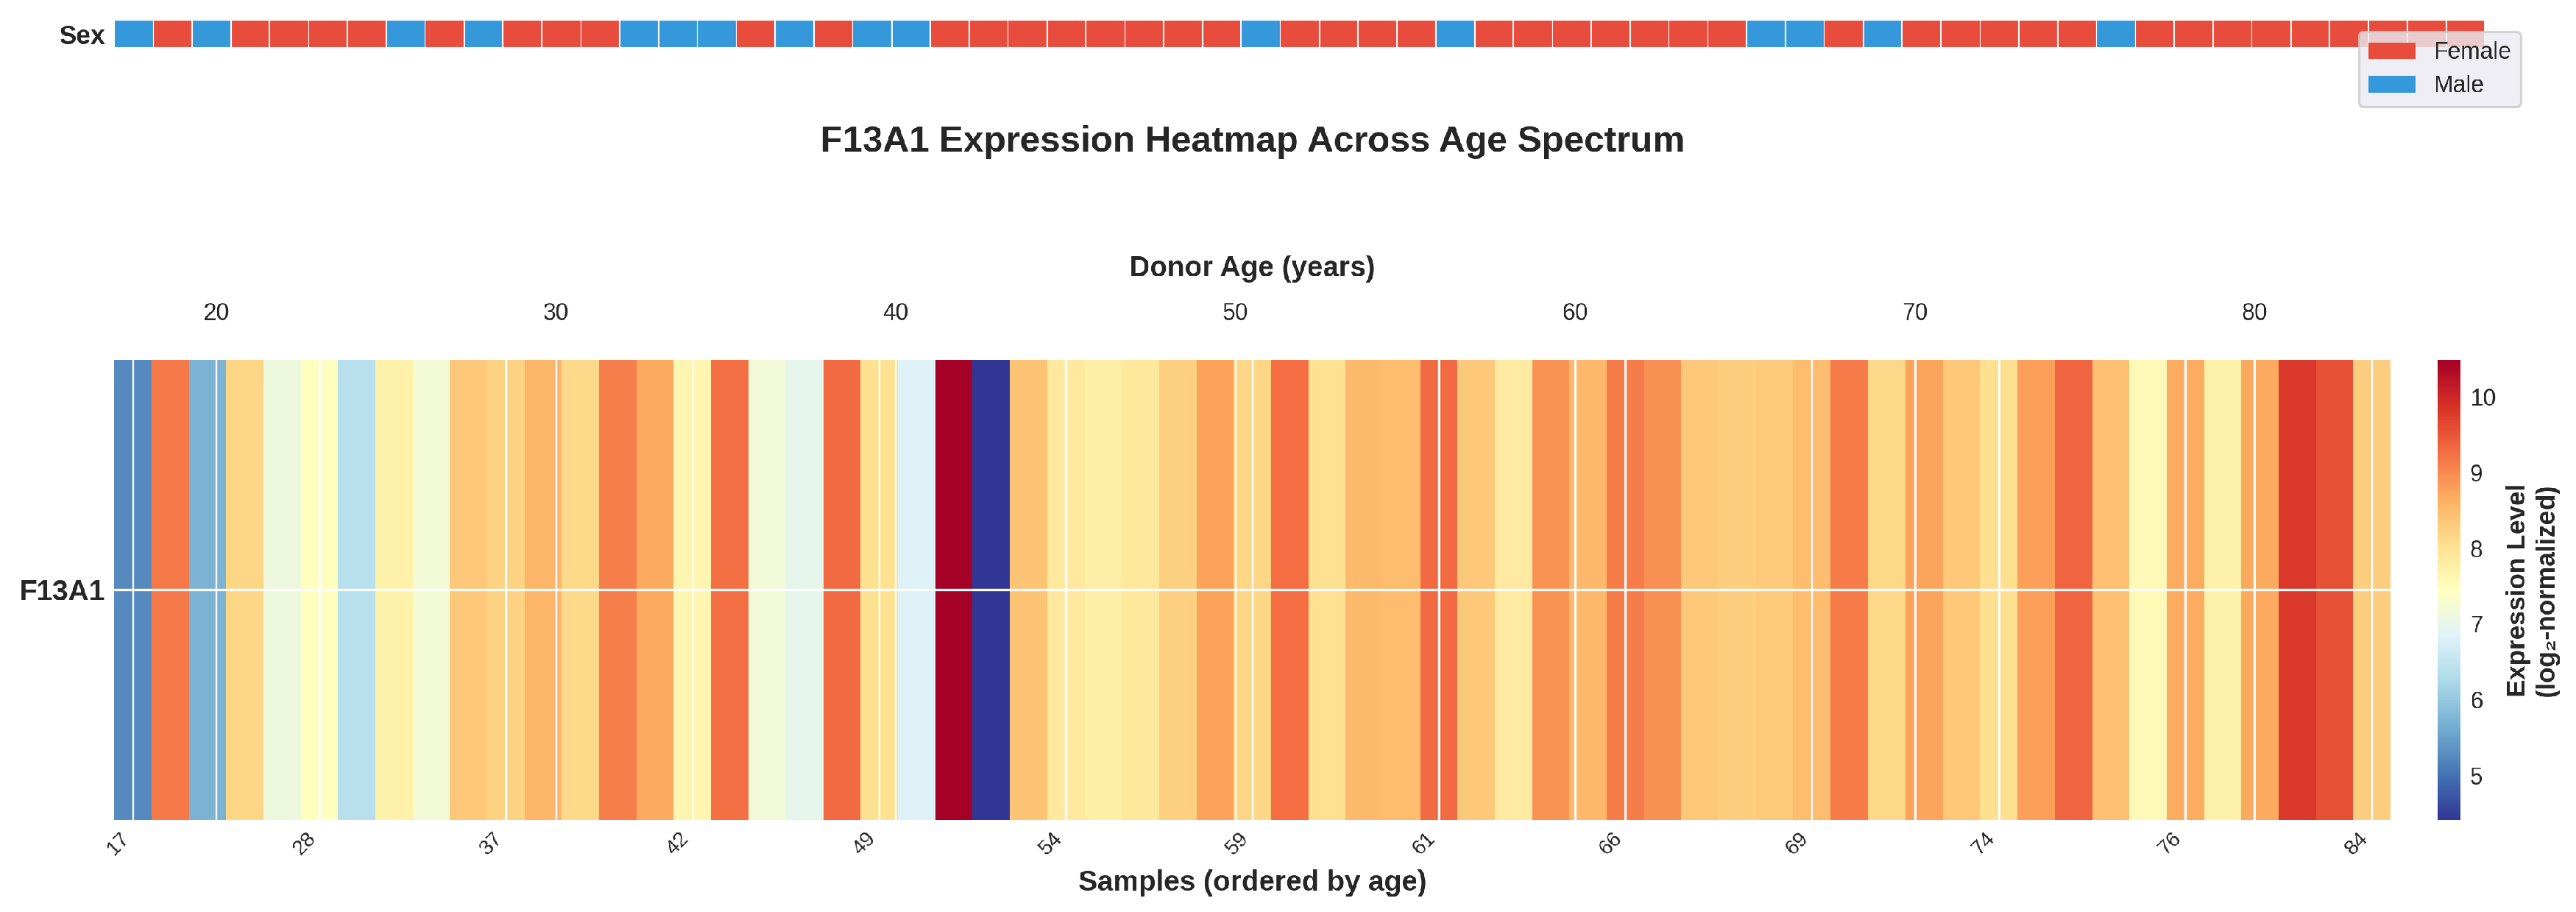
Heatmap visualization of F13A1 expression across the age spectrum. F13A1 gene expression levels are displayed for all 61 samples ordered by chronological age (17–84 years, left to right). The top bar indicates donor sex (red = female, blue = male). Color intensity represents expression level (red = high, blue = low). The heatmap reveals a general trend of increasing F13A1 expression with advancing donor age, particularly evident in the oldest donors.
Figure 2.
Heatmap visualization of F13A1 expression across the age spectrum. F13A1 gene expression levels are displayed for all 61 samples ordered by chronological age (17–84 years, left to right). The top bar indicates donor sex (red = female, blue = male). Color intensity represents expression level (red = high, blue = low). The heatmap reveals a general trend of increasing F13A1 expression with advancing donor age, particularly evident in the oldest donors.
3.4. Multivariate Analysis: Age and Sex as Predictors
Table 2 summarizes the results of multivariate regression models examining age and sex as predictors of F13A1 expression.

Table 3.
Regression Coefficients for Multivariate Models.
| Predictor | Model 2 Coefficient | SE | Model 3 Coefficient | SE |
|---|---|---|---|---|
| Intercept | 6.796 | 0.563 | 7.181 | 0.621 |
| Age | 0.0255 | 0.007 | 0.0189 | 0.009 |
| Sex (Male) | 0.307 | 0.876 | ||
| Age × Sex | — | — | 0.0264 | 0.016 |
Model 2: Main Effects Model
The multivariate model including both age and sex as independent predictors (Model 2) maintained similar explanatory power (R2 = 0.187, adjusted R2 = 0.159) as the age-only model, with overall statistical significance (F(2,58) = 6.68, p = 0.002). Age remained a significant predictor ( = 0.0255, p < 0.001), while sex showed no significant independent effect ( = , p = 0.967). The negligible change in R2 when adding sex to the model ( = 0.00002) confirms that sex contributes virtually no additional explanatory power beyond age alone.
Model 3: Interaction Model
The inclusion of an age × sex interaction term (Model 3) resulted in modest increases in explained variance (R2 = 0.223, adjusted R2 = 0.182), with maintained overall significance (F(3,57) = 5.44, p = 0.002). However, the interaction term itself did not achieve statistical significance ( = 0.0264, p = 0.114). The incremental R2 contributed by the interaction was ΔR2 = 0.035, which was not statistically significant (F(1,57) = 2.58, p = 0.114).
These results indicate that while age is a robust predictor of F13A1 expression, neither sex nor the age × sex interaction contributes meaningfully to explaining variance in F13A1 levels in this cohort.
3.5. Age-Stratified Analysis
One-way ANOVA revealed statistically significant differences in F13A1 expression across age groups (F(3,57) = 4.73, p = 0.005; Table 4, Figure 3). F13A1 expression showed a progressive increase across age categories, with the youngest group (<30 years) exhibiting the lowest mean expression (7.043 ± 1.370) and the oldest group (>70 years) showing the highest (8.613 ± 0.663).
3.6. Regression Diagnostics
Residual analysis for the full interaction model (Model 3) revealed some deviation from normality (Shapiro-Wilk W = 0.939, p = 0.005), suggesting mild non-normality in residuals. However, linear regression is relatively robust to moderate departures from normality with sample sizes of this magnitude. The Durbin-Watson statistic (DW = 1.83) indicated minimal autocorrelation in residuals, falling within the acceptable range. Visual inspection of residual plots (Figure 4) confirmed acceptable homoscedasticity with no systematic patterns.
Figure 5.
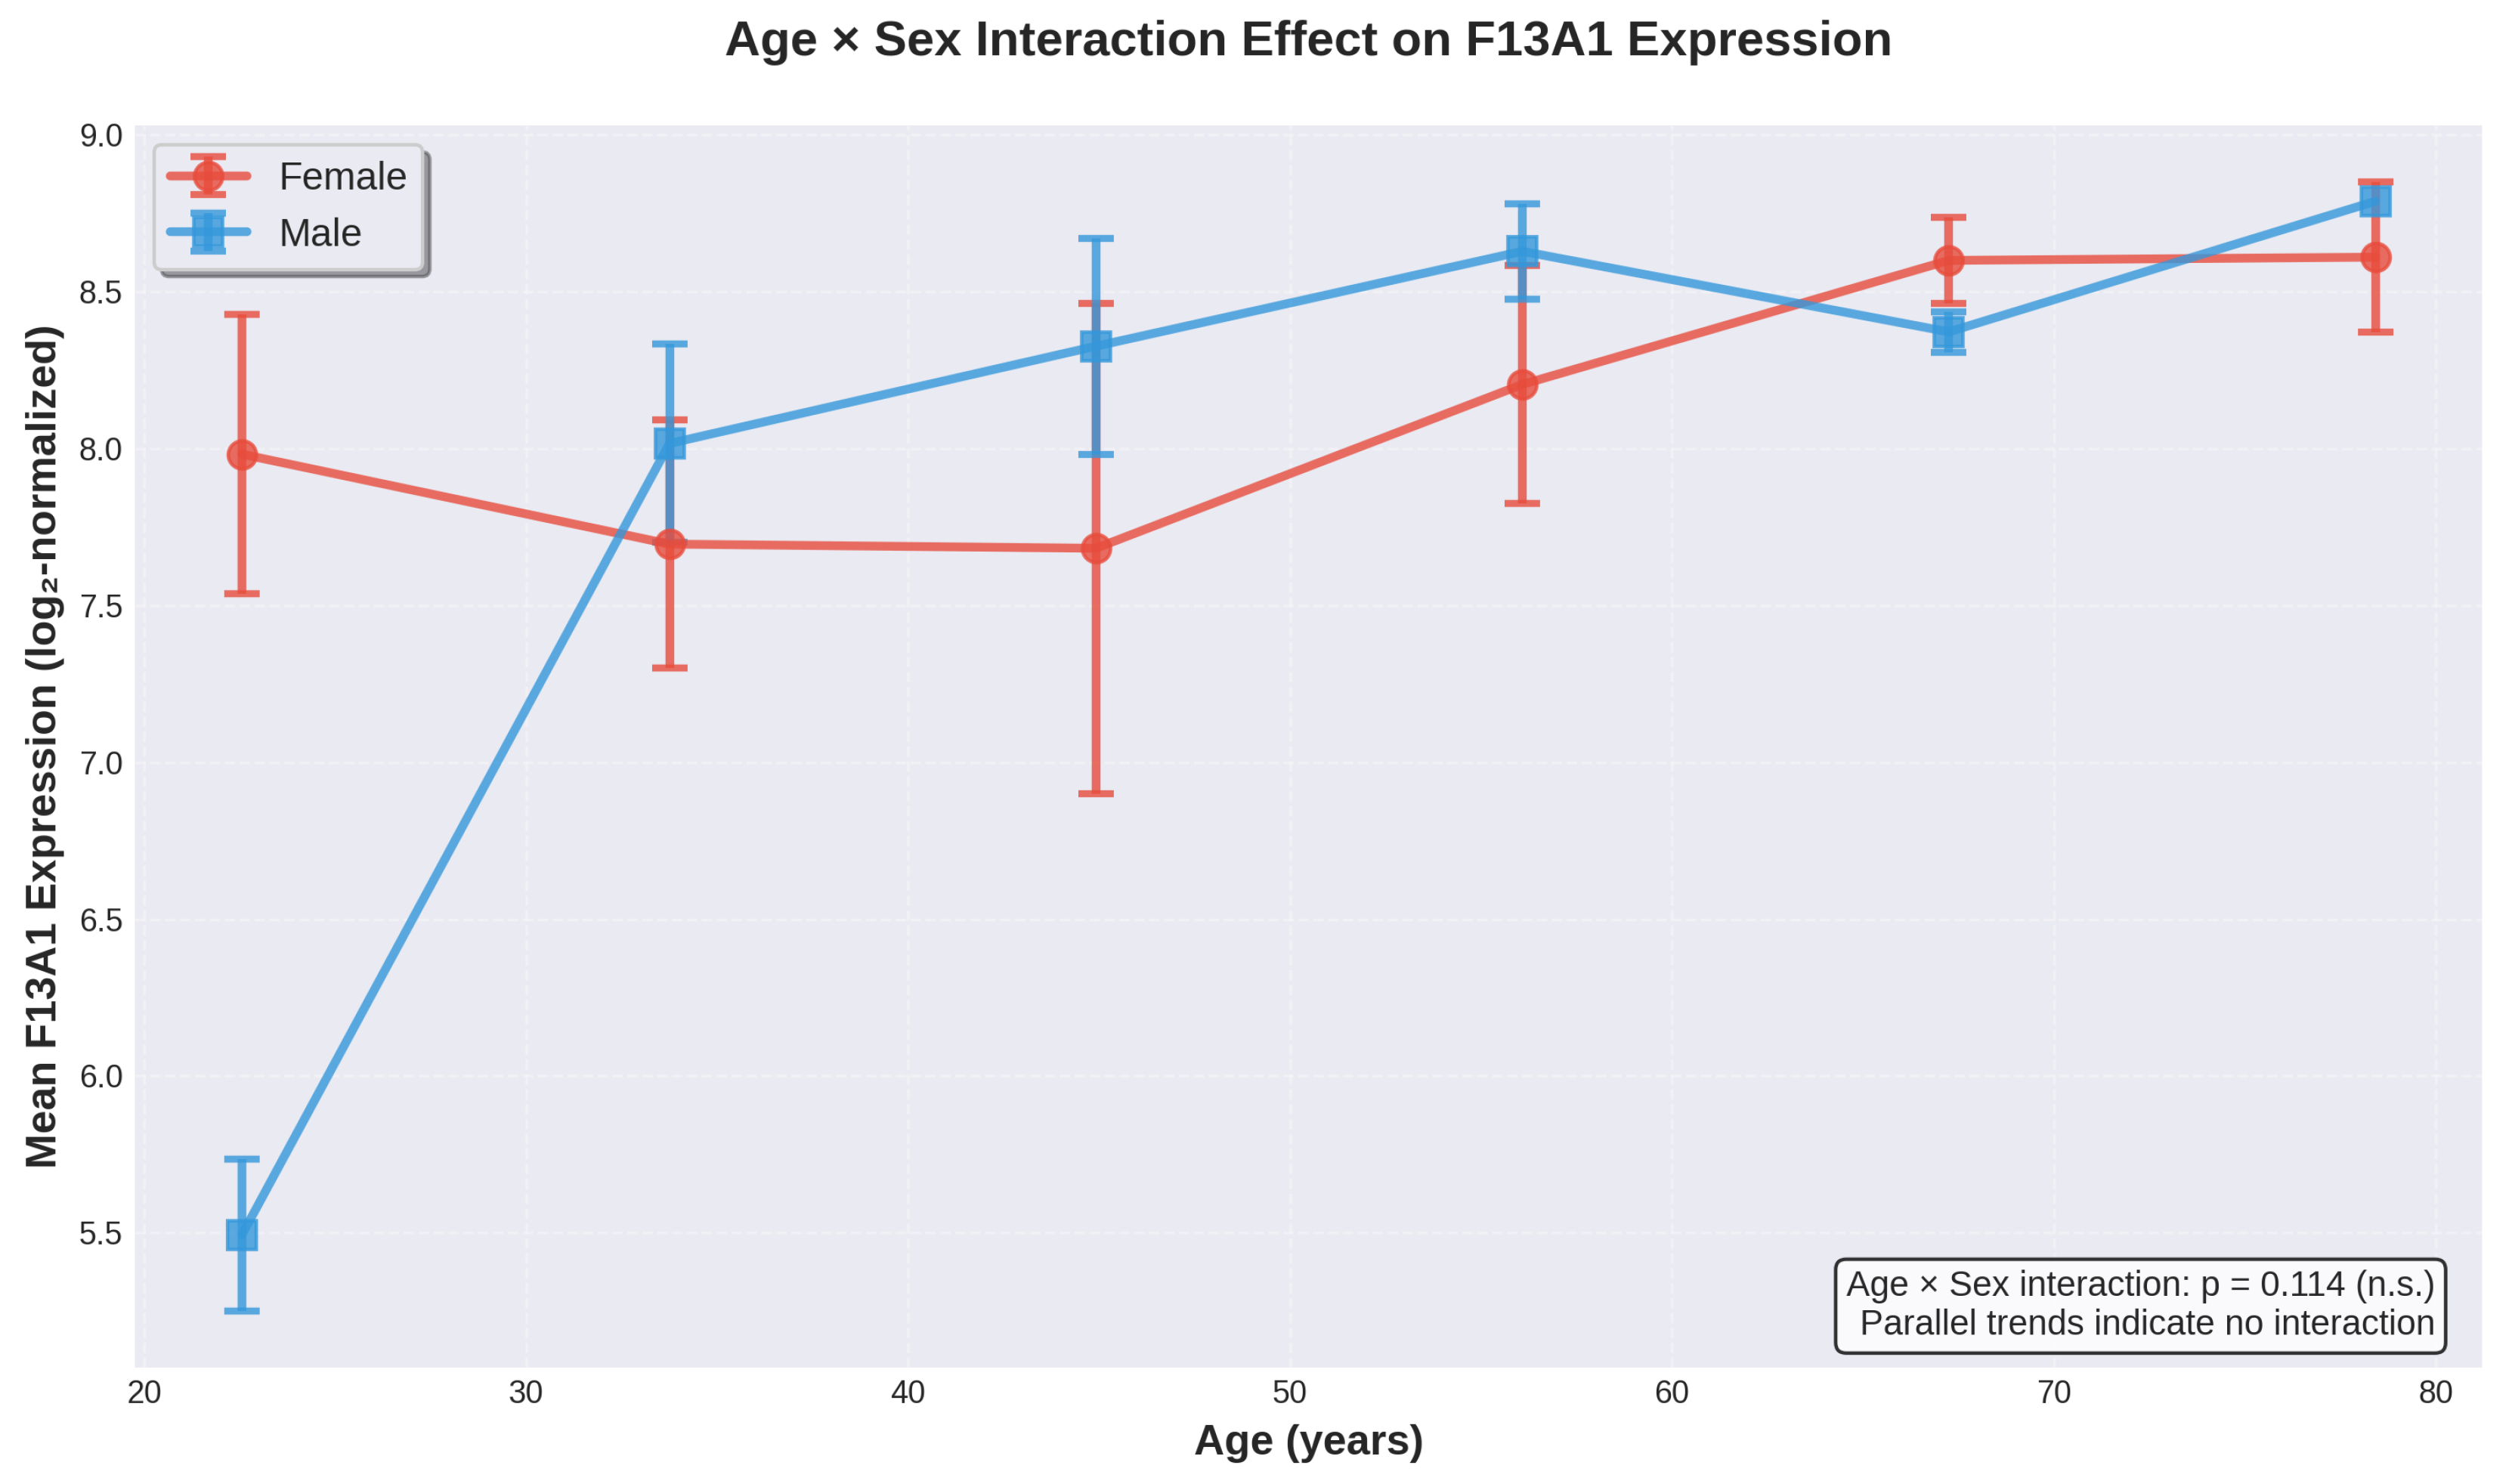
Age × Sex interaction effect on F13A1 expression. Mean F13A1 expression levels (±SEM) plotted across age bins for female (red circles) and male (blue squares) donors. The parallel trajectories of both sexes indicate no significant interaction effect (p = 0.114), suggesting that age-related increases in F13A1 expression follow similar patterns in both sexes.
Figure 5.
Age × Sex interaction effect on F13A1 expression. Mean F13A1 expression levels (±SEM) plotted across age bins for female (red circles) and male (blue squares) donors. The parallel trajectories of both sexes indicate no significant interaction effect (p = 0.114), suggesting that age-related increases in F13A1 expression follow similar patterns in both sexes.
4. Discussion
4.1. Principal Findings
This comprehensive analysis of F13A1 gene expression in human bone marrow-derived MSCs across a wide age spectrum reveals several key findings. First, F13A1 expression exhibits a statistically significant positive correlation with chronological age, explaining approximately 18.7% of variance in expression levels. Second, biological sex does not significantly influence F13A1 expression levels, either as a main effect or through interaction with age. Third, age-stratified analysis demonstrates progressive increases in F13A1 expression across successive age decades, supporting a continuous age-related upregulation pattern.
4.2. Biological Interpretation
The observed age-related increase in F13A1 expression in MSCs may reflect several interconnected biological processes. Factor XIII plays essential roles beyond hemostasis, including extracellular matrix stabilization, tissue remodeling, and regulation of inflammation [7]. Age-related upregulation of F13A1 in MSCs could represent:
Compensatory Response to Aging:
Elevated F13A1 expression may reflect cellular attempts to maintain tissue integrity in the face of age-related extracellular matrix deterioration. Enhanced transglutaminase activity could theoretically bolster matrix crosslinking to compensate for declining tissue quality.
Age-Related Inflammatory Milieu:
Chronic low-grade inflammation (“inflammaging”) characterizes aged tissues [8]. Factor XIII expression is responsive to inflammatory signals, and its upregulation may reflect MSC adaptation to an altered inflammatory microenvironment.
Altered Regenerative Capacity:
Fibrotic Tendency:
Excessive tissue crosslinking can contribute to fibrosis, a common pathological feature of aging tissues. Age-related F13A1 upregulation might potentially contribute to increased fibrotic propensity, although this hypothesis requires direct functional validation.
4.3. Absence of Sex Effects
The lack of significant sex differences in F13A1 expression is noteworthy. While many biological aging processes exhibit sexual dimorphism [9], F13A1 expression appears to follow similar age trajectories in both sexes within MSCs (Figure 6). This observation suggests that age-related regulation of F13A1 in MSCs may be governed by sex-independent mechanisms. However, the limited number of male donors (n=16) in this cohort may have constrained statistical power to detect modest sex effects. Future studies with more balanced sex representation would be valuable.
4.4. Comparison with Previous Literature
Our findings align with previous observations of age-related transcriptional changes in MSCs [5,10]. Alves et al. (2012) identified numerous age-correlated genes in their comprehensive transcriptomic analysis, though F13A1 was not specifically highlighted in their primary analyses. Our focused examination of F13A1 provides detailed statistical characterization of this relationship and its independence from sex.
Studies examining age-related changes in MSC function have documented alterations in proliferation, differentiation capacity, immunomodulatory properties, and secretome composition [4,11]. The upregulation of F13A1 observed here may contribute to age-related functional modifications, particularly those related to matrix interactions and tissue repair capacity.
4.5. Clinical Implications
These findings have potential implications for MSC-based cell therapies. Age-related molecular changes in MSCs may affect their therapeutic potency, particularly for applications requiring robust matrix remodeling or tissue regeneration [11]. Understanding baseline molecular differences between young and aged MSCs, including F13A1 expression patterns, could inform donor selection strategies or suggest targets for cellular rejuvenation approaches.
However, whether increased F13A1 expression in aged MSCs represents beneficial adaptation or detrimental dysfunction remains unclear and warrants functional investigation. Future studies examining the consequences of F13A1 modulation on MSC function and therapeutic efficacy would be valuable.
4.6. Methodological Considerations
Several methodological strengths and limitations merit consideration. Strengths include the relatively large sample size (n=61) spanning a wide age range (17–84 years), use of standardized cell culture conditions, and comprehensive multivariate statistical approaches accounting for both sex and age effects. The public availability of data enhances transparency and reproducibility.
Limitations include the cross-sectional design, which cannot distinguish age-related changes from cohort effects or establish temporal causality. The predominance of female donors (73.8%) may limit statistical power for sex-specific analyses. Gene expression analysis was performed on cultured MSCs at early passages, which may not fully recapitulate in vivo aged MSC characteristics. Furthermore, mRNA expression levels do not necessarily correlate with protein abundance or functional activity; proteomic and functional studies would provide complementary insights.
The dataset used Affymetrix microarrays rather than RNA sequencing, which offers lower dynamic range and does not capture transcript isoform variation. Future studies employing RNA-seq and single-cell technologies would provide higher resolution insights.
4.7. Future Directions
Several research directions emerge from this work:
- Functional Studies: Investigate whether F13A1 overexpression or knockdown affects MSC proliferation, differentiation, matrix interactions, or therapeutic potency.
- Protein Validation: Confirm age-related changes at the protein level using Western blotting, ELISA, or mass spectrometry approaches.
- Longitudinal Studies: Examine F13A1 expression changes within individuals over time to distinguish aging effects from inter-individual variation.
- Mechanistic Investigation: Elucidate transcriptional regulators and signaling pathways mediating age-related F13A1 upregulation.
- Tissue-Specific Analysis: Determine whether similar age-related patterns occur in MSCs from other tissue sources (adipose, umbilical cord) or in other cell types.
- Clinical Translation: Assess whether F13A1 expression levels predict clinical outcomes in MSC-based therapies.
5. Conclusion
This comprehensive multivariate analysis demonstrates that F13A1 gene expression exhibits a statistically significant positive correlation with chronological age in human bone marrow-derived mesenchymal stromal cells. This age-related upregulation occurs independently of biological sex and shows progressive increases across age decades. Age alone explains approximately 18.7% of variance in F13A1 expression levels, with neither sex nor age-sex interactions contributing additional explanatory power.
These findings contribute to our understanding of molecular aging signatures in therapeutically relevant stem cell populations and identify F13A1 as a potential biomarker for MSC aging. Further research is needed to elucidate the functional consequences of age-related F13A1 upregulation and to determine its relevance for MSC-based regenerative medicine applications. Understanding the molecular aging process in MSCs, including changes in genes such as F13A1, is essential for optimizing cell therapy strategies in elderly populations where regenerative interventions may be most needed.
Conflicts of Interest
The authors declare no competing interests.
References
- López-Otín C, Blasco MA, Partridge L, Serrano M, Kroemer G. The hallmarks of aging. Cell. 2013;153(6):1194–1217. [CrossRef]
- Kennedy BK, Berger SL, Brunet A, et al. Geroscience: linking aging to chronic disease. Cell. 2014;159(4):709–713. [CrossRef]
- Caplan AI. Mesenchymal stem cells: time to change the name! Stem Cells Transl Med. 2017;6(6):1445–1451. [CrossRef]
- Stolzing A, Jones E, McGonagle D, Scutt A. Age-related changes in human bone marrow-derived mesenchymal stem cells: consequences for cell therapies. Mech Ageing Dev. 2008;129(3):163–173. [CrossRef]
- Alves H, van Ginkel J, Groen N, et al. A mesenchymal stromal cell gene signature for donor age. PLoS One. 2012;7(8):e42908. [CrossRef]
- Board PG, Webb GC, McKee J, Ichinose A. Localization of the coagulation factor XIII A subunit gene (F13A) to chromosome bands 6p24→p25. Cytogenet Cell Genet. 1988;48(1):25–27. [CrossRef]
- Hethershaw EL, Cilia La Corte AL, Duval C, et al. The effect of blood coagulation factor XIII on fibrin clot structure and fibrinolysis. J Thromb Haemost. 2014;12(2):197–205. [CrossRef]
- Franceschi C, Capri M, Monti D, et al. Inflammaging and anti-inflammaging: a systemic perspective on aging and longevity emerged from studies in humans. Mech Ageing Dev. 2007;128(1):92–105. [CrossRef]
- Austad SN, Fischer KE. Sex differences in lifespan. Cell Metab. 2016;23(6):1022–1033. [CrossRef]
- Geissler S, Textor M, Kühnisch J, et al. Functional comparison of chronological and in vitro aging: differential role of the cytoskeleton and mitochondria in mesenchymal stromal cells. PLoS One. 2012;7(12):e52700. [CrossRef]
- Carvalho MS, Alves L, Bogalho I, Cabral JMS, da Silva CL. Impact of donor age on the osteogenic supportive capacity of mesenchymal stromal cell-derived extracellular matrix. Front Cell Dev Biol. 2021;9:747521. [CrossRef]
- Levy JH, Greenberg C. Biology of Factor XIII and clinical manifestations of Factor XIII deficiency. Transfusion. 2013;53(5):1120–1131. [CrossRef]
- Biswas A, Ivaskevicius V, Seitz R, Thomas A, Oldenburg J. An update of the mutation profile of Factor 13 A and B genes. Blood Rev. 2011;25(5):193–204. [CrossRef]
Figure 1.
Linear regression analysis of F13A1 expression and donor age. Scatter plot showing F13A1 gene expression (log2-normalized) as a function of donor age in human bone marrow-derived MSCs. Female donors (n=45) are shown in red circles, male donors (n=16) in blue squares. The black line represents the linear regression fit (F13A1 = 0.0256 × Age + 6.788), with gray shading indicating the 95% confidence interval. Pearson correlation coefficient r = 0.433, R2 = 0.187,
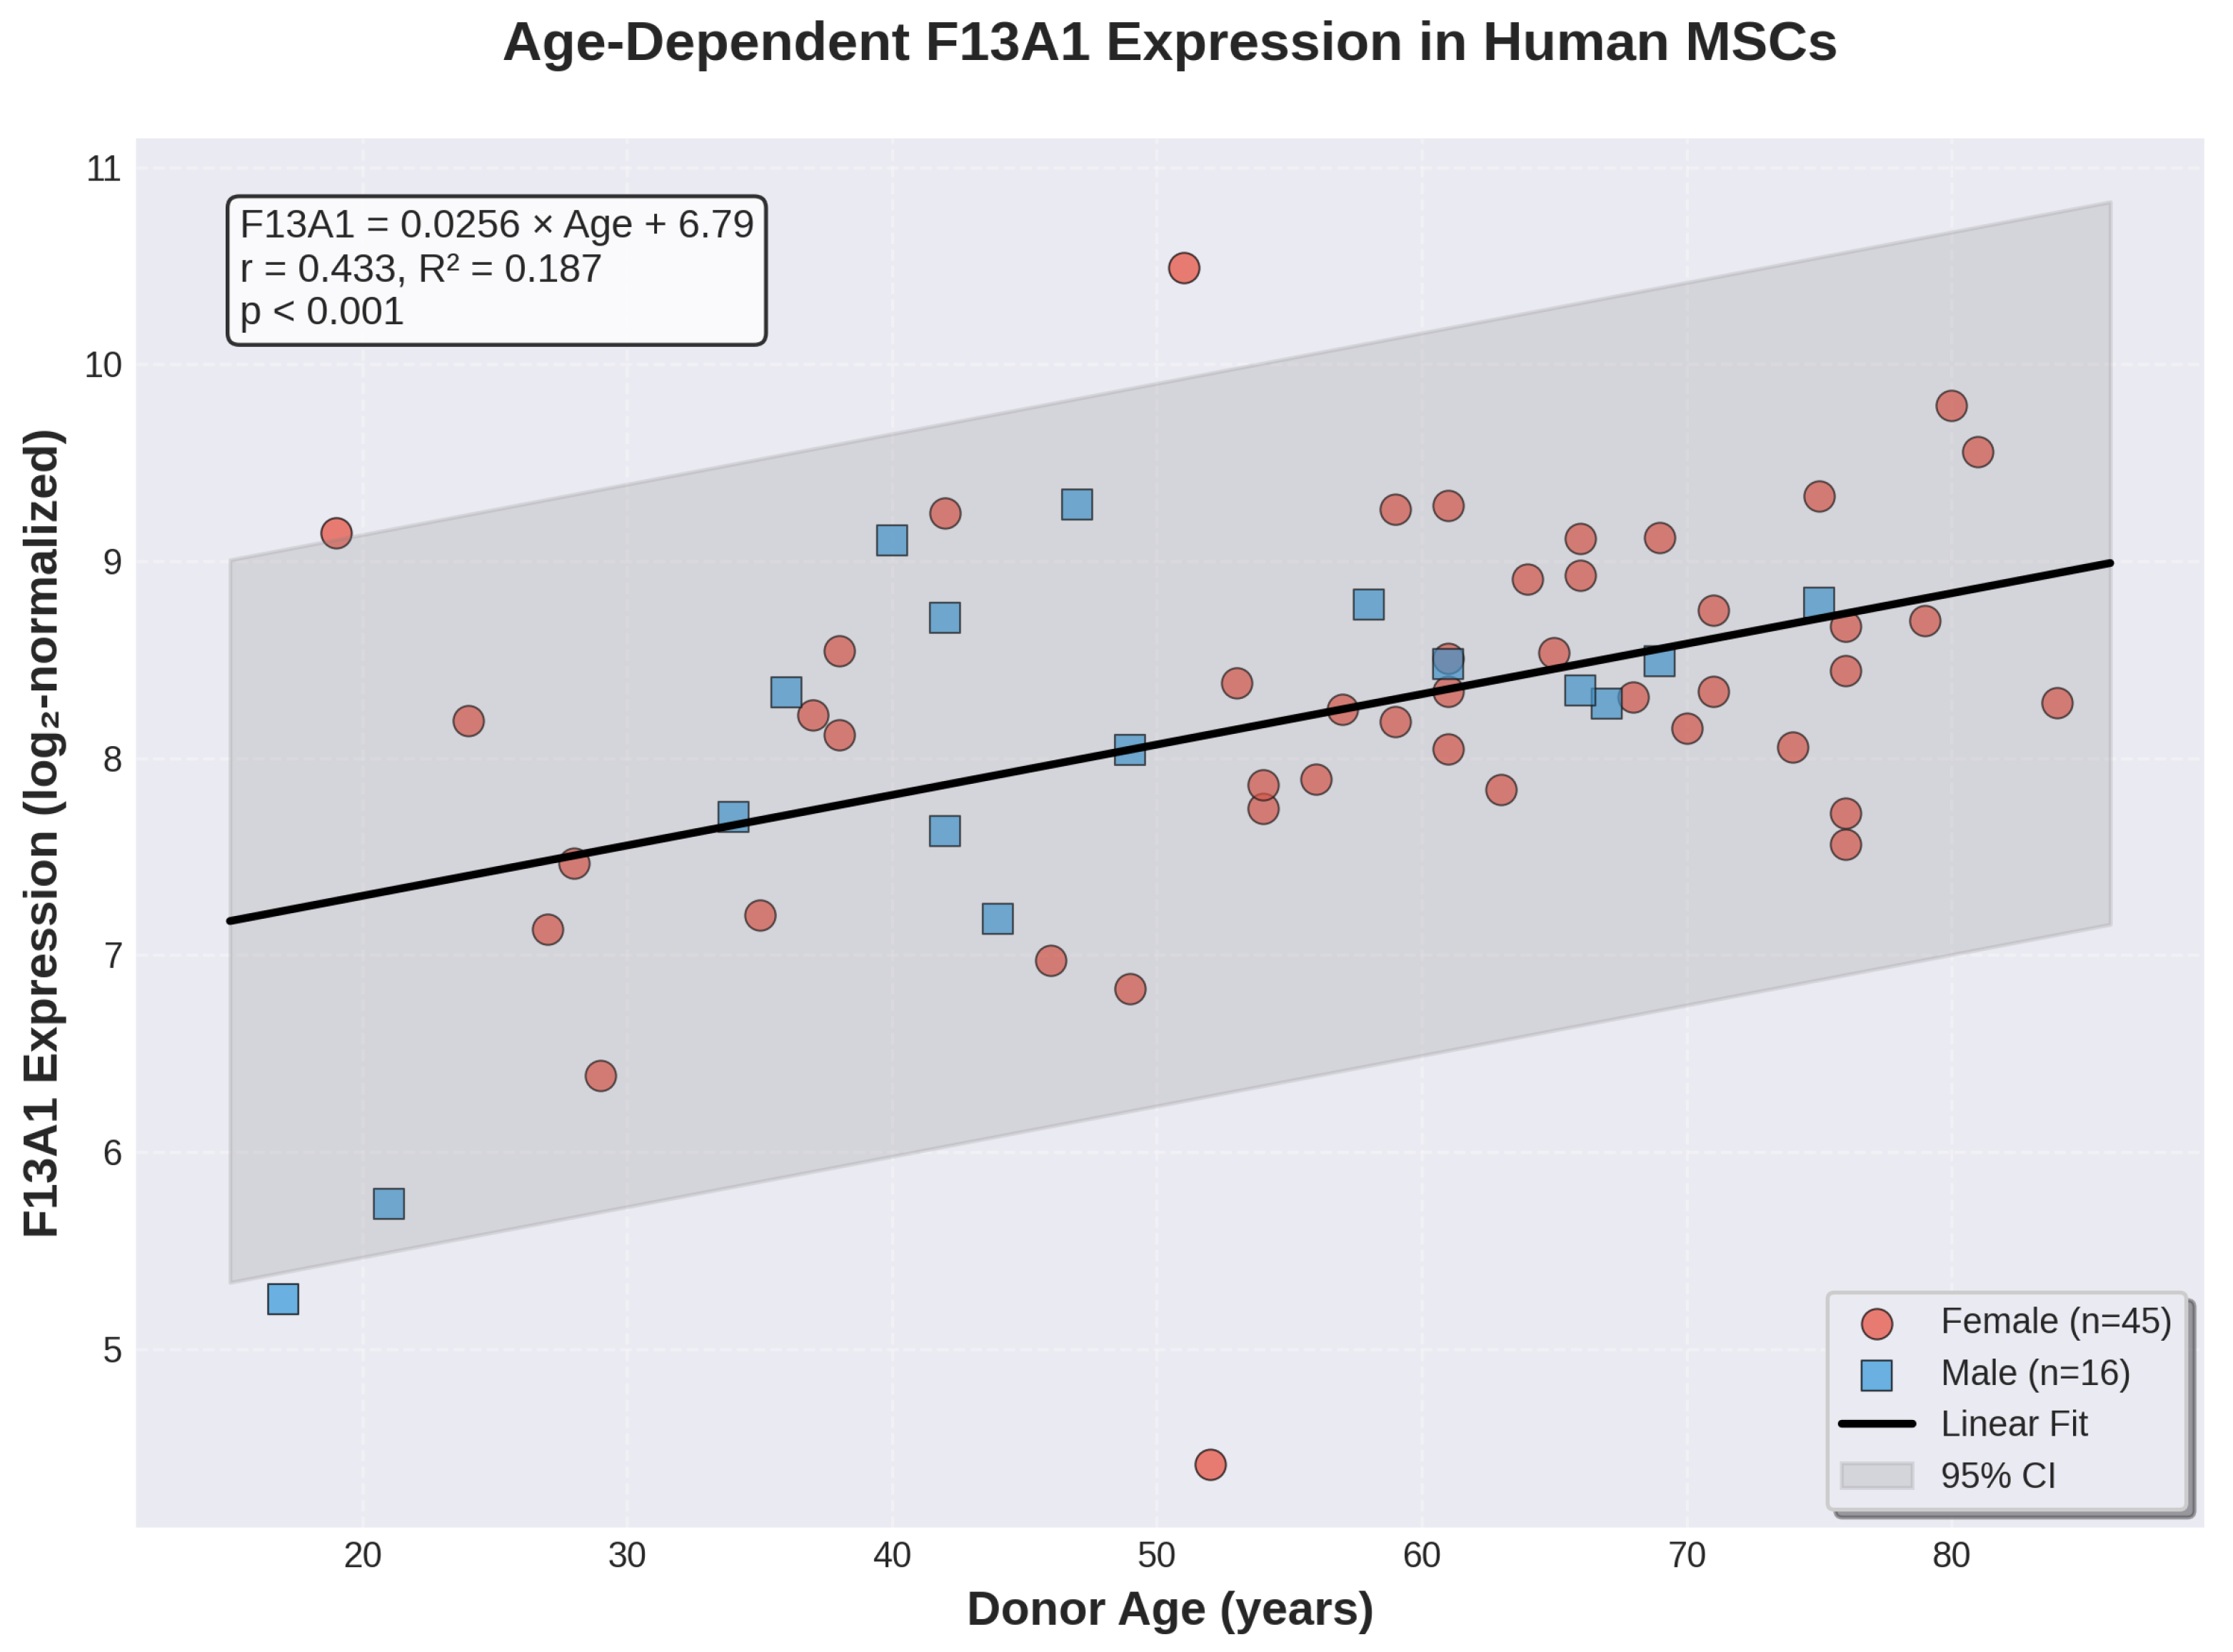
Figure 3.
Box plot comparisons of F13A1 expression by age group and sex. (A) F13A1 expression levels across four age groups showing progressive increase with age (one-way ANOVA, p = 0.005). Box plots display median (horizontal line), interquartile range (box), whiskers (1.5×IQR), mean (red diamond), and individual data points (black dots with jitter). (B) F13A1 expression comparison between female and male donors showing no significant difference (t-test, p = 0.385, n.s. = not significant).
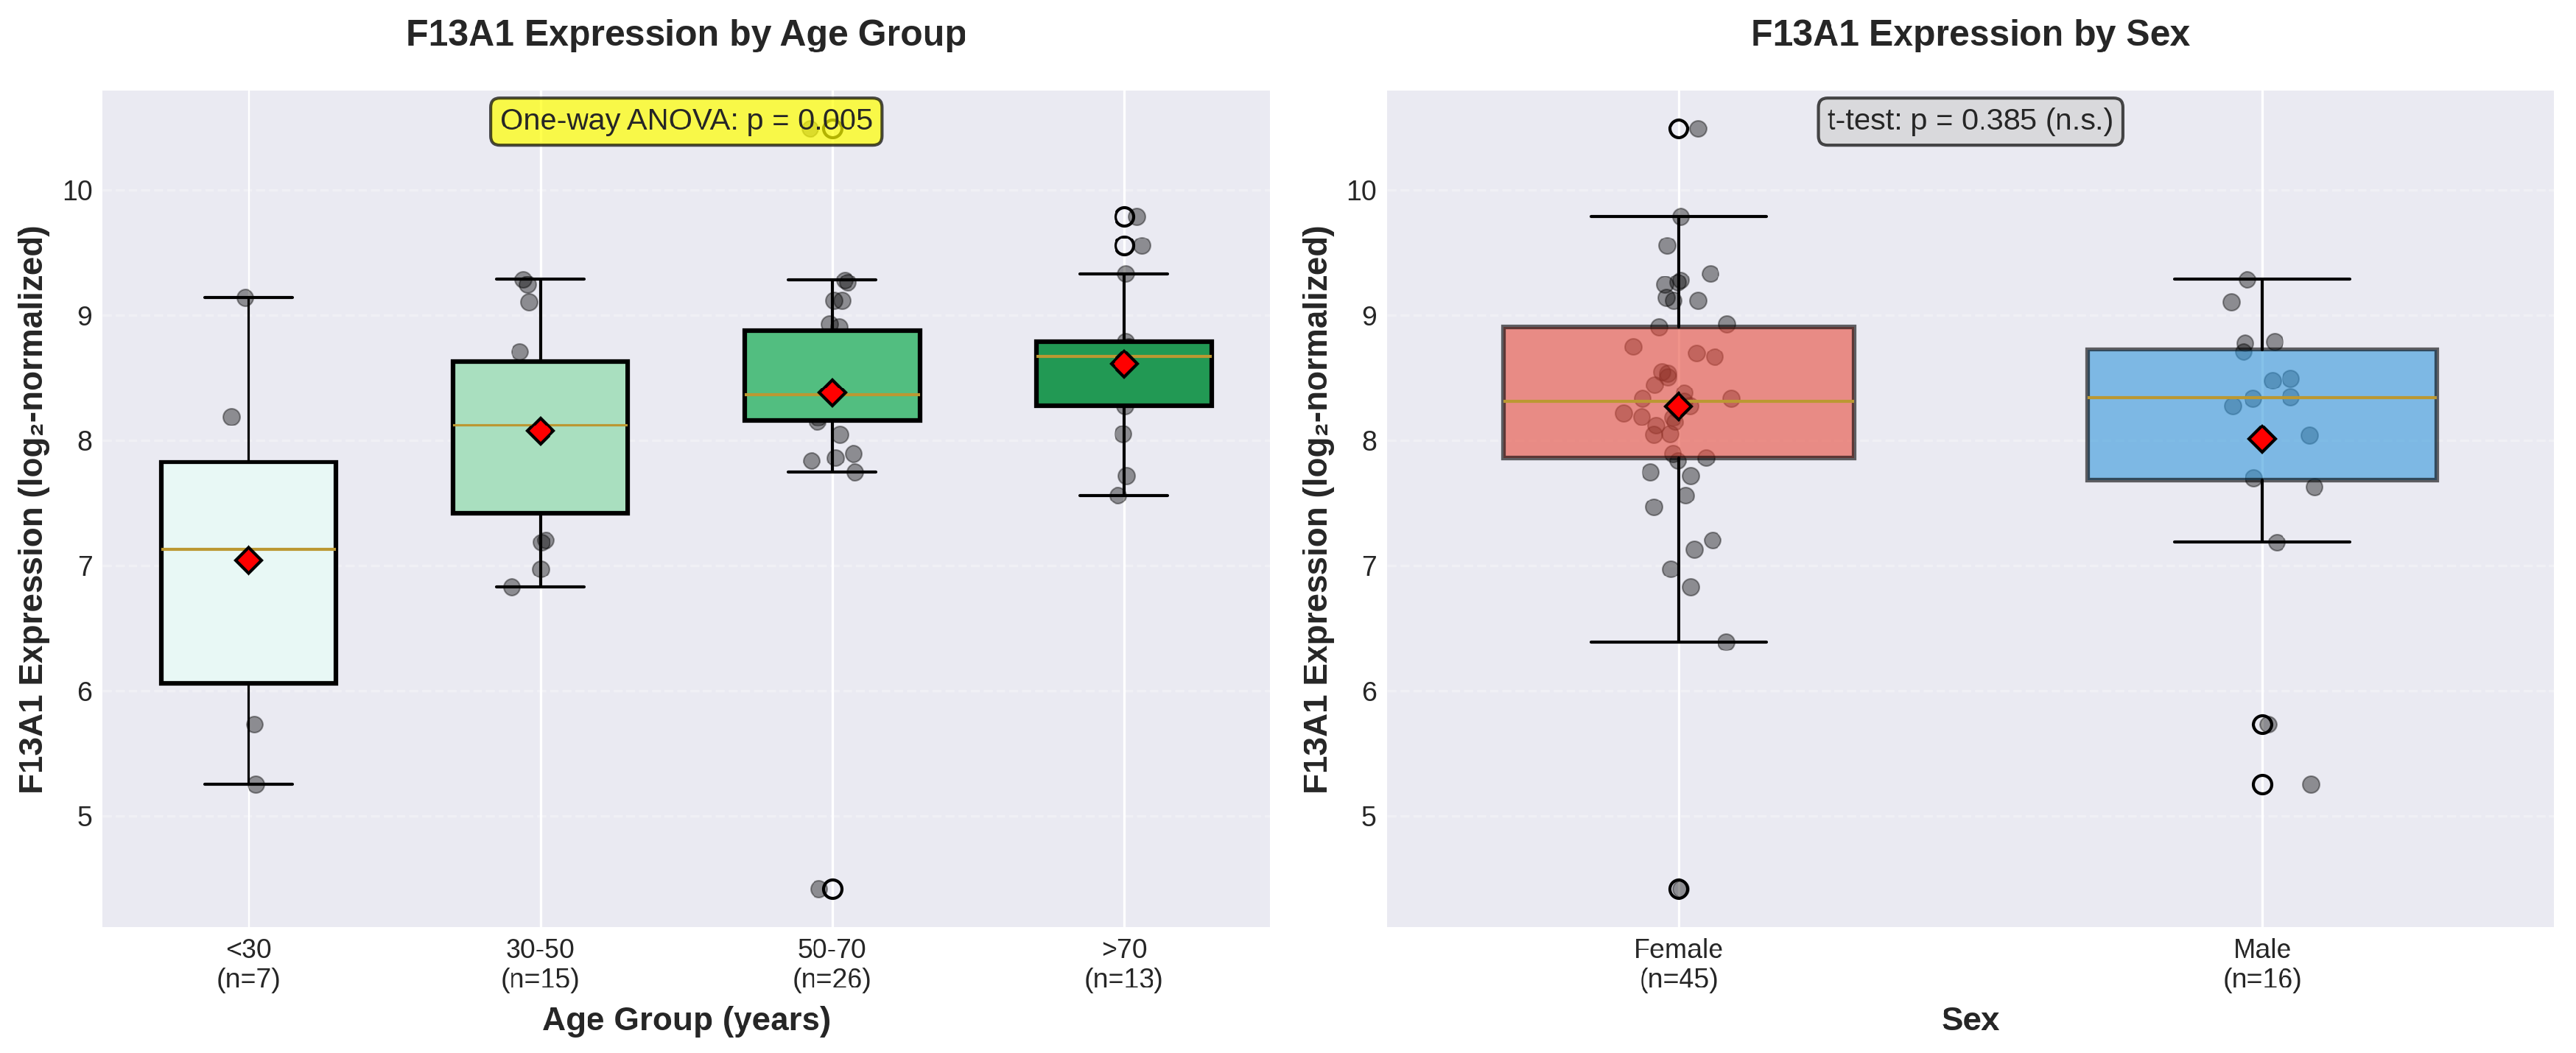
Figure 4.
Regression diagnostic plots for the multivariate model. (A) Residuals vs. fitted values showing random scatter around zero, indicating homoscedasticity. (B) Normal Q-Q plot demonstrating approximate normality of residuals despite Shapiro-Wilk test significance (W = 0.939, p = 0.005). (C) Scale-location plot showing relatively constant variance across fitted values. (D) Histogram of residuals with Shapiro-Wilk test results, approximating normal distribution.
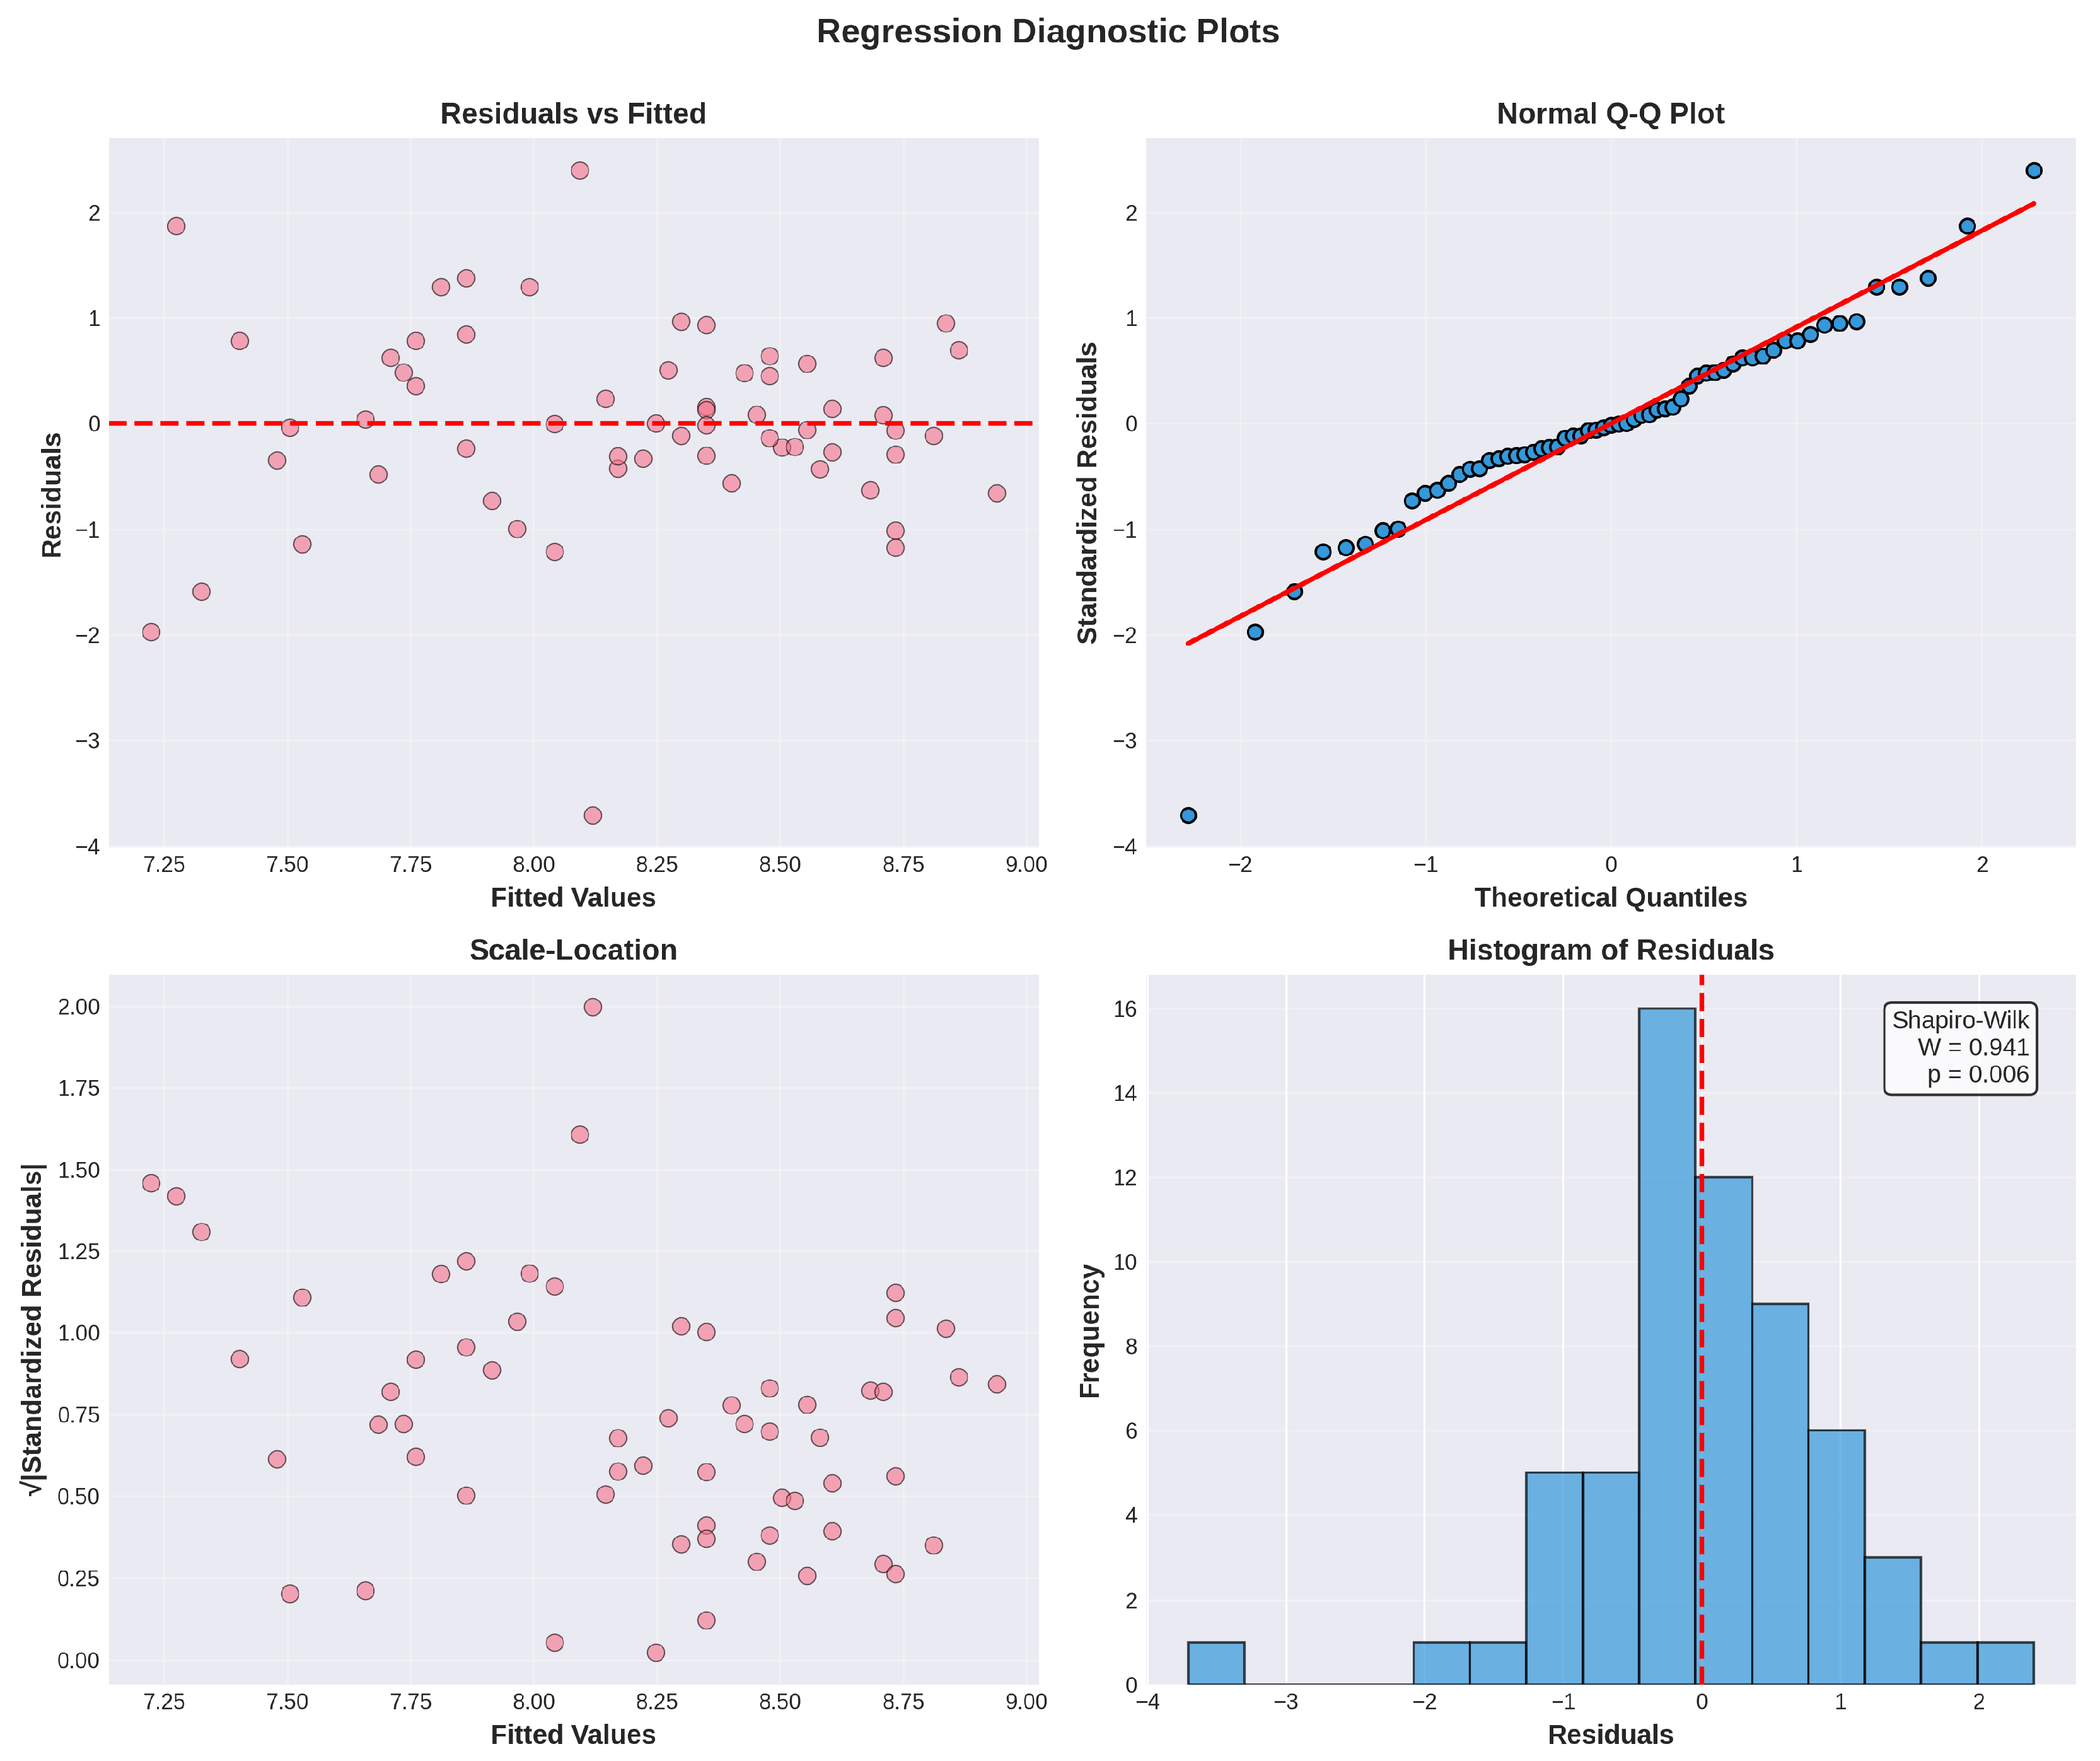
Figure 6.
Distribution analysis of F13A1 expression using violin plots. (A) Violin plots showing the full distribution of F13A1 expression across age groups, revealing progressive increases with age. The violin width represents the probability density, with wider sections indicating higher frequency of values. Individual data points (black dots), medians (horizontal lines), and means (shown by connecting lines) are overlaid. (B) Sex comparison showing substantial overlap in expression distributions between female and male donors, consistent with the non-significant t-test result.
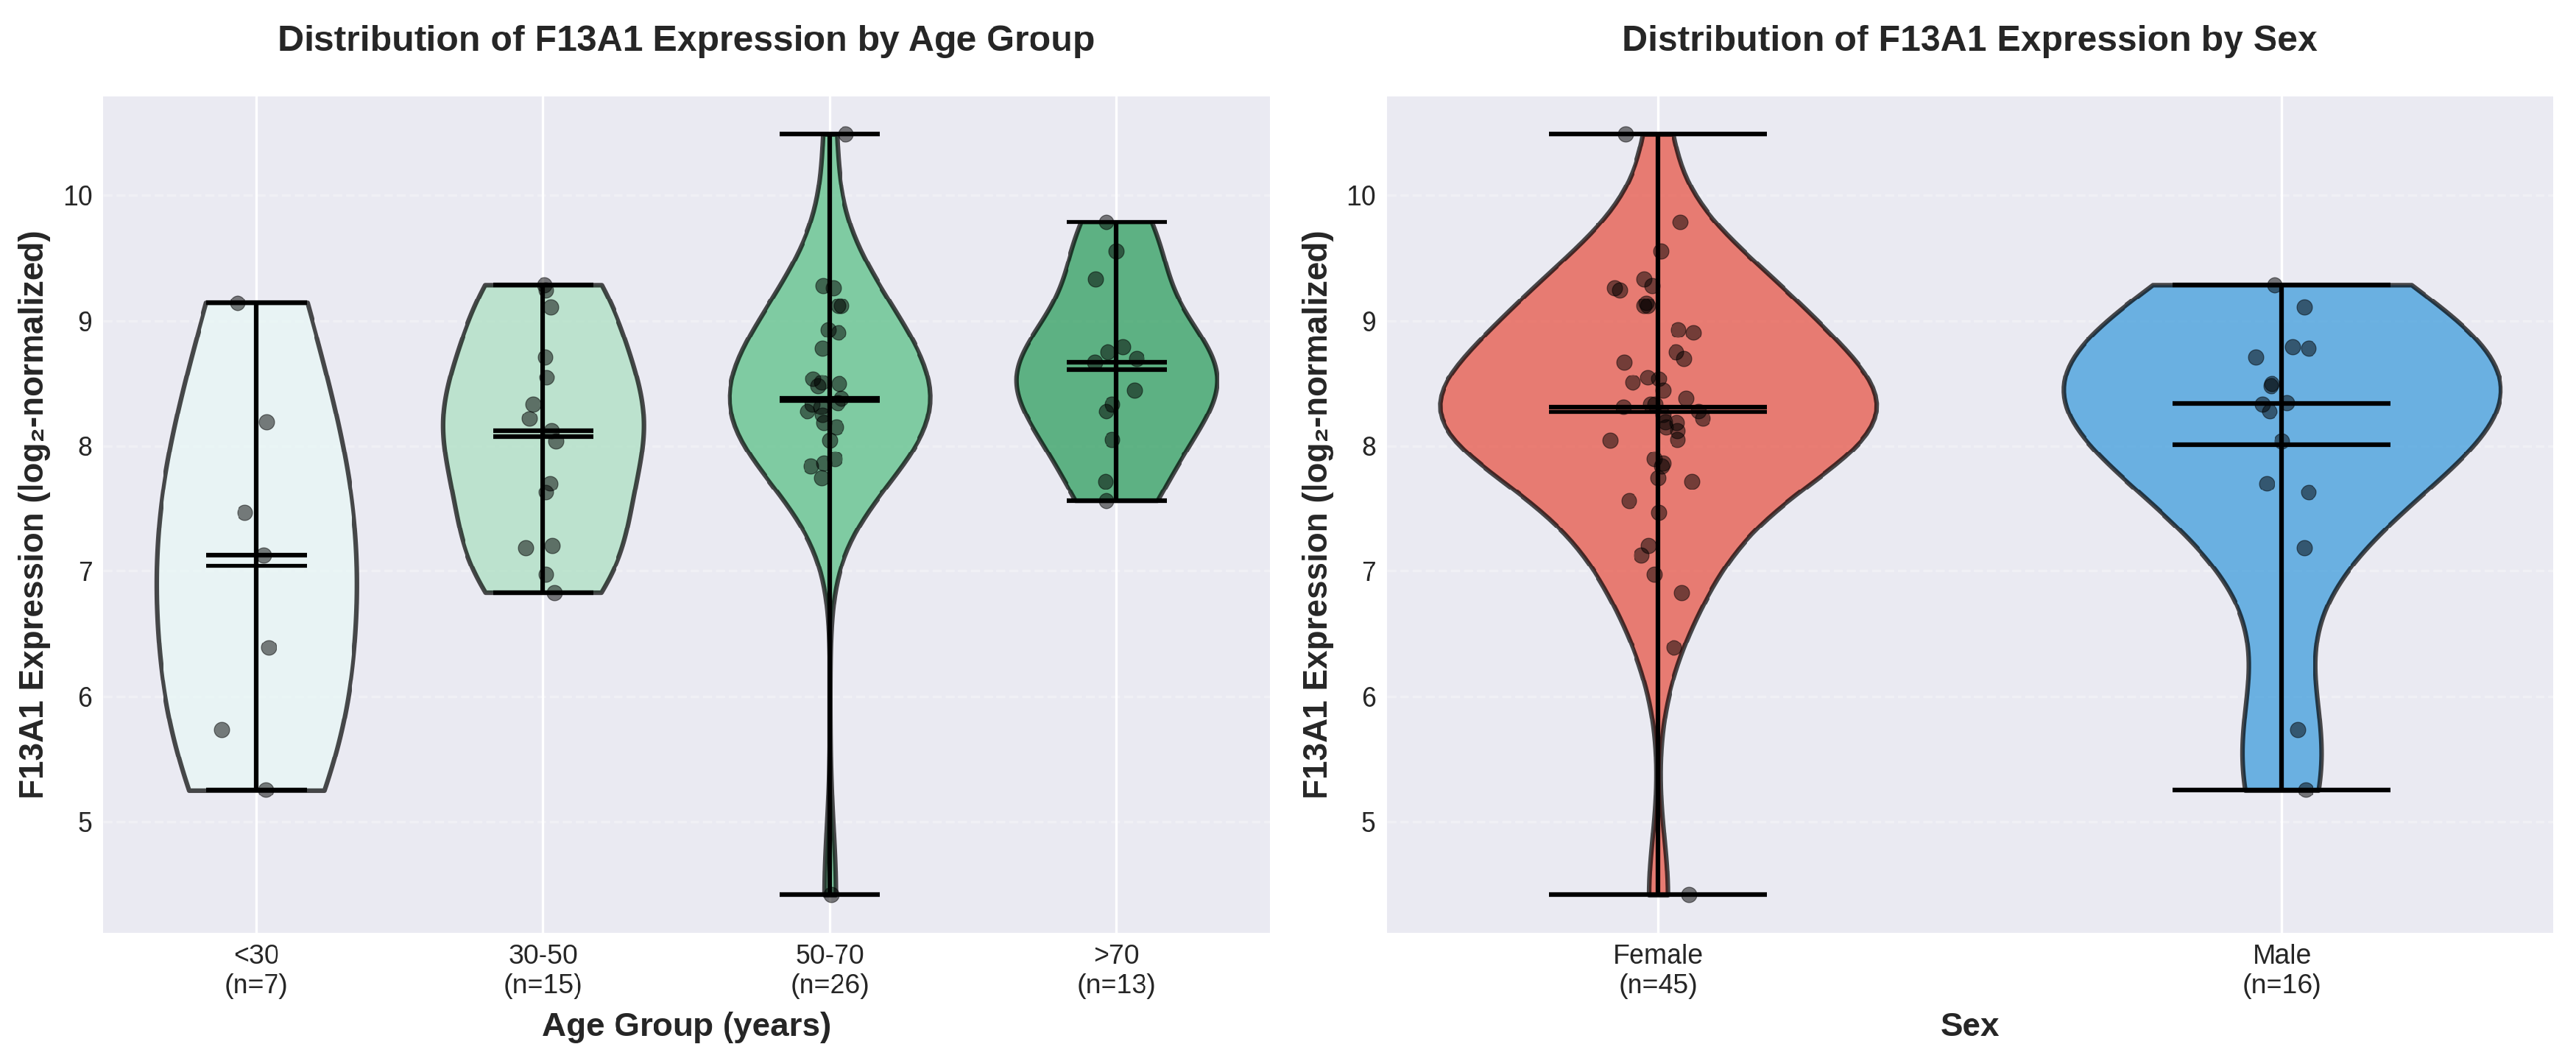
Table 1.
Descriptive Statistics of Study Cohort and F13A1 Expression.
| Variable | All (N=61) | Female (n=45) | Male (n=16) |
|---|---|---|---|
| Age (years) | |||
| Mean ± SD | 55.2 ± 17.4 | 57.8 ± 17.0 | 48.0 ± 16.9 |
| Median | 59.0 | 61.0 | 44.0 |
| Range | 17–84 | 19–84 | 17–75 |
| F13A1 Expression (log2-normalized) | |||
| Mean ± SD | 8.202 ± 1.030 | 8.271 ± 0.998 | 8.008 ± 1.125 |
| Median | 8.332 | 8.336 | 8.315 |
| Range | 4.414–10.491 | 4.414–10.491 | 5.251–9.287 |
Table 2.
Multivariate Regression Models Predicting F13A1 Expression.
| Model | R2 | Adj. R2 | F-statistic | p-value |
|---|---|---|---|---|
| Model 1: Age only | 0.187 | 0.174 | 13.59 | |
| Model 2: Age + Sex | 0.187 | 0.159 | 6.68 | 0.002 |
| Model 3: Age + Sex + Age×Sex | 0.223 | 0.182 | 5.44 | 0.002 |
Table 4.
F13A1 Expression by Age Group.
| Age Group | n | Mean ± SD | Range |
|---|---|---|---|
| <30 years | 7 | 7.043 ± 1.370 | 5.251–9.143 |
| 30–50 years | 15 | 8.075 ± 0.813 | 6.390–9.287 |
| 50–70 years | 26 | 8.382 ± 1.002 | 4.414–10.491 |
| >70 years | 13 | 8.613 ± 0.663 | 7.719–9.789 |
Disclaimer/Publisher’s Note: The statements, opinions and data contained in all publications are solely those of the individual author(s) and contributor(s) and not of MDPI and/or the editor(s). MDPI and/or the editor(s) disclaim responsibility for any injury to people or property resulting from any ideas, methods, instructions or products referred to in the content. |
© 2025 by the authors. Licensee MDPI, Basel, Switzerland. This article is an open access article distributed under the terms and conditions of the Creative Commons Attribution (CC BY) license (http://creativecommons.org/licenses/by/4.0/).
Copyright: This open access article is published under a Creative Commons CC BY 4.0 license, which permit the free download, distribution, and reuse, provided that the author and preprint are cited in any reuse.


