Submitted:
27 November 2025
Posted:
02 December 2025
You are already at the latest version
Abstract
Silver nanoparticles (AgNPs) are promising agents for nanomedicine but their interactions with lipid membranes, which are a key interface for drug delivery, require deeper understanding. This study investigates the influence of fructose-capped AgNPs on the physicochemical properties of SOPC-based liposomal bilayers, with implications for drug delivery and photothermal therapy. We employed a multi-technique approach, including infrared (IR) spectroscopy, differential scanning calorimetry (DSC), thermally induced shape fluctuation analysis, and laser irradiation at 343, 515, and 1030nm. Our results show that AgNPs incorporated into the bilayer are causing measurable perturbations: DSC revealed a decrease in the main phase transition enthalpy (from 0.280 to 0.234 J/g) and temperature (from 2.80 to 3.41 °C) while shape fluctuation analysis indicated a reduction in bending modulus (from 1.18 × 10⁻¹⁹ J to 0.93 × 10⁻¹⁹ J), confirming increased membrane fluidity. FTIR confirmed interactions of fructose-capped nanoparticles and lipid’s carbonyl and phosphate groups. Furthermore, the AgNPs-liposomes exhibited a strong, wavelength- dependent photothermal response with a temperature increase ≈22 °C under 515 nm laser irradiation, compared to only 3–5 °C at 1030nm. We concluded that fructose-capped-AgNPs moderately fludify lipid bilayers while enabling efficient, controllable photothermal capability, making them excellent candidates for designing advanced liposomal systems for combined therapy and diagnostic.
Keywords:
silver nanoparticles
; drug delivery
; photothermal therapy
; nanoparticle-membrane interactions
; infrared (IR) spectroscopy
; phase transition
; elastic properties
; laser irradiation
1. Introduction
Silver has a long-standing history in biomedicine because of its broad-spectrum antimi- crobial and antifungal properties. Even before the nanoscale era, bulk silver was employed to treat infections, burns, and wounds. At the nanoscale, silver nanoparticles (AgNPs) inherit and greatly amplify these attributes: AgNPs typically measure below 100 nm and contain thousands of silver atoms, giving them extremely high surface area-to-volume ratios and distinct size-dependent physicochemical characteristics [1]. These unique prop- erties (optical, thermal, and chemical) differ markedly from bulk silver and make AgNPs especially attractive in nanomedicine. However, we highlight the importance of AgNPs in generating reactive species that disrupt microbial membranes and metabolic processes, demonstrating their potent antibacterial/antifungal actions. The current focus on the nature of AgNPs is in cancer diagnostics and therapy: they can serve as cytotoxic or drug carrier agents against tumors. In fact, AgNPs have been shown to exert dose-dependent cytotoxicity in cancer cells while enabling enhanced drug delivery precision. Crucially, these nanoparticles exhibit surface plasmon resonance in the visible–near-IR range that can be tuned by size and shape, enabling efficient absorption of near-infrared (NIR) light and converting it to heat. This plasmonic heating under NIR irradiation is the physical basis of photothermal therapy (PTT) with metallic NPs. Thus, the combination of inherent bioactivity, high surface reactivity, and strong tunable optical absorption makes AgNPs highly beneficial for advanced drug delivery and photothermal applications in cancer treatment.
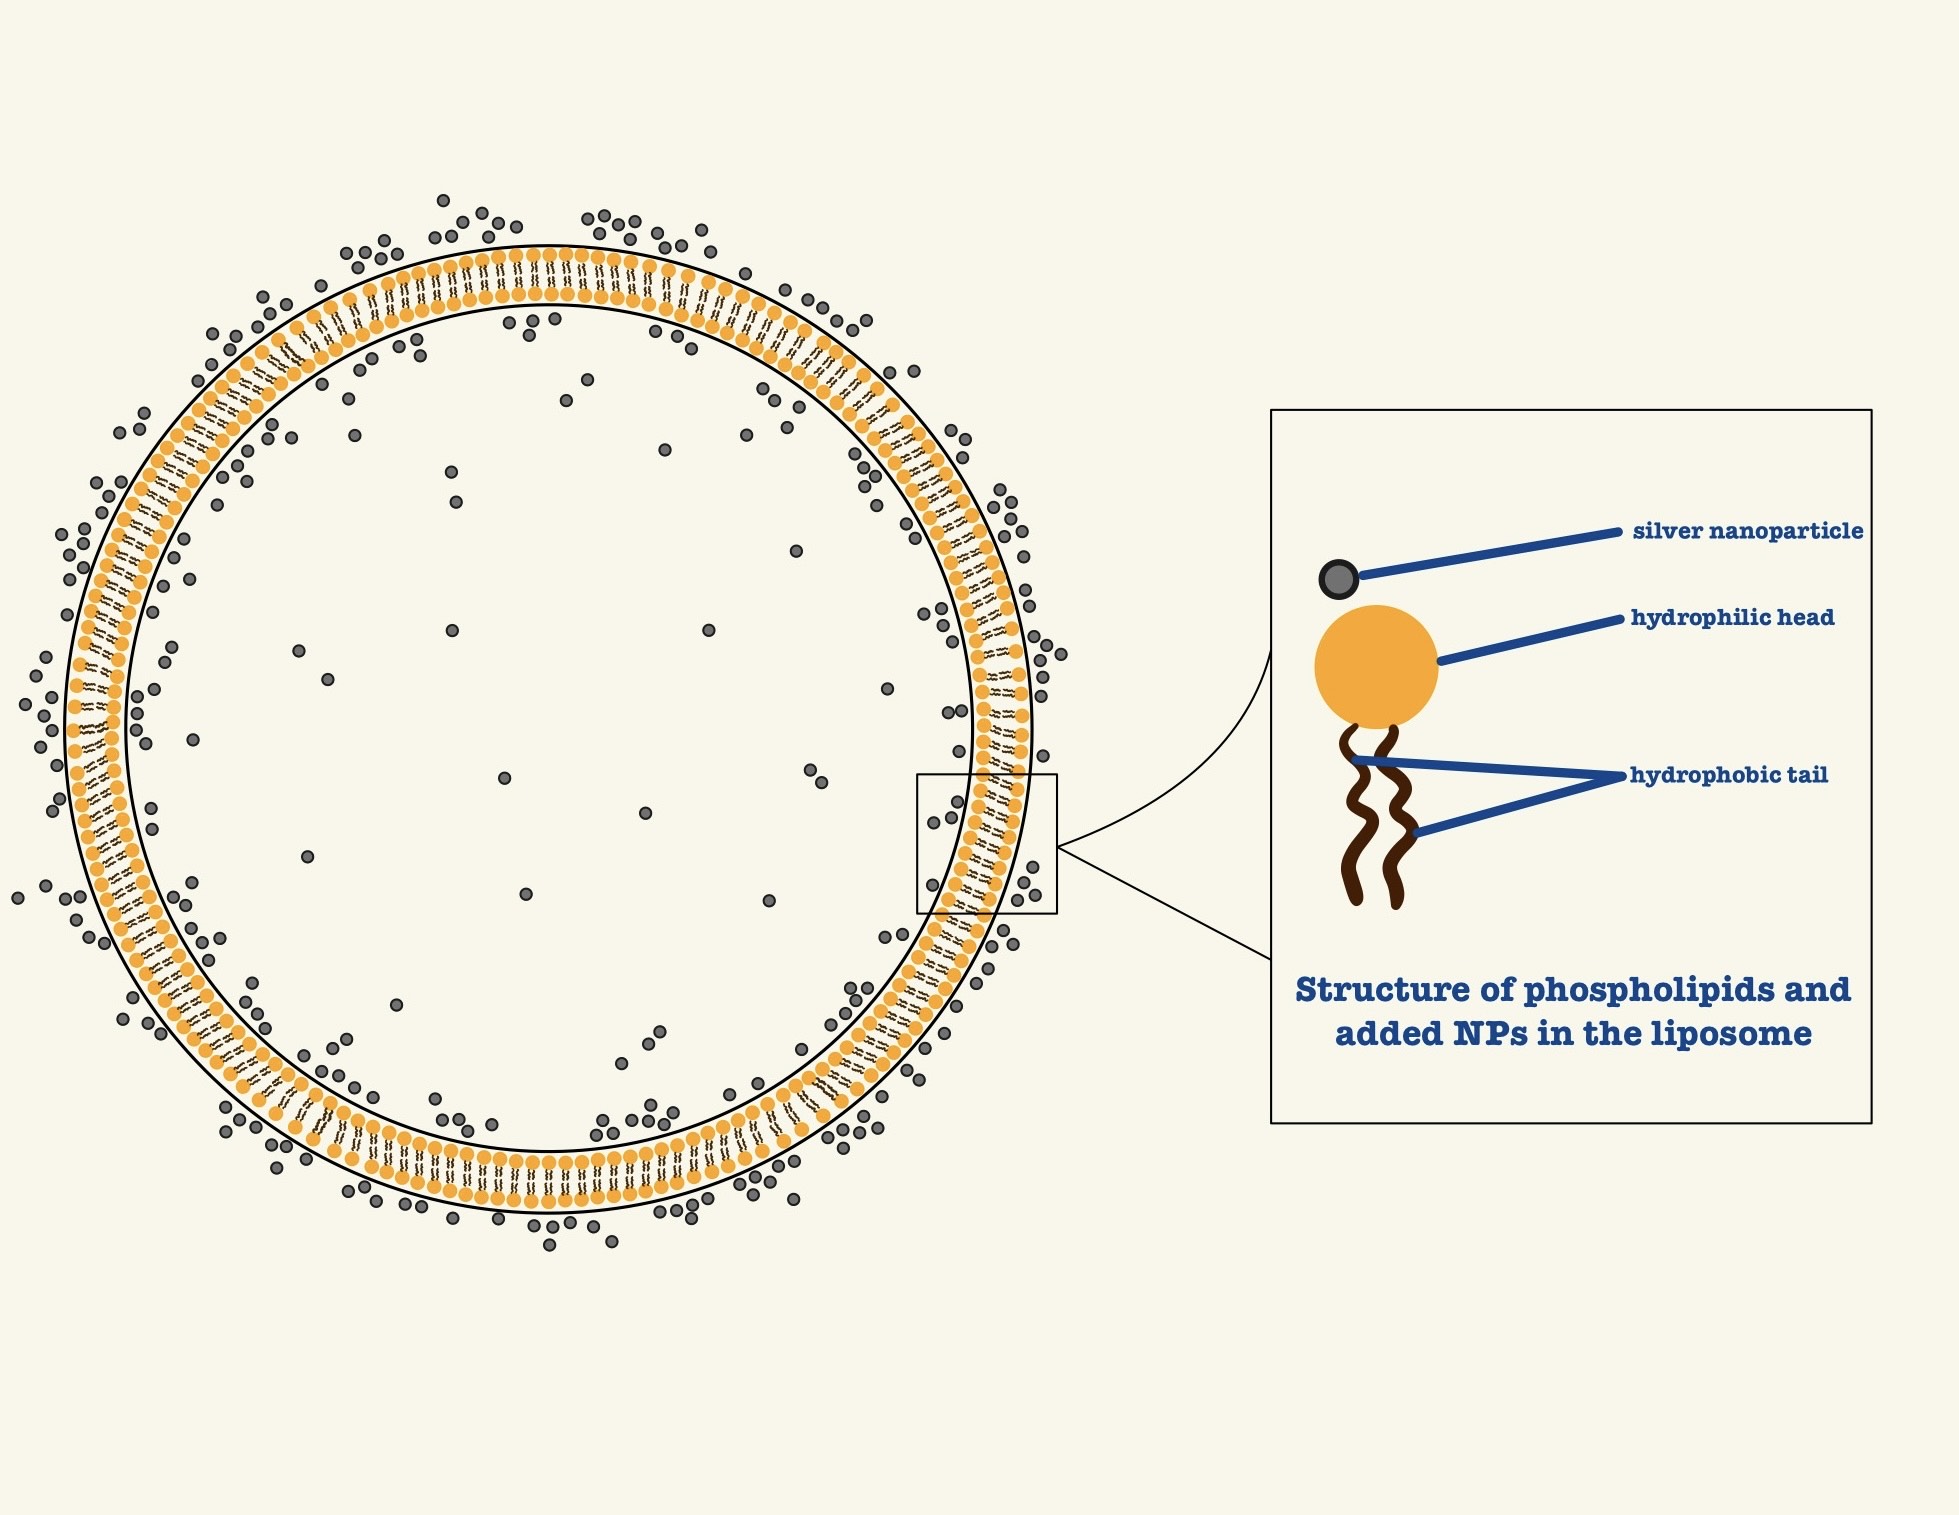
Parallel to the development of metallic NPs, liposomes have emerged as cornerstone of nanomedicine for drug delivery [2]. These biocompatible, self-assembled phospholipid bilayers mimic the structural characteristics of biological membranes and can encapsulate a wide range of therapeutic agents – both hydrophilic and hydrophobic. Liposomal formulations offer critical advantages, such as improved drug solubility, reduced systemic toxicity, extended systemic circulation, and the ability to be functionalized for controlled or triggered release [3,4]. For fundamental studies, well-defined phospholipids like SOPC (1- stearoyl-2-oleoyl-sn-glycero-3-phosphocholine) are ideal, as they form fluid, stable bilayers at physiological temperature resemble mammalian cell membrane. The integration of AgNPs with liposomal carriers present a compelling strategy to create multifunctional platforms that combine the diagnostic and photothermal capabilities of AgNPs with the superior drug-delivery properties of liposomes. However, while both (liposomes and AgNPs) have been widely studied independently, the fundamental interactions between AgNPs and lipid bilayers remains poorly understood. Critical questions regarding how AgNPs influence membrane fluidity, structural integrity, and phase behaviour must be answered to enable rational design.
This study therefore investigates the physicochemical effects of fructose-capped Ag- NPs on SOPC-based liposomal membranes. We focus specifically on elucidating changes in bilayer elasticity, structure, and phase behavior. By probing these fundamental nanoparticle- membrane interactions in a controlled model system, this work provides the necessary foundation for the rational development of advanced, combined-modality nanotheraupet- ics that leverage simultaneous drug delivery and photothermal intervention.
2. Materials and Methods
2.1. Materials Sample Preparation
1-stearoyl-2-oleoyl-sn-glycero-3-phosphocholine (SOPC) was purchased from Avanti Polar Lipids, Inc., (Alabama, USA). Chloroform (purity of 99%) was obtained from Sigma- Aldrich and Merck (Merck KGaA, Darmstadt, Germany). All chemicals were used without further purification. The structural formula of the lipid used in the studies is given in Figure 1.
Fructose-capped silver nanoparticles (AgNPs) were synthesized as previously de- scribed, with slight modifications [5]; their spherical morphology and a thin fructose
capping layer (≈ 2–3 nm) were confirmed by transmission electron microscopy (TEM, Figure 2).
2.2. Sample Preparation
2.2.1. Liposome Preparation for DSC and FTIR Spectroscopy
For both DSC and FTIR spectroscopy, samples were prepared using the same protocol as follows. SOPC was dissolved in chloroform to a concentration of 10 mg/ml. For each sample, an aliquot containing 1 mg SOPC was poured into a vial, and the solvent was evaporated under vacuum for 4 hrs to form an uniform lipid film. The dried film was hydrated with 100 µL of an aqueous solution containing double-distilled water and AgNPs to achieve final AgNP concentrations of 0, 0.5, 1.0, and 2.5 wt%. Finally, the samples were incubated in an ultrasonic bath at 35 °C for 8 h to form multilamellar vesicles.
2.2.2. Preparation of Giant Unilamellar Vesicles (GUVs) for Shape Fluctuation Analysis Giant unilamellar Vesicles (GUVs, Diameter Approx. 20–40 µm) Were Prepared Using
a modified electroformation method to ensure consistency, using the same lipid/AgNP solutions as for the spectroscopic and calorimetric studies. The electroforming chamber consisted of two indium tin oxide (ITO) coated glass slides (layer thickness 100 ± 20 nm, resistivity approx. 100 Ω/square) separated by a PDMS spacer. For each AgNP concentration, freshly prepared solutions were deposited as multiple small droplets on the conducting surfaces of the slides and dried under vacuum for about 4 h to allow complete solvent removal. The chamber was then filled with double-distilled water and silver nanoparticles of the following concentrations: 1% and 2.5%, and connected overnight to a generator supplying a sinusoidal alternating voltage of 1.5 Vpp at 10 Hz. This procedure ensured the successful formation of GUVs with AgNPs embedded in the hydrophobic region of the lipid bilayer.
2.3. Infrared (IR) Spectroscopy
Infrared spectroscopy is a powerful analytical method that provides valuable molecu- lar and structural information for a wide range of inorganic compounds, organic molecules, and biomolecular systems. Vibrational spectroscopy can identify the components of mixture and reveal structural changes resulting from molecular interactions or chemical transfor- mations. These capabilities have made it especially useful in investigating conformational changes in lipid bilayers and membranes [6,7,8].
The attenuated total reflectance (ATR) IR spectra were acquired on a Bruker Invenio R spectrometer, equipped with a diamond crystal Pike Technology ATR accessory. The samples were studied in liquid state by directly depositing several drops on the diamond surface. The spectra were recorded in the frequency region 4000–600 cm−1 with 200 scans at a resolution of 2 cm−1, with water as background. The spectra were baseline-corrected and smoothed at 17 smoothing points.
2.4. Differential Scanning Calorimetry (DSC)
DSC is a thermoanalytical technique that measures the difference in heat flow between a sample and a reference as their temperature increases at a controlled rate [9,10]. When the sample undergoes a phase transition, additional heat is either absorbed (endothermic) or released (exothermic), which is recorded as a peak in the DSC thermogram. This method allows for determination of key thermodynamic properties such as the change in enthalpy, entropy, and heat capacity associated during phase transitions.
In this study, DSC measurements were performed using a DSC Discovery 250 instru- ment (TA Instruments, New Castle, USA). Precisely weighed sample portions (typically between 15 and 30 mg) were placed in standard aluminum pans, hermetically sealed, and measured against empty reference pan under identical conditions. The temperature protocol included an initial heating, followed by cooling and a final heating (further details in the following section) from –10 °C to 70 °C, with a scan rate of 5 °C/min.
For DSC data processing and analysis, a custom C++ program was developed as part of a course thesis and was used to automatically calculate the heating and cooling enthalpies of the AgNP-containing and control SOPC samples.
2.5. Thermally Induced Shape Fluctuation Method
One common and effective approach for quantifying the bending elasticity of lipid bilayers is thermally induced shape fluctuation analysis [11,12,13]. This technique is used to estimate how the mechanical properties of SOPC lipid bilayers are influenced by NPs. Spontaneous, thermally driven undulations of giant unilamellar vesicles are recorded via phase-contrast microscopy. Their contour fluctuations are then analyzed using spherical harmonic decomposition, and the bending modulus is extracted by fitting fluctuation spectra to the Milner-Safran theoretical model. Stroboscopic illumination is provided by a xenon flash lamp to capture clear picture of the vesicles. To prevent eye irritation caused by direct exposure sample positioning and stability were monitored indirectly via a video display. The xenon flash lamp’s pulsed light ensures that flicker is eliminated, allowing for stable, high-quality frames for subsequent quantitative analysis. [14,15].
For the analysis, equatorial cross-sections of GUVs are recorded, usually capturing 400 images per second and the mean diameter is measured in 256 directions along the vesicle’s radius. These images are then decomposed into harmonic functions. This non- invasive technique is highly sensitive to chemical or structural perturbations, including the presence of nanoparticles or bilayer compositions, allowing researchers to assess changes in mechanical properties due to such interactions [16,17,18].
Fluctuating giant vesicles were imaged using a Zeiss Axiovert 100 phase contrast microscope (LD Ph2 100×, NA 0.75) equipped with a custom stroboscopic illumination system. The setup employed a xenon flash lamp L6604 (external main discharge capacitor E7289-01, power supply C6096) synchronized with vertical sync pulses from a Hamamatsu,
Japan (manufacturer of all mentioned equipment in the current paragraph) CCD camera (C2400-60), producing light pulses of less than 3–4 µs (FWHM) at 2 J input energy, as specified in the manufacturer’s data sheet.
2.6. Laser Irradiation
The effect of electromagnetic radiation was studied on AgNPs to determine their potential to change temperature when exposed to a laser beam. All experiments were performed using a Pharos PH2-10W femtosecond laser (Light Conversion, Lithuania) equipped with an automated harmonic generator emitting at wavelengths of 1030 nm, 515 nm, and 343 nm. The system delivers up to 10 W at 1030 nm, with corresponding maximum powers of 5.9 W and 2.8 W for the second and third harmonics. Pulse durations range from 170 fs for the fundamental wavelength to 130 fs for the higher harmonics, with repetition rates adjustable from single pulse up to 200 kHz.
3. Results
3.1. Transmission Electron Microscopy (TEM)
Transmission electron microscopy (TEM) provides valuable insight into the mor- phology and surface chemistry of AgNPs, particularly in relation to their synthesis and stabilization mechanisms. The TEM image (Figure 2(a)) confirms the synthesis of smaller spherical particles. Many compounds are used as capping agents, such as polysaccharides, proteins, mannose, galactose, glucose, chitosan, and sodium alginate [19].
TEM images, listed as Figure 2(a) and Figure 2(b), confirmed that fructose participated as a capping and protecting agent. A thin coat of fructose with an average thickness of 2-3 nm can be observed in the aforementioned TEM image. Many groups, such as hydroxyl, carboxyl, phenol, and carbonyl, are linked with oxygen and nitrogen with covalent bond linkage for the complex formation of silver, and so they are probably absorbed on its surface [20,21]. This concept of small reducing sugar molecules obliging as protecting agents is not strictly limited to NPs: bearing in mind that table sugar [22,23,24] is composed of the foregoing glucose and fructose, we allege, based on a conducted research, that sucrose serves as cell protector against drought, both at low and high temperatures [25,26]. Similarly, we assume that fructose can act as a stabilizing and protecting agent for silver nanoparticles in experimental systems: reposing trust in its ability to preserve the structural integrity of biological membranes under stress. By analogy, table sugar can provide protection to various nanoparticles during synthesis and storage.
3.2. Infrared (IR) Spectroscopy
The ATR-FTIR spectra of the pure SOPC and the respective liposomes with varying amounts of NPs are depicted within the region 3000-900 cm−1 on Figure 3.
In the FTIR-ATR spectrum of the pure SOPC, the IR band for the asymmetric C-H vibrations of the methylene groups was found at 2924 cm−1. As it could be seen from the spectra in Figure 3, the incorporation of the AgNPs, containing fructose in their cover layer, in the liposomes did not influence much the position of the band - it remained almost unchanged varying between 2924 and 2923 cm−1. The IR band for the symmetric stretching vibrations of the methylene groups also do not show a substantial frequency change upon the addition of the NPs – it was found in all samples at ca. 2853-2854 cm−1. These wavenumbers correspond to a partially disordered state of the hydrocarbon chains as the bands are shifted more than 5 cm−1 from the typical positions for lipids in ordered phase [6,27,28]. However, in between the samples, no significant change was observed suggesting that the NPs had little effect on the packing of the hydrocarbon tails.
The characteristic IR band of the ester carbonyl (C=O) stretching vibratio of pure SOPC was found at 1743 cm−1 and corresponded to partially hydrated carbonyl groups (Figure 3). In the liposomes containing incorporated silver nanoparticles with fructose capping agent, the carbonyl band was low-frequency shifted by approximately 10 cm−1 – 1736-1732 cm−1 which is evidence for increased hydrogen bonding of the carbonyl groups. The observed changes in the (C=O) stretching band position can be related to the interactions of the studied NPs that hold fructose in their cover layer with the ester groups of the SOPC membrane – obviously the carbonyl groups of the SOPC molecules were involved in stronger and greater hydrogen bonding interaction in the presence of the NPs. This effect should be attributed to the strong hydrogen bonding capacity of the polar fructose molecules, rich in hydroxy groups.
The IR bands for the phosphate stretching vibrations were shifted from 1232 cm−1 in the pure SOPC (characteristic for partially hydrated phosphate groups) to 1228 cm−1 in the liposomes containing 0.5 and 1% NPs (Figure 3). This shift indicated that hydrogen bonding interactions of the phosphate groups also increased in the presence of AgNPs, accommo- dated with fructose in their cover surface. Considering that the stretching vibrations of both the carbonyl and the phosphate groups were affected; it could be suggested that the NPs are incorporated within the polar region of SOPC membrane.
In the IR spectrum of the sample, containing 2.5% NPs, the position of the latter band is influenced by the emerging absorptions for C-O and C-C stretching vibrations of the fructose molecules in this region, and cannot be used for the assessment of the hydrogen bonding of the SOPC phosphate groups. In the region below 1250 cm−1, several bands arising from the fructose C–O and C–C stretching vibrations were observed with the strongest bands appearing at 1160, 1101, 1085, 1064 and 1016 cm−1. The bands are the most intense in the spectrum of the sample containing 2.5% NPs in accordance with the highest amounts of the fructose in it.
3.3. Differential Scanning Calorimetry (DSC)
Previous reports have shown that a water content of 10–20 wt% yields optimal ther- motropic profiles for SOPC liposomes [29]. To ensure consistency and comparability all SOPC samples with varying concentrations of AgNPs were prepared with 10 wt% water. At higher heating rates (e.g. from 2 to 5 °C/minute), it has been observed that both the transition temperature and calorimetric enthalpy increase [29]. A heating rate 5 °C/minute was chosen as the optimal for the DSC equipment, balancing simultaneously sensitivity and accuracy. For thermal analysis, each sample was equilibrated at room temperature before being placed in the DSC oven. The samples were first heated to 50 °C, followed by controlled cooling at a rate of 5 °C per minute down to -10 °C, based on the aforementioned experimental details. Subsequently, the samples were reheated from -10 °C up to 70 °C at the same rate. This protocol ensured a consistent thermal history for all samples regardless of AgNPs concentrations in SOPC liposomes. (a) and (b) show the differential scan- ning calorimetry (DSC) thermograms of SOPC liposomes, both in the absence and presence of various concentrations of AgNPs during heating and cooling cycles. The DSC results indicate that the incorporation of AgNPs into SOPC liposomes slightly alters the phase transition behavior. As the concentration of AgNPs increases, the main phase transition from gel to the liquid crystalline state shifts to lower temperatures. This shift is evident in both heating and cooling profiles where the main endothermic and exothermic peaks move leftward on the temperature axis with increasing NPs DSC thermograms of the SOPC lipid system containing 0.5, 1.0, and 2.5 wt% of silver nanoparticles during cooling.
For all studied concentrations of AgNPs, the transition peak becomes slightly broader and less defined compared to that of pure SOPC, suggesting a less cooperative or more gradual phase change [30,31]. This effect is observed in both the heating (Figure 4(a)) and cooling (Figure 4(b)) thermograms. The SOPC samples with the highest AgNPs (2.5)% show the most diffuse peak among the samples tested, indicating a subtle alteration of membrane organization. The enthalpy associated with the transition also decreases as more Ag-based nanocarriers are introduced (Table 1), reflecting a reduction in the energy required for the phase transformation. These changes are consistent with a membrane that undergoes a less ordered transition due to the incorporation of NPs. The quantified DSC results, summarized in Table 1, support the graphical observations.
For pure SOPC liposomes, the main phase transition temperature ( Tm ) during cooling is 3.41 °C. As the concentration of AgNPs increases, ( Tm ) steadily decreases, reaching 2.80 °C at 2.5wt% AgNPs. The transition enthalpy (∆H) also decreases with increasing nanoparticle concentration, from 0.280 J/g in pure SOPC to 0.234 J/g at the maximal NPs content, reflecting a reduction in the energetic cooperativity of the phase transformation. A similar trend is observed for the heating cycle, where ( Tm ) slightly increases with higher AgNPs concentration but the heating enthalpy (∆H) monotonically decreases. Together, these results suggest that the AgNPs induce subtle changes in the SOPC bilayer, resulting in broader and less defined phase transitions. This effect facilitates membrane fluidization at reduced temperatures, supporting the theory of phase transitions of systems with diluted defects [32].
3.4. Thermally Induced Shape Fluctuation Method
To ensure reliable and comparable results, we applyed the thermally induced fluctua- tion to investigate the effect of AgNPs on SOPC lipid membranes, incorporating AgNPs concentrations up to 2.5 wt%. The outcomes obtained with AgNPs were compared with those from pure SOPC and SOPC membranes in the presence of glucose. [33,34,35].
Following a well-established methodology, we systematically investigated how AgNPs affect the elastic properties of SOPC lipid membranes. Similar to the bilayer softening with sugar, we anticipated that the adsorption and capping chemistry of AgNPs—particularly with fructose cap layers—would alter bending rigidity through surface pressure effects and interactions with lipid head-group interactions. While higher concentrations sometimes led to membrane imperfections that complicated the formation of the large spherical vesicles needed for an accurate analysis, we were still able to successfully measure the moduli of bending elasticity (kc) for the SOPC giant unilamellar vesicles (GUV) containing 1.0% and 2.5% AgNPs. These results summarized in Table 2, represent weighted average from at least five separate vesicles. The data suggest that within the margin of error, AgNPs at the tested concentrations did not significantly alter the elastic behavior of the SOPC bilayer. For a statistical outlook, the experimental values of (kc) are presented in a histogram on Figure 5, thus giving a direct comparison of the bending elasticity modulus in presence of fructose. Such a comparison is not accidental, since sugars - like NPs - modulate bilayer mechanics through hydration and head-group interactions.
Sugars, well-known cryoprotectants under extreme conditions, displace water from the hydrophilic part of the molecule by forming multiple hydrogen bonds with the phos- pholipid head groups. This alters the tendency of lipid molecules to bind to water. However, as highlighted by Cacela and Hincha [36] and further discussed in disaccharide-membrane studies [37], once a critical concentration is reached, additional sugar molecules no longer displace water and the system reaches equilibrium with no further significant changes.
The progressive decrease in (kc) with the increase of the concentration of AgNPs suggests that NPs alter the lipid packing, reducing the bending rigidity of the bilayer. This observation is consistent with the DSC results which show a shift and broadening of the main transition, supporting the interpretation that incorporating NPs induced subtle
changes in membrane properties. This could reflect in minor membrane destabilization or enhanced fluidity as a result of nanoparticle incorporation. Bending elastic modulus in presence of fructose is included as a reference, which, as visible, has much lower (kc). This underlines that even at reduced rigidity, SOPC membranes with AgNPs are still significantly stiffer than lipid membranes in presence of fructose (which has a bending elasticity modulus of almost half of that of pure SOPC). From a biomedical perspective, the observed concentration-dependent softening of SOPC membranes suggests that high AgNP loadings may lead to subtle alterations in membrane integrity and thereby contribute to antimicrobial effects, although in vivo behaviour will additionally depend on protein coronas, ionic environment and cellular repair mechanisms.
3.5. Temperature Changes Under the Effect of Laser IRRADIATION in the presence of Silver Nanoparticles
The experimental environment for cell cultures is suitable for the investigation of temperature changes under laser irradiation. In the presence of AgNPs, laser irradiation leads to a significant increase in the temperature, with the temperature dynamics depending on both the wavelength and power density of the radiation. The temperature response of the medium was investigated under laser irradiation at three wavelengths (1030 nm, 515 nm, and 343 nm) and power densities of 0.1 and (0.2 W/cm2), in the presence of the AgNPs. Dulbecco’s Modified Eagle Medium (DMEM) served as the reference medium for all measurements. All the experiments in the study were performed at 100 kHz repetition rate. To assess the temperature variation induced by laser exposure, AgNP suspensions were introduced into the medium at a concentration of 50 µL/mL.
A FOTRIC 320F thermal imaging camera (FOTRIC Inc., USA) was used to measure temperature change in the studied systems during their irradiation with laser. The results obtained for all studied cases are shown in Figure 6. The y-axis corresponds to the temperature differences of the silver nanoparticles throughout a 10-minute irradiation process with time indicated on the x-axis. The most pronounced thermal effect is registered at λ = 515 nm, where at a higher power density (0.2 W/cm2) the temperature increase reaches over 30 °C within 10 minutes. This highlights effective absorption and conversion of optical energy into heat.
At a wavelength of 343 nm, a distinct temperature increase was also observed, al- though lower compared to the 515 nm. In contrast at λ = 1030 nm the thermal effect was significantly weaker, regardless of the power density used. These results clearly demonstrate the spectral dependence of the photothermal response in the system and emphasize the key role of the plasmon resonance of AgNPs in the green range of the spectrum. This spectral behavior highlights their potential for applications in photothermal therapy, where selective heating in the presence of NPs can be used to target pathological cells with minimal impact on healthy tissues.
4. Conclusions
In conclusion, our study demonstrates that the functional properties of lipid vesi- cles are profoundly and concentration-dependently altered by the incorporation of silver nanoparticles (AgNPs). We have elucidated a multi-faceted mechanism of interaction: FTIR- ATR spectroscopy revealed that AgNPs preferentially interact with carbonyl and phosphate groups in the lipid head region [38], while DSC thermograms indicated a perturbation of the hydrophobic core, leading to a broadened and less cooperative phase transition. This disruption in lipid packing was directly linked to a concentration-dependent softening of the membrane, as measured by a reduction in bending rigidity.
These findings have critical dual implications. On one hand, the nanoparticle-induced membrane destabilization provides a plausible mechanism for the known antimicrobial activity of AgNPs. On the other hand, the strong, wavelength-specific photothermal response of AgNPs confirms their potential for applications in controlled hyperthermia therapies. This duality underscores a central tenet of nanomedicine: the same property that confers therapeutic benefit (membrane interaction) can also pose a risk to membrane integrity.
Therefore, the successful implementation of AgNP-liposome hybrids in biotechnology and medicine hinges on a precise, quantitative understanding of these interactions. Future work will focus on translating these findings from biomimetic models to real cellular systems to validate their biological relevance and therapeutic efficacy.
Author Contributions
Conceptualization, J.G and L.S.; methodology, J.G., L.S., M.L. and D.Y.; validation, J.G., L.S., M.L and D.Y.; formal analysis, J.G., L.S., M.L and D.Y.; investigation, J.G., L.S.,. M.L and D.Y.; resources, J.G., L.S., M.L., S.N. M.T. and D.Y.; data curation, J.G., L.S., M.L. and D.Y; writing—original draft preparation, M.L.; writing—review and editing, J.G., L.S., M.L. N.K., K.H-P., Ch. X. and D.Y.; visualization, J.G., L.S., M.L., S.N. M.T. and D.Y.; supervision, J.G. and L.S.; project administration, L.S.; funding acquisition, J.G., L.S. and N.K.. All authors have read and agreed to the published version of the manuscript.
Funding
This research received funding in 2023 via the Bulgarian National Science Fund.
Data Availability Statement
Additional data are available on request.
Acknowledgments
The authors thank the Bulgarian National Science Foundation (contract KP-06- N78/8 from 14/12/2023) for the financial support. D.Y. is grateful for the financial support of the European Union NextGenerationEU, through the National Recovery and Resilience Plan of the Republic of Bulgaria, Project No. BG-RRP-2.004- 0002, “BiOrgaMCT”. Equipment of INFRAMAT (Research Infrastructure from National roadmap of Bulgaria), supported by the Bulgarian Ministry of Education and Science, is used in a part of the present investigations.
Conflicts of Interest
The authors declare no conflicts of interest.
Abbreviations
The following abbreviations are used in this manuscript:
| AgNPs | Silver nanoparticles |
| DSC | Differential scanning calorimetry |
| SOPC | 1-stearoyl-2-oleoyl-sn-glycero-3-phosphocholine |
| FTIR-ATR | Fourier transform infrared spectroscopy with Attenuated total reflection |
| IR spectroscopy | Infrared spectroscopy |
| PTT | Photothermal therapy |
| NIR light | Near-infrared light |
| EPR effects | Enhanced permeability and retention |
| TEM | Transmission electron microscopy |
Appendix A. Calculation of Heating Enthalpies of a Set of Samples by DSC (Differential Scanning Calorimetry)
The calculation of enthalpy values from the DSC thermograms in this study was performed using a dedicated C++ console program developed in accordance with the protocol established by Maria Lyudmilova. This protocol serves as the reference standard for the experimental and computational methodology employed.
The console application processes raw thermogram data (temperature and heat flow) for each sample and calculates the enthalpy associated with the phase transitions observed during heating or cooling. Central features of the program include:
- File-based Data Input: The user specifies the name of a text file containing tabulated temperature and normalized heat flow measurements from the DSC experiment.
- Trapezoidal Numerical Integration: The enthalpy (∆H) for the relevant transition is computed using the trapezoidal rule, applying the general formula respectively.
- User-defined Integration Range: For each measurement, the user selects the temper- ature interval for integration to fully capture the enthalpic peak (as determined by protocol guidance for each sample type).
- Calculation of Error Relative to Protocol: The program permits entry of a protocol reference value for enthalpy against which the calculated result is compared, reporting absolute and relative errors.
- Output: All results (file name, calculated ∆H, reference value, error) are displayed and saved as a CSV file.
Appendix B. Protocol Adherency and Accuracy
The analysis intervals for each sample and nanoparticle concentration are based on the peak positions and widths specified in the established protocol. This ensures method- ological consistency and enables reliable comparison to experimentally validated reference values. The program’s logic and calculation steps mirror those performed in spreadsheet analyses and yield results within accepted experimental error margins (typically < 5%). This software tool provides both a reproducible and automated means for enthalpy calcula- tion in SOPC/AgNP systems and can be adapted for other lipid/nanoparticle combinations as required.
References
- Ahmadi, S. (2020). The importance of silver nanoparticles in human life. Advances in Applied NanoBio-Technologies, 1(1), 5–9. [CrossRef]
- Subramani, K., & Ahmed, W. (2018). Biomedical applications of nanoparticles. In Emerging Nanotechnologies in Dentistry (pp. 41–60). Elsevier. [CrossRef]
- Khan, I., Saeed, K., & Khan, I. (2019). Nanoparticles: Properties, applications and toxicities. Arabian Journal of Chemistry, 12(7), 908–931. [CrossRef]
- Rajendran, R., et al. (2019). Nanotechnology-based approaches for targeting and delivery of drugs and genes. In New Look to Phytomedicine (pp. 639–668). Elsevier. [CrossRef]
- Todorova, M., Milusheva, M., Kaynarova, L., Georgieva, D., Delchev, V., Simeonova, S., Pilicheva, B., & Nikolova, S. (2023). Drug-loaded silver nanoparticles—A tool for delivery of a mebeverine precursor in inflammatory bowel diseases treatment. Biomedicines, 11, 1593. [CrossRef]
- Lewis, R. N. A. H., & McElhaney, R. N. (2007). Fourier transform infrared spectroscopy in the study of lipid phase transitions in model and biological membranes. In A. M. Dopico (Ed.), Methods in Membrane Lipids (Vol. 400, pp. 207–226). Humana Press. [CrossRef]
- Derenne, A., Claessens, T., Conus, C., & Goormaghtigh, E. (2013). Infrared spectroscopy of membrane lipids. In G. C. K. Roberts (Ed.), Encyclopedia of Biophysics. Springer. [CrossRef]
- Mishra, S., & Khurana, M. (2022). A snapshot review: In vitro characterization of lipid membranes and their applications. MRS Advances, 7, 551–561. [CrossRef]
- Ohline, S. M., Campbell, M. L., Turnbull, M. T., & Kohler, S. J. (2001). Differential scanning calorimetric study of bilayer membrane phase transitions: A biophysical chemistry experiment. Journal of Chemical Education, 78(1), 125. [CrossRef]
- Koyama, T. M., Stevens, C. R., Borda, E. J., Grobe, K. J., & Cleary, D. A. (1999). Characterizing the gel to liquid crystal transition in lipid-bilayer model systems. The Chemical Educator, 4(1), 12–15. [CrossRef]
- Mitov, M. D., Faucon, J.-F., Méléard, P., & Bothorel, P. (1992). Thermal fluctuations of membranes. In G. W. Gokel (Ed.), Advances in Supramolecular Chemistry (pp. 93–139). JAI Press Inc., Greenwich, CT.
- Helfrich, W. (1973). Elastic properties of lipid bilayers: Theory and possible experiments. Z. Naturforsch., 28, 693–703. https// doi.org/10.1515/znc-1973-11-1209.
- Bivas, I. (2010). Shape fluctuations of nearly spherical lipid vesicles and emulsion droplets. Physical Review E, 81, 061911. [CrossRef]
- Genova, J., Vitkova, V., Aladjem, L., Méléard, P., & Mitov, M. D. (2005). The stroboscopic illumination gives new opportunities and improves the precision of bending elastic modulus measurements. Journal of Optoelectronics and Advanced Materials, 7(1), 257–260. https://old.joam.inoe.ro/arhiva/pdf7_1/Genova.pdf.
- Genova, J., & Pavlic, J. I. (2012). Realization of Marin Mitov idea for the stroboscopic illumination used in optical microscopy. Bulgarian Journal of Physics, 39(1), 65–71. https://www.researchgate.net/publication/284764437_Realization_of_Marin_Mitov_ idea_for_the_stroboscopic_illumination_used_in_optical_microscopy.
- Genova, J. (2013). Marin Mitov lectures: Measuring bending elasticity of lipid bilayers. Advances in Planar Lipid Bilayers and Liposomes, 17, 1–27. Academic Press. [CrossRef]
- Bivas, I., Hanusse, P., Bothorel, P., Lalanne, J., & Aguerre-Chariol, O. (1987). An application of optical microscopy to the determination of the curvature elastic modulus of biological and model membranes. Journal de Physique, 48, 855–867. [CrossRef]
- Milner, S. T., & Safran, S. A. (1987). Dynamical fluctuations of droplet microemulsions and vesicles. Physical Review A, 36(9), 4371–4379. [CrossRef]
- Vedelago, J., Gomez, C. G., Valente, M., & Mattea, F. (2018). Green synthesis of silver nanoparticles aimed at improving theranostics. Radiation Physics and Chemistry, 146, 55–67. [CrossRef]
- Fahim, M., Shahzaib, A., Nishat, N., Jahan, A., Bhat, T. A., & Inam, A. (2024). Green synthesis of silver nanoparticles: A comprehen- sive review of methods, influencing factors, and applications. JCIS Open, 16, 100125. [CrossRef]
- Dhaka, A., Mali, S. C., Sharma, S., & Trivedi, R. (2023). A review on biological synthesis of silver nanoparticles and their potential applications. Results in Chemistry, 6, 101108. [CrossRef]
- Roy, A., Dutta, R., Kundu, N., Banik, D., & Sarkar, N. (2016). A comparative study of the influence of sugars sucrose, trehalose and maltose on the hydration and diffusion of DMPC lipid bilayer at complete hydration: Investigation of structural and spectroscopic aspect of lipid–sugar interaction. Langmuir, 32(20), 5124–5134. [CrossRef]
- Andersen, H. D., Wang, C., Arleth, L., Peters, G. H. J., & Westh, P. (2011). Reconciliation of opposing views on membrane–sugar interactions. Proceedings of the National Academy of Sciences of the United States of America, 108(5), 1874–1878. [CrossRef]
- Mu, Q., Jiang, G., Chen, L., Zhou, H., Fourches, D., Tropsha, A., & Yan, B. (2014). Chemical basis of interactions between engineered nanoparticles and biological systems. Chemical Reviews, 114(15), 7740–7781. [CrossRef]
- Demel, R. A., Dorrepaal, E., Ebskamp, M. J. M., Smeekens, J. C. M., & de Kruijff, B. (1998). Fructans interact strongly with model membranes. Biochimica et Biophysica Acta (BBA) - Biomembranes, 1375(1), 36–42. [CrossRef]
- Vijn, I., & Smeekens, S. (1999). Fructan: More than a reserve carbohydrate? Plant Physiology, 120(2), 351–360. [CrossRef]
- Tamm, L. K., & Tatulian, S. A. (1997). Infrared spectroscopy of proteins and peptides in lipid bilayers. Quarterly Reviews of Biophysics, 30(4), 365–429. [CrossRef]
- Cameron, D. G., Casal, H. L., & Mantsch, H. H. (1980). Characterization of the pretransition in 1,2-dipalmitoyl-sn-glycero-3- phosphocholine by Fourier transform infrared spectroscopy. Biochemistry, 19(15), 3665–3672. [CrossRef]
- Genova, J., Slavkova, Z., Chamati, H., & Petrov, M. (2019). Gel–liquid crystal phase transition in dry and hydrated SOPC phospho- lipid studied by differential scanning calorimetry. Phase Transitions, 92, 323–332. [CrossRef]
- Bothun, G. D. (2008). Hydrophobic silver nanoparticles trapped in lipid bilayers: Size distribution, bilayer phase behavior, and optical properties. Journal of Nanobiotechnology, 6, 13. https://jnanobiotechnology.biomedcentral.com/articles/10.1186/1477-315 5-6-13.
- Westerhausen, C., Strobl, F. G., Herrmann, R., Bauer, A. T., Schneider, S. W., Reller, A., Wixforth, A., & Schneider, M. F. (2012). Chemical and mechanical impact of silica nanoparticles on the phase transition behavior of phospholipid membranes in theory and experiment. Biophysical Journal, 102(5), 1032–1038. [CrossRef]
- Faizi, H. A., Granek, R., & Vlahovska, P. M. (2024). Curvature fluctuations of fluid vesicles reveal hydrodynamic dissipation within the bilayer. Proceedings of the National Academy of Sciences of the United States of America, 121(44), e2413557121. [CrossRef]
- Genova, J., Zheliaskova, A., & Mitov, M. D. (2006). The influence of sucrose on the elasticity of SOPC lipid membrane studied by the analysis of thermally induced shape fluctuations. Colloids and Surfaces A: Physicochemical and Engineering Aspects, 282–283, 420–422. [CrossRef]
- Genova, J., Zheliaskova, A., & Mitov, M. D. (2007). Monosaccharides (fructose, glucose) and disaccharides (sucrose, trehalose) influence the elasticity of SOPC membranes. Journal of Optoelectronics and Advanced Materials, 9(2), 427–430.
- Genova, J., Vitkova, V., & Bivas, I. (2013). Registration and analysis of the shape fluctuations of nearly spherical lipid vesicles. Physical Review E, 88(2), 022707. [CrossRef]
- Cacela, C., & Hincha, D. K. (2006). Low amounts of sucrose are sufficient to depress the phase transition temperature of dry phosphatidylcholine, but not for lyoprotection of liposomes. Biophysical Journal, 90(8), 2831–2842. [CrossRef]
- Moiset, G., Dufourc, E. J., & others. (2014). Disaccharides impact the lateral organization of lipid membranes. Journal of the American Chemical Society, 136, 15210–15213. [CrossRef]
- Toyran, N., & Severcan, F. (2002). Infrared spectroscopic studies on the dipalmitoyl phosphatidylcholine bilayer interactions with calcium phosphate: Effect of vitamin D2. Spectroscopy, 16, 399–408.
Figure 1.
Schematic representation of the SOPC lipid structure.
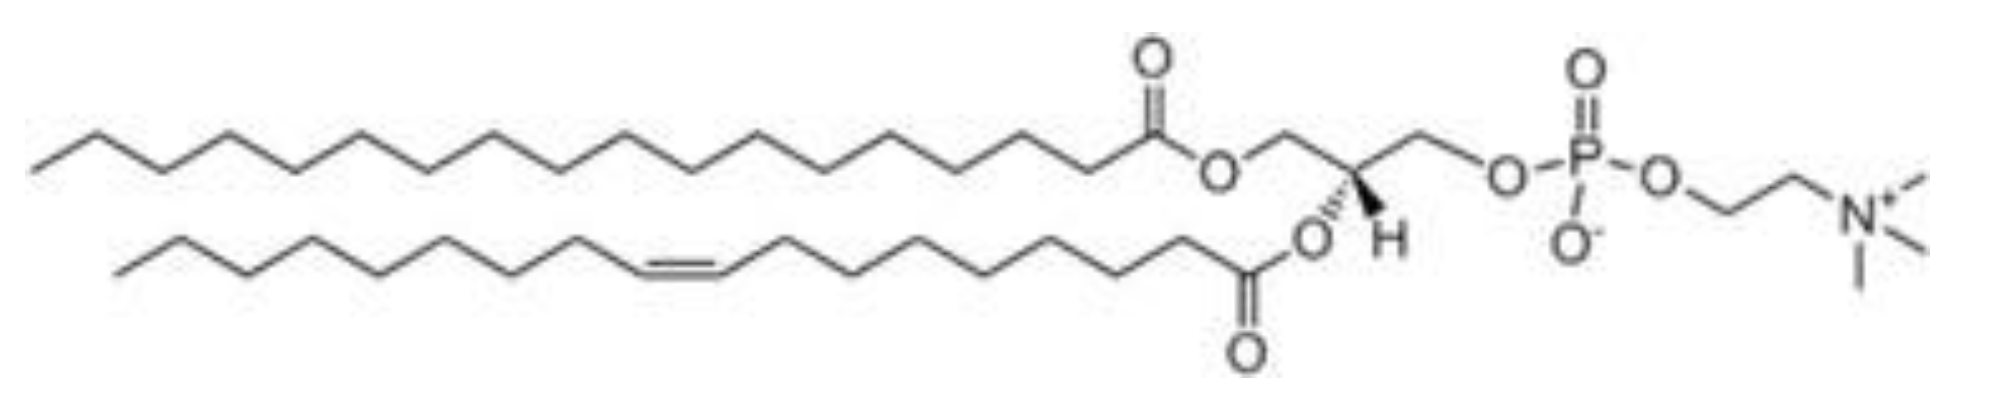
Figure 2.
TEM characterization of AgNPs showing morphology and surface capping.
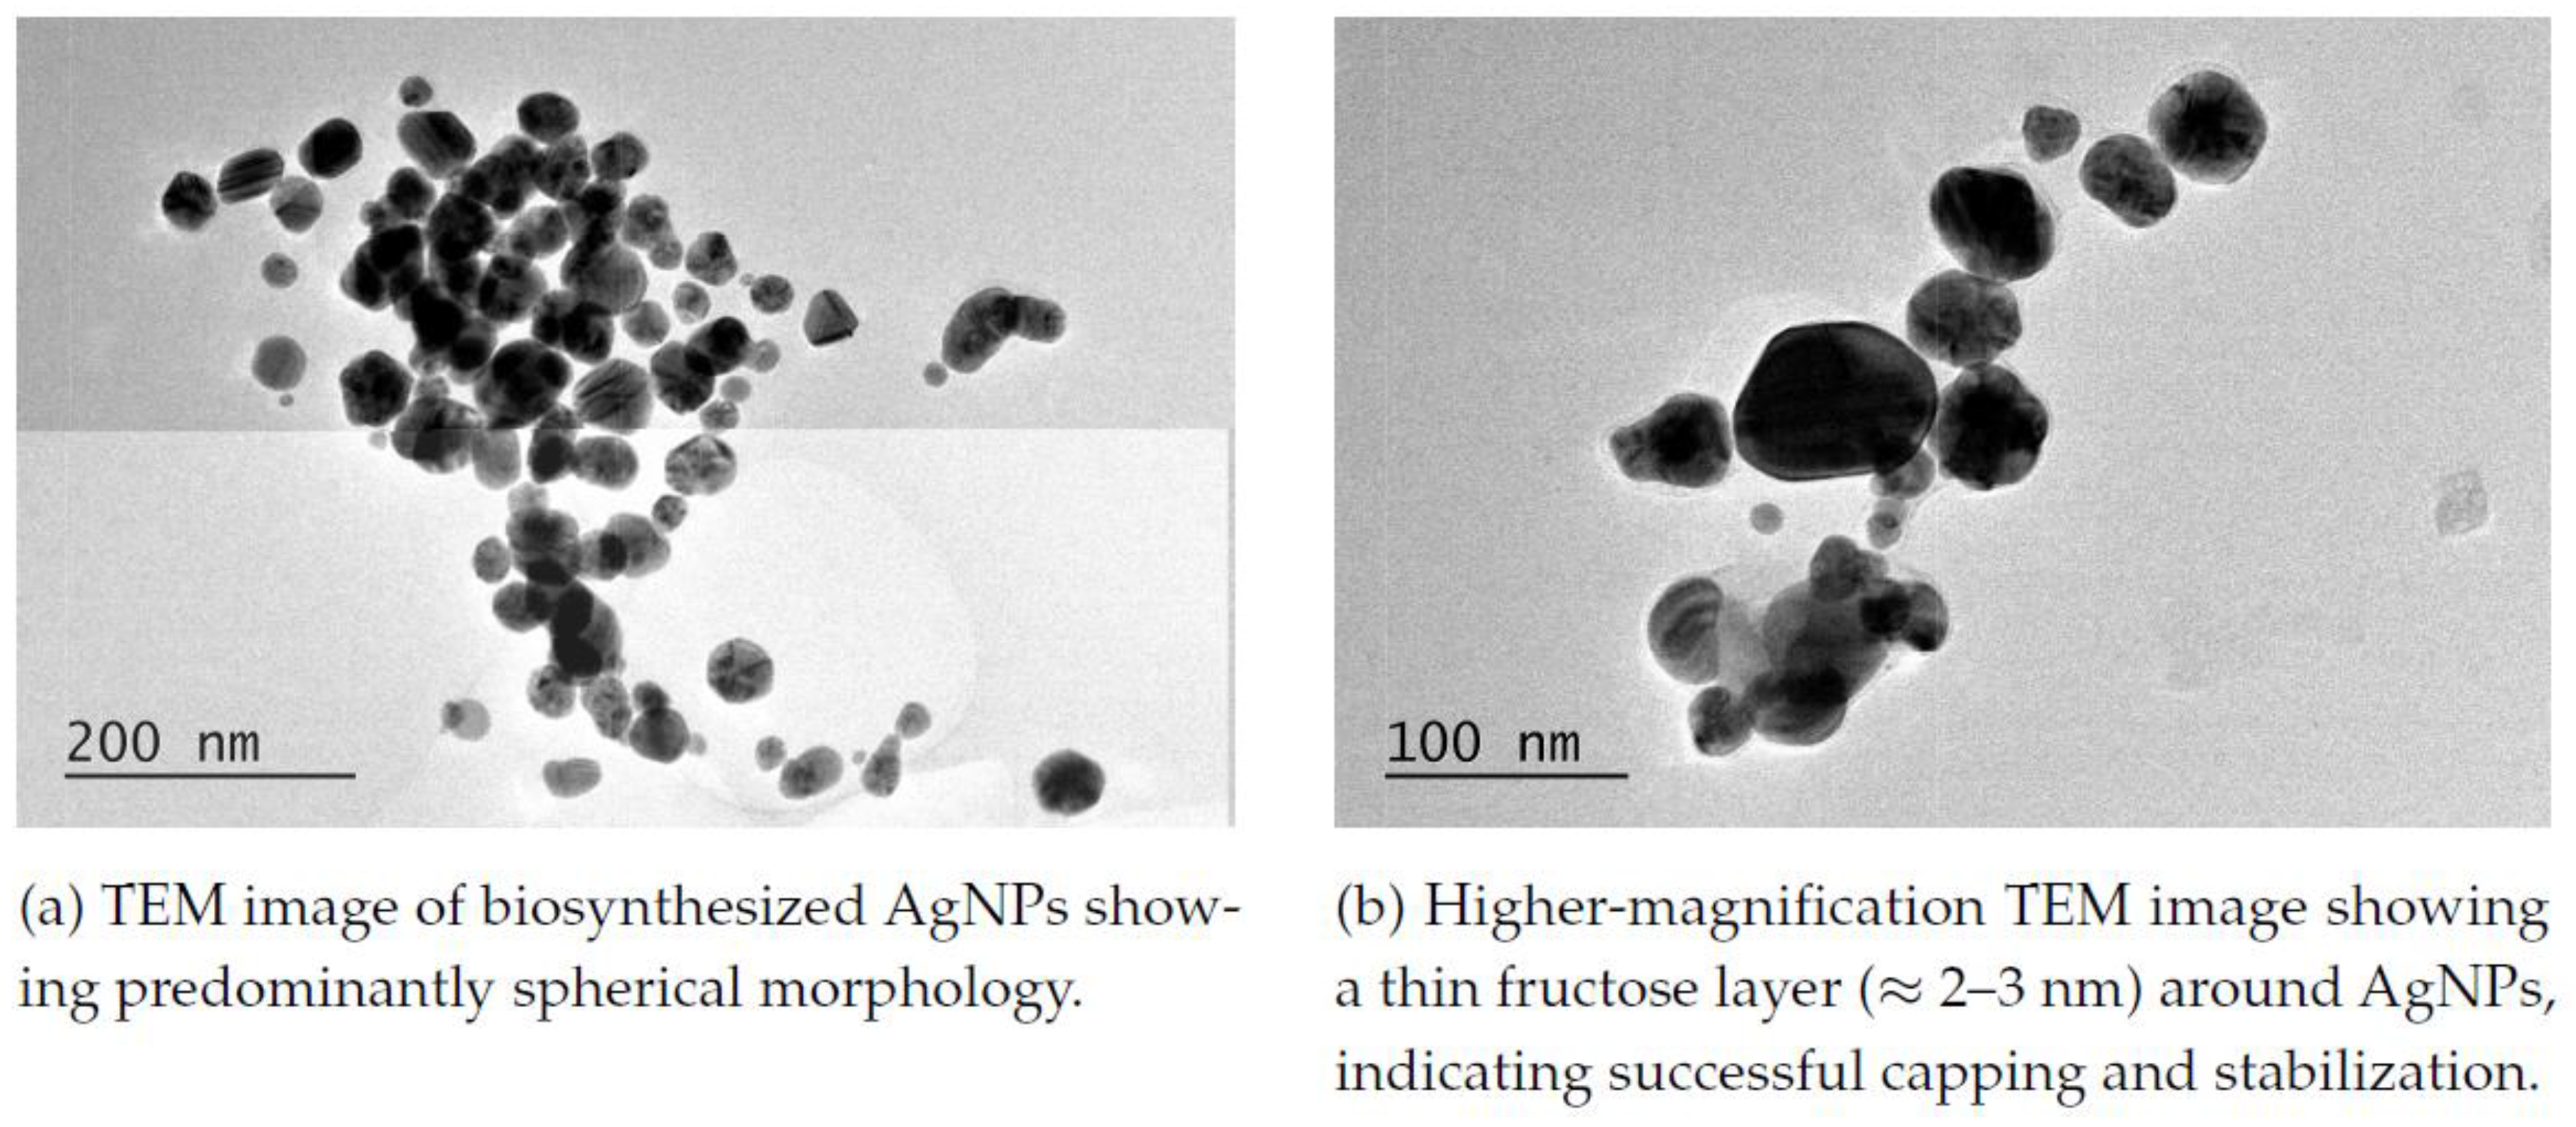
Figure 3.
ATR-FTIR spectra in the region from 3000 to 900 cm−1 of pure SOPC and three SOPC samples with varying amounts of AgNPs measured by referencing to water as a background.
Figure 3.
ATR-FTIR spectra in the region from 3000 to 900 cm−1 of pure SOPC and three SOPC samples with varying amounts of AgNPs measured by referencing to water as a background.
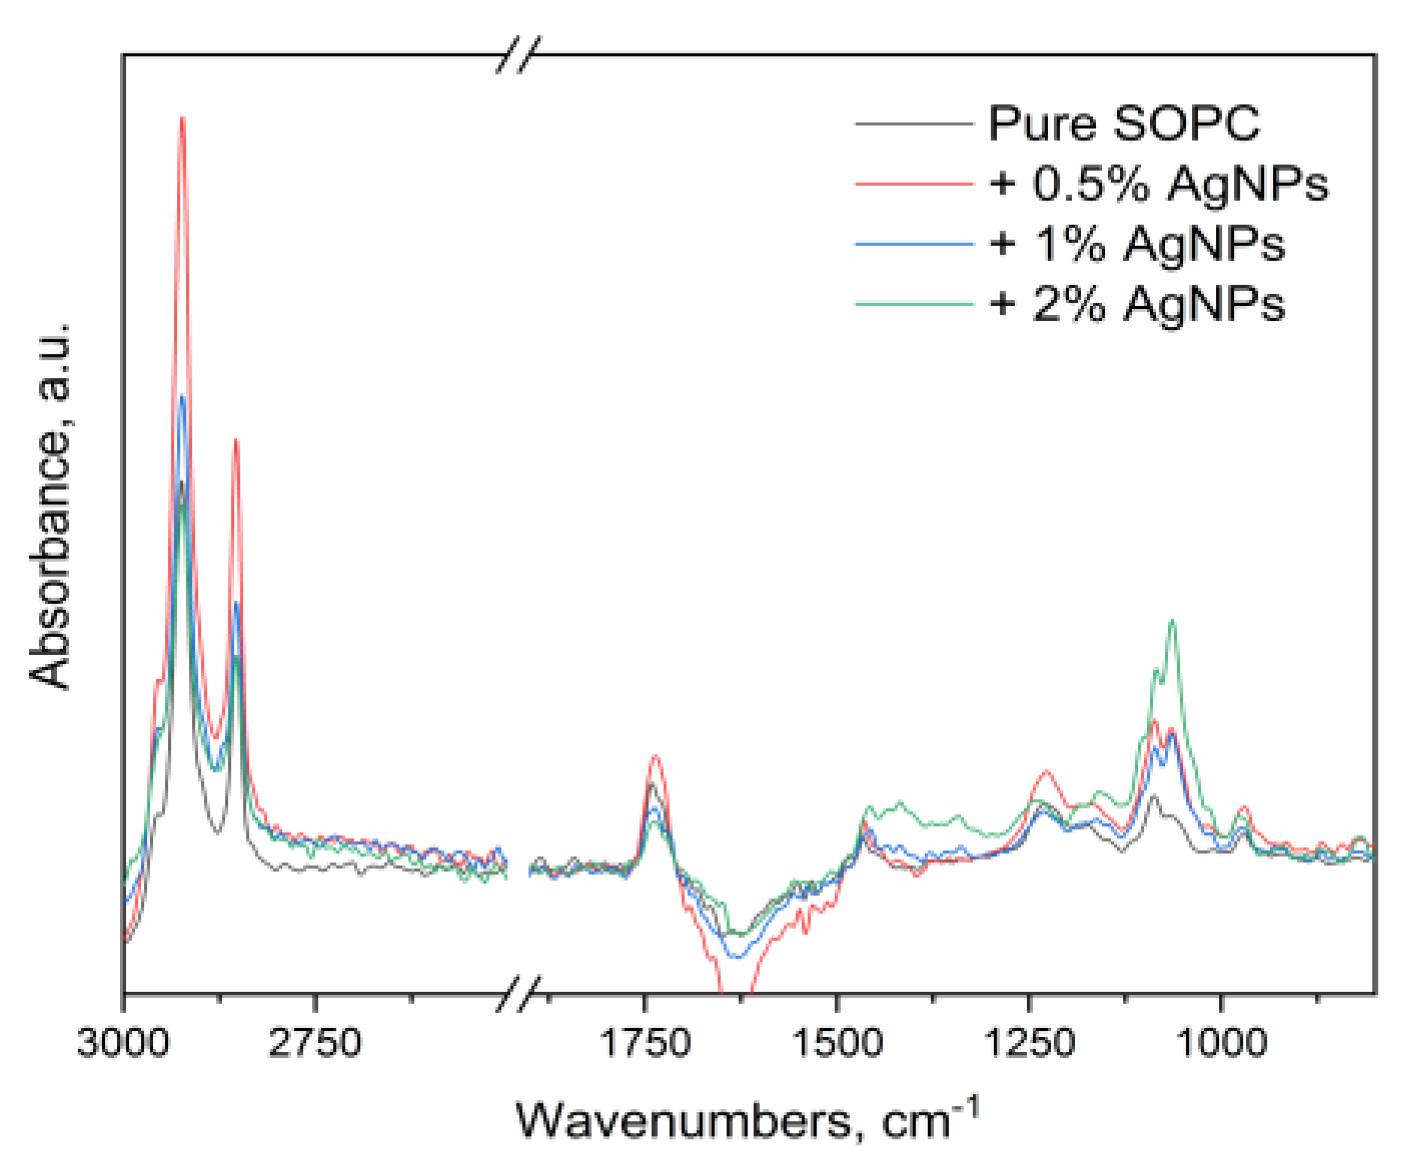
Figure 4.
Thermal behavior of lipid systems, containing 0-2.5%wt AgNPs. Panels are labeled as: (a) heating; (b) cooling.
Figure 4.
Thermal behavior of lipid systems, containing 0-2.5%wt AgNPs. Panels are labeled as: (a) heating; (b) cooling.
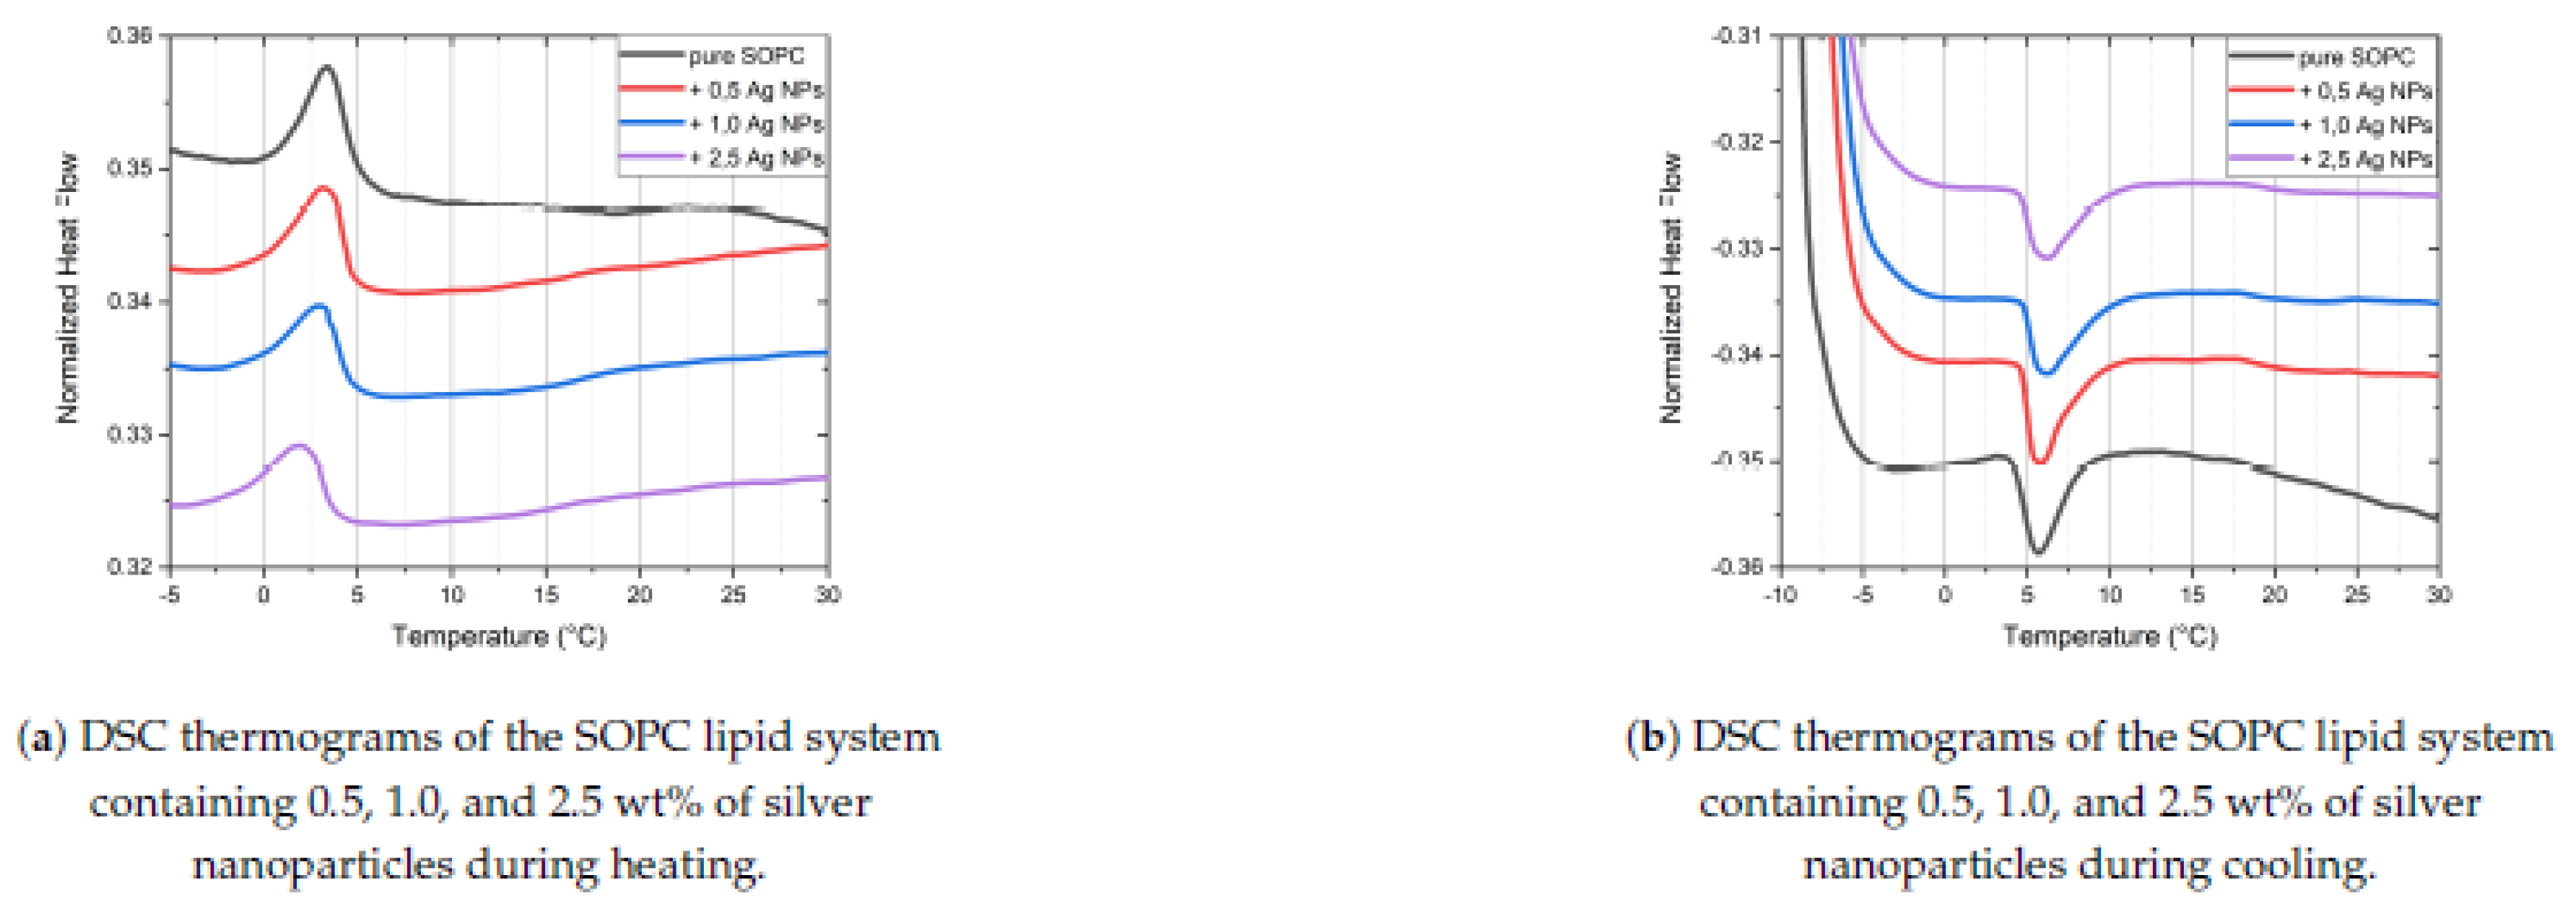
Figure 5.
Bending elasticity moduli of pure SOPC and SOPC, containing AgNPs.
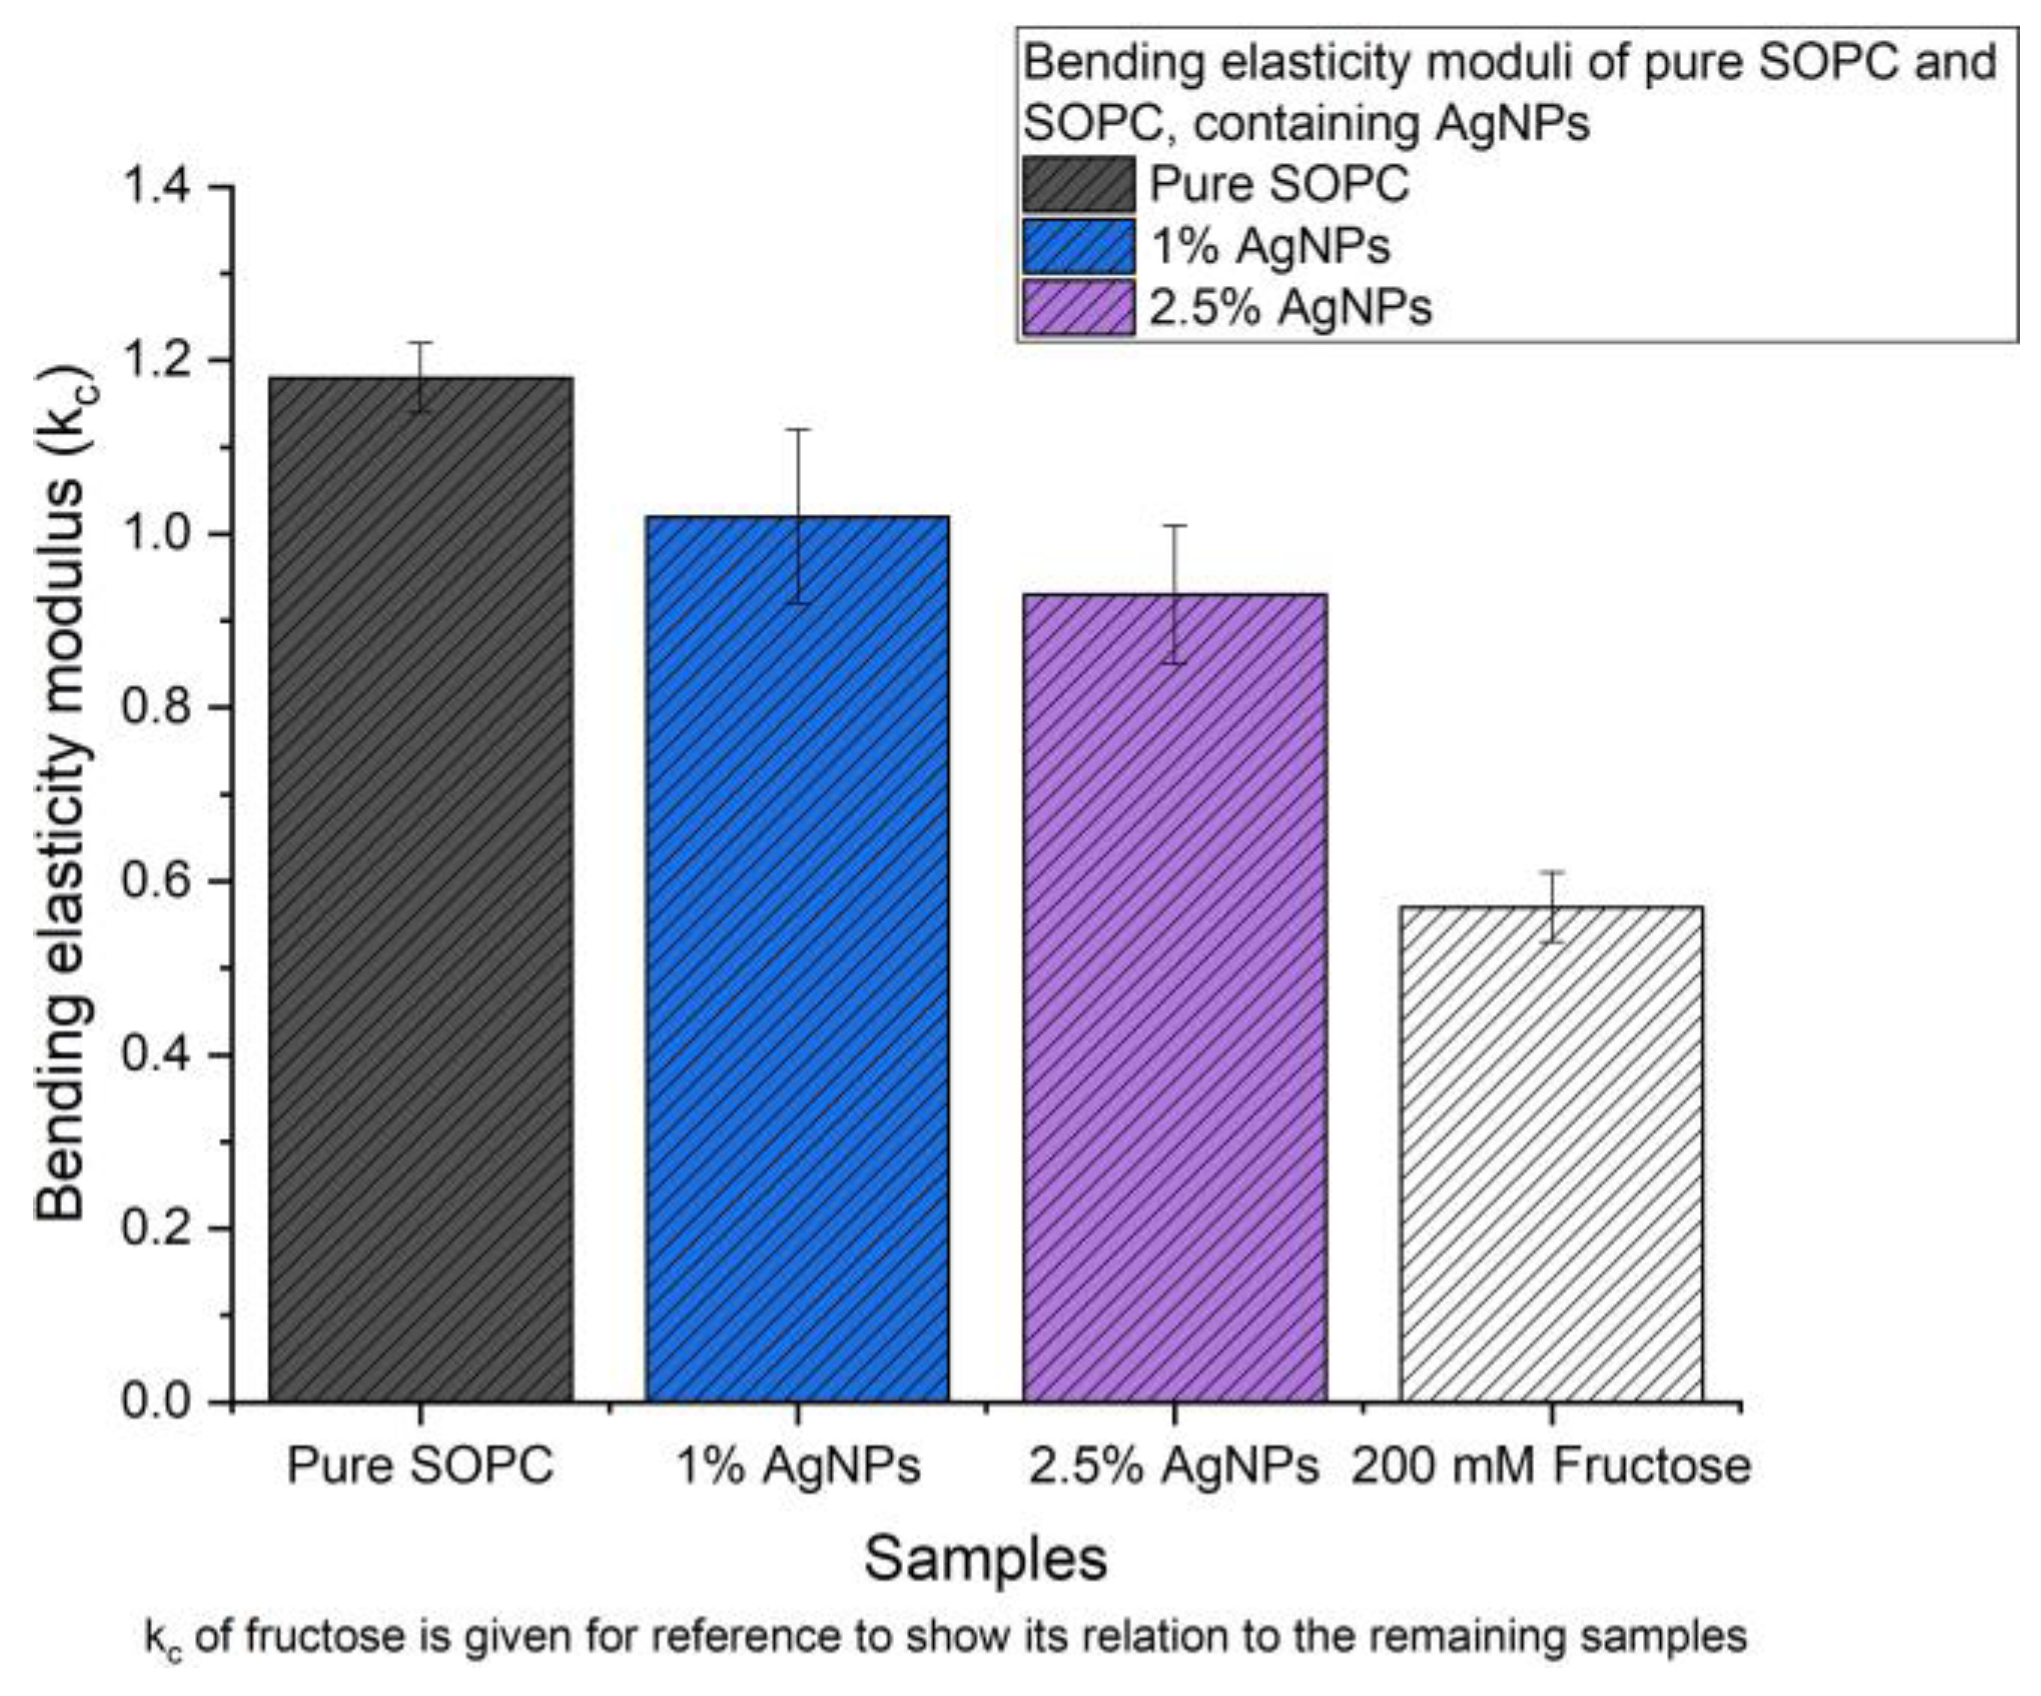
Figure 6.
Thermal changes of DMEM with AgNPs during irradiation with the three wavelengths.
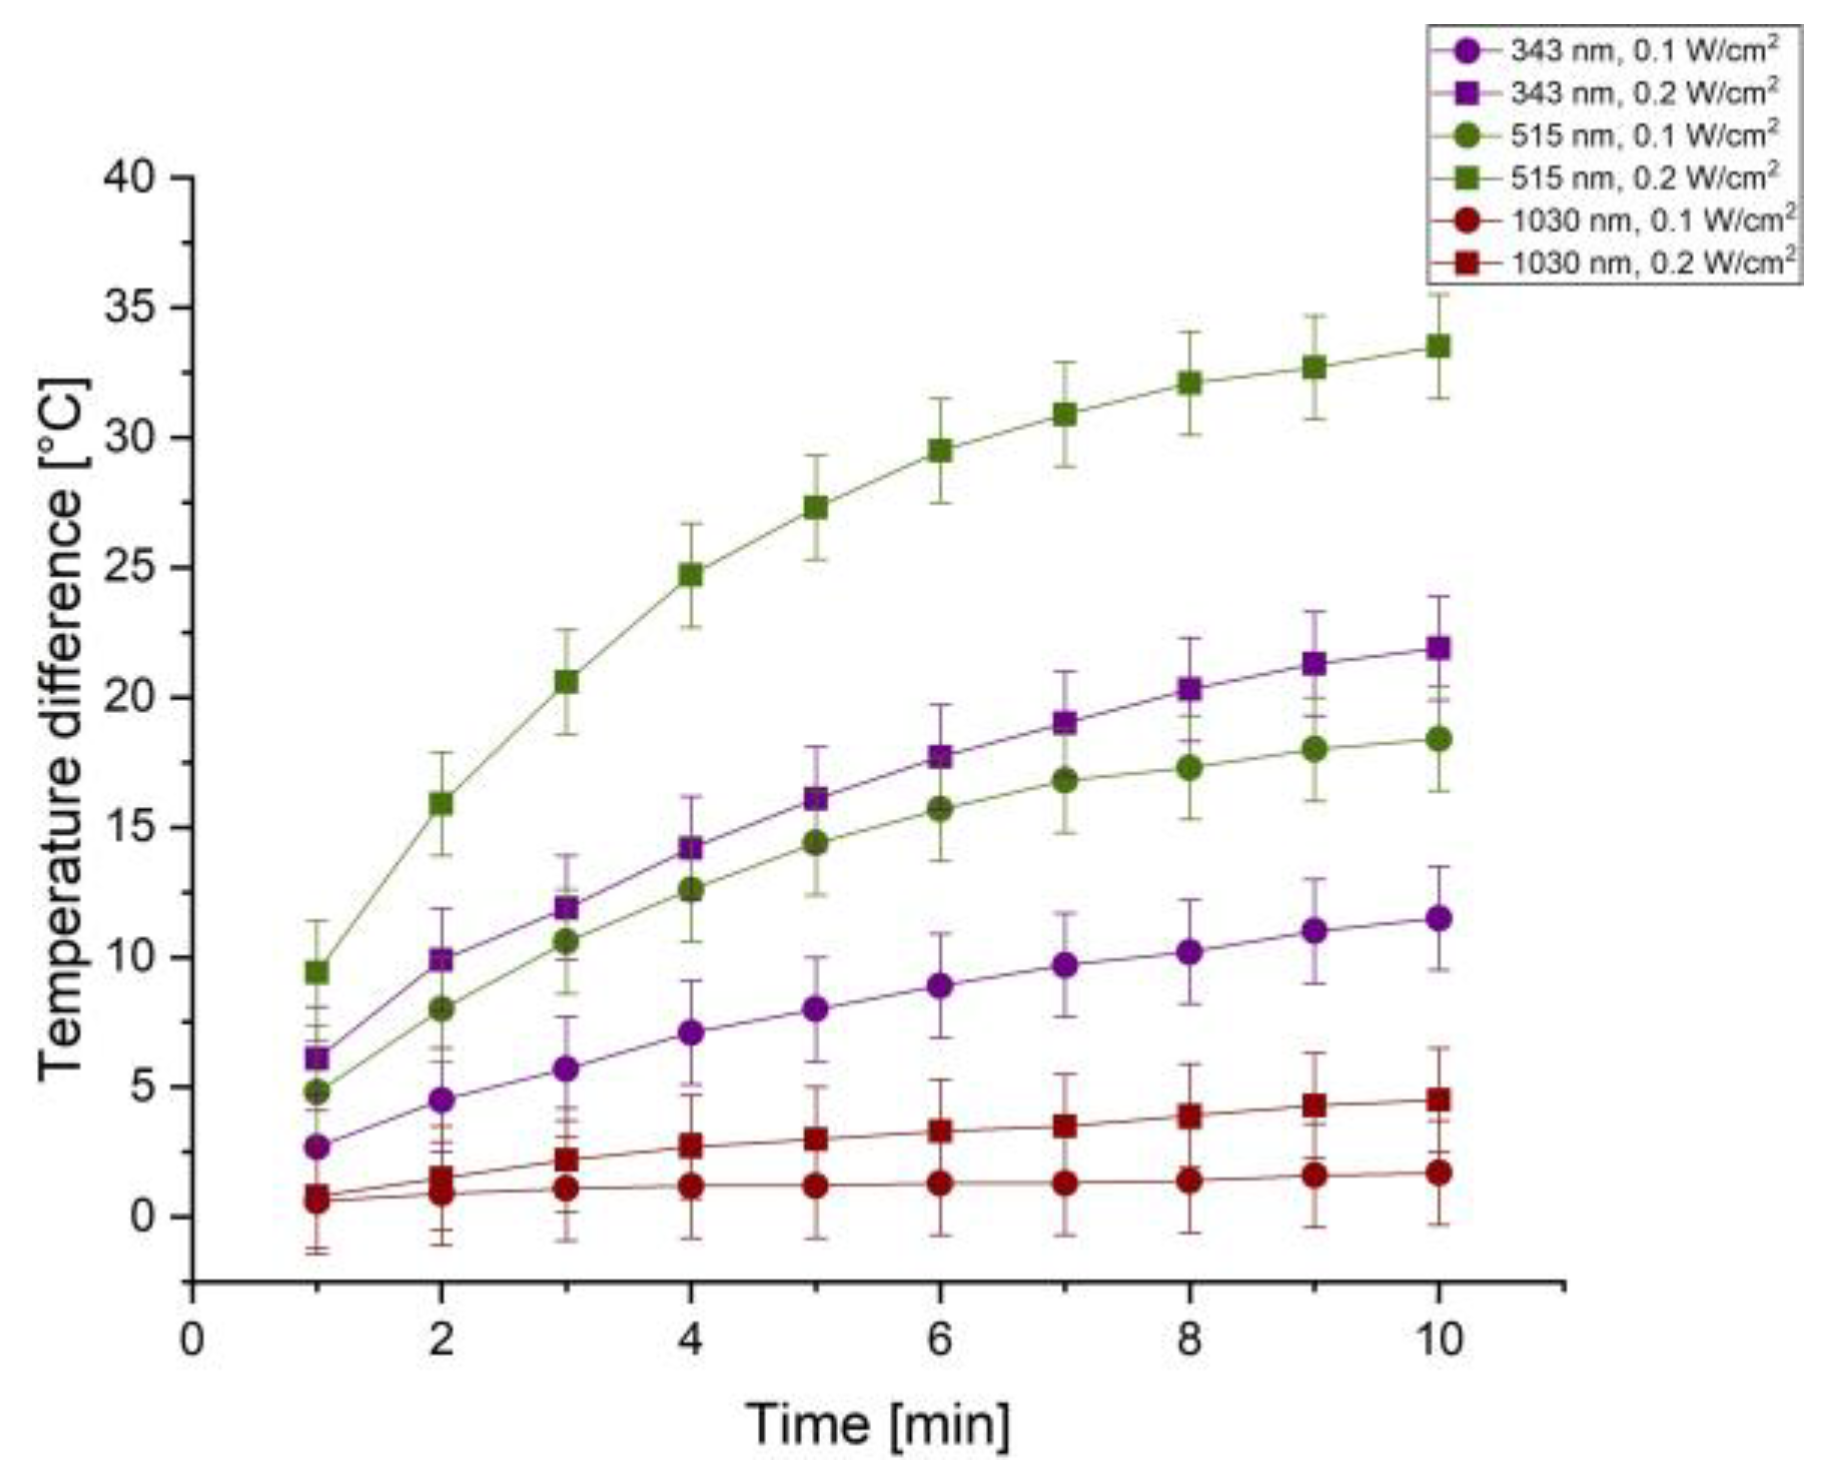

Table 1.
Thermal properties of SOPC liposomes (10% ddH2O) with various AgNP concentrations during cooling and heating.
Table 1.
Thermal properties of SOPC liposomes (10% ddH2O) with various AgNP concentrations during cooling and heating.
| Sample | EXO Tm (°C) | EXO ∆H (J/g) | ENDO Tm (°C) | ENDO ∆H (J/g) |
|---|---|---|---|---|
| Pure | 3.41 | 0.280 | 5.80 | 0.263 |
| +0.5% AgNPs | 3.20 | 0.279 | 5.80 | 0.306 |
| +1.0% AgNPs | 3.33 | 0.261 | 5.92 | 0.264 |
| +2.5% AgNPs | 2.80 | 0.234 | 6.30 | 0.258 |
Table 2.
Bending elasticity modulus (kc) of the lipid membrane containing various concentrations of AgNPs, acquired through thermally induced shape fluctuations analysis. Bending modulus values represent weighted averages of five vesicles per concentration.
Table 2.
Bending elasticity modulus (kc) of the lipid membrane containing various concentrations of AgNPs, acquired through thermally induced shape fluctuations analysis. Bending modulus values represent weighted averages of five vesicles per concentration.
| Experimental system | Pure SOPC | SOPC + 1.0 wt% Ag |
SOPC + 2.5 wt% Ag |
200 mM fructose |
|---|---|---|---|---|
| kc × 10−19 [J] | 1.18 ± 0.04 | 1.02 ± 0.10 | 0.93 ± 0.08 | 0.57 ± 0.04 |
Disclaimer/Publisher’s Note: The statements, opinions and data contained in all publications are solely those of the individual author(s) and contributor(s) and not of MDPI and/or the editor(s). MDPI and/or the editor(s) disclaim responsibility for any injury to people or property resulting from any ideas, methods, instructions or products referred to in the content. |
© 2025 by the authors. Licensee MDPI, Basel, Switzerland. This article is an open access article distributed under the terms and conditions of the Creative Commons Attribution (CC BY) license (http://creativecommons.org/licenses/by/4.0/).
Copyright: This open access article is published under a Creative Commons CC BY 4.0 license, which permit the free download, distribution, and reuse, provided that the author and preprint are cited in any reuse.


