
Submitted:
24 May 2023
Posted:
26 May 2023
You are already at the latest version
Abstract
Bovine lactoferrin (bLf) is a milk-derived protein that exhibits multiple biological activities and has been explored towards different therapeutic applications. Since this molecule is susceptible to degradation and some of its properties depend on its tertiary structure, the encapsulation of bLf in stimuli-responsive therapeutic formulations provides an added value to potentiate its biological activities when administered. Plasmonic magnetoliposomes emerge as promising nanosystems for dual hyperthermia (magneto-photothermia) and local therapy, since the combination of magnetic and gold nanoparticles (NPs) in a single nanosystem (multifunctional liposomes) enables the targeting and controlled release of encapsulated drugs. In this work, plasmonic magnetoliposomes (PMLs) containing manganese ferrite nanoparticles (28 nm size) and gold nanoparticles (~ 5 nm size) functionalized with 11-mercaptoundecanoic acid or octadecanethiol, were synthesized and loaded with bLf. The structural, magnetic and optical properties of the nanoparticles were measured by TEM, SQUID and UV/vis/NIR absorption spectroscopy. Specific Absorption Rate was determined to assess the capabilities for magnetic and photothermal hyperthermia. Finally, Saccharomyces cerevisiae was used as an eukaryotic cellular model to assess the biological activity and the mechanism of entry of bLf-loaded PMLs, through counting of colony forming units and fluorescence microscopy, respectively. The results demonstrate that PMLs are mainly internalized through an energy- and temperature-dependent endocytic process, though the contribution of a diffusion component cannot be discarded. Most notably, only bLf-loaded PMLs exhibit cytotoxicity with an efficiency similar to free bLf, attesting their promising potential for bLf delivery in the context of therapeutic interventions.
Keywords:
Plasmonic magnetoliposomes
; Dual hyperthermia
; Bovine lactoferrin
; Cytotoxicity
; Biological activity
1. Introduction
Lactoferrin (Lf) is a 80 kDa iron-binding glycoprotein of the transferrin family with multifunctional properties produced by mucosal epithelial cells or neutrophils during inflammation processes. It is present in several biological fluids such as tears, saliva, sweat and, in greater abundance, in milk [1]. Lf has been described as a multifunctional protein, as it is involved in immunomodulatory processes and exhibits antibacterial, anti-viral, anti-inflammatory, antifungal and anticancer activities [2,3,4,5,6], among others. For this reason, its potential for therapy of different diseases has been demonstrated in both in vitro and in vivo studies, as well as in clinical trials [7,8]. Indeed, Lf has been shown to exhibit antioxidant properties, which allow to reduce reactive oxygen species and inflammation, leading to the protection of cells and organs [9]. Furthermore, several studies have reported that Lf induces cytotoxicity against many types of cancer cells, inhibiting the uncontrolled proliferation of cancer cells by causing cell cycle arrest and cancer cell death [10,11]. In the fight against microbial infections, Lf is considered a protein of the first line of defense, which can act by a bacteriostatic mechanism, which consists of acquiring iron from the environment, reducing its availability for pathogenic agents, or by a bactericidal mechanism, which involves the binding of Lf to bacteria, resulting in membrane disruption [12,13]. Additionally, the antifungal activity of this protein is also well known and is associated with the condensation of nuclear chromatin, accumulation of reactive oxygen species, mitochondrial dysfunction and intracellular acidification of fungal cells [3,14,15]. Furthermore, Lf has important immunomodulatory activities since it is known to modulate the differentiation, maturation, activation, migration and proliferation of antigen-presenting cells (B cells, neutrophils, monocytes/macrophages and dendritic cells), ultimately reducing the pro-inflammatory profile [16,17].
The most commonly used route for Lf administration is oral delivery, which was demonstrated to be promising for different therapeutic applications [7,18,19]. However, Lf has been shown to undergo degradation in the gastrointestinal tract generating Lf-derived peptides. Though this degradation into smaller peptides may enhance the Lf antifungal activity [20], it may compromise some of the Lf properties and biological activities that depend on its tertiary structure [21,22]. To overcome this limitation, we sought to encapsulate bLf in stimuli-responsive therapeutic nanoformulations, in order not only to preserve its biological activity, but also to promote its targeting and controlled release [23,24].
Nanoparticles (NPs), with sizes ranging from 1 to 200 nm, exhibit numerous applications in the biomedical field, such as for diagnosis through atomic imaging, for magnetic and photothermal therapy and targeted drug delivery, among others [25]. In the last decades, liposomes have gained great importance in biomedicine. They are small spherical vesicles composed of, at least, one lipid bilayer and have been described as ideal systems for the encapsulation and delivery of bioactive compounds [26]. Magnetic nanoparticles with superparamagnetic behavior are advantageous for biomedical use, since their magnetic properties are only manifested in the presence of a magnetic field, making it possible to direct them to the target site and cause hyperthermia without causing cytotoxicity to healthy cells [27,28]. Plasmonic nanoparticles, which convert part of the absorbed energy into heat, can also be encapsulated into liposomes and be used for photothermal therapy (PTT). The Surface Plasmon Resonance (SPR) phenomenon of noble metal-based nanoparticles makes it possible to generate heat through the absorption of energy from a laser. PTT enhances the action of chemical agents because it can: (i) accumulate more nanocarriers in the affected tissue, (ii) facilitate cell membrane permeability, (iii) increase the cytotoxic effect of the drug, and (iv) release the drug at the target site [29,30,31]. The conjugation of magnetic and plasmonic NPs into a single nanosystem (multifunctional liposomes) are of great interest in nanomedicine for dual hyperthermia (magneto-photothermal).
In this work, gold and manganese ferrite NPs were prepared and incorporated in the membrane of liposomes and in the aqueous core of liposomes, respectively, forming aqueous plasmonic magnetoliposomes (PMLs). Two lipid formulations were tested, a natural phospholipid mixture (egg lecithin, Egg-PC), and 100% dipalmitoylphosphatidylcholine (DPPC), whose transition temperature is near the ones used in mild magnetic hyperthermia treatments. Bovine Lf (bLf) was incorporated in these PMLs and both the encapsulation efficiency and its release profile were determined. Finally, biological assays were performed using the yeast Saccharomyces cerevisiae as an eukaryotic model organism. The biological activity of bLf-loaded PMLs, as well as its mechanism of entry into yeast cells, were assessed by counting of colony forming units and fluorescence microscopy, respectively. The results are promising for the future use of these bLf-loaded multifunctional liposomes in therapeutic applications, such as in cancer therapy.
2. Materials and Methods
2.1. Preparation of Manganese Ferrite Nanoparticles
Manganese ferrite magnetic nanoparticles were prepared using the citrate stabilization method, adapted from a protocol previously described [32]. Therefore, to 19 mL of ultrapure water at 100 °C, 294.1 mg of trisodium citrate dihydrate (1.0×10⁻³ mol) and 1058 µL of sodium hydroxide solution (19.9×10⁻³ mol) were added. Then, 359.5 mg of iron chloride hexahydrate (1.33×10⁻³ mol) and 111.5 mg of manganese sulfate monohydrate (6.6×10⁻⁴ mol) were dissolved in 1 mL of ultrapure water and added drop by drop to the above mixture, under stirring. In this step, the colorless solution changes to a dark color. After 2 h, the solution was cooled to room temperature and washed with water and ethanol, in a 1:1 ratio, by magnetic decantation. Finally, the NPs were dried and stored in a closed container. A stock solution (20 mM) was prepared with 23.2 mg of magnetic nanoparticles in 5 mL of ultrapure water.
2.2. Preparation of Gold Nanoparticles
Gold nanoparticles were synthesized using the citrate reduction method described in [33], to obtain spherical Au NPs from 13 to 45 nm in diameter. For that, 17 µL of chloroauric acid (1.6×10⁻³ M) and 7.35 mg of trisodium citrate dihydrate (5.0×10⁻⁴ M) were added to a conical flask, containing 50 mL of ultrapure water, with stirring. To 1.5 mL of ultrapure water, 5.67 mg of sodium borohydride (0.1 M) were added and placed in the refrigerator, for a few minutes. Subsequently, this solution was added, drop by drop, to the flask, under magnetic stirring. At this point, it has been verified a change of color to red ruby. Stirring was continued for 1 hour and, at the end of the process, the gold nanoparticles were stored in the refrigerator.
2.2.1. Functionalization with 11-Mercaptoundecanoic Acid and Octadecanethiol
After preparing the gold NPs, they were functionalized by a ligand exchange process. For this purpose, two different ligands were chosen, 11-mercaptoundecanoic acid (MUA), and octadecanethiol (ODT).
In the case of MUA, 1.42 mg of MUA (1.3×10⁻³ M) were added in 5 mL of ultrapure water with 2.6 µL of sodium hydroxide solution (0.01 M) and added to 5 mL of the AuNPs in water. The solution was sonicated for 1 hour and then incubated for 24 hours, in a procedure adapted from [33]. The next day, 20 µL of a magnesium chloride solution (0.1 M) was added, to promote the precipitation of nanoparticles, and three washes were performed by centrifugation (8500 rpm) for 10 minutes, to eliminate the excess of MUA. The nanoparticles (AuNPs_MUA) were then resuspended in 5 mL of ultrapure water.
For the covering with ODT, a solution was prepared with 5 mL of ethanol and 2.86 mg of ODT (1.0×10⁻³ M) and added to 5 mL of AuNPs in water. The mixture was sonicated for 15 minutes and incubated for 2 h at room temperature. Then, to eliminate the ODT that did not bind to gold, three washing steps were performed by centrifugation (8500 rpm) for 10 minutes with ethanol and, at the end, it was resuspended in 5 mL of chloroform. This solution (AuNPs_ODT) was stored in the refrigerator.
2.3. Preparation of Plasmonic Magnetoliposomes (PMLs)
Plasmonic magnetoliposomes were synthesized using the ethanolic injection method, adapted from [34]. The magnetic NPs were incorporated in the aqueous core and the gold ones in the membrane. Two different formulations were prepared, one with the lipid mixture Egg-PC, and another with DPPC. Additionally, magnetoliposomes were prepared with either AuNPs_MUA or with AuNPs_ODT.
To an Eppendorf tube, the lipids Egg-PC or DPPC (1.0×10⁻³ M) and AuNPs_MUA or AuNPs_ODT (3.2×10⁻⁴ M) were added, and an ultrapure nitrogen stream was used to evaporate the solvent quickly. At this point, 300 µL of ethanol (or diethyl ether) and the NBD-labelled lipid NBD-C12-HPC (1.0×10⁻⁶ M) was added. This solution was added, drop by drop, to a glass tube with 5 mL of ultrapure water with MnFe2O4 NPs solution (1.0×10⁻⁴ M), under stirring.
2.4. Bovine Lactoferrin Encapsulation
bLf was encapsulated in PMLs along with the nanoparticles. The protein was acquired from DMV (Veghel, The Netherlands), its purity is about 80% with 3.5% moisture and 21% iron-saturated, according to the manufacturer. In this procedure, 187 µL of a stock solution of bLf in water (3.9 mM) were placed in the aqueous part (3 mL), together with 15 µL of a stock solution of magnetic nanoparticles in water (20 mM). The lipid solution, composed of 150 µL of a stock solution of Egg-PC in chloroform (20 mM) and 600 µL of a solution of AuNPs_MUA in water (1.6 mM), were evaporated using ultrapure nitrogen, redissolved in 300 µL of ethanol and injected into the aqueous part, forming bLf-loaded PMLs.
2.5. Preparation of Small Unilamellar Vesicles (SUVs) as Membrane Models
As membrane models, small unilamellar vesicles were used. Its preparation was accomplished using the ethanolic injection method and started by drying 350 µL of a soybean lecithin solution (20 mM) to a final concentration of 0.001 M, under an ultrapure nitrogen stream to form a thin film. Then 300 µL of ethanol and, in some cases, 64.5 µL of a solution of Nile Red 1.1×10⁻⁴ M in ethanol to obtain a final concentration of 1.0×10⁻⁶ M, were added. The above solution was added, drop by drop, to 7 mL of ultrapure water, under stirring.
2.6. Characterization of Nanoparticles and Magnetoliposomes
2.6.1. UV-Vis-NIR (Ultraviolet-Visible-Near-Infrared) Absorption
Absorption spectra were determined on a Shimadzu UV-Vis-NIR spectrophotometer, model UV-3600 Plus (Shimadzu Corporation, Kyoto, Japan). The spectrum of the magnetic nanoparticles dispersed in water was measured in the wavelength range 220 nm to 820 nm, with a concentration of 4.0×10⁻⁴ M; and for the AuNPs and AuNPs_MUA dispersed in water and AuNPs_ODT dispersed in chloroform between 250 nm and 1300 nm. The concentration used for AuNPs dispersions was 3.2×10⁻⁴ M.
2.6.2. X-ray Diffraction
X-Ray Diffraction (XRD) analyses of MnFe2O4 were performed using a PAN’alytical X’Pert PRO diffractometer (Malvern Panalytical Ltd., Malvern, UK), operating with CuKα radiation, in Bragg-Brentano configuration, from the University of Trás-os-Montes and Alto Douro (UTAD), Vila Real, Portugal.
2.6.3. Magnetic Properties
Magnetic measurements were performed in a Superconducting Quantum Interference Device (SQUID) magnetometer, Quantum Design’s MPMS 3 model (Quantum Design Inc., San Diego, CA, USA), from the Institute of Materials Physics of the University of Porto.
2.6.4. Specific Absorption Rate
The magnetic nanoparticles were dispersed in water to obtain the heating profile, using a home-built hyperthermia setup. For this measurement, the field frequency was fixed at 155 kHz under a magnetic field of 11 mT. The value of SAR was calculated by a program using IAM (Incremental Analysis Method).
2.6.5. Dinamic Light Scattering and Electrophoretic Light Scattering
The average hydrodynamic size and the zeta potential of the manganese ferrite and gold nanoparticles, as well as the magnetoliposomes, were measured using an Anton Paar equipment, Litesizer 500 model (Anton-Paar GmbH, Graz, Austria). Polystyrene or quartz cuvettes (as needed), of 10 mm of optical path, and an Univette cuvette were used for the measurements. The concentrations of the solutions of AuNPs were 1.6 mM, for magnetic nanoparticles were 2.0×10⁻⁴ M and for magnetoliposomes 1.3×10⁻³ M. A study of the size and zeta potential of NPs as a function of pH was carried out using PBS (phosphate-buffered saline) buffer solutions.
2.6.6. Transmission Electron Microscopy
Images of the magnetic nanoparticles were obtained by Transmission Electron Microscopy (JEOL JEM1010 (100 kV)) on the Center for Scientific and Technological Research Support (CACTI), of the University of Vigo, Spain. The samples were subjected to ultrasonication and then deposited on copper grids with carbon and Formvar.
TEM images were processed using ImageJ software (version 1.53t, National Institutes of Health (NIH), Bethesda, MD, USA), and the resulting histograms were fitted to a Gaussian distribution.
2.6.7. Fluorescence Spectroscopy Measurments
Fluorescence measurements were recorded using the Fluorolog-3, model FL-1039 (HORIBA Jobin Yvon IBH Ltd., Glasgow, UK), equipped with Glan-Thompson polarizers, double monochromators in excitation and emission, and a cuvette holder with temperature control.
2.6.7.1. Fluorescence Emission Studies
To verify the incorporation of the nanoparticles in liposomes, assays based on fluorescence emission (quenching measurements) were performed, using NBD-C12-HPC as a fluorescent-labelled lipid, with λexc= 450 nm. In this labelled lipid, the nitrobenzoxadiazole (NBD) probe is bound in the acyl chains of phospholipids and has good photophysical properties, such as high fluorescence quantum yield, good sensitivity to the environment and possible adaptation either as a donor or acceptor, for FRET (Förster Resonance Energy Transfer) assays [35].
2.6.7.2. Fusion Assays with Membrane Models
The interaction of the plasmonic magnetoliposomes with membrane models (SUVs) was determined by FRET, using the fluorescent-labelled lipid NBD-C12-HPC (0.001 mM), which acted as the energy donor, and the dye Nile Red (0.001 mM) as the acceptor. The NBD-labelled lipid was incorporated into the PMLs, while the dye Nile Red into the SUVs. The Nile Red probe is an uncharged and hydrophobic molecule, and its fluorescence depends on the polarity of the environment where it is located. In polar media, it presents a redshift at maximum emission, along with fluorescence quenching [36].
2.6.7.3. Anisotropy Measurements
Fluorescence anisotropy measurements were also performed to study the phase transition temperature of DPPC liposomes and different concentrations of plasmonic nanoparticles in the membrane. The lipid membrane probe 1,6-diphenyl-1,3,5-hexatriene (DPH) was incorporated in the liposomes and its fluorescence anisotropy was measured as function of temperature, using polarizers in vertical and horizontal position, in excitation and emission, for temperatures below and above the lipid transition temperature, Tm (from 25 °C to 55 °C).
The fluorescence anisotropy I is experimentally determined by equation 1:
where VV and VH are the intensities of the emission spectra obtained with vertical and horizontal polarization, respectively (for vertically polarized excitation light), HV and HH are the emission intensities obtained with vertical and horizontal polarization (for horizontally polarized excitation light) and is the instrumental correction factor.
2.6.8. Encapsulation Efficiency of Bovine Lactoferrin
The encapsulation efficiency (EE%) of bLf in PMLs was determined by measurements of the fluorescence emission of the compound itself, using Amicon filters. bLf solutions were prepared (in water) with known decreasing concentrations, to obtain a calibration curve. The fluorescence emission spectrum was plotted and the percentage of compound present was calculated, taking into account the calibration curve obtained above, using the equation 2 [37]:
where [bLf]t is the total concentration of bLf that was added in magnetoliposomes preparation and [bLf]non-encapsulated is the concentration of bLf that was not incorporated in the nanosystems.
2.6.9. Release Assays
To evaluate the bLf release profile from PMLs, assays were performed using rich medium, Yeast Extract Peptone Dextrose (YEPD) medium, and Tris-HCl buffer at 30 °C and 37 °C.
YEPD medium was prepared with 250 mL of deionized water, 1% (w/v) yeast extract, 2% (w/v) bactopeptone and 2% (w/v) glucose. For the buffer, to 50 mL of deionized water 60.57 mg of Trizma® base was added, to obtain a final concentration of 0.01 M, and the pH was adjusted with HCl to pH=7.2.
Hereupon, the non-encapsulated part in the Amicon filters was removed and the YEPD medium was placed in one tube and the Tris-HCl Buffer in the other. The two tubes were placed in a 30 °C incubator with agitation (200 rpm) and samples were taken over three consecutive days. The process was repeated for the assay at 37 °C, which was placed in an incubator at 150 rpm. Two calibration curves were performed, with different known concentrations of bLf, in YEPD medium and Tris-HCl buffer.
2.6.10. Photothermia Assays
Photothermia tests were performed to evaluate the heating capacity of the gold nanoparticles. This study was carried out using an experimental setup assembled in the laboratory, consisting of a sample holder, a continuous laser light source of 532 nm and 200 mW of power, which irradiated the sample placed in a glass cuvette (10 mm), and a T-type thermocouple connected to a digital multimeter (Agilent U1242A) for temperature monitoring. Each assay was irradiated for 30 minutes (heating), followed by 30 minutes with cooling (laser off), and the temperature was recorded over time.
2.7. Biological Assays
2.7.1. Growth Conditions
S. cerevisiae wild-type (wt) strain BY4741 cells were grown on rich YEPD medium. Growth was performed overnight at 30 °C and 200 rpm, until attainment of the exponential phase (OD640 of 0.7).
2.7.2. In Vitro Cytotoxicity Assays
The cytotoxicity of bLf-loaded PMLs was compared with unloaded PMLs, as well as with free bLf, by counting of colony forming units (CFUs). The treatment with bLf and PMLs was performed as previously described for bLf alone [15]. Briefly, after cells reaching the exponential phase, they were harvested to a final OD640 of 0.5 and resuspended in 10 mM Tris-HCl buffer pH 7.2. Afterwards, cells were incubated at 30 °C for up to 90 minutes with free bLf, unloaded PMLs and bLf-loaded PMLs at different concentrations (62.5, 125 and 250 μg/mL), using stock solutions of 4 mM for bLf and of 10 mg/mL for PMLs and PMLs+bLf. At each timepoint analyzed, serial dilutions were performed for each condition and then, 5 drops of 40 μL of the last dilution (10-4) were dropped into Petri dishes containing YEPD plus 2% (w/v) agar, and the OD640 was read. Petri dishes were incubated at 30 °C for 48 hours, and the grown colonies were counted.
The same method was applied to compare the cell viability of the endocytosis-defective mutant strain (end3Δ) [38] with the wt strain upon treatment with unloaded PMLs and bLf-loaded PMLs. In this assay, only the highest concentration (250 μg/mL) was tested for different time points (15, 30 and 90 minutes).
2.7.3. Nanosystems Internalization Assays
The S. cerevisiae wt strain BY4741 was used to evaluate the internalization of PMLs unloaded or loaded with bLf, using a methodology adapted from [39]. Cells were resuspended in 10 mM Tris-HCl buffer pH 7.2 and incubated with DPH (7.5 µM) labelled PMLs unloaded or loaded with bLf (250 µg/mL), for 15, 30, 60 and 90 minutes, at 30 °C and 200 rpm. Samples were centrifuged for 5 minutes at 3000 ×g and resuspended in 500 µL of PBS 1× (0.137 M NaCl, 2.7 mM KCl, 10 mM Na2HPO4, 1.8 mM KH2PO4, pH 7.4). Finally, a new centrifugation (3000 ×g, 2 minutes) was performed and 450 µL of the obtained supernatant were removed and the cells were resuspended in the remaining 50 µL. Samples were observed under a fluorescence microscope (Leica Microsystems DM-5000B, Wetzlar, Germany) with a 100× oil immersion objective and with the appropriate filter settings for DPH. The images were obtained with a Leica DCF350FX digital camera (Leica Camera AG, Wetzlar, Germany) and processed with LAS (Leica Microsystems Software).
2.7.4. Nanosystems Cellular Uptake under Inhibitory Conditions
Nanosystems uptake experiments in wt cells were also performed using three different inhibitory conditions, namely: incubation with the endocytosis inhibitor methyl-β-cyclodextrin (MβCD, 5 mg/mL) or with the glycolysis inhibitor 2-deoxyglucose (2-DG, 20 nM) and also, incubation at 4 °C to inhibit cellular metabolism [15,39]. These experiments were carried out using the same methodology as in 2.7.2, modifying only one step. In this case, after changing the medium to Tris-HCl buffer, the cells were incubated under the different inhibitory conditions for 30 minutes. For the inhibitory condition at 4 °C, the temperature was maintained throughout the entire process. After the 30 minutes incubation under the different inhibitory conditions, DPH (7.5 µM) labelled bLf-loaded PMLs (250 µg/mL) were added and incubated for 15, 30, 60 and 90 min with yeast cells, treated with the respective inhibitor and then observed under the fluorescence microscope.
3. Results and Discussion
3.1. Nanoparticles Characterization
3.1.1. UV-VIS-NIR Absorption Spectroscopy
The absorption spectrum of magnetic nanoparticles of manganese ferrite is shown in Figure 1. This type of ferrites was chosen for their higher magnetic susceptibility when compared to ferrites composed of other transition metals [40]. Figure 1A shows a characteristic spectrum of these nanoparticles [34], with notable absorption in the UV/Visible region. An important parameter to evaluate the optical characteristics of the nanoparticles is the band gap. The equation 3 allows to determine the band gap energy (Eg) by creating a Tauc plot:
where 𝛼 is the absorption coefficient, ℎ the Planck constant, 𝜈 the frequency of light, and 𝑛 is related to the nature of the transition, being equal to 2 for a direct semiconductor and 1/2 for an indirect one.
(𝛼ℎ𝜈)𝑛 ∝ (ℎ𝜈 − 𝐸𝑔)
For the synthesized manganese ferrite nanoparticles, the Tauc plot shown in Figure 1A inset) allows to confirm an indirect semiconductor material with a band gap energy value of 1.02 eV, which is in agreement with the value of 0.98 eV reported by Rafique et al. [41]. Regarding the gold nanoparticles, in their absorption spectra, represented in Figure 1B, it is verified the presence of a characteristic and well defined plasmonic band. For the neat Au nanoparticles (AuNPs) in water, the maximum peak at 520 nm points to small nanoparticles, of around 5 – 10 nm size [42]. This small size is relevant for the proposed application, as we aim preparing Au NPs functionalized with suitable ligands for anchoring them in the lipid membrane, but without perturbing significantly the membrane behaviour. AuNPs_MUA (NPs covered with 11-mercaptoundecanoic acid) in aqueous media exhibit a plasmonic band at 548 nm, in accordance with the results reported by Ansar et al. [33]. For AuNPs_ODT (gold NPs covered with octadecanethiol in chloroform), the plasmon band is centered at 525 nm, which is also in agreement with previous reports for hydrophobic gold nanoparticles [43]. The position of the plasmonic band must be taken into account in the assessment of photothermal capabilities of AuNPs.
3.1.2. X-ray Diffraction Analysis of MnFe2O4 NPs
X-ray diffraction analysis is essential to obtain the crystallinity and degree of purity of the synthesized magnetic NPs. The XRD diffractogram is shown in Figure 2 and was analyzed with Profex software (version 4.3.6) [44], using a Rietveld analysis implemented by BGMN [45], starting from the CIF file number 1010131 (space group Fd-3m:1) and resulting in a fit with χ2 = 1.00 and RP = 6.2. The lattice parameter of 8.356 Å was slightly lower than the one included in the CIF file (8.515 Å).
The XRD pattern proves the synthesis of magnetic NPs (100% MnFe2O4) with a crystalline structure and 28 nm size (Figure 2). The diffraction peaks of the MnFe2O4 NPs are observed at 2θ = 18.3° (1 1 1), 30.2° (2 2 0), 35.6° (3 1 1), 37.2° (2 2 2), 43.2° (4 0 0), 53.7° (4 2 2), 57.2° (5 1 1) (3 3 3), 62.8° (4 4 0), 71.3° (6 2 0), 75.4° (6 2 2), 79.4° (4 4 4), 87.2° (6 4 2), 90.1° (7 3 1) (5 5 3) and 95.0° (8 0 0). The relative intensities are compatible with a full inverted structure with preferred orientation effects taken into account, considering the crystal symmetry as implemented in BGMN model [45].
3.1.3. Magnetic and Structural Properties of MnFe2O4 Nanoparticles
The magnetization curve (hysteresis cycle) of the manganese ferrite nanoparticles is shown in Figure 3, and the values of saturation magnetization (Ms), remanent magnetization (Mr), coercive field (Hc) and the ratio between Mr/Ms are summarized in Table 1.
The saturation magnetization value, 65.32 emu/g, is significantly larger than the ones previously reported for the same type of nanoparticles [32,34], evidencing an optimized synthesis method. The ratio between the remanent magnetization and the saturation magnetization, Mr/Ms (magnetic squareness value), points to a nanomaterial with superparamagnetic behavior (value below 0.1), indicating that 90% of the magnetization is lost after removing the applied magnetic field. This behavior of the nanoparticles is crucial to decrease toxicity and, therefore, points to a potential use in biomedicine.
To obtain the shape and size distribution of the synthesized MnFe2O4 nanoparticles, they were subjected to characterization by electron microscopy. TEM images reveal that the magnetic nanoparticles have roughly a spherical shape, with the presence of some aggregation (Figure 4A).
The TEM image of the nanoparticles was treated with ImageJ software and about 100 particles of the image were considered. A size distribution of 32 ± 11 nm, was obtained from the histogram shown in Figure 4B. These results are in accordance with the ones from XRD.
3.1.4. Specific Absorption Rate (SAR)
For assessment of magnetic hyperthermia capabilities, a stable aqueous dispersion of magnetic nanoparticles (35 mg/mL) was subjected to an alternating magnetic field of 11 mT and a frequency of 155 kHz, as previously mentioned. The heating profile is displayed in Figure 5A. The potential of the gold nanoparticles as photothermia agents was also evaluated for Au NPs and Au NPs covered with MUA (AuNPs_MUA). For that, the heating curves of aqueous solutions (1 mg/mL) were measured under irradiation of a continuous laser of 532 nm (Figure 5B). SAR values for both magnetic and plasmonic NPs were determined according to equation 4:
where is the specific heat capacity of the medium (4.186 J g-1 K-1), / is the initial slope of the temperature curve as a function of time, and and are the mass of solvent and of nanoparticles, respectively [46]. Table 2 summarizes the magnetic and photothermal hyperthermia results.
Magnetic hyperthermia heating curve shows a large temperature increase of 17.5 °C in 30 minutes (Figure 5A), with a corresponding SAR value of 4.18 W/g. When AMF is shutting down, the aqueous dispersion returns to room temperature after 24 min. Pradhan et al. reported, for MnFe2O4 spherical NPs synthesized by co-precipitation method, a SAR value of 97 W/g, under an AMF of 18.8 mT amplitude and 300 kHz frequency [47]. Taking the much lower AMF amplitude and frequency values used here and the appropriate temperature increase for therapeutic action, the MnFe2O4 NPs obtained in this work are promising as magnetic hyperthermia agents, under more safety AMF operating conditions.
Photothermia experiments demonstrate a temperature increase of 4 °C and 1.5 °C, for Au NPs and AuNPs_MUA, respectively, upon 30 minutes of laser irradiation, with corresponding SAR values of 2134 W/g and 107 W/g respectively (Table 2). The lower photothermal performance of AuNPs_MUA is related to the NPs covering with 11-mercaptoundecanoic acid, which is a self-assembling amphiphilic molecule (with a hydrophobic aliphatic chain and a hydrophilic head carboxylic group) [48]. This character causes self-aggregation of MUA-covered gold nanoparticles in aqueous media, thus affecting the heating profile. Nevertheless, taking the neat AuNPs and considering an initial temperature of 37 °C (normal body temperature), this NPs solution would reach 41 °C in half an hour, being possible to trigger apoptosis in the cells around it [49].
3.2. Characterization of Plasmonic Magnetoliposomes
The magnetic and plasmonic nanoparticles were included in liposomes, to obtain plasmonic magnetoliposomes suitable as nanocarriers for transport and release of bLf.
3.2.1. Fluorescence Quenching by Magnetic and Plasmonic NPs
The emission of the fluorescent-labeled lipid NBD-C12-HPC (NBD as the fluorophore) included in the lipid formulation in liposomes with only MnFe2O4 NPs, PMLs with MnFe2O4 and AuNPs_MUA or AuNPs_ODT and liposomes composed of Egg-PC (the latter without nanoparticles and with the same concentration of lipid) is shown in Figure 6 (similar results were obtained for DPPC-based nanosystems).
In magnetoliposomes, with only MnFe2O4 NPs, a quenching effect on the NBD fluorescence is verified, that results from the proximity between the dye and the MnFe2O4 NPs, which absorb in a wide wavelength range. This quenching effect is larger in PMLs with the presence of the two types of nanoparticles. This phenomenon confirms the incorporation of both MnFe2O4 NPs and AuNPs with MUA or ODT (Figure 6), and can be explained by photoinduced electron transfer and/or an increase in intersystem crossing efficiency due to the heavy atom effect. The last mechanism usually prevails in the emission quenching in this type of nanosystems [50].
3.2.2. Fusion Assays with Membrane Models
To assess the fusion ability of the developed PMLs with models of biological membranes, the labeled lipid NBD-C12-HPC was incorporated into the PMLs’ lipid bilayer, while the dye Nile Red was incorporated into Small Unilamellar Vesicles (SUVs) used as membrane models. If fusion between PMLs and SUVs occur, it is expected a FRET process, where the NBD (in PMLs) acts as the energy donor and the hydrophobic dye Nile Red (located in SUVs) acts as the energy acceptor [34]. For resonance energy transfer to occur, the donor-acceptor distance must be lower than 100 Å. Fluorescence spectra of DPPC liposomes containing MnFe2O4 NPs and AuNPs_MUA (Figure 7A) and MnFe2O4 and AuNPs_ODT (Figure 7B), before and after interaction with SUVs, were measured by exciting the energy donor (a residual excitation of Nile Red is also detected at this wavelength).
Before the interaction with SUVs, the presence of an emission band is observed in the separate samples of PMLs and SUVs. The band in Figure 6A and 6B of PMLs has maximum around 535 nm, corresponding to NBD emission. The band of SUVs has maximum around 635 nm, due to the emission of Nile Red in aqueous environment [34]. After interaction with the membrane models, there is a decrease in the fluorescence band of NBD (donor) and an increase in the fluorescence band of Nile Red (acceptor). These results are similar to those previously reported for magnetoliposomes containing manganese ferrite nanoparticles [34], and validate the membrane fusion between PMLs and SUVs. Consequently, the results allow concluding that PMLs are favorable as drug delivery systems, as they are able to fuse with cell membranes.
3.2.3. Influence of AuNPs in Phase Transition of DPPC
As referred, gold nanoparticles were covered with specific ligands to anchor them in the lipid bilayer of PMLs. Therefore, it is important to assess the effect of AuNPs_MUA and AuNPs_ODT, in two different concentrations, on the phase transition of DPPC-based PMLs. For that purpose, the fluorescence anisotropy of DPH, a membrane probe, was measured varying temperature. This probe is usually employed to determine changes in membrane fluidity and transition temperature of phospholipids, since a long time [51,52]. The results are summarized in Figure 8.
It is possible to verify that the incorporation of the AuNPs_ODT into PMLs leads to a notable decrease in fluorescence anisotropy values of the membrane probe DPH. This indicates an increase in the membrane fluidity, with the loss of DPPC phase transition for the higher AuNPs_ODT concentration, pointing to a strong perturbation of membrane dynamics. For the PMLs with AuNPs_MUA, only the higher concentration showed a decrease of DPH anisotropy, indicating that these NPs have lower influence in the membrane fluidity. Moreover, the DPH anisotropy variation is very similar for neat DPPC liposomes and PMLs with AuNPs_MUA at 3.2×10⁻⁴ M, evidencing a transition temperature around 40 °C [53]. For these reasons, the AuNPs_MUA nanoparticles were selected for the subsequent biological studies with bLf.
3.2.4. Structural and Surface Charge Characterization
The nanosystems size and polydispersity (PDI) are important parameters that significantly influence, for example, pharmacokinetics, tissue diffusion, and kidney excretion [54]. It is generally accepted that the desirable size of drug delivery systems should be between 50 and 200 nm [55]. PDI values reflect the degree of heterogeneity of size distributions, being recognized for this type of application, that PDI must be below 0.3, indicating a homogeneous population of the nanocarriers [54]. The hydrodynamic diameter and PDI of the PMLs were measured by DLS (Table 3). All formulations revealed a hydrodynamic diameter around or slightly above 200 nm, except the PMLs with AuNPs_ODT. Generally, the size is narrowly distributed, with a polydispersity index below the 0.3 limit. The presence of the magnetic and plasmonic nanoparticles causes a small increase in size relatively to the neat liposomes, which may be due to the gold nanoparticles in the lipid membrane. It was previously shown that ferrite nanoparticles of transition metals (nickel ferrite, manganese ferrite) enclosed in the aqueous inner volume of magnetoliposomes have very little influence in the nanosystems’ diameter [34,56].
Zeta potential values (Table 3) reveal negative charged nanosystems for Egg-PC-based liposomes and PMLs, with a slight diminution of the surface charge (being less negative) in the magnetic/plasmonic systems, as expected, since the Au nanoparticles are located at the lipid membrane. For DPPC-based liposomes, an inversion of zeta potential values is detected in the presence of the nanoparticles, which seem to perturb the lipid membrane, exposing the positive choline head group. In general, the zeta potential values higher than ± 30 mV point to long-time colloidal stability of the nanosystems [57]. No appreciable variations in both hydrodynamic size and zeta potential are detected after 24 h of preparation, except for DPPC PMLs with AuNPs_ODT. These Au nanoparticles also seem to have a higher influence in the hydrodynamic size of the liposomes when compared with AuNPs_MUA.
Taking all the previous characterization into account, bLf was encapsulated only in Egg-PC plasmonic magnetoliposomes containing manganese ferrite NPs and AuNPs_MUA. TEM images of these PMLs (Figure 9) revealed roughly spherical nanostructures, with sizes around or below 200 nm, and some small Au nanoparticles (the dark spots), with sizes around 5 nm, at the membrane surface (the MnFe2O4 NPs are enclosed in the aqueous inner volume of the liposomes).
3.3. bLf-Loaded Plasmonic Magnetoliposomes
3.3.1. Hydrodynamic Diameter and Zeta Potential
The hydrodynamic diameter and zeta potential of bLf-loaded PMLs were measured at time 0 (immediately after preparation), at 24 hours and 120 hours after synthesis, to assess their stability over time (Figure 10).
Both size and zeta potential show similar values over time, evidencing the stability of the nanosystems since there are no significant changes after 120 hours of their formation. The hydrodynamic diameter of bLf-loaded PMLs is around 200 nm, suitable for biomedical applications. bLf-loaded nanosystems have positive zeta potential values, proving the incorporation of bLf, which is a positively-charged molecule [58].
3.3.2. bLf Encapsulation Efficiency and Release Profiles
The encapsulation efficiency, EE(%), of bLf in PMLs was obtained through measurements of fluorescence emission. The maximum fluorescence intensity values of bLf in water (λmax = 300 nm) obtained for the phase corresponding to the non-encapsulated compound, allowed the calculation of the EE(%) according to equation (2) (Table 4).
The average value of EE percentage obtained (95.6% ± 1.0%), for these nanosystems, confirms the incorporation of bLf in the PMLs, as well as their capacity as carriers for this protein. The EE percentage achieved for bLf is significantly higher than the percentage reported for the encapsulation of several proteins in liposomes [59].
The bLf release behavior was studied, over time, to assess the drug release profile from plasmonic magnetoliposomes. Figure 11 shows the percentage of bLf released from PMLs.
Two mathematical models, the Weibull model and first-order kinetic model, were used to better understand the release mechanism of bLf from the PMLs. The Weibull model expresses the fraction of released compounds accumulated (m) in solution at time t, following Equation 5 [60],
where a denotes the timescale of the process, Ti is a location parameter indicating the latency time of the release mechanism, and b parameter denotes the curve shape. Though the Weibull mathematical model is empirical, a correlation between the model parameters and diffusional mechanism can be established. For b > 1, the transport follows a complex release mechanism; b ≤ 0.75 indicates Fickian diffusion (in either fractal or Euclidian spaces), and 0.75 < b < 1 indicates a combined mechanism between Fickian diffusion and Case II transport.
The first-order mathematical model is described by Equation 6 [61],
where F(%) and M0 are the percentage and the total amount of the compound released, respectively, k is the first-order rate constant, and t is the time.
The release profile of bLf from the plasmonic magnetoliposomes was obtained in both YEPD medium and Tris-HCl buffer, at 37 °C. Figure 11A shows the percentage of bLf cumulative released from PMLs, during a 72 h period. The release kinetic data up to 24 h were fitted to Weibull and first-order kinetic models and the fitting parameters obtained are summarized in Table 5. Figures 11B and 11C display the experimental data in the first 24 h, fitted to the Weibull model (as an example).
The experimental data allow a good fitting to the Weibull and first-order kinetic models, with high determination coefficients. A slightly better fit was obtained for the Weibull model (Table 5). The parameter b indicates a Fickian type transport in Tris-HCl buffer and a combination of Fickian diffusion and Case II transport mechanism in YEPD medium. The faster release obtained in Tris-HCl buffer may be due to a hampered release of bLf in YEPD medium, considering this is an amino acid-rich medium.
3.3. Biological Activity of bLf-Loaded PMLs
The biological activity of bLf-loaded PMLs of Egg-PC was assessed using the yeast S. cerevisiae. This unicellular eukaryotic organism is considered a model organism for assessing the effect of compounds in higher eukaryotes, since most processes and cellular machinery are evolutionarily conserved between yeast and higher eukaryotic cells. Indeed, it has been previously used to study the mechanisms of action of free bLf, which were also validated in human cell lines [62,63].
3.3.1. Evaluation of Cytotoxicity and Internalization of bLf-Loaded PMLs
Yeast cells were incubated with bLf-loaded PMLs, as well as with unloaded PMLs and free bLf, and their effect on cell survival was monitored by CFUs counting (Figure 12A).
While unloaded PMLs did not affect cell viability, PMLs loaded with increasing concentrations of bLf caused an increased loss of cell viability, which was not statistically different from that observed for free bLf. Altogether, these results show that PMLs per se are not cytotoxic and are able to transport and release bLf without loss of its biological activity.
After confirming that the bLf-loaded PMLs have promising characteristics for biomedical applications, as they preserve bLf biological activity, studies were carried out to confirm their internalization. In these assays, unloaded PMLs and bLf-loaded PMLs were labelled with the fluorescent probe DPH, which is used to visualize hydrophobic regions of membranes in structural and dynamic studies [64]. Through fluorescence microscopy, it was possible to verify that the nanosystems are internalized by yeast cells (Figure 12B).
3.3.2. Study of the Internalization Mechanism of bLf-Loaded PMLs
To understand the mechanism of internalization, the end3Δ mutant, known to be deficient in endocytosis, was used. This strain lacks the END3 gene, which encodes a protein known to be involved in endocytosis [39]. Thereunto, the cytotoxicity of unloaded and bLf-loaded PMLs (250 µg/mL) in the wt strain and end3Δ mutant, was evaluated over time (Figure 13). Although the end3Δ mutant tends to show a higher survival than the wt strain, 15 to 90 minutes after treatment with bLf-loaded PMLs, the differences were not statistically significant (Figure 13).
To further understand the mechanism of internalization of the developed nanocarriers, their uptake was monitored under different inhibitory conditions through fluorescence microscopy, as above described. The analysis of fluorescence microscopy images allowed to determine the percentage of yeast cells that internalized bLf-loaded PMLs on the untreated control cells and under the different inhibitory conditions (Figure 14A). MβCD is a lipid rafts disrupting agent known to deplete cholesterol from the plasma membrane. Since it affects membrane fluidity, it inhibits different endocytic pathways namely fast endophilin-mediated endocytosis, clathrin-independent endocytosis, micropinocytosis and phagocytosis, and also caveolin-mediated endocytosis in mammalian cells [64]. 2-DG is a non-metabolizable analogue of glucose that inhibits glycolysis and leads to ATP depletion [15]. In addition, yeast cells were incubated with PMLs at low temperature (4 °C) to ascertain whether diffusion through the plasma membrane may also contribute to PMLs uptake, as it is temperature dependent [65,66].
Figure 14A demonstrates that 15 minutes after incubation under the three inhibitory conditions, the internalization of the bLf-loaded PMLs is significantly decreased in comparison with the control, which is maintained over 30 and 60 minutes for the incubation at 4 °C and with MβCD, respectively. Figure 14B allows a visual observation of the uptake of the nanosystems in each condition. The inhibitory effect on PMLs internalization induced by pre-treatment with 2-DG indicates that the uptake process depends on the energy generated by glucose metabolism [15], in agreement with the significant reduction in PMLs uptake at 4 °C [65,66]. However, at longer PMLs incubation times (60-90 min), both 2-DG and low temperature do not appear to affect PMLs uptake, which suggests that transmembrane diffusion may also be contributing to PMLs uptake in yeast cells. This interpretation is reinforced by the observation of a similar uptake of PMLs by MβCD pre-treated and control cells at 90 min timepoint.
Data from the literature shows that micropinocytosis is involved in the uptake of nanosystems with diameters greater than 200 nm [64,67]. As for charged systems, their internalization is known to be mediated by clathrin-mediated endocytosis (CME) and caveolae-mediated endocytosis (CvME) [67,68]. On the other hand, it has been demonstrated that nanoparticles with sizes larger than 8 nm enter cells by energy dependent processes, generally involving endocytosis [69]. Accordingly, the internalization of the PMLs herein developed, which have a medium size around 20 nm, is energy- and temperature-dependent, as attested by the results obtained with the 2-DG inhibitor and 4 °C, respectively. In addition, the results with MβCD suggest that an endocytic process is involved in the internalization of PMLs by yeast cells. A similar uptake mechanism was described for resveratrol-loaded liposomes in yeast [39]. Furthermore, it was shown that cationic nanosystems have the ability to bind directly to the anionic head of phospholipids at the cell membrane, which can induce CME internalization [23,24]. As the herein developed PMLs have positive charge, their internalization may occur through this specific endocytic pathway. However, further studies are required to better characterize whether a diffusion component, as well as which specific endocytic pathways are involved in their uptake.
4. Conclusions
In this work, a multifunctional nanocarrier containing the bLf protein was developed as a new approach for different therapeutic applications using this protein. Superparamagnetic nanoparticles of manganese ferrite were obtained with sizes around 20 nm and a saturation magnetization of Ms = 65.32 emu/g. Furthermore, the assessment of the hyperthermia capability showed strong heating capacity in just 30 minutes. Plasmonic gold nanoparticles functionalized with 11-mercaptoundecanoic acid (MUA) or octadecanethiol (ODT) were also synthesized. Both types of NPs (magnetic and plasmonic) were encapsulated in liposomes of DPPC and Egg-PC, forming plasmonic magnetoliposomes (PMLs). FRET assays indicated the fusion ability of the developed PMLs with biomembrane models. Fluorescence anisotropy studies of DPH probe allowed us to conclude that AuNPs_MUA do not significantly alter the membrane fluidity and phase transition temperature of DPPC liposomes, while the same does not happen for AuNPs_ODT. The Egg-PC liposomes have revealed to be more suitable for incorporation of functionalized AuNPs, being chosen as nanocarriers for bLf and used in the release studies and biological assays. The encapsulation of bLf exhibited an efficiency value of 96 ± 1%, suggesting PMLs as promising nanocarriers for this protein. bLf-loaded PMLs have sizes around 200 nm, stable for at least 5 days, and a positive zeta potential.
Finally, the biological assays allowed us to demonstrate the PMLs promising potential for bLf delivery in the context of therapeutic interventions as they are not cytotoxic per se and are able to transport and release bLf without loss of its biological activity. Moreover, the internalization assays suggest that the uptake of bLf-loaded PMLs is mainly mediated by an energy- and temperature-dependent, and MβCD-inhibitable endocytic process. However, the contribution of a diffusion component to PMLs uptake by yeast cells cannot be discarded. All these features constitute an added value of the developed nanosystems for their use as bLf nanocarriers. Indeed, the encapsulation of bLf in the developed nanocarriers can be a solution to preserve its tertiary structure-dependent biological activities and avoid degradation, and likely will increase the local amount of intact bLf reaching the therapeutic target. The therapeutic effect of bLf, in combination with dual hyperthermia (promoted by both magnetic stimuli and laser irradiation) are advantageous for developing therapeutic applications based on bLf, especially against cancer.
In summary, the developed multifunctional nanosystems appear as excellent transport vehicles for bLf, and likely for other drugs, allowing specific targeting through magnetic hyperthermia, and efficient release of this protein, constituting a promising approach for therapeutic interventions.
Author Contributions
Conceptualization, M.C.-R., C.S.-P. and E.M.S.C.; methodology, M.P., A.R.O.R. and C.S.-P.; validation, A.R.O.R., M.C.-R., C.S.-P. and E.M.S.C.; formal analysis, M.P., A.R.O.R. and L.A., investigation, M.P. and L.A.; visualization, A.R.O.R., L.A., M.C.-R. and C.S.-P.; supervision, C.S.-P. and E.M.S.C.; writing—original draft preparation, M.P.; writing—review and editing, A.R.O.R., M.C.-R., C.S.-P. and E.M.S.C. All authors have read and agreed to the published version of the manuscript.
Funding
This study was supported by the Portuguese Foundation for Science and Technology (FCT) under the scope of the strategic funding of CEB (UIDB/04469/2020), CBMA (UIDB/04050/2020) and CF-UM-UP (UIDB/04650/2020) units.
Institutional Review Board Statement
Not applicable.
Informed Consent Statement
Not applicable.
Data Availability Statement
Not applicable.
Conflicts of Interest
The authors declare no conflict of interest.
References
- Kowalczyk, P.; Kaczyńska, K.; Kleczkowska, P.; Bukowska-ośko, I.; Kramkowski, K.; Sulejczak, D. The Lactoferrin Phenomenon—A Miracle Molecule. Molecules 2022, 27, 1–16. [Google Scholar] [CrossRef] [PubMed]
- Andrés, M.T.; Fierro, J.F. Antimicrobial Mechanism of Action of Transferrins: Selective Inhibition of H+-ATPase. Antimicrob. Agents Chemother. 2010, 54, 4335–4342. [Google Scholar] [CrossRef] [PubMed]
- Santos-Pereira, C.; Andrés, M.T.; Chaves, S.R.; Fierro, J.F.; Gerós, H.; Manon, S.; Rodrigues, L.R.; Côrte-Real, M. Lactoferrin Perturbs Lipid Rafts and Requires Integrity of Pma1p-Lipid Rafts Association to Exert Its Antifungal Activity against Saccharomyces cerevisiae. Int. J. Biol. Macromol. 2021, 171, 343–357. [Google Scholar] [CrossRef]
- Santos-Pereira, C.; Guedes, J.P.; Ferreira, D.; Rodrigues, L.R.; Côrte-Real, M. Lactoferrin Perturbs Intracellular Trafficking, Disrupts Cholesterol-Rich Lipid Rafts and Inhibits Glycolysis of Highly Metastatic Cancer Cells Harbouring Plasmalemmal V-ATPase. Int. J. Biol. Macromol. 2022, 220, 1589–1604. [Google Scholar] [CrossRef]
- Farid, A.; El Shemy, M.; Nafie, E.; Hegazy, A.; Abdelhiee, E. Anti-Inflammatory, Anti-Oxidant and Hepatoprotective Effects of Lactoferrin in Rats. Drug Chem. Toxicol. 2021, 44, 286–293. [Google Scholar] [CrossRef]
- Einerhand, A.W.C.; van Loo-Bouwman, C.A.; Weiss, G.A.; Wang, C.; Ba, G.; Fan, Q.; He, B.; Smit, G. Can Lactoferrin, a Natural Mammalian Milk Protein, Assist in the Battle against COVID-19? Nutrients 2022, 14, 1–23. [Google Scholar] [CrossRef]
- Russo, R.; Superti, F.; Karadja, E.; De Seta, F. Randomised Clinical Trial in Women with Recurrent Vulvovaginal Candidiasis: Efficacy of Probiotics and Lactoferrin as Maintenance Treatment. Mycoses 2019, 62, 328–335. [Google Scholar] [CrossRef]
- Matino, E.; Tavella, E.; Rizzi, M.; Avanzi, G.C.; Azzolina, D.; Battaglia, A.; Becco, P.; Bellan, M.; Bertinieri, G.; Bertoletti, M.; et al. Effect of Lactoferrin on Clinical Outcomes of Hospitalized Patients with COVID-19: The LAC Randomized Clinical Trial. Nutrients 2023, 15, 1–16. [Google Scholar] [CrossRef]
- Aoyama, Y.; Naiki-Ito, A.; Xiaochen, K.; Komura, M.; Kato, H.; Nagayasu, Y.; Inaguma, S.; Tsuda, H.; Tomita, M.; Matsuo, Y.; Takiguchi, S.; Takahashi, S. Lactoferrin Prevents Hepatic Injury and Fibrosis via the Inhibition of NF-ΚB Signaling in a Rat Non-Alcoholic Steatohepatitis Model. Nutrients 2022, 14, 42. [Google Scholar] [CrossRef]
- Pereira, C.S.; Guedes, J.P.; Gonçalves, M.; Loureiro, L.; Castro, L.; Gerós, H.; Rodrigues, L.R.; Côrte-Real, M. Lactoferrin Selectively Triggers Apoptosis in Highly Metastatic Breast Cancer Cells through Inhibition of Plasmalemmal V-H+-ATPase. Oncotarget 2016, 7, 62144–62158. [Google Scholar] [CrossRef]
- Iglesias-Figueroa, B.F.; Siqueiros-Cendón, T.S.; Gutierrez, D.A.; Aguilera, R.J.; Espinoza-Sánchez, E.A.; Arévalo-Gallegos, S.; Varela-Ramirez, A.; Rascón-Cruz, Q. Recombinant Human Lactoferrin Induces Apoptosis, Disruption of F-Actin Structure and Cell Cycle Arrest with Selective Cytotoxicity on Human Triple Negative Breast Cancer Cells. Apoptosis 2019, 24, 562–567. [Google Scholar] [CrossRef]
- Drago-Serrano, M.E.; De La Garza-Amaya, M.; Luna, J.S.; Campos-Rodríguez, R. Lactoferrin-Lipopolysaccharide (LPS) Binding as Key to Antibacterial and Antiendotoxic Effects. Int. Immunopharmacol. 2012, 12, 1–9. [Google Scholar] [CrossRef]
- Ellison, R.T.; Giehl, T.J. Killing of Gram-Negative Bacteria by Lactoferrin and Lysozyme. J. Clin. Invest. 1991, 88, 1080–1091. [Google Scholar] [CrossRef]
- Andrés, M.T.; Acosta-Zaldívar, M.; González-Seisdedos, J.; Fierro, J.F. Cytosolic Acidification Is the First Transduction Signal of Lactoferrin-Induced Regulated Cell Death Pathway. Int. J. Mol. Sci. 2019, 20, 5838. [Google Scholar] [CrossRef]
- Acosta-Zaldívar, M.; Andrés, M.T.; Rego, A.; Pereira, C.S.; Fierro, J.F.; Côrte-Real, M. Human Lactoferrin Triggers a Mitochondrial- and Caspase-Dependent Regulated Cell Death in Saccharomyces cerevisiae. Apoptosis 2016, 21, 163–173. [Google Scholar] [CrossRef]
- Rascón-Cruz, Q.; Espinoza-Sánchez, E.A.; Siqueiros-Cendón, T.S.; Nakamura-Bencomo, S.I.; Arévalo-Gallegos, S.; Iglesias-Figueroa, B.F. Lactoferrin: A Glycoprotein Involved in Immunomodulation, Anticancer, and Antimicrobial Processes. Molecules 2021, 26, 205. [Google Scholar] [CrossRef]
- Hu, L.; Hu, X.; Long, K.; Gao, C.; Dong, H.L.; Zhong, Q.; Gao, X.M.; Gong, F.Y. Extraordinarily Potent Proinflammatory Properties of Lactoferrin-Containing Immunocomplexes against Human Monocytes and Macrophages. Sci. Rep. 2017, 7, 4230. [Google Scholar] [CrossRef]
- Moastafa, T.M.; El-Sissy, A.E.-D.E.; El-Saeed, G.K.; Koura, M.S.E.-D. Study on the Therapeutic Benefit on Lactoferrin in Patients with Colorectal Cancer Receiving Chemotherapy. Int. Sch. Res. Notices 2014, 2014, 184278. [Google Scholar] [CrossRef]
- El Amrousy, D.; El-Afify, D.; Elsawy, A.; Elsheikh, M.; Donia, A.; Nassar, M. Lactoferrin for Iron-Deficiency Anemia in Children with Inflammatory Bowel Disease: A Clinical Trial. Pediatr. Res. 2022, 92, 762–766. [Google Scholar] [CrossRef]
- Fernandes, K.E.; Carter, D.A. The Antifungal Activity of Lactoferrin and Its Derived Peptides: Mechanisms of Action and Synergy with Drugs against Fungal Pathogens. Front. Microbiol. 2017, 8, 2. [Google Scholar] [CrossRef]
- Troost, F.J.; Saris, W.H.M.; Brummer, R.J.M. Orally Ingested Human Lactoferrin Is Digested and Secreted in the Upper Gastrointestinal Tract in Vivo in Women with Ileostomies. J. Nutr. 2002, 132, 2597–2600. [Google Scholar] [CrossRef]
- Sienkiewicz, M.; Jaśkiewicz, A.; Tarasiuk, A.; Fichna, J. Lactoferrin: An Overview of Its Main Functions, Immunomodulatory and Antimicrobial Role, and Clinical Significance. Crit. Rev. Food Sci. Nutr. 2022, 62, 6016–6033. [Google Scholar] [CrossRef]
- Abad, I.; Conesa, C.; Sánchez, L. Development of Encapsulation Strategies and Composite Edible Films to Maintain Lactoferrin Bioactivity: A Review. Materials 2021, 14, 7358. [Google Scholar] [CrossRef]
- Yao, X.; Bunt, C.; Cornish, J.; Quek, S.Y.; Wen, J. Preparation, Optimization and Characterization of Bovine Lactoferrin-Loaded Liposomes and Solid Lipid Particles Modified by Hydrophilic Polymers Using Factorial Design. Chem. Biol. Drug Des. 2014, 83, 560–575. [Google Scholar] [CrossRef]
- Emerich, D.F.; Thanos, C.G. Nanotechnology and Medicine. Expert Opin. Biol. Ther. 2003, 3, 655–663. [Google Scholar] [CrossRef]
- Akbarzadeh, A.; Rezaei-Sadabady, R.; Davaran, S.; Joo, S.W.; Zarghami, N.; Hanifehpour, Y.; Samiei, M.; Kouhi, M.; Nejati-Koshki, K. Liposome: Classification, Preparation, and Applications. Nanoscale Res. Lett. 2013, 8, 102. [Google Scholar] [CrossRef]
- Pankhurst, Q.A.; Connolly, J.; Jones, S.K.; Dobson, J. Applications of Magnetic Nanoparticles in Biomedicine. J. Phys. D Appl. Phys. 2003, 36, R167–R181. [Google Scholar] [CrossRef]
- Jose, J.; Kumar, R.; Harilal, S.; Mathew, G.E.; Parambi, D.G.T.; Prabhu, A.; Uddin, Md.S.; Aleya, L.; Kim, H.; Mathew, B. Magnetic Nanoparticles for Hyperthermia in Cancer Treatment: An Emerging Tool. Environ. Sci. Poll. Res. 2020, 27, 19214–19225. [Google Scholar] [CrossRef] [PubMed]
- Yang, W.; Liang, H.; Ma, S.; Wang, D.; Huang, J. Gold Nanoparticle Based Photothermal Therapy: Development and Application for Effective Cancer Treatment. Sust. Mat. Technol. 2019, 22, e00109. [Google Scholar] [CrossRef]
- Khafaji, M.; Zamani, M.; Golizadeh, M.; Bavi, O. Inorganic Nanomaterials for Chemo/Photothermal Therapy: A Promising Horizon on Effective Cancer Treatment. Biophys. Rev. 2019, 11, 335–352. [Google Scholar] [CrossRef] [PubMed]
- Li, K.; Nejadnik, H.; Daldrup-Link, H.E. Next-Generation Superparamagnetic Iron Oxide Nanoparticles for Cancer Theranostics. Drug Discov. Today 2017, 22, 1421–1429. [Google Scholar] [CrossRef]
- Veloso, S.R.S.; Silva, J.F.G.; Hilliou, L.; Moura, C.; Coutinho, P.J.G.; Martins, J.A.; Testa-Anta, M.; Salgueiriño, V.; Correa-Duarte, M.A.; Ferreira, P.M.T.; Castanheira, E.M.S. Impact of Citrate and Lipid-Functionalized Magnetic Nanoparticles in Dehydropeptide Supramolecular Magnetogels: Properties, Design and Drug Release. Nanomaterials 2021, 11, 16. [Google Scholar] [CrossRef]
- Ansar, S.; Chakraborty, S.; Kitchens, C. pH-responsive Mercaptoundecanoic Acid Functionalized Gold Nanoparticles and Applications in Catalysis. Nanomaterials 2018, 8, 339. [Google Scholar] [CrossRef]
- Rodrigues, A.R.O.; Ramos, J.M.F.; Gomes, I.T.; Almeida, B.G.; Araújo, J.P.; Queiroz, M.J.R.P.; Coutinho, P.J.G.; Castanheira, E.M.S. Magnetoliposomes Based on Manganese Ferrite Nanoparticles as Nanocarriers for Antitumor Drugs. RSC Adv. 2016, 6, 17302–17313. [Google Scholar] [CrossRef]
- Loura, L.M.S.; Fernandes, F.; Fernandes, A.C.; Ramalho, J.P.P. Effects of Fluorescent Probe NBD-PC on the Structure, Dynamics and Phase Transition of DPPC. A Molecular Dynamics and Differential Scanning Calorimetry Study. Biochim. Biophys. Acta - Biomembranes 2008, 1778, 491–501. [Google Scholar] [CrossRef]
- Hendriks, J.; Gensch, T.; Hviid, L.; van der Horst, M.A.; Hellingwerf, K.J.; van Thor, J.J. Transient Exposure of Hydrophobic Surface in the Photoactive Yellow Protein Monitored with Nile Red. Biophys. J. 2002, 82, 1632–1643. [Google Scholar] [CrossRef] [PubMed]
- Gooneh-Farahani, S.; Naghib, S.M.; Naimi-Jamal, M.R. A Novel and Inexpensive Method Based on Modified Ionic Gelation for pH-Responsive Controlled Drug Release of Homogeneously Distributed Chitosan Nanoparticles with a High Encapsulation Efficiency. Fibers Polym. 2020, 21, 1917–1926. [Google Scholar] [CrossRef]
- Raths, S.; Rohrer, J.; Crausaz, F.; Riezman, H. End3 and End4: Two Mutants Defective in Receptor-Mediated and Fluid-Phase Endocytosis in Saccharomyces cerevisiae. J. Cell Biol. 1993, 120, 55–65. [Google Scholar] [CrossRef]
- Barbosa, C.; Santos-Pereira, C.; Soares, I.; Martins, V.; Terra-Matos, J.; Côrte-Real, M.; Lúcio, M.; Oliveira, M.E.C.D.R.; Gerós, H. Resveratrol-Loaded Lipid Nanocarriers Are Internalized by Endocytosis in Yeast. J. Nat. Prod. 2019, 82, 1240–1249. [Google Scholar] [CrossRef] [PubMed]
- Cabrera, L.I.; Somoza, Á.; Marco, J.F.; Serna, C.J.; Puerto Morales, M. Synthesis and Surface Modification of Uniform MFe2O4 (M = Fe, Mn, and Co) Nanoparticles with Tunable Sizes and Functionalities. J. Nanopart. Res. 2012, 14, 873. [Google Scholar] [CrossRef]
- Rafique, M.Y.; Pan, L.Q.; Javed, Q.U.A.; Iqbal, M.Z.; Qiu, H.M.; Farooq, M.H.; Guo, Z.G.; Tanveer, M. Growth of Monodisperse Nanospheres of MnFe2O4 with Enhanced Magnetic and Optical Properties. Chinese Phys. B 2013, 22, 107101. [Google Scholar] [CrossRef]
- Haiss, W.; Thanh, N.T.K.; Aveyard, J.; Fernig, D.G. Determination of Size and Concentration of Gold Nanoparticles from UV−Vis Spectra. Anal. Chem. 2007, 79, 4215–4221. [Google Scholar] [CrossRef]
- Ishida, T.; Yanaga, Y.; Yamada, S.; Takahashi, Y. A Versatile Method for Surface Functionalization and Hydrophobization of Gold Nanoparticles. Appl. Surf. Sci. 2021, 546, 148932. [Google Scholar] [CrossRef]
- Doebelin, N.; Kleeberg, R. Profex: A Graphical User Interface for the Rietveld Refinement Program BGMN. J. Appl. Crystallogr. 2015, 48, 1573–1580. [Google Scholar] [CrossRef]
- Bergmann, J.; F.P.; K.R. IUCr Commission on Powder Diffraction. Newsletter 1998, 20, 5–8. [Google Scholar]
- Iacovita, C.; Florea, A.; Dudric, R.; Pall, E.; Moldovan, A.; Tetean, R.; Stiufiuc, R.; Lucaciu, C. Small versus Large Iron Oxide Magnetic Nanoparticles: Hyperthermia and Cell Uptake Properties. Molecules 2016, 21, 1357. [Google Scholar] [CrossRef] [PubMed]
- Pradhan, P.; Giri, J.; Samanta, G.; Sarma, H.D.; Mishra, K.P.; Bellare, J.; Banerjee, R.; Bahadur, D. Comparative Evaluation of Heating Ability and Biocompatibility of Different Ferrite-Based Magnetic Fluids for Hyperthermia Application. J. Biomed. Mater. Res. B 2007, 81B, 12–22. [Google Scholar] [CrossRef]
- Stettner, J.; Frank, P.; Griesser, T.; Trimmel, G.; Schennach, R.; Gilli, E.; Winkler, A. A Study on the Formation and Thermal Stability of 11-MUA SAMs on Au(111)/Mica and on Polycrystalline Gold Foils. Langmuir 2009, 25, 1427–1433. [Google Scholar] [CrossRef]
- Fernandes, N.; Rodrigues, C.F.; Moreira, A.F.; Correia, I.J. Overview of the Application of Inorganic Nanomaterials in Cancer Photothermal Therapy. Biomater. Sci. 2020, 8, 2990–3020. [Google Scholar] [CrossRef]
- Pacheco, A.R.F.; Cardoso, B.D.; Pires, A.; Pereira, A.M.; Araújo, J.P.; Carvalho, V.M.; Rodrigues, R.O.; Coutinho, P.J.G.; Castelo-Grande, T.; Augusto, P.A.; Barbosa, D.; Lima, R.A.; Teixeira, S.F.C.F.; Rodrigues, A.R.O.; Castanheira, E.M.S. Development of pH-Sensitive Magnetoliposomes Containing Shape Anisotropic Nanoparticles for Potential Application in Combined Cancer Therapy. Nanomaterials 2023, 13, 1051. [Google Scholar] [CrossRef] [PubMed]
- Lentz, B.R. Membrane “Fluidity” as Detected by Diphenylhexatriene Probes. Chem. Phys. Lipids 1989, 50, 171–190. [Google Scholar] [CrossRef]
- Lentz, B.R. Use of Fluorescent Probes to Monitor Molecular Order and Motions within Liposome Bilayers. Chem. Phys. Lipids 1993, 64, 99–116. [Google Scholar] [CrossRef]
- Biltonen, R.L.; Lichtenberg, D. The Use of Differential Scanning Calorimetry as a Tool to Characterize Liposome Preparations. Chem. Phys. Lipids 1993, 64, 129–142. [Google Scholar] [CrossRef]
- Danaei, M.; Dehghankhold, M.; Ataei, S.; Hasanzadeh Davarani, F.; Javanmard, R.; Dokhani, A.; Khorasani, S.; Mozafari, M. Impact of Particle Size and Polydispersity Index on the Clinical Applications of Lipidic Nanocarrier Systems. Pharmaceutics 2018, 10, 57. [Google Scholar] [CrossRef]
- Pattni, B.S.; Chupin, V.V.; Torchilin, V.P. New Developments in Liposomal Drug Delivery. Chem. Rev. 2015, 115, 10938–10966. [Google Scholar] [CrossRef]
- Rodrigues, A.R.O.; Gomes, I.T.; Almeida, B.G.; Araújo, J.P.; Castanheira, E.M.S.; Coutinho, P.J.G. Magnetic Liposomes Based on Nickel Ferrite Nanoparticles for Biomedical Applications. Phys. Chem. Chem. Phys. 2015, 17, 18011–18021. [Google Scholar] [CrossRef]
- Honary, S.; Zahir, F. Effect of Zeta Potential on the Properties of Nano-Drug Delivery Systems - A Review (Part 1). Trop. J. Pharm. Res. 2013, 12, 255–264. [Google Scholar] [CrossRef]
- Chen, H.; Tang, L.; Qin, Y.; Yin, Y.; Tang, J.; Tang, W.; Sun, X.; Zhang, Z.; Liu, J.; He, Q. Lactoferrin-Modified Procationic Liposomes as a Novel Drug Carrier for Brain Delivery. Eur. J. Pharm. Sci. 2010, 40, 94–102. [Google Scholar] [CrossRef]
- Colletier, J.P.; Chaize, B.; Winterhalter, M.; Fournier, D. Protein Encapsulation in Liposomes: Efficiency Depends on Interactions between Protein and Phospholipid Bilayer. BMC Biotechnol. 2002, 2, 9. [Google Scholar] [CrossRef]
- Papadopoulou, V.; Kosmidis, K.; Vlachou, M.; Macheras, P. On the Use of the Weibull Function for the Discernment of Drug Release Mechanisms. Int. J. Pharm. 2006, 309, 44–50. [Google Scholar] [CrossRef]
- Noyes, A.A.; Whitney, W.R. The Rate of Solution of Solid Substances in Their Own Solutions. J. Am. Chem. Soc. 1897, 19, 930–934. [Google Scholar] [CrossRef]
- Mell, J.C.; Burgess, S.M. Yeast as a Model Genetic Organism. in Encyclopedia of Life Sciences, Wiley, 2002. [CrossRef]
- Carmona-Gutierrez, D.; Eisenberg, T.; Büttner, S.; Meisinger, C.; Kroemer, G.; Madeo, F. Apoptosis in Yeast: Triggers, Pathways, Subroutines. Cell Death Differ. 2010, 17, 763–773. [Google Scholar] [CrossRef] [PubMed]
- Rennick, J.J.; Johnston, A.P.R.; Parton, R.G. Key Principles and Methods for Studying the Endocytosis of Biological and Nanoparticle Therapeutics. Nature Nanotechnol. 2021, 16, 266–276. [Google Scholar] [CrossRef]
- Mohamed, B.; Verma, N.; Prina-Mello, A.; Williams, Y.; Davies, A.M.; Bakos, G.; Tormey, L.; Edwards, C.; Hanrahan, J.; Salvati, A.; Lynch, I.; Dawson, L.; Kelleher, D.; Volkov, Y. Activation of Stress-Related Signalling Pathway in Human Cells upon SiO2 Nanoparticles Exposure as an Early Indicator of Cytotoxicity. J Nanobiotech. 2011, 9, 29. [Google Scholar] [CrossRef]
- Fernando, L.P.; Kandel, P.K.; Yu, J.; McNeill, J.; Ackroyd, P.C.; Christensen, K.A. Mechanism of Cellular Uptake of Highly Fluorescent Conjugated Polymer Nanoparticles. Biomacromolecules 2010, 11, 2675–2682. [Google Scholar] [CrossRef]
- Habib, F.S.; Fouad, E.A.; Abdel-Rhaman, M.S.; Fathalla, D. Liposomes as an Ocular Delivery System of Fluconazole: In Vitro Studies. Acta Ophthalmol. 2010, 88, 901–904. [Google Scholar] [CrossRef]
- Ozbek, O.; O. Ulgen, K.; Ileri Ercan, N. The Toxicity of Polystyrene-Based Nanoparticles in Saccharomyces cerevisiae Is Associated with Nanoparticle Charge and Uptake Mechanism. Chem. Res. Toxicol. 2021, 34, 1055–1068. [Google Scholar] [CrossRef]
- Harisa, G.I.; Badran, M.M.; Alanazi, F.K.; Attia, S.M. An Overview of Nanosomes Delivery Mechanisms: Trafficking, Orders, Barriers and Cellular Effects. Artif. Cells Nanomed. Biotechnol. 2018, 46, 669–679. [Google Scholar] [CrossRef]
Figure 1.
(A) Absorption spectrum of MnFe2O4 NPs dispersed in water (4.0×10⁻⁴ M) synthesized by the citrate stabilization method. Inset: Tauc plot of manganese ferrite nanoparticles. (B) Absorption spectrum of AuNPs and AuNPs_MUA dispersed in water (3.2×10⁻⁴ M) and AuNPs_ODT dispersed in chloroform (3.2×10⁻⁴ M), synthesized by the citrate reduction method.
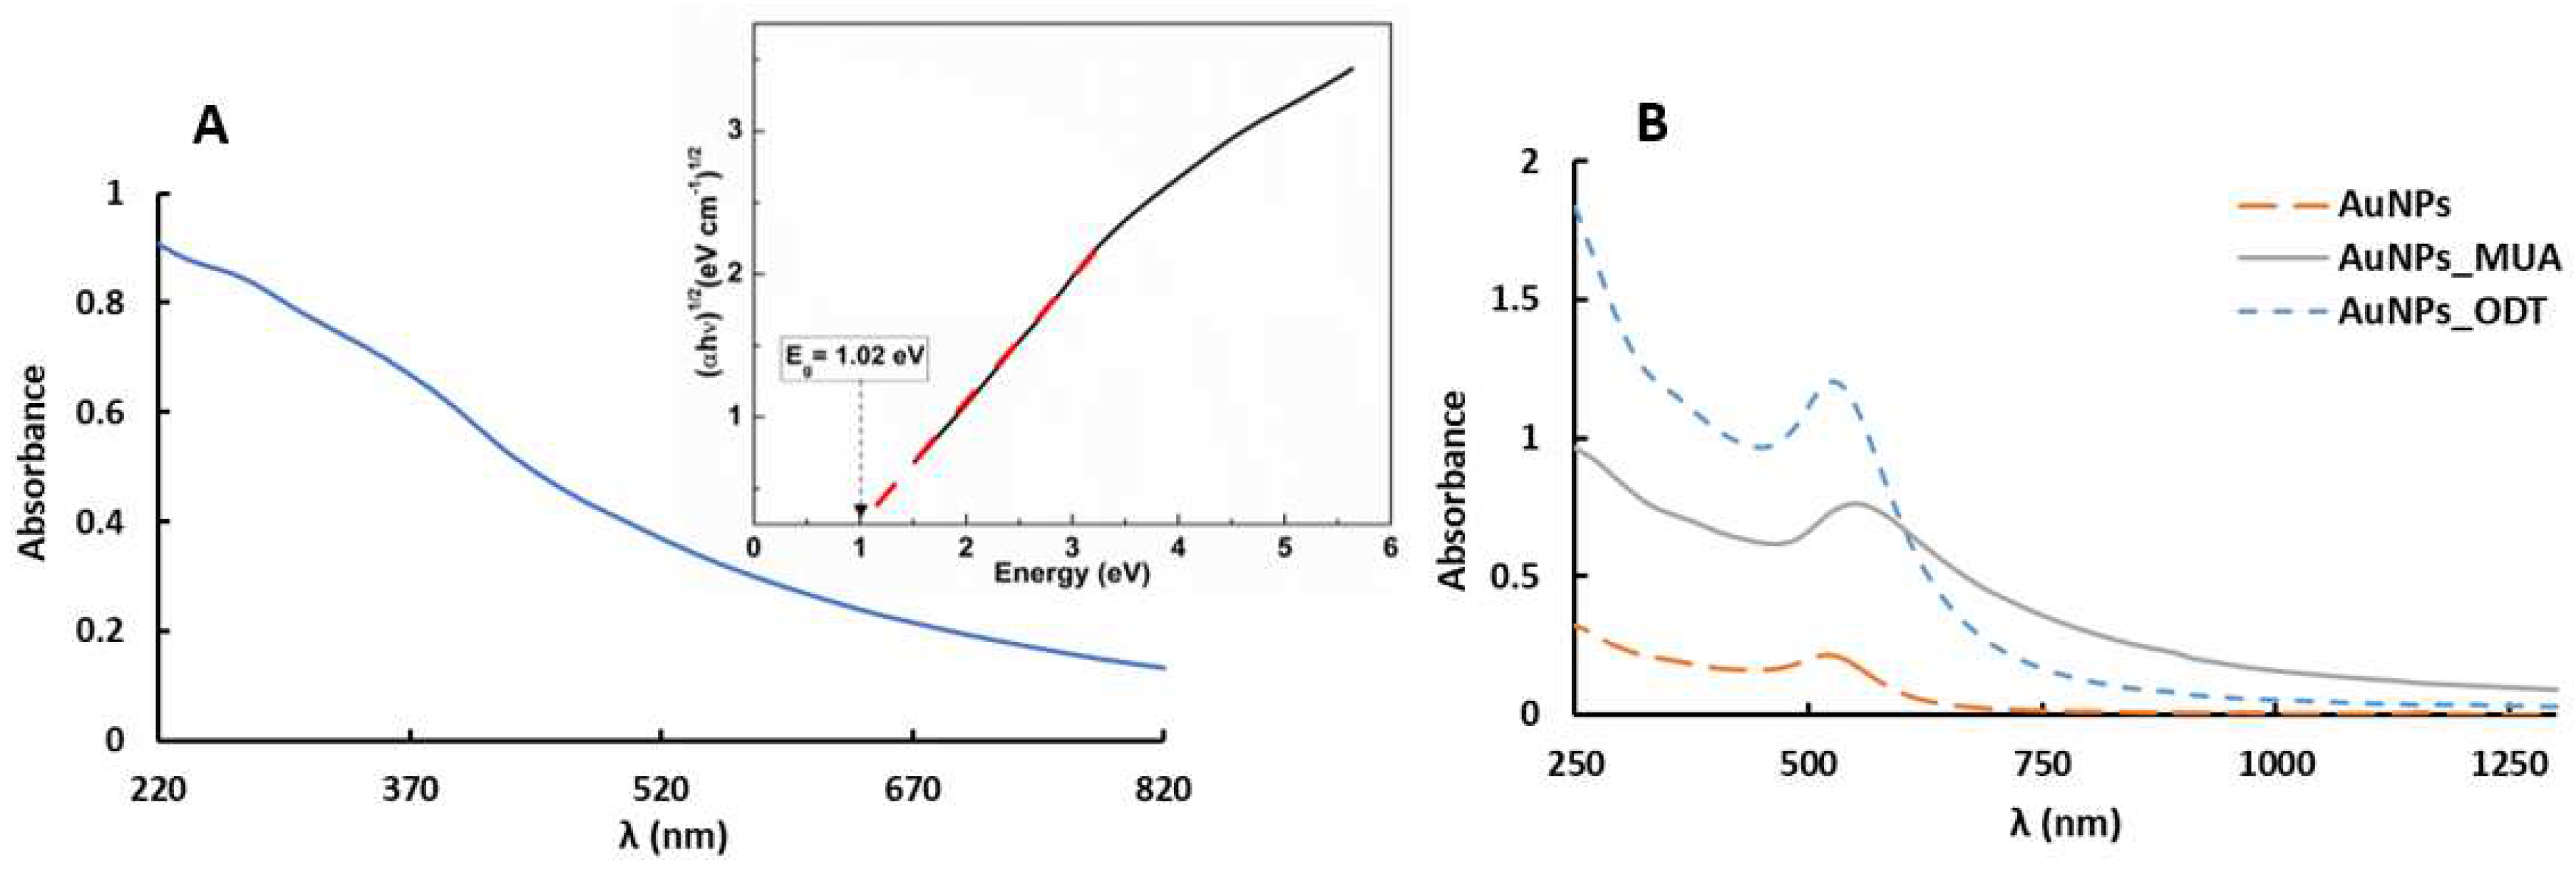
Figure 2.
X-Ray Diffraction pattern of manganese ferrite nanoparticles and corresponding Rietveld analysis with Miller indices.
Figure 2.
X-Ray Diffraction pattern of manganese ferrite nanoparticles and corresponding Rietveld analysis with Miller indices.
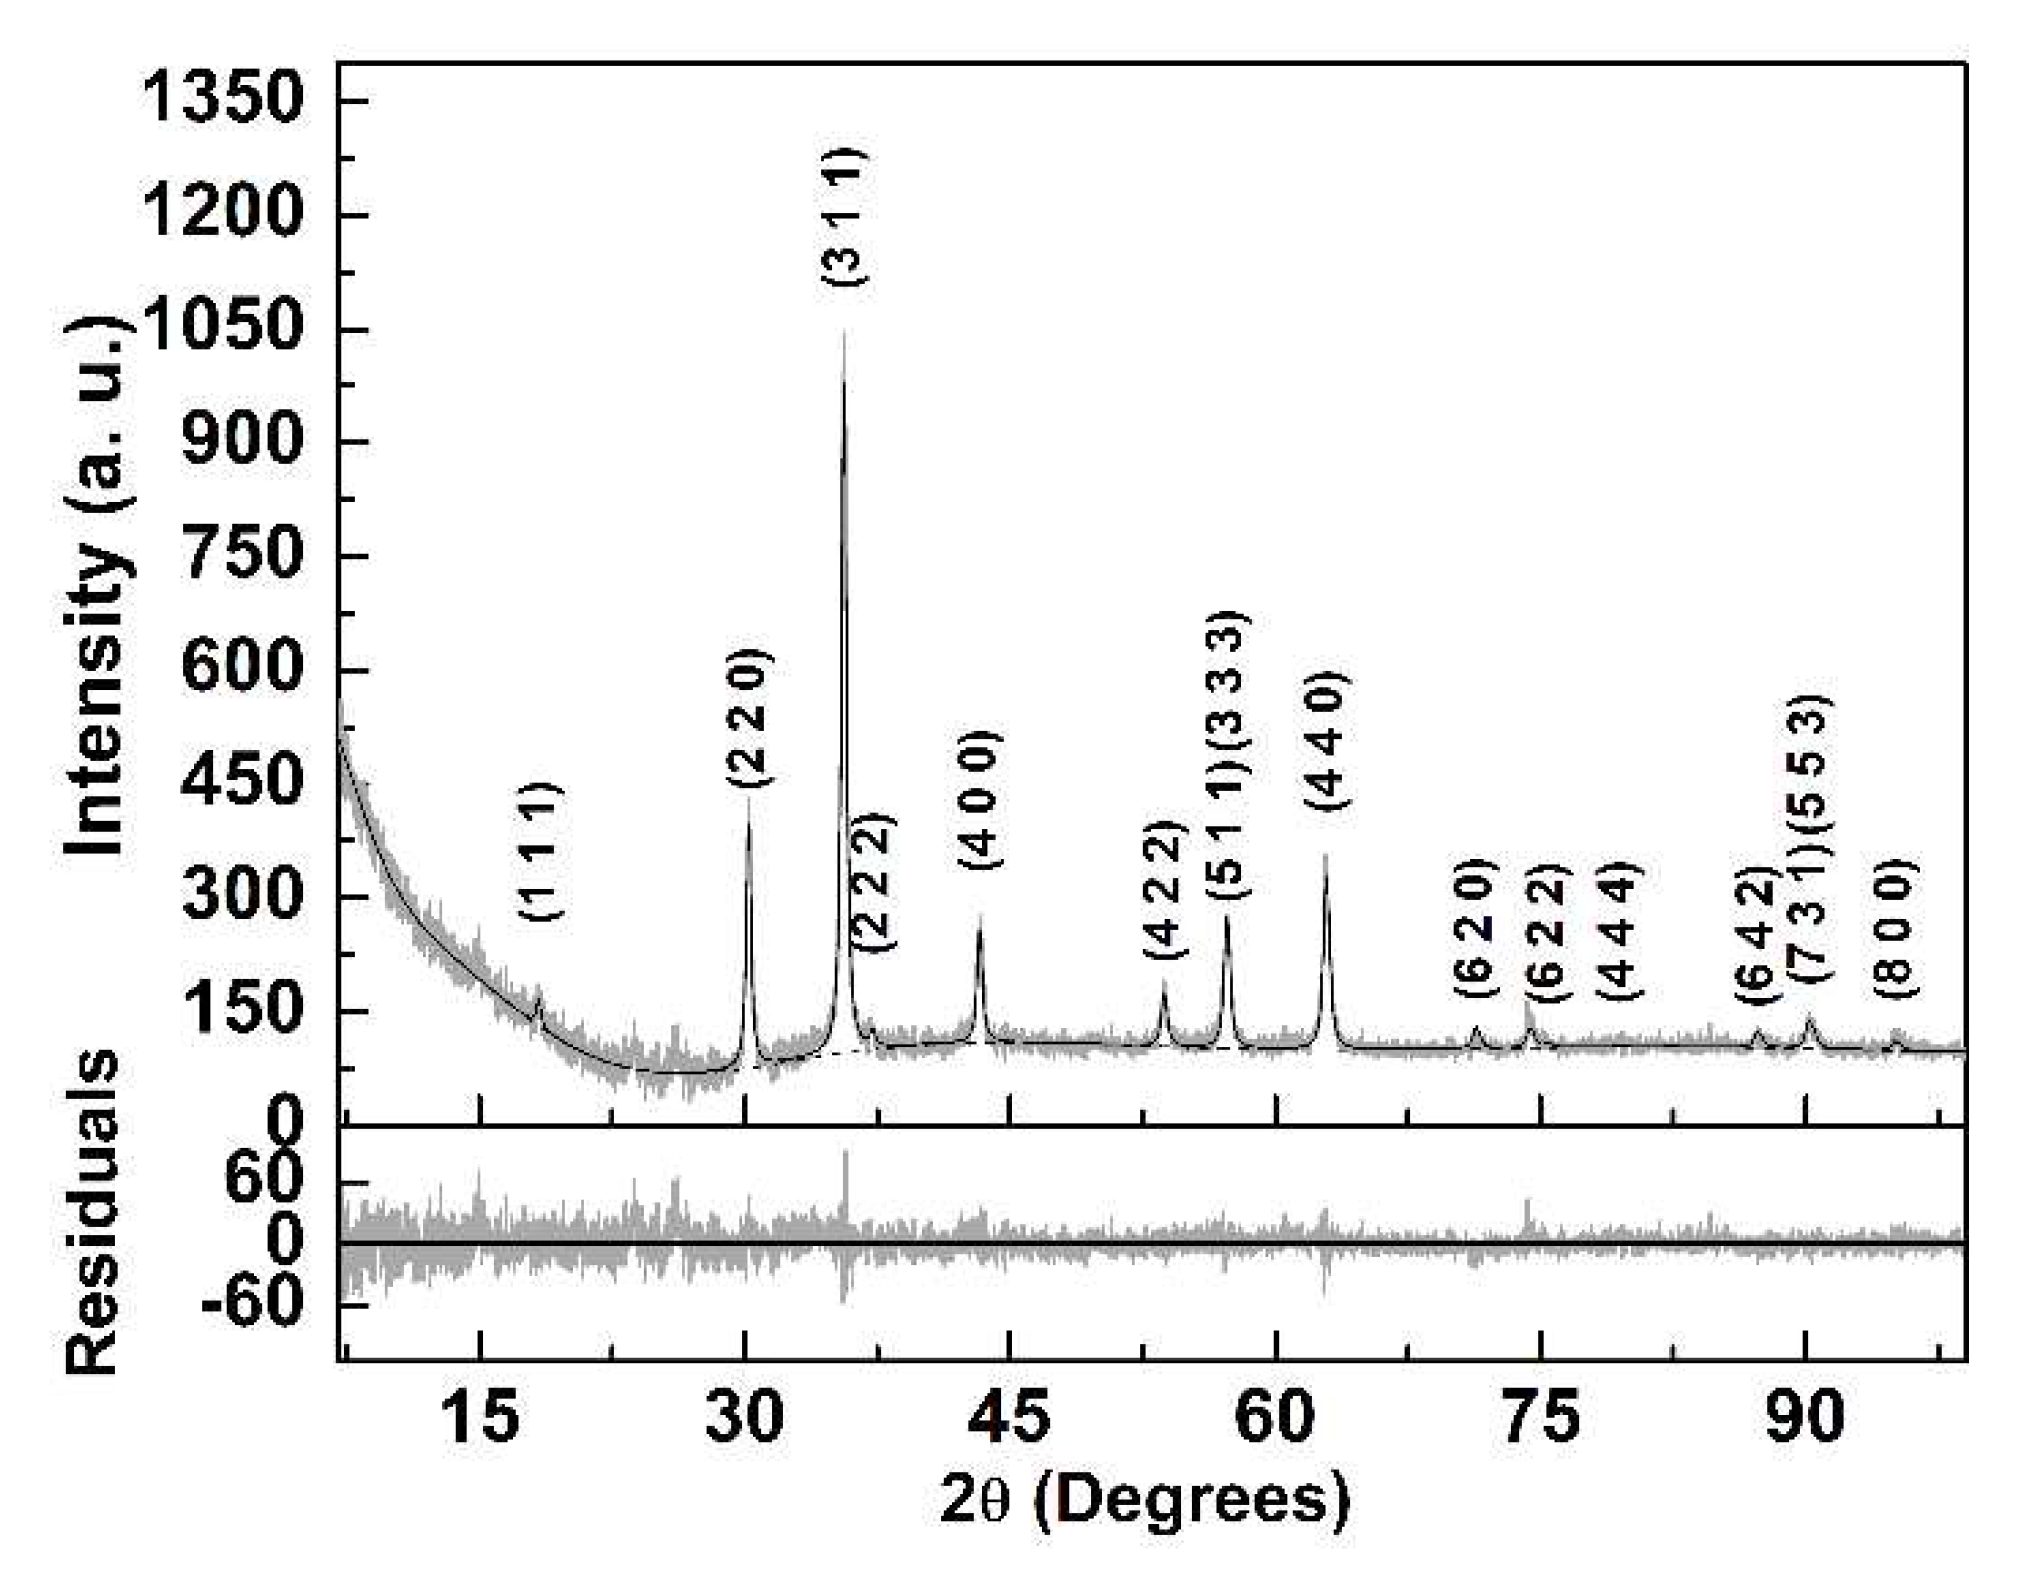
Figure 3.
Magnetization hysteresis loop of MnFe2O4 NPs measured at room temperature. Inset: Enlargement of the loop, in the low field region.
Figure 3.
Magnetization hysteresis loop of MnFe2O4 NPs measured at room temperature. Inset: Enlargement of the loop, in the low field region.
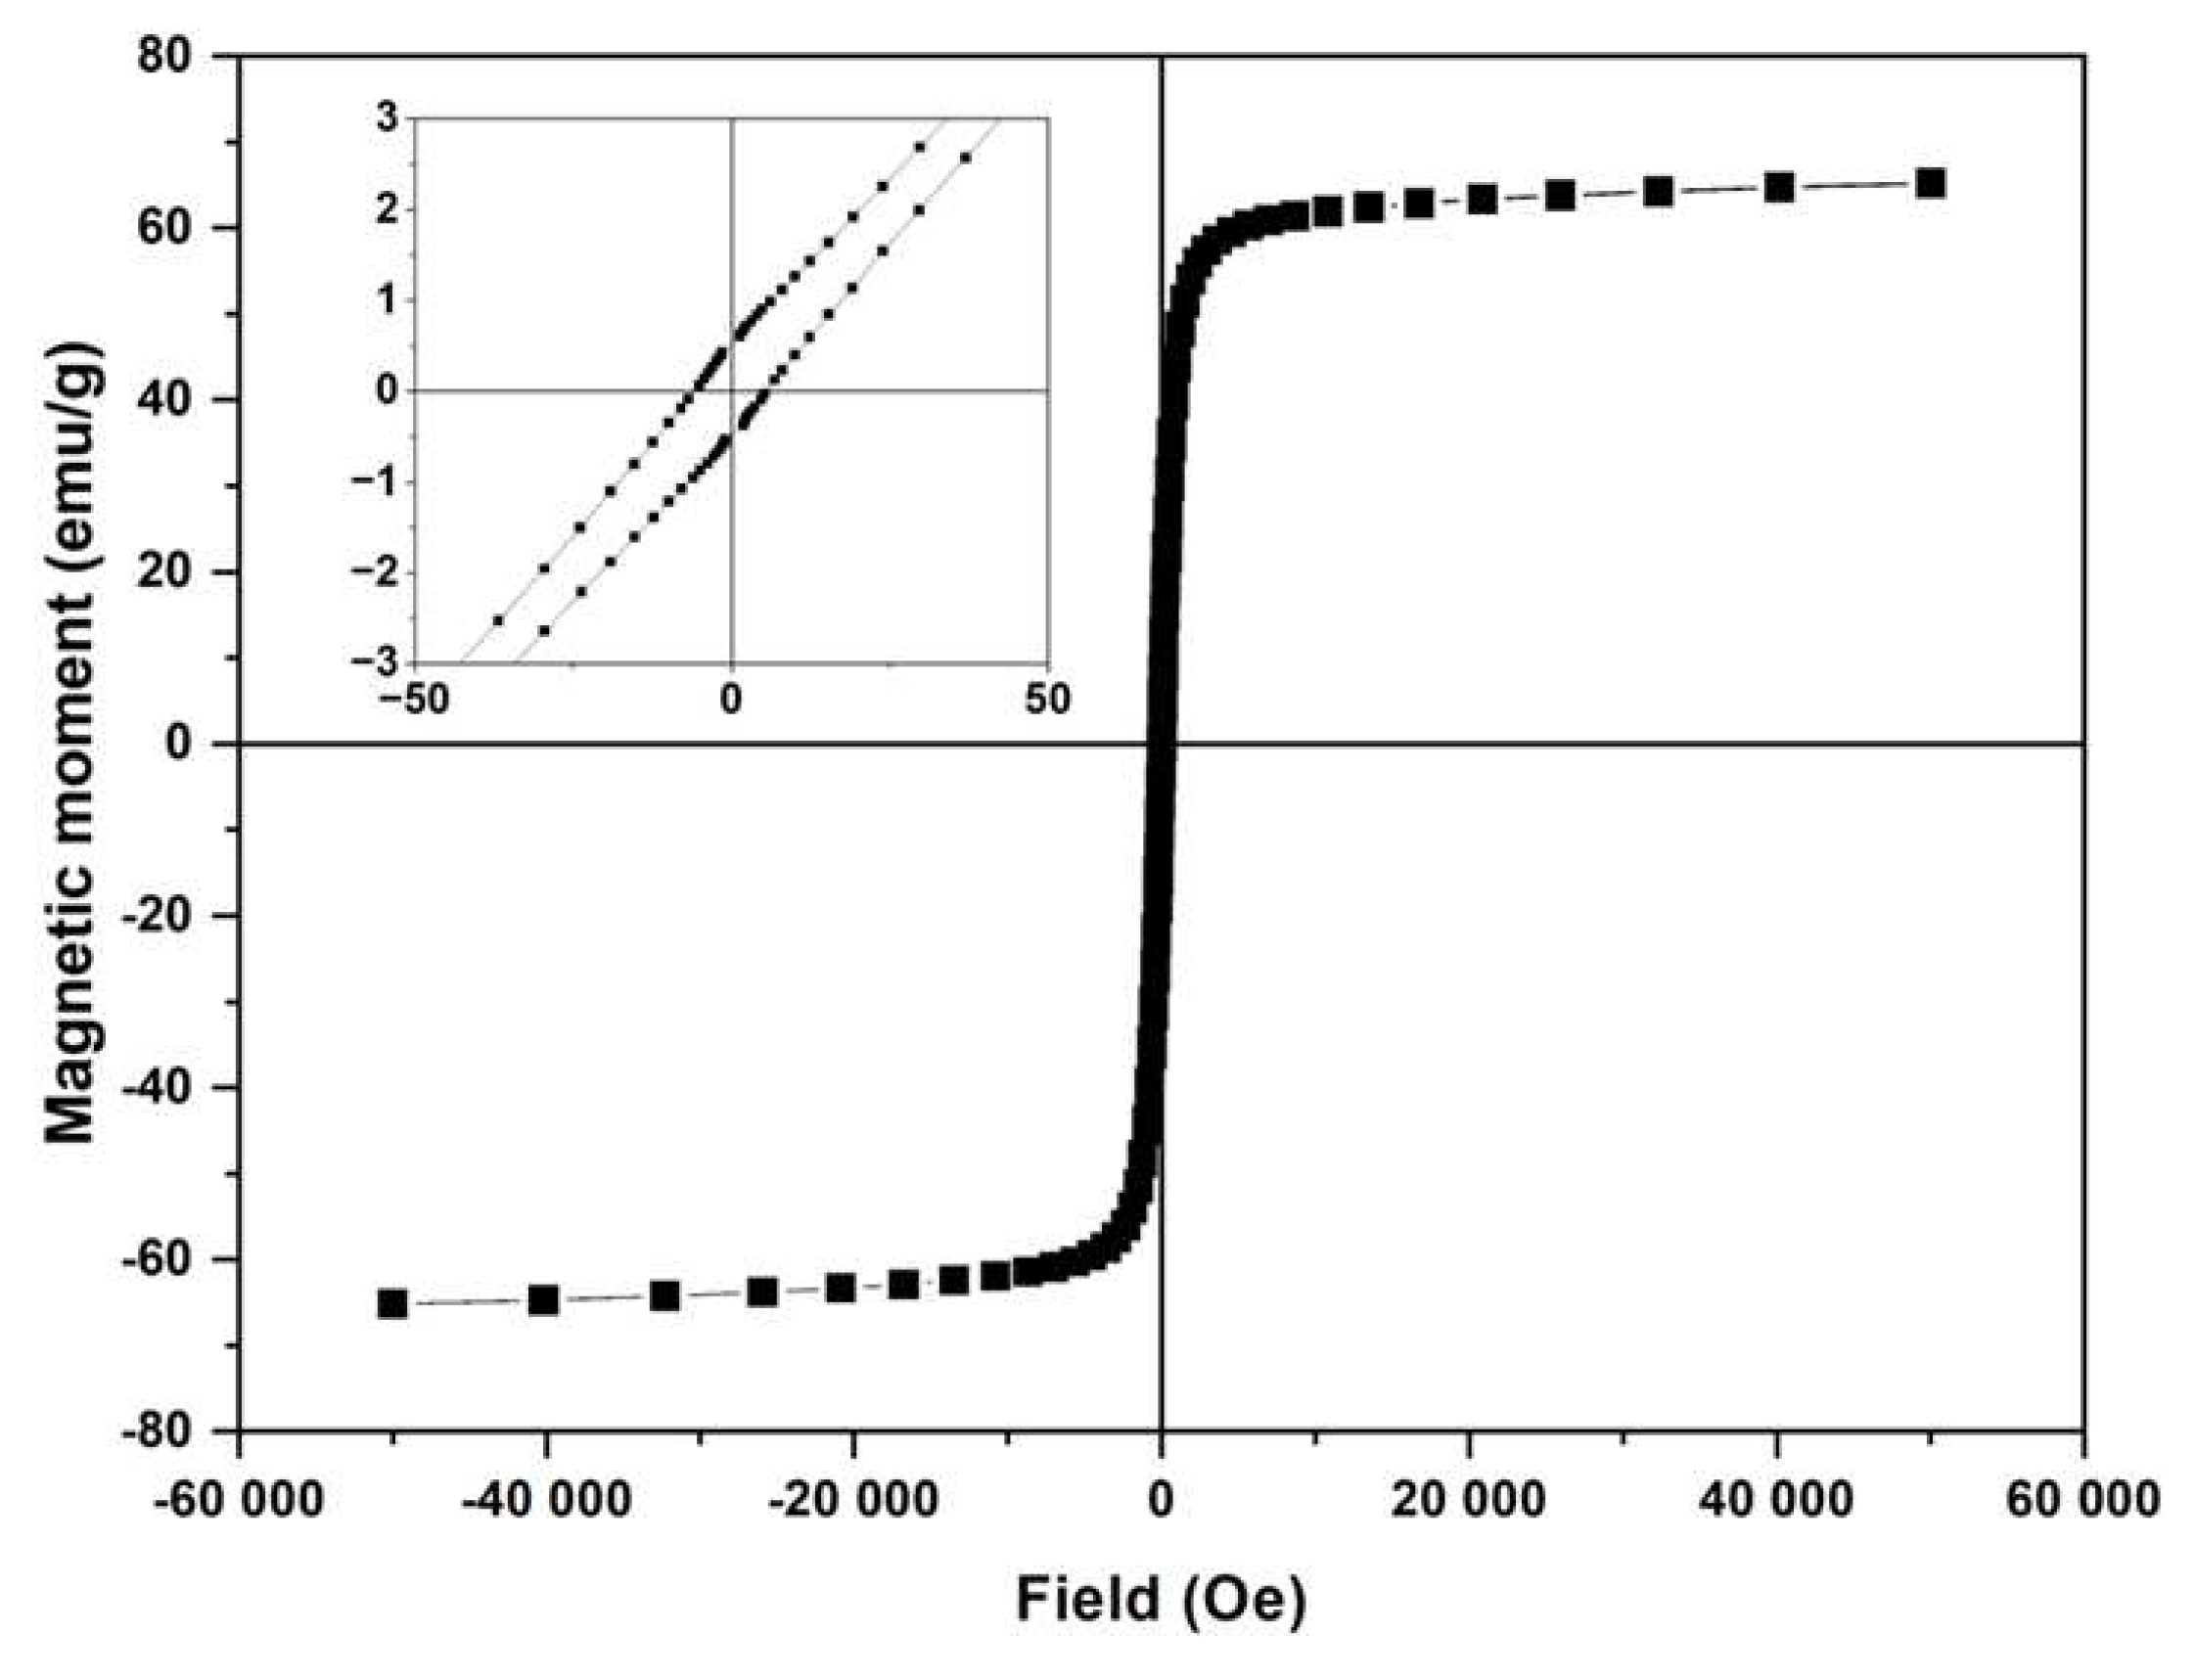
Figure 4.
(A) TEM image of manganese ferrite nanoparticles and (B) size histogram of image A and fitting to a Gaussian distribution.
Figure 4.
(A) TEM image of manganese ferrite nanoparticles and (B) size histogram of image A and fitting to a Gaussian distribution.
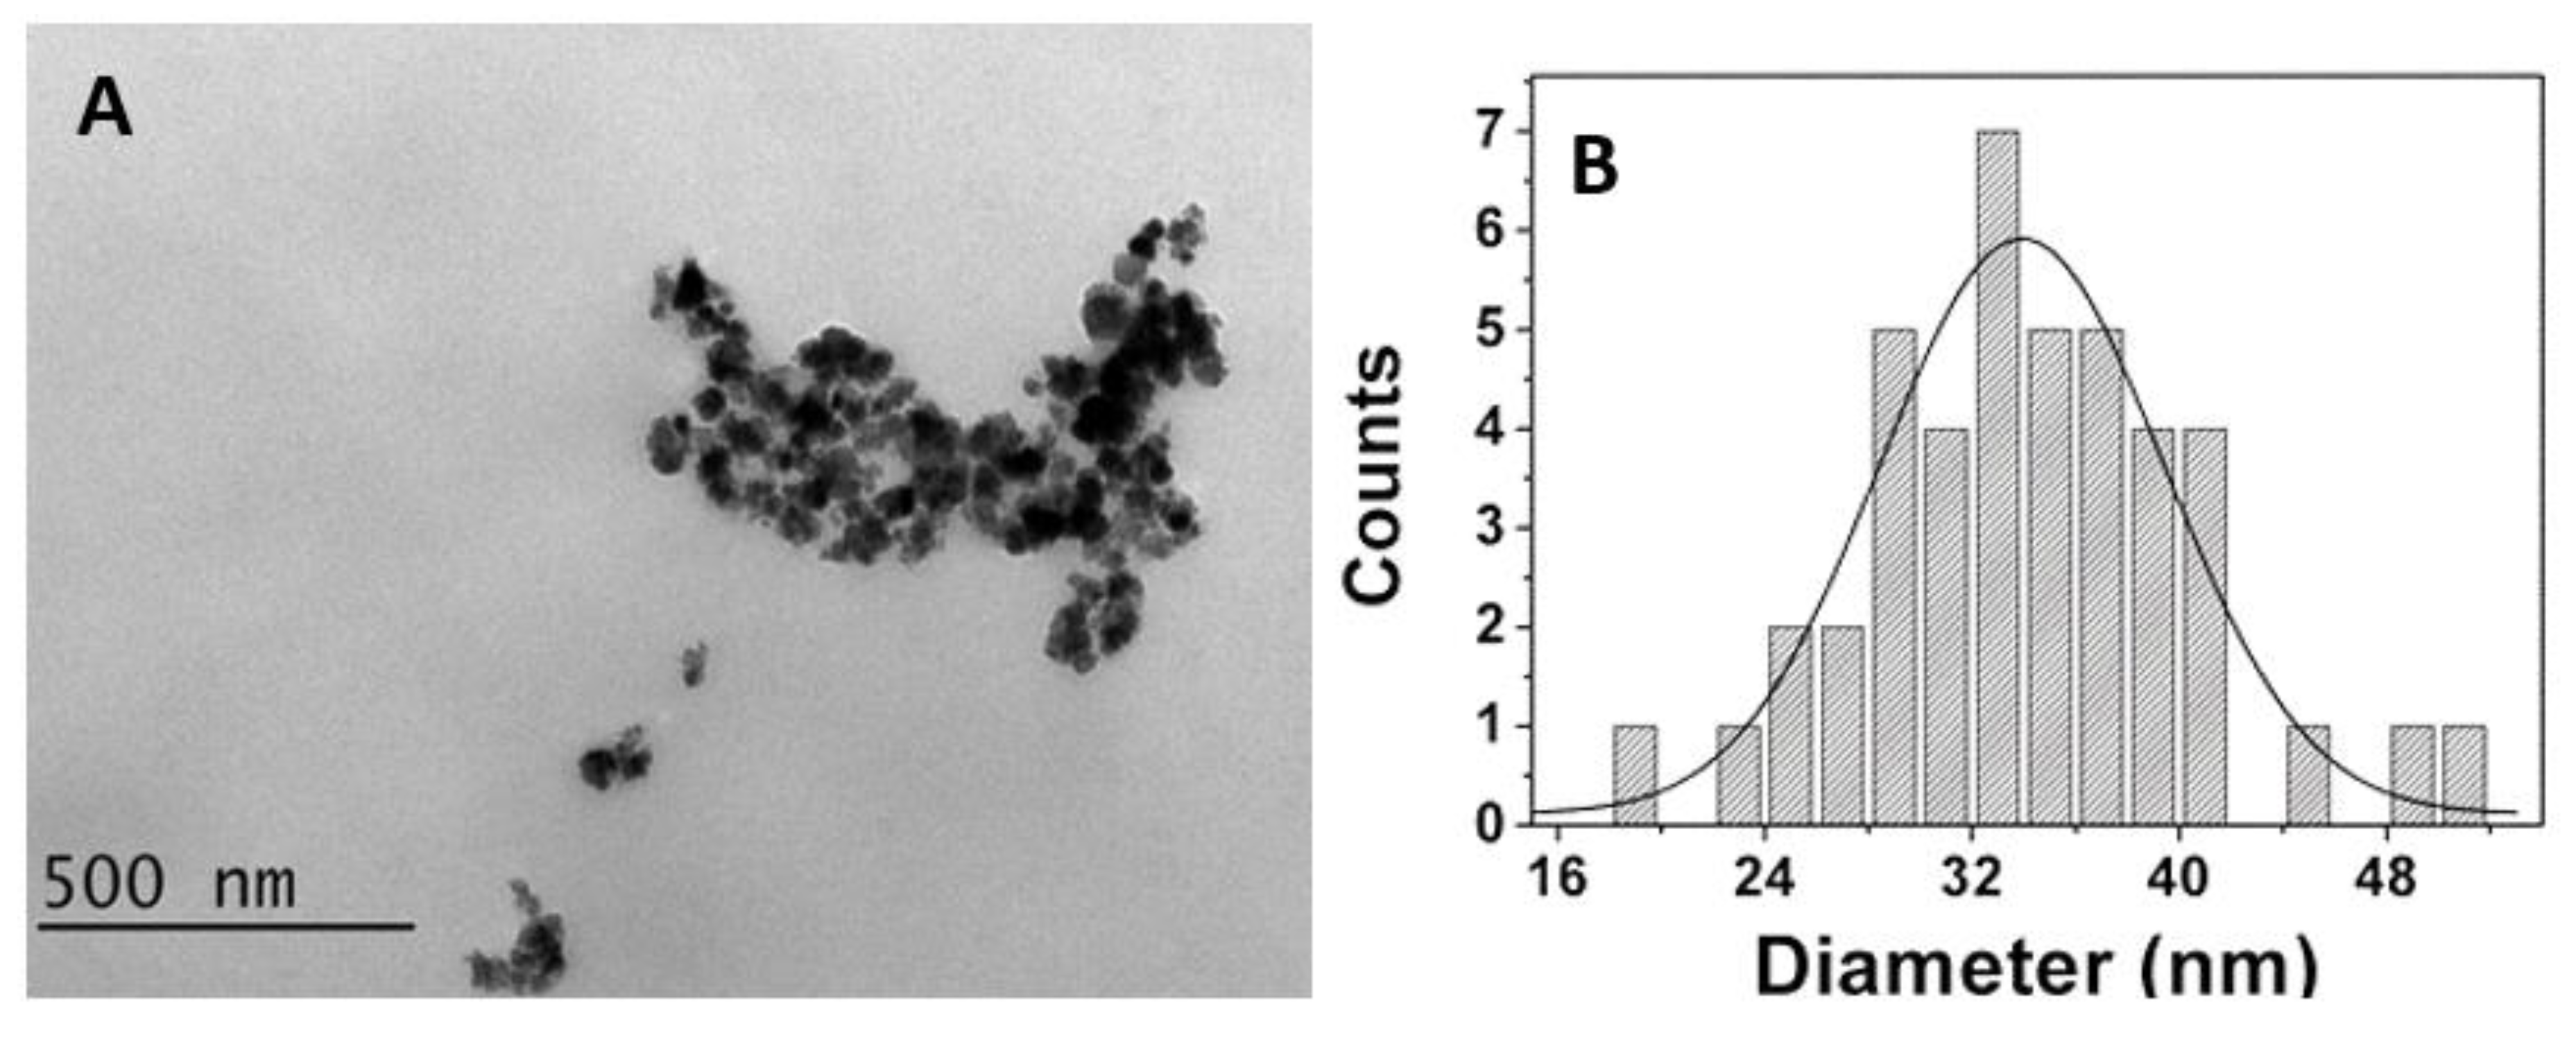
Figure 5.
(A) Heating and cooling curve of an aqueous dispersion of MnFe2O4 NPs as a function of time, under AMF (11 mT and 155 kHz). (B) Heating and cooling curve of a dispersion of Au NPs and AuNPs_MUA irradiated with a 532 nm continuous light laser (1 W/cm2).
Figure 5.
(A) Heating and cooling curve of an aqueous dispersion of MnFe2O4 NPs as a function of time, under AMF (11 mT and 155 kHz). (B) Heating and cooling curve of a dispersion of Au NPs and AuNPs_MUA irradiated with a 532 nm continuous light laser (1 W/cm2).
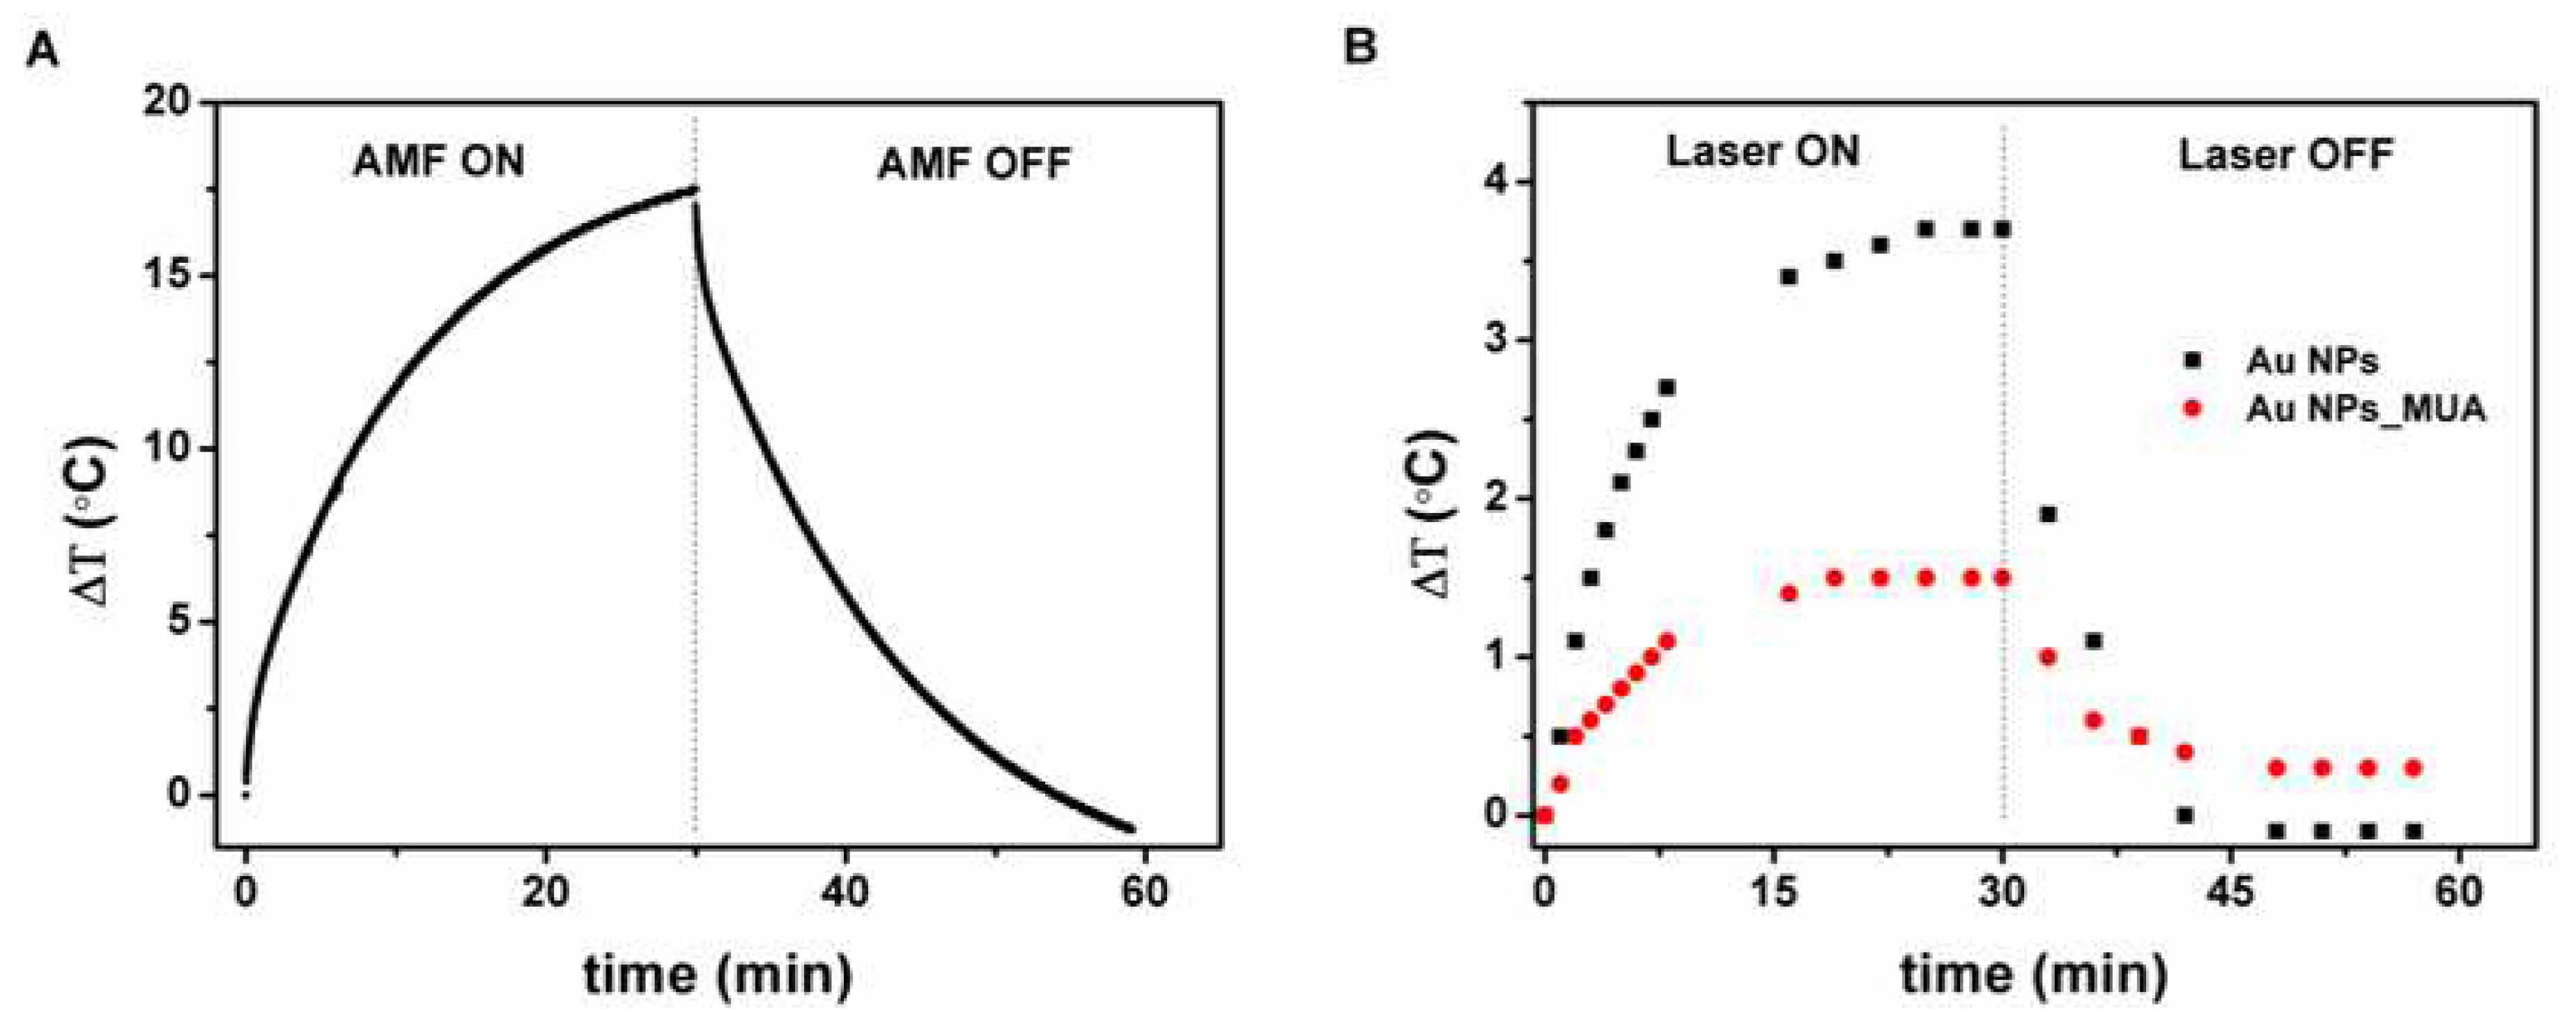
Figure 6.
Fluorescence spectra (λexc= 450 nm) of the labeled lipid NBD-C12-HPC (1×10⁻⁶ M) incorporated in Egg-PC liposomes, in magnetoliposomes (MLs) with MnFe2O4 NPs and PMLs with MnFe2O4 and AuNPs_MUA or AuNPs_ODT (spectra of both PMLs are almost coincident).
Figure 6.
Fluorescence spectra (λexc= 450 nm) of the labeled lipid NBD-C12-HPC (1×10⁻⁶ M) incorporated in Egg-PC liposomes, in magnetoliposomes (MLs) with MnFe2O4 NPs and PMLs with MnFe2O4 and AuNPs_MUA or AuNPs_ODT (spectra of both PMLs are almost coincident).
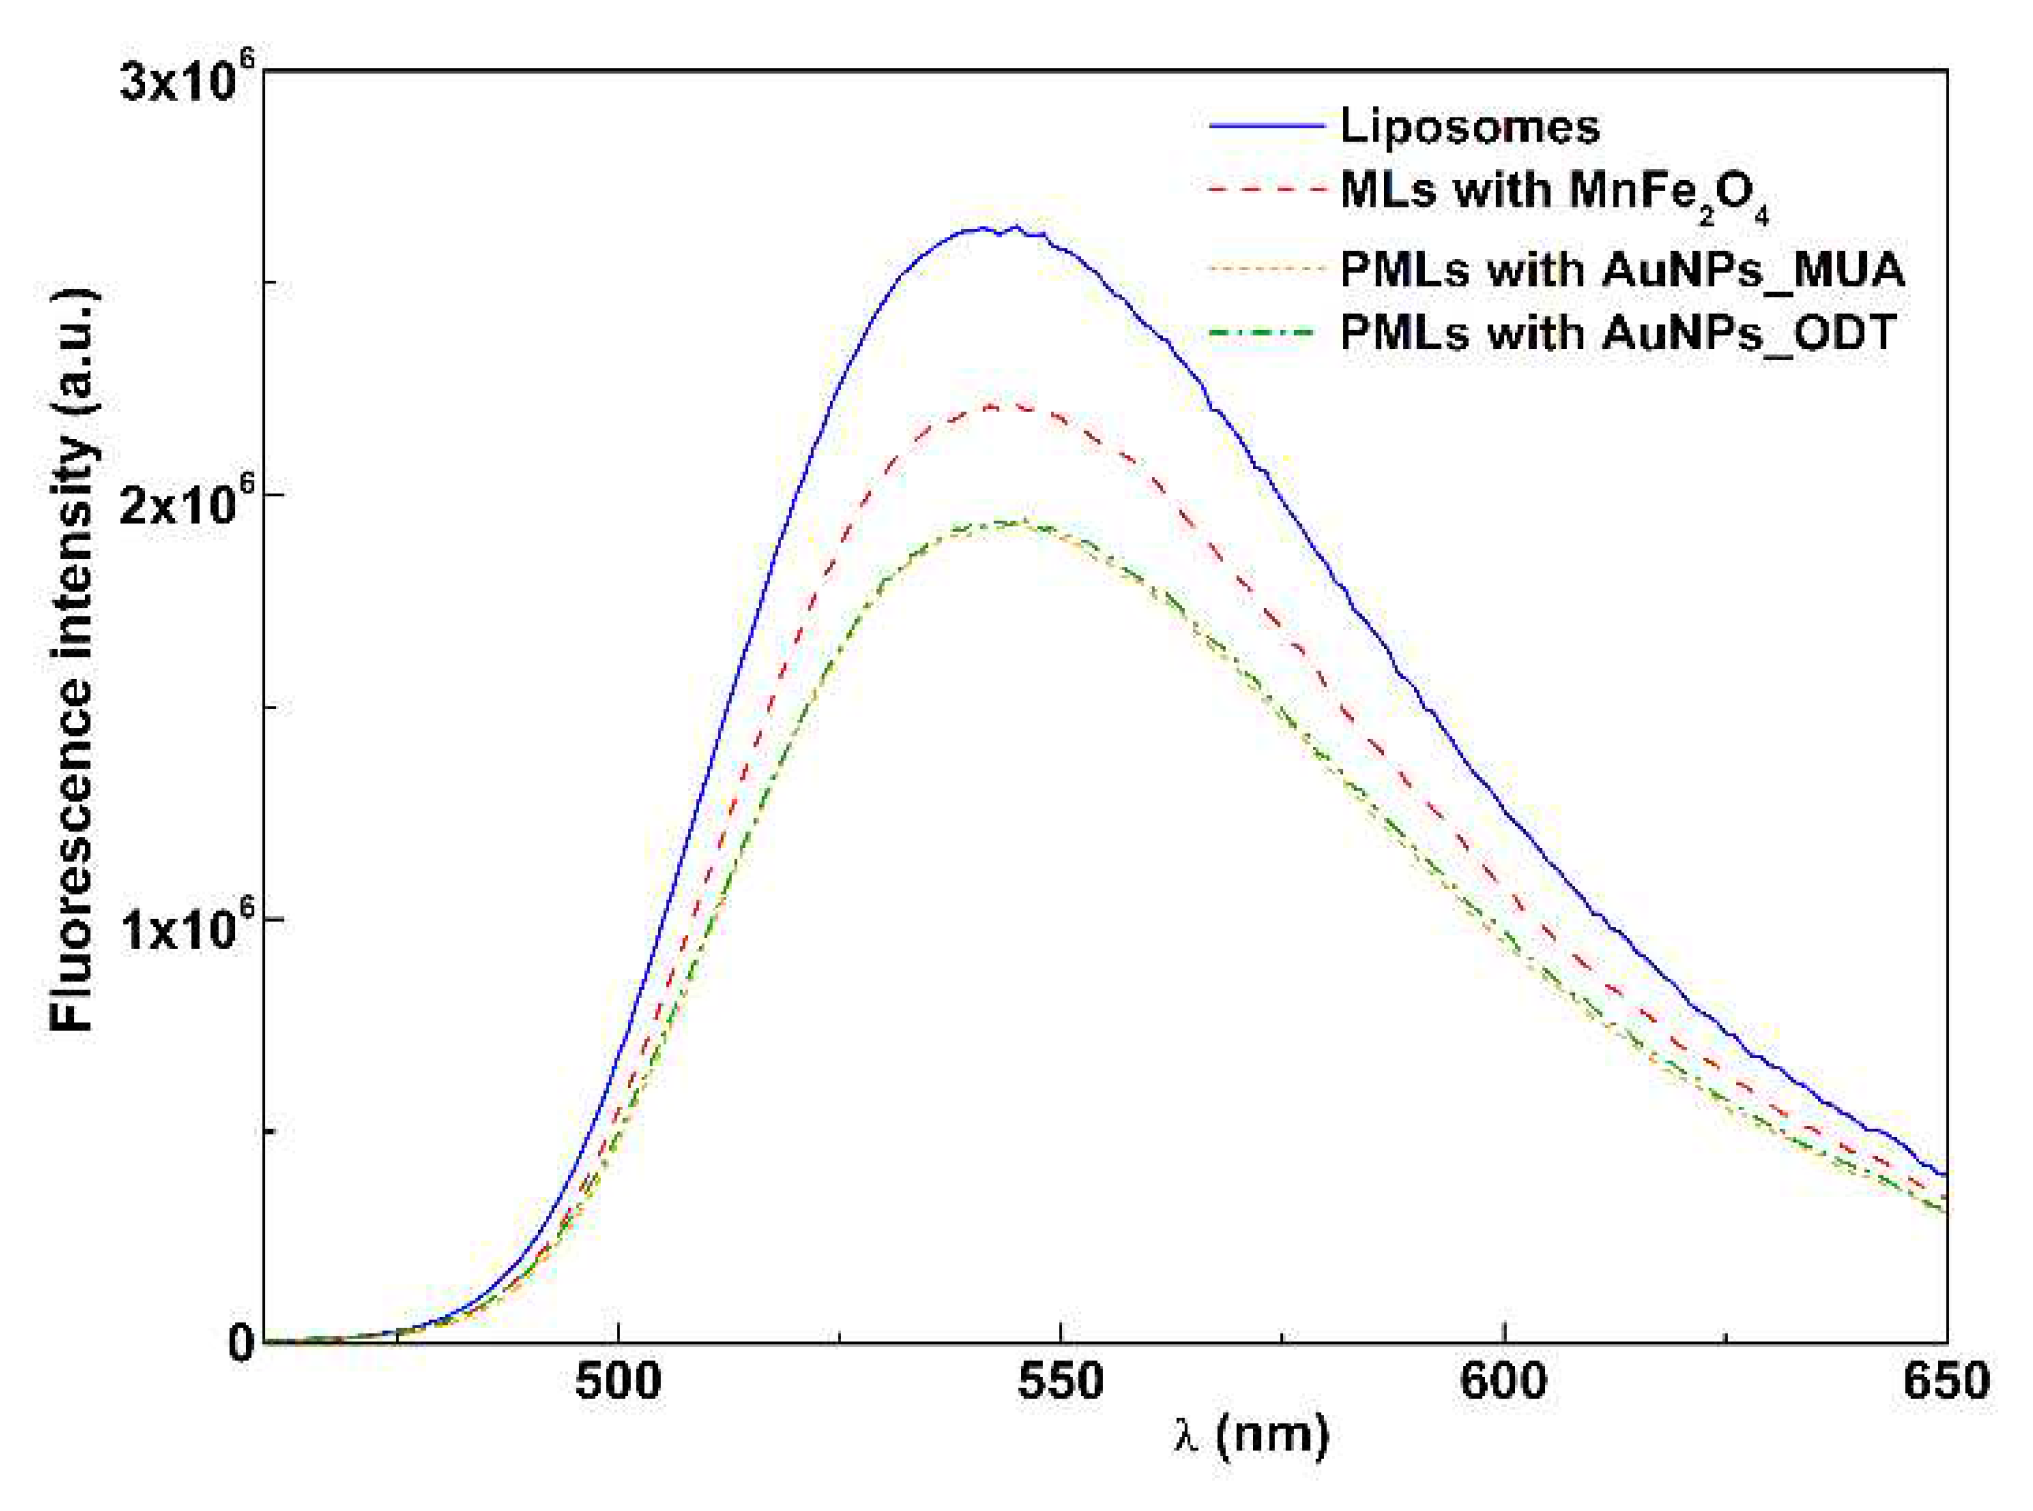
Figure 7.
Fluorescence spectra (λexc=450 nm) of PMLs of: (A) MnFe2O4 and AuNPs_MUA. (B) MnFe2O4 and AuNPs_ODT, containing the labeled lipid NBD-C12-HPC (1×10⁻⁶ M), SUVs containing only Nile Red (1×10⁻⁶ M), and of the mixture of labelled PMLs and SUVs.
Figure 7.
Fluorescence spectra (λexc=450 nm) of PMLs of: (A) MnFe2O4 and AuNPs_MUA. (B) MnFe2O4 and AuNPs_ODT, containing the labeled lipid NBD-C12-HPC (1×10⁻⁶ M), SUVs containing only Nile Red (1×10⁻⁶ M), and of the mixture of labelled PMLs and SUVs.
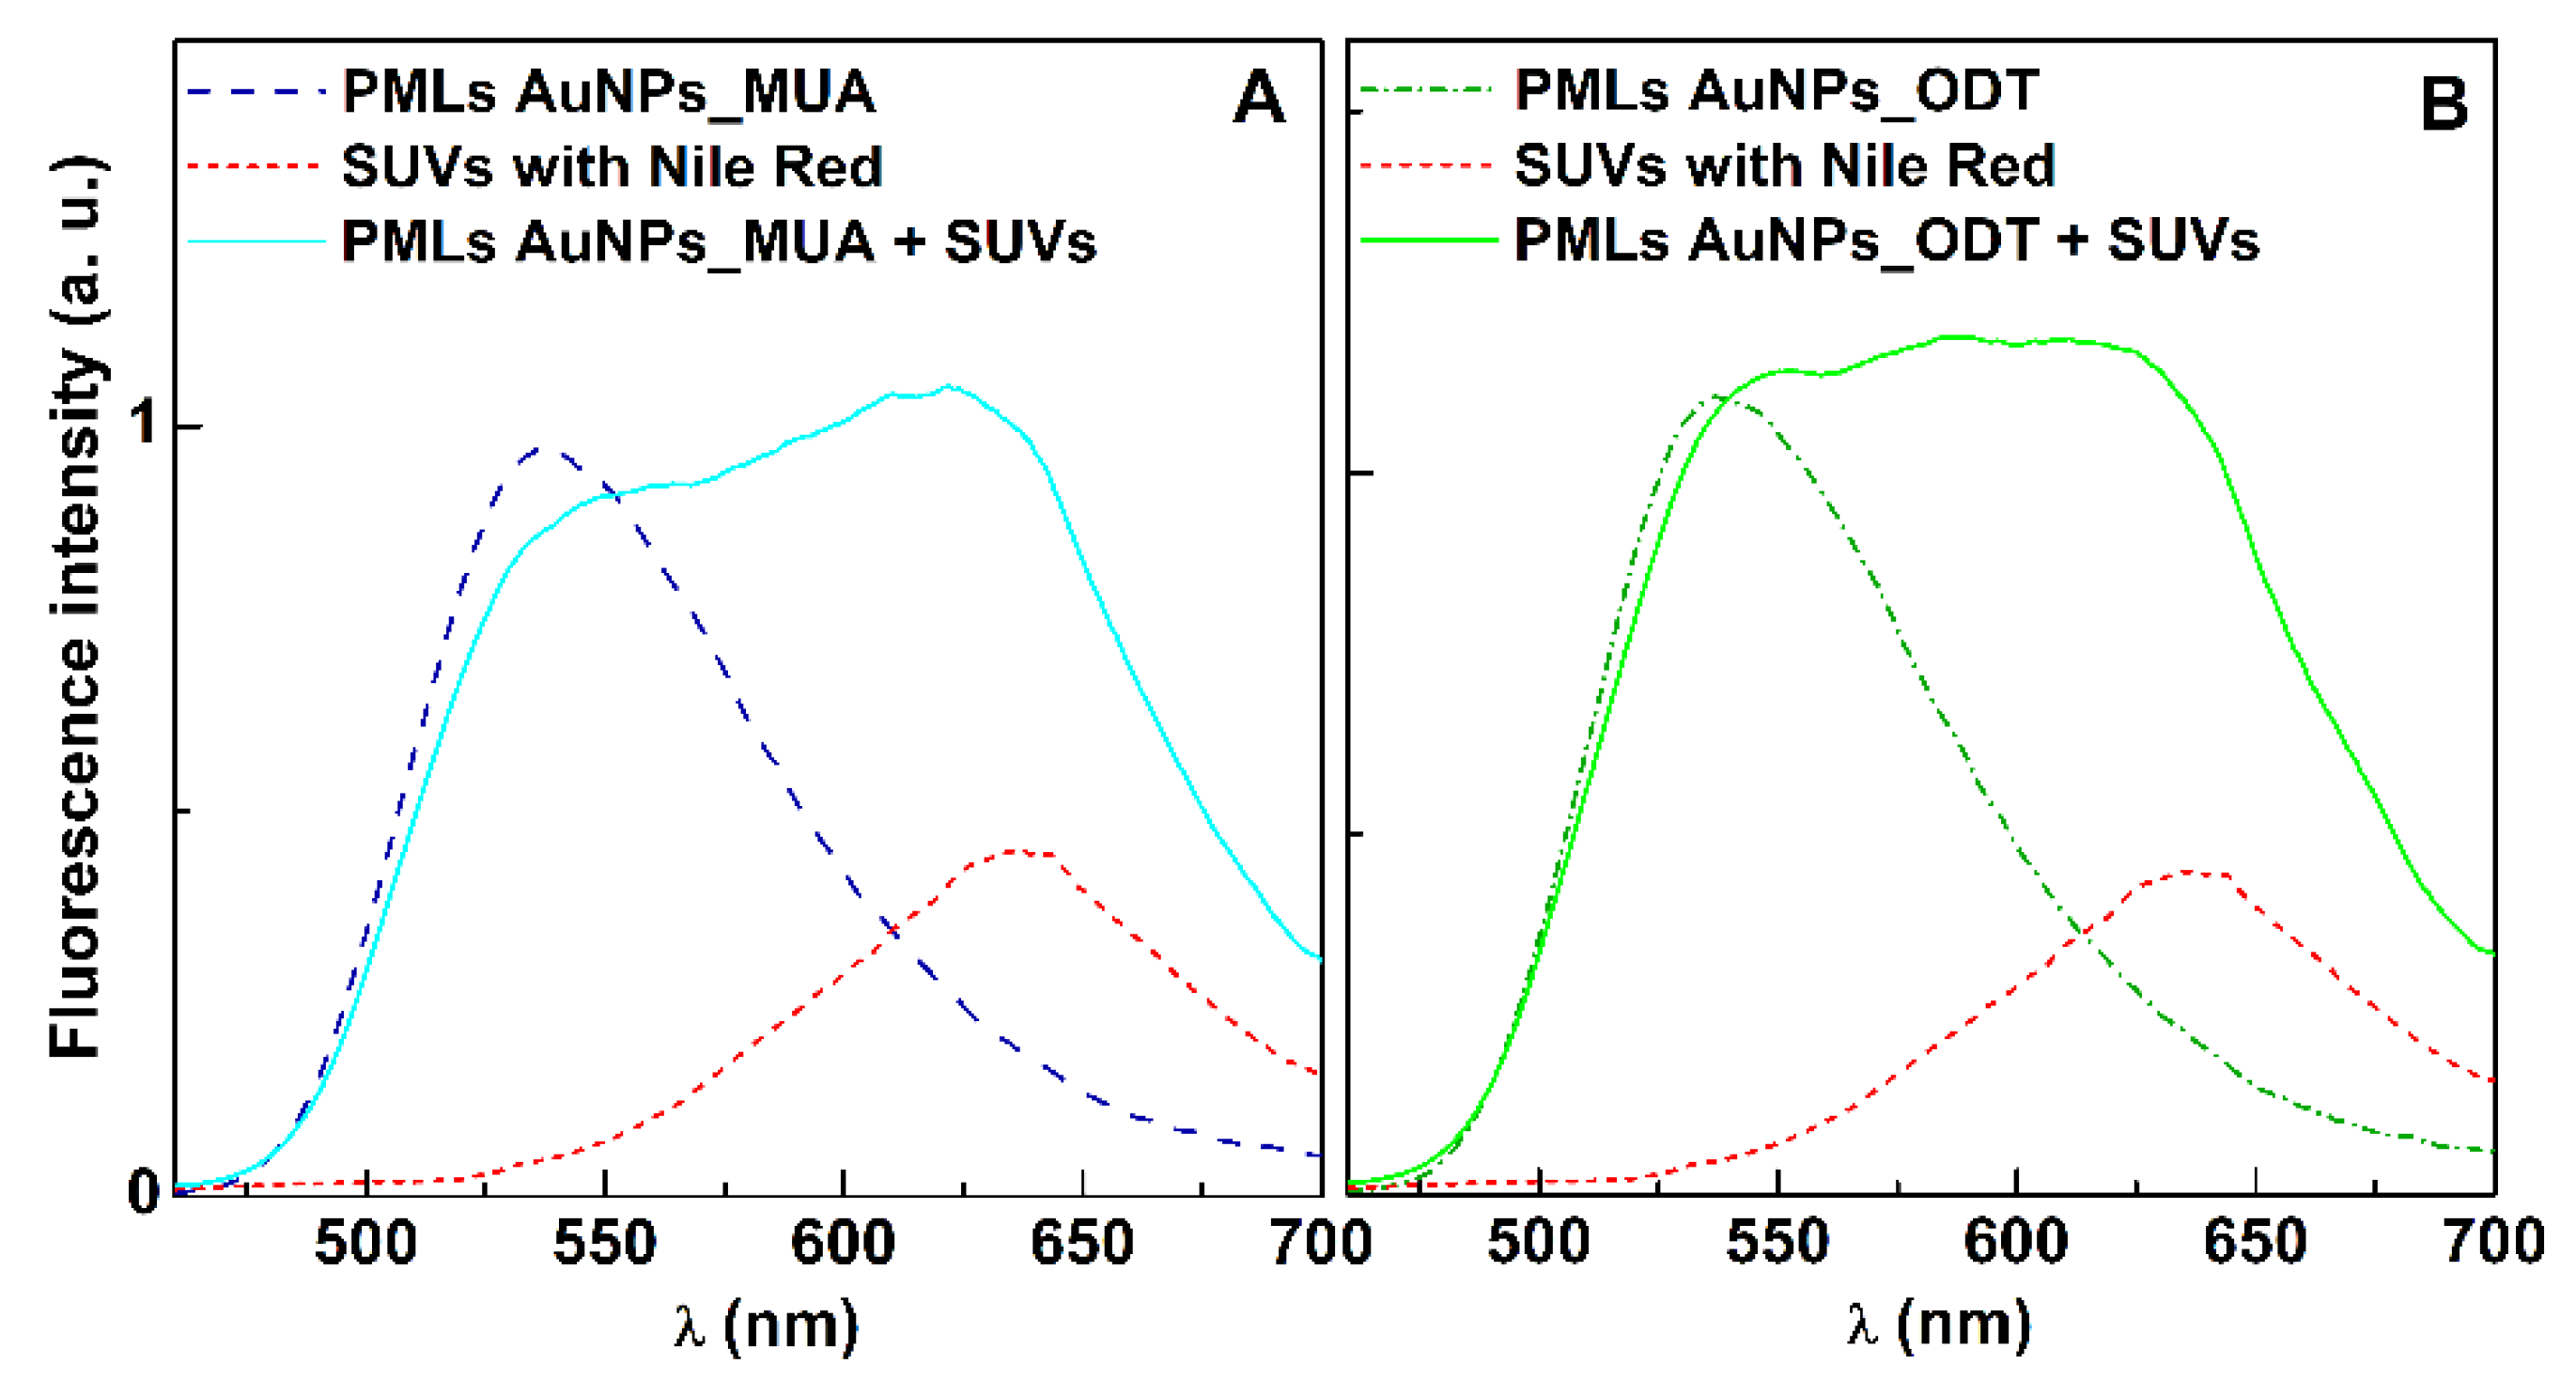
Figure 8.
Variation with temperature of fluorescence anisotropy of DPH incorporated into DPPC-based PMLs, with two different concentrations of AuNPs_MUA and AuNPs_ODT, and DPPC liposomes (for comparison).
Figure 8.
Variation with temperature of fluorescence anisotropy of DPH incorporated into DPPC-based PMLs, with two different concentrations of AuNPs_MUA and AuNPs_ODT, and DPPC liposomes (for comparison).
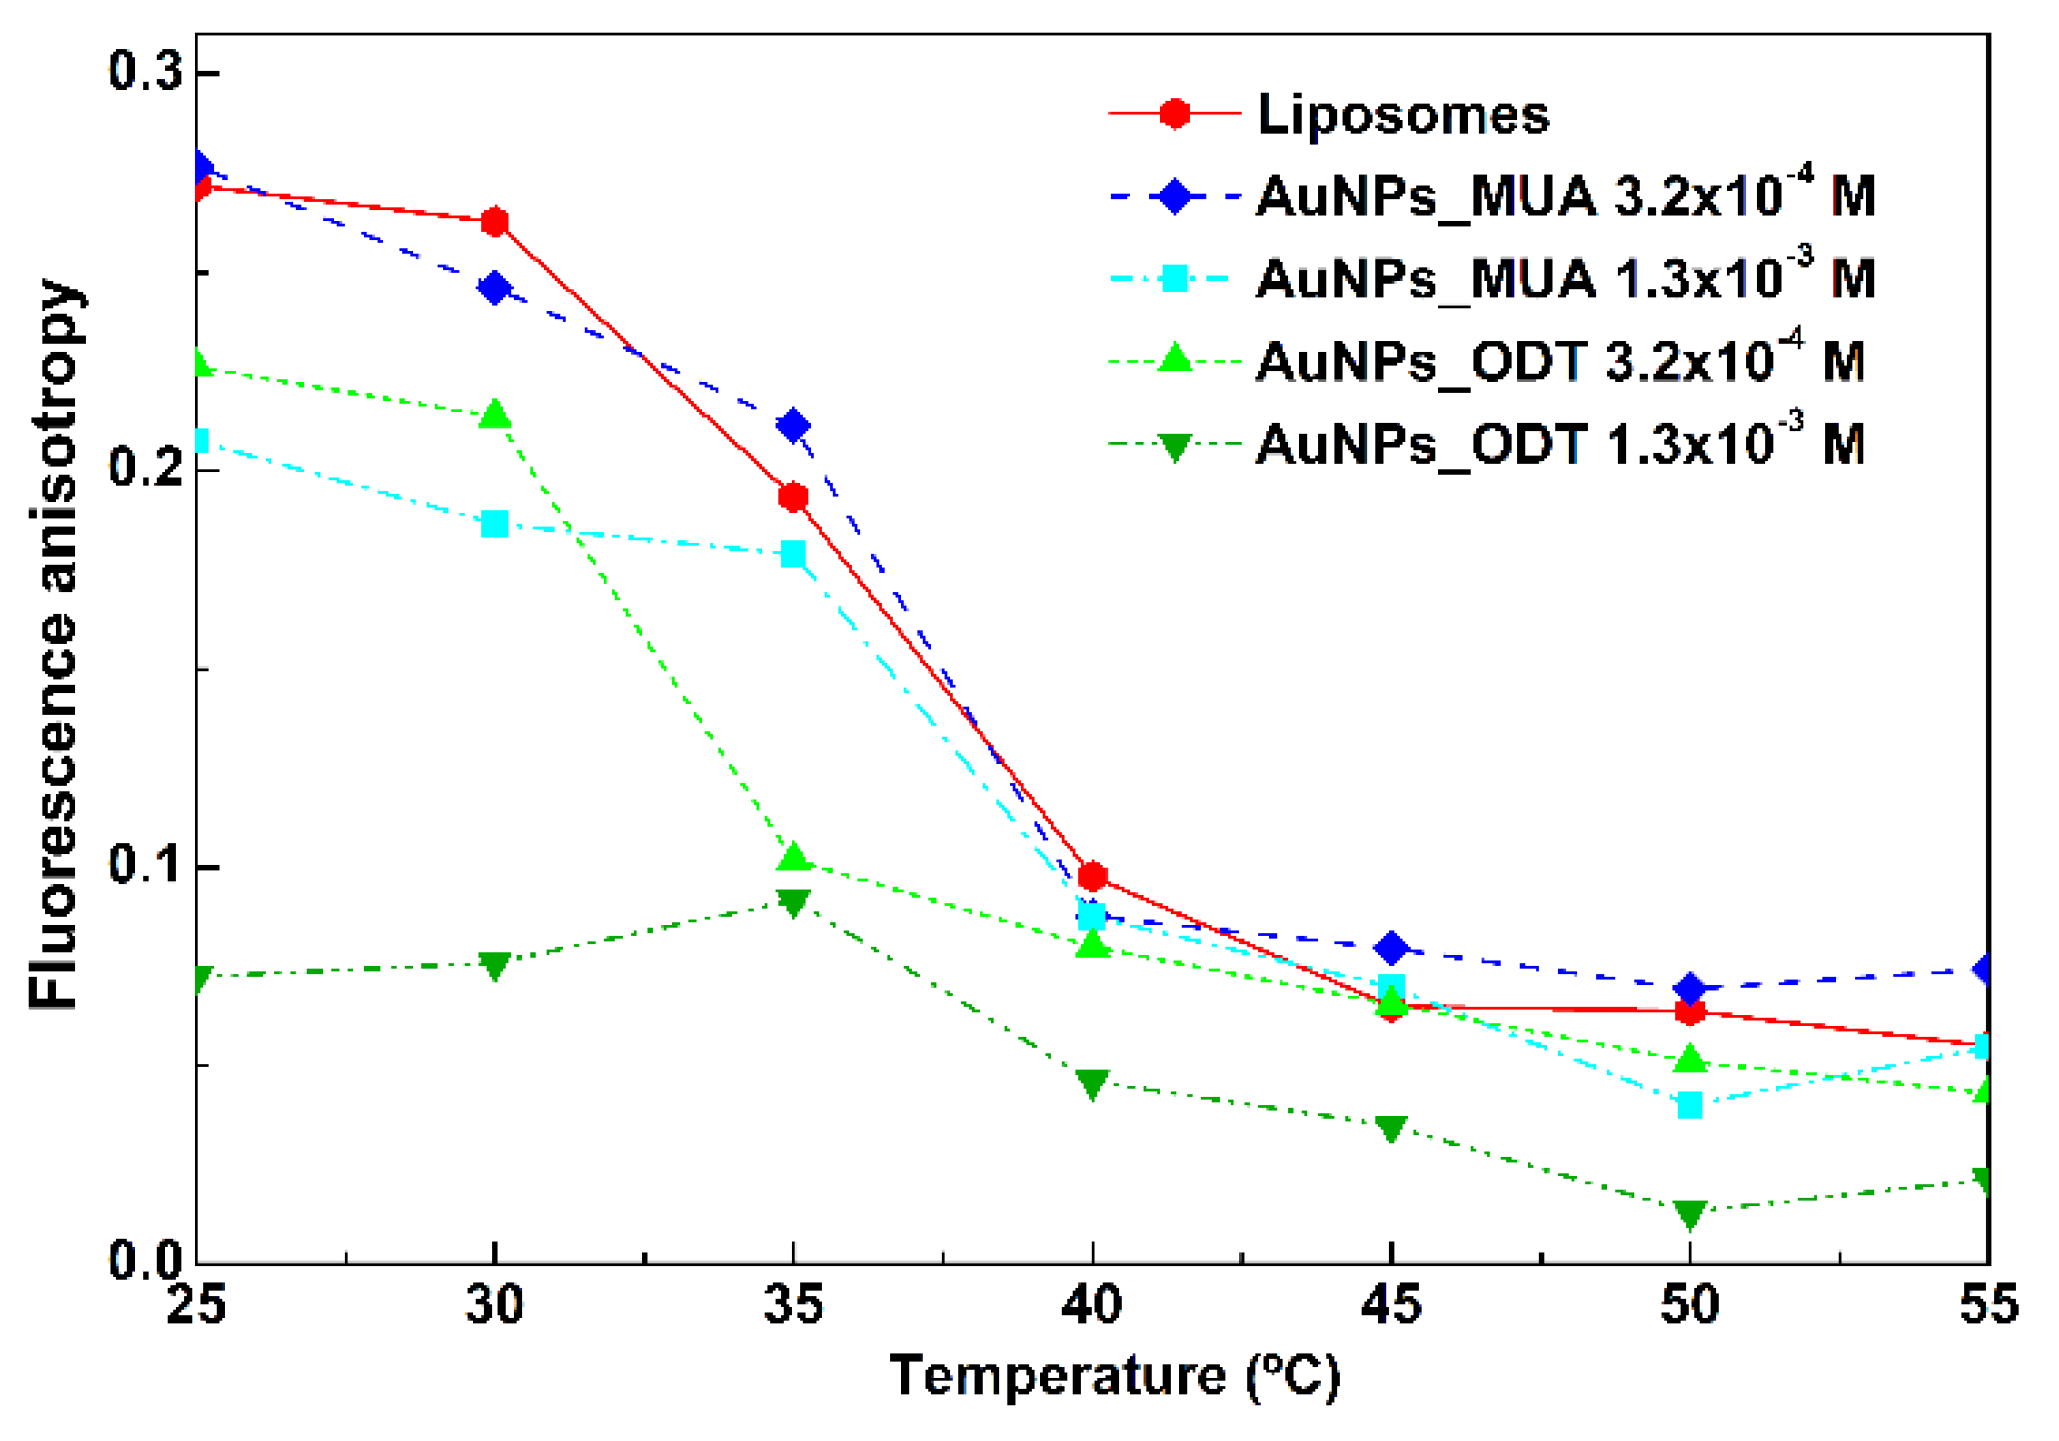
Figure 9.
Transmission electron microscopy (TEM) images of Egg-PC PMLs containing AuNPs_MUA (due to the vacuum system of TEM, the structures become aggregated in the grid).
Figure 9.
Transmission electron microscopy (TEM) images of Egg-PC PMLs containing AuNPs_MUA (due to the vacuum system of TEM, the structures become aggregated in the grid).
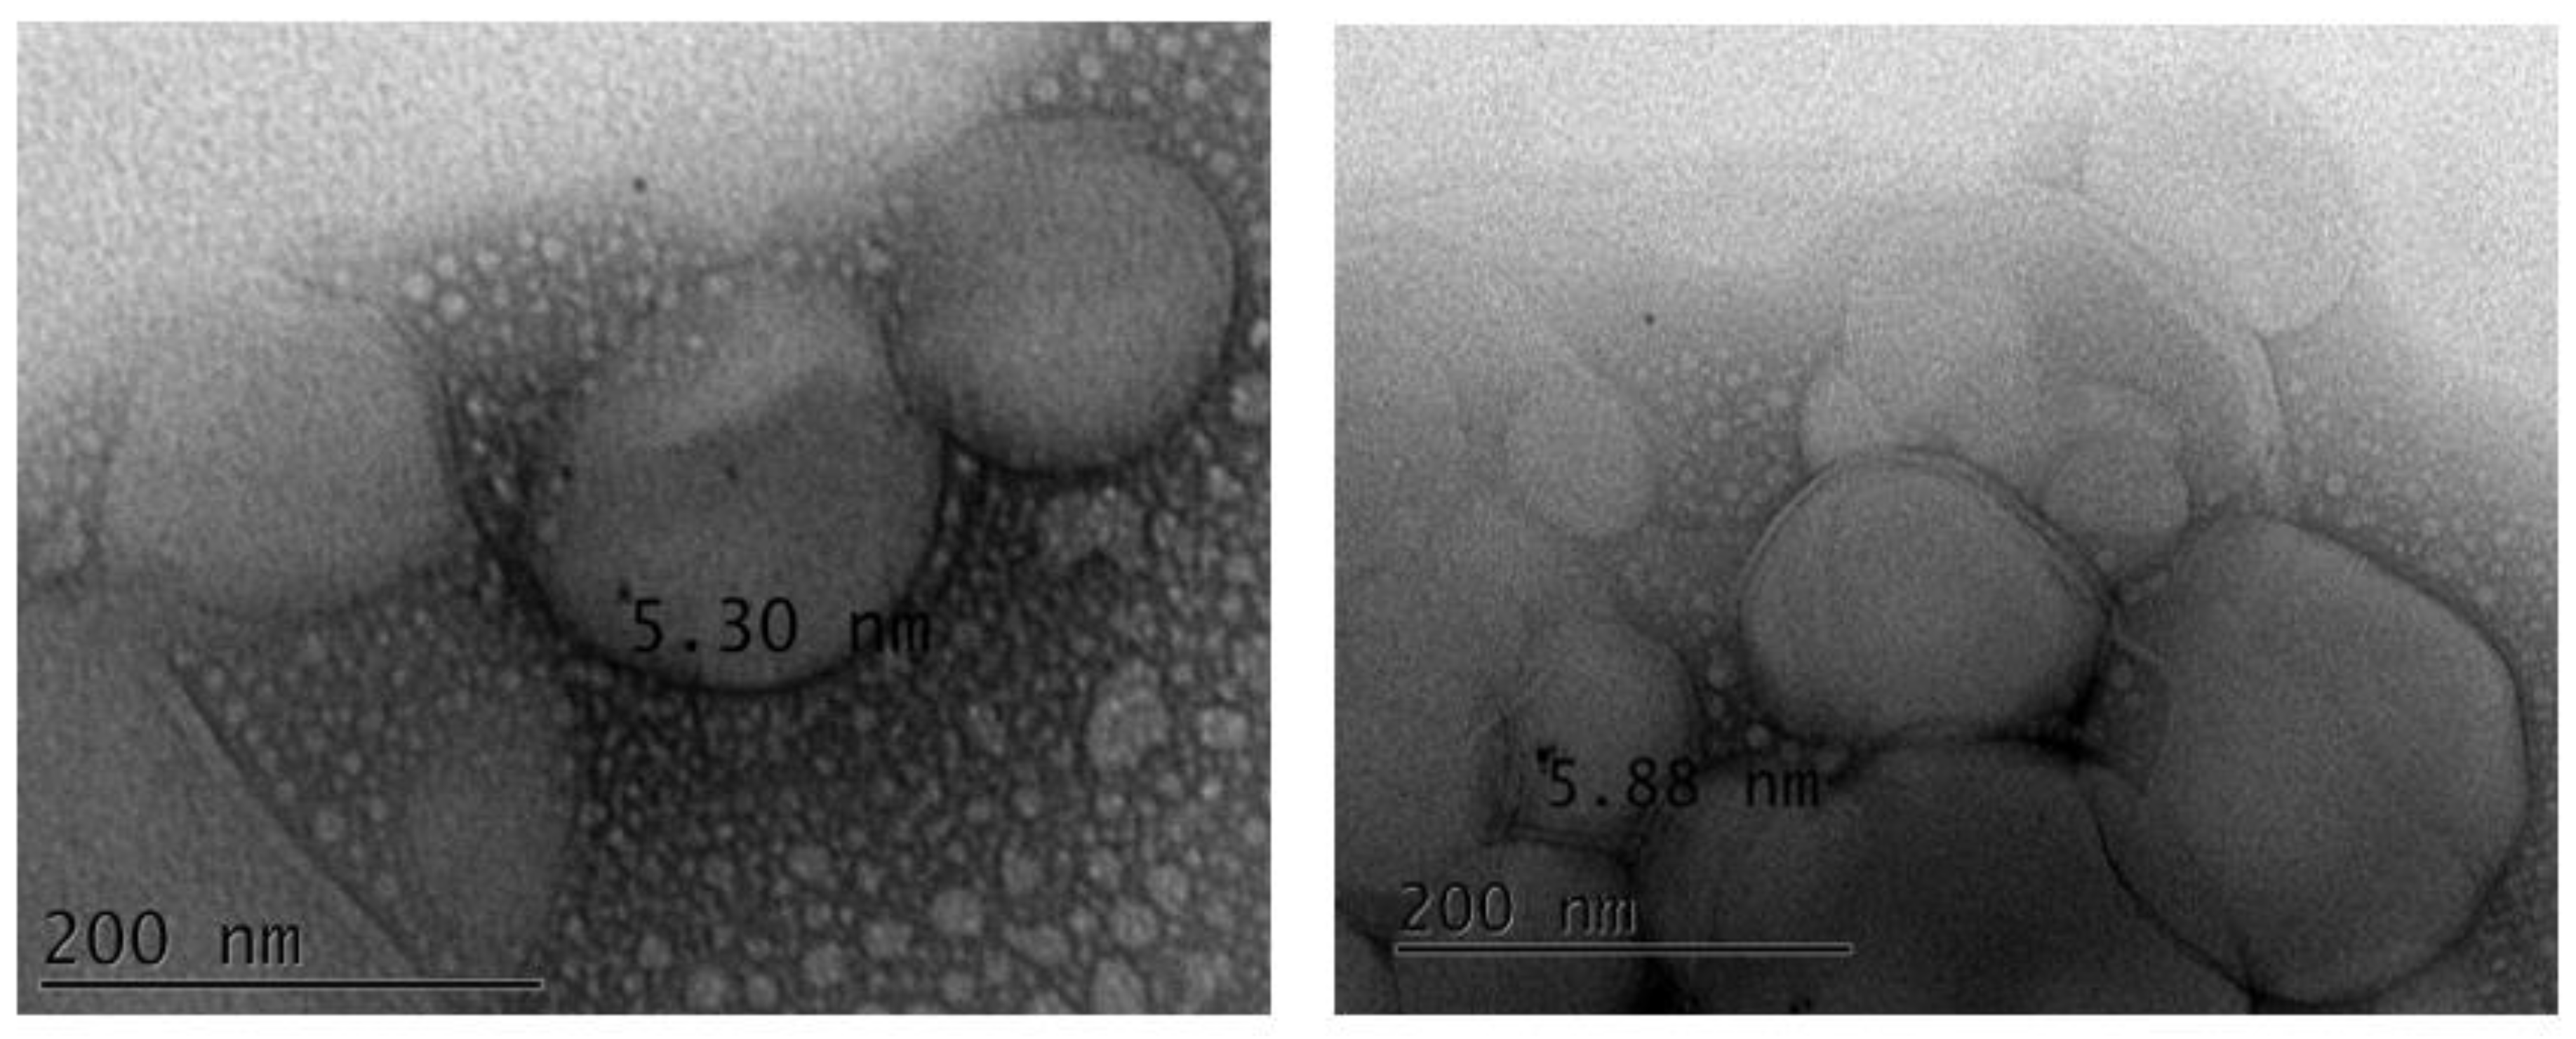
Figure 10.
(A) Hydrodynamic diameter and polydispersity (PDI) and (B) zeta potential of bLf-loaded PMLs at t = 0, 24 and 120 hours after preparation.
Figure 10.
(A) Hydrodynamic diameter and polydispersity (PDI) and (B) zeta potential of bLf-loaded PMLs at t = 0, 24 and 120 hours after preparation.
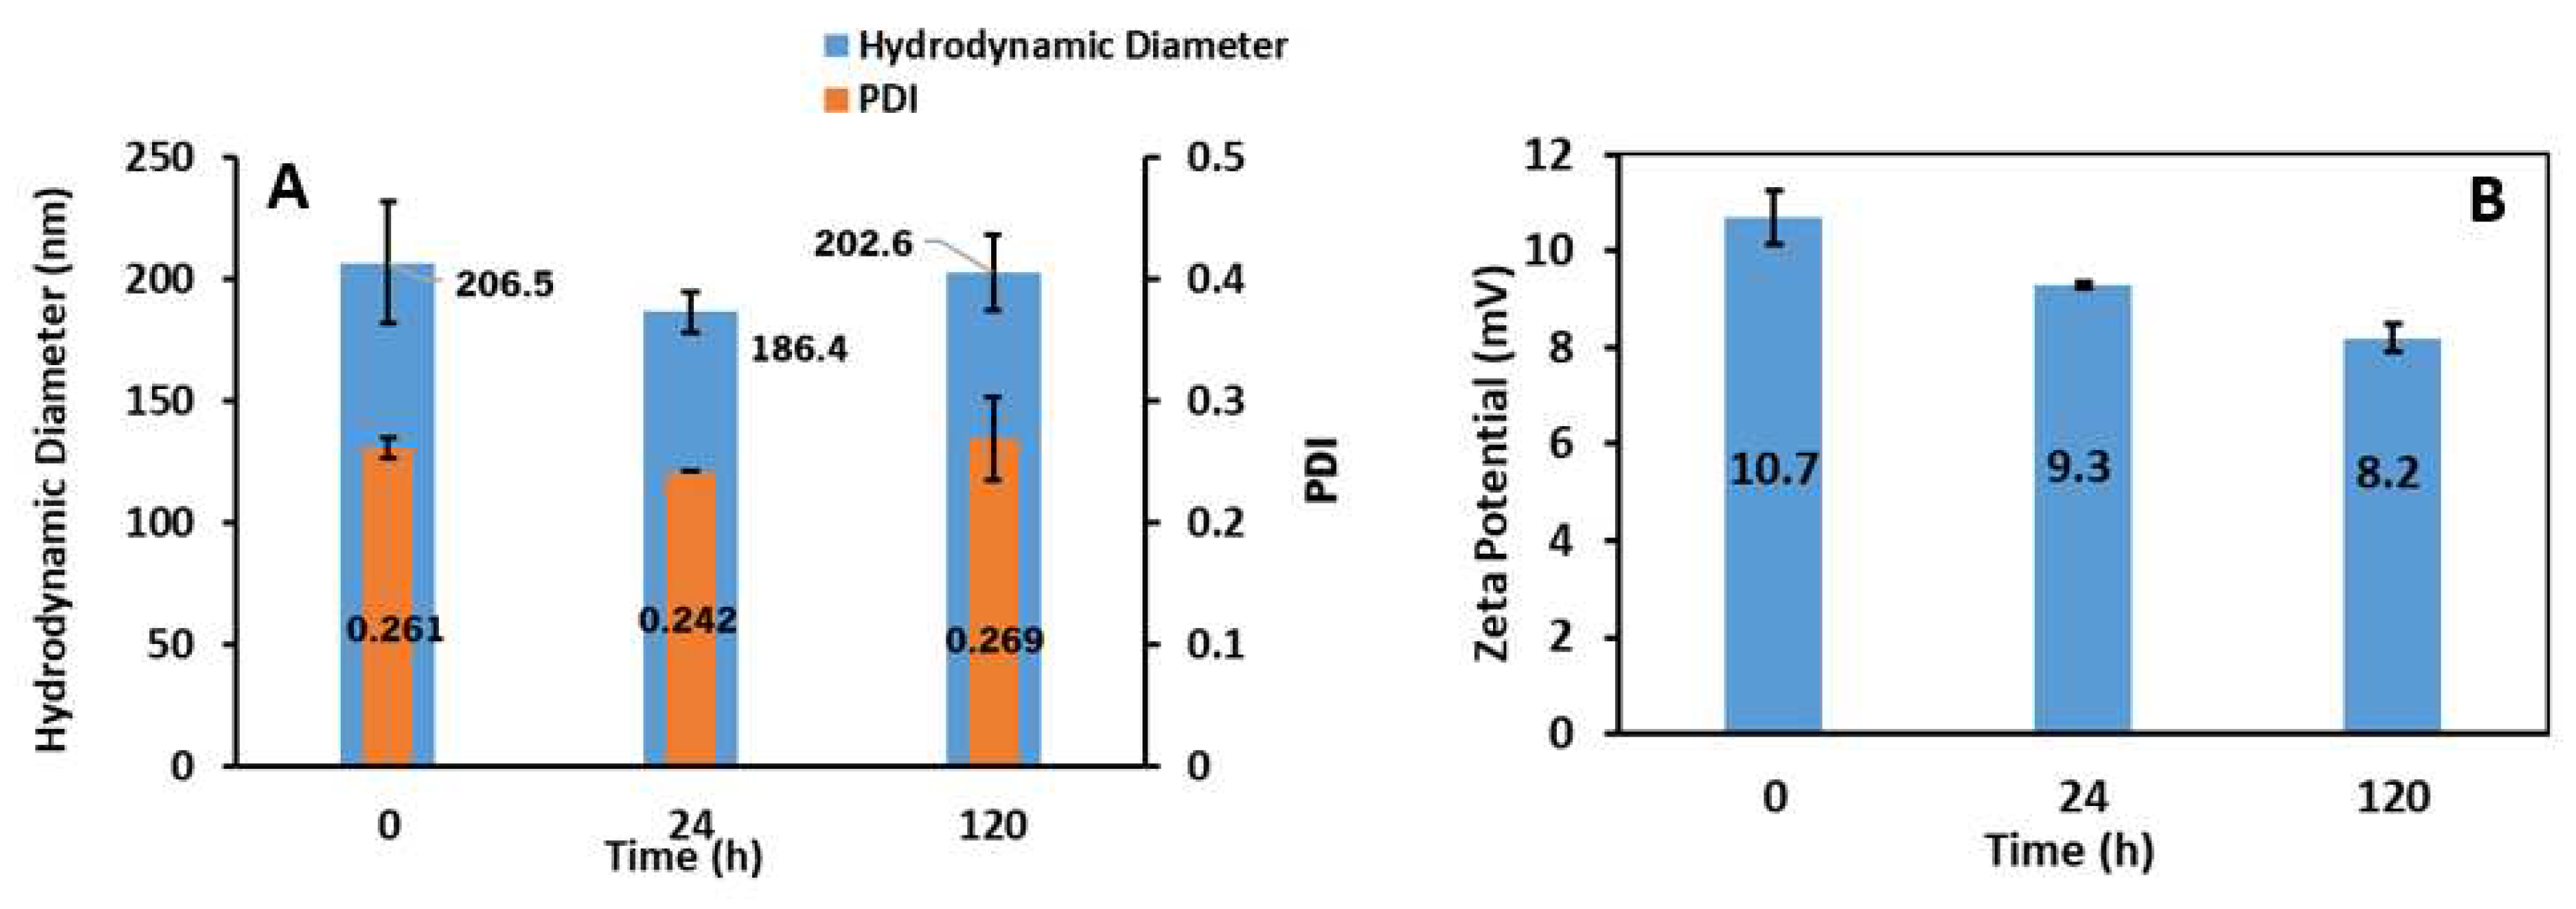
Figure 11.
(A) bLf release profile from PMLs in Tris-HCl buffer and in YEPD medium for 72 h, at 37 °C. Percentage of bLf released in the first 24 h, fitted to Weibull model: (B) in Tris-HCl buffer and (C) in YEPD medium.
Figure 11.
(A) bLf release profile from PMLs in Tris-HCl buffer and in YEPD medium for 72 h, at 37 °C. Percentage of bLf released in the first 24 h, fitted to Weibull model: (B) in Tris-HCl buffer and (C) in YEPD medium.
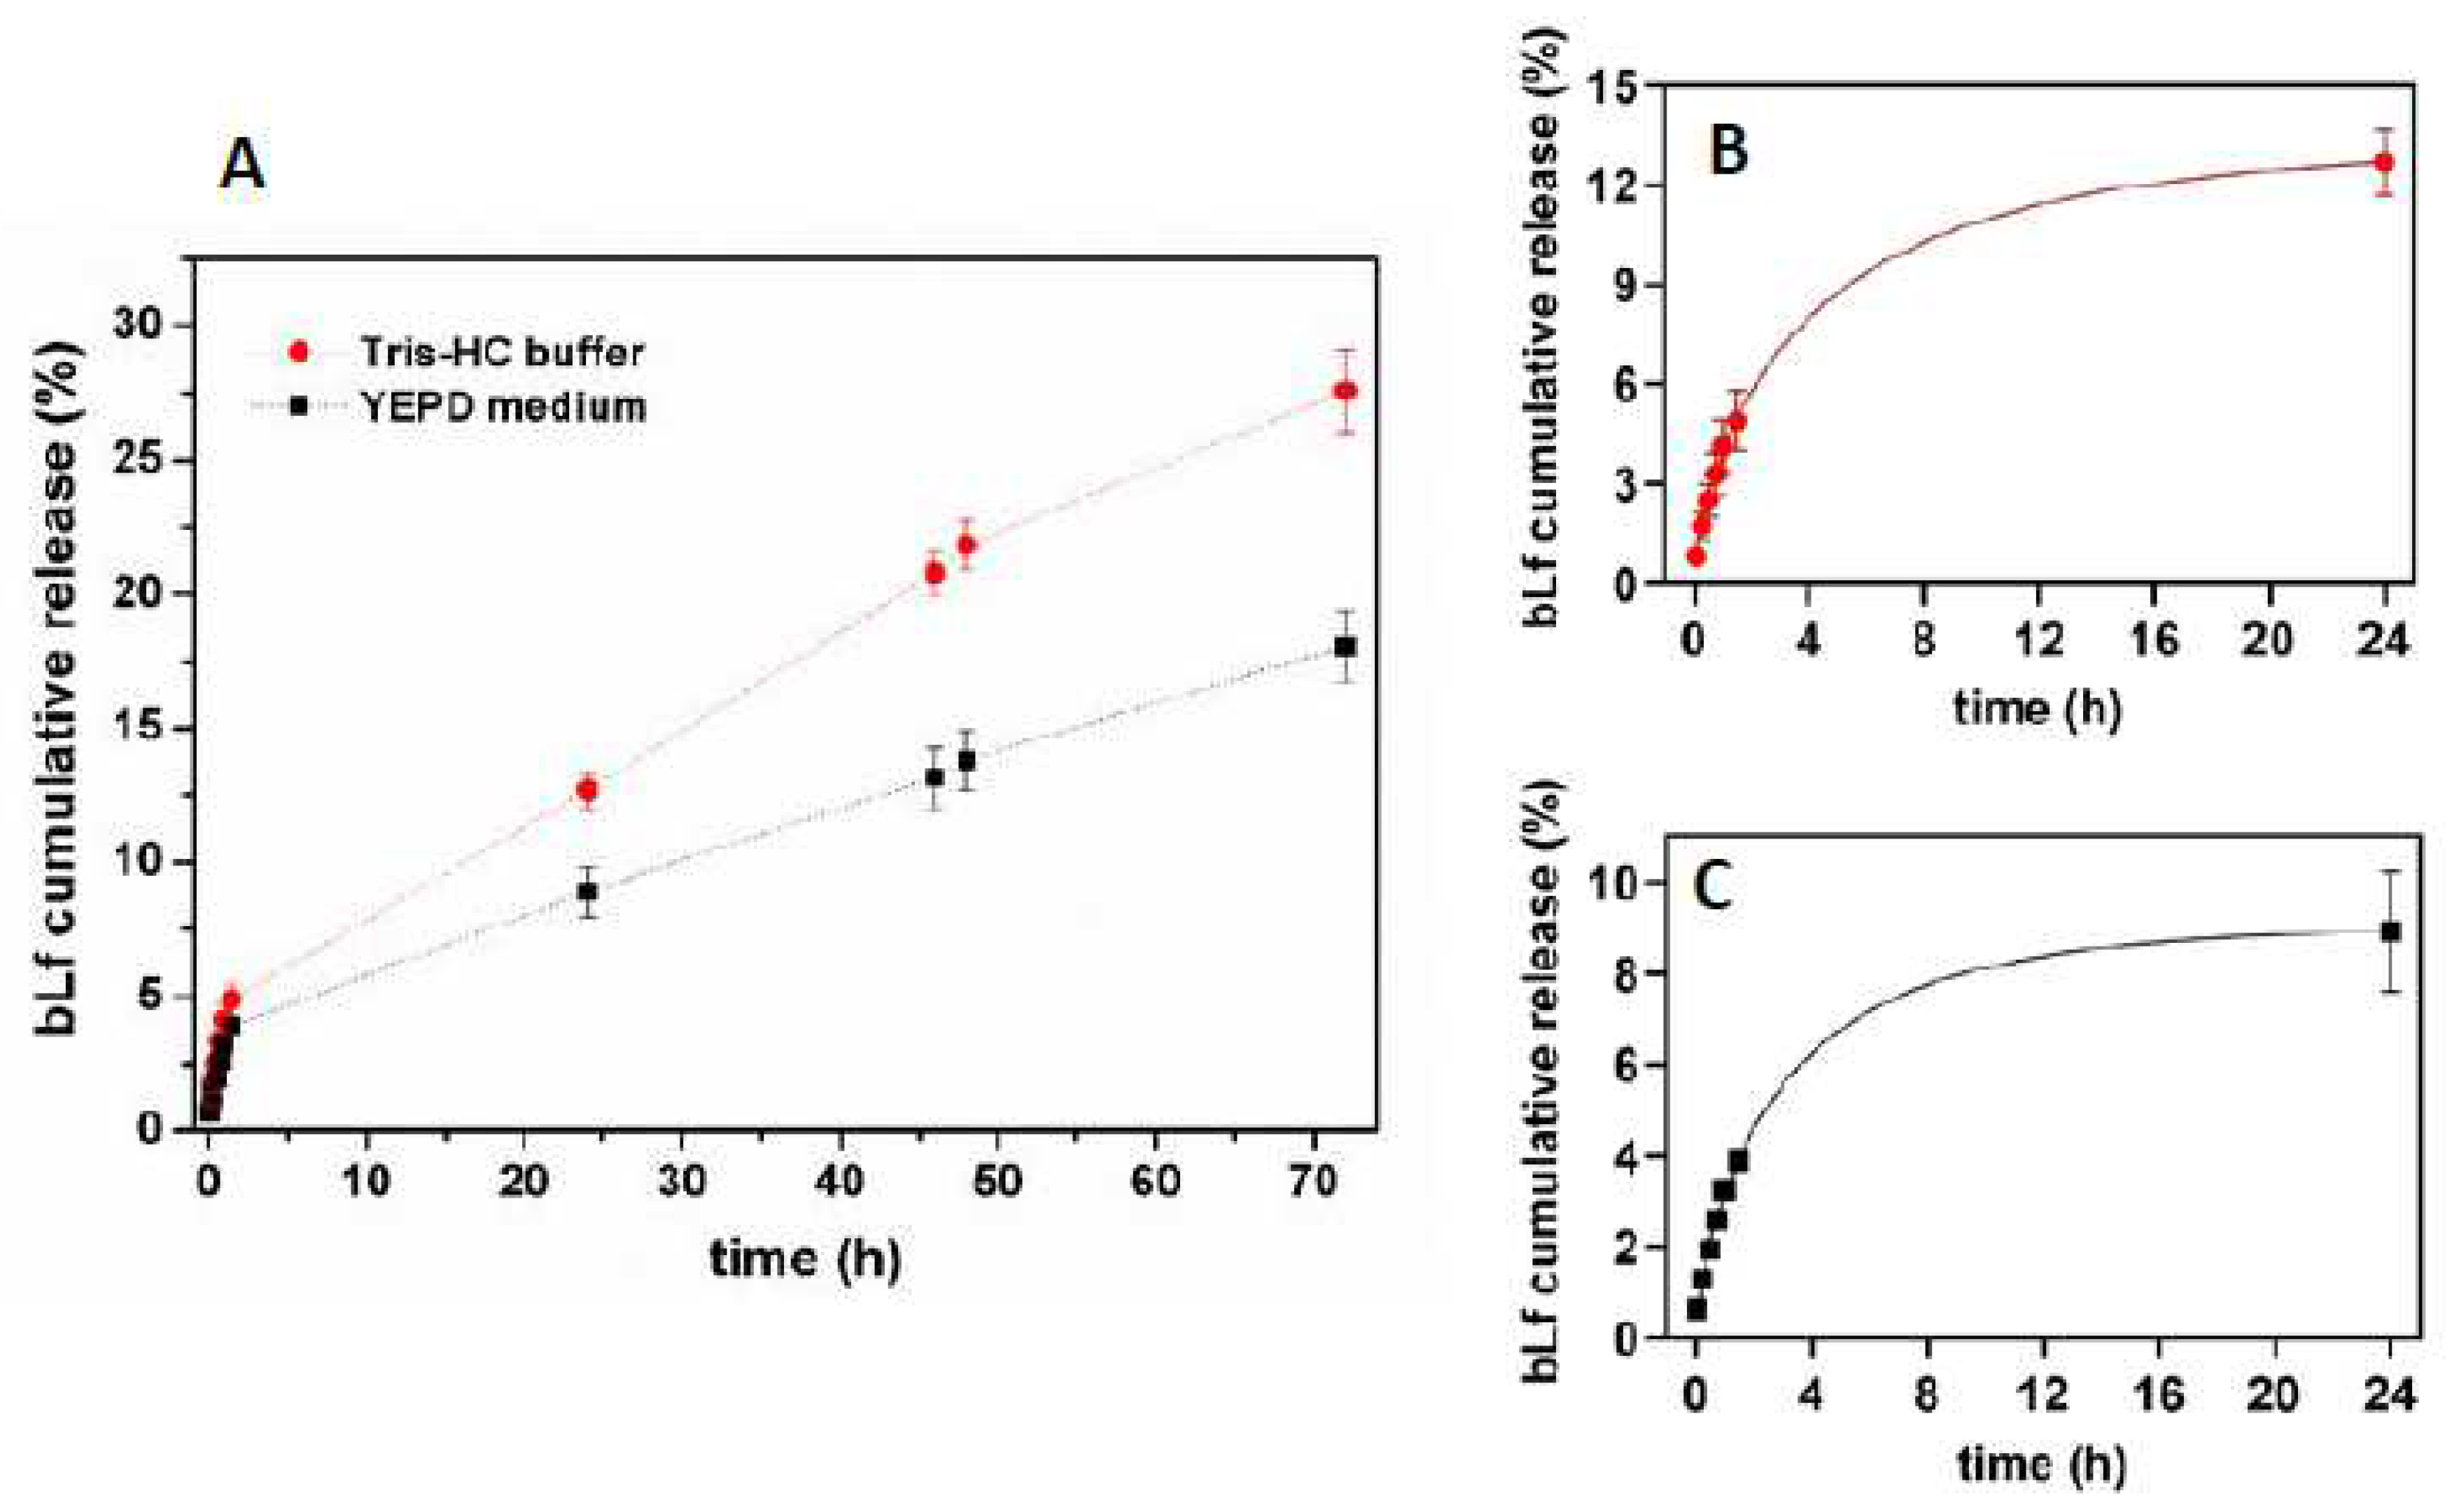
Figure 12.
(A) Cell viability of S. cerevisiae wt strain in Tris-HCl buffer, incubated for 90 minutes with different concentrations of bLf-unloaded PMLs, bLf-loaded PMLs (PMLs + 62.5, 125 and 250 μg/mL bLf) or of free bLf (62.5, 125 and 250 μg/mL). A control consisting of yeast cells without any treatment is also shown. Cell survival is expressed in percentage, considering 100% the number of CFUs at time 0 for each condition tested. The values presented are the mean and standard derivation of three independent experiments (n=3). ns - non-significant; ***, **** P < 0.001, 0.0001, respectively, in comparison to the untreated control. (B) Fluorescence microscopy images of PMLs and bLf-loaded PMLs (250 µg/mL), labeled with DPH (blue fluorescence), incubated for 90 minutes at 30 °C with wt cells.
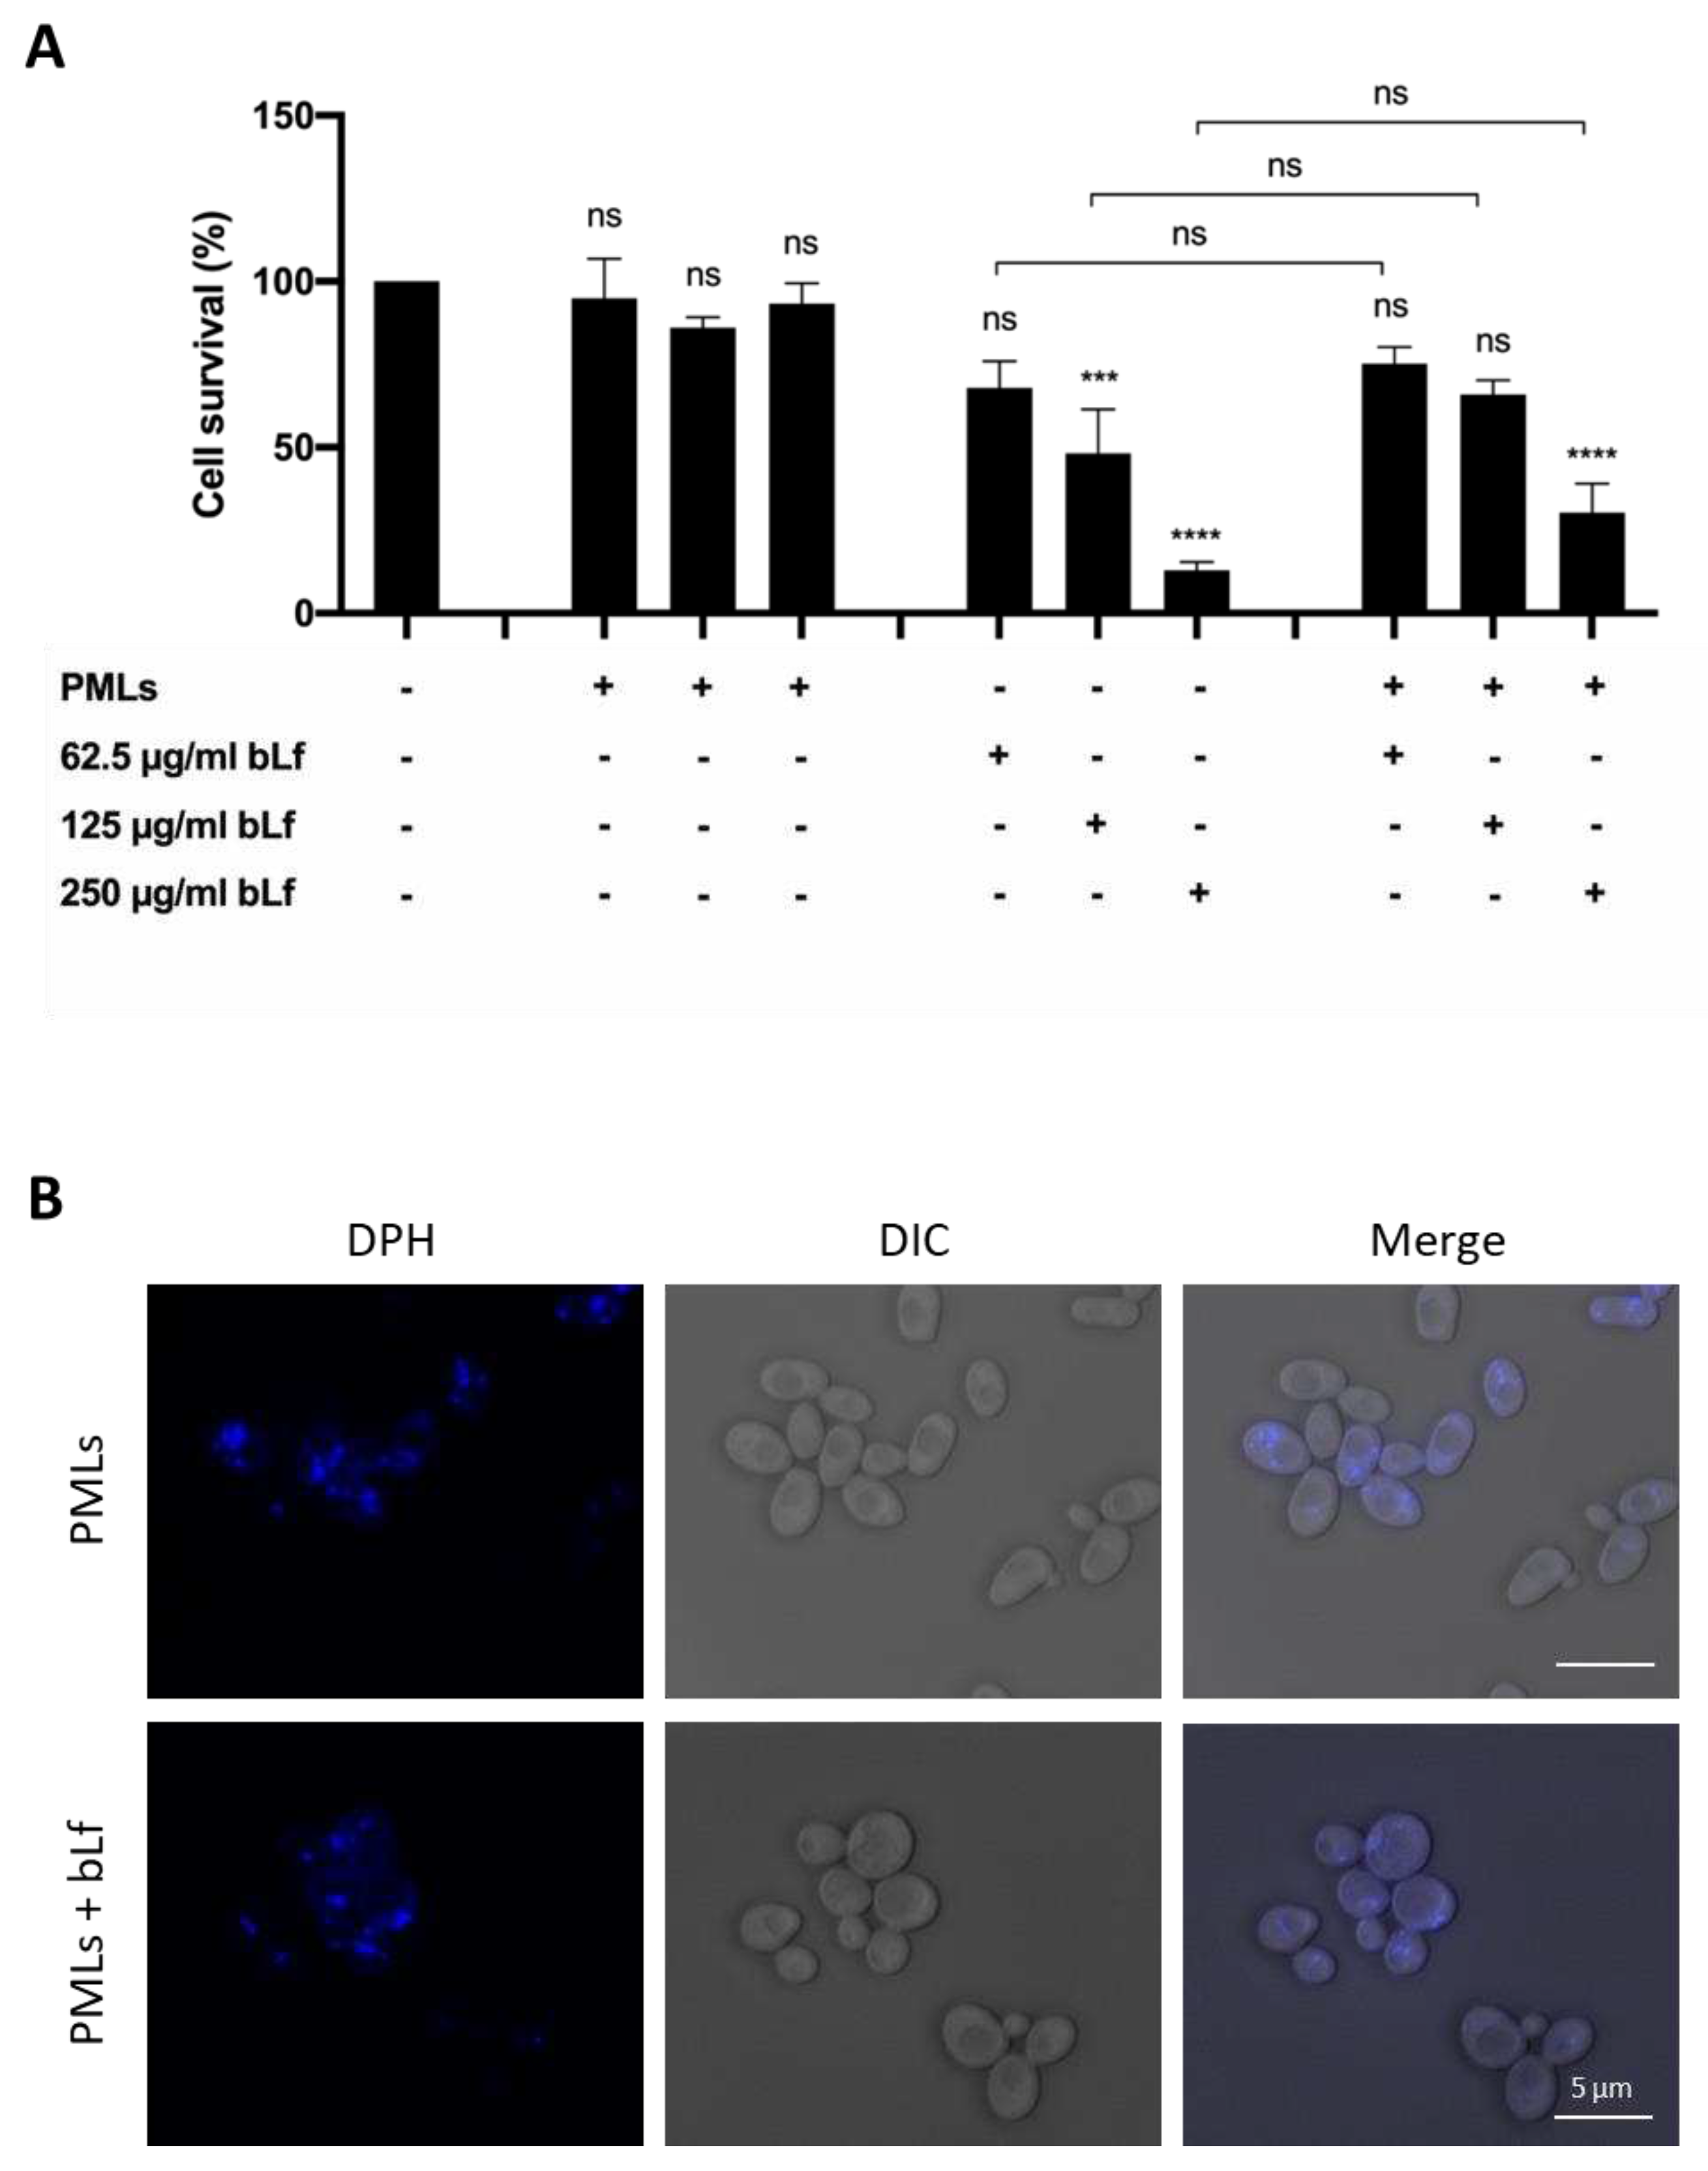
Figure 13.
Cell survival of S. cerevisiae wt and mutant end3Δ cells, in Tris-HCl buffer, incubated for 15, 30 and 90 minutes with 250 µg/mL of PMLs and bLf-loaded PMLs. A control consisting of yeast cells without any treatment is also shown. Cell survival is expressed in percentage, considering 100% the number of CFUs at time 0 for each condition tested. The values presented are the mean and standard derivation of three independent experiments (n=3). ns - non-significant; *, **, ***, **** P < 0.05, 0.01, 0.001, 0.0001, respectively, in comparison with the control.
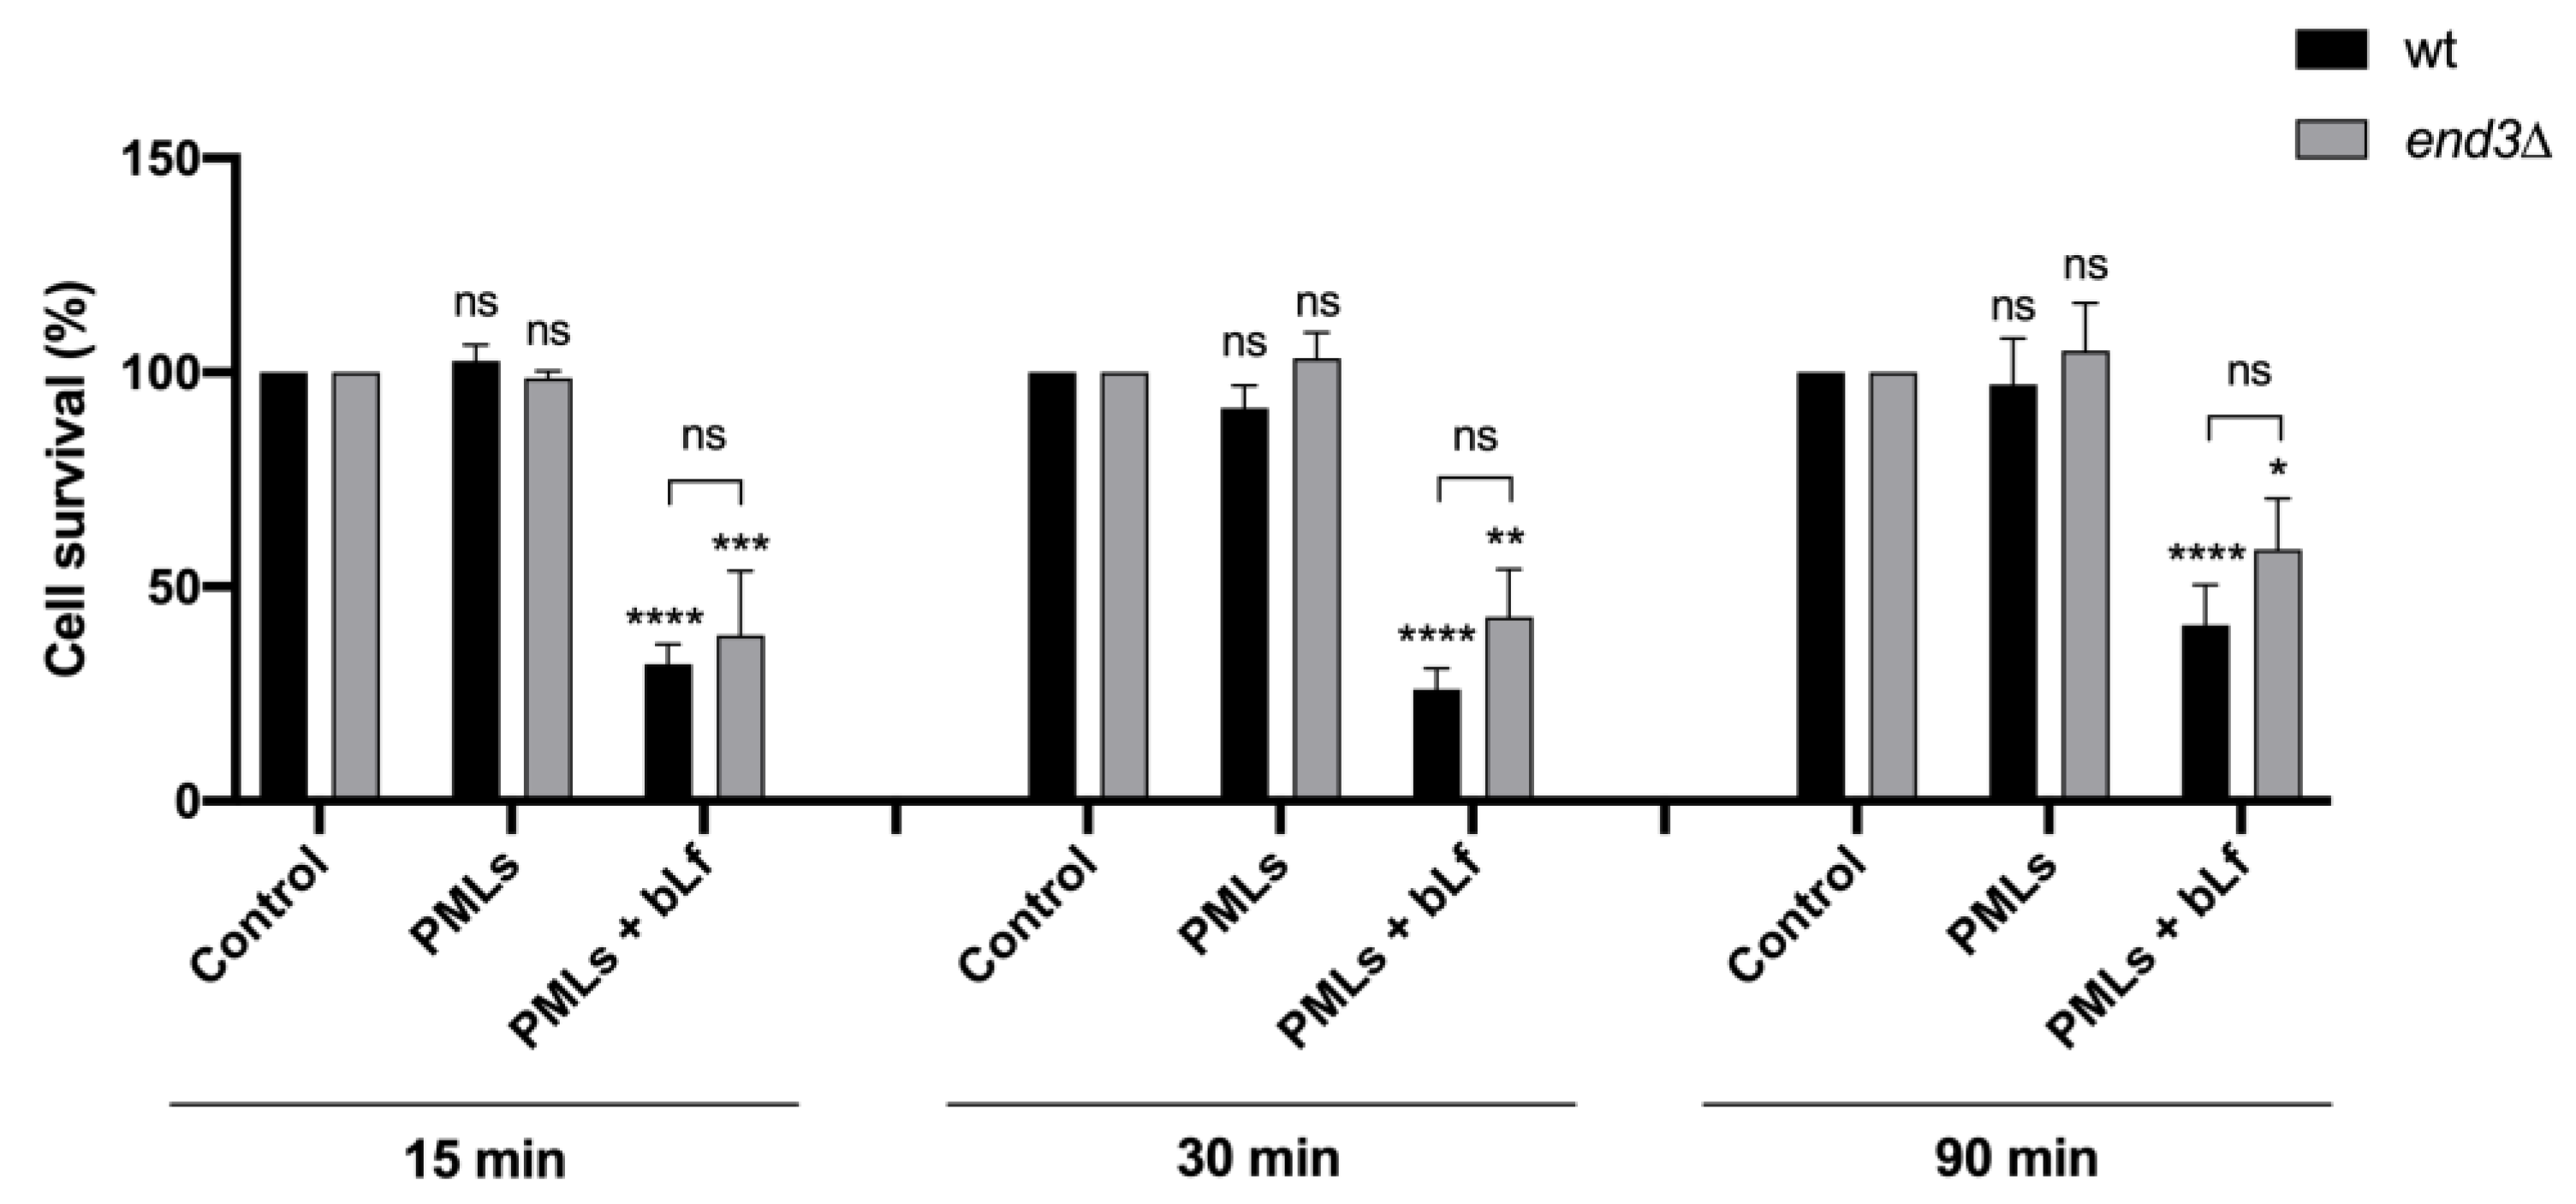
Figure 14.
(A) Internalization of PMLs+bLf by S. cerevisiae wt cells in Tris-HCl buffer after pre-incubation for 30 minutes with 5 mg/mL MβCD, at 4 °C and with 20 nM 2-DG, followed by incubation for 15, 30, 60 and 90 minutes with 250 µg/mL of bLf-loaded PMLs. A control consisting of yeast cells without any treatment, at 30 °C is also shown. Internalization is expressed as percentage of cells exhibiting blue fluorescence. The values presented are the mean and standard derivation of three independent experiments (n=3). ns – non-significant; *, ** P < 0.05, 0.01, respectively, in comparison with the control. (B) Fluorescence microscopy images of S. cerevisiae cells pre-incubated with MβCD, at 4 °C and with 2-DG for 30 minutes, and then incubated for additional 30 min with 250 µg/mL of bLf-loaded PMLs labeled with DPH (blue fluorescence).
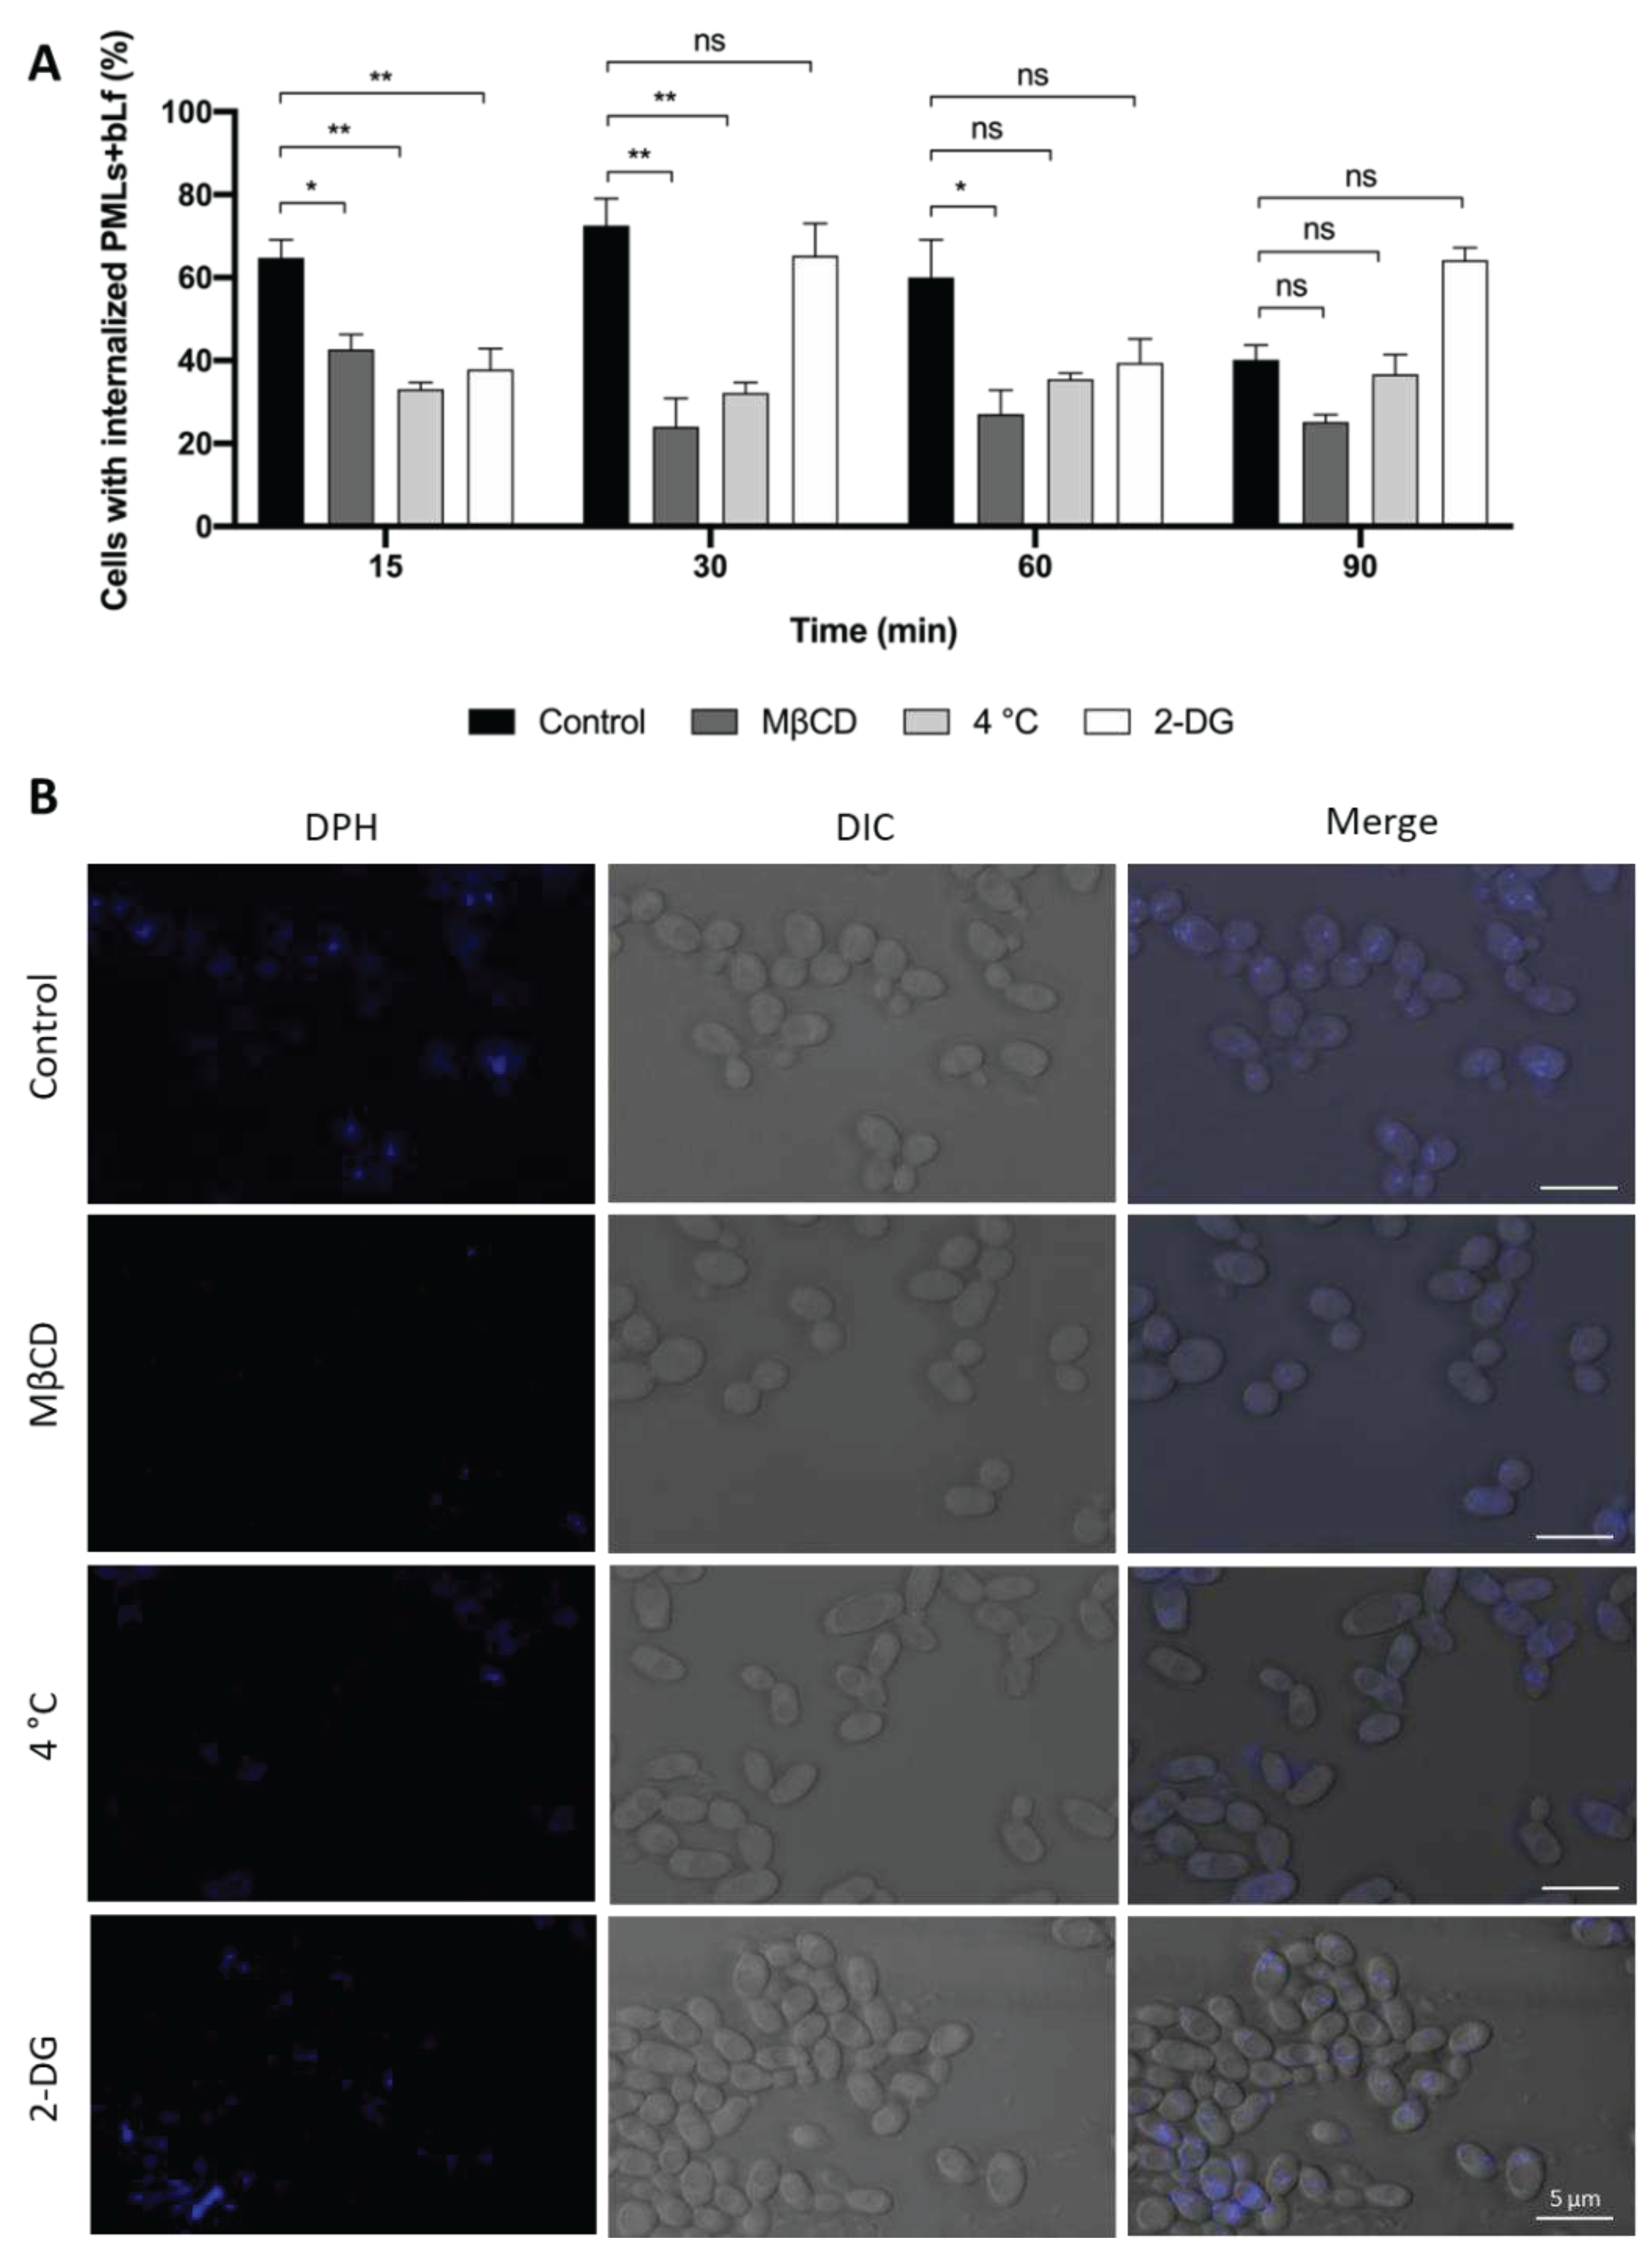

Table 1.
Coercive field (Hc), remanent magnetization (Mr), saturation magnetization (Ms), and the ratio between remanent magnetization and saturation magnetization (Mr/Ms) for MnFe2O4 NPs.
Table 1.
Coercive field (Hc), remanent magnetization (Mr), saturation magnetization (Ms), and the ratio between remanent magnetization and saturation magnetization (Mr/Ms) for MnFe2O4 NPs.
| Hc (Oe) | Ms (emu/g) | Mr (emu/g) | Mr/Ms | |
|---|---|---|---|---|
| MnFe2O4 NPs | 5.45 | 65.32 | 0.52 | 0.008 |
Table 2.
Slope (ΔT/Δt) and Specific Absorption Rate (SAR) values of MnFe2O4 and Au NPs.
| Nanoparticles | Mechanism | ΔT/Δt (°C/min) | SAR (W/g) |
|---|---|---|---|
| MnFe2O4 | Magnetic hyperthermia | 0.05 | 4.18 |
| Au | Photothermia | 0.51 | 2134 |
| AuNPs_MUA | Photothermia | 0.21 | 107 |
Table 3.
Hydrodynamic size, polydispersity (PDI) and zeta potential values for DPPC PMLs and Egg-PC PMLs, containing MnFe2O4 NPs and AuNPs_ODT or AuNPs_MUA, immediately after preparation (0 h) and 24 h after. SD: Standard deviation of three independent measurements.
Table 3.
Hydrodynamic size, polydispersity (PDI) and zeta potential values for DPPC PMLs and Egg-PC PMLs, containing MnFe2O4 NPs and AuNPs_ODT or AuNPs_MUA, immediately after preparation (0 h) and 24 h after. SD: Standard deviation of three independent measurements.
| Lipid | System | Hydrodynamic diameter ± SD (nm) | PDI ± SD | Zeta potential ± SD (mV) | |||
|---|---|---|---|---|---|---|---|
| 0 h | 24 h | 0 h | 24 h | 0 h | 24 h | ||
| DPPC | Liposomes | 186 ± 14 | 165 ± 25 | 0.28 ± 0.01 | 0.30 ± 0.05 | −13.2 ± 0.2 | −13.6 ± 0.8 |
| PMLs with AuNPs_MUA | 195 ± 7 | 203 ± 10 | 0.27 ± 0.04 | 0.29 ± 0.08 | 31.1 ± 0.8 | 30.8 ± 0.4 | |
| PMLs with AuNPs_ODT | 261 ± 10 | 302 ± 55 | 0.279 ± 0.007 | 0.248 ± 0.03 | 28.1 ± 0.8 | 31.2 ± 0.3 | |
| Egg-PC | Liposomes | 132 ± 11 | 140 ± 21 | 0.24 ± 0.03 | 0.27 ± 0.01 | −27 ± 2 | −28 ± 1 |
| PMLs with AuNPs_MUA | 207 ± 18 | 215 ± 10 | 0.27 ± 0.04 | 0.26 ± 0.02 | −12.6 ± 0.5 | −8.7 ± 0.6 | |
| PMLs with AuNPs_ODT | 337 ± 32 | 334 ± 7 | 0.28 ± 0.04 | 0.26 ± 0.02 | −16.5 ± 0.4 | −14.9 ± 0.2 | |
Table 4.
bLf encapsulation efficiency (EE%) values in Egg-PC PMLs, for three independent measurements, and the respective mean with standard deviation (SD). Systems were prepared with Egg-PC concentration of 1 mM and bLf 0.243 mM.
Table 4.
bLf encapsulation efficiency (EE%) values in Egg-PC PMLs, for three independent measurements, and the respective mean with standard deviation (SD). Systems were prepared with Egg-PC concentration of 1 mM and bLf 0.243 mM.
| Assay | EE (%) | Mean ± SD (%) |
|---|---|---|
| I | 94.7 | |
| II | 95.4 | 95.6 ± 1.0 |
| III | 96.6 |
Table 5.
Parameters of Weibull and first-order kinetic models fitted to the bLf release data (in Tris-HCl buffer and YEPD medium) in the first 24 h and respective coefficient of determination (R2).
Table 5.
Parameters of Weibull and first-order kinetic models fitted to the bLf release data (in Tris-HCl buffer and YEPD medium) in the first 24 h and respective coefficient of determination (R2).
| Weibull | First-order | ||||
|---|---|---|---|---|---|
| a | b | R2 | k (min-1) | R2 | |
| Tris-HCl buffer | 0.396 | 0.695 | 0.999 | 0.505 | 0.987 |
| YEPD medium | 0.511 | 0.757 | 0.999 | 0.417 | 0.984 |
Disclaimer/Publisher’s Note: The statements, opinions and data contained in all publications are solely those of the individual author(s) and contributor(s) and not of MDPI and/or the editor(s). MDPI and/or the editor(s) disclaim responsibility for any injury to people or property resulting from any ideas, methods, instructions or products referred to in the content. |
© 2023 by the authors. Licensee MDPI, Basel, Switzerland. This article is an open access article distributed under the terms and conditions of the Creative Commons Attribution (CC BY) license (http://creativecommons.org/licenses/by/4.0/).
Copyright: This open access article is published under a Creative Commons CC BY 4.0 license, which permit the free download, distribution, and reuse, provided that the author and preprint are cited in any reuse.


