
Submitted:
28 November 2025
Posted:
28 November 2025
You are already at the latest version
Abstract
Over the past 18 months, we have performed hundreds of temperature characterizations of fiber Bragg gratings inscribed in different germanium-doped silica glass fibers. Under the experimental conditions, the main conclusions, are: the temperature dependence of the “temperature gauge factor” or the normalized temperature sensitivity, KT, was found to be quadratic in the −¬¬50–200 ºC range while it may be considered linear for the −20–100 ºC range; KT values at 20 ºC varies from 5.176 x 10⁻⁶ K-1, for a B/Ge co-doped fiber up to 6.724 x 10⁻⁶ K-1, for a highly Ge-doped fiber; KT does not depend on the hydrogen-loading process or the gratings coupling strength; KT is essentially independent on wavelength in the 1500–1600 nm range being its value accurately determined with a relative error ~ 0.2%; gratings produced by femtosecond-laser radiation and UV-laser radiation exhibit comparable values of KT. The previous achievements allows, by having knowledge of KT for a single grating, the accurate determination of the temperature dependence of the Bragg wave-length for any other grating inscribed in the same fiber; the presented methodology enables one to determine the “unknown” gratings temperature sensitivity, typically, with an error of 0.01 pm/ºC, being, therefore, very useful in research labs and computer simulations; thus, expressions for the temperature dependence of KT for gratings inscribed in several fibers are given. We have also fully analyzed the potential sources of error in KT determination.
Keywords:
Fiber Bragg gratings
; temperature sensitivity
1. Introduction
For more than three decades, temperature sensing is being, probably, the most well-known application of fiber Bragg gratings (FBG) [1]. Independently of the physical parameter under measurement, temperature discrimination is required [2-7]. In this context, a precise determination of temperature is an essential task and, therefore, an accurate knowledge of the FBG temperature sensitivity is on demand [8]. In comparison to the number of publications related to FBG theory, applications and simulations, only few acknowledge the fact that the Bragg wavelength shifts nonlinearly with temperature, even for a limited temperature range, such as 120 °C, and that the thermo-optic coefficient of silica-doped glass fibers depends on temperature and wavelength [8-11]. Recently [11], preliminary results pointed toward the independence on wavelength of the “temperature gauge factor” KT=(1/λ)(dλ/dT) [12] or the normalized temperature sensitivity, in the 1500–1600 nm range. However, we recognize that definite conclusions require higher stability, accuracy and resolution of the equipment used. Therefore, in this paper we compare the normalized temperature sensitivity of fs-FBG and UV-FBG, we discuss the potential effect of the hydrogen-loading process and of the initial grating coupling strength on KT values. We demonstrate that KT is, essentially, independent on wavelength in the 1500–1600 nm wavelength range. Based on the previous results, we also demonstrate that the temperature dependence of the Bragg wavelength of a second FBG can be predicted through integration of the KT expression obtained previously for a former FBG. A thorough discussion on the experimental errors that can affect the determination of the FBG temperature sensitivity is also presented. The KT expressions for FBG inscribed in silica fibers with distinct concentrations of GeO2 are also given.
2. Gratings Fabrication
The UV-FBGs were inscribed in six different fibers: Corning SMF-28 (NA=0.14) and SMF-28e+ (NA=0.14), Leoni SMF with an Ormocer coating (NA=0.14, MFD=8.8±0.5), FiberCore SM1500 (a high GeO2-dopant concentration having NA: 0.19-0.21 and 0.29-0.31), and FiberCore PS1250/1500 (a B/Ge co-doped fiber having NA: 0.12-0.14). Gratings were made by scanning a UV laser (244 nm, laser beam cross section= 0.9*0.9 mm2) over the fibers through a phase mask Ibsen Photonics® (period = 1063.50 nm and length = 10 mm), as depicted in Figure 1. Different grating strengths were achieved by changing several parameters. For the specific gratings produced (PS1250/1500 and SM1500 fibers) the laser power has been in the range 10 mW to 70 mW, the beam scanning speed in the range 0.01685 mm/s to 1.348 mm/s. Gratings in the PS 1250/1500 fiber and grating of 33% reflectivity (R) in the SM1500 fiber were made without focusing lens. Gratings with R=12%, 2.8% and 0.7% in SM1500 fiber (NA: 0.29-0.31) were made with divergent cylindric lens (intensity in the fiber decreased by a factor of 10), and the phase mask period was 1056.50 nm (Table 1). Note that the choice of the phase mask period, Λ, was such that the Bragg wavelength (λB = neffΛ, being neff the effective refractive index) would be in the 1500-1600 nm range.
3. Gratings Thermal Characterization
The temperature characterization was performed using a Dry block-temperature calibrator from Sika, model type TP17200S, allowing measurements between −55 °C and 200 °C with 0.01 °C resolution and an accuracy of 0.2 °C. Gratings were mounted inside the insert blocks keeping them stress-free. Bragg wavelengths were measured, after ~1h stabilization, using an optical interrogator FS22SI BraggMeter ST (with 8 channels), with an acquisition rate of 1 sample/s, which enables resolution/stability better than 0.5 pm/1 pm. The temperature range was from −20 °C up to 100 °C (cycle: 30 °C up to 90 °C, followed by 100 °C down to −20°C, and finally −10 up to 30°C, all in steps of 20°C). At each temperature step, the Bragg wavelength was determined by averaging 2500 data points and the standard deviation was lower than 0.7 pm, with a typical value of 0.4 pm. A quadratic fitting was applied to the temperature dependence of the Bragg wavelength and it was observed that KT shifted linearly with temperature. Similarly, gratings inscribed in the SMF-28 fiber were submitted to four heating cycles from −50 °C up to 200 °C. A cubic fitting was applied to the temperature dependence of the Bragg wavelength and KT shifted quadratically with temperature. Figure 2 shows the temperature dependence of the Bragg wavelength for both temperature cycles. The comparison between the fitting of KT is presented in Figure 3, where it can be observed that a divergence occurs as one approaches the limits of the temperature interval [−20, 100] °C. This divergence can be explained by the fact that, at room temperature, KT=((1/neff)(dneff/dT) + SiO2) (the normalized hermos-optic coefficient and the thermal expansion coefficient, respectively) is essentially determined by the temperature behavior of the hermos-optic coefficient (dneff/dT), a cubic temperature dependence [8,9,13,14]. The calibrations were repeated with all fiber gratings in Table 1 and results are summarized in Table 2. It can be observed that KT increases with the fiber GeO2 content, being lower for the B/Ge fiber. The absolute values of KT for the SMF-28 fiber and Leoni SMF with an Ormocer coating differs from the ones previously measured [11]. Therefore, we performed a reanalysis of those experiments and results will be discussed in the next section. The possible effect of the hydrogen-loading process or the grating coupling strength (reflectivity) on KT values was studied using gratings in the SMF-28e+ fiber. The results have shown that up to a reflectivity of 15% there is no impact on the determination of the normalized temperature sensitivity. Similar results were obtained for the other fibers, namely, a grating induced in the PS1500 (NA=0.29) fiber with a reflectivity as high as 33% was tested and gratings inscribed in a batch of the Leoni SMF with an Ormocer coating, having reflectivity ranging from 1% up to a saturated level, were also used.
4. Error Analysis Related to FBG Thermal Characterization
This section besides the scientific content, also intends to be a pedagogical one in an era of unprecedent exponential increase of “insufficient mature” published data. The initial thermal characterizations were performed using a customized oven as described in [15] (although with shorter dimensions) and the thermal bath described in [11]. However, both heating apparatuses exhibited errors in the absolute temperature measurements. We realized that a 5 pm difference (or equivalently a temperature difference of 0.5 °C) on each temperature step led, after fitting the temperature dependence of the Bragg wavelength, to values of KT at room temperature (20 °C) that were expected for 29.4 °C, being clearly not sufficient for the precision required [8]. Therefore, all further characterizations were performed using the calibrated Dry block described in the previous section and using this new setup (Dry block + interrogator), we have investigated the potential source of errors in the determination of the temperature dependence of the Bragg wavelength, for which hundreds (above 750) of independent temperature measurements were performed over the last 18 months.
The potential effect of using different optical interrogators (comparison with a FS22SI with 4 channels) was analyzed. We have tested 3 FBG (λB~1543 nm) inscribed in the SM1500 (NA_0.19) and other 3 FBG (λB~1541 nm) induced in the Leoni SMF fiber (with an Ormocer coating). Three heating cycles were performed in the temperature interval: − 20-100 °C, using the 8 channels unit and 4 more for the 4 channels unit in a total of 34 tests. All KT values at 20 °C were in the interval ±0.004 K-1, therefore, both interrogators register the same values of Bragg wavelengths and, consequently, leading to the same KT values. We have identified another source of error related to a temperature gradient inside the calibration inserts (15.0 cm long) containing the FBG, which was estimated to be ~0.3 °C/cm outside the homogeneous temperature region. For that we have inserted gratings at different depths (5 to 15 cm) and we have also used an array with five 4.5 mm-gratings separated by ~10 mm. The Sika manual states that the homogeneous temperature zone is limited to 4.0 cm, therefore, the FBG should be well inside that region at the bottom of the insert. Since the temperature stability is very important to obtain good measurements, for each temperature step we analyzed the standard deviation, that typically was better than 0.4 pm, and we calculated the average of the resonance wavelength, typically using 2500 data points. When we close the cycle returning to the initial temperature we also checked the resonance wavelength, the difference should be lower than 1 pm. Sometimes the device loses stability, probably associated to condensation, which is observed in Figure 4 (b)-(d) (wavelength vs time) and that also impacts the values obtained for KT. It should be stressed that we have tried to minimize the occurrence of condensation inside the Dry block by increasing the temperature above 100 °C in the first step before decreasing to 30 °C, but the improvement is not always clear and neither uniform for all channels. The frequency of instability events seems to be associated to changes in temperature and humidity in the lab room along the year. As an example, it was difficult to reach stable values of temperature at −50 °C during summer and, therefore, we limited measurements down to −40 °C.
When the above sources of error are controlled, we still have to deal with the curve fitting. A thorough study on the measurements repeatability was performed by using three gratings inscribed in the SMF-28 fiber. Four heating cycles (−20-100 °C) followed by another four heating cycles (−50-200 °C) were performed. Recently (6 months interval), five heating cycles (−40-200 °C) were also performed to compare reproducibility (measurements were limited to −40 °C, as mentioned above). For the former a 2nd order polynomial fitting was applied to the temperature dependence of the Bragg wavelength while a wider temperature range demands for a higher polynomial fitting (Figure 2). As can be observed in Figure 3 and Figure 5, the normalized temperature sensitivity value is slightly lower for the latter. Nevertheless, a similar value is obtained when restricted to the same temperature range. It should be mentioned that KT values at 20 °C do not differ by more than 0.01 in each temperature range, totalizing 39 independent measurements. We have also analyzed the influence of decreasing the temperature step, by performing three tests between −40 °C and 100 °C such that when merged with previous tests results in temperature steps of about 2.5 °C. The KT values are similar to the ones obtained in previous tests (Linear 2 in Figure 5). In general, gratings in other fibers show similar behavior.
The last source of error, and one of the most important, is the homogeneity of the fiber itself, that is, the uniform distribution of the germanium concentration along the fiber core. As mentioned previously, we found values for fs-FBG ranging from 6.175 x 10⁻⁶ K-1 up to 6.224 x 10⁻⁶ K-1., and from 6.153 x 10⁻⁶ K-1 up to 6.213 x 10⁻⁶ K-1 for UV-FBG. The lack of uniformity was pointed out in the past during the fabrication of mechanically-induced gratings in the SMF-28 fiber [16] and arc-induced gratings in the B/Ge co-doped fiber [17]. In this work, we have used the Leoni SMF fiber as a reference since we had commercially available fs-FBG on it and therefore, we could make comparisons between FBG produced under different fabrication techniques and parameters, such as, reflectivity. Initially we attributed the differences to the fs inscription, but after comparison of UV-FBG produced in the SMF-28 fiber and in the Leoni SMF fiber using different setups ([11] and current work) we notice that while the ones inscribed in the SMF-28 fiber show similar values of KT, the same did not happen for FBG induced in the Leoni SMF fiber. Moreover, recently we have inscribed FBG in two new commercially available batches of SM1500 fiber (both NA=0.19 and NA=0.29) and not only the Bragg wavelength is much higher (Δncore = 1.555 x 10⁻³ and 4.390 x 10⁻³, which corresponds to an estimated increase in GeO2 concentration of 1.1 and 3.0 mol%, respectively [8]) but also KT is higher for FBG induced in both fibers: from 6.238 x 10⁻⁶ K-1 to 6.290 x 10⁻⁶ K-1 and from 6.574 x 10⁻⁶ K-1 to 6.724 x 10⁻⁶ K-1, respectively. Therefore, we have used 18 m of the Leoni SMF fiber containing two fs-FBG (~19%; (6.182±0.001) x 10-6 K-1) to inscribe UV-FBG with different reflectivity (<1%, 18.9%, 98.8% and saturated) using both setups and all values of KT fallen in the range: (6.186±0.006) x 10-6 K-1. It should be highlighted that peak detection for the high reflectivity gratings is also a demanding task (and the values of R2 of the fitting are lower for these gratings). Therefore, since we cannot guarantee that there is uniform distribution of germanium in the core of the 18 m of the Leoni SMF fiber, under the experimental conditions, we may conclude that KT is similar for fs-FBG and UV-FBG and that the coupling strength has negligible influence on the determination of KT. For the sake of illustration, and since we do not know the fiber parameters in order to determine germanium concentration, we present KT as a function of neff in Figure 6. We have also included the KT value (KT=1.4178x10⁻⁸ T+ 6.1299x10⁻⁶ K-1; 6.413x10⁻⁶ K-1 @20 °C) obtained using three gratings (λB~1540, 1547 and 1554 nm) inscribed in another high Ge-doped fiber (j-fiber SMF: NA=0.26 and MFD=5.5±0.4). It is clearly shown that KT increases with the increase of GeO2 concentration and decreases with B2O3 concentration.
5. Prediction of the Temperature Dependence of the Bragg Wavelength
Assuming that we know K(T) for one UV-FBG and λ(T0) for a second FBG inscribed in the same fiber, we can determine λ(T) for the latter, through integration of K(T) and by applying a 3rd order Taylor expansion to the exponential function. Thus,
or
and therefore,
and
where Ki (i=0, 1, 2) are coefficients. For the [−20, 100] temperature range, a linear behavior is adequate and therefore, K2=0. We demonstrate the applicability by using five gratings written in the SM1500 (NA_0.19) fiber with a reflectivity of about 0.5%. Table 3 summarizes the average values of KT at 20 °C for four tests in the [−40, 200] temperature range, limited to the [−20, 100] °C and also three tests in the [−20, 97.5] °C, in steps of 10 °C but at different temperature plateaus. For each grating, the absolute error of KT is within 0.002 K-1. Therefore, there is a slight dependence of KT on wavelength (in a range that exceeds 50 nm) that was averaged in the subsequent calculations. Thus, by fitting all experimental data, for the former temperature range we obtained KT = −2.1973x10⁻¹¹T2 + 1.6689x10⁻⁸T + 5.9194x10⁻⁶ (R2 = 0.99998), for the second KT = 1.5004x10⁻⁸T + 5.9410x10⁻⁶ (R2 = 0.99986) and for the latter KT = 1.5118x10⁻⁸T + 5.9358x10⁻⁶ (R2 = 0.99985). Table 4 summarizes the results obtained by comparison of the Bragg wavelengths and temperature sensitivity (dλ/dT) values from direct calibration (dλ_dir2/dT and dλ_dir3/dT, for quadratic and cubic fitting, respectively) and by following Eq (1)-(4) where we have assumed KT through the fitting of all experimental data of the five FBG (λ_int2 and dλ_dint2/dT, for quadratic fitting and λ_int3 and dλ_dint3/dT, for cubic fitting). In each temperature range, the difference in wavelength is lower than 3 pm and the calculated temperature sensitivity differs by ~0.01 pm/°C. It should be noted that the differences in the temperature sensitivity near the limits of the temperature range (0.1 pm/°C) is essentially due to the dependence of KT on temperature (goes from quadratic to cubic dependence for larger temperature interval), despite its also slight dependence on wavelength for the five FBG inscribed in this fiber with high GeO2 dopant concentration (as observed in Table 3 and with impact on the fitting: R2 = 0.99986). Concerning the [−20, 97.5] °C temperature range, the values of KT at 20 °C have lower dispersion (Table 3) and similar results were obtained when applying the method to estimate the wavelength and temperature sensitivity of the “unknown” grating.
A similar analysis was performed using five gratings inscribed in the SMF-28 fiber and KT was calculated in the − 20–100 °C temperature range. Table 5 summarizes the average values of dλ/dT and KT for four independent measurements. Note that the dependence of the temperature sensitivity on wavelength is well expressed in Eq. (4). All results are within 6.165 ± 0.004 K-1, being more stable than the ones obtained for the previous gratings inscribed in the SM1500 fiber. Table 6 shows the results of considering the methodology by using KT = 1.4236 x 10⁻⁸T + 5.8831 x 10⁻⁶ (R2 = 0.9999999) for the FBG at 1509.2 nm and by applying it to the FBG at 1561.6 nm. The largest difference, 2.4 pm, occurs at −20 °C but the sensitivity is always within 0.01 pm/°C. Similar results would be obtained if we have used for KT, the average of all measurements (KT = 1.4310 x 10⁻⁸T + 5.8786 x 10⁻⁶; R2 = 0.99994). It should be stressed that we analyzed the independence on wavelength using gratings inscribed in other fibers and results were even more constant, within 0.001, although for shorter wavelength ranges: SM1500_NA=0.29 (2 FBG; 10 nm), j-fiber SMF (3 FBG; 14 nm), Leoni SMF (5 gratings; 27 nm).
Figure 7 shows the wavelength dependence of ‘KT‘ for four silica glasses and KT for five FBG inscribed in the SMF-28 Corning fiber and in the SM1500 fiber (NA=0.19). As can be observed, the wavelength dependence of KT is negligible for the FBG in the SMF-28 fiber (and also resembles the ‘KT‘ behavior of the Corning glass). On the other hand, KT seems to have a slight dependence on wavelength for FBG in the SM1500 fiber.
5. Conclusions
We have shown that the temperature dependence of the normalized temperature sensitivity, KT, was found to be quadratic in the − 50–200 °C range while it is linear for the −20–100 °C range. KT values at 20 °C range from 5.176 x 10⁻⁶ K-1, for a B/Ge co-doped fiber up to 6.724 x 10⁻⁶ K-1, for a highly Ge-doped fiber. We have demonstrated that KT does not depend on the hydrogen-loading process, neither on the gratings coupling strength and that is independent on wavelength in the 1500–1600 nm range. Furthermore, gratings produced by femtosecond-laser radiation and UV-laser radiation exhibit comparable values of KT. The KT expressions for FBG inscribed in silica fibers with distinct concentrations of GeO2 was given. A discussion of the potential sources of error on KT determination was presented. We have introduced a methodology that allows the accurate determination of the temperature dependence of the Bragg wavelength of any grating, as far as one has knowledge of KT for a single grating inscribed in the same fiber. This methodology is very useful in research labs and computer simulations.
Author Contributions
Conceptualization, methodology and data analysis, G.M.R.; experimental work, J.L.C., M.C., F.M.A., J.P., R.O., R.N., M.P., P.C.; writing—review and editing, G.M.R., J.L.C., and R.O. All authors have read and agreed to the published version of the manuscript.
Funding
This work was financed by national funds through the Portuguese funding agency, FCT – Fundação para a Ciência e a Tecnologia, I.P., under the support of INESC TEC through FCT within project: 10.54499/UID/50014/2025 and supported by The Applied Digital Transformation Laboratory (ADiT-LAB), through FCT within project: 10.54499/UIDP/06121/2025. This work is also funded by FCT – Fundação para a Ciência e a Tecnologia, I.P., and, when eligible, co-funded by EU funds under project/support UID/50008/2025 – Instituto de Telecomunicações, with DOI identifier https://doi.org/10.54499/UID/50008/2025. R. Oliveira acknowledges the FCT contract CEECIND2021.01066 with DOI identifier 10.54499/2021.01066.CEECIND/CP1653/CT0004. J. L. Cruz acknowledges the grant through project PROMETEO:CIPROM/2022/30, funded by the Generalitat Valenciana, Spain.
Institutional Review Board Statement
Not applicable.
Informed Consent Statement
Not applicable.
Data Availability Statement
The data segments can be obtained by contacting the corresponding author.
Acknowledgments
Not applicable.
Conflicts of Interest
The authors declare no conflicts of interest.
References
- Meltz, G.; Morey, W.W.; Glenn, W.H. Formation of Bragg gratings in optical fibers by a transverse holographic method. Optics Letters, 1989, 14, 823–825. [Google Scholar] [CrossRef] [PubMed]
- Hill, K.O.; Meltz, G. Fiber Bragg grating technology fundamentals and overview. Journal of Lightwave Technology, 1997, 15, 1263–1276. [Google Scholar] [CrossRef]
- Kersey, A.D.; et al. Fiber grating sensors. Journal of Lightwave Technology, 1997, 15, 1442–1463. [Google Scholar] [CrossRef]
- Hill, K.O.; et al. Bragg gratings fabricated in monomode photosensitive optical fiber by UV exposure through a phase mask. Applied Physics Letters, 1993, 62, 1035–1037. [Google Scholar] [CrossRef]
- Yun-Jiang, R. In-fibre Bragg grating sensors. Measurement Science and Technology, 1997, 8, 355. [Google Scholar]
- Xu, M.G.; et al. Discrimination between strain and temperature effects using dual-wavelength fibre grating sensors. Electronics Letters, 1994, 30, 1085–1087. [Google Scholar] [CrossRef]
- Sahota, J.K.; Gupta, N.; Dhawan, D. Fiber Bragg grating sensors for monitoring of physical parameters: a comprehensive review. Optical Engineering, 2020, 59, 060901. [Google Scholar] [CrossRef]
- Iadicicco, A.; et al. Self temperature referenced refractive index sensor by non-uniform thinned fiber Bragg gratings. Sensors and Actuators B: Chemical, 2006, 120, 231–237. [Google Scholar] [CrossRef]
- Lobry, M.; et al. Plasmonic Fiber Grating Biosensors Demodulated Through Spectral Envelopes Intersection. Journal of Lightwave Technology, 2021, 39, 7288–7295. [Google Scholar] [CrossRef]
- Feng, D.; et al. High-Precision Temperature-Compensated Magnetic Field Sensor Based on Optoelectronic Oscillator. Journal of Lightwave Technology, 2021, 39, 2559–2564. [Google Scholar] [CrossRef]
- Zhao, Y.; Liao, Y. Discrimination methods and demodulation techniques for fiber Bragg grating sensors. Optics and Lasers in Engineering, 2004, 41, 1–18. [Google Scholar] [CrossRef]
- Kinet, D.; et al. Fiber Bragg Grating Sensors toward Structural Health Monitoring in Composite Materials: Challenges and Solutions. Sensors, 2014, 14, 7394–7419. [Google Scholar] [CrossRef] [PubMed]
- Rego, G.M. Temperature Dependence of the Thermo-Optic Coefficient of GeO2-Doped Silica Glass Fiber. Sensors, 2024, 24. [CrossRef]
- Rego, G. Temperature Dependence of the Thermo-Optic Coefficient of SiO2 Glass. Sensors, 2023, 23. [CrossRef]
- Flockhart, G.M.H.; et al. Quadratic behavior of fiber Bragg grating temperature coefficients. Applied Optics, 2004, 43, 2744–2751. [Google Scholar] [CrossRef] [PubMed]
- João, P.; et al. Normalized temperature sensitivity of fiber Bragg gratings inscribed under different conditions. in Proc.SPIE. 2025.
- Imas, J.J.; et al. Accurate compensation and prediction of the temperature cross-sensitivity of tilted FBG cladding mode resonances. Applied Optics, 2023, 62, E8–E15. [Google Scholar] [CrossRef] [PubMed]
- Wenyuan, W.; et al. Measurements of thermo-optic coefficient of standard single mode fiber in large temperature range. in Proc.SPIE. 2015.
- Tan, C.Z. ; Dependence of the refractive index on density, temperature, and the wavelength of the incident light. 2021, 94, 139.
- Rego, G.M. Arc-induced long-period fibre gratings : fabrication and their applications in optical communications and sensing, in Engineering Faculty. 2006, Porto: Porto University.
- Rego, G.; et al. New technique to mechanically induce long-period fibre gratings. Optics Communications, 2003, 220, 111–118. [Google Scholar] [CrossRef]
- Colaço, C.; et al. Arc-Induced Long-Period Fiber Gratings in the Dispersion Turning Points. Journal of Lightwave Technology, 2016, 34, 4584–4590. [Google Scholar] [CrossRef]
- Leviton, D.B. and B.J. Frey. Temperature-dependent absolute refractive index measurements of synthetic fused silica. in Proceedings of SPIE - The International Society for Optical Engineering. 2006.
- Leviton, D.B., B.J. Frey, and T.J. Madison. Temperature-dependent refractive index of CaF2 and Infrasil 301. in Proceedings of SPIE - The International Society for Optical Engineering. 2007.
- Leviton, D.B., et al. Temperature-dependent refractive index measurements of CaF2, Suprasil 3001, and S-FTM16 for the Euclid near-infrared spectrometer and photometer. in Proceedings of SPIE - The International Society for Optical Engineering. 2015.
- Miller, K.H., M.A. Quijada, and D.B. Leviton. Cryogenic refractive index of Heraeus homosil glass. in Proceedings of SPIE - The International Society for Optical Engineering. 2017.
Figure 1.
Schematic of the fiber Bragg grating recording system based on the phase mask method.
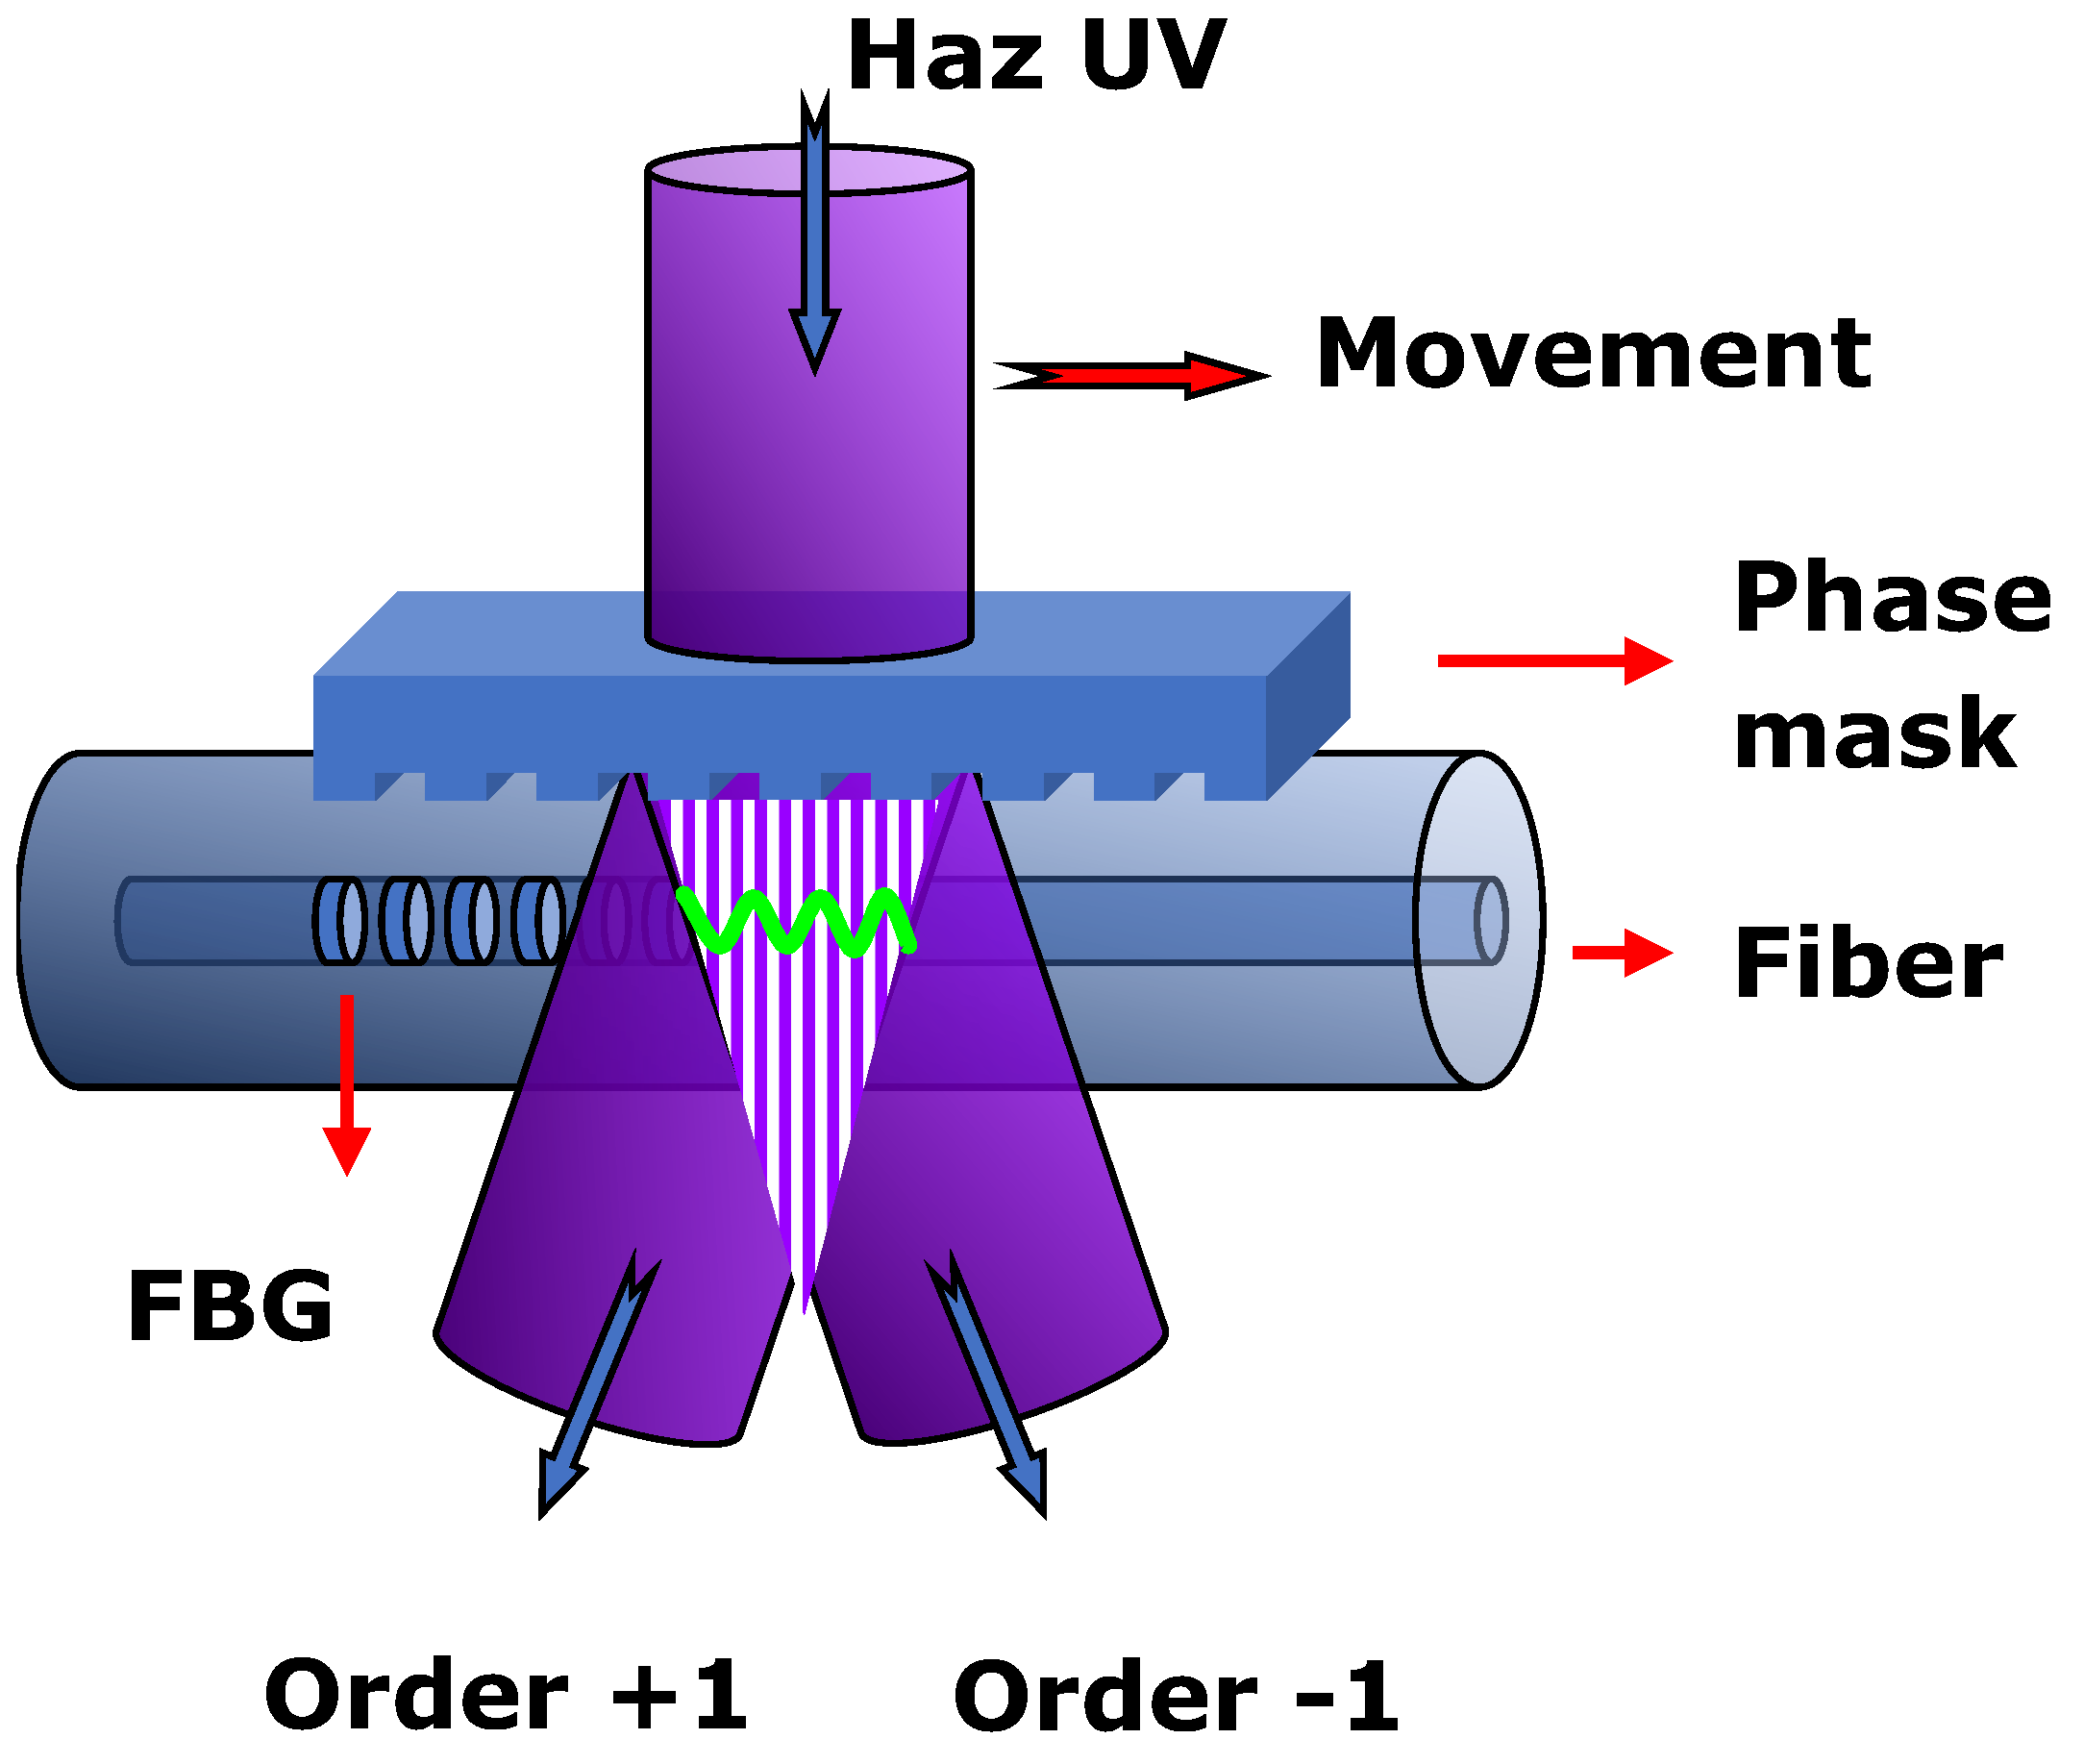
Figure 2.
Bragg wavelength temperature dependence for the three UV-FBGs induced in the SMF-28 fiber: (a) four heating cycles −20-100 °C and (b) four heating cycles −50-200 °C (average values for each FBG).
Figure 2.
Bragg wavelength temperature dependence for the three UV-FBGs induced in the SMF-28 fiber: (a) four heating cycles −20-100 °C and (b) four heating cycles −50-200 °C (average values for each FBG).
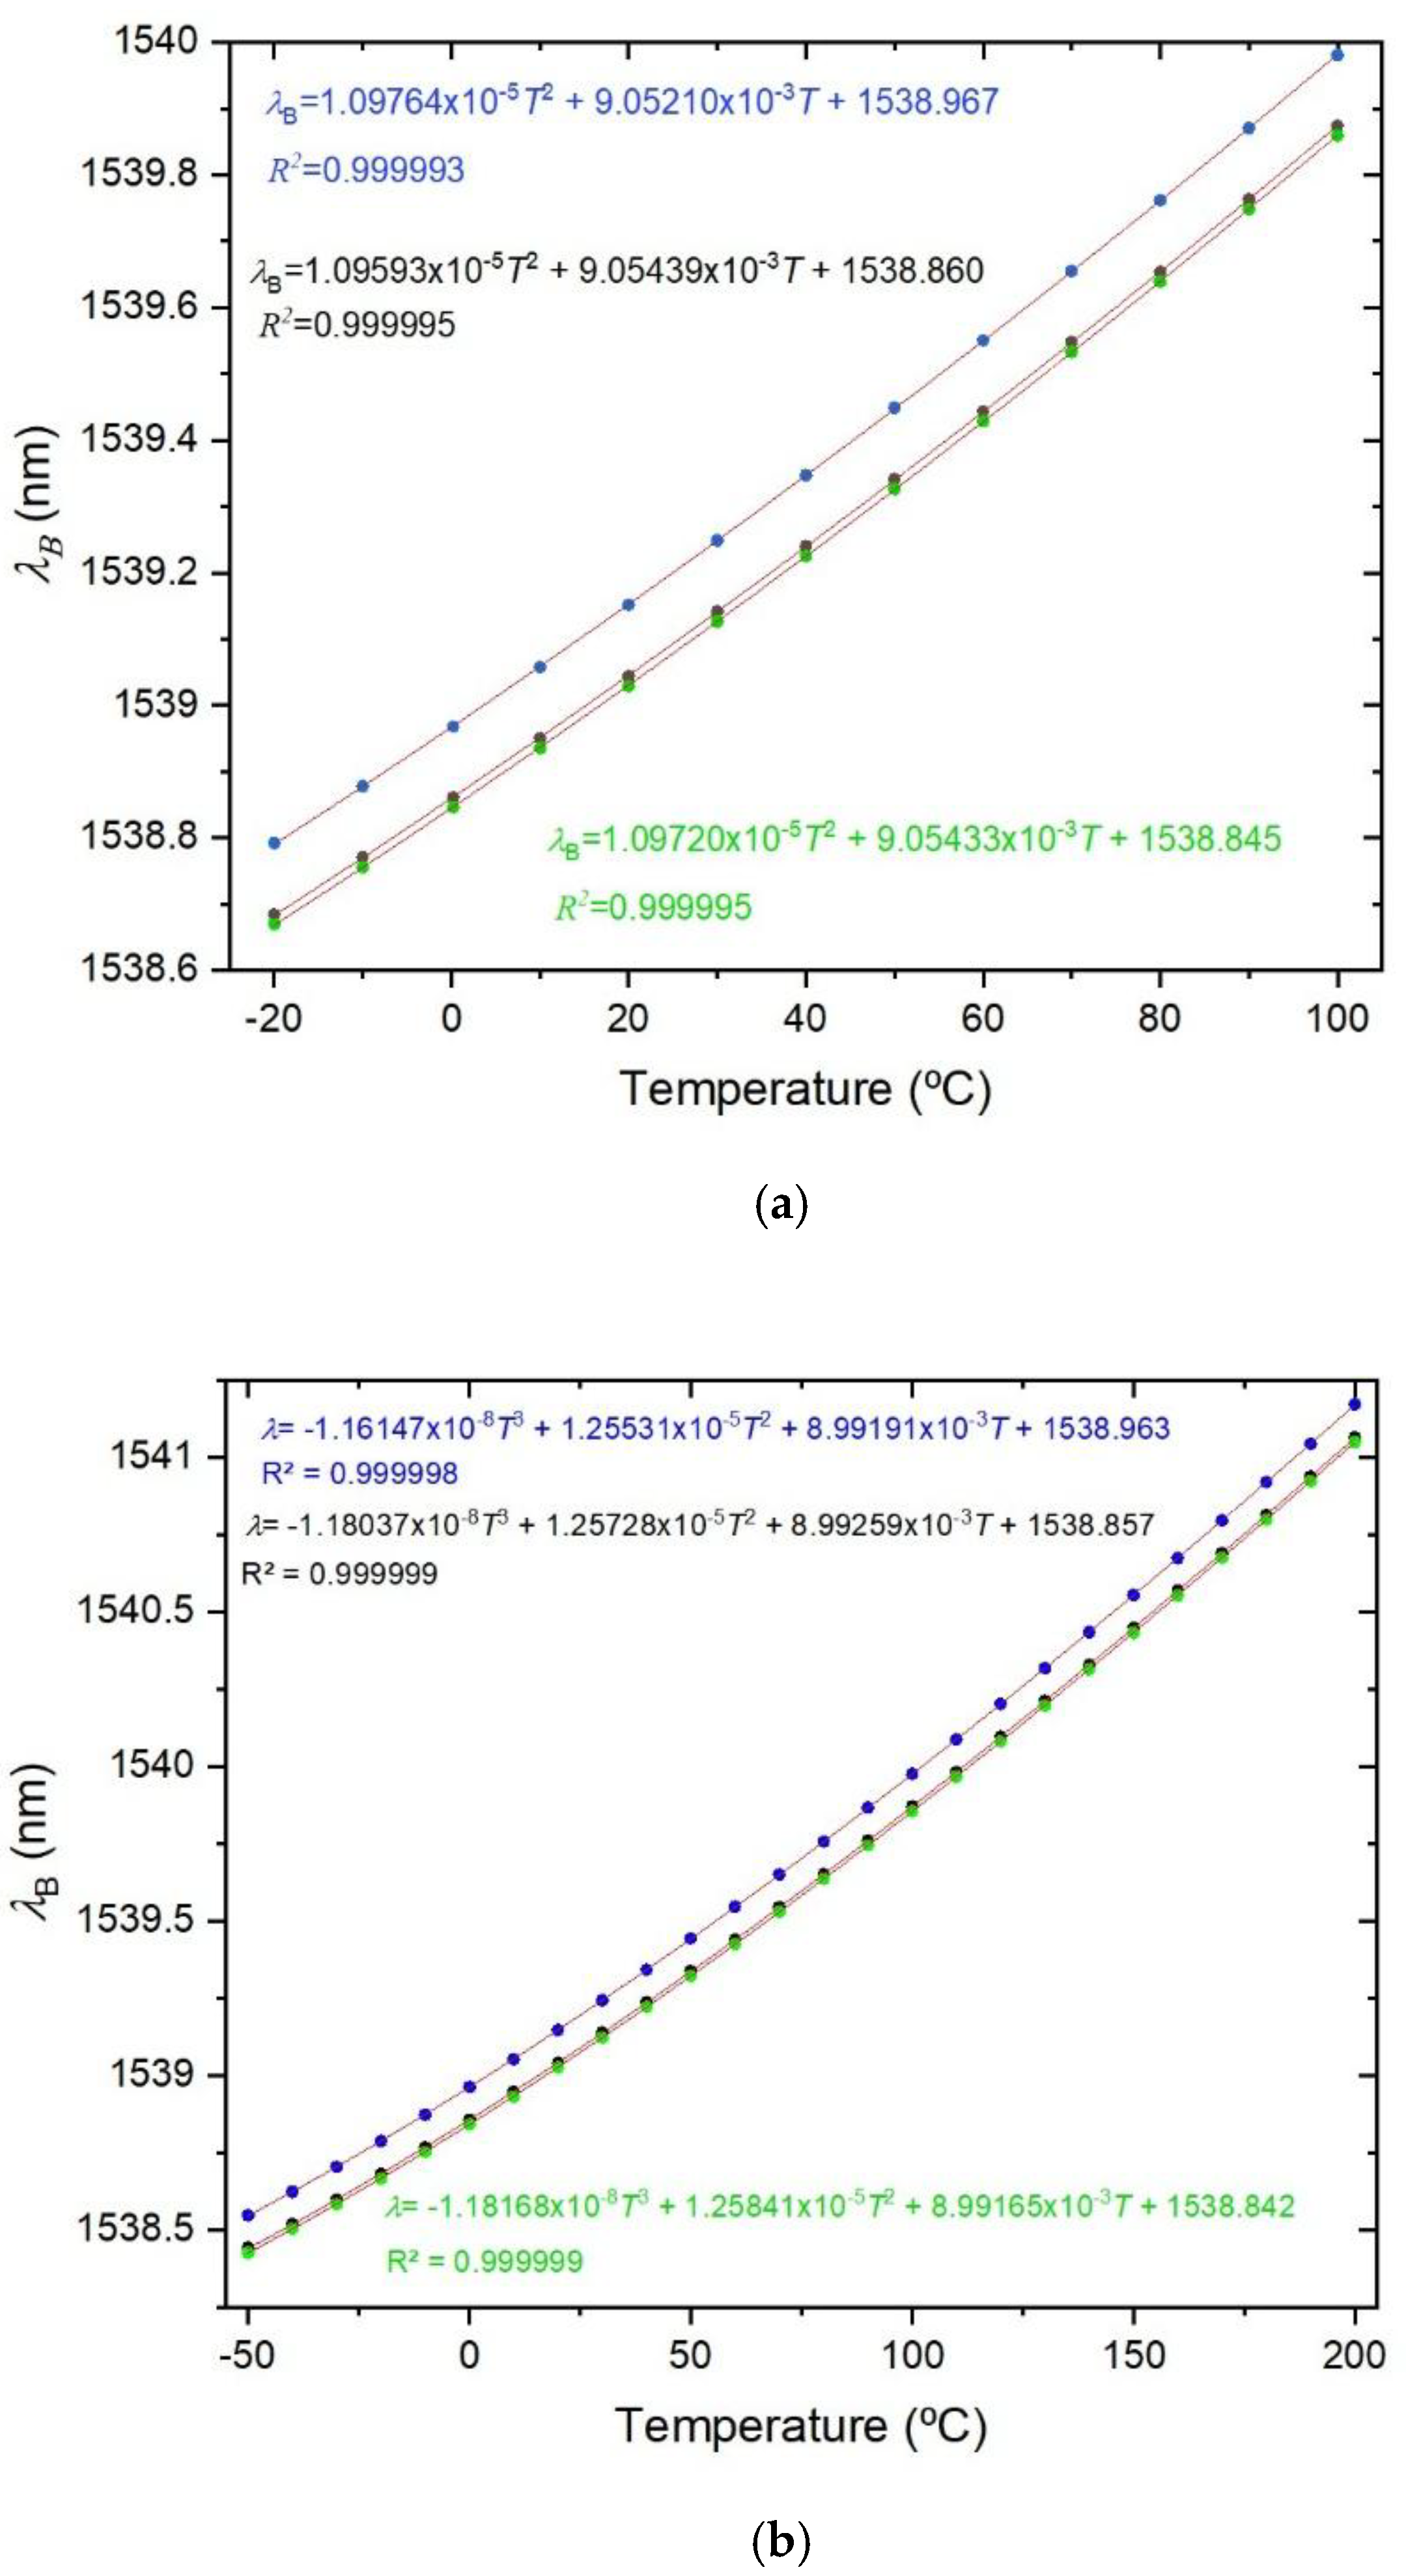
Figure 3.
KT versus temperature (average values) considering the three FBGs for both temperature cycles.
Figure 3.
KT versus temperature (average values) considering the three FBGs for both temperature cycles.
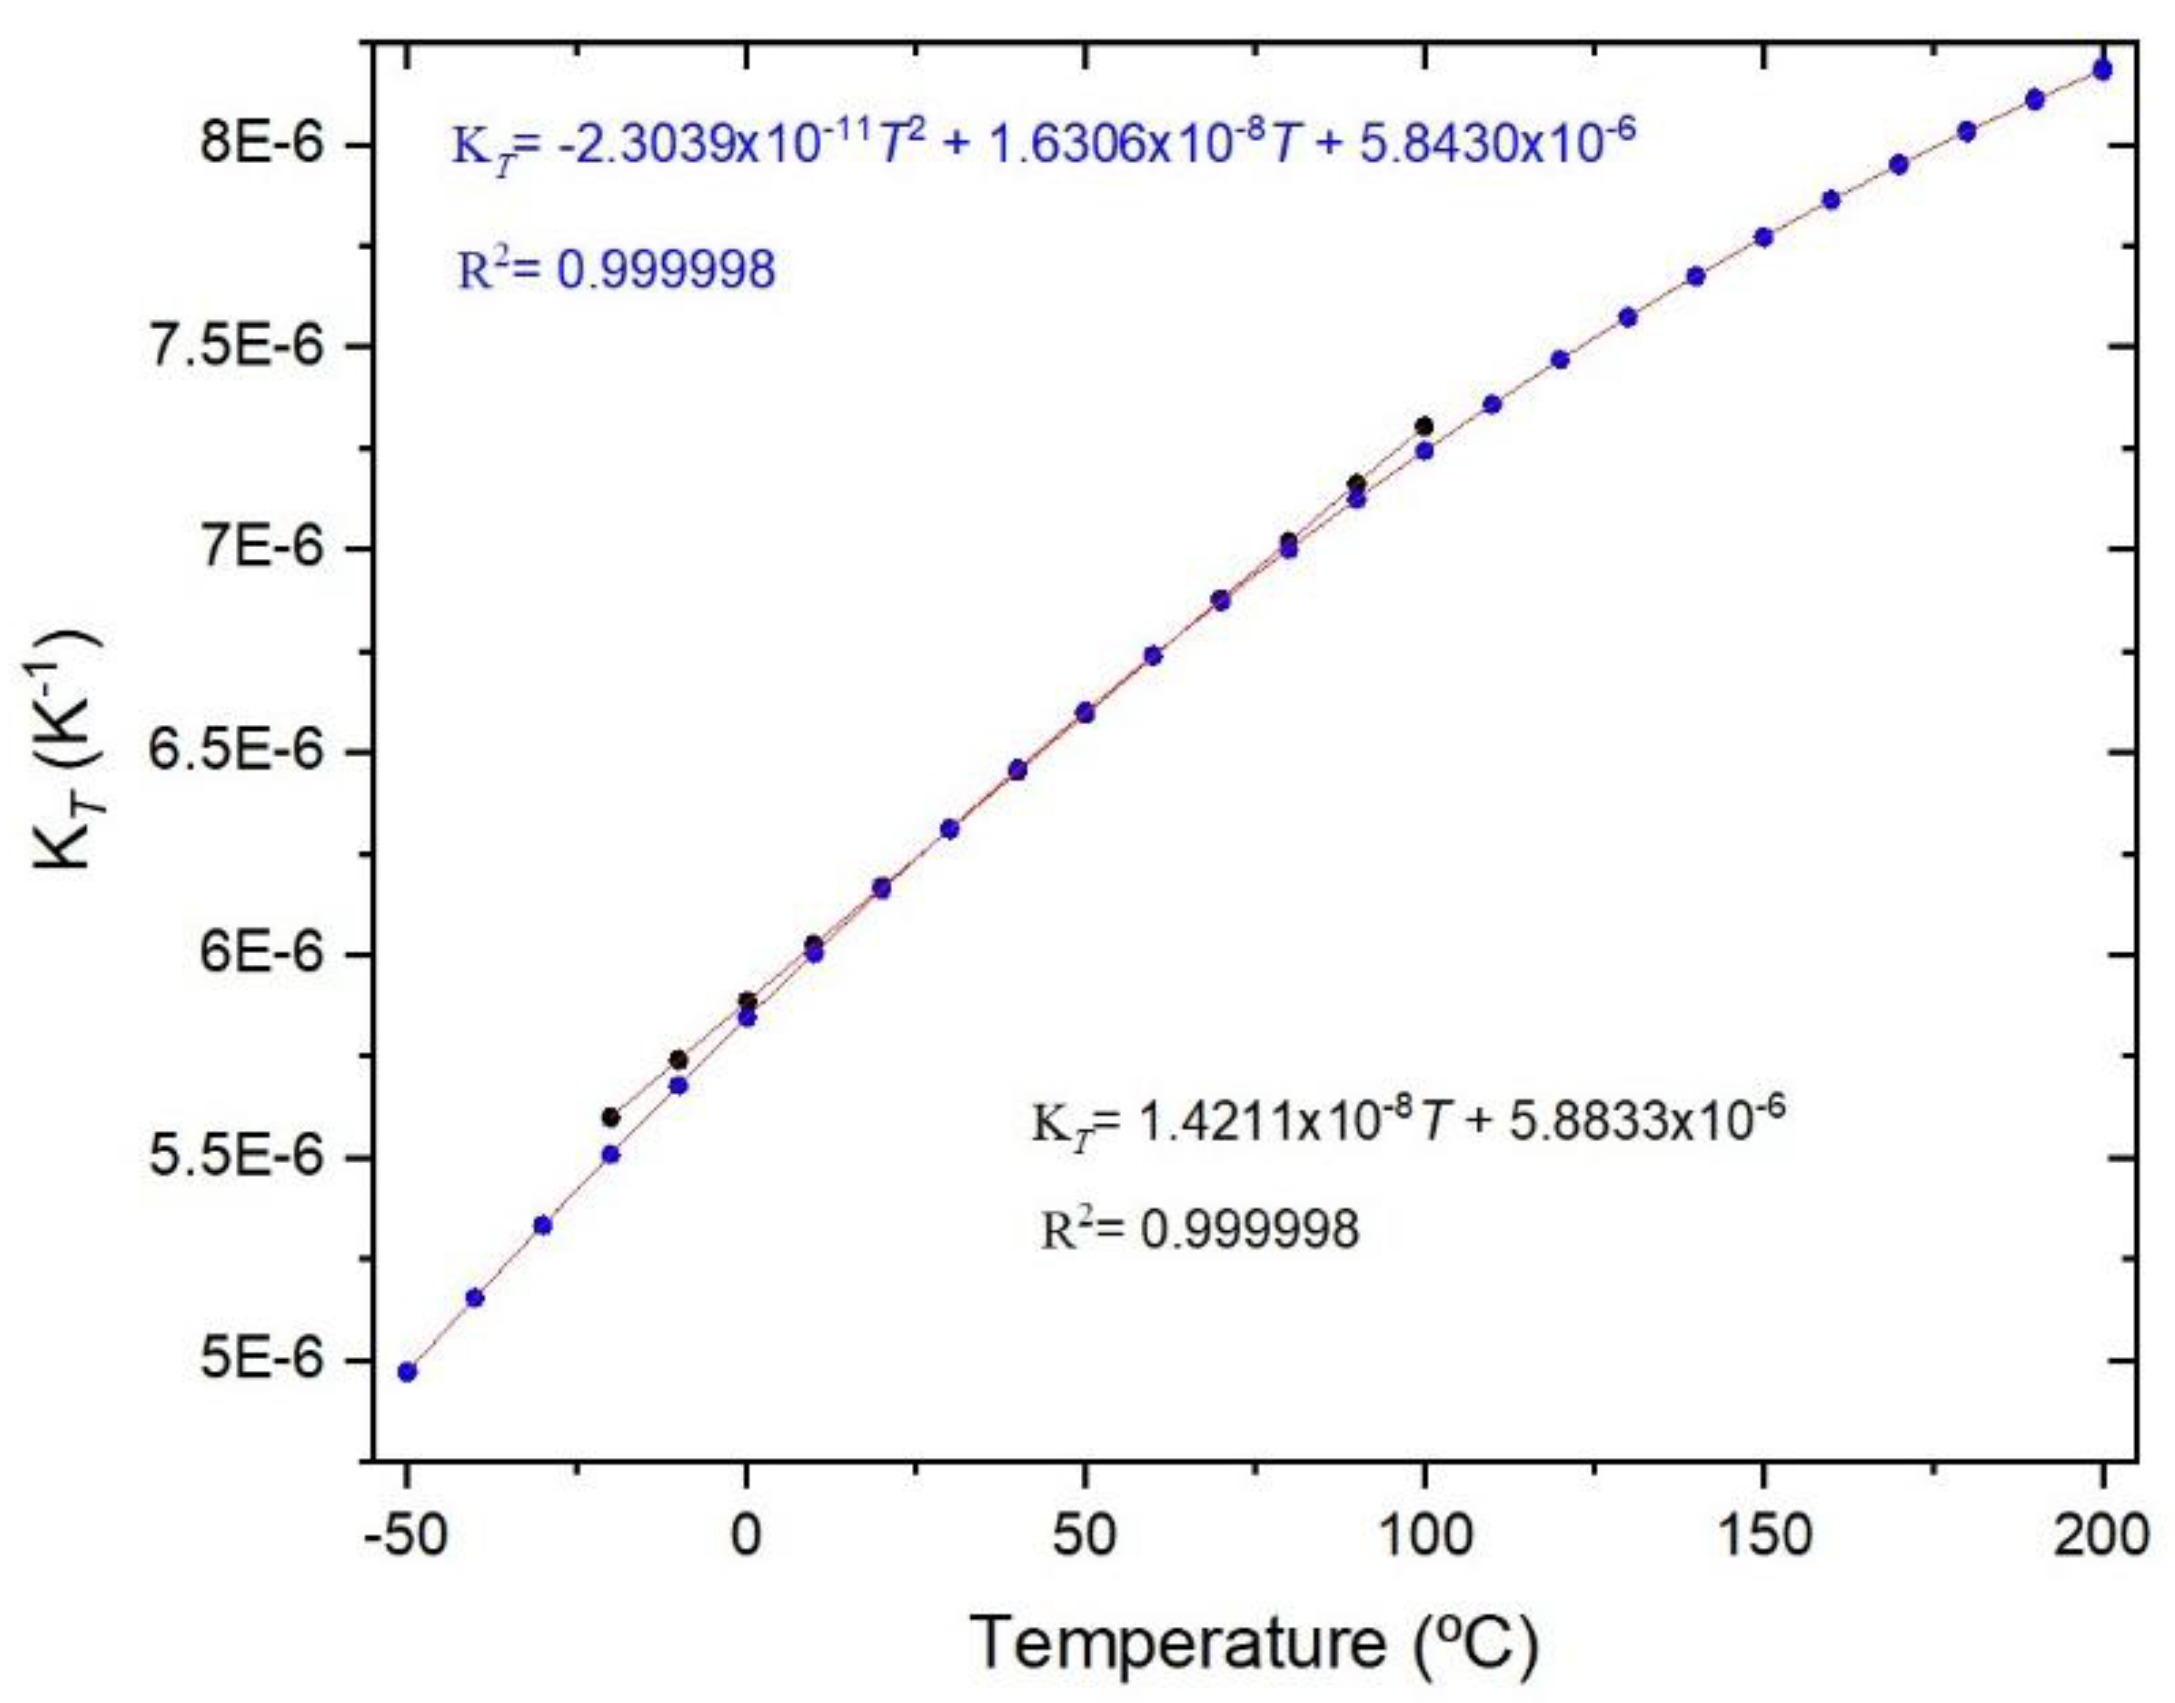
Figure 4.
(a) Stable measurements; (b)-(d) instability in one or more temperature steps (initially checked by the larger values of standard deviation).
Figure 4.
(a) Stable measurements; (b)-(d) instability in one or more temperature steps (initially checked by the larger values of standard deviation).
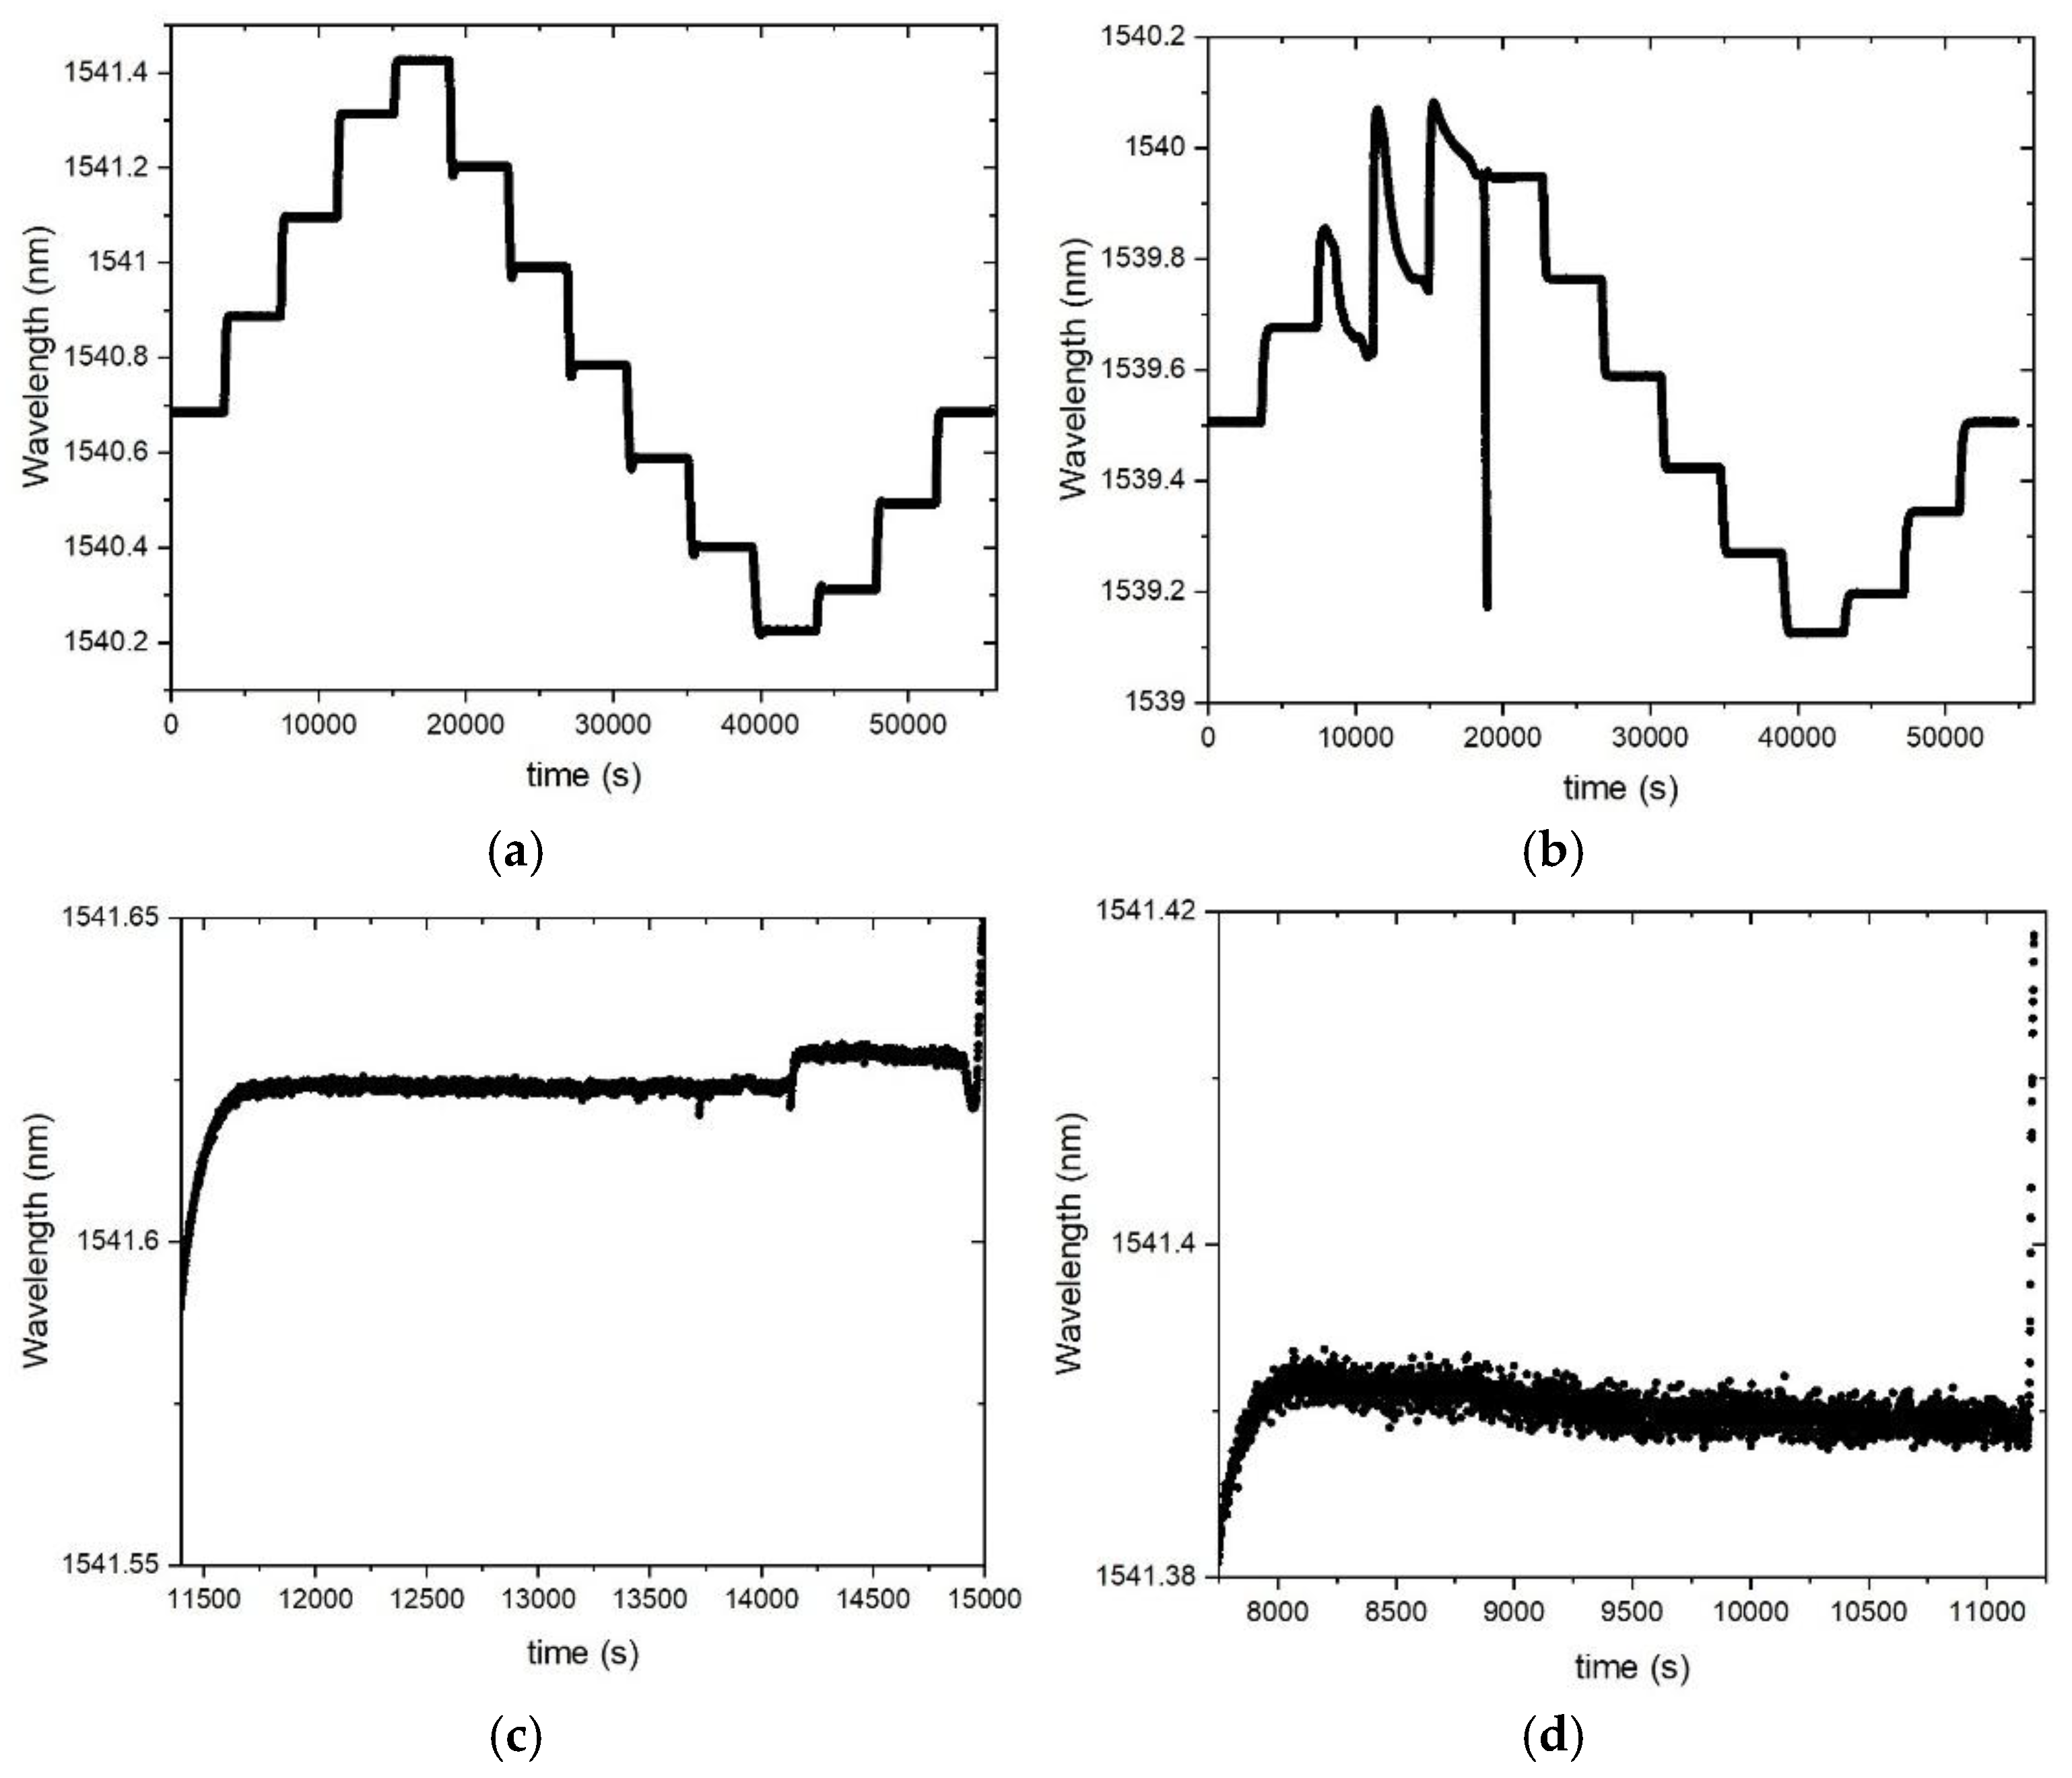
Figure 5.
KT obtained for different temperature ranges and temperature steps.
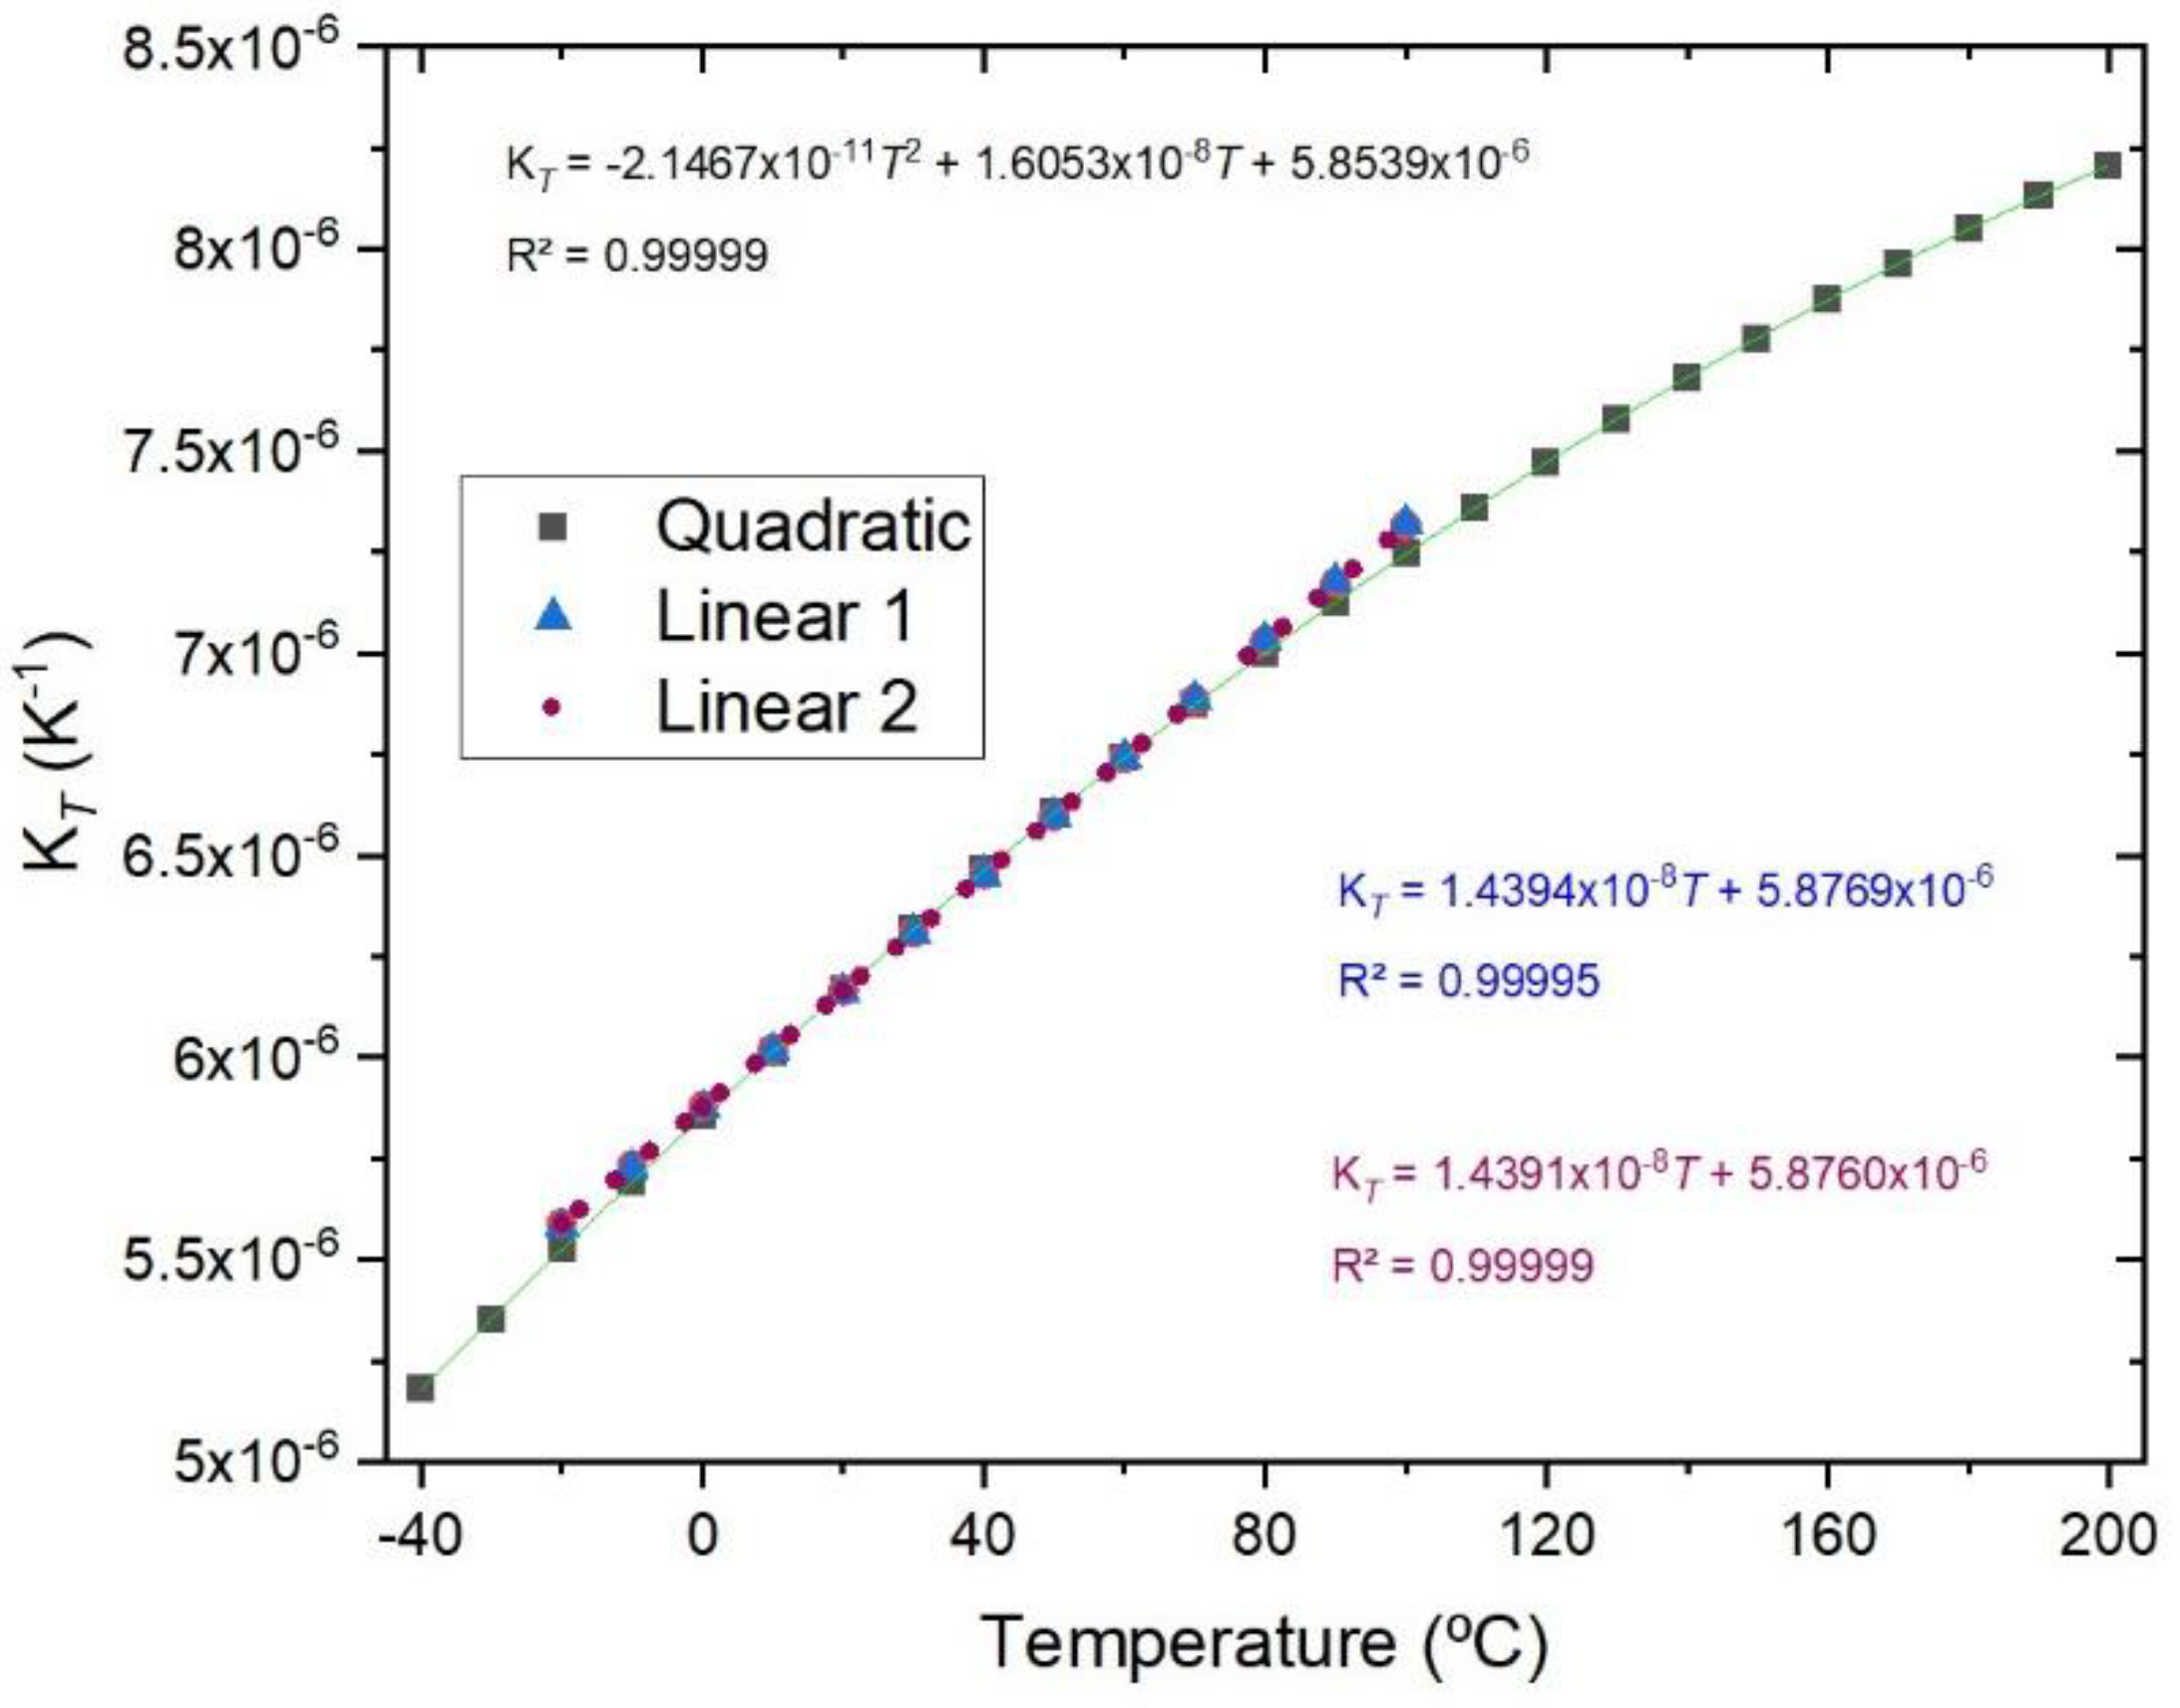
Figure 6.
KT vs neff @20 °C, obtained for various gratings inscribed in fibers with different germanium concentration.
Figure 6.
KT vs neff @20 °C, obtained for various gratings inscribed in fibers with different germanium concentration.
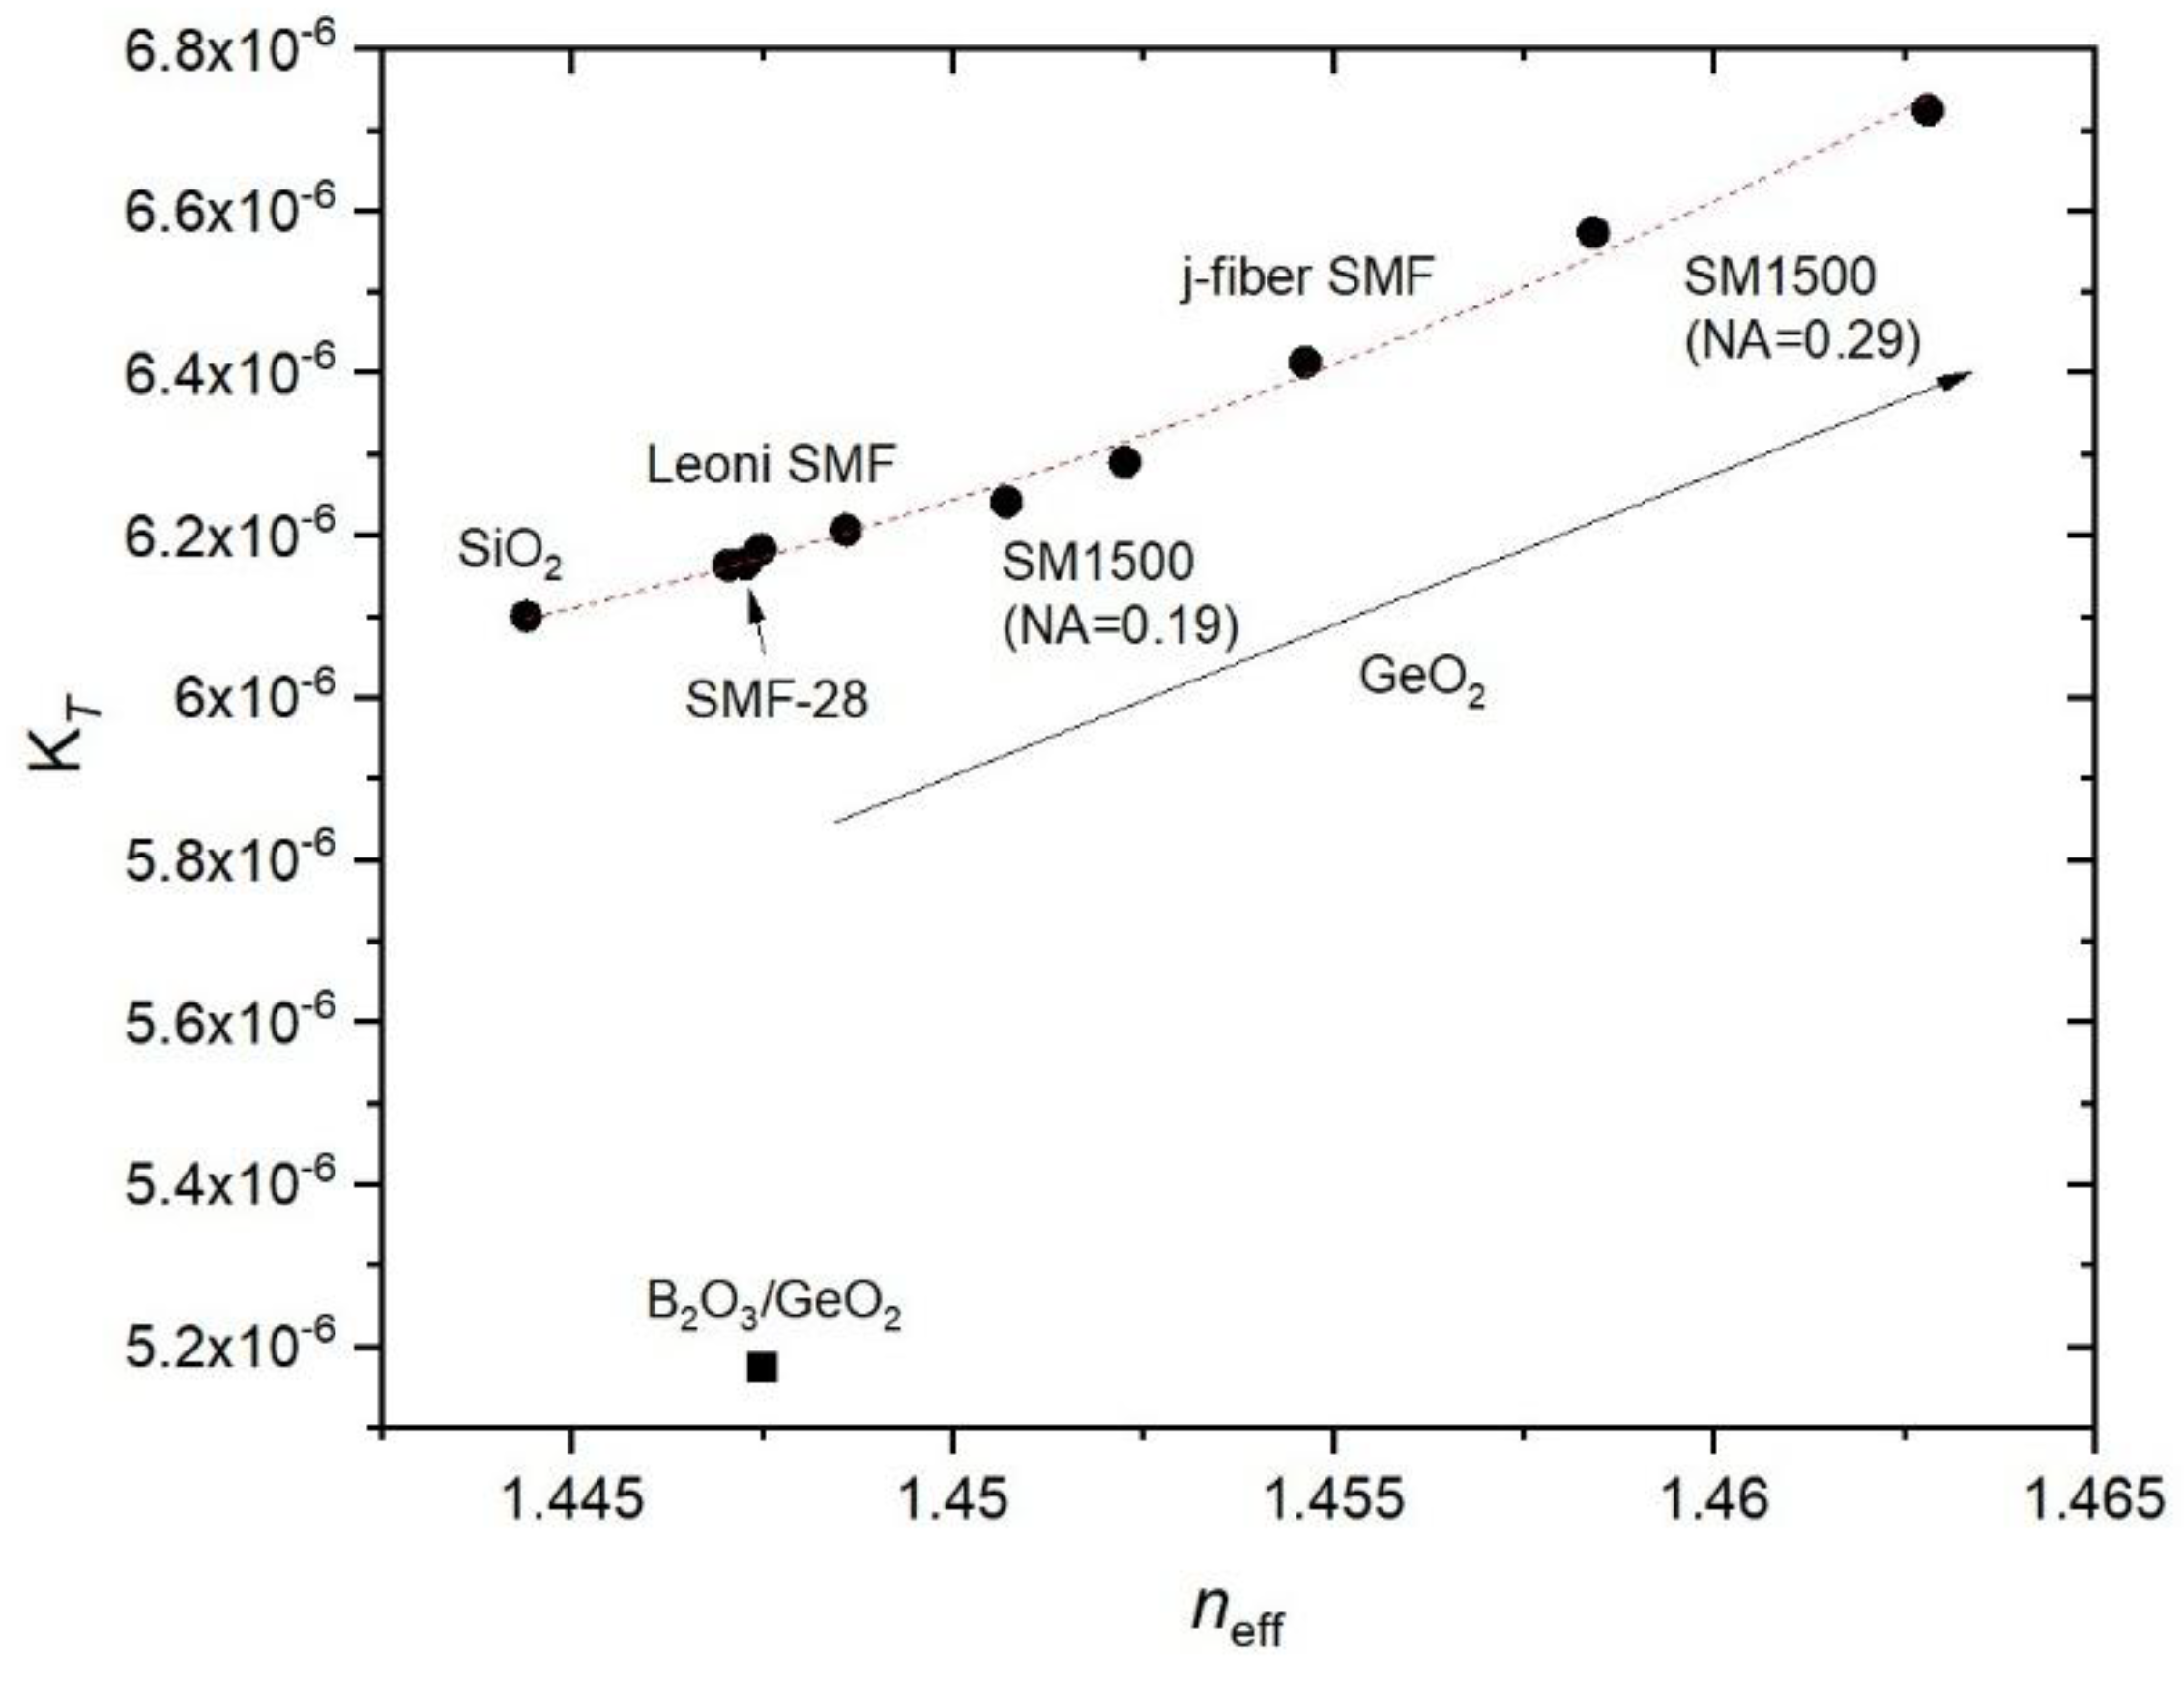
Figure 7.
‘KT’ for four silica glasses [9,18-21] and KT for UV-FBGs inscribed in the SMF-28 Corning fiber and in FiberCore SM1500 fiber (NA=0.19).
Figure 7.
‘KT’ for four silica glasses [9,18-21] and KT for UV-FBGs inscribed in the SMF-28 Corning fiber and in FiberCore SM1500 fiber (NA=0.19).
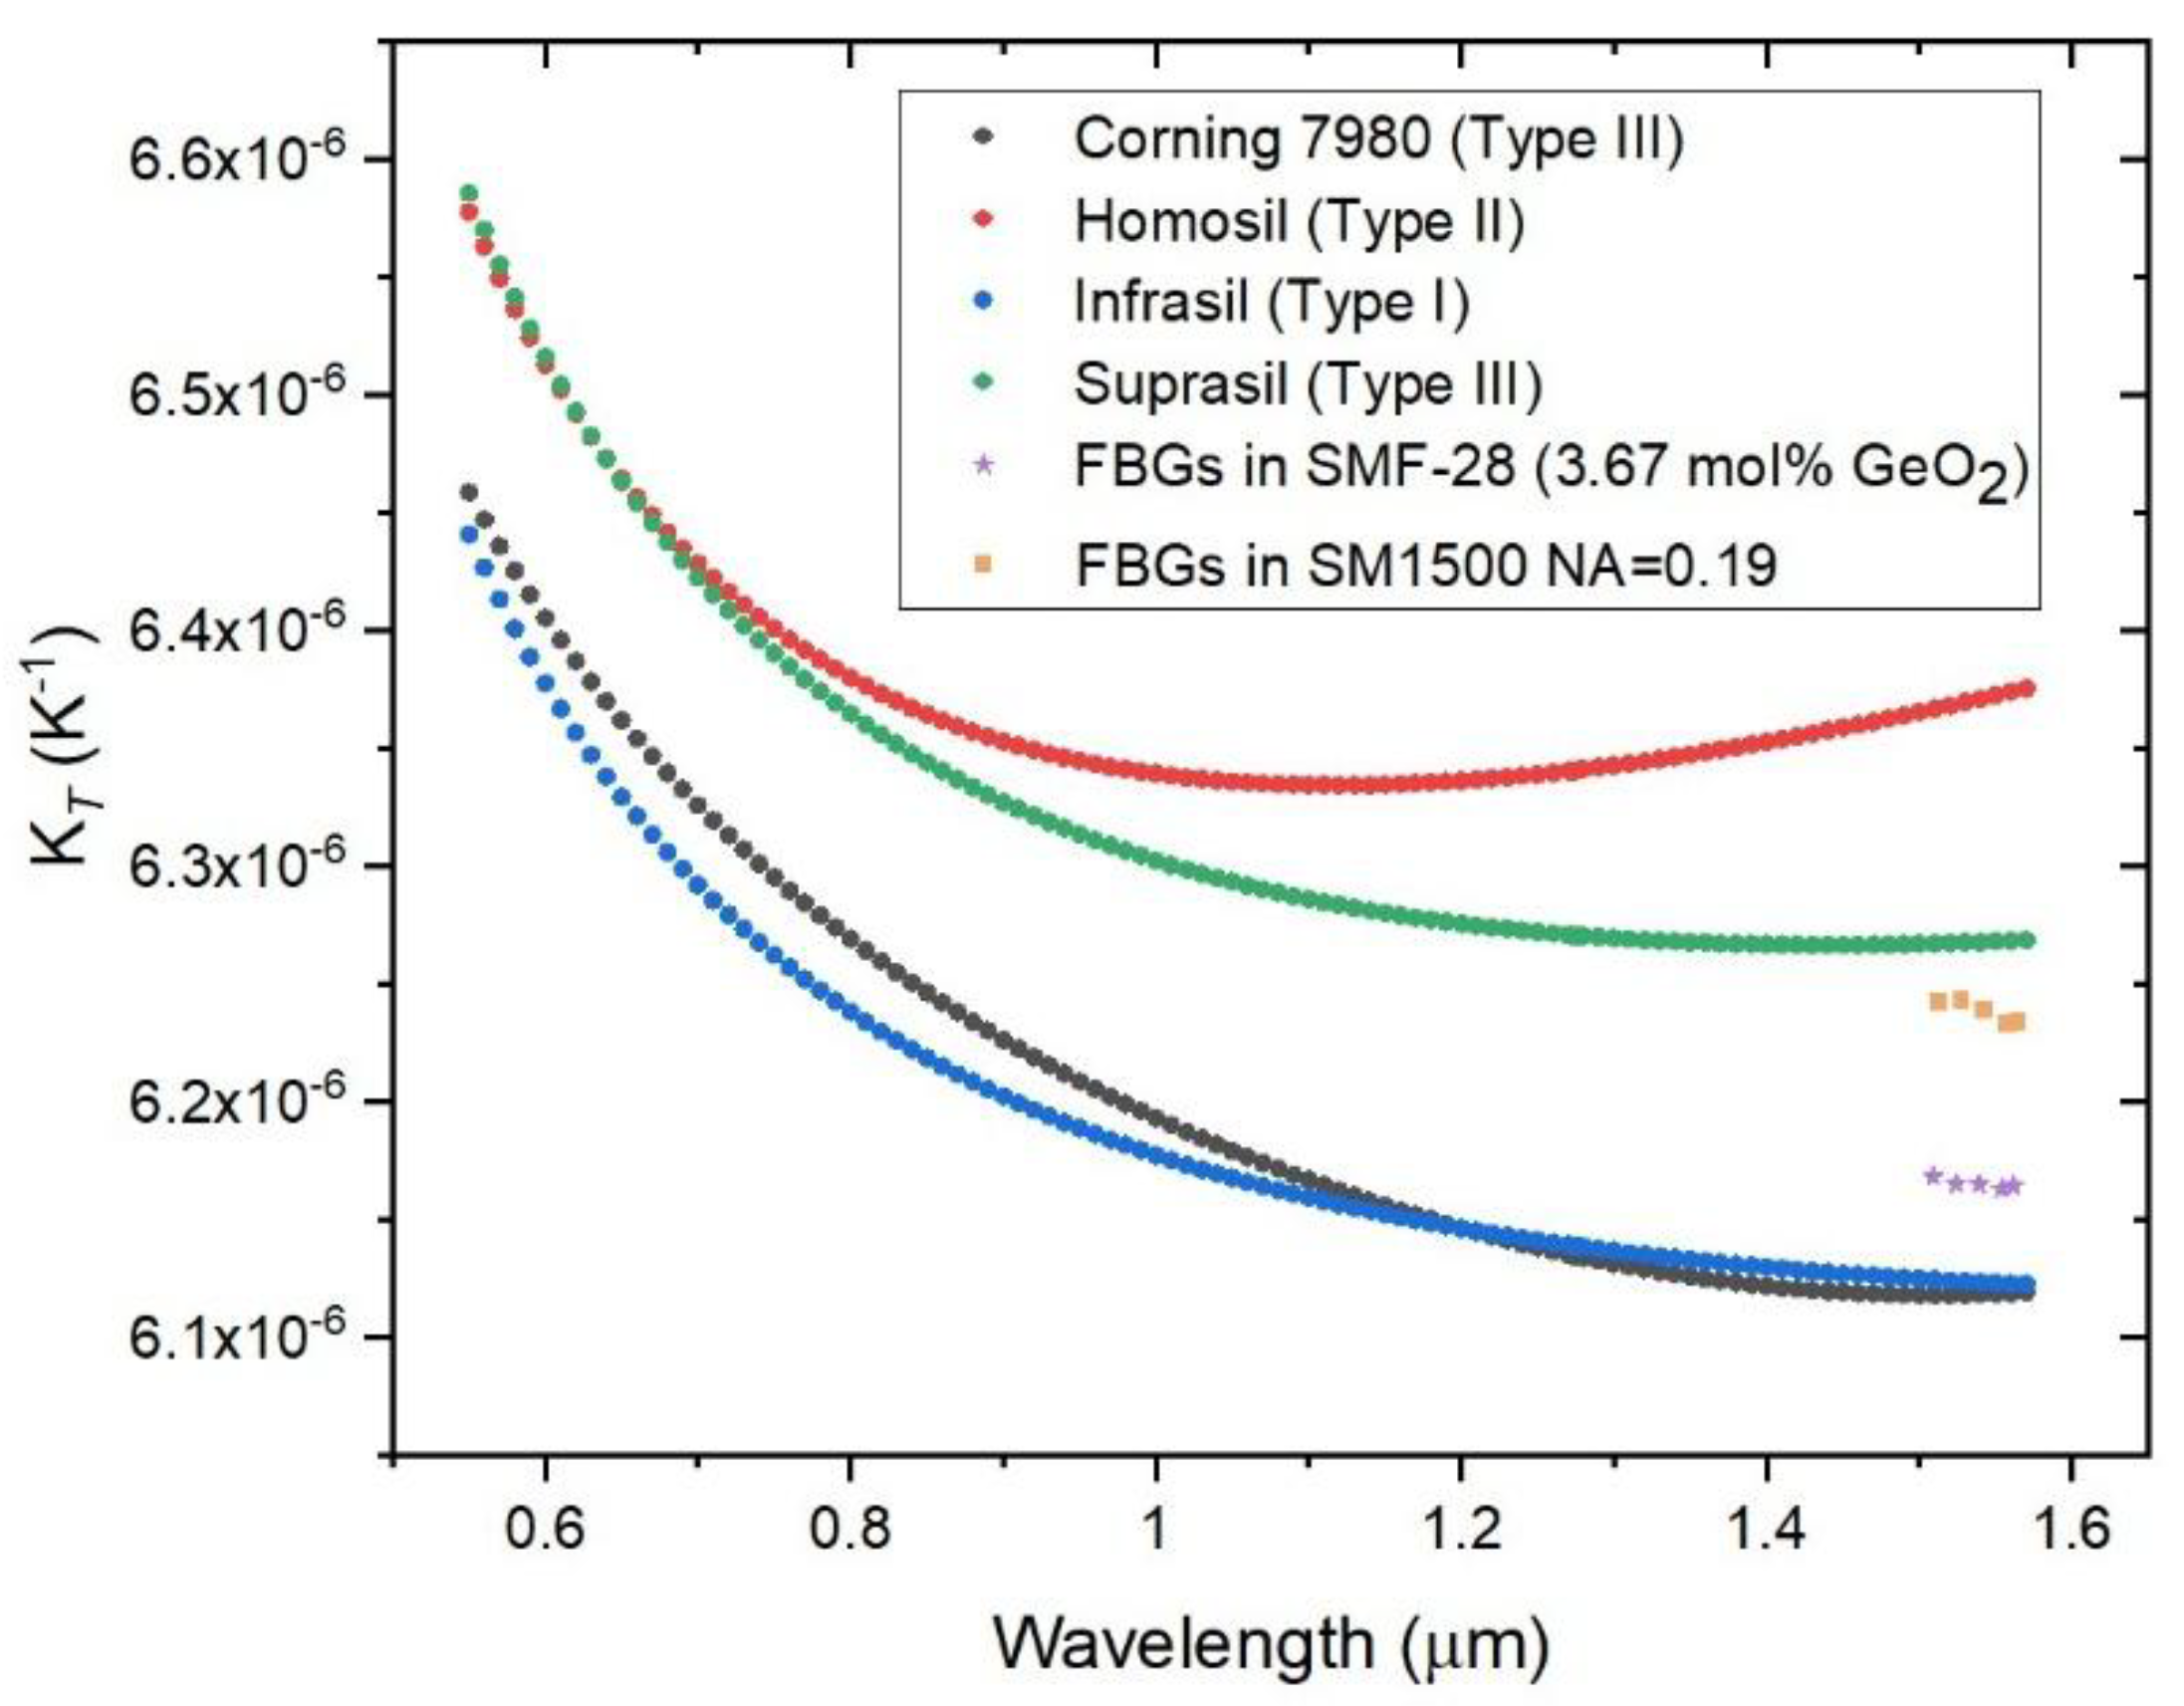

Table 1.
Gratings reflectivity and UV fluence for the gratings inscribed in six different fibers.
| SMF-28e+ pristine |
SMF-28e+ H2 loaded |
SM1500 NA=0.29-0.31 |
PS1250/1500, NA=0.12-0.14 |
||||
| R (%) / E’’ (J/mm2) | R (%) / E’’ (J/mm2) | R (%) / E’’ (J/mm2) | R (%) / E’’ (J/mm2) | ||||
| 7.3 | 48.8 | 15 | 3.30 | 33 | 0.857 | 13 | 2.308 |
| 1.2 | 9.76 | 4 | 1.32 | 12 | 0.429 | 4 | 0.923 |
| 0.36 | 4.62 | 1.3 | 0.264 | 2.8 | 0.00536 | 1.5 | 0.154 |
| 0.07 | 0.923 | 0.095 | 0.0528 | 0.7 | 0.00165 | 0.26 | 0.0264 |
| SMF-28 | Leoni SMF w/Ormocer coating |
SM1500 NA=0.19-0.21 |
|||||
| R (%) / E’’ (J/mm2) | R (%) / E’’ (J/mm2) | R (%) / E’’ (J/mm2) | |||||
| 1.6 | 9.89 | --- | 9.89 | 10 | 0.923 | ||
| 0.46 | 4.94 | --- | 4.94 | 1.0 | 0.0923 | ||
| 0.09 | 0. 989 | --- | 0.989 | 0.51 | 0.00385 | ||
Table 2.
KT expressions for FBG inscribed in different fibers, in the temperature range* [−20, 100] °C.
Table 2.
KT expressions for FBG inscribed in different fibers, in the temperature range* [−20, 100] °C.
| Fiber | KT (K-1) (T is in °C in equations below) | KT@20 °C |
| Fibercore PS1250/1500 NA=0.12-0.14 |
1.5619x10⁻⁸ T+ 4.8636x10⁻⁶ | 5.176x10⁻⁶ |
| Corning SMF-28 *[−50, 200] °C |
−2.3039x10⁻¹¹ T2 + 1.6306x10⁻⁸ T + 5.8430x10⁻⁶ | 6.166x10⁻⁶ |
| Corning SMF-28 limited to [−20, 100] °C |
1.4310x10⁻⁸ T+ 5.8786x10⁻⁶ | 6.165x10⁻⁶ |
| Corning SMF-28e+ NA=0.14 |
1.4348x10⁻⁸ T+ 5.8777x10⁻⁶ | 6.165x10⁻⁶ |
| Leoni SMF w/Ormocer coating NA=0.14, MFD=8.8±0.5 | 1.4524x10⁻⁸ T+ 5.8956x10⁻⁶ | 6.186x 10⁻⁶ |
| Fibercore SM1500 NA=0.19-0.21 |
1.5118x10⁻⁸ T+ 5.9358x10⁻⁶ | 6.238x10⁻⁶ |
| Fibercore SM1500 NA=0.29-0.31 |
1.5890x10⁻⁸ T+ 6.2564x10⁻⁶ | 6.574x10⁻⁶ |
Table 3.
KT values at 20 °C obtained using five FBG induced in the SM1500 (NA_0.19).
|
λΒ (nm) <KT (K-1)> |
1512.7 | 1527.7 | 1542.8 | 1557.7 | 1565.1 |
| [−40, 200] (°C) | 6.248x10⁻⁶ | 6.250x10⁻⁶ | 6.246x10⁻⁶ | 6.239x10⁻⁶ | 6.239x10⁻⁶ |
| [−20, 100]* (°C) | 6.244x10⁻⁶ | 6.249x10⁻⁶ | 6.242x10⁻⁶ | 6.237x10⁻⁶ | 6.235x10⁻⁶ |
| [−20, 97.5] (°C) | 6.242x10⁻⁶ | 6.243x10⁻⁶ | 6.239x10⁻⁶ | 6.233x10⁻⁶ | 6.234x10⁻⁶ |
Table 4.
Calculated Bragg wavelength and temperature sensitivity for the “unknown” grating.
| T (°C) | <λ> (nm) | λ_int2 (nm) | λ_int3 (nm) | dλ_int2/dT (pm/°C) | dλ_dir2/dT(pm/°C) | dλ_int3/dT(pm/°C) | dλ_dir3/dT(pm/°C) |
| −39.94 | 1527.2213 | --------- | 1527.2195 | --------- | --------- | 7.97 | 7.98 |
| −20 | 1527.3844 | 1527.3825 | 1527.3840 | 8.62 | 8.63 | 8.52 | 8.53 |
| 0.1 | 1527.5608 | 1527.5603 | 1527.5605 | 9.08 | 9.09 | 9.05 | 9.05 |
| 20 | 1527.7455 | 1527.7455 | 1527.7455 | 9.54 | 9.55 | 9.54 | 9.55 |
| 100 | 1528.5831 | 1528.5819 | 1528.5806 | 11.37 | 11.38 | 11.27 | 11.27 |
| 200 | 1529.7931 | --------- | 1529.7905 | --------- | --------- | 12.82 | 12.81 |
Table 5.
dλ/dT and KT values at 20 °C obtained using five FBG inscribed in the SMF-28 fiber and Bragg wavelengths fitted in the [−20, 100] °C temperature range.
Table 5.
dλ/dT and KT values at 20 °C obtained using five FBG inscribed in the SMF-28 fiber and Bragg wavelengths fitted in the [−20, 100] °C temperature range.
|
λΒ (nm) |
1509.2 | 1524.2 | 1539.2 | 1554.1 | 1561.6 |
| dλ/dT (pm/°C) | 9.31 | 9.40 | 9.49 | 9.59 | 9.63 |
| KT (K-1) | 6.168x10⁻⁶ | 6.165x10⁻⁶ | 6.165x10⁻⁶ | 6.163x10⁻⁶ | 6.164x10⁻⁶ |
Table 6.
Calculated Bragg wavelength and temperature sensitivity for the “unknown” grating.
| T (°C) | <λ> (nm) | λ_int2 (nm) | dλ_int2/dT (pm/°C) | dλ_dir2/dT(pm/°C) |
| −20 | 1561.2157 | 1561.2133 | 8.74 | 8.74 |
| 0.1 | 1561.3939 | 1561.3934 | 9.19 | 9.18 |
| 20 | 1561.5807 | 1561.5807 | 9.63 | 9.63 |
| 100 | 1562.4223 | 1562.4226 | 11.42 | 11.41 |
Disclaimer/Publisher’s Note: The statements, opinions and data contained in all publications are solely those of the individual author(s) and contributor(s) and not of MDPI and/or the editor(s). MDPI and/or the editor(s) disclaim responsibility for any injury to people or property resulting from any ideas, methods, instructions or products referred to in the content. |
© 2025 by the authors. Licensee MDPI, Basel, Switzerland. This article is an open access article distributed under the terms and conditions of the Creative Commons Attribution (CC BY) license (http://creativecommons.org/licenses/by/4.0/).
Copyright: This open access article is published under a Creative Commons CC BY 4.0 license, which permit the free download, distribution, and reuse, provided that the author and preprint are cited in any reuse.


