
Submitted:
13 December 2025
Posted:
17 December 2025
You are already at the latest version
Abstract
Zachlod et al. 1 analysed satellite data from Malaysian oil palm plantations and concluded that Roundtable Table on Sustainable Palm Oil (RSPO) certification reduces plantation efficiency by lowering canopy coverage. Our reanalysis of 93,987 ha shows that their methods and interpretation are fundamentally flawed, primarily because the study does not account for routine replanting, which caused temporary canopy loss in 32.7% of certified areas between 2018 and 2023. Using validated remote sensing methods and cross-verified timelines, we found no significant decline in oil palm coverage and no evidence of reduced oil palm coverage in certified plantations. Given the risk of policy misinterpretation we call for more rigorous, transparent, and context-aware evaluations of sustainability outcomes in plantation systems.
Keywords:
deforestation
; forest
; oil palm
; replanting
; roundtable on sustainable palm oil
Key Methodological and Conceptual Flaws by Zachlod et al.
The main claim in Zachlod et al. [1]—that RSPO certification results in reduced efficiency of palm oil plantations—is unsound. Firstly, they equate “efficiency” with oil palm canopy coverage (the percentage of plantation area covered by oil palm). Oil palm canopy coverage is not a good proxy for palm oil yield which would ideally be measured in yield per hectare. Palm oil yields can vary by an order of magnitude related to management choices and site conditions [2]. Indeed, lower oil palm coverage can be associated with improved yields [3].
Second, the study by Zachlod et al. [1] does not note or account for replanting. Oil palm is normally replanted every 25 years as yields decline. When older palms are cleared and replaced (Figure S1), the process temporarily reduces canopy cover, which is easily seen in satellite images (Figure S2). These practices are integral to normal oil palm operations [4-6]. Temporary reductions in oil palm coverage are evidence of neither inefficiency nor degradation, but of stand rejuvenation and improvements [5].
Third, the authors generalize from a single-company case study in Malaysia to global RSPO effects. This extrapolation is not supported by their data. Other contexts (e.g., Indonesia, West Africa, Latin America) have very different plantation structures, governance, and market pressures [7,8].
Our concerns add to those raised by Ata and Putra [9], who, like us, believe that methodological shortcomings undermine the conclusions of Zachlod et al.’s study. Next, we re-evaluate Zachlod et al.’s selected sites over a comparable period to see what we can infer. We implement our own land use change classification; and assess the role of replanting in the changes observed.
Our revaluation of the data and analysis by Zachlod et al.
Methods are available in Supplementary Materials.
Study Area
Our remapping of plantation boundaries covers 93,987 ha, consisting of 102 polygons. This is smaller than the 135,683 ha from 144 plantations reported by Zachlod et al. (Table 1 in [1]). Our lower total area results from the exclusion of poorly defined plantation areas in Figure 5 of Zachlod et al. [1], but the difference of ~40,000 ha cannot be attributed to digitizing inaccuracies alone and suggests that Zachlod et al.’s Figure 1 does not display all of their study area (unless the numbers in their Table 1 are erroneous).
Land Tenure
Our findings provide more specific attribution of plantation ownership within the study area. While Zachlod et al. [1] refer to the mills and estates as belonging to the anonymous company “CorpPalm”, our analysis – based on cross-referencing with the Nusantara Atlas and the RSPO’s GeoRSPO platform–reveals that 74 of the 102 digitized polygons are associated with Wilmar International Limited (Wilmar), an RSPO member since 2004. All RSPO members are required to follow the organization’s Principles and Criteria, regarding deforestation, irrespective of the certification status of their individual estates and subsidiaries. This is relevant for attributing efficiency changes to certification. Plantation companies self-select into RSPO, often as part of broader management transitions and commitments.
Land Cover Change Re-Analysis
Zachlod et al. [1] showed in their Figure 4 a plantation that underwent a full replanting cycle between 2018 and 2023. Evidence of the replanting cycle is shown in Figure S2 in this study. They interpreted the observed changes as a decline in efficiency. This interpretation is incorrect, and furthermore, when comparing their classification with satellite images in Figure S2, we find notable inaccuracies (Figure 1).
Comparative Trends
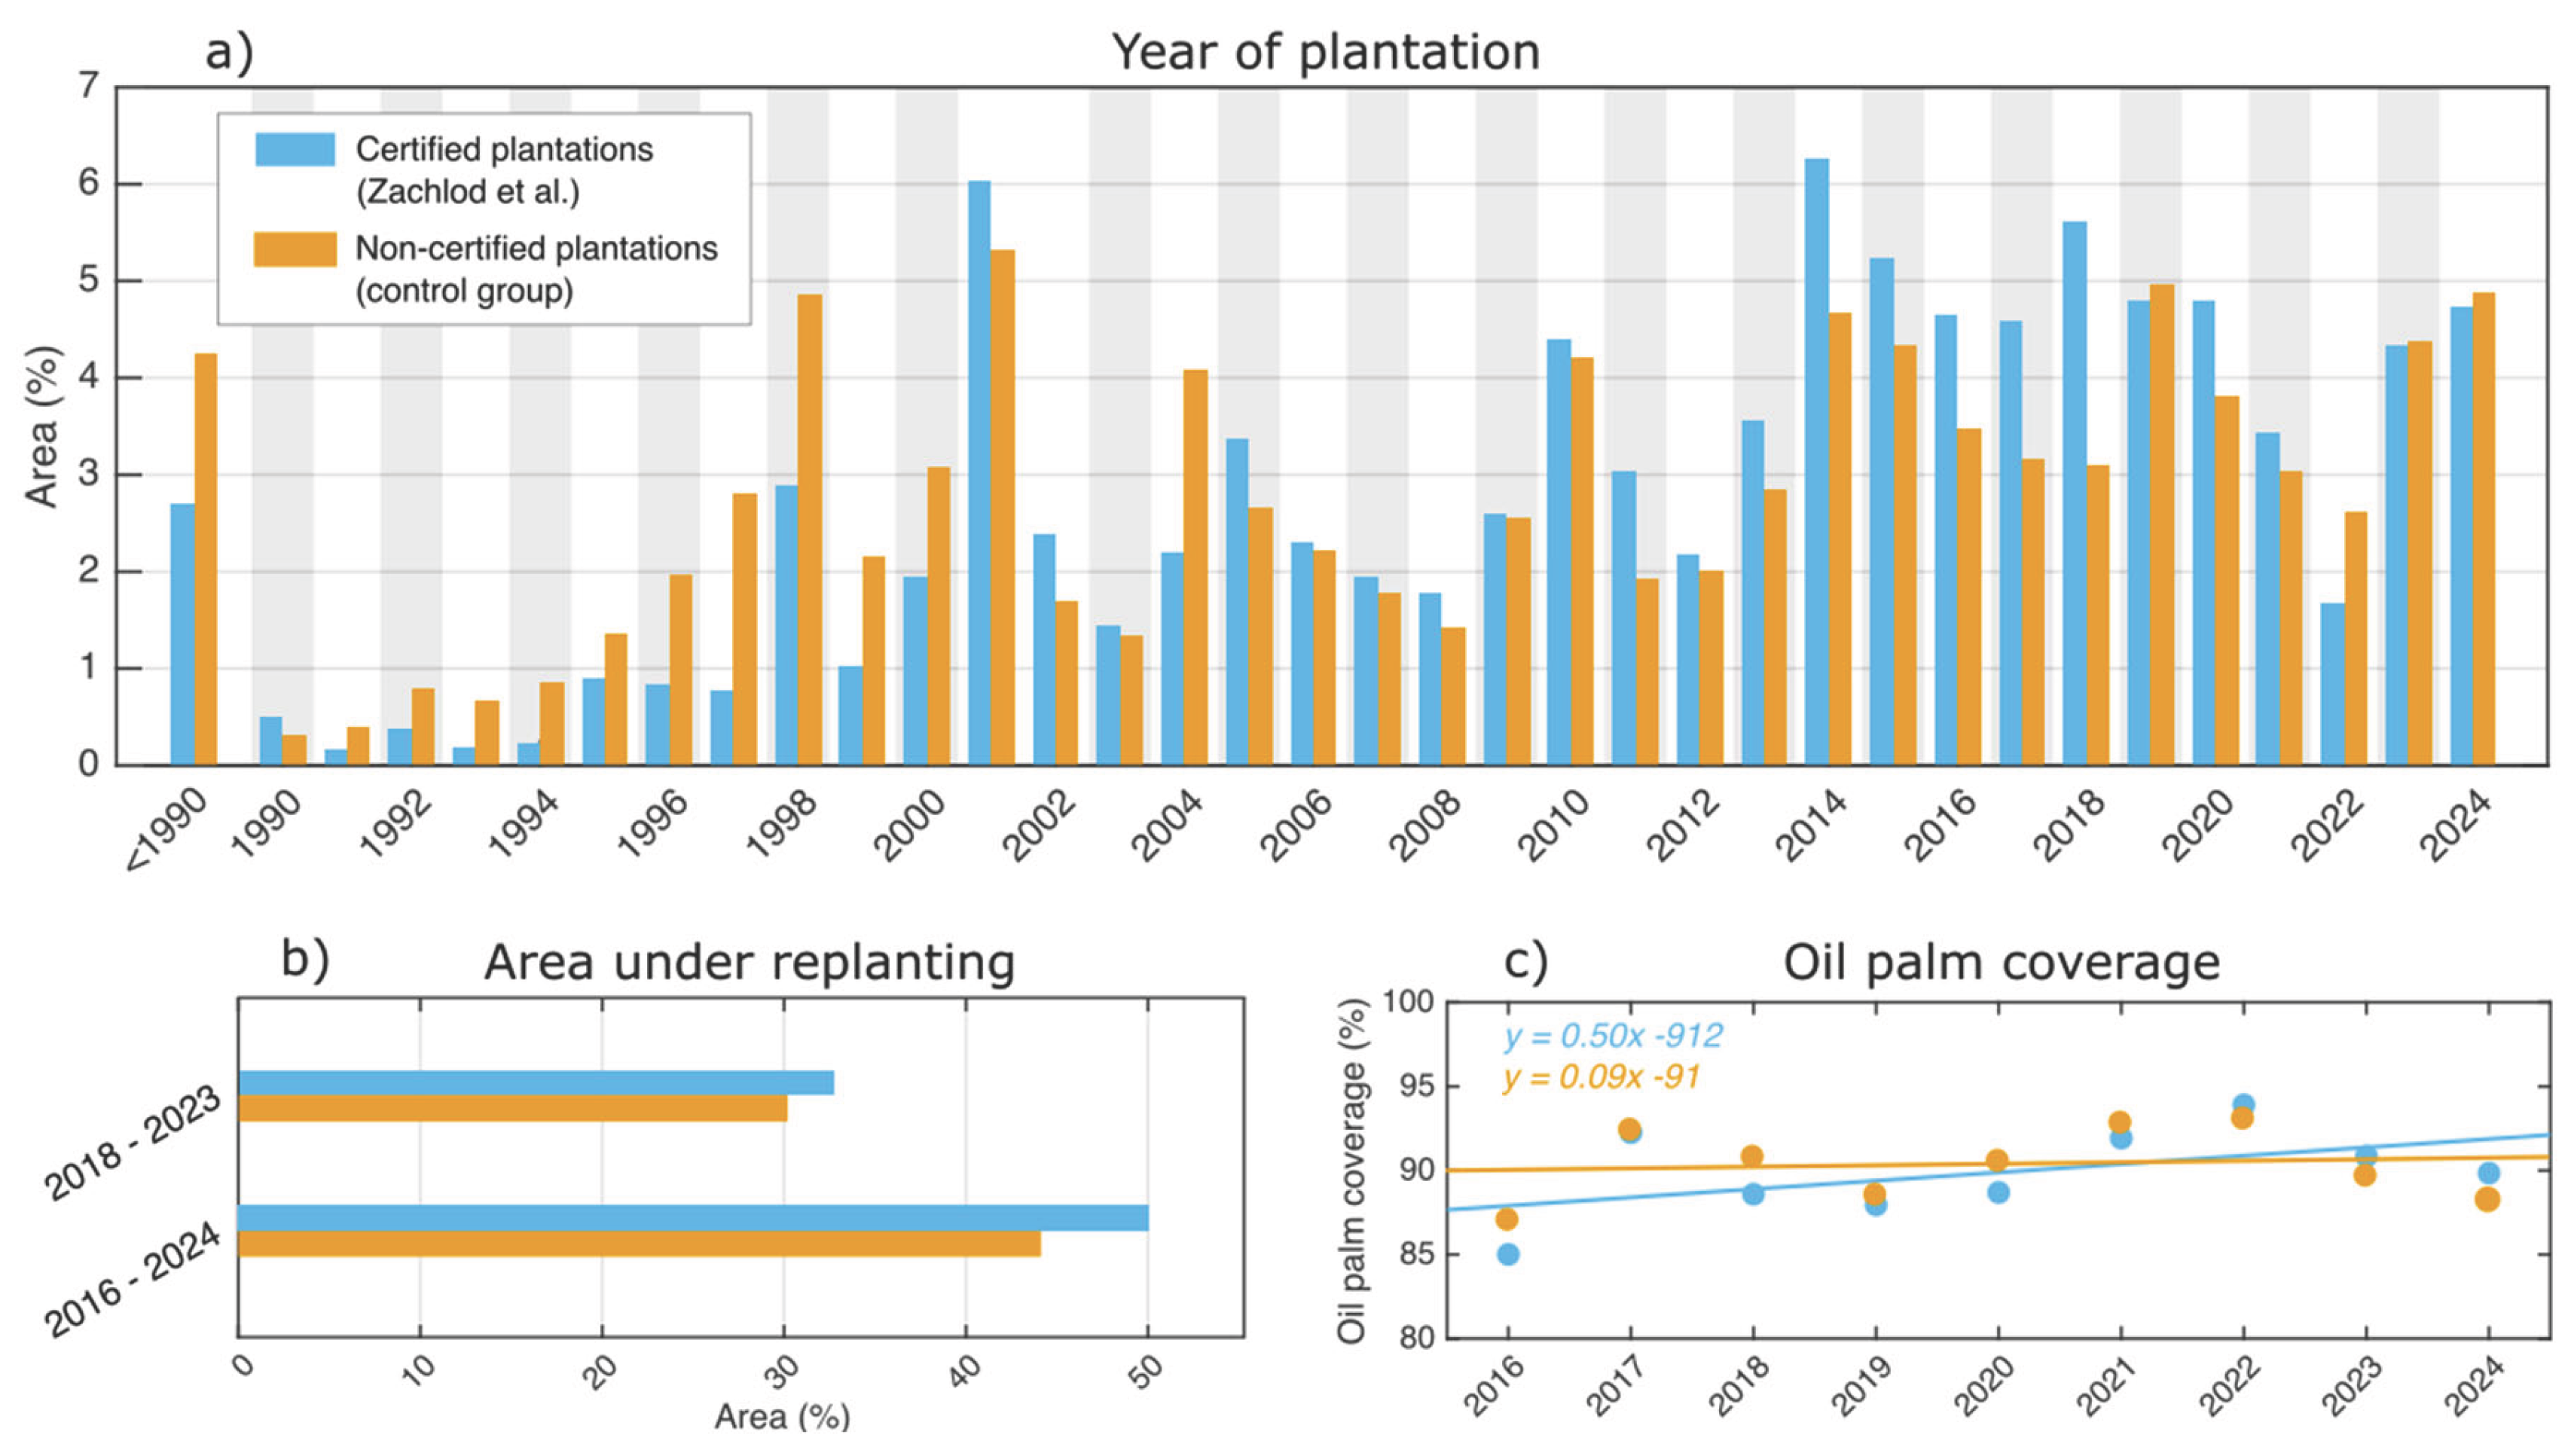
We found that 24.7% of the total certified plantation area was replanted between 2018 and 2023 (Figure 2a), according to the method in Descals et al. [10]. This percentage is 45.4% between 2014 and 2023, indicating replanting dynamics typical for a mature (20 – 30 y.o.) plantation landscape [10] during the study period considered by Zachlod et al. [1]. Furthermore, our supervised classification found that 32.7% of the area experienced temporary canopy loss due to replanting between 2018 and 2023, and 50.0% between 2016 and 2024 (Figure 2b). The approach in Descals et al. [10] gives a lower estimate due to differences in the methods and assumptions (mainly definition of planting year).
One of the claims of Zachlod et al. [1] is that oil palm coverage declined from 2018 to 2023. In contrast, we found a positive but non-significant trend in oil palm coverage (Figure 2c); the slope is 0.50 (-0.26, 1.25; 95% confidence interval) for certified plantations and 0.09 (-0.61, 0.79) for non-certified plantations.
Discussion
Our analysis revealed no substantial differences between certified and non-certified plantations in planting year distribution, oil palm coverage, or replanting activity. Both groups showed similar patterns in planting years and comparable trends in coverage from 2016 to 2024, with no significant changes. These findings invalidate Zachlod et al.’s conclusion that ‘RSPO certification obtainment resulted in production decisions which decreased plantation efficiency both before and after certification’.
Zachlod et al.’s claims of decreased efficiency reflect an apparent misinterpretation of a normal process: replanting. Certified plantations had only slightly higher replanting rates (2016–2024) than non-certified ones, with minor differences overall. We lack estate-specific data to assess impacts on actual palm oil production, as RSPO mandates public reporting only post-certification. For instance, public summaries for Saremas 2 (a Wilmar unit in Zachlod et al.’s study) report increased production volumes from 2020 to 2023 [11,12], though pre-certification comparisons are unavailable. These reports also confirm annual replanting across estates, aligning with our findings.
Palm oil production sustainability remains contentious, often shaped by polarised perspectives [13]. While its environmental and social costs are recognised, the crop’s role in meeting global demand is increasingly acknowledged [14]. Zachlod et al.’s misinterpretation risks portraying certification as detrimental, when ‘lower efficiency’ may reflect sustainability trade-offs. This could lead policymakers to view certification as economically harmful, encourage producers to resist standards, and undermine progress. Robust science is essential for informing debates on vegetable oils [14], as media-driven headlines can distort public opinion and policy, hindering environmental and social improvements.
Supplementary Materials
The following supporting information can be downloaded at the website of this paper posted on Preprints.org.
Conflicts of Interest
This study was funded by the Roundtable on Sustainable Palm Oil. The funders had not role in the design and implementation of the study.
References
- Zachlod, N.; Hudecheck, M.; Sirén, C.; George, G. Sustainable palm oil certification inadvertently affects production efficiency in Malaysia. Communications Earth & Environment 2025, 6, 200. [Google Scholar] [CrossRef] [PubMed]
- Khiabani, P.H.; Takeuchi, W. Assessment of oil palm yield and biophysical suitability in Indonesia and Malaysia. International Journal of Remote Sensing 2020, 41, 8520–8546. [Google Scholar] [CrossRef]
- Zemp, D.C.; Guerrero-Ramirez, N.; Brambach, F.; Darras, K.; Grass, I.; Potapov, A.; Röll, A.; Arimond, I.; Ballauff, J.; Behling, H.; et al. Tree islands enhance biodiversity and functioning in oil palm landscapes. Nature 2023, 618, 316–321. [Google Scholar] [CrossRef] [PubMed]
- Ashton-Butt, A.; Willcock, S.; Purnomo, D.; Suhardi; Aryawan, A.A.K.; Wahyuningsih, R.; Naim, M.; Poppy, G.M.; Caliman, J.-P.; Peh, K.S.H.; et al. Replanting of first-cycle oil palm results in a second wave of biodiversity loss. Ecology and Evolution 2019, 9, 6433–6443. [Google Scholar] [CrossRef] [PubMed]
- Petri, H.; Hendrawan, D.; Bähr, T.; Musshoff, O.; Wollni, M.; Asnawi, R.; Faust, H. Replanting challenges among Indonesian oil palm smallholders: a narrative review. Environment, Development and Sustainability 2023. [Google Scholar] [CrossRef]
- Zhao, J.; Elmore, A.J.; Lee, J.S.H.; Numata, I.; Zhang, X.; Cochrane, M.A. Replanting and yield increase strategies for alleviating the potential decline in palm oil production in Indonesia. Agricultural Systems 2023, 210, 103714. [Google Scholar] [CrossRef]
- Corley, R.H.V.; Tinker, P.B. The Oil Palm, Fifth edition; Wiley Blackwell Publishing: Chichester, UK, 2016. [Google Scholar]
- Descals, A.; Sheil, D.; Wich, S.; Ozigis, M.; Meijaard, E. Extensive unreported non-plantation oil palm in Africa. Environmental Research: Food Systems 2025, 2, 031002. [Google Scholar] [CrossRef]
- Ata, A.; Putra, P.H.M.; Zachlod. Methodological Concerns Regarding RSPO Certification and Plantation Efficiency in Malaysia. A Commentary on Sustainable Palm Oil Certification Inadvertently Affects Production Efficiency in Malaysia. EarthArXiv 2025. [Google Scholar] [CrossRef]
- Descals, A.; Gaveau, D.L.A.; Serge, W.; Szantoi, Z.; Meijaard, E. Global mapping of oil palm plantation age for 2021. Earth System Science Data 2024. [Google Scholar] [CrossRef]
- ControlUnion (Control Union (Malaysia) Sdn. Bhd.). RSPO Principles & Criteria. Public Summary Report. Annual Surveillance Audit 3. Malaysia. Saremas 2 POM. PPB Oil Palms Berhad; Report Number CU892086; Control Union (Malaysia) Sdn. Bhd.: Selangor, Malaysia, 2023. [Google Scholar]
- Sirim Qas International (Sirim Qas International Sdn. Bhd). RSPO Public Summary Report. Wilmar International Limited - Saremas 2 Certification Unit; Sirim Qas International Sdn. Bhd: Selangor, Malaysia, 2022. [Google Scholar]
- Meijaard, E.; Sheil, D. The Moral Minefield of Ethical Oil Palm and Sustainable Development. Frontiers in Forests and Global Change 2019, 2. [Google Scholar] [CrossRef]
- Meijaard, E.; Virah-Sawmy, M.; Newing, H.S.; Ingram, V.; Holle, M.J.M.; Pasmans, T.; Omar, S.; van den Hombergh, H.; Unus, N.; Fosch, A.; et al. Exploring the future of vegetable oils. Oil crop implications - Fats, forests, forecasts, and futures; IUCN and SNSB: Gland, Switzerland, 2024; p. 186. [Google Scholar]
Figure 1.
Comparison of land-cover classification results for a Wilmar plantation certified in 2023. The top row shows results from this study for 2018–2023. Purple indicates bare land, green indicates oil palm, and yellow highlights oil palm replanted on bare land identified in previous years. The bottom row shows the corresponding results from Zachlod et al. (taken from their Figure 4) for 2018, 2020, and 2023. See Figure S2 for satellite imagery showing the replanting status within plantation boundaries (outlined in cyan).
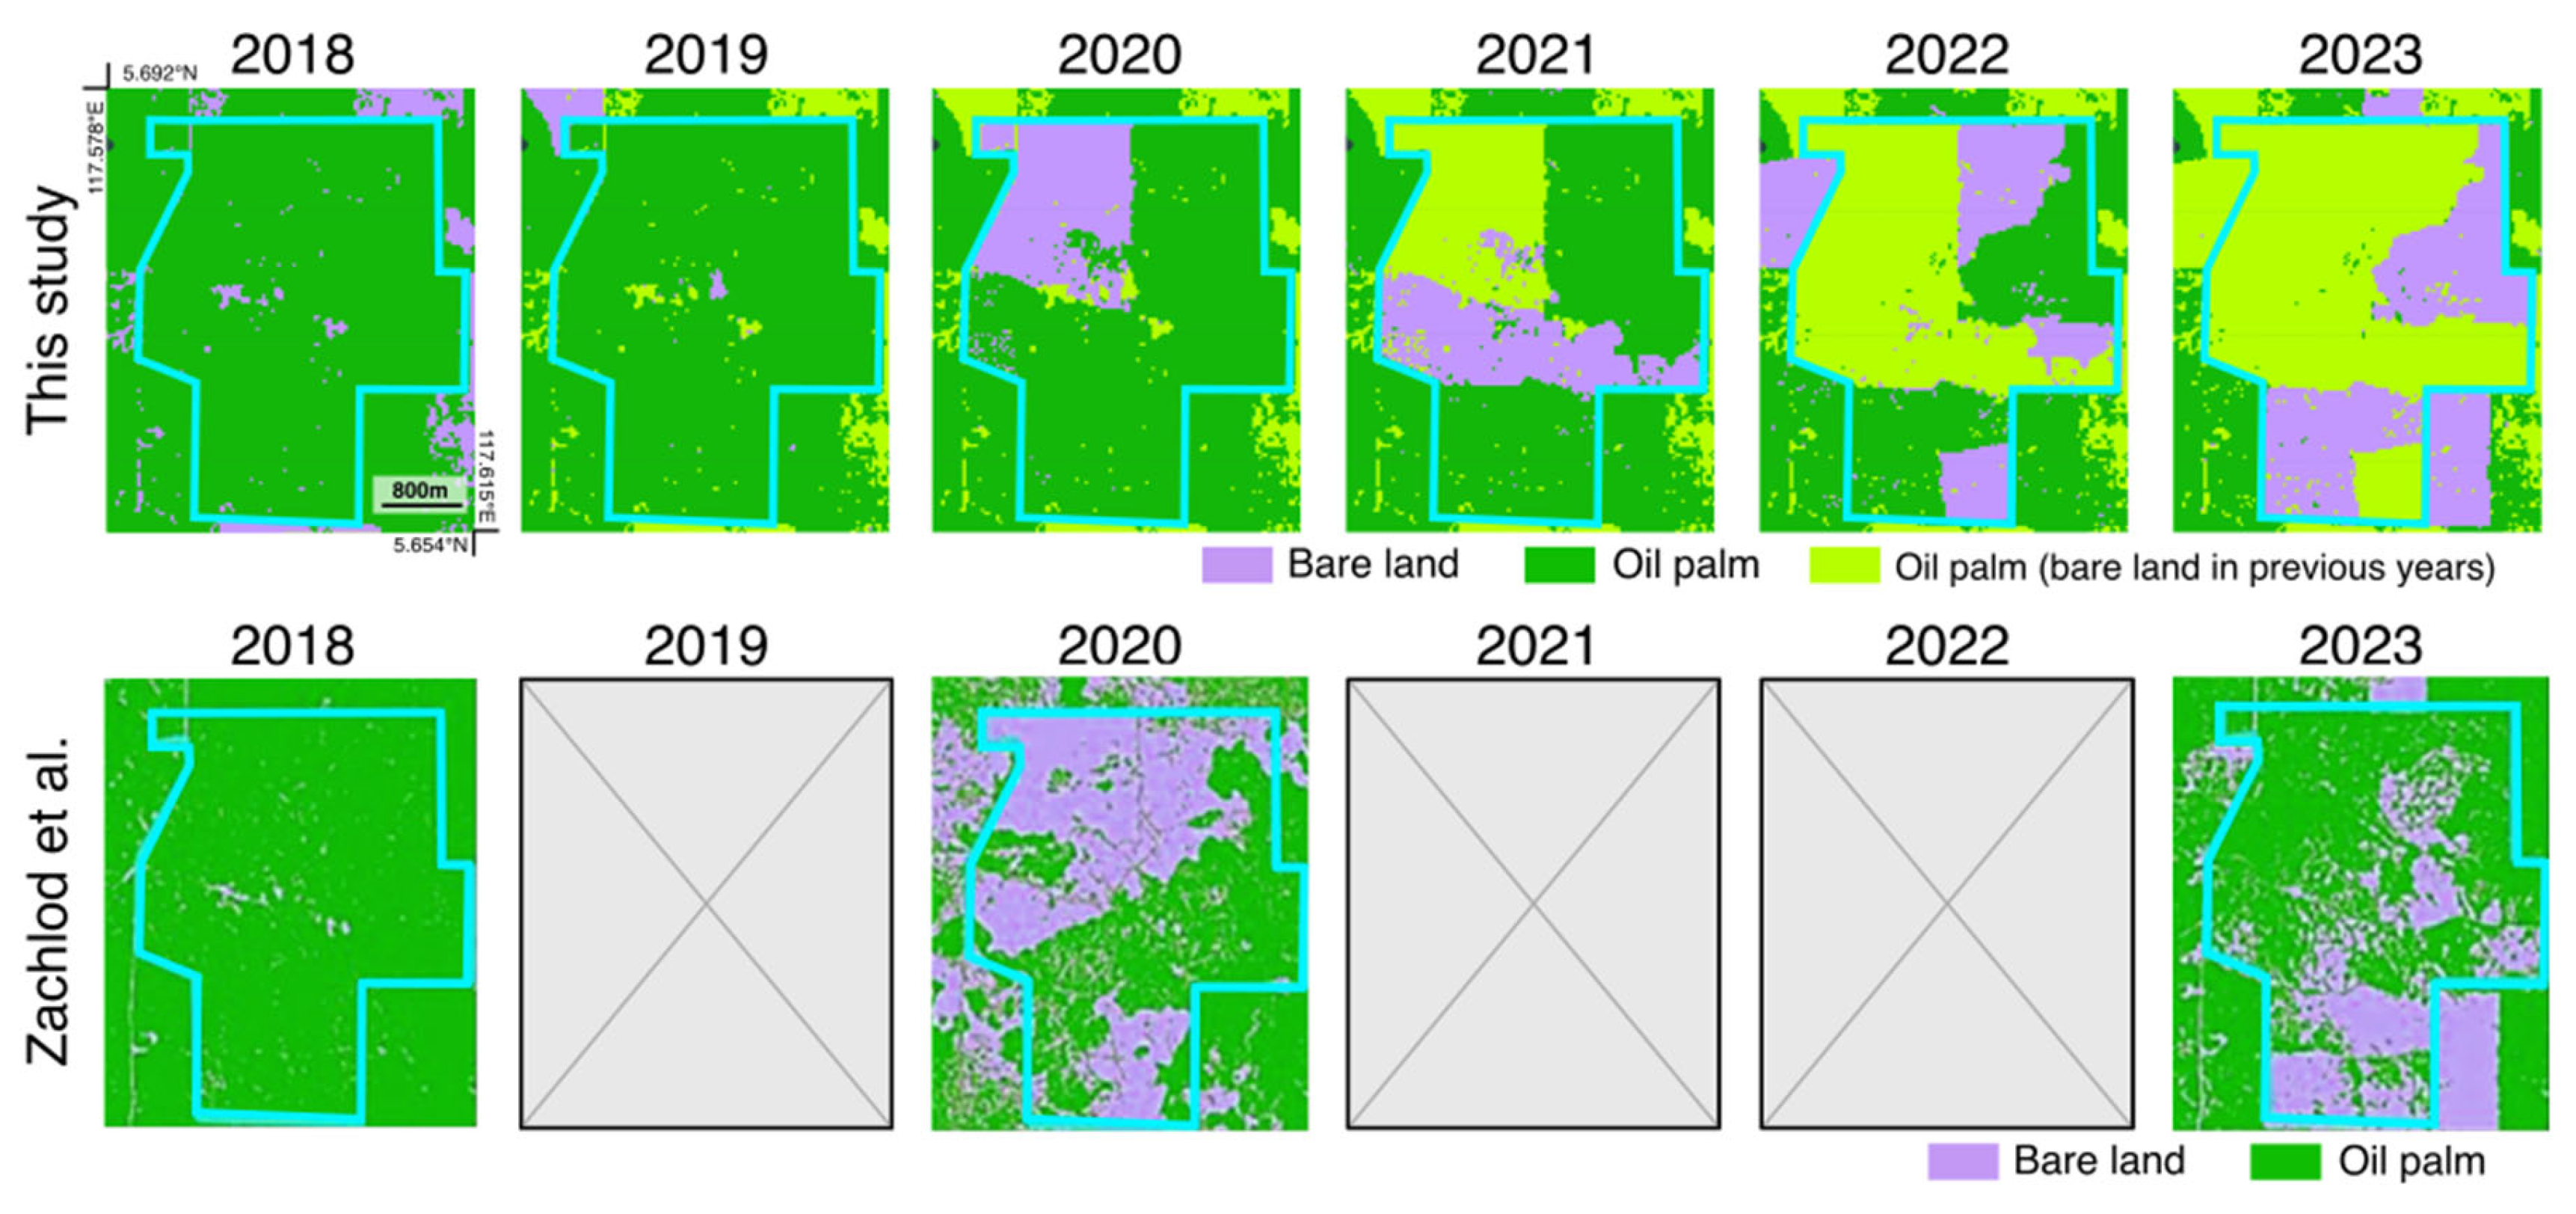
Figure 2.
Characteristics of RSPO-certified plantations included in Zachlod et al. [1] (blue) and non-certified plantations (orange). a) Distribution of plantation establishment years. b) Share of plantation area under replanting during 2016–2024 and 2018–2023. c) Temporal trends in oil palm coverage between 2016 and 2024, with fitted linear regressions (non-significant).
Disclaimer/Publisher’s Note: The statements, opinions and data contained in all publications are solely those of the individual author(s) and contributor(s) and not of MDPI and/or the editor(s). MDPI and/or the editor(s) disclaim responsibility for any injury to people or property resulting from any ideas, methods, instructions or products referred to in the content. |
© 2025 by the authors. Licensee MDPI, Basel, Switzerland. This article is an open access article distributed under the terms and conditions of the Creative Commons Attribution (CC BY) license (http://creativecommons.org/licenses/by/4.0/).
Copyright: This open access article is published under a Creative Commons CC BY 4.0 license, which permit the free download, distribution, and reuse, provided that the author and preprint are cited in any reuse.


