
Submitted:
19 February 2025
Posted:
20 February 2025
You are already at the latest version
Abstract
The extent of oil palm in non-plantation settings in Africa remains unknown despite its considerable socio-economic, nutritional, and cultural importance. Based on a sampling approach and sub-meter satellite data, we estimated 6.53 ± 0.99 Mha of non-plantation oil palm, unreported in official statistics, but widespread near West and Central African villages. These results indicate a capacity to meet local nutritional needs that were previously unrecognized by official statistics. Our findings are therefore of significance for policies and practices related to African food security.
Keywords:
Food security
; oil palm
; remote sensing
; fat gap
Main Text
African oil palm (Elaeis guineensis Jacq.) is a species native to Africa with a broad distribution across the tropical belt of the continent [1]. Palm oil produced from oil palm had been used for millennia in West Africa [2]. Despite its wide-spread consumption in the continent, regional production is insufficient and most African countries are net importers of palm oil [3]. In Africa, palm oil is produced in contexts ranging from intensively-managed plantations to semi-wild and wild oil palm, with the latter two being primarily for subsistence consumption [4]. Plantations include large-scale industrial and smallholder settings cultivated as monocultures in organized patches of similar age. Non-plantation oil palm grows in forest, agroforest and garden contexts, appearing dispersed or forming clusters with irregular arrangements, often integrated into temporary fields, groves, or forested areas [5].
Non-plantation oil palm is primarily the Dura variety, known for lower yields compared to the hybrid Tenera variety used in modern plantations [4]. However, the Dura variety is often preferred by farmers because it casts less shade, facilitating intercropping [6]. African consumers value unrefined palm oil, a staple in African cuisine, which typically commands a higher price in local markets than refined palm oil [7]. Oil palm also produces palm wine [1]. In rural contexts, oil palm fruit bunches are commonly processed in artisanal mills that supply local demand [8]. The resulting palm oil is consumed within the community [4], and only rarely beyond local production areas.
Despite its local importance, non-plantation oil palm is underrepresented in official statistics. FAO data, based on individual country reports, focus on commercial plantations and neglect wild foods [9]. In the case of oil palm, FAO reports 6.76 x 10⁶ ha (million hectares; Mha) in Africa in 2021, but this only considers plantations. A previous study of closed-canopy monoculture plantations estimated the African oil palm area at 1.08 Mha in 2021 based on radar satellite data [10]. However, this study omitted most non-plantation oil palm. In contrast, one study combined country-level estimates based on various observations and approaches and suggested a much larger area of 6.67 Mha for non-plantation oil palm [5].
Vegetable oils are important for healthy diets. The 2008 Food and Agriculture Organization (FAO) and World Health Organization consultation recommended a daily fat consumption of 20–35% of total energy intake [11]. Fat consumption below the 20% threshold is problematic for health. A study considered FAO statistics and concluded that fat consumption in grams in West and Central Africa falls below this threshold [12], creating a “fat gap”. However, this analysis neglected non-plantation oil palm or other potentially invisible fat sources [13].
This study estimates the area of non-plantation oil palm in Africa and its presence near villages. First, we randomly selected 11,800 points across an area of 618.83 Mha (Supplementary Figure S1). For each point, we visualized sub-meter resolution satellite images in Google Earth and identified if plantation or non-plantation oil palm was present based on the identification and spatial arrangement of the palms (Supplementary Figure S2). This sampling allowed us to estimate the total oil palm canopy area with confidence intervals. Second, we randomly selected 1,100 village boundaries to determine if non-plantation oil palm was present in their surroundings. This approach aimed to identify villages with non-plantation oil palms and their distribution.
Based on our sample, we estimated the total oil palm area at 8.43 ± 1.11 Mha. This is significantly larger than reported by FAO (6.76 Mha), USDA Foreign Agricultural Service (4.58 Mha), and satellite-based estimate (1.08 Mha) in 2021 [10]. Most, 77.4% (6.53 ± 0.99 Mha) consisted of non-plantation oil palm, with just 22.6% (1.90 ± 0.51 Mha) in plantations. Our area estimates for plantation oil palm by country are similar to those reported by FAO and USDA data, except in Nigeria (Figure 1).
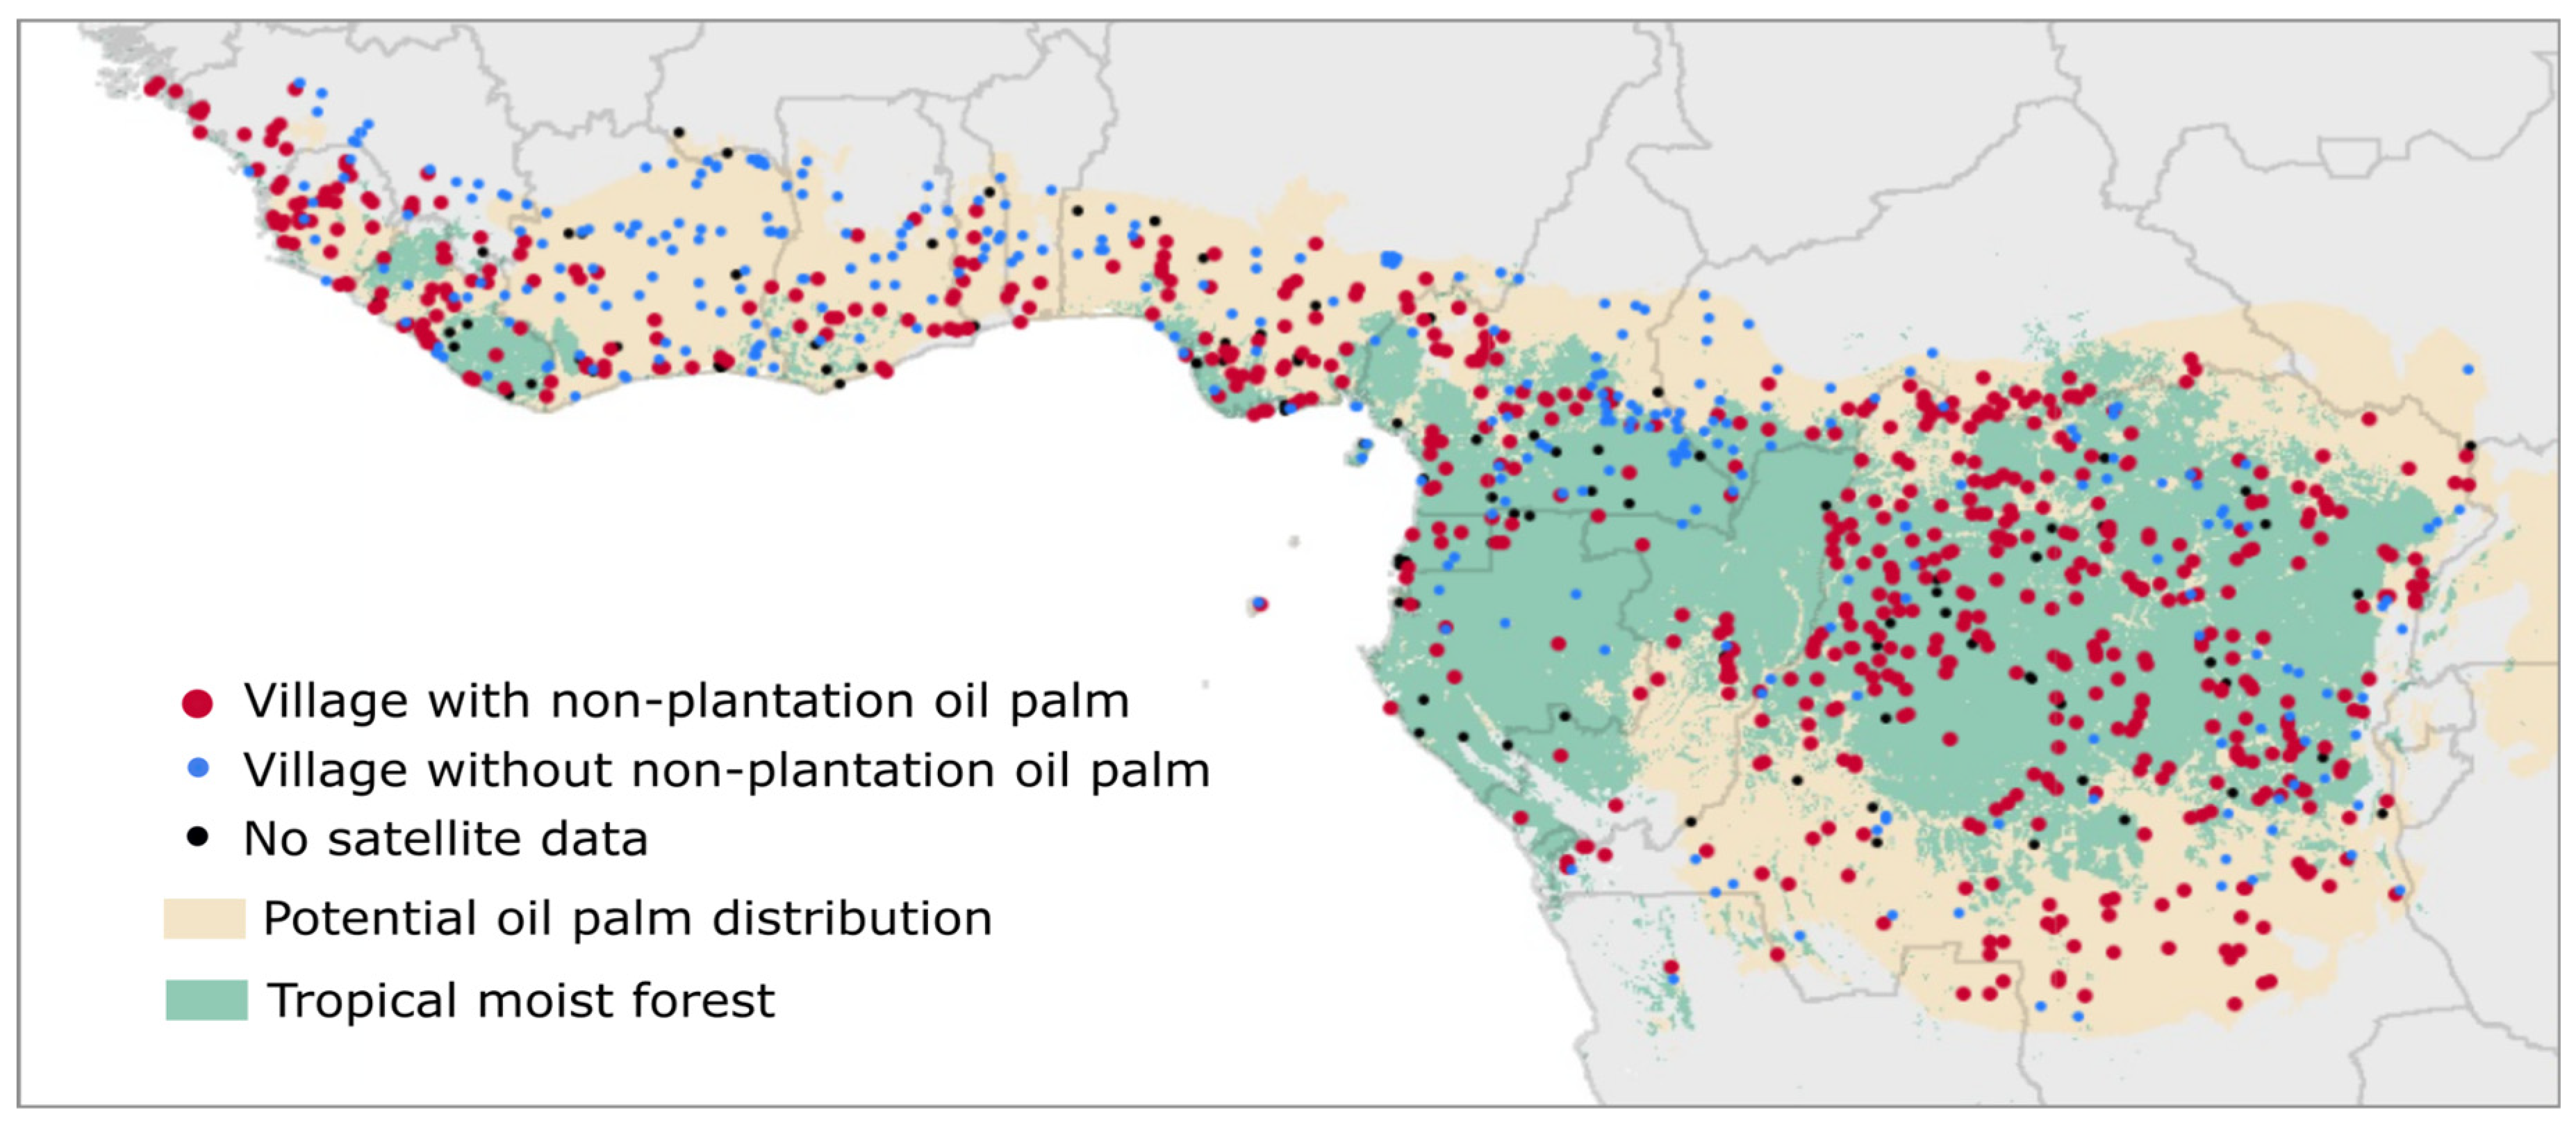
The DRC holds the largest area of non-plantation oil palm, with 2.50 ± 0.69 Mha, followed by Nigeria with 1.89 ± 0.54 Mha, but we note that these are large countries. When assessing oil palm density, we found that Sierra Leone has the highest density of non-plantation oil palm, representing 6.6% ± 2.5% of the sampled area in the country. This contrasts with the 1.2 ± 0.3% found in the DRC. The highest density of plantation oil palm was found in Sao Tome and Principe, with 5.9 ± 4.3% of the sampled area being oil palm plantations. In addition, we found that inhabited areas (see Methods) overall had a higher oil palm density (2.4 ± 0.4%) compared to uninhabited areas (0.4 ± 0.2%). Non-plantation oil palm was common near villages across most of the surveyed area (Figure 2), with a few exceptions such as the interior of Côte d’Ivoire. The highest proportion of villages with oil palm was found in Central Africa within the Congo rainforest (see Methods), with 79.1%. The proportion of villages with non-plantation oil palm was 61.0% in the rest of Central Africa, and 51.3% in West Africa.
Our approach is imperfect. Detecting oil palm in dense forests is challenging, and some palms may have been missed [14]. Non-plantation oil palm has been reported outside the sampled area, for example, in parts of Angola, Zambia, and Mauritania [1], but these regions were excluded in our study. Additionally, distinguishing oil palm from other palm species or irregularly arranged plantations introduces classification uncertainty. Despite these caveats, the visual interpretation of satellite images and our estimates are robust for the following reasons. The unaccounted oil palms are isolated oil palm populations that likely represent negligible areas [1]. The identification of key spatial features in palm and cultivation types relied on sub-meter resolution satellite images paired with Google Street View (Supplementary Figure S3). We replicated the visual identification of oil palm five times and determined the result using a majority vote (See Methods). The alignment of our plantation oil palm estimates with FAO statistics, except Nigeria, supports the accuracy of our methods. We discuss the likely overestimations by FAO and USDA in Nigeria in the Supplementary Text S1.
We observe that much of the rural population in West and Central Africa has access to non-plantation oil palms [5]. This “invisible” oil palm has important implications for food security, by potentially addressing the assumed “fat gap” in these areas [12]. The presence of non-plantation oil palm does not prove that it is harvested or consumed locally, but the extensive presence associated with isolated villages suggests local use may be common. Surveys like those done elsewhere [15], are required to verify these implications and to determine production for subsistence versus trade.
The extent of non-plantation oil palm revealed in our observations suggests a significant source of nutrition and income as has been noted locally in previous studies [5,16]. This raises questions concerning potential deforestation. The presence of oil palm indicates that the land is suitable for this crop and that villagers likely have the relevant knowledge to manage, harvest, and process the crop [5,8]. These factors may facilitate commercial intensification of oil palm cultivation to better meet regional and global demand [13]. Smallholder-driven oil palm expansion may occur at the expense of old-growth forests if suitable policies and regulations are not implemented [15,17]. On the other hand, oil palm yields more than other oil crops and if crop expansion is needed to meet demand, the use of oil palm may spare land [13].
The challenge of quantifying the presence and access to oil palm illustrates a broader issue in understanding food security, particularly for communities living near forests or maintaining mixed gardens. While satellite imagery can help estimate some distinctive crops, like oil palm and coconut, many other food sources remain difficult to observe and quantify. These include crops like taro (Colocasia spp.) and yam (Dioscorea spp.) that thrive in forest margins, fallows and gardens, fruiting trees like Dacryodes edulis H.J. Lam, Allanblackia spp. and Irvingia spp., as well as seasonal mushrooms, and other plants like bananas (Musa spp.) and false banana (Ensete ventricosum (Welw.) Cheesman), which are often integrated into complex multi-layered gardens that often merge and persist within the secondary forest. Similarly, bushmeat continues to be a crucial yet poorly documented source of protein and fat. The importance of these food resources follows seasonal patterns, with communities relying on different items throughout the year and involving a spectrum between wild harvest and cultivation depending on needs, availability and local knowledge. These often ’messy’ landscapes and dependencies - neither purely agricultural nor purely wild - pose challenges for agricultural monitoring and food security assessment methods despite their potentially crucial role in local nutrition and resilience. To address such issues it is essential to map all crops and farming practices, including other overlooked food species such as groundnut, rice, cassava, sorghum, and millet and subsistence value chains, which also play significant roles in forest loss, climate change, and biodiversity loss [17]. Understanding and accurately mapping all crops and agricultural practices is critical to effectively address the social and environmental impacts of agriculture.
Methods
We demonstrate the occurrence of non-plantation oil palm in Africa using two complementary approaches. First, we estimated the oil palm area by country using 11,800 points randomly sampled. Second, we assessed the presence of non-plantation oil palm within 1,100 randomly selected villages.
1. Simple Random Sampling for Country-Wide Estimation of Oil Palm Area
1.1. Delimitation of the Sampling Area
We defined a sampling area based on the potential oil palm distribution delimited in a previous study [18]. This potential distribution represents regions where bioclimatic variables indicate that the climate is suitable for oil palm cultivation. Within this potential distribution, we excluded areas where oil palm occurrence is unlikely by masking non-vegetated land cover, including water, bare land, and impervious surfaces in the European Space Agency WorldCover 2021 v2 land cover map. This mask aimed to constrain the sampling area and reduce uncertainty in the area estimates. Then, we subdivided the potential distribution into primary forests, inhabited and uninhabited areas. First, we defined the primary forests using the JRC Tropical Moist Forest (TMF) dataset [19], which defines primary forests as undisturbed evergreen or semi-evergreen forest, with no signs of degradation or deforestation, as observed in the Landsat data. Then, outside the primary forest, we defined inhabited areas as pixels within a 100-meter radius of those classified as inhabited in any of two datasets, the Global Human Settlement Layer and the World Settlement Footprint 2015. Areas outside the inhabited buffer zone were classified as uninhabited. In addition, we buffered the potential oil palm distribution area by 100 kilometers and extended the buffering area in West Africa across the coast up to Senegal, where non-plantation oil palm has been reported [5]. In summary, the sampling area consisted of four classes: 1) primary forest, 2) inhabited and 3) uninhabited areas within the potential distribution, and 4) buffering area of the potential distribution. The total sampled area was 618.83 Mha.
The purpose of subdividing the sampling area was to use different sampling densities. Inhabited areas are more likely to contain human-managed oil palm than uninhabited areas, and primary forests and areas outside the potential distribution are expected to have less oil palm. Thus, we applied a higher sampling density to inhabited areas. This varied sampling density aimed to reduce uncertainty in area estimates in regions with higher oil palm coverage. The minimum sampling density per country was set to 20 points per Mha in inhabited areas, 10 points per Mha in uninhabited areas and buffered areas of the potential distribution, and 5 points per Mha in primary forests.
Despite the extensive study area, we acknowledge the existence of oil palm in Africa outside the sampled area. For example, we did not include isolated oil palm populations that have been reported in Angola, Zambia, and Mauritania [1]. These regions represent sparse populations with a negligible oil palm area compared to the areas found in the potential distribution of oil palm.
1.2. Definition of oil Palm Types
We defined plantation and non-plantation oil palm based on spatial features that can be recognized in sub-meter satellite images. While plantation oil palm is a specific type of plantation where oil palm is intensively managed, non-plantation oil palm includes a heterogeneous group of oil palm types:
- 1)
- Plantation oil palm: Structured monoculture plantations with homogeneous oil palm age. The plantation has a regular planting pattern and optimal spacing to maximize productivity. These plantations can be corporate-managed (industrial plantations) or owned by small businesses, families or local communities (smallholder plantations). Plantation oil palm can be identified in sub-meter satellite images because of the high planting density and a linear arrangement of palms (Supplementary Figure S2). While industrial plantations show similar characteristics such as large coverage, long linear well-defined boundaries, and dense and equidistant trails placed for optimal harvesting, smallholders are a heterogeneous group with different planting settings. Here, in this category, we include any smallholder contexts with a systematic layout, planting rows, and standardized spacing.
- 2)
- Non-plantation oil palm: oil palm that grows dispersed or disorganized in clusters, with irregular arrangement and lack of strict planting patterns (Supplementary Figure S2). This includes: a) wild oil palm, which grows in naturalized settings coexisting with native vegetation or other plant species, creating a mixed structure that resembles a natural vegetation type rather than a cultivated plantation. This includes truly wild oil palm which was mapped elsewhere [14]; b) smallholder or community-based oil palms that grow close together but lack systematic layout, planting rows, or standardized spacing. In these groves, oil palms grow in irregular patterns due to spontaneous seedling emergence or informal planting methods without planned organization; c) Dispersed oil palms in anthropogenic landscapes: individual or scattered oil palm growing within human-modified environments, such as agricultural fields, villages, roadsides, or mixed-use lands. Our definition of non-plantation oil palm does not distinguish between land owned and managed by smallholders and land where oil palm grows entirely wild, as this information cannot be directly determined from satellite data.
1.3. Visual Interpretation of Satellite Data
Oil palm can be distinguished from other palm and plantation types based on specific features visible in sub-meter resolution satellite images. To identify oil palm and differentiate it from other species, we collected 175 sub-meter resolution images paired with Google Street View data. Supplementary Figure S3 provides examples from six locations. First, we determined the palm or crop type in the 175 locations using Google Street View. Then, we analyzed the sub-meter resolution satellite images and qualitatively identified the key features that distinguish oil palm from other palms and crop types.
Sub-meter resolution satellite images capture the crowns of palms and trees. Palms typically appear as asterisk-like shapes when viewed from above (Supplementary Figure S3), formed by fronds growing outward in all directions from the top of the trunk. For oil palms, these fronds are usually longer than those of other palms, such as coconut or areca palms. Long fronds are the first indicator of an oil palm, although this is less reliable for older oil palms, which grow taller with shorter fronds. Other palms, such as Raphia sp. and Phoenix sp., also have long fronds, but their leaflets are smaller and thinner compared to oil palm. Thus, the second distinguishing feature of oil palm is broader, well-defined fronds visible in sub-meter resolution satellite images. Fronds of Raphia sp. and Phoenix sp. are often indistinct in such images. However, this is not a definitive indicator, as some Google Earth images are slightly blurred, making the fronds also indistinguishable in oil palm. The color of satellite imagery can also help distinguish oil palms, although it is the least reliable indicator due to variations in Google Earth imagery. Oil palms typically appear dark green, although young oil palms often look brighter. In comparison, other palms show brighter green hues.
Plantation and non-plantation oil palm can be identified based on the spatial arrangement of the oil palms (Supplementary Figure S2). Plantation oil palm presents a homogeneous density and is typically planted in rows using a triangular spacing arrangement [1]. Rectangular spacing is also used in oil palm, although this spacing type is more common in coconut plantations. Non-plantation oil palm, on the contrary, does not follow a strict plantation pattern and occurs at variable densities or scattered across the land.
We visually inspected sub-meter resolution satellite images in Google Earth to determine if oil palm was present at the sampled points. We classified a point as having oil palm only if the point was located within the oil palm canopy area. The oil palm canopy area is the ground area covered by the vertical projection of the oil palm fronds. If sparse oil palms were present but the point didn’t fall within the canopy area, we considered that oil palm was not present in the sampled point. If the point fell within the oil palm canopy area, we further categorized the point as plantation or non-plantation oil palm. This approach ensured that the oil palm area estimates represented the canopy area rather than areas with varying palm densities.
The sub-meter resolution images available on Google Earth are updated regularly, but there are regions where images are not available. When the imagery was unavailable for a given point, we labelled the point as ‘no satellite data’ and considered the points as class ‘Other’ in the subsequent analyses. We did this reclassification because most points without satellite data were in isolated, forested areas with a low likelihood of containing oil palm. When sub-meter satellite images are available, they show different years depending on the location. For this reason, our estimates reflect the oil palm area over the past few years rather than a specific year. This uncertainty is minimal because oil palm is perennial, and its spatial extent does not exhibit substantial year-to-year variation.
A single interpreter conducted the visual interpretation of satellite images, performing the task independently five times to ensure consistency. The final assigned class for each point was determined using a majority vote among the results from the five replications.
1.4. Estimation of Oil Palm Canopy Area
We used the Wilson score to estimate the proportion of points with plantation and non-plantation oil palm. The Wilson score provides accurate approximations to the binomial distribution when dealing with low proportions [20], which is the case in our study; the proportion of points labelled as oil palm was below 5% in many countries. The center of the Wilson score interval was calculated with Equation (1):
where p is the observed proportion of points with oil palm (either plantation or non-plantation oil palm separately), n is the total number of points sampled, and z is the critical value from the standard normal distribution for a desired confidence interval. In this study, we used a 95% confidence interval and, thus, a z value of 1.96. The formula for the Wilson Score Interval (Equation (2)) provides the confidence interval of .
The oil palm area estimate (AE) was calculated by multiplying the total sampled area by the proportion of oil palm (Equation (3)). Similarly, the confidence interval of the oil palm area estimate () was obtained by multiplying the total sampled area by the confidence interval of the proportion of oil palm (Equation (4)). Sampled points were classified as oil palm only if they fell within the oil palm canopy. Thus, our area estimates represent the oil palm canopy area, defined as the ground area covered by the vertical projection of the oil palm fronds.
We used different density of points that differed by country and sampling area classes. Thus, the estimation of the oil palm area (Equation (1) and 3) and its confidence interval (Equation (2) and 4) were calculated separately for each country and sampling area class. To obtain country-wide area estimates (AEcountry), we summed the oil palm area estimates for the inhabited area (AEinhab), uninhabited area (AEuninhab), buffered potential distribution (AEbuffer), and primary forest (AEforest) (Equation (5)). For the confidence intervals, we used the propagation of uncertainty to aggregate the uncertainty at the country scale (Equation (6)):
where CIinhab, CIuninhab, CIbuffer, and CIforest represent the confidence intervals for the inhabited area, uninhabited area, buffered potential distribution, and primary forest for a given country. CItotal represents the confidence interval of the country-wide area estimate (AEcountry).
1.5. Comparison with Official and Satellite-Derived Statistics
We compared our oil palm area estimates with official statistics from FAOSTAT and USDA Foreign Agricultural Service, as well as satellite-derived estimates from a global oil palm map [10]. We extracted the oil palm area from these datasets for the year 2021. These datasets have different definitions of what constitutes oil palm. The official statistics from FAO and USDA include oil palm areas that have been harvested. In contrast, the global oil palm map only includes closed-canopy monoculture oil palm plantations, whether it was harvested or not, but excludes young plantations and oil palm that grow sparsely. For Nigeria, we also compared our estimates with previous studies on plantation and non-plantation oil palm (Supplementary Text S1).
2. Determining the Occurrence of Non-Plantation Oil Palm Within the Proximities of Villages
The second approach focused on determining the proportion of villages with non-plantation oil palm growing in their surrounding areas. We mapped the surroundings of the villages using OpenStreetMap (OSM) data. Specifically, we used all settlement boundaries in West and Central Africa included in OSM. To enhance the reliability of the village boundaries, we also used the Open Buildings 2.5D Temporal Dataset and excluded the village boundaries with fewer than 10 buildings or more than 1,000 buildings.
Because the density of villages varies across Africa, we created a 100 x 100 km grid and randomly selected 100 villages within each grid cell. This approach prevented oversampling areas with high village densities. Finally, from the selected villages, we randomly selected 400 village boundaries in West Africa and 700 in Central Africa. The boundaries in Central Africa were subdivided into 500 within the Congo forest and 200 outside it. The villages in the Congo forest were selected based on the region with tropical & subtropical moist broadleaf forests in the RESOLVE Ecoregion dataset. For each selected village, we visually inspected sub-meter resolution imagery within the village boundary and within a 100-meter buffer surrounding the boundary. We considered that oil palm was present if it appeared in natural groves, clustered formations, around houses, or in non-plantation settings. Supplementary Figure S4 shows a village with non-plantation oil palm. In cases where oil palms appeared scattered, we considered that the village contained oil palm if there were at least five palms within the inspected area.
This analysis focused on West and Central Africa, excluding East Africa for two reasons. First, the oil palm area in East African countries, based on the sampling points, was much smaller than in West and Central Africa. This suggests that oil palm is less relevant in East Africa, although it may have local importance in regions like Kigoma in western Tanzania. Second, preliminary analysis indicated that oil palm is absent around villages in East Africa. We observed, however, a high occurrence of coconut palms in villages along the coasts of Tanzania and Mozambique.
Data Availability
The 11,800 randomly sampled points used to generate the oil palm area estimates are available at https://doi.org/10.5281/zenodo.14754653. Village boundaries were queried from OpenStreetMap https://www.openstreetmap.org/ using QGIS. Sub-meter resolution images were visualized in Google Earth Engine https://code.earthengine.google.com/. The JRC Tropical Moist Forest can be downloaded at https://forobs.jrc.ec.europa.eu/TMF/data, the ESA WorldCover 10m v200 at https://doi.org/10.5281/zenodo.7254221, the Global Human Settlement Layer at https://doi.org/10.2905/2FF68A52-5B5B-4A22-8F40-C41DA8332CFE, the World Settlement Footprint 2015 at https://doi.org/10.6084/m9.figshare.12424970, the building dataset developed by Google. We also used the Open Buildings 2.5D Temporal Dataset (https://sites.research.google/gr/open-buildings/temporal/), and the RESOLVE Ecoregion biome layer (https://ecoregions.appspot.com/). Official oil palm statistics were obtained from FAOSTAT (https://www.fao.org/faostat/en/) and USDA-FAS (https://fas.usda.gov/).
Competing Interests
Serge Wich is a member of the IUCN Oil Crops Task Force. Erik Meijaard chairs and has received funding from the IUCN Oil Crops Task Force, and he has done work paid for by the Roundtable on Sustainable Palm Oil.
Acknowledgment
This research was undertaken with financial support from the United Nation Environmental Programme (UNEP) under the Global Environment Facility (GEF) Congo Basin Impact Program (PCA/2022/5067).
References
- Corley, R. H. V. & Tinker, P. B. The Oil Palm. (John Wiley & Sons, 2008).
- Sowunmi, M.A. The significance of the oil palm (Elaeis guineensis Jacq.) in the late Holocene environments of west and west central Africa: A further consideration. Veg. Hist. Archaeobotany 1999, 8, 199–210. [Google Scholar] [CrossRef]
- FAO. FAO: FAOSTAT statistical database. (2022).
- Poku, K. Small-Scale Palm Oil Processing in Africa. (Food & Agriculture Org., 2002).
- Carrere, R. Oil palm in Africa: Past, present and future scenarios. WRM series on tree plantations 15, 1–78 (2010).
- Pashkevich, M.D.; Marshall, C.A.; Freeman, B.; Reiss-Woolever, V.J.; Caliman, J.-P.; Drewer, J.; Heath, B.; Hendren, M.T.; Saputra, A.; Stone, J.; et al. The socioecological benefits and consequences of oil palm cultivation in its native range: The Sustainable Oil Palm in West Africa (SOPWA) Project. Sci. Total. Environ. 2024, 926, 171850. [Google Scholar] [CrossRef] [PubMed]
- Cirad, U.S.d.P.; Rafflegeau, S.; Nanda, D.; I, C.U.d.Y.; Genot, C.; Bia, F.I.-U. Artisanal mills and local production of palm oil by smallholders. Achieving sustainable cultivation of oil palm Volume 2: Diseases, pests, quality and sustainability (2018).
- Hyman, E.L. An economic analysis of small-scale technologies for palm oil extraction in Central and West Africa. World Dev. 1990, 18, 455–476. [Google Scholar] [CrossRef]
- Borelli, T.; Hunter, D.; Powell, B.; Ulian, T.; Mattana, E.; Termote, C.; Pawera, L.; Beltrame, D.; Penafiel, D.; Tan, A.; et al. Born to Eat Wild: An Integrated Conservation Approach to Secure Wild Food Plants for Food Security and Nutrition. Plants 2020, 9, 1299. [Google Scholar] [CrossRef] [PubMed]
- Descals, A.; Gaveau, D.L.A.; Wich, S.; Szantoi, Z.; Meijaard, E. Global mapping of oil palm planting year from 1990 to 2021. Earth Syst. Sci. Data 2024, 16, 5111–5129. [Google Scholar] [CrossRef]
- Joint, F. & others. Fats and fatty acids in human nutrition. Report of an expert consultation, 10-14 November 2008, Geneva. (2010).
- Bajželj, B.; Laguzzi, F.; Röös, E. The role of fats in the transition to sustainable diets. Lancet Planet. Heal. 2021, 5, e644–e653. [Google Scholar] [CrossRef] [PubMed]
- Virah-Sawmy, M.; Newing, H.; Ingram, V.; Holle, M.; Pasmans, T.; Omar, S.; Hombergh, H.v.D.; Unus, N.; Fosch, A.; de Arruda, H.F.; et al. Exploring the future of vegetable oils : oil crop implications : fats, forests, forecasts, and futures; IUCN: Gland, Switzerland, 2024. [Google Scholar]
- Cosiaux, A. , Gardiner, L. & Couvreur, T. Elaeis guineensis. The IUCN Red List of Threatened Species 2016: e. T13416970A13416973. (2016).
- Ordway, E.M.; Naylor, R.L.; Nkongho, R.N.; Lambin, E.F. Oil palm expansion in Cameroon: Insights into sustainability opportunities and challenges in Africa. Glob. Environ. Chang. 2017, 47, 190–200. [Google Scholar] [CrossRef]
- Murphy, D.J.; Goggin, K.; Paterson, R.R.M. Oil palm in the 2020s and beyond: challenges and solutions. CABI Agric. Biosci. 2021, 2, 1–22. [Google Scholar] [CrossRef]
- Meijaard, E.; et al. Apes and agriculture. Frontiers in Conservation Science 4, 1225911 (2023).
- Descals, A.; Wich, S.; Meijaard, E.; Gaveau, D.L.A.; Peedell, S.; Szantoi, Z. High-resolution global map of smallholder and industrial closed-canopy oil palm plantations. Earth Syst. Sci. Data 2021, 13, 1211–1231. [Google Scholar] [CrossRef]
- Vancutsem, C.; et al. Long-term monitoring of tropical moist forest extent (from 1990 to 2019). 2020. [Google Scholar]
- Wilson, E. B. Probable inference, the law of succession, and statistical inference. Journal of the American Statistical Association 22, 209–212 (1927).
Figure 1.
Comparison of plantation and non-plantation oil palm areas in million hectares (Mha) across the 16 top-producing African countries. The figure shows estimates from various sources: this study, FAO, USDA, and Descals et al., 2024 for the year 2021. Points in cyan represent other studies reporting plantation and non-plantation oil palm in Nigeria. Black lines indicate 95% confidence intervals for the estimates of this study.
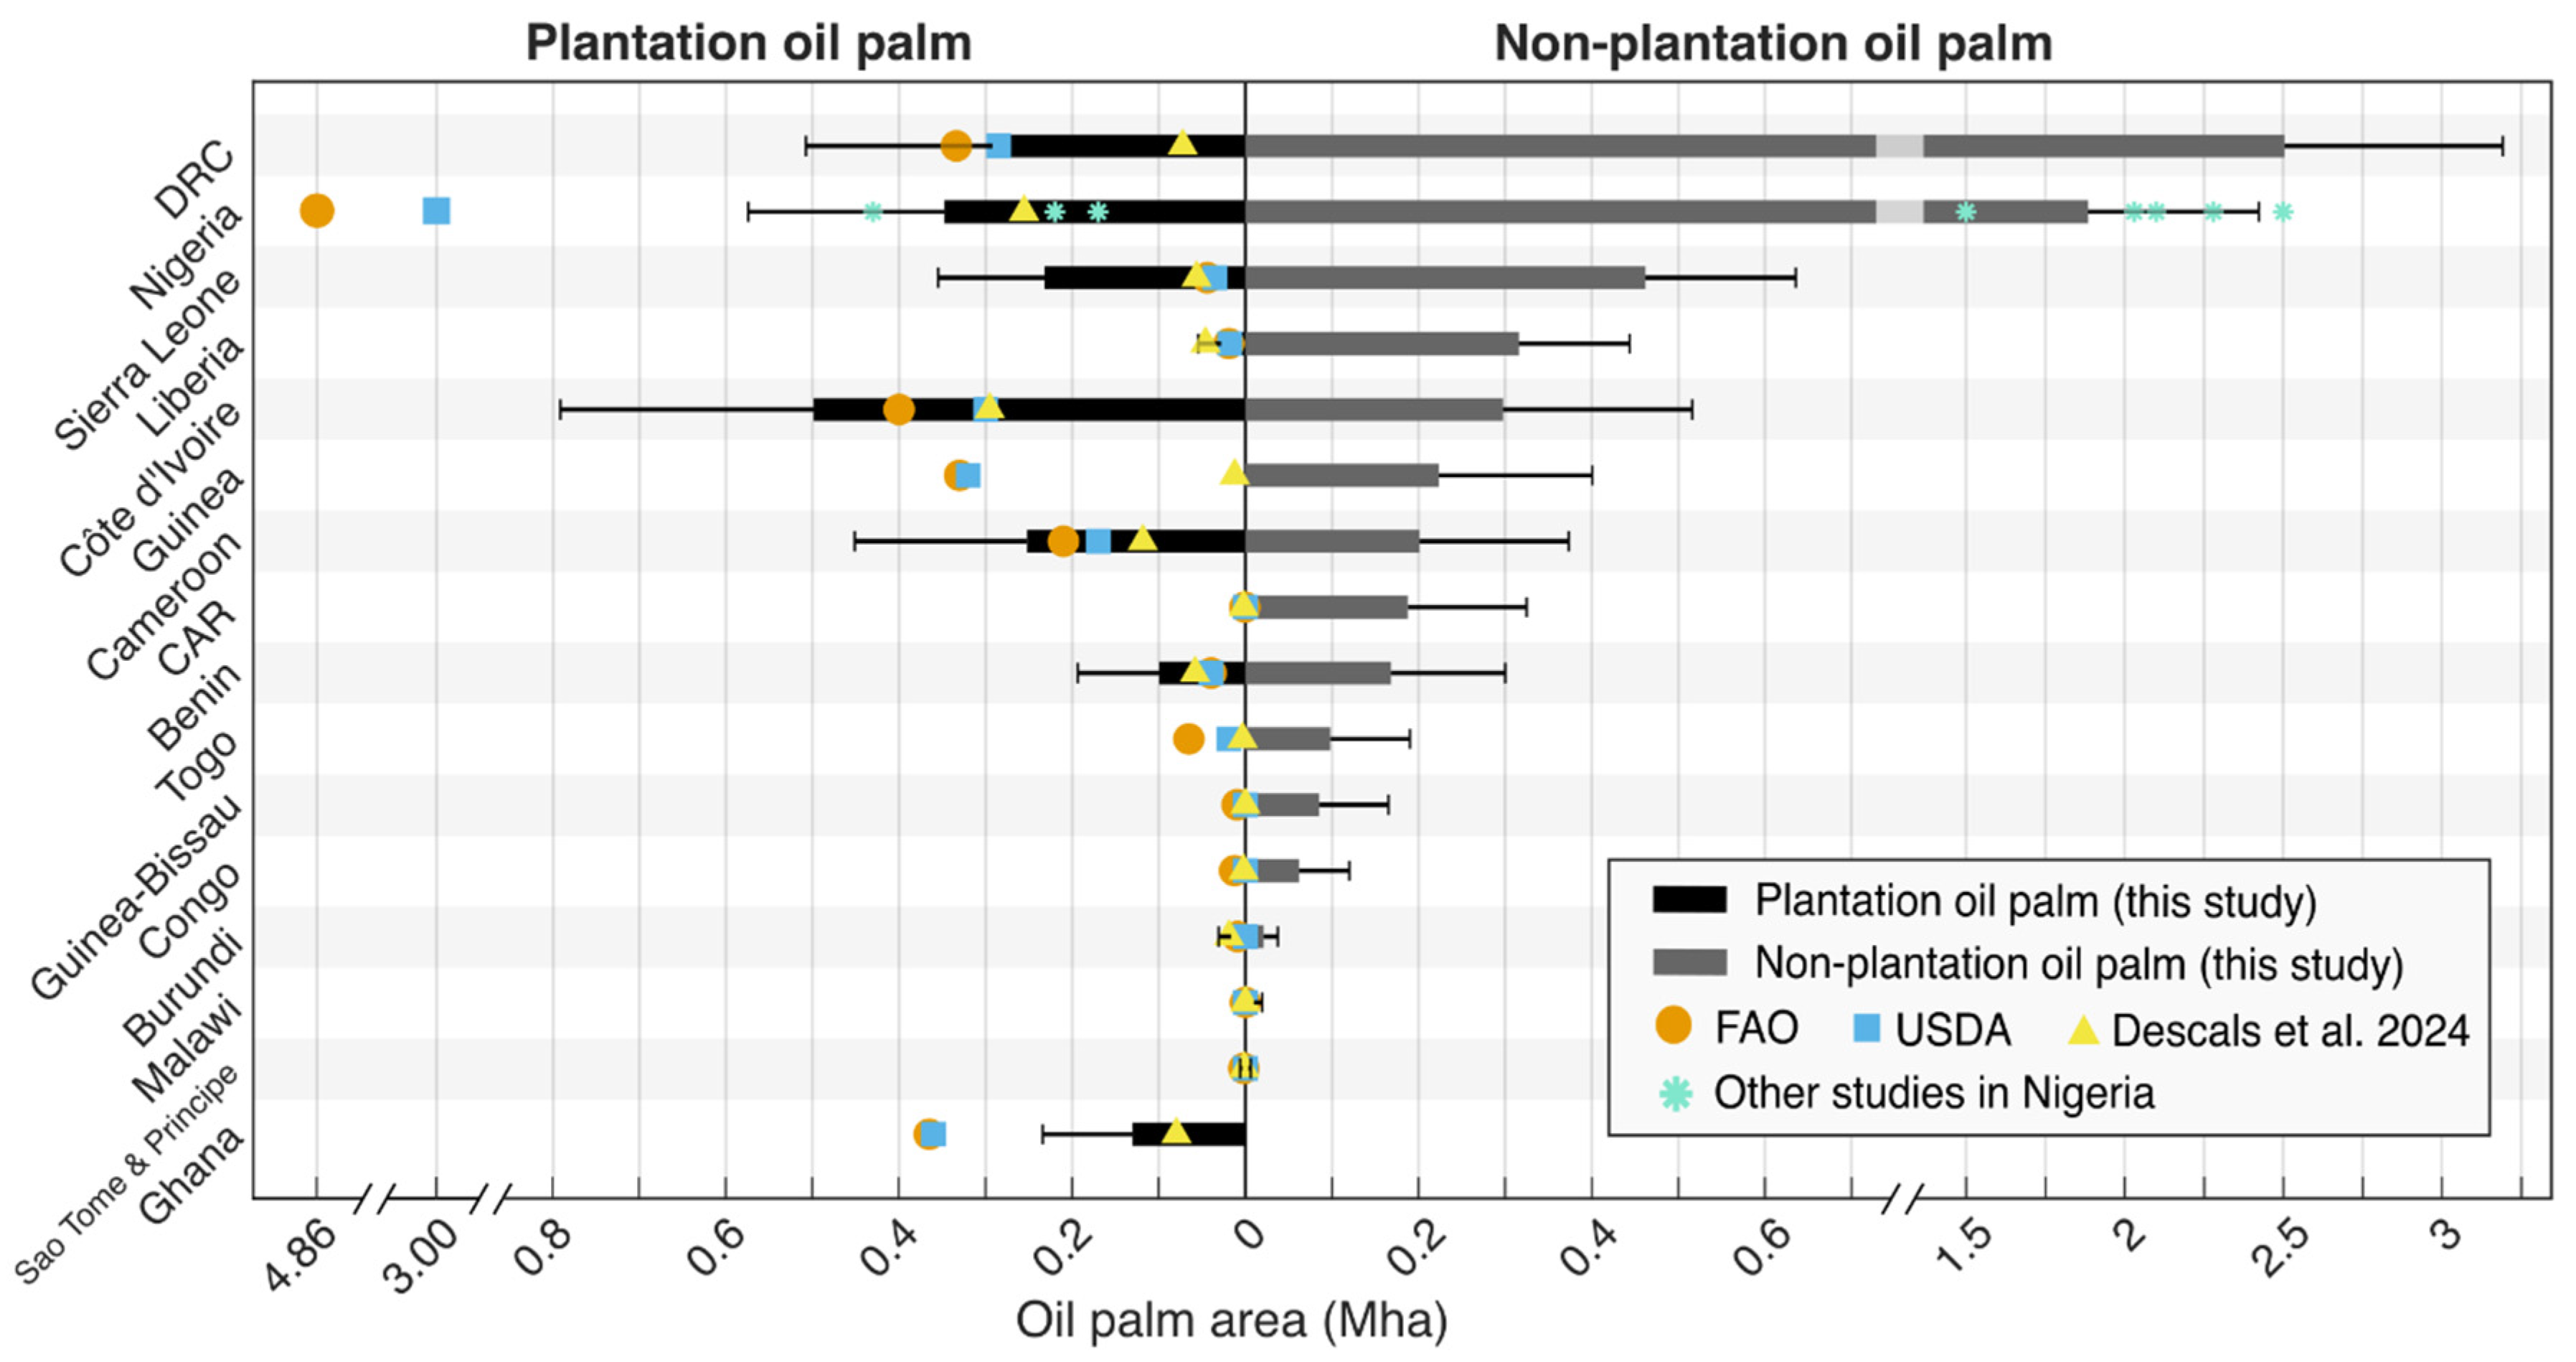
Figure 2.
Spatial distribution of villages with (red circles) and without (blue circles) non-plantation oil palm across the oil palm potential distribution in West and Central Africa.
Figure 2.
Spatial distribution of villages with (red circles) and without (blue circles) non-plantation oil palm across the oil palm potential distribution in West and Central Africa.
Disclaimer/Publisher’s Note: The statements, opinions and data contained in all publications are solely those of the individual author(s) and contributor(s) and not of MDPI and/or the editor(s). MDPI and/or the editor(s) disclaim responsibility for any injury to people or property resulting from any ideas, methods, instructions or products referred to in the content. |
© 2025 by the authors. Licensee MDPI, Basel, Switzerland. This article is an open access article distributed under the terms and conditions of the Creative Commons Attribution (CC BY) license (http://creativecommons.org/licenses/by/4.0/).
Copyright: This open access article is published under a Creative Commons CC BY 4.0 license, which permit the free download, distribution, and reuse, provided that the author and preprint are cited in any reuse.


