
Submitted:
27 November 2025
Posted:
28 November 2025
You are already at the latest version
Abstract
This study identifies the technological signature of ancient and alternative “Chu” and “Kriab” gold glass mosaic mirrors from Thailand. Although these mirrors play an important role in Thai decorative heritage, their production routes and interfacial chemistry at the lead-to-glass interface have remained unclear. A survey of 154 sites across Thailand shows mosaic glass was widely distributed and likely produced during the Ayutthaya period (~300 years ago). PXRF, WD-XRF, SEM, and XPS were used to examine the material properties of observed Chu mirrors. Most samples can be classified as a mixed lead-alkaline glass type, with PbO content ranging from 4.28 to 48.17 wt%. Their yellow tone is controlled by iron and manganese redox states. Chemical and physical analyses distinguish between Chu1 and BKK[7], which share a silica source but rely on different flux, pointing to different glass workshops. Additionally, some Chu and Kriab samples exhibit evidence of potential use of recycled materials. Depth profiling showed that there were lead species at the interface, including PbO4, PbO, and Pb0. The ancient samples had higher Pb0 concentration due to reducing kiln conditions. Silanol groups on the glass surface are identified as the key factor promoting the adhesion of lead coating to the glass surface. Variations in raw materials and coating techniques further differentiate ancient Chu mirrors from modern reproductions. This research offers useful information about the technological ingenuity of ancient artisans and supports the conservation and replication of these culturally significant artifacts. The results contribute to preserving Thailand’s rich heritage in decorative glasswork and lay a foundation for future research into material provenance and historical restoration practices.
Keywords:
lead-coated glass mirrors
; gold glass
; glass mosaic
; glass-to-lead interface
; adhesive bond
; silanol groups
1. Introduction
Thailand, a country with a large Buddhist population, is well-known for its custom of using elaborate, gleaming glass mosaic mirrors to decorate church buildings, temples, shrines, palaces, and other places or artefacts of worship. Although Thailand has evidence of ancient glass technology at the west-central Thailand such as Khao Sam Kaeo and Ban Don Ta Phet sites dating back to the early Southeast Asian Iron Age (4th to 2nd century BCE), most of the artifacts discovered were beads, earrings, and bracelets [1,2]. Another intriguing site is Khlong Thom, where large glass chunks, weighing several kilograms, have been found. These discoveries suggest the possibility of primary glass production at the sites; however, the absence of high-temperature furnace evidence makes it challenging for archaeologists to draw definitive conclusions [3]. Despite the significant discovery of early glass production, there have been no subsequent discoveries of glass production sites from later periods. The limited historical understanding of glass technology in Thailand further complicates efforts to trace the origins of early glass mosaic production, which has been discovered in the country since the late Ayutthaya period.
Our extensive investigations have identified two major groups of glass mosaic mirrors in Thailand: Kriab mirrors, predominantly found in the central regions, and Chu mirrors, more commonly seen in the northern areas, particularly in the old Lanna Kingdom, as illustrated in Figure 1. The majority of these mirrors were constructed from a lead silicate glass composition, with differences in the thickness of the glass and lead layers resulting in the emergence of unique creative morphologies. Kriab mirrors are hard and vibrant, typically cut into small pieces for tessellation in decorative designs. In contrast, Chu mirrors are thinner, easily cut with scissors, and can be bent into curves, making them ideal for inlay art (Figure 2).
Extensive research has been conducted on the first type of these mirrors, known as Kriab [4,5,6,7,8], including a study we previously published [9]. In our earlier work, we analyzed the chemical and mechanical properties of Kriab mirror tesserae and restoration mirrors from the 18th and 19th centuries. Tracing the history of lead-coated glass, leaded convex mirrors first emerged during the Roman Empire (2nd–4th century CE) and later persisted in the Near East. These mirrors appeared in Viking-age Europe by the 9th century [10,11,12], and their technological and historical evolution has been extensively documented. Lead-coated mirrors were also discovered in Islamic Spain from a Murcian workshop (12th century, Spain) [13]. By the Middle Ages, lead-backed glass mirrors with frames made of metal, wood, or ivory became commonplace [14,15]. The process of mirror-making underwent significant innovations during this period. In the 16th century, lead alloys, such as lead-bismuth amalgams, were introduced and later became valued commodities in the New World [16]. The German methods for mirror production played a key role in reviving the craft in Florence during the 16th century [17]. By 1500, tin foil amalgamation began to replace traditional leaded mirrors, and by the 19th century, silvering techniques using silver nitrate became widely adopted [18].
The origins of lead-coated glass mirrors in Thailand remain uncertain. The primary evidence comes from an old book by His Royal Highness Prince Krom Khun Worachak Phalanubhab, titled Tumra Hung Krachok Kriab (Production of Kriab Mirrors). This book suggests that Kriab mirrors might have been produced in royal glass workshops in Bangkok or central Thailand during the early Rattanakosin period or the 18th century [19]. However, the book provides limited details on the production process. Due to Bangkok’s extensive urbanization, no remnants of furnace kilns, glassworking tools, or raw glass fragments have been preserved. Nevertheless, as our research indicates, fragments of lead-coated glass mosaics are still found in numerous artifacts and archaeological sites across Thailand. Chemical analysis of the glass composition remains a valuable method to trace the provenance, understand the production technology, and identify potential locations of these historic glass workshops.
Archaeological evidence indicates that ancient glassmakers predominantly employed a soda-lime mixture in their manufacturing techniques. Silica originated from sand or crushed quartz, whereas soda or potash obtained from plant ash, wood ash or mineral deposits functioned as the fluxing agents in the majority of ancient glassware. These conclusions are derived on chemical analyses and archaeological interpretations. The raw ingredients frequently included lime and other contaminants, resulting in defects in the glass. Moreover, trace quantities of metal oxides, salts, lead, and antimony compounds were intentionally incorporated to alter the color of glass and opacity [20]. These components often displayed considerable contamination owing to their natural sources or the associated production procedures. The interaction of these minor and trace components provides insights into the original formulations and raw ingredients, perhaps resulting in a distinctive “glass fingerprint.” Chemical traces can assist archaeologists in determining whether glass artifacts discovered at a site were locally manufactured or imported via ancient trade networks. Nonetheless, glass recycling complicates the analysis of these results. Similar to metal, glass can be liquefied and recycled, amalgamating components from many origins. The recycling procedure complicates data analysis and restricts conclusive determinations on the origin of archaeological glass.
Through chemical analysis and the careful interpretation of archaeological findings [20,21,22,23,24,25,26,27], it has been established that ancient glass production originated in the Near East during the mid-4th millennium BCE. Early “glassy faïence” techniques gradually evolved into the production of “real glass” around 1600 BCE in Mesopotamia and Egypt [28]. Early glass was made using silica-rich sand or quartz mixed with plant ash or natron as flux, with the addition of lime and metal oxides to enhance stability, color, and opacity. Over time, technological advancements and trade networks gave rise to distinct glass types, including natron soda-lime, plant-ash soda-lime, and mixed soda-potash glasses.
Lead glass production represents a significant technological advancement in early medieval Northwestern Europe, particularly with the emergence of mixed-alkali glass, a blend of wood-ash glass and natron soda-lime glass [30]. Lead was used to improve the properties of silica-based glass, serving as an opacifier, flux, or stabilizer. Historical examples include lead antimonate from 1500 BCE and lead-tin oxide from 200 BCE [31]. Notable uses include lead glass beads in Amenhotep III’s palace (1386–1353 BCE) and Roman-era soda-lead glass [32].
Eastern innovations included Chinese lead-barium-silicate glass and potash-silica glass, distinct to East Asia and spread regionally from the Warring States to the Han Dynasty [33,34]. The low melting point of lead glass (~900 °C) allowed for easier processing compared to wood-ash and soda glasses [35]. In the Carolingian period, high-lead silica glasses and mixed lead-alkaline glasses emerged in Europe, likely derived from lead-silver smelting by-products such as glassy slag [36]. George Ravenscroft [37] revolutionized glassmaking in the 17th and 18th centuries with the invention of English crystal glass, notable for its exceptional purity achieved by increasing PbO content to 34–40%. Its low melting point and superior optical properties made lead glass highly versatile and commercially successful, cementing its importance in the advancement of glassmaking technology.
This research utilized chemical analysis to examine and categorize lead-coated glass mirrors in Thailand. Portable X-Ray Fluorescence (PXRF) and Wavelength-Dispersive XRF (WD-XRF) were employed to analyze the glass layers, while scanning electron microscopy (SEM) and X-ray Photoelectron Spectroscopy (XPS) were used to investigate the lead-metal interface of flexible Chu mirrors, that includes both ancient and alternative specimens. The results demonstrate how useful this research is in creating a database that is open to the public and creating glass prototypes for conservation and restoration projects. In addition to highlighting Thailand’s historical significance as a center of Southeast Asian trade and culture, these technologies allow glass to be distinguished by date and place of origin.
2. Experimental Procedure
2.1. Sample Preparation
In this work, we focused on analyzing the chemical elements in the yellow glass layer, commonly referred to as ‘gold glass’ due to its resemblance to gold when coated with lead. Fragments of a Christmas bauble-shaped gold glass were discovered at the Bonn excavation site in a cremation burial dating back to the early 2nd century [10]. Additional evidence of similar glass has also been found in Germany [38].
Given their gold-like appearance, the Kriab and Chu mirrors, as shown in Figure 3, are classified as ‘gold glass.’ These mirrors have been widely used to adorn various objects and archaeological structures. Their historical significance continues to inspire the use of non-leaded yellow mirrors in upscale buildings, religious architecture, and antique designs across Thailand and neighboring countries.
Each sample was cleaned in deionized (DI) water by immersing it in an ultrasonic bath for two minutes, doing this once to remove the dirt and stain. After 30 minutes of oven drying, the samples were analyzed chemically using the PXRF and WD-XRF methods.
As previously mentioned, the old book Tumra Hung Krachok [19] does not provide details about the glass-blowing or lead-coating techniques required to replicate the production process. Historically, such knowledge was often kept as a family secret. Unfortunately, since the prince did not pass this knowledge on to successors, it was inevitably lost. However, Koch and Sode (2002) [12] reported a lead-coating technique used on large glass globes in Kapadvanj, Gujarat. These Western Indian glassworks are believed to have been made during the Mughal period, approximately 500 years ago. Figure 4 (Past) illustrates the proposed schematic representation of how ancient glass workers crafted the Kriab mirrors.
We speculate that the Thai royal glasshouse may have used a similar technique to produce Kriab mirrors, as Thailand and India have maintained a close relationship for thousands of years. In our previous paper [9], we documented our initial attempt to reproduce these mirrors using a modified tape-casting technique, as traditional glass-blowing with lead-containing glass posed significant health hazards. However, this modified tape-casting method resulted in a dull surface because the hot glass adhered to the metal plate before being coated with liquid lead on the back. Additionally, the glass formula used in our first attempt, which contained high levels of lead and boron to lower the melting point, caused rapid corrosion due to phase separation.
This study explores the adaptation of traditional techniques by modifying the conventional glass-blowing process into a hand-drawing method developed by Mr. Choktavee Piboon, an artisan from the Samart Handcrafted Thin-Glass Workshop in Hang Dong, Chiang Mai, as shown in Figure 2 (Present). In this modified approach, an electric muffle furnace was used to melt 500 grams of glass in an alumina crucible, which was then transferred to a drawing desk for shaping. The resulting drawn glass sheet, measuring approximately 80 cm × 120 cm, exhibited thickness variations ranging from about 0.3 mm at the top to 0.15 mm at the bottom. The glass sheet was subsequently coated with lead using an adapted screen-printing technique.
Preliminary analyses of the yellow glass layers in the ancient gold glass Kriab and Chu samples, which revealed significant variations, facilitated the approximation of a glass formula, as detailed in Table 1. It is important to clarify that the composition presented here is our recent formulation (without boron), which differs from the earlier composition (B2O3 approximately 1.6 wt%) used in the WD-XRF analysis.
The newly developed formula incorporates an optimized lead content and requires a melting temperature of 1400 °C for 2 hours to achieve complete homogenization. All raw materials used in this study were of commercial grade. Figure 5 provides a comparison between the Chu mirror reproduced in this study and its ancient counterpart.
2.2. Chemical Analysis
2.2.1. Wavelength Dispersive Spectroscopy (WDS)
This study utilized a JSM-IT300 Scanning Electron Microscope (SEM), equipped with Lanthanum Hexaboride Cathodes (LaB6) as the electron source, operating in high-vacuum (HV) mode. The instrument provides a resolution of 2.0 nm and an adjustable electron accelerating voltage range of 0.3–30 kV. The microscope is specifically designed for the analysis of materials such as metals, ceramics, polymers, cement, and glass. Sample preparation involved cutting the specimen to a maximum diameter of 4 cm, cleaning it with ethanol, air-drying, mounting it on carbon-taped brass stubs, coating the surface with gold, and performing analysis using both WDS and EDS techniques.
2.2.2. Handheld/Portable X-Ray Fluorescent Spectrometers—PXRF
The elemental compositions of the ancient Chu Mosaic mirrors were analyzed using the Olympus Vanta M Series Handheld X-ray Fluorescence (XRF) Analyzer, which provides a precision of 0.001 wt%. This portable device is well-suited for fieldwork, delivering results comparable to those from laboratory-grade equipment, making it highly versatile across various industries. The XRF technique operates by using primary X-rays to eject inner-shell electrons from atoms, creating vacancies that are filled by outer-shell electrons. This electron transition emits energy as characteristic X-ray radiation, unique to each element, forming an X-ray fluorescence spectrum for elemental identification. The analyzer was equipped with a rhodium X-ray tube and employed dual-beam measurements: a high-energy beam at 40 kV and a low-energy beam at 13 kV, filtered through a 2 mm aluminum filter. Emitted X-rays were captured by a silicon detector, and PyMca software was used to fit the spectra and validate the analysis results, ensuring accurate and reliable measurements.
2.2.3. High-Performance Wavelength Dispersive XRF Spectrometer: WD-XRF
The ancient Chu Mosaic mirrors were analyzed using the S8 TIGER Series 2 Wavelength Dispersive X-ray Fluorescence (WDXRF) system to determine the type and quantity of elements in the samples based on the principles of X-ray fluorescence. This technique employs a wavelength-dispersive mechanism to detect elements ranging from beryllium (Be) to uranium (U) in both solid and liquid samples, with concentrations spanning from percentage levels to trace amounts in parts per million (ppm). The process begins with X-rays generated by the instrument interacting with the sample, inducing fluorescence. The emitted X-rays pass through a collimator to form a parallel beam, which is directed at analyzing crystal within a vacuum spectrometer. The crystal disperses the X-rays by wavelength, and detectors convert the resulting signals into spectra that reveal the elemental composition of the sample. This method provides highly precise and accurate elemental analysis, making it suitable for a wide range of applications.
2.3. Characterization of Glass-Lead Interface
2.3.1. Scanning Electron Microscopy- and Energy Dispersive X-Ray Spectroscopy (SEM- EDS)
The study utilized a scanning electron microscope (SEM) to investigate the morphology and surface characteristics of various materials. A high-resolution SEM (JSM IT800) was employed to characterize the interface of the ancient Chu mirror, with an integrated Energy Dispersive Spectroscopy (EDS) system used to perform X-ray line scans of the lead-glass interface. Additionally, a lower-resolution SEM (JSM IT300) was used to examine the cross-section of the alternative Chu sample.
2.3.2. X-Ray Photoelectron Spectroscopy (XPS)
The ancient Chu mosaic mirror was analyzed using X-ray Photoelectron Spectroscopy (XPS) to determine the chemical composition of the sample’s surface. The analysis was conducted with an XPS instrument (AXIS ULTRA DLD, Kratos Analytical, Manchester, UK) under a base pressure of approximately 1.7 × 10⁻⁹ torr in the analysis chamber. Sample excitation was performed in X-ray hybrid mode with a spot area of 700 × 300 µm, using monochromatic Al Kα1,2 radiation at 1.4 keV. The X-ray anode was operated at 15 kV, 10 mA, and 150 W. Photoelectrons were detected with a hemispherical analyzer positioned at a 90° angle relative to the sample surface. Ion sputtering was conducted with Ar+ ions at 4 keV for 30 seconds, targeting a 2.5 × 2.5 mm area of corrosion.
The spectra were calibrated using the C 1s peak (binding energy = 285 eV) and analyzed with VISION II software from Kratos Analytical Co., Ltd. For XPS analysis, samples were prepared by cutting specimens into sizes ranging from 2 mm to 2 cm in diameter. The thin glass and metal layers were separated using pliers, and the pieces were carefully placed onto aluminum foil. The foil-wrapped samples were promptly transferred to a sealed container filled with silica gel to minimize moisture absorption. The samples were transferred to the vacuum chamber as quickly as possible for analysis. A schematic diagram of the sample preparation process is shown in Figure 6.
3. Results and Discussion
3.1. Chemical Analysis of Yellow Glass Layers
Some samples are available in restricted quantities, and the glass layers of the Chu and Kriab samples are extremely thin. Consequently, in order to get accurate information on the composition of glass, a thorough chemical study is necessary. Wavelength Dispersive Spectroscopy (WDS) was initially utilized to evaluate several Kriab and Chu materials. Interestingly, the glass layer was found to have a significant boron (B) content. Nonetheless, given that WDS is recognized for delivering semi-quantitative point analysis and only three points were examined in each glass layer, more validation was considered essential.
We utilized a High-Performance WD-XRF instrument to test a prepared lead borosilicate glass sample (1.6 wt% B2O3) to validate the presence of boron. The findings demonstrated that boron oxide content was detectable only when a minimum of 4 g of ground powder was examined, producing amounts that closely corresponded to the prepared batch glass. Nevertheless, the examination of a thin glass sheet (about 0.17–0.2 mm in thickness) composed of the same lead borosilicate glass revealed no apparent presence of boron oxide. Therefore, further high-precision analyses, such Laser Ablation Inductively Coupled Plasma Mass Spectrometry (LA-ICP-MS) with suitable standards, are necessary for a more comprehensive examination. In this study, we utilized WD-XRF to perform chemical analyses of the glass layers in the selected Chu and Kriab mirror samples, the results of which will be discussed later.
The key components in the yellow glass layers of chosen Chu and Kriab samples, such as silicon (Si), lead (Pb), calcium (Ca), potassium (K), and aluminum (Al), were also examined through portable X-ray fluorescence (PXRF), as detailed in Table 2. Due to the limitations of the PXRF device, detection of sodium (Na) and other light elements, such as boron (B), was not feasible. Additional minor elements were identified, showing differences in both type and concentration.
Iron (Fe) and manganese (Mn) are minor elements that significantly influence the yellow hue of glass layers. Conventionally, oxidized Fe3+ ions are thought to contribute to a pale-yellow color, whereas reduced Fe2+ ions are thought to give a blue-green color [7]. Figure 3 illustrates that, in spite of a high lead level, the deepest yellow hue was not seen in the sample SoKhla15, which had the greatest Fe concentration. This discrepancy may be due to a low concentration of Mn.
The yellow coloration of glass is significantly influenced by the redox conditions present during the glass melting process and within the furnace, which affect the retention of Fe3+ ions that contribute to this hue. Moreover, Mn4+ and Mn3+ function as oxidizing agents within the glass melt, promoting the oxidation of Fe2+ to Fe3+. The incorporation of suitable quantities of MnO2 into the glass melt can effectively regulate the yellow coloration. Generation after generation of glassmakers have inherited this complex understanding of redox regulation and the function of Mn.
Table 3 presents the chemical composition (wt%) of the “gold glass” layers from Chu and Kriab mirrors, analyzed using the WD-XRF technique on the yellow glass surface. The historical age of the samples was determined based on treatment histories, comprehensive examination data from the Fine Arts Department, and relevant archival documents. While the Kriab and Chu samples are broadly dated to the 18th–20th centuries, the precise age of these mirrors remains inconclusive.
By examining the weight proportions of major and minor composition, including Al2O3, CaO, PbO, Na2O, K2O, and MgO, in the yellow glass layers, a deeper understanding of their material composition was obtained, as illustrated in Figure 7. Previous findings on the yellow glass of Kriab [7] and Chu [8], gathered from various sources, were also plotted, providing insights into the origins of the raw materials and their connections to historical glass production practices.
The findings revealed that the glass compositions employed in manufacture of these mirrors were primarily lead-silicate-based, as established by WD-XRF analysis. The lead oxide (PbO) concentration in the lead-silicate glass samples exhibited considerable variation, spanning from 4.28% to 48.17% by weight. This variety probably indicates disparities in manufacturing procedures or provenance of raw materials.
The yellow glass of the mirror samples is primarily composed of silica, the main raw material for glass production, as demonstrated in the CaO-Al2O3 relationship graph (Figure 7(a)). This plot is typically used to trace the provenance of the silica source used in producing the yellow glass layer of the examined mirrors. The data reveal that most of the glass samples utilized silica with a wide distribution of CaO (2–12 wt%) and Al2O3 (1–4.2 wt%). A few samples, including PheRi3, NAN1, and CM1, deviate from the main group.
Interestingly, a significant cluster of Kriab and Chu samples aligns within the same group, specifically encompassing CaO concentrations of 5–12 wt% and Al2O3 concentrations of 2.5–4.2 wt%, suggesting a common silica source. However, the PbO-K2O relationship (Figure 7(b)) indicates some divergence among the samples, with only the main Chu Lanna and certain Kriab BKK [7] samples remaining in the group. These samples are characterized by low PbO levels, not exceeding 10 wt%.
The other two relationships, K2O-MgO and Na2O-K2O (Figure 7(c) and 7(d)), further support the distinct clustering of the Chu1 group. Notably, the K2O-MgO plot suggests the use of wood ash from a consistent provenance. The inset of the Chu1 samples highlights their morphology, confirming that all originate from the Lanna area. TAK5, however, is excluded from the group due to its distinct morphology, which differs significantly from the others and will be discussed further. Additionally, CM [8], previously reported as “gold glass” Chu from the Lanna region, also aligns within the Chu1 group.
It is important to note that three fundamental components are required to produce glass: calcium, silica, and an alkaline flux. Common sources of alkaline flux include wood ash, plant ash, and natron. Silica is typically derived from sand, while calcium is obtained from shell fragments within the sand or from calcium compounds present in plant or wood ash. For high-lead glasses, analyzing the ratios of minor impurities, such as Fe2O3 and TiO2, typically found in silica sand, alongside the primary components SiO2, Al2O3, and CaO, provides an alternative and equally valid method for investigating provenance. This approach is illustrated in Figure 8 and Figure 9 and offers valuable insights into their origins [39].
As shown in Figure 8, TAK5 deviates from the Chu1 group due to its higher concentrations of CaO and Na2O compared to the other samples. This variation suggests that TAK5 may represent a recycled material. Another potential instance of recycling is BKK [7] sample 1, which slightly deviates from the group of Kriab samples (BKK [7] 2–4) collected from the Temple of the Emerald Buddha in Bangkok. Although Chu1 and BKK [7] may share a similar source of silica, differences in the flux source, particularly the potash source (Figure 7(c)), further distinguish them. Notably, all BKK [7] samples lack detectable amounts of MgO, separating them into a distinct group based on flux composition. However, further investigation using additional trace element analysis is necessary to confirm this hypothesis in future research.
Utilizing Ti impurities in the silica source, a plot of Fe2O3/TiO2 and Fe2O3/Al2O3 ratios (Figure 9) confirms a shared provenance of silica between the Chu1 group and BKK [7] Kriab samples, particularly for samples with low Fe2O3 content (samples 3 and 4). In contrast, BKK [7] samples 1 and 2 exhibit the highest Fe2O3 content, likely due to intentional additions aimed at enhancing the yellow hue of the glass. Other distinct deviations are observed in alternative materials, such as modern commercial-grade sand and CM [8], which employed low-precision chemical analysis techniques.
Other ancient samples, including BKK2, Autt1, and the oldest sample in this study, PheRi4# (all Kriab), are excluded from this plot due to the absence of detectable TiO2. These Kriab samples may share the same provenance or have been produced using similar technology. However, based on the K2O and MgO plot in Figure 7(c), BKK2 and Autt1 are closely grouped, while PheRi4# is distinct, characterized by a higher concentration of MgO compared to the other two Kriab samples. This observation aligns well with the dating of PheRi4#, which is the oldest sample, from the late Ayutthaya period. In contrast, BKK2 and Autt1 date to the early Rattanakosin period, approximately 140 years later.
Interestingly, the physical appearances of Autt1 and BKK2 differ significantly. Autt1 exhibits a darker surface, which may be attributed to a small amount of Cd detected in this sample, as shown by the PXRF results in Table 1. Alternatively, the dark appearance could result from corrosion caused by prolonged flooding, as the Kriab mirror containing Autt1 was recovered from a temple in Ayutthaya that had experienced severe flooding.
The Chu1 group predominantly dates to the 20th century, with the exception of CM2, which is dated to approximately the 19th century. This finding is particularly significant when compared to the BKK [7] samples, which are dated to the 19th century, possibly during the major restoration under King Rama II. It is plausible that either sand or raw glass from the same provenance was used in their production.
Most of the yellow glass layers we observed belong to the group of mixed lead-alkaline glass or wood-ash lead glass, based on analysis and comparison with other ancient glass compositions [20,35]. This type of glass was initially produced in Eastern Europe during the 13th century. However, its origin remains uncertain, as glass with a similar composition has also been discovered in Thailand from the 18-20th century, several centuries after its first known production.
Although evidence of the Royal glass workshops primarily exists in old records, no detailed information about glass kilns or raw glass production has been preserved. It can be hypothesized that much of the Kriab glass found in central Thailand during the Early Rattanakosin era (around the 19th century) may have been produced in the Royal glass workshops, even though strong evidence to confirm this remains lacking. Chu1, which shares the same silica source as BKK [7], could potentially have some connection to the Royal glass workshops. However, the wood ash flux appears to have originated from a different source, and the physical characteristics of Kriab and Chu glass are notably different.
It is likely that glass craftsmen of this period employed similar technologies and glass recipes but operated independent workshops, leading to the development of unique and innovative techniques for producing a diverse range of glass mirrors. To explore this concept further, additional research involving trace element analysis, lead isotope analysis, and extensive archaeological evidence is necessary.
3.2. Microstructural Analysis at the Glass-Lead Interface
As previously mentioned, the WDS technique was initially employed to preliminarily investigate the glass-lead interface of the surveyed ancient lead-coated glass mosaic samples. Chemical analysis was performed on several examples, revealing a notably high concentration of B2O3. Table 4 presents an example of the chemical composition of the yellow glass layer in the CM1 sample.
The observed high concentration of B2O3 is attributed to the use of an inappropriate standard (pure boron) and the inherent limitation of WDS to point analysis. Furthermore, the ancient glass layer exhibits considerable heterogeneity. In contrast, the results from WD-XRF, which utilize bulk analysis of the Chu mirror surface rather than the cross-section analyzed by WDS, differ not only in concentration but also in the detection of additional components. The quantitative analysis using WD-XRF was further enhanced by the use of precise borosilicate glass standards.
The WD-XRF analysis of the CM1 yellow glass layer shows no detectable trace of B2O3, likely due to the very thin glass sheet used, as previously mentioned. However, the presence of Cl detected by WDS may be attributed to weathering, which WD-XRF was unable to detect. Additionally, the composition derived from WDS falls within the PbO- B2O3-SiO2 glass system, known to have a large immiscibility region leading to phase separation [9,41]. This characteristic results in reduced weathering resistance of the glass, a factor that must be considered in efforts to reproduce this ancient material. To confirm the presence of boron in the ancient glass, more precise chemical analysis techniques, such as LA-ICP-MS, may be required.
The cross-sectional examination of the ancient Chu mirror (CM1) at the lead-glass interface was performed using a scanning electron microscope (SEM) equipped with a backscattered electron detector. Micrographs of two fracture areas from the same sample are shown in Figure 10 (a) and (b). The sample was cut with scissors, and the splice in Figure 10 (a) appears straight, with no visible separation between the glass and lead. However, signs of heterogeneity in the glass matrix, evident throughout the examined areas, may have been caused by residual lead substrate introduced during scissor cutting or by intrinsic heterogeneity in the glass matrix itself. To address this issue, proper polishing and careful sample preparation should be employed in future investigations.
In contrast, the area shown in Figure 10 (b) revealed regions where separation between the glass and lead occurred. Uneven bonding of the lead was also observed, with some sections tearing off while others remained securely adhered, even to the extent that the scissors cut through them. This uneven adhesion between the lead and glass may be attributed to the glass coating process used by ancient craftsmen, who likely encountered challenges in controlling the factors necessary for achieving a uniform coating across the entire glass sheet. Variations in heat application or the presence of contaminants, such as dirt or newly formed oxide layers on the glass surface, could have contributed to these irregularities in adhesion.
To preliminarily examine the chemical characteristics of the interface in the Chu mirror sample, an X-ray line scan was conducted, and the results are shown in Figure 11. Despite the use of high-resolution SEM, distinguishing the size of the interface layer proved challenging. The drop in the signal observed around 40–50 µm appears to be caused by a microcrack. Further analysis using XPS was performed on the same sample, as will be discussed in the next section.
Figure 12 shows an example of the cross-section of the alternative Chu sample (1.6 wt% B2O3). The scissor-cutting technique was used for sample preparation without subsequent polishing. The interface appears smooth and straight, with some evidence of cracks at the interface, suggesting that the adhesion between the glass and lead layers is quite robust. Using image analysis software, the thickness of the glass layer and lead layer was measured to be approximately 295.8 µm and 82.79 µm, respectively. This indicates that with a well-controlled coating technique, strong adhesion between the glass and lead layers can be achieved.
3.3. Depth Profile Analysis of Glass and Lead Interfacial Surfaces by XPS
To investigate the lead-glass interface in Chu mirror samples, both ancient and alternative Chu mirrors were analyzed using XPS. The interface and depth profiling results are illustrated in Figure 13. The binding energy of Pb7/2 photoelectrons, as listed in Table 3, provides insight into the chemical state of lead from the surface to an examined depth of approximately 10 nm. The binding energy at 137.8–138.3 eV corresponds to PbO4 units or pyramids forming polymer chains with the SiO4 network. PbO at 136.3–137.0 eV likely represents PbO or PbO2, while Pb-O species in high-lead silicate glass are associated [42,43]. Binding energies between 138.2 and 138.8 eV correspond to Pb(OH)2, and those at 137.0–136.3 eV are associated with Pb0.
PbOx (x ~ 1) species were observed from the start of the surface analysis in all samples. This can be attributed to hot lead coating, which causes lead atoms to diffuse into the glass surface to a certain depth, subsequently oxidizing with air to form PbO. Both the glass sides of the ancient and alternative Chu samples contained significant amounts of PbOx (x~ 1) up to a depth of 10 nm. On the opposite lead side of the ancient Chu sample, a similarly high amount of PbOx (x~ 1) was observed, comparable to its glass side counterpart. However, in the alternative Chu sample, the lead side showed a shallow penetration depth of approximately 1.2 nm, with no detectable presence of PbOx (x~ 1) beyond this depth.
The PbOx (x ~ 4) species, representing a four-oxygen bonded lead structure known as a PbO4 unit or PbO4 pyramid, have been identified. Research has shown that when the lead content in the PbO-SiO2 system exceeds 40% by weight, PbO4 pyramids form polymer chains interconnected with the SiO4 tetrahedral network structure [42,43]. Conversely, the one-oxygen lead species (Pb-O), typically associated with PbO4 pyramidal polymer chains in high-lead silicate glass, are more likely represented by x = 1 rather than 2 [43,44]. These Pb-O species were only detected on the glass side of the ancient Chu mirror and not in the alternative version. This aligns with the PbO content in the glass layers: the ancient Chu (CM1) contains 32.24 wt% PbO, significantly higher than the 17.3 wt% in the alternative Chu (Table 1: batch composition). Further detailed structural analysis of this glass is recommended for deeper insights.
The Pb0 species were first detected at an approximate depth of 5 nm from the surface on the glass side of both ancient and alternative Chu mirrors, with a greater and increasing concentration observed in the ancient mirror. This difference can be attributed to variations in the PbO content of the glass composition. Such a phenomenon is commonly observed in lead silicate glass with high lead oxide content. These photoelectrons may originate from self-bonded Pb-Pb interactions, potentially associated with PbO4 pyramidal polymer chains within the PbO-SiO2 glass system, as noted by Morikawa et al. [43] and Khanna et al. [44]. Alternatively, they may arise from isolated Pb atoms formed during the reduction of PbO in the melting process. The higher concentration of these species in the ancient Chu mirror may be linked to the use of a reducing atmosphere in ancient firing kilns.
Notably, PbO4 species were detected on the lead sides of both ancient and alternative Chu mirrors, with higher amounts observed in the alternative mirror compared to the ancient one. This difference may be attributed to variations in the lead raw materials used for coating. In our research, artisans repeatedly melted lead in a pan to save costs, which may have allowed PbO4 to form over time. Based on our experience, freshly melted lead consistently produces superior coating results. Differences in coating techniques also contribute to this variation. Ancient craftsmen likely coated hot blown glass globes, a process that naturally minimized oxidation by preventing external air from entering the globe due to the rising hot air. This method provided an inherent advantage to the ancient coating process. In contrast, the alternative mirror, made by drawing glass sheets, was inevitably exposed to ambient air containing oxygen. This exposure increased the likelihood of oxidation during lead coating, potentially resulting in the formation of various oxidized lead species at the interface.

Table 5.
Binding energies of Pb7/2 peaks corresponding to different chemical states of thin yellow glass and lead side of the analyzed Chu mirror samples.
Table 5.
Binding energies of Pb7/2 peaks corresponding to different chemical states of thin yellow glass and lead side of the analyzed Chu mirror samples.
| Chemical state | Binding energies of Pb (eV) Pb7/2 Peaks |
|---|---|
| PbO4 | 137.8-138.3 |
| Pb0 | 136.3-137.0 |
| PbO | 138.6-139.1 |
| Pb (OH)2 | 138.2-138.8 |
The most intriguing aspect of the XPS results is the detection of Pb(OH)2 species with a thickness of approximately 3.4 nm, which is remarkably consistent in both ancient and alternative Chu mirrors. This finding underscores a distinct chemical interaction at the interface. According to previous works [45,46], silica glass surfaces can form silanol linkages, in both hydrogen-bonded silanol and free silanol groups. The latter type is more susceptible to with other atoms or molecules. These silanol groups function as active adsorption sites, with their quantity and specific characteristics influenced by various factors, such as temperature, impurities, and defects in the glass surface structure.
The most intriguing aspect of the XPS results is the detection of Pb(OH)2 species with a thickness of approximately 3.4 nm, which remains remarkably consistent in both ancient and alternative Chu mirrors. This finding highlights a distinct chemical interaction at the interface. Previous studies [45,46] suggest that silica glass surfaces can form silanol linkages, including both hydrogen-bonded and free silanol groups. The latter type is more reactive and readily interacts with other atoms or molecules. These silanol groups serve as active adsorption sites, with their quantity and specific characteristics influenced by various factors such as temperature, impurities, and structural defects in the glass surface.
This finding underscores the importance of precise control over coating conditions, as these interfacial phenomena are critical to the long-term durability and adhesion of the lead layer. Future studies comparing historical and modern coating techniques could provide valuable insights into optimizing restoration practices while preserving the authenticity of ancient artifacts.
Conclusions
With a focus on their distinctive “gold glass” qualities and lead-coated surfaces, this study offers a thorough chemical and structural analysis of both ancient and alternative Chu mirrors. With lead oxide (PbO) content ranging from 4.28 to 48.17 wt%, chemical tests employing methods including PXRF, WD-XRF, SEM, and XPS showed that the mirrors were primarily made of mixed lead-alkaline glass type. The yellow coloration of the glass was significantly affected by iron oxide (Fe2O3) and manganese (MnO), with redox conditions during production being a critical factor. The analysis identified distinct material compositions, including wood-ash lead glass in certain samples, which underscores shared silica sources while revealing variations in fluxes and production methods.
At the interface, PbOx (x ~ 4), Pb-O, and Pb0 species were identified, influencing the structural and adhesive characteristics of the mirrors. The ancient Chu mirrors exhibited elevated concentrations of Pb0 species, likely attributable to the reducing kiln atmosphere employed during their manufacture. The presence of silanol groups on the glass surface enhances bonding with lead, highlighting the importance of surface chemistry in the adhesion mechanism.
These discoveries highlight how technologically advanced ancient glassmakers were, especially in their capacity to control materials and procedures to produce desired results. This research enhances knowledge of the chemical composition, production techniques, and bonding mechanisms of these mirrors, offering important insights for their conservation, restoration, and reproduction as culturally significant artifacts. Further research into the origins of raw materials and the improvement of replication techniques will help to preserve this distinctive glassmaking tradition.
Acknowledgments
This work was supported by two main funding sources. The first was the National Research Council of Thailand (NRCT) through the project titled “Materials Characterization of Ancient Thai Mirrors and Fabrication of Lead-Free Prototypes” (NRCT5-RSA63004-01). The second source of funding was the Ministry of Higher Education, Science, Research, and Innovation, through the project titled “Ancient Mosaic Mirror Survey and Glass Mirror Work for Use in Architecture and Arts in the Suvarnabhumi Region.” Additional support for this research was provided by Center of Excellence in Materials Science and Technology and Chiang Mai University. We would like to extend our sincere gratitude to the staff of the Synchrotron Light Research Institute (SLRI), Thailand, for their assistance with XRF measurements; the staff of the Department of Science Service for their support with WD-XRF measurements; the staff of the Center of Excellence in Physics for their expertise and assistance with XPS analysis; and the staff of the Advanced Scientific Instrumentation Unit, Faculty of Science, Chiang Mai University, for their help with WDS and SEM-EDS analyses.
References
- Bellina-Pryce, B., Silapanth, P., 2006. Weaving cultural identities on trans-Asiatic networks: Upper Thai-Malay Peninsula - an early socio-political landscape. Bulletin de l’École française d’Extrême-Orient. 93, 257-293. Available online: https://www.jstor.org/stable/43734048.
- Glover, I.C., 1990. Early trade between India and Southeast Asia– A Link in the Development of a World Trading System, Occasional Paper 16 (2nd ed.), University of Hull Centre for South-East Asian Studies, Hull, pp. 1-45.
- Lankton, J.W., Dussubieux, L., 2013. Early glass in southeast Asia. in Janssens, K. (ed.) Modern Methods for Analysing Archaeological and Historical Glass, John Wiley & Sons, New York, pp. 415-443. [CrossRef]
- Won-in, K., Thongkam, Y., Pongkrapan, S., Intarasiri, S., Thongleurm, C., Kamwanna, T., Leelawathanasuk, T., Dararutana, P., 2011. Raman spectroscopic study on archaeological glasses in Thailand: ancient Thai glass. Spectrochim. Acta - A: Mol. Biomol. Spectrosc. 83 (1), 231-235. [CrossRef]
- Won-In, K., Dararutana, P., 2018. Elemental distribution of the greenish-Thai decorative glass. J Phys.: Conf. Ser. 1082, 012084. [CrossRef]
- Klysubun, W., Hauzenberger, C. A., Ravel, B., Klysubun, P., Huang, Y., Wongtepa, W., & Sombunchoo, P., 2015. Understanding the blue color in antique mosaic mirrored glass from the Temple of the Emerald Buddha, Thailand. X-Ray Spectrom. 44 (3), 116-123. [CrossRef]
- Klysubun, W., Ravel, B., Klysubun, P., Sombunchoo, P., Deenan, W., 2013. Characterization of yellow and colorless decorative glasses from the Temple of the Emerald Buddha, Bangkok, Thailand. Appl Phys A. 111 (3), 775-782. [CrossRef]
- Ravel, B., Carr, G., Hauzenberger, C.A., Klysubun, W., 2015. X-ray and optical spectroscopic study of the coloration of red glass used in 19th century decorative mosaics at the Temple of the Emerald Buddha. J. Cult. Herit. 16, 315-321. [CrossRef]
- Ounjaijom, T., Intawin, P., Kraipok, A., et al. 2023. Chemical and Mechanical Characterization of the Alternative Kriab-Mirror Tesserae for Restoration of 18th to 19th-Century Mosaics (Thailand). Materials 2023. 16 (9), 3321. [CrossRef]
- Eggert, G., Andrea, A. F., Mirrored with molten lead: Convex mirror glass through the ages. In Working Towards a Sustainable Past. ICOM-CC 20th Triennial Conference Preprints, Valencia, 18-22 September 2023, ed. J. Bridgland. Paris: International Council of Museums.
- Keller, D., 2006. Antikes Glas. By Axel von Saldern. 250mm. Pp xxv + 708, ills. Munich: C H Beck, 2004. The Antiquaries Journal. 86, 427 - 428. [CrossRef]
- Kock, J., Sode, T., 2002. Medieval glass mirrors in Southern Scandinavia and their technique, as still practiced in India. Journal of Glass Studies. 44, 79-94. https://www.jstor.org/stable/24190873.
- Carmona, N., Villegas, M.A., Jiménez, P., Navarro, J., García-Heras, M., 2009. Islamic glasses from Al-Andalus. Characterisation of materials from a Murcian workshop (12th century AD, Spain). Journal of Cultural Heritage. 10 (3), 439-445. [CrossRef]
- Krueger, I., 1990. Glasspiegel im Mittelalter - Fakten. Funde Fragen. Bonner Jahrbücher. 233-313. [CrossRef]
- Krueger, I., 1995. Glasspiegel im Mittelalter II - Neue Funde und neue Fragen. Bonner Jahrbücher. 209-248. [CrossRef]
- Ostapkowicz, J., 2013. ‘Made … with admirable artistry’: The context, manufacture and history of a Taíno belt. The Antiquaries Journal. 93, 287-317. [CrossRef]
- Ilardi, V., 2007. Renaissance vision from spectacles to telescopes. American Philosophical Society. 259, pp. 378.
- Liebig, J., 1856. Ueber Versilberung und Vergoldung von Glas. Justus Liebigs Annalen der Chemie. 98 (1), 132-139. [CrossRef]
- D-Library|National Library of Thailand. Available online: http://164.115.27.97/digital/items/show/4961 (accessed on 10 December 2024).
- Gratuze, B., 2013. Provenance Analysis of Glass Artefacts, in Janssens, K. (ed.) Modern Methods for Analysing Archaeological and Historical Glass, John Wiley & Sons, New York, pp. 312-343. [CrossRef]
- Billaud, Y., Gratuze, B., 2002. Les perles en verre et en faïence de la Protohistoire française. Matériaux, Productions, Circulations du Néolithique à l’Âge du bronze. Errance, Paris, pp. 193-212.
- Sayre, E.V., 1964. Some ancient glass specimens with composition of particular archaeological significance. Brookhaven National Laboratory B.N.L., 879, (T-534). Upton, New-York.
- Lilyquist, C., Brill, R. H., Wypyski, M. T., 1993. Studies in early Egyptian glass. Metropolitan Museum of Art, New York, pp. 1-80.
- Barrera, J., Velde, B., 1989. A study of French medieval glass composition. Journal of glass studies. 31, 48-54. https://www.jstor.org/stable/24190095.
- Henderson, J., 1988. Electron probe microanalysis of mixed-alkali glasses. Archaeometry. 30 (1), 77-91. [CrossRef]
- Hartmann, G., Kappel, I., Grote, K., Arndt, B., 1997. Chemistry and technology of prehistoric glass from Lower Saxony and Hesse. Journal of Archaeological Science. 24 (6), 547-559. [CrossRef]
- Brill, R. H., 1992. Chemical analysis of some glass from Frattesina. Journal of Glass Studies. 34, 11-22. https://www.jstor.org/stable/24190975.
- Shortland, A. J., Tite, M. S., 1998. The interdependence of glass and vitreous faience production at Amarna. in Ceramics and Civilization, 8 (eds P. McCray and W.D. Kingery), American Ceramic Society, Westerville, Ohio, pp. 251-265.
- Francis, P. Jr., 2002. Asia’s Maritime Bead Trade. 300 B.C. to the Present., University of Hawai’i Press, Honolulu.
- Sablerolles, Y., Henderson, J., Dijkmann, W., 1997. Early medieval glass bead making in Maastricht (Jodenstraat 30), the Netherlands: an archaeological and scientific investigation. in Perlen Archäologie, Techniken, Analysen (eds. U. von Freeden and A. Wieczorek), Habelt, Bonn (DEU), Germany, pp. 293-313.
- Tite, M., Pradell, T., Shortland, A., 2008. Discovery, production and use of thin-based opacifiers in glasses, enamels and glazes from the late iron age onwards: a reassessment, Archaeometry. 50 (1), 67-84. [CrossRef]
- Brill, R. H., 1999, Chemical Analyses of Early Glasses, The Corning Museum of Glass, New York.
- Fuxi, G., 2009. Origin and Evolution of Ancient Chinese Glass, Ancient Glass Research along the Silk Road (eds G. Fuxi, R.H. Brill and T. Shouyun), World Scientific Publ., New Jersey. pp. 1-40.
- Koezuka, T., 1997. Scientific study of evolution of ancient glasses found in Japan. Ph.D. Thesis, Tokyo University of the Arts (in Japanese).
- Mecking, O., 2013. Medieval lead glass in central Europe. Archaeometry. 55 (4), 640-662. [CrossRef]
- Téreygeol, F., Gratuze, B., Foy, D., Lancelot, J., 2004. Les scories de plomb argentifère: une source d’innovation technique carolingienne?. Cahiers d’histoire et de philosophie des sciences (eds N. Coquery, L. Hilaire-Perez, L. Sallmann and C.Verna), ENS e’ditions, SFHST, 52, 31-40.
- Brain, C., Brain, S., 2003. John Greene’s Glass Designs 1667-167. Annales du 16e Congres de l’Association Internationale pour l’Histoire du Verre, 263-266.
- Follmann-Schultz, A.-B., 1988. Die römischen Gläser aus Bonn. Köln: Rheinland-Verlag. 46.
- H. Ma, J. Henderson, Y. Sablerolles, S. Chenery and J. Evans. 2023. Early medieval glass production in the Netherlands: a chemical and isotopic investigation, Cultural Heritage Agency of the Netherlands, Amersfoort, 191.
- Bellina-Pryce, B. and Silapanth, P. 2006, Weaving cultural identities on trans-Asiatic networks: Upper Thai-Malay Peninsula - an early socio-political landscape. Bulletin de l’Ecole Franc¸aise d’Extrˆeme-Orient, 93, 257-293.
- T. Palomar, J. Mosa, M. Aparicio. 2020, Hydrolytic resistance of K2O–PbO–SiO2, glasses in aqueous and high-humidity environments. J. Am. Ceram. Soc. 103, 5248–5258. [CrossRef]
- P.W. Wang and L. Zhang. 1996, Structural role of lead in lead silicate glasses derived from XPS spectra, J. Non. Cryst. Solids. 1996, 194, 129-134. [CrossRef]
- H. Morikawa, Y. Takagi, H. Ohno. 1982, Structural Analysis of 2PbO·SiO2 glass, J, Non. Cryst. Solids. 53, 173-182. [CrossRef]
- A. Khanna, A. Saini, B. Chen, F. Gonzalez, B. Ortiz. 2014, Structural characterization of PbO–B2O3–SiO2, Phys. Chem. Glasses: Eur. J. Glass Sci. Technol. B, 55 (2), 65–73.
- M.L. Hair. 1975, Hydroxyl Groups on Silica Surface, J, Non. Cryst. Solids., 19, 299-309. [CrossRef]
- W.J. Eakins. 1968, Silanol Groups on Silica and Their Reactions with Trimethyl Chlorosilane and Trimethysilanol, I&EC Product Research and Development, 7 (1), 39-43. [CrossRef]
Figure 1.
GPS coordinates of locations where Kriab and Chu Mirrors were discovered in Thailand and a few in neighboring countries.
Figure 1.
GPS coordinates of locations where Kriab and Chu Mirrors were discovered in Thailand and a few in neighboring countries.
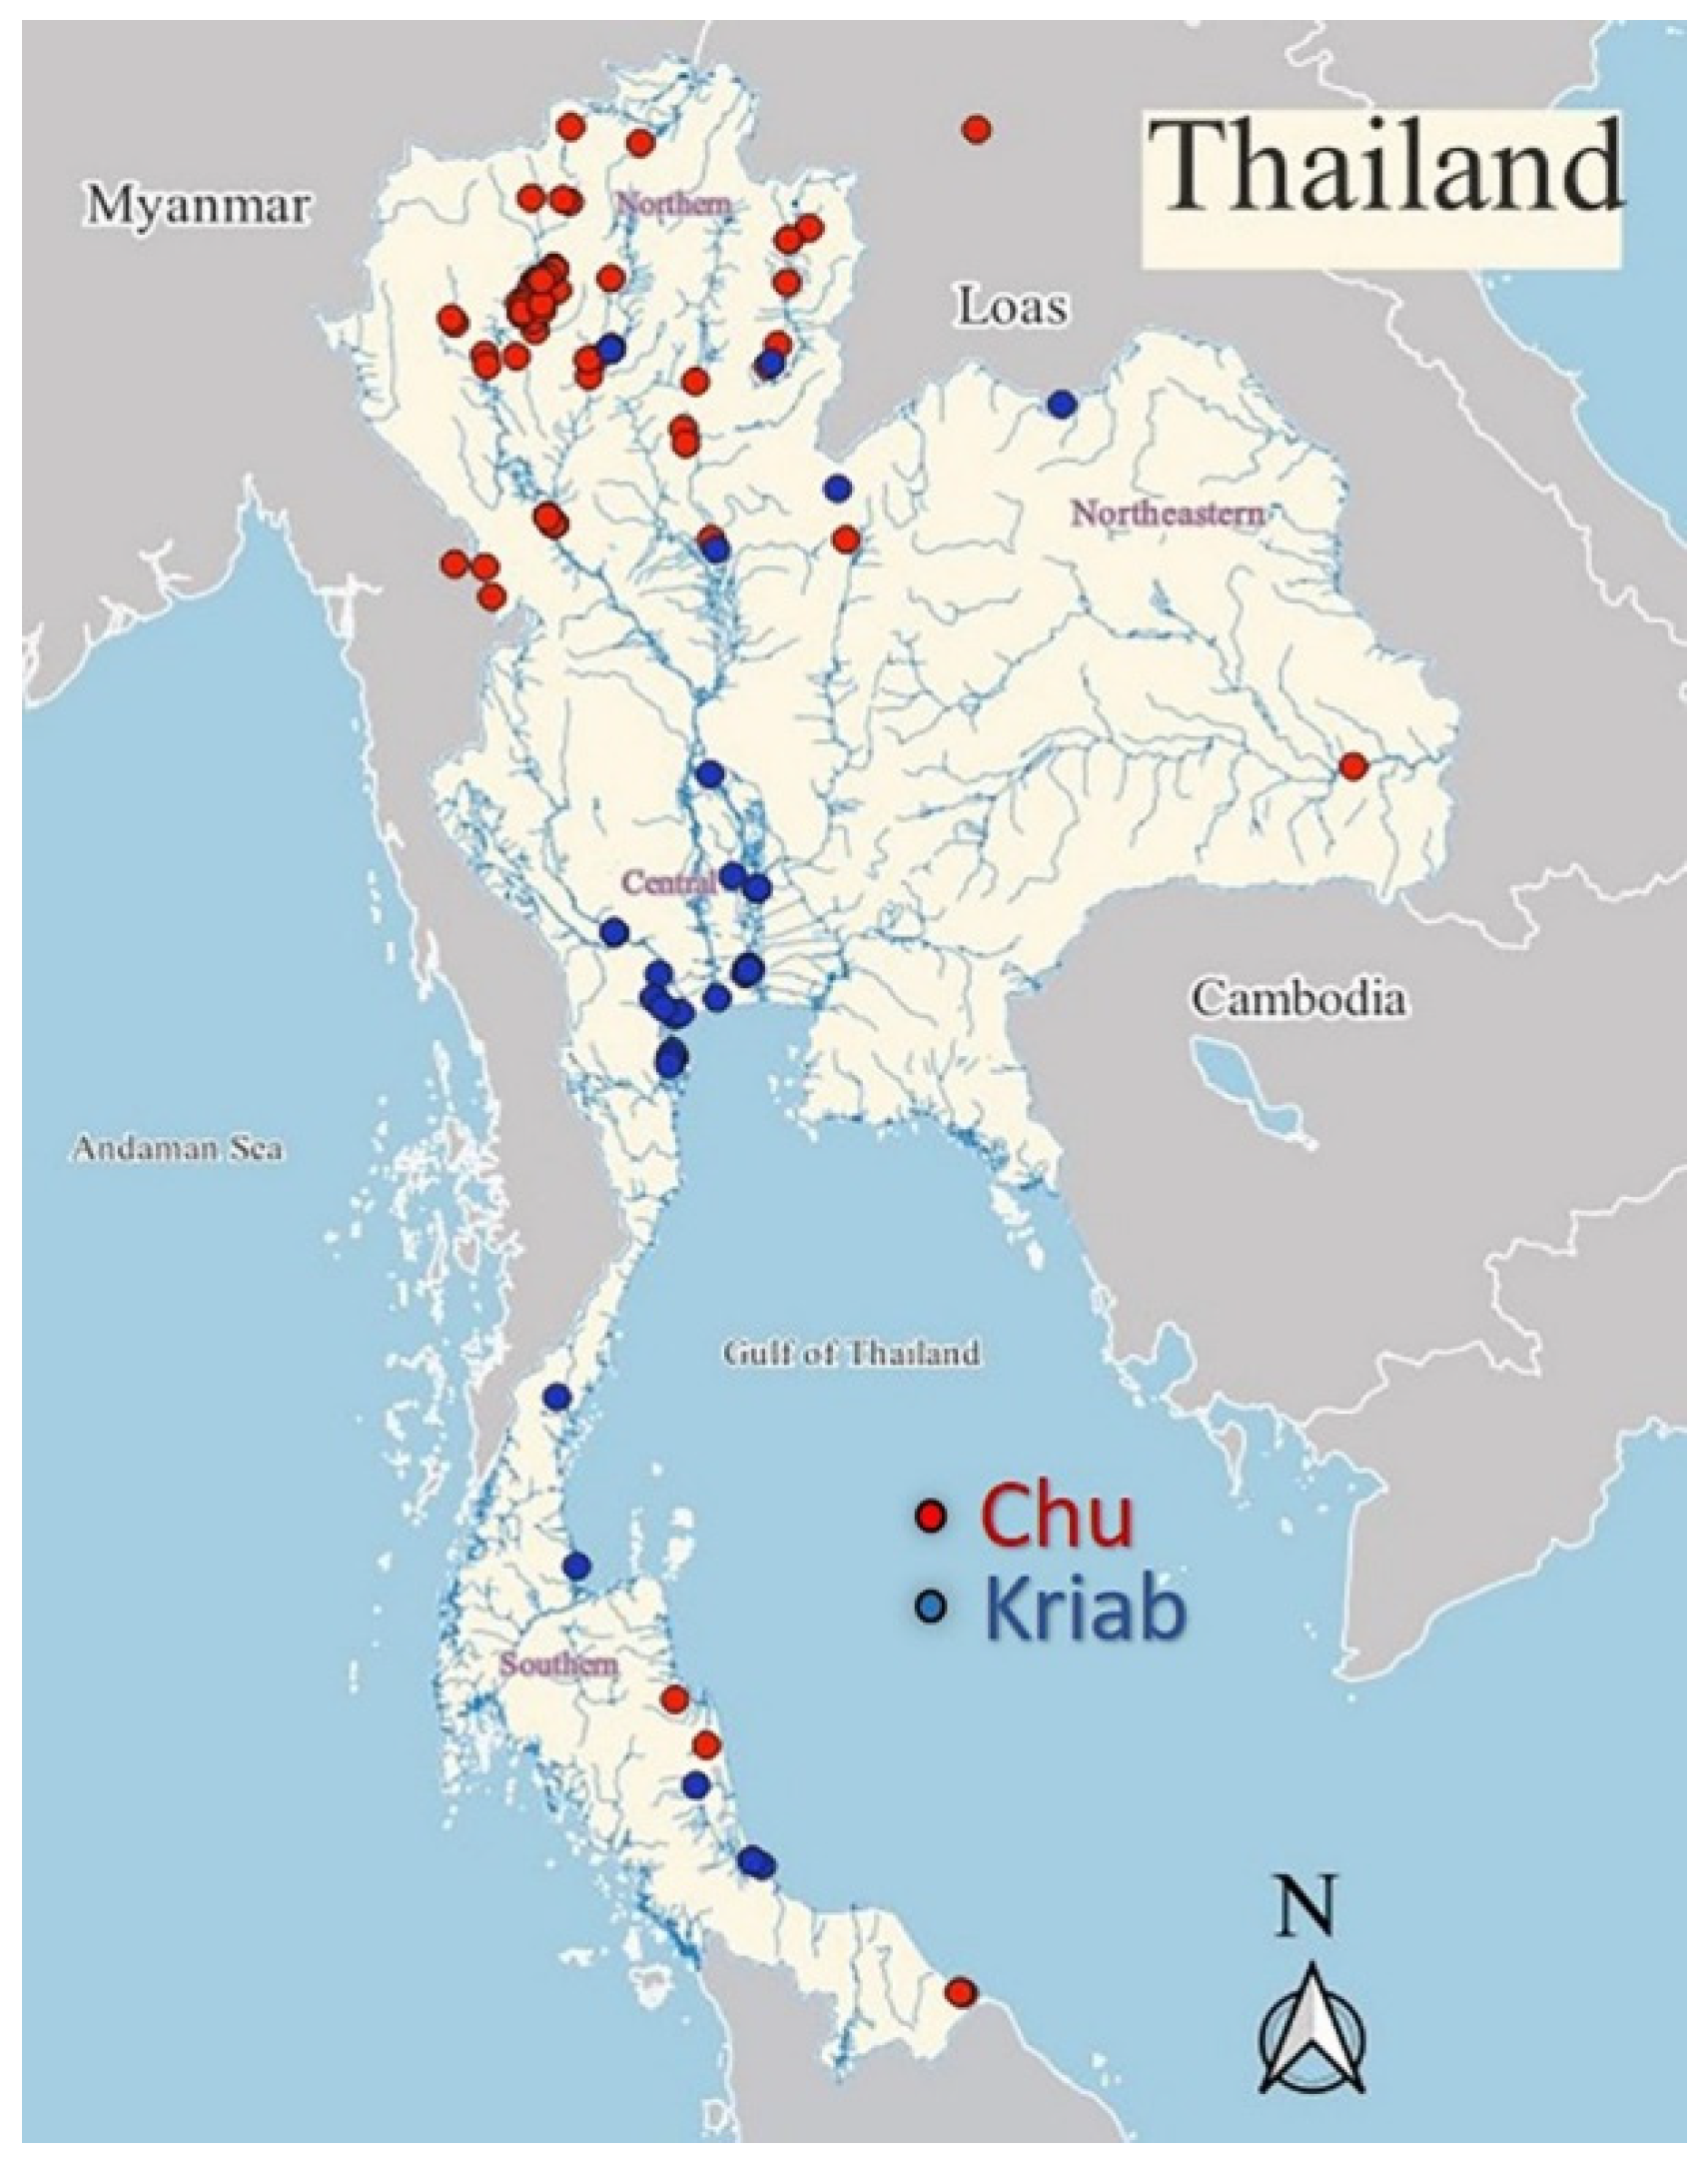
Figure 2.
Examples of Kriab and Chu mirrors and their use in archaeological artifacts. (a) Kriab mirrors arranged in tessellated decorative patterns, and (b) thin, flexible Chu mirrors used for curved inlay work.
Figure 2.
Examples of Kriab and Chu mirrors and their use in archaeological artifacts. (a) Kriab mirrors arranged in tessellated decorative patterns, and (b) thin, flexible Chu mirrors used for curved inlay work.
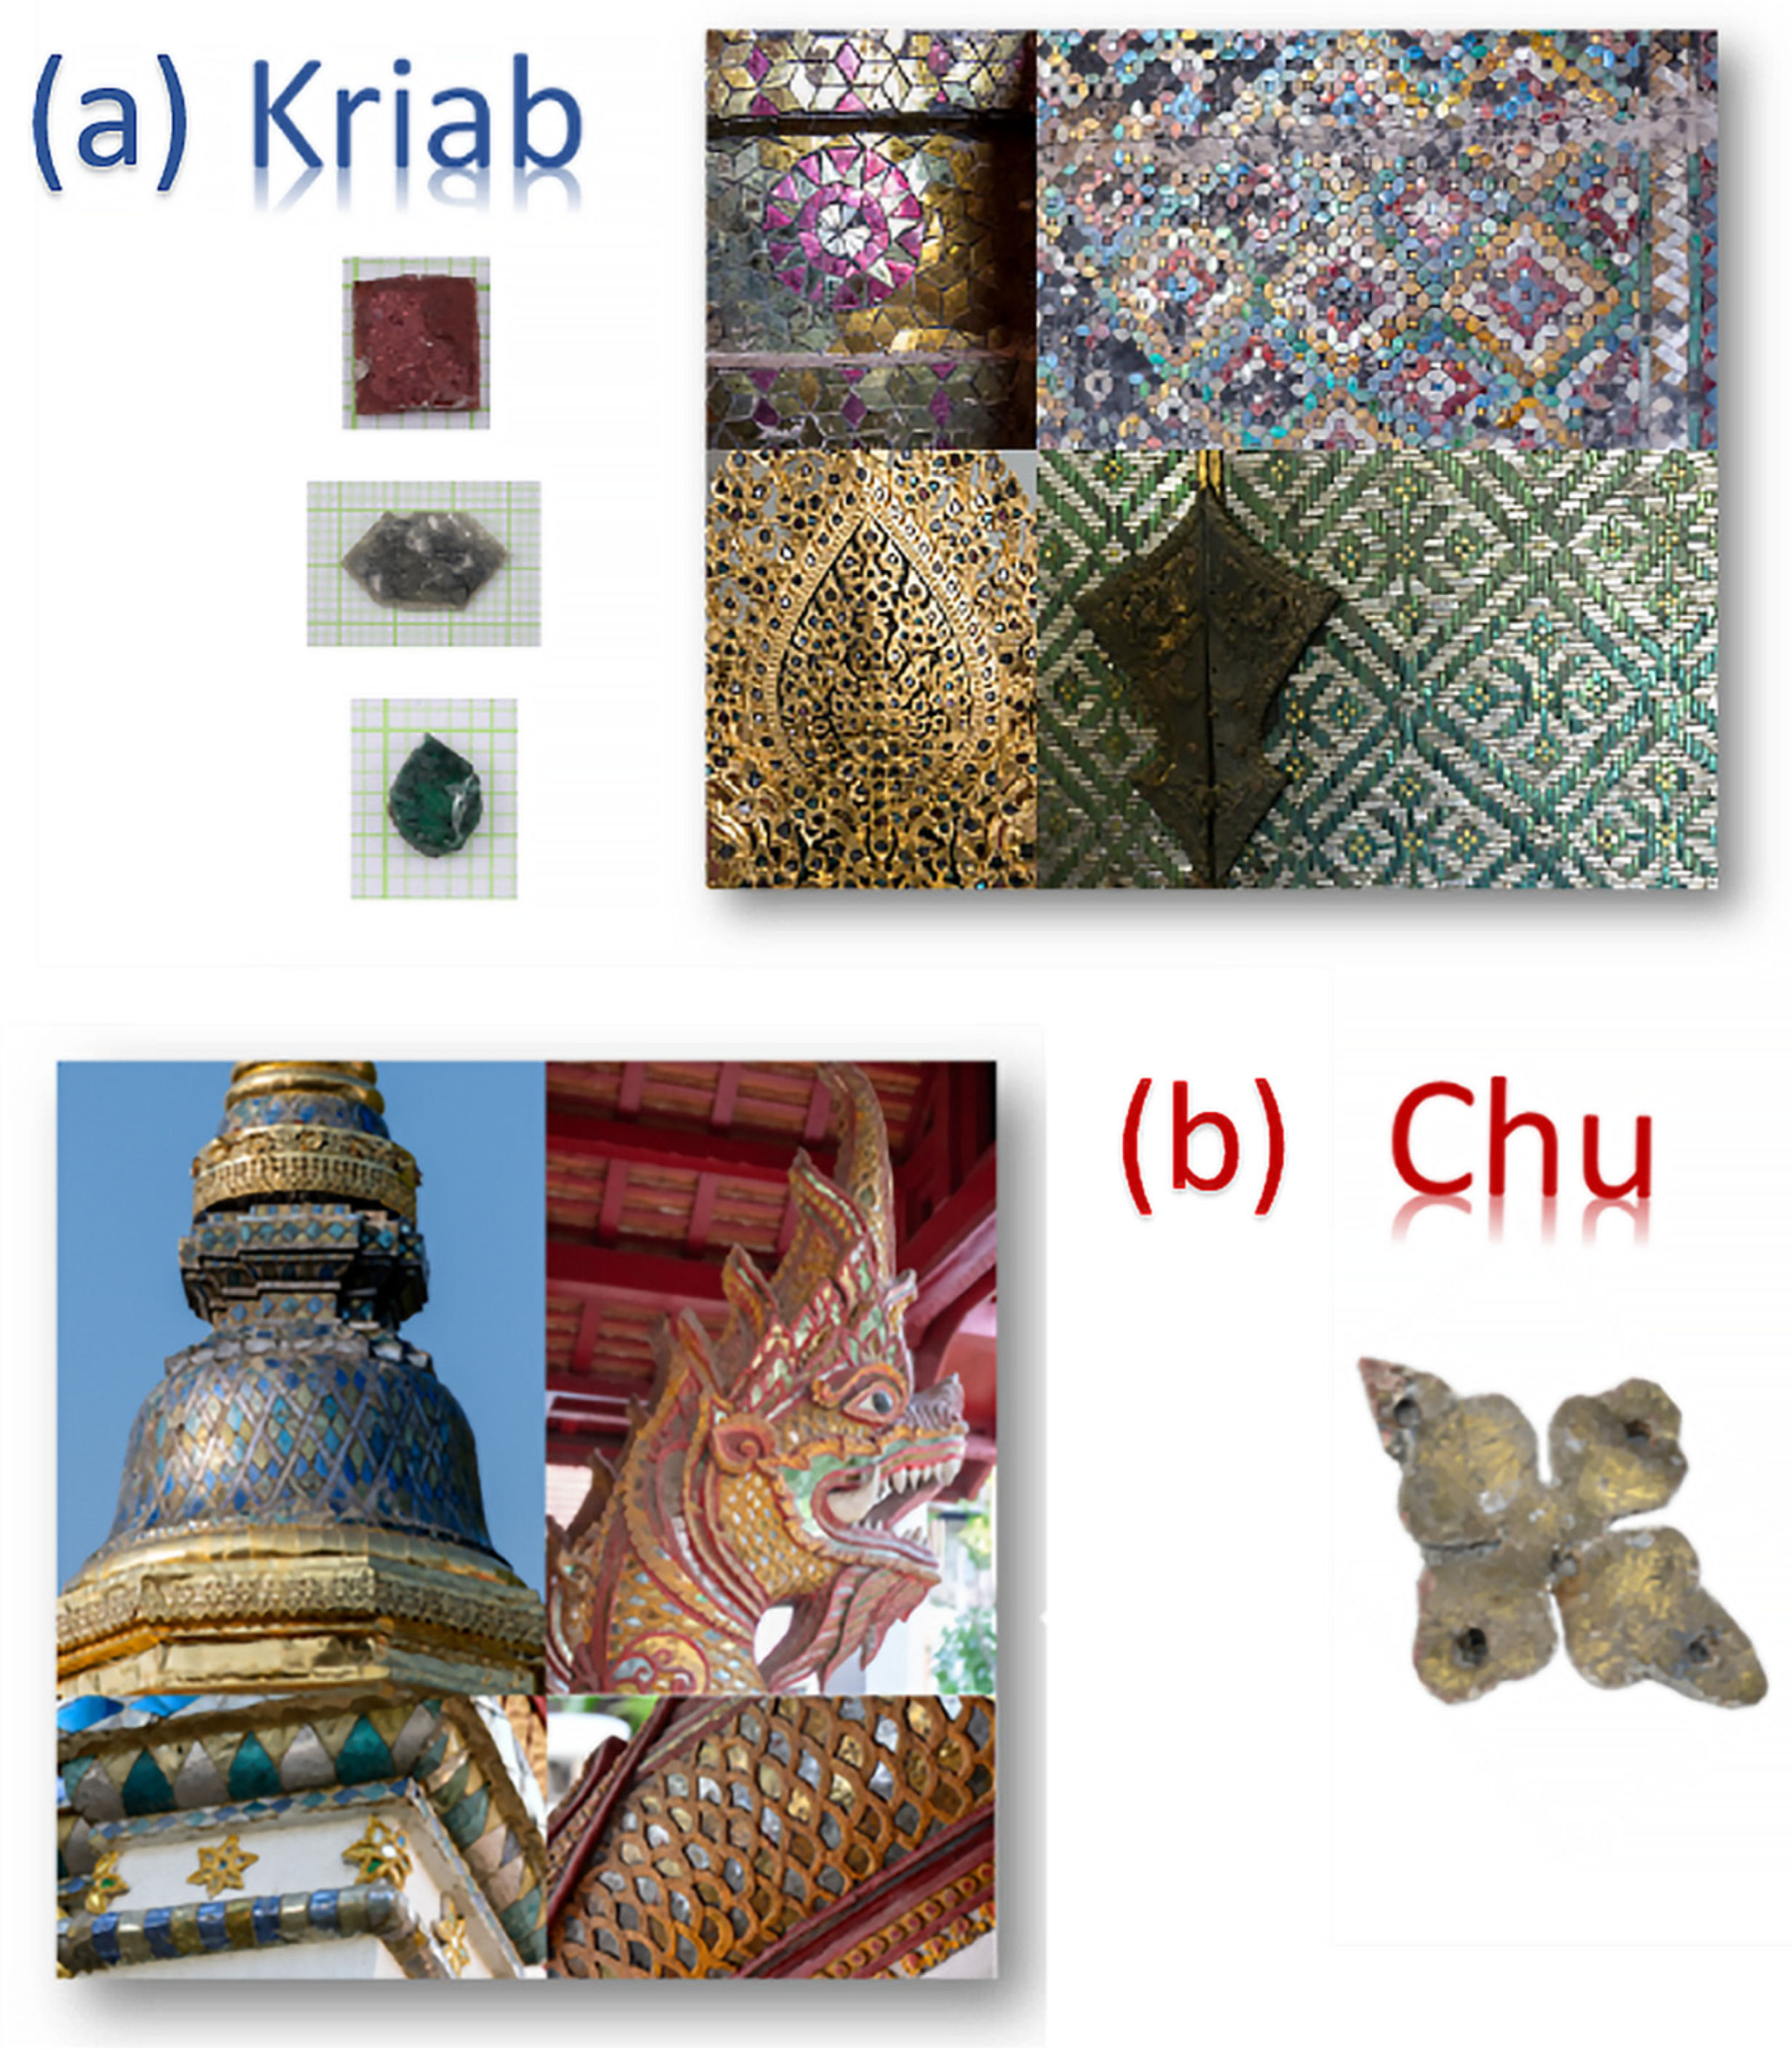
Figure 3.
Selected “gold glass” Chu (a) and Kriab (b) mirrors from different locations in Thailand.
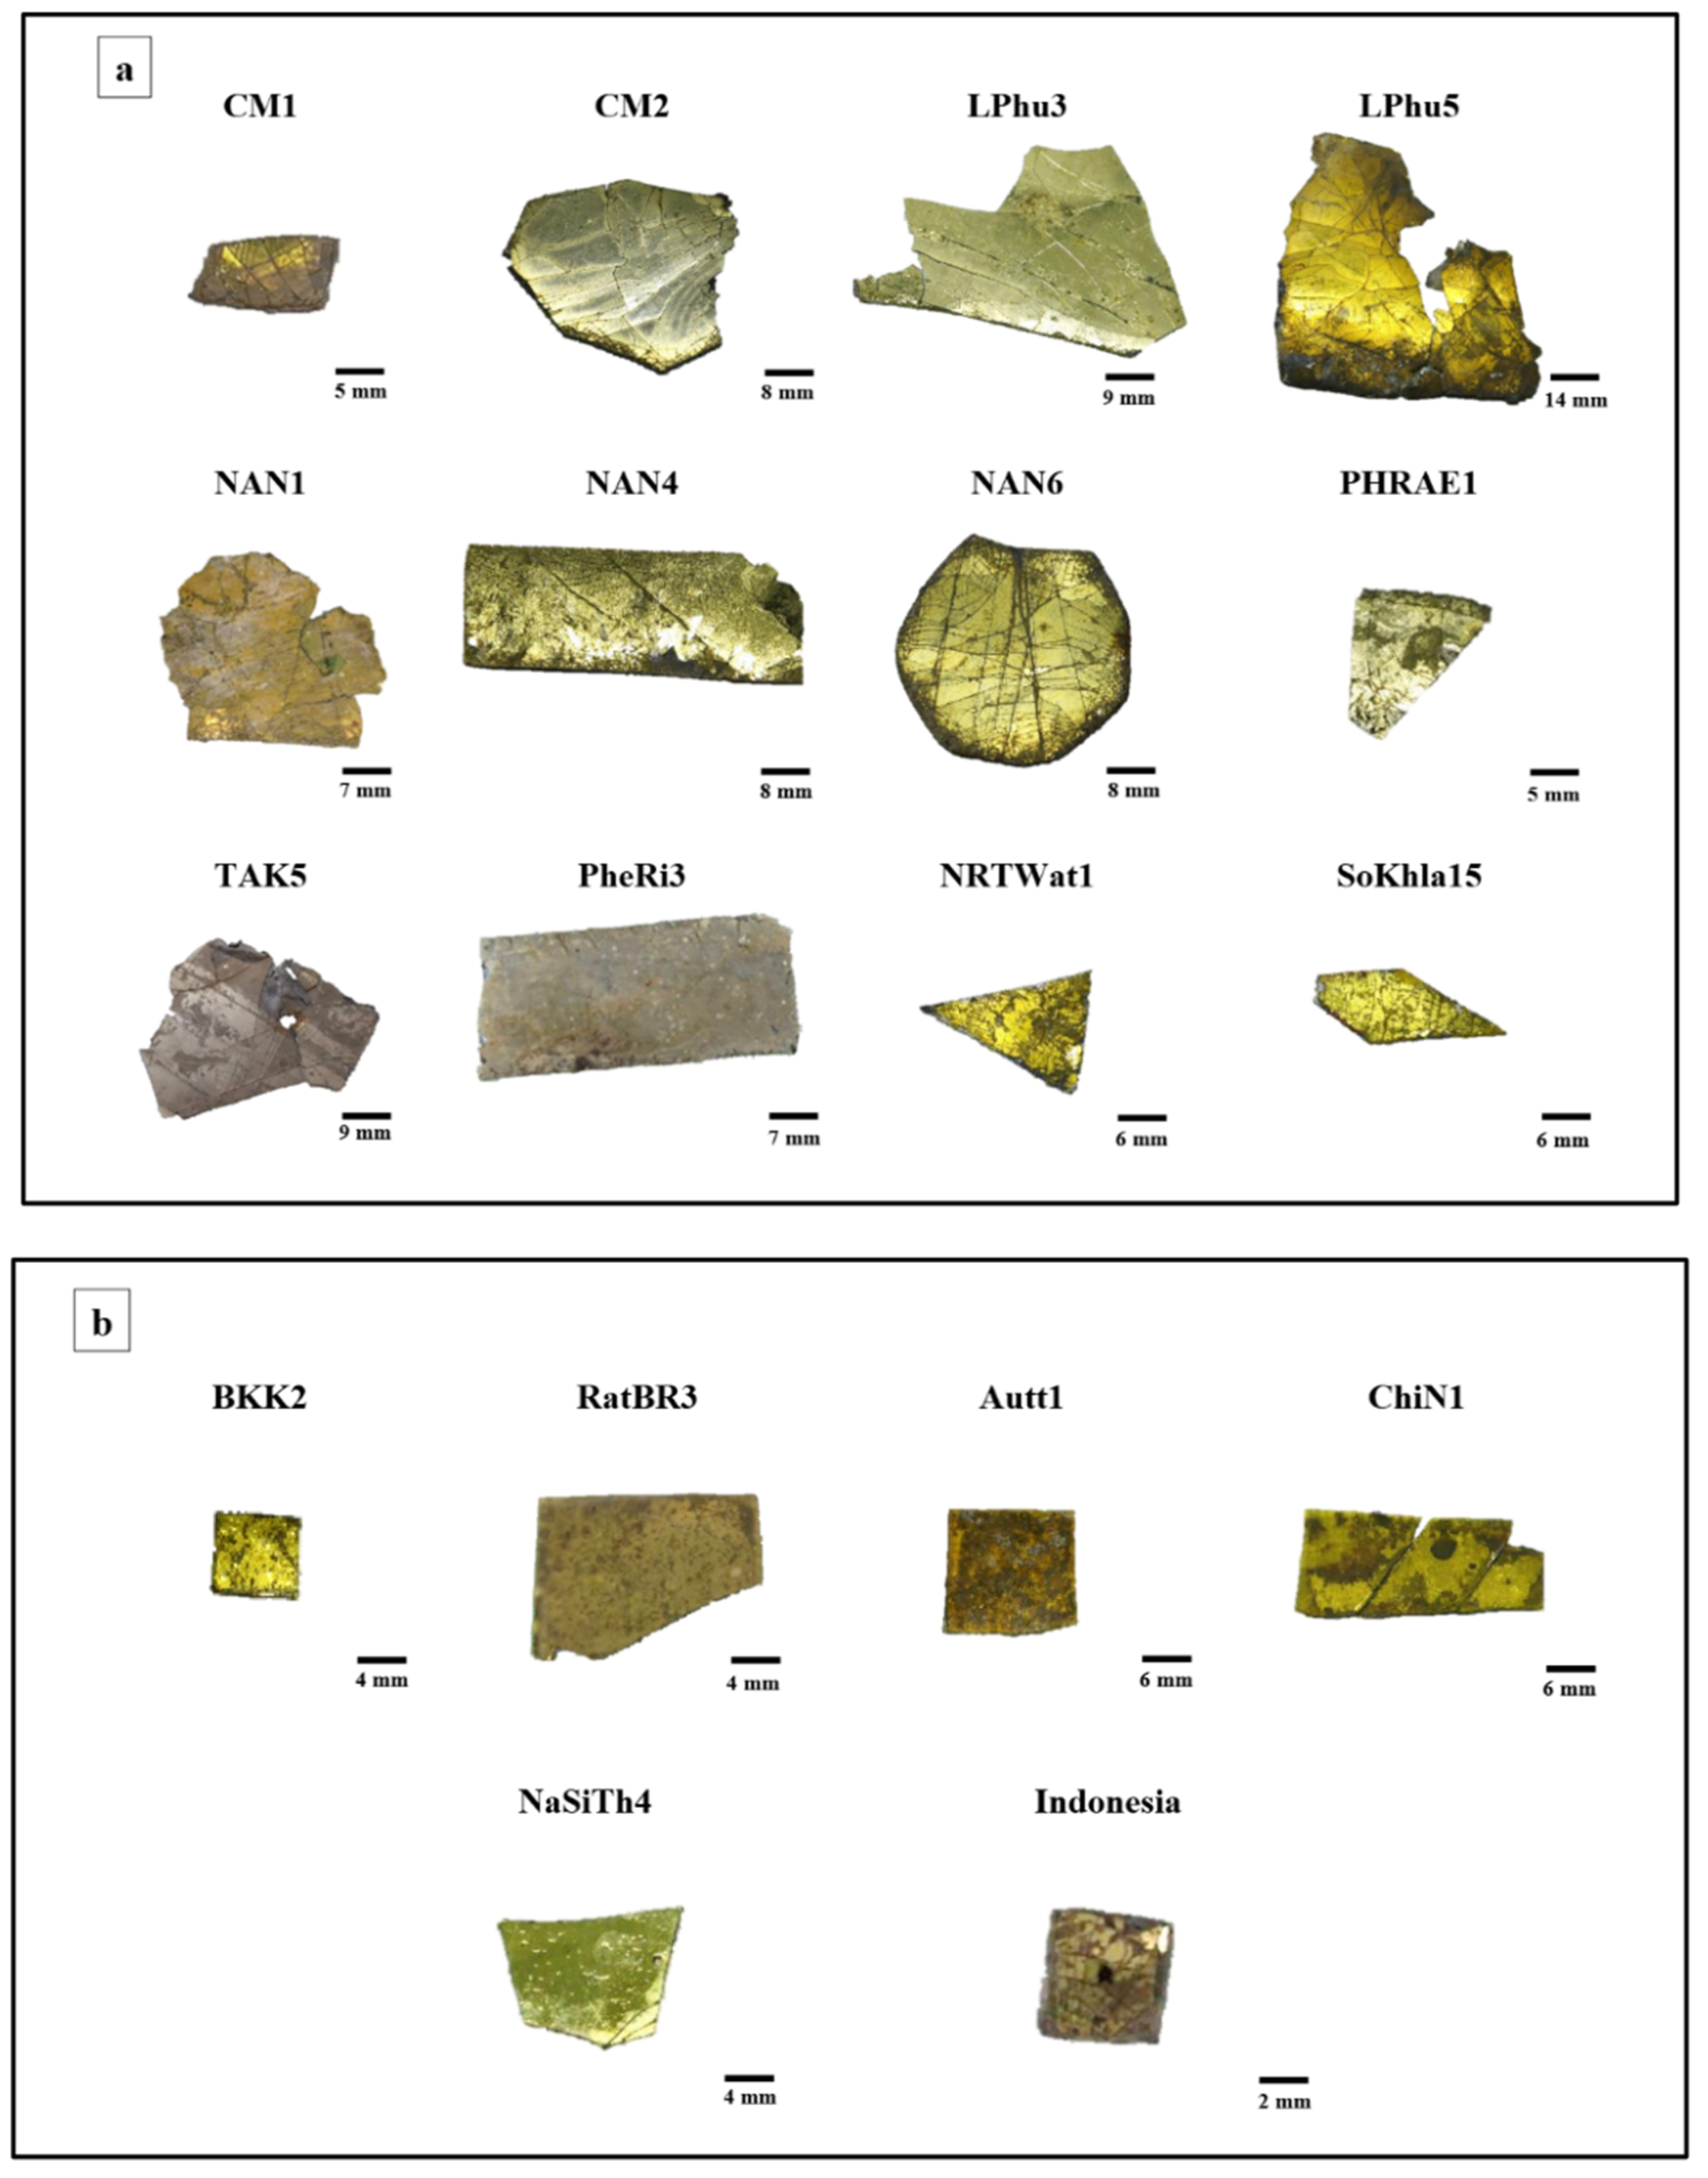
Figure 4.
Schematic representation depicting the production process of lead-coated glass mosaic mirrors. Past: It’s possible that early glassblowers used simple methods, applying molten lead to hot glass spheres while they were still hot. Currently: Our research team and artisans at the Samart Handcrafted Thin-glass Workshop in Hang Dong, Chiang Mai, have developed and adopted contemporary and safer processes.
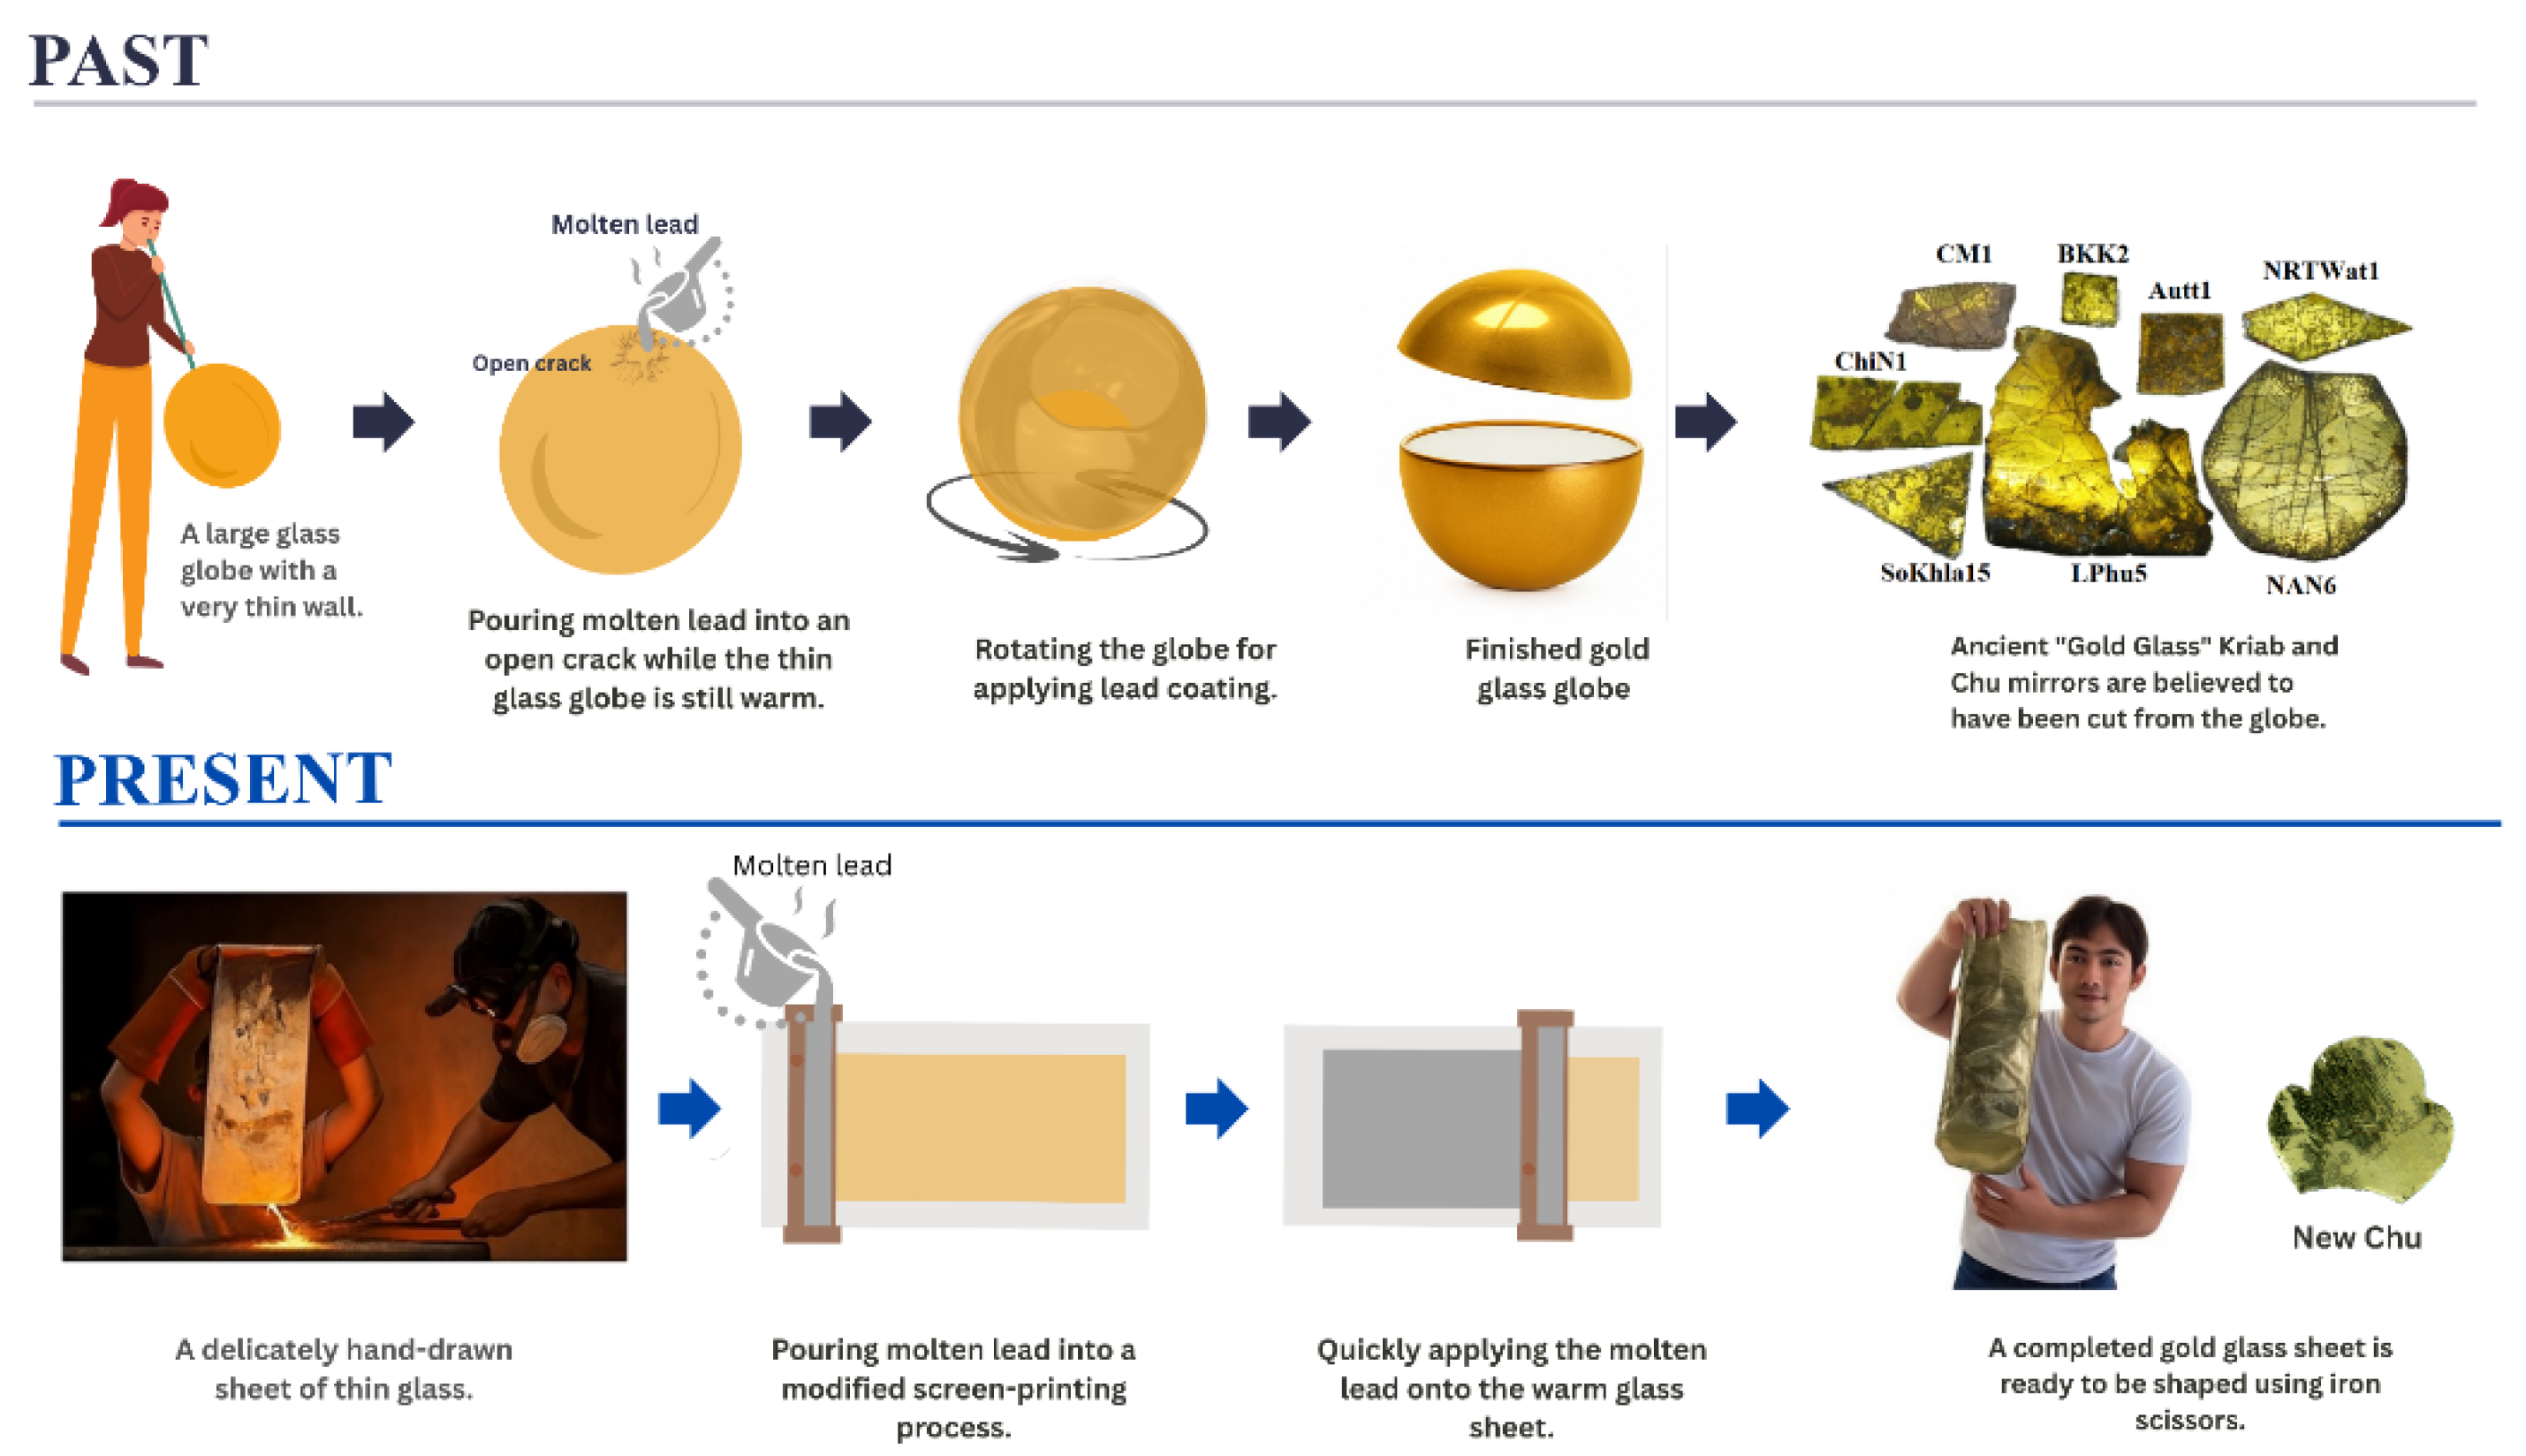
Figure 5.
Comparison of the appearance between ancient Chu samples and alternative Chu reproductions.
Figure 5.
Comparison of the appearance between ancient Chu samples and alternative Chu reproductions.
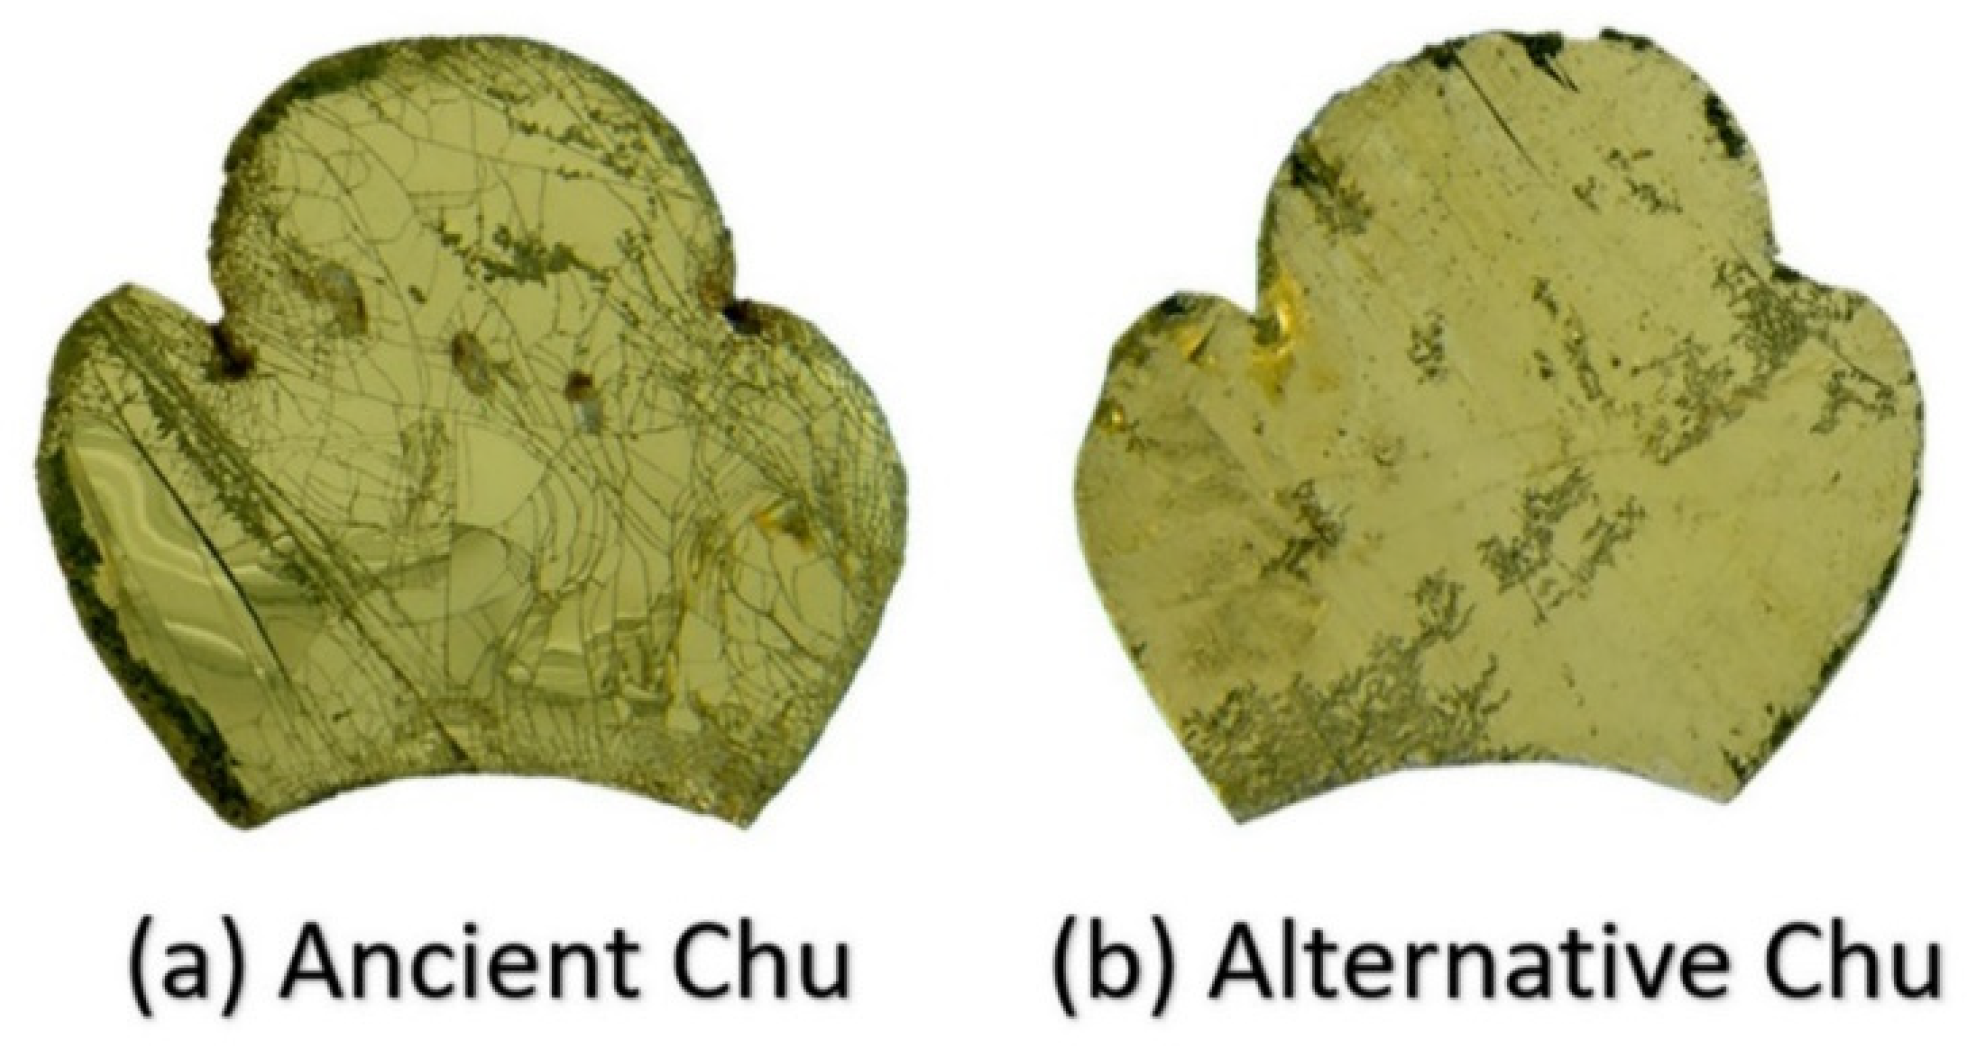
Figure 6.
Schematic diagram of XPS sample preparation at the glass-to-lead interface.
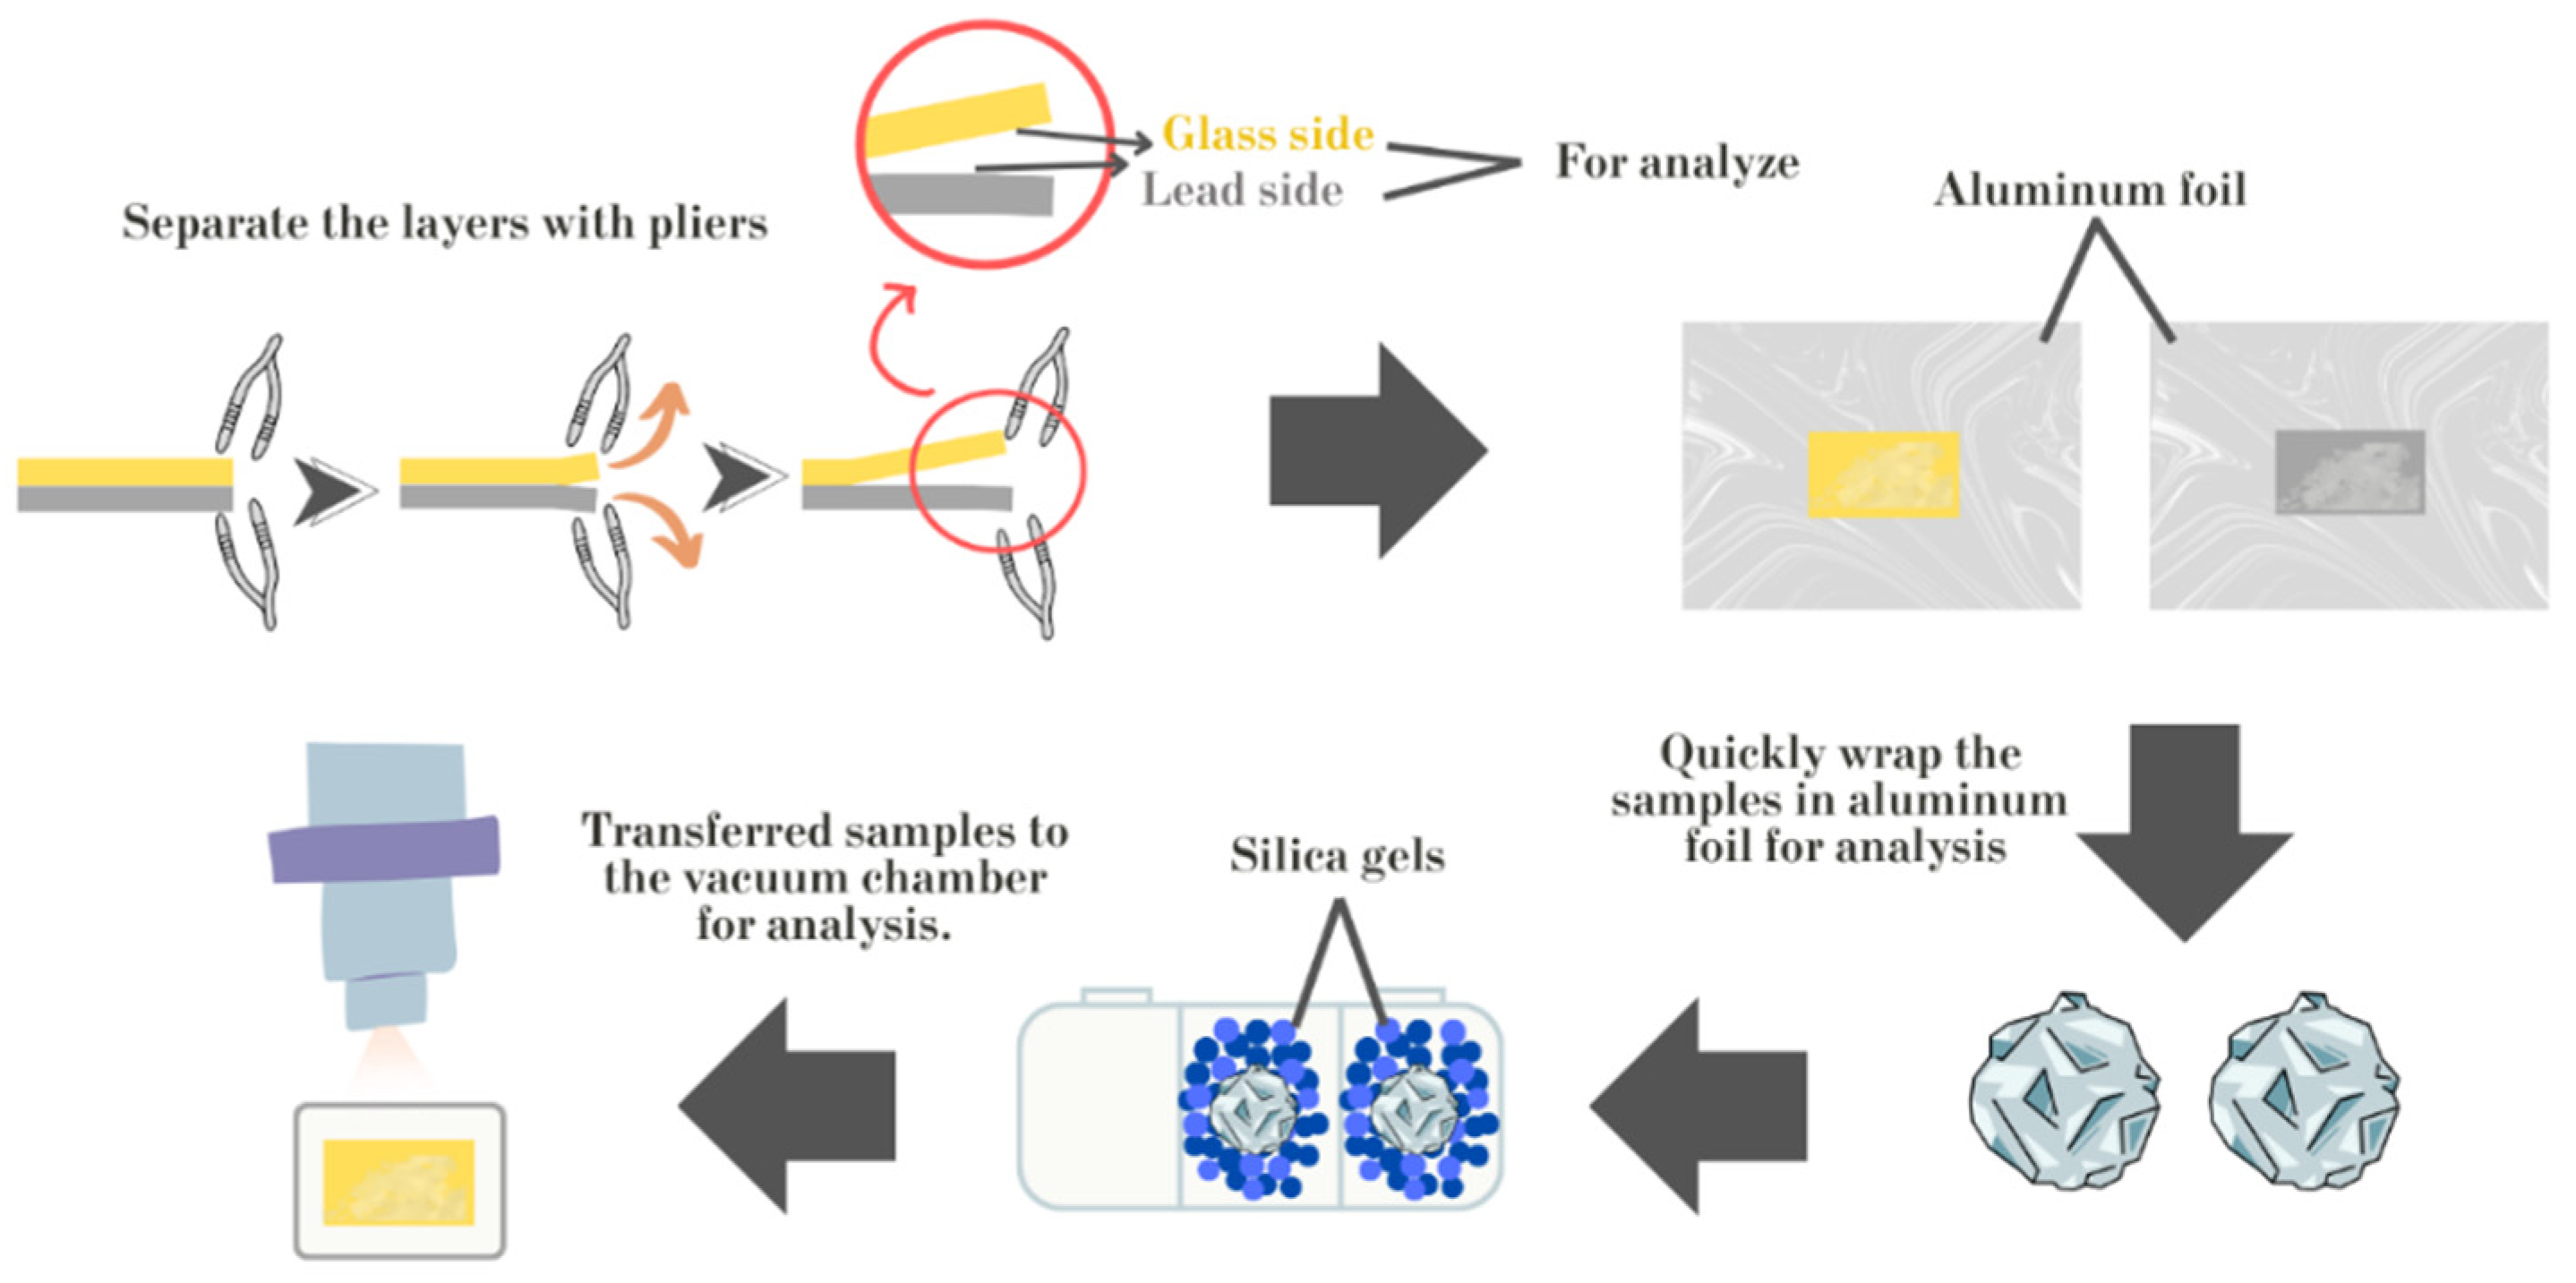
Figure 7.
The oxide composition relationships in the yellow glass layers of “gold glass” from Kriab and Chu mirror samples, collected from various locations investigated in this project, were compared with data from related studies [7,8]. These studies included analyses of alternative Chu samples and a 300-year-old green Kriab sample (#PheRi4). Four types of compositional relationships were examined through graphical representations: (a) CaO-Al2O3, (b) PbO-K2O, (c) K2O-MgO, and (d) Na2O-K2O.
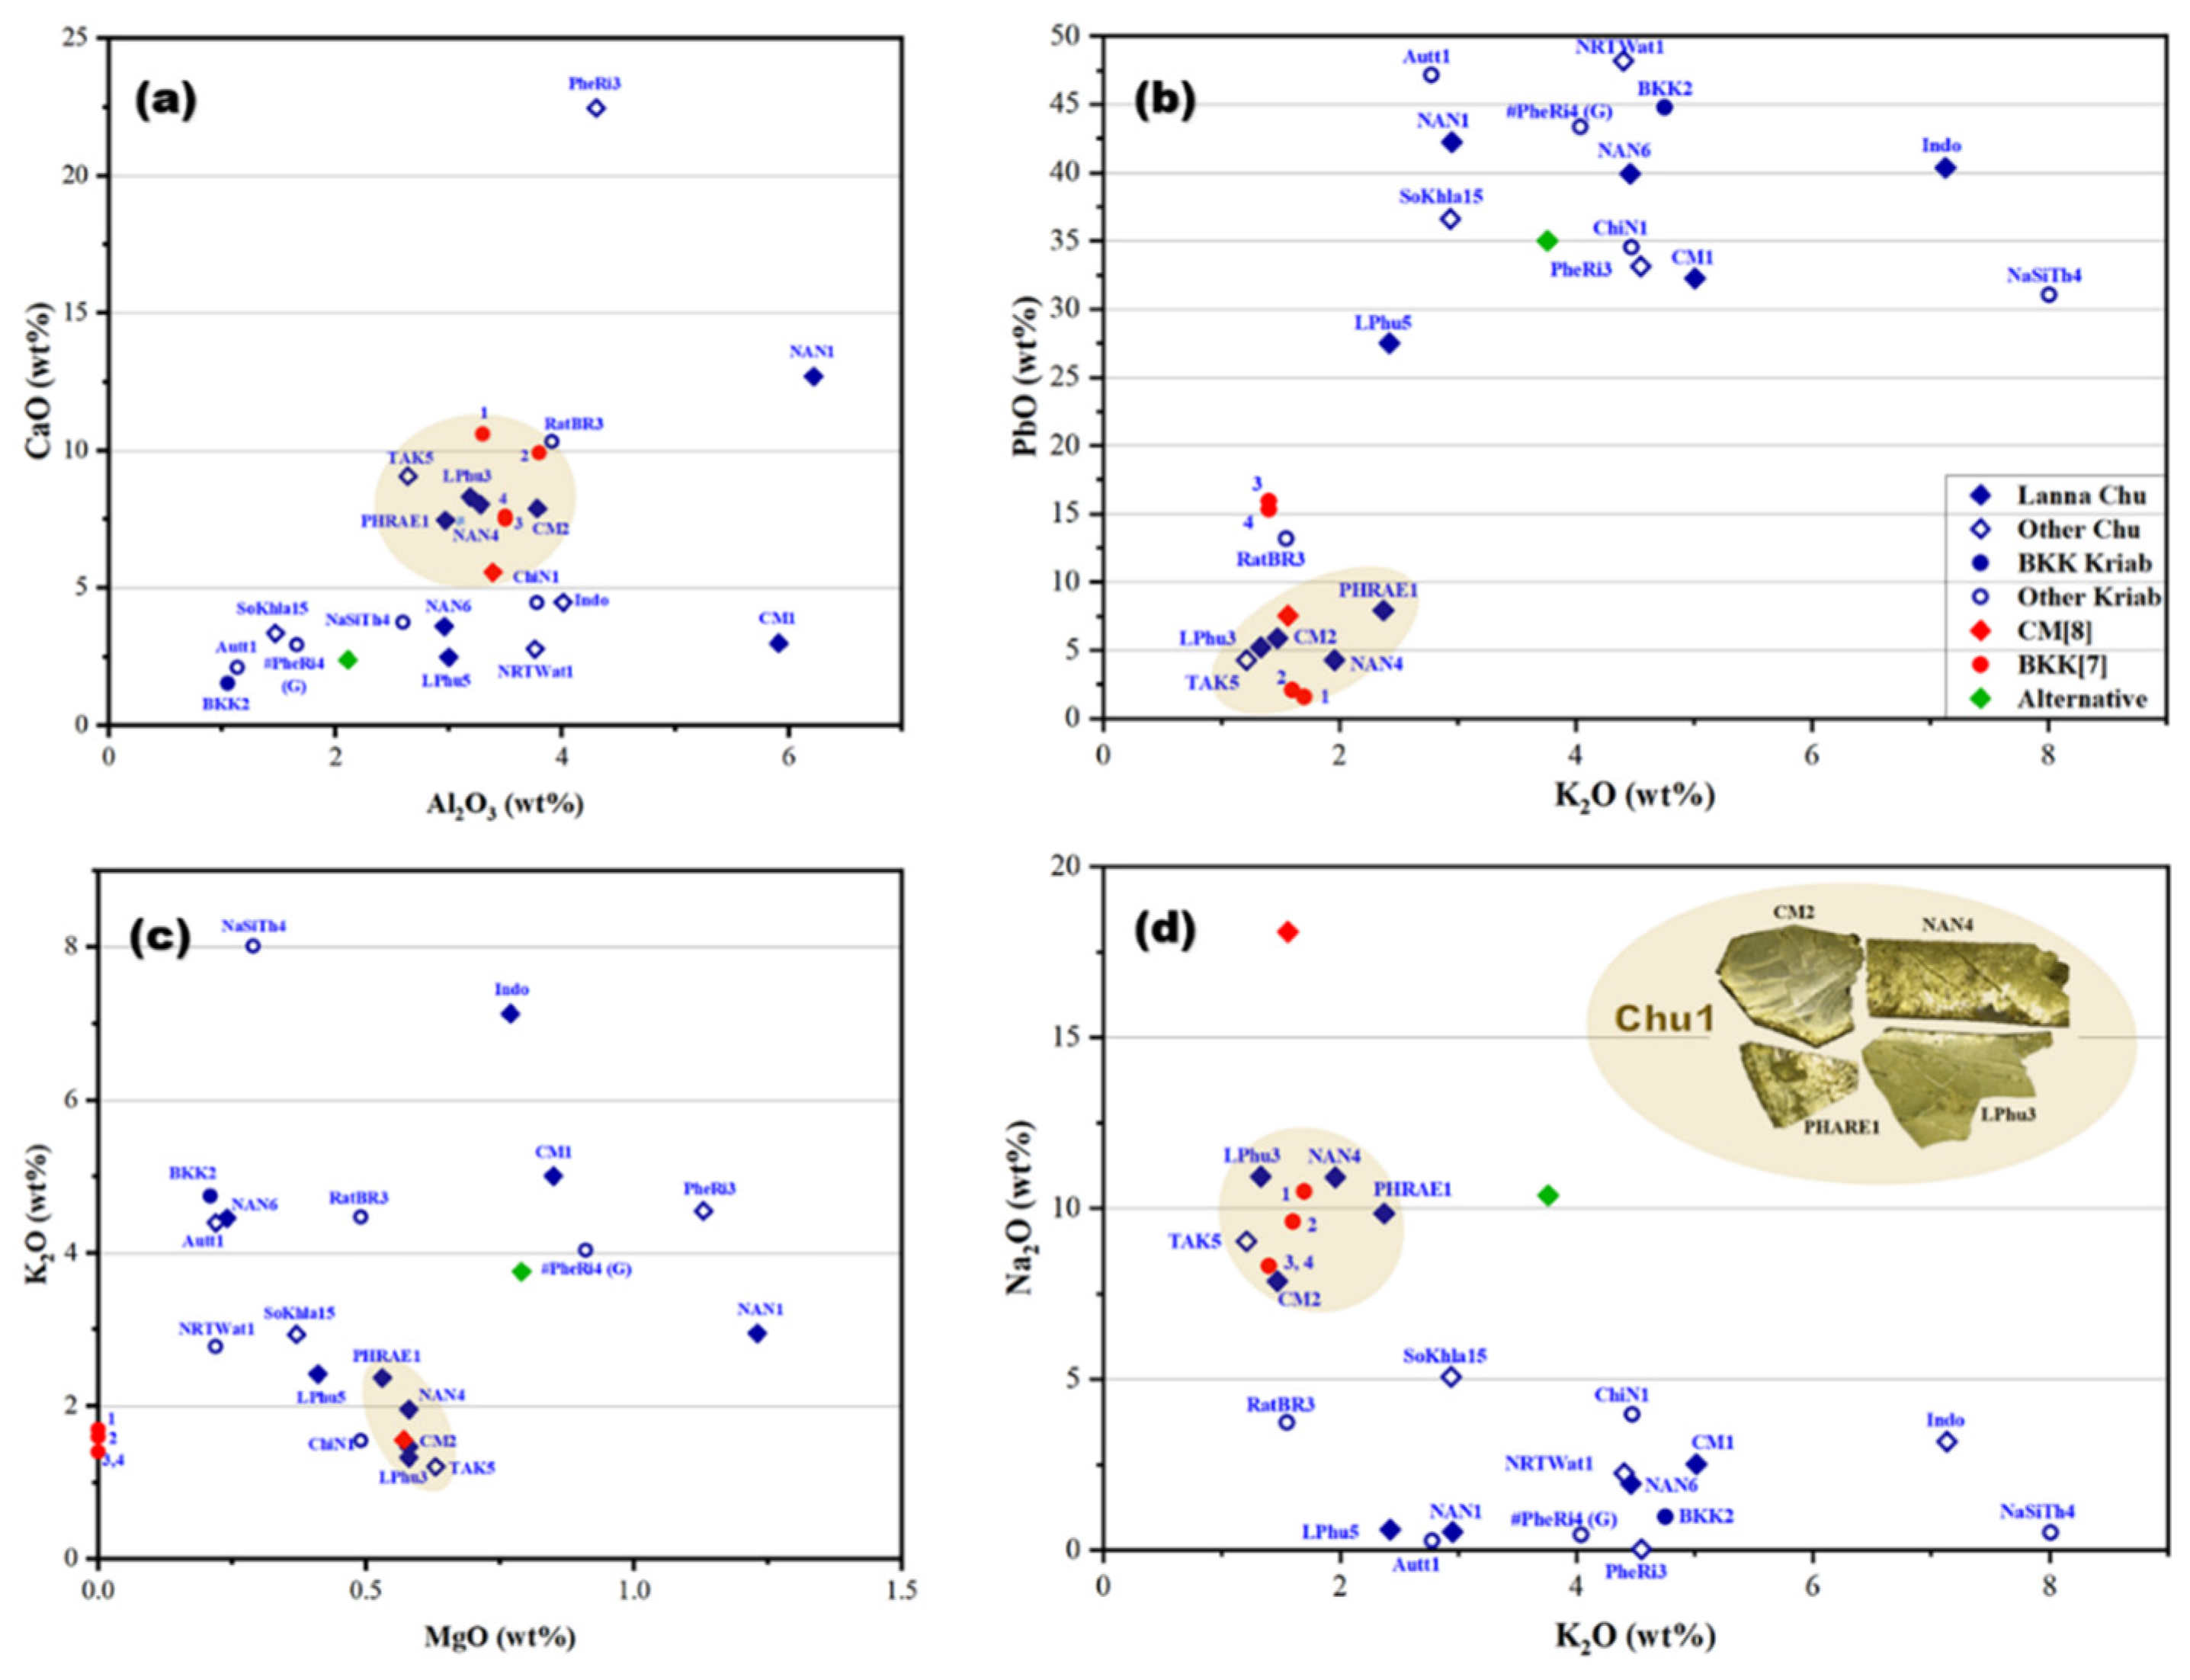
Figure 8.
A plot of CaO/Al2O3 and Na2O/SiO2 in the yellow glass layers of “gold glass” from Kriab and Chu mirror samples.
Figure 8.
A plot of CaO/Al2O3 and Na2O/SiO2 in the yellow glass layers of “gold glass” from Kriab and Chu mirror samples.
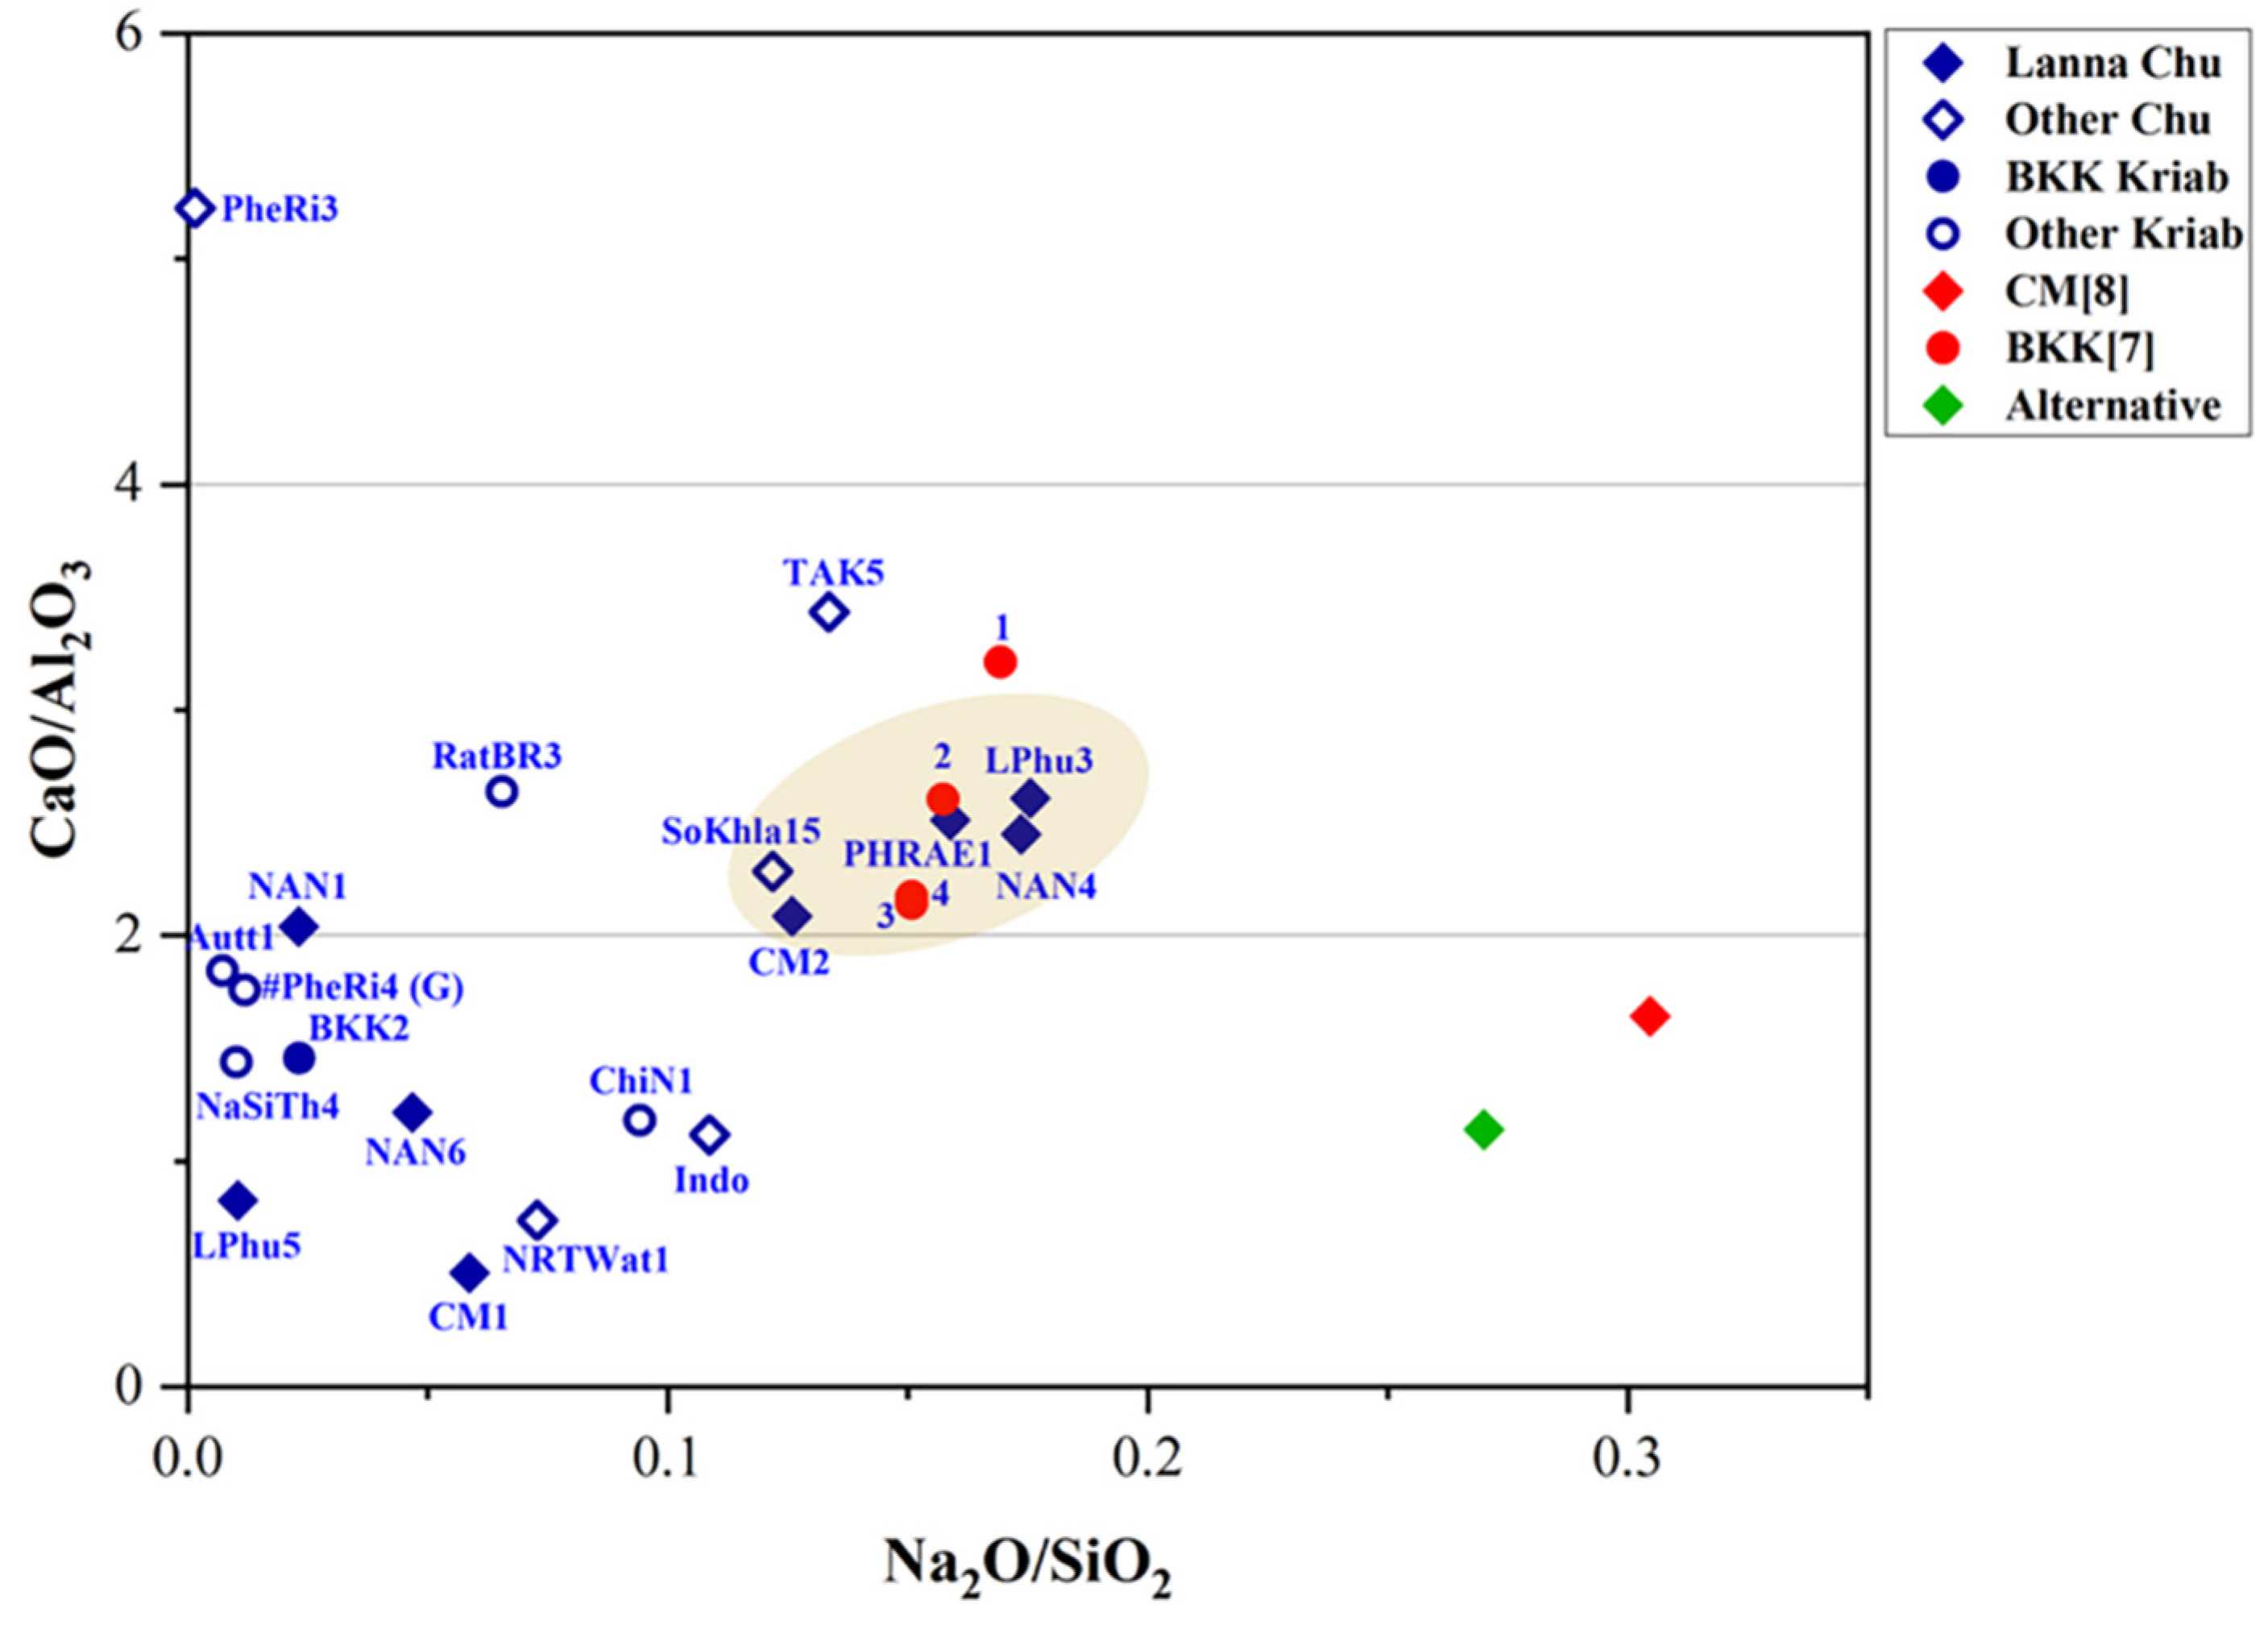
Figure 9.
A plot of Fe2O3/TiO2 and Fe2O3/Al2O3 in the yellow glass layers of “gold glass” from Kriab and Chu mirror samples.
Figure 9.
A plot of Fe2O3/TiO2 and Fe2O3/Al2O3 in the yellow glass layers of “gold glass” from Kriab and Chu mirror samples.
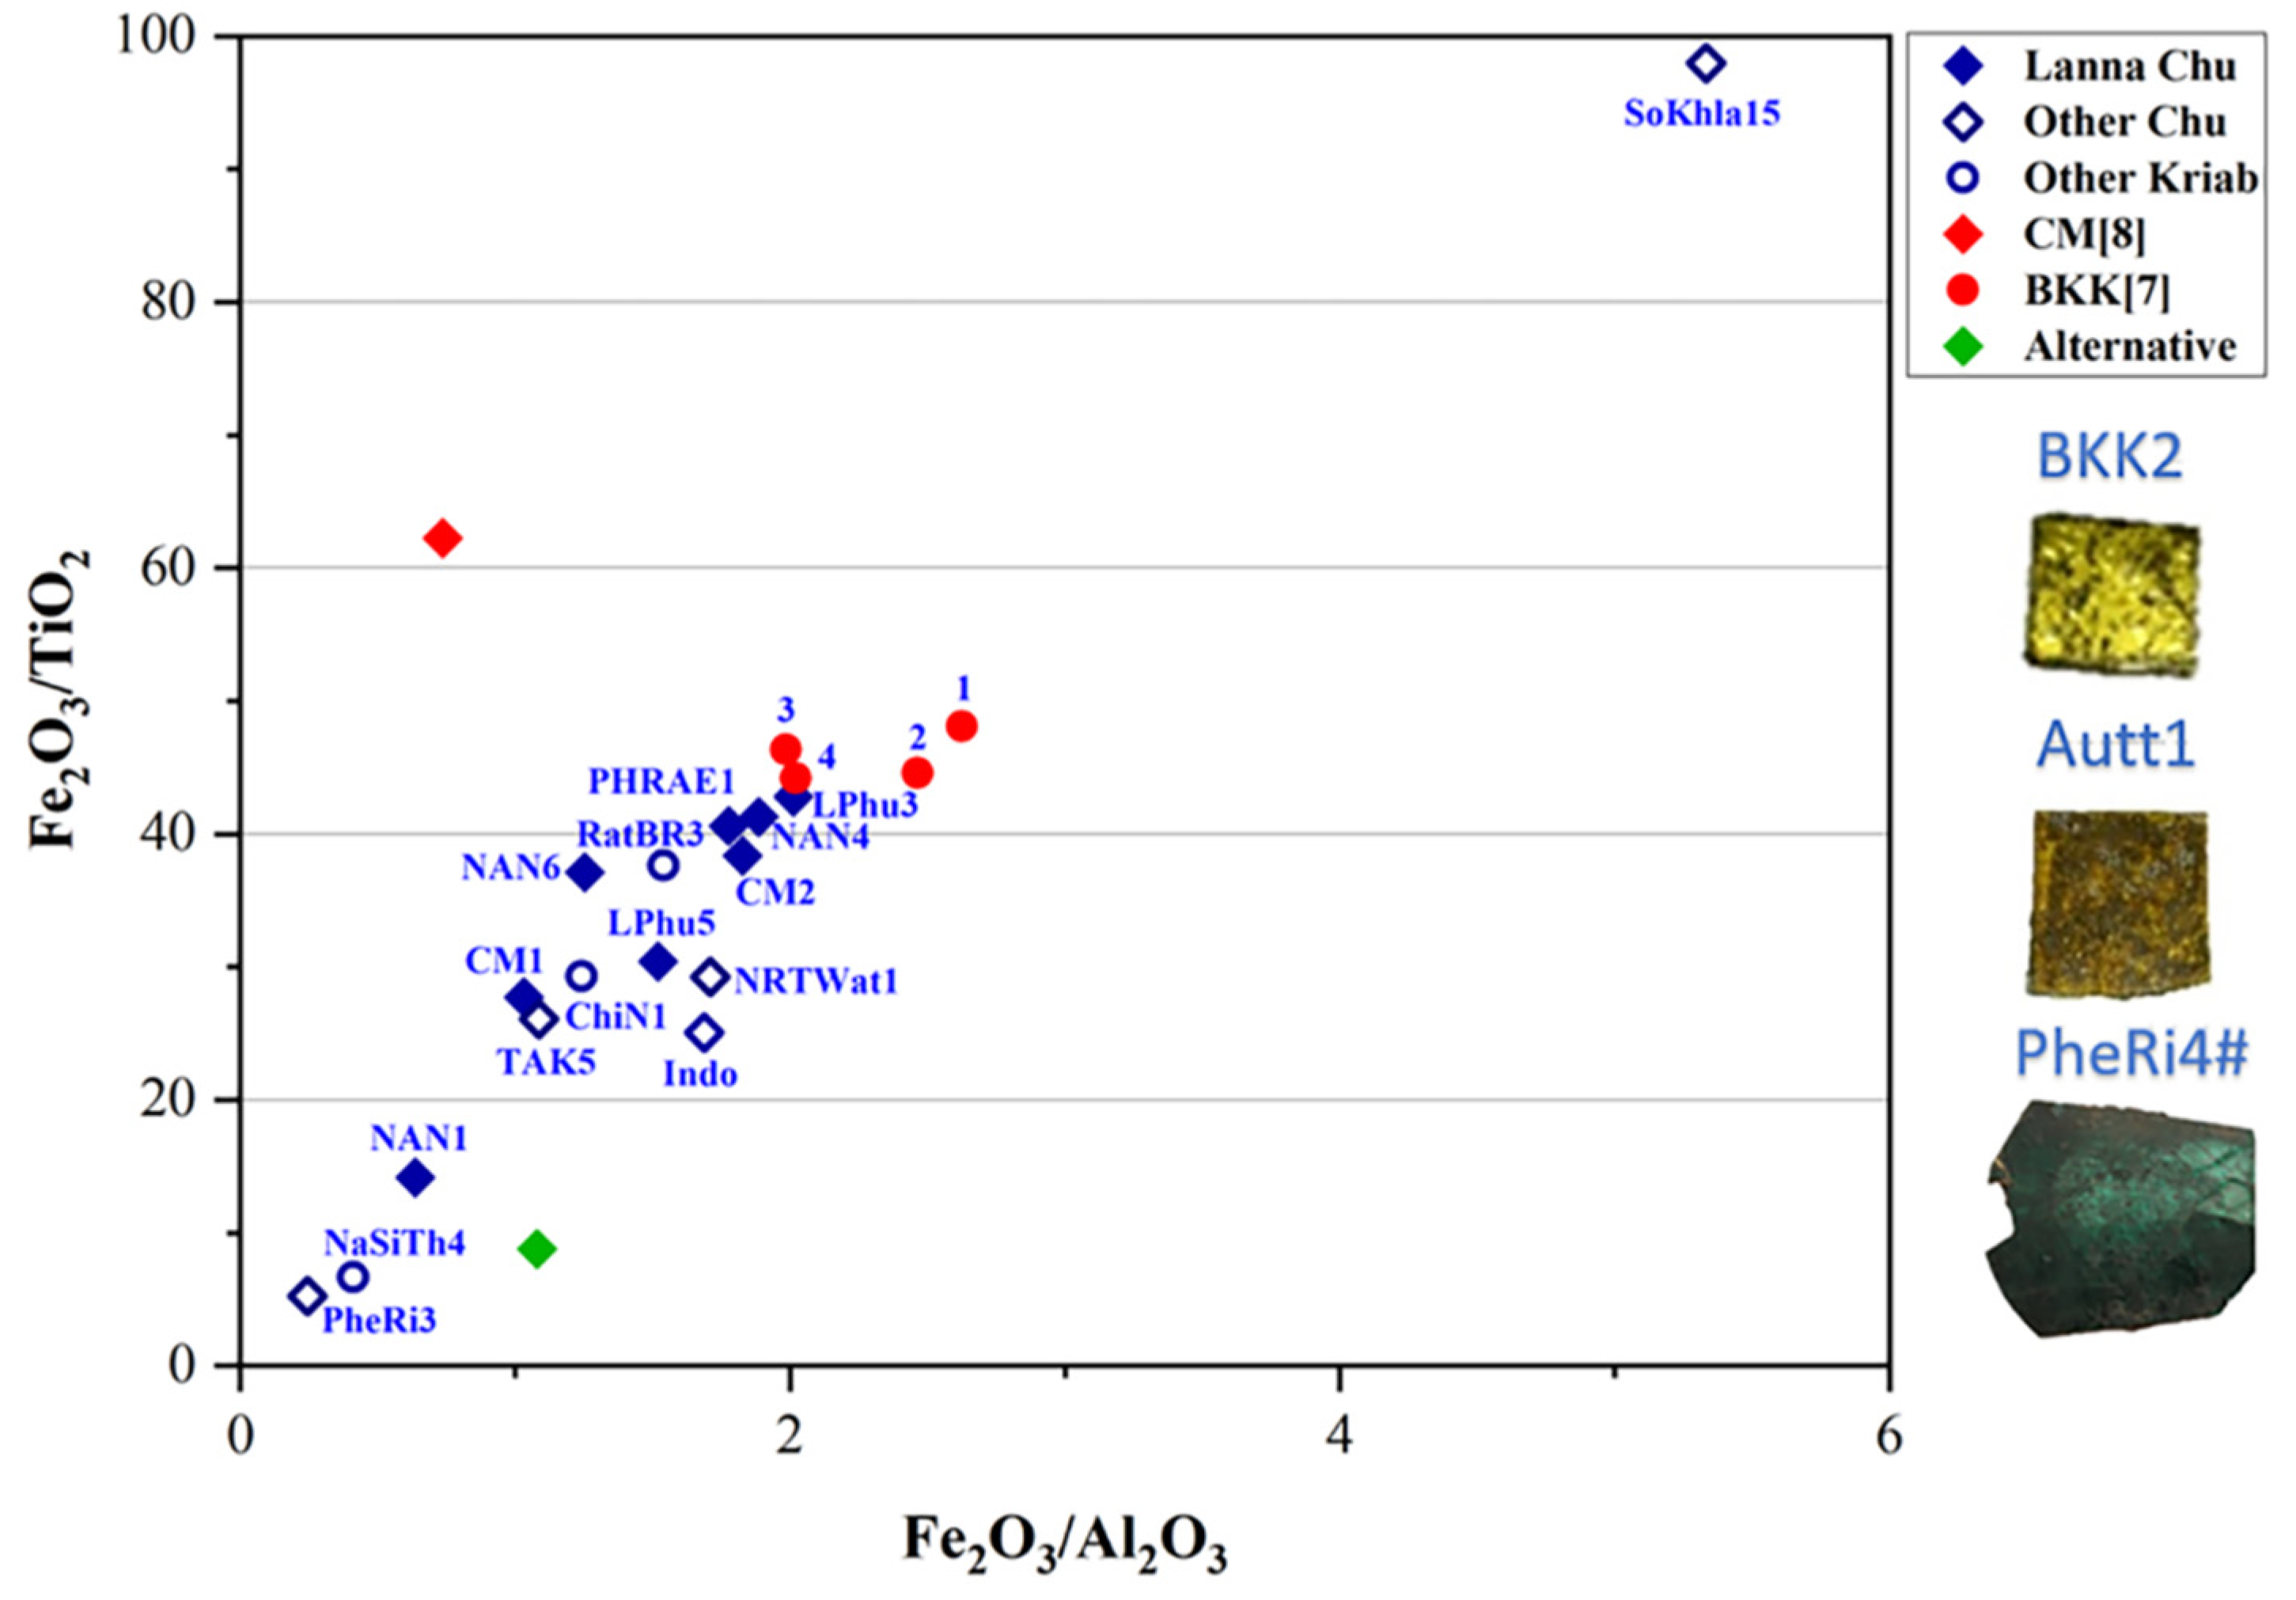
Figure 10.
Micrographs illustrating the interface between the glass and lead layer in the ancient Chu sample (CM1).
Figure 10.
Micrographs illustrating the interface between the glass and lead layer in the ancient Chu sample (CM1).
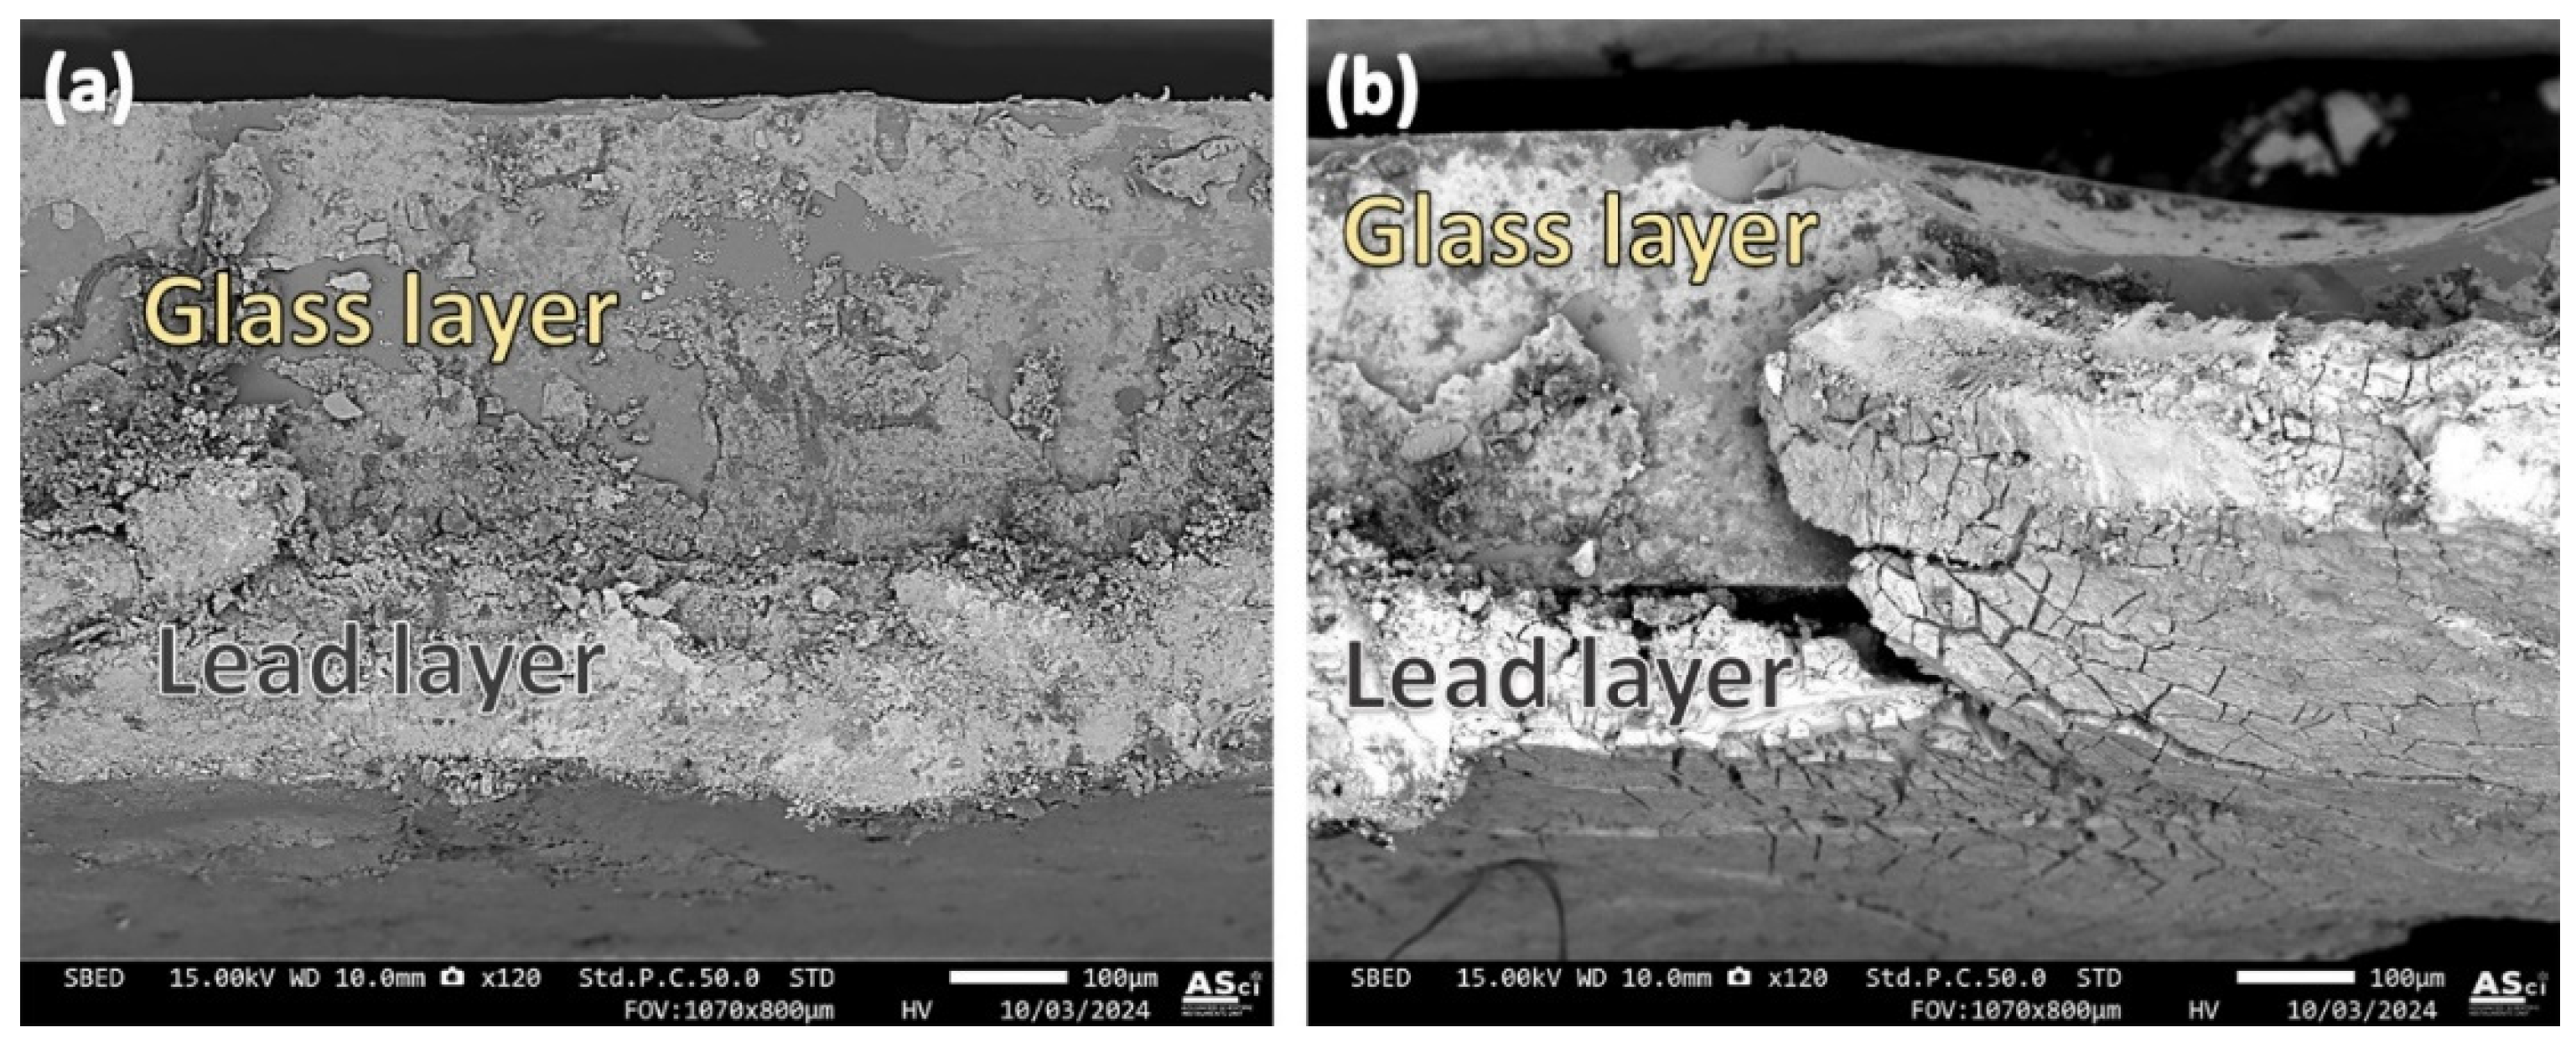
Figure 11.
X-ray line scan at the interface between the glass and lead layer in the ancient Chu sample (CM1).
Figure 11.
X-ray line scan at the interface between the glass and lead layer in the ancient Chu sample (CM1).
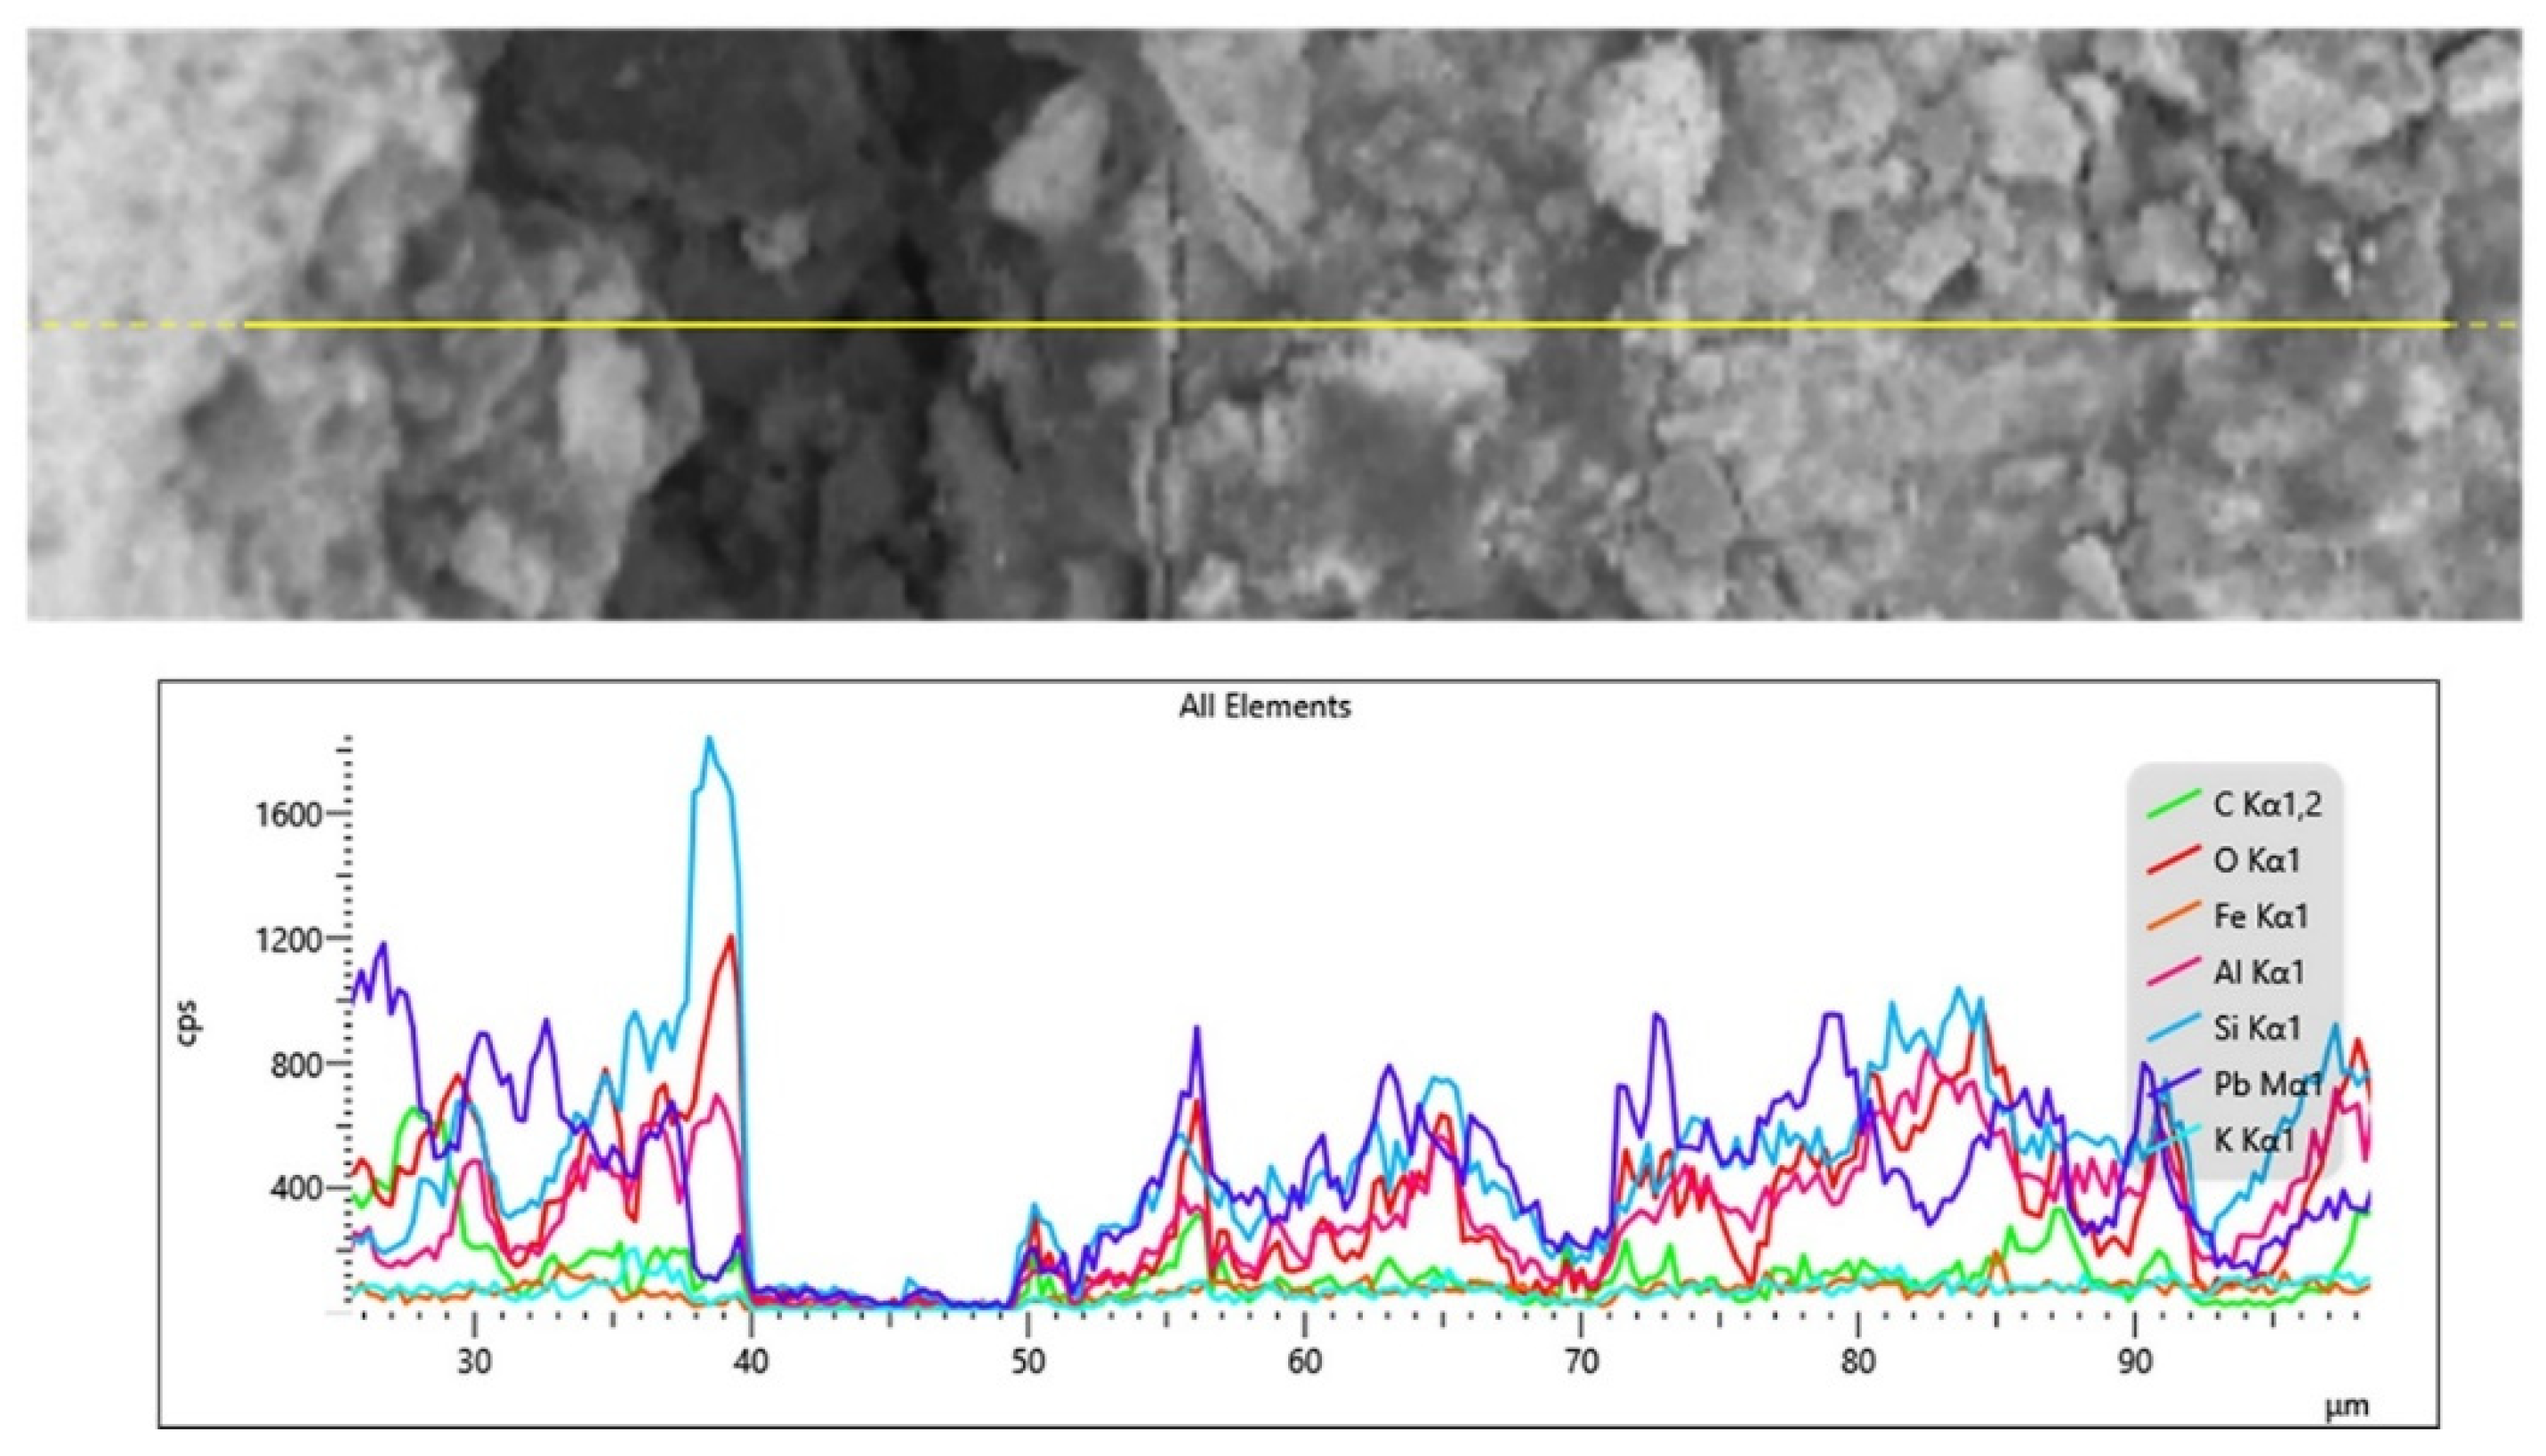
Figure 12.
Micrographs illustrating the interface between the glass and lead layer in the alternative Chu sample.
Figure 12.
Micrographs illustrating the interface between the glass and lead layer in the alternative Chu sample.
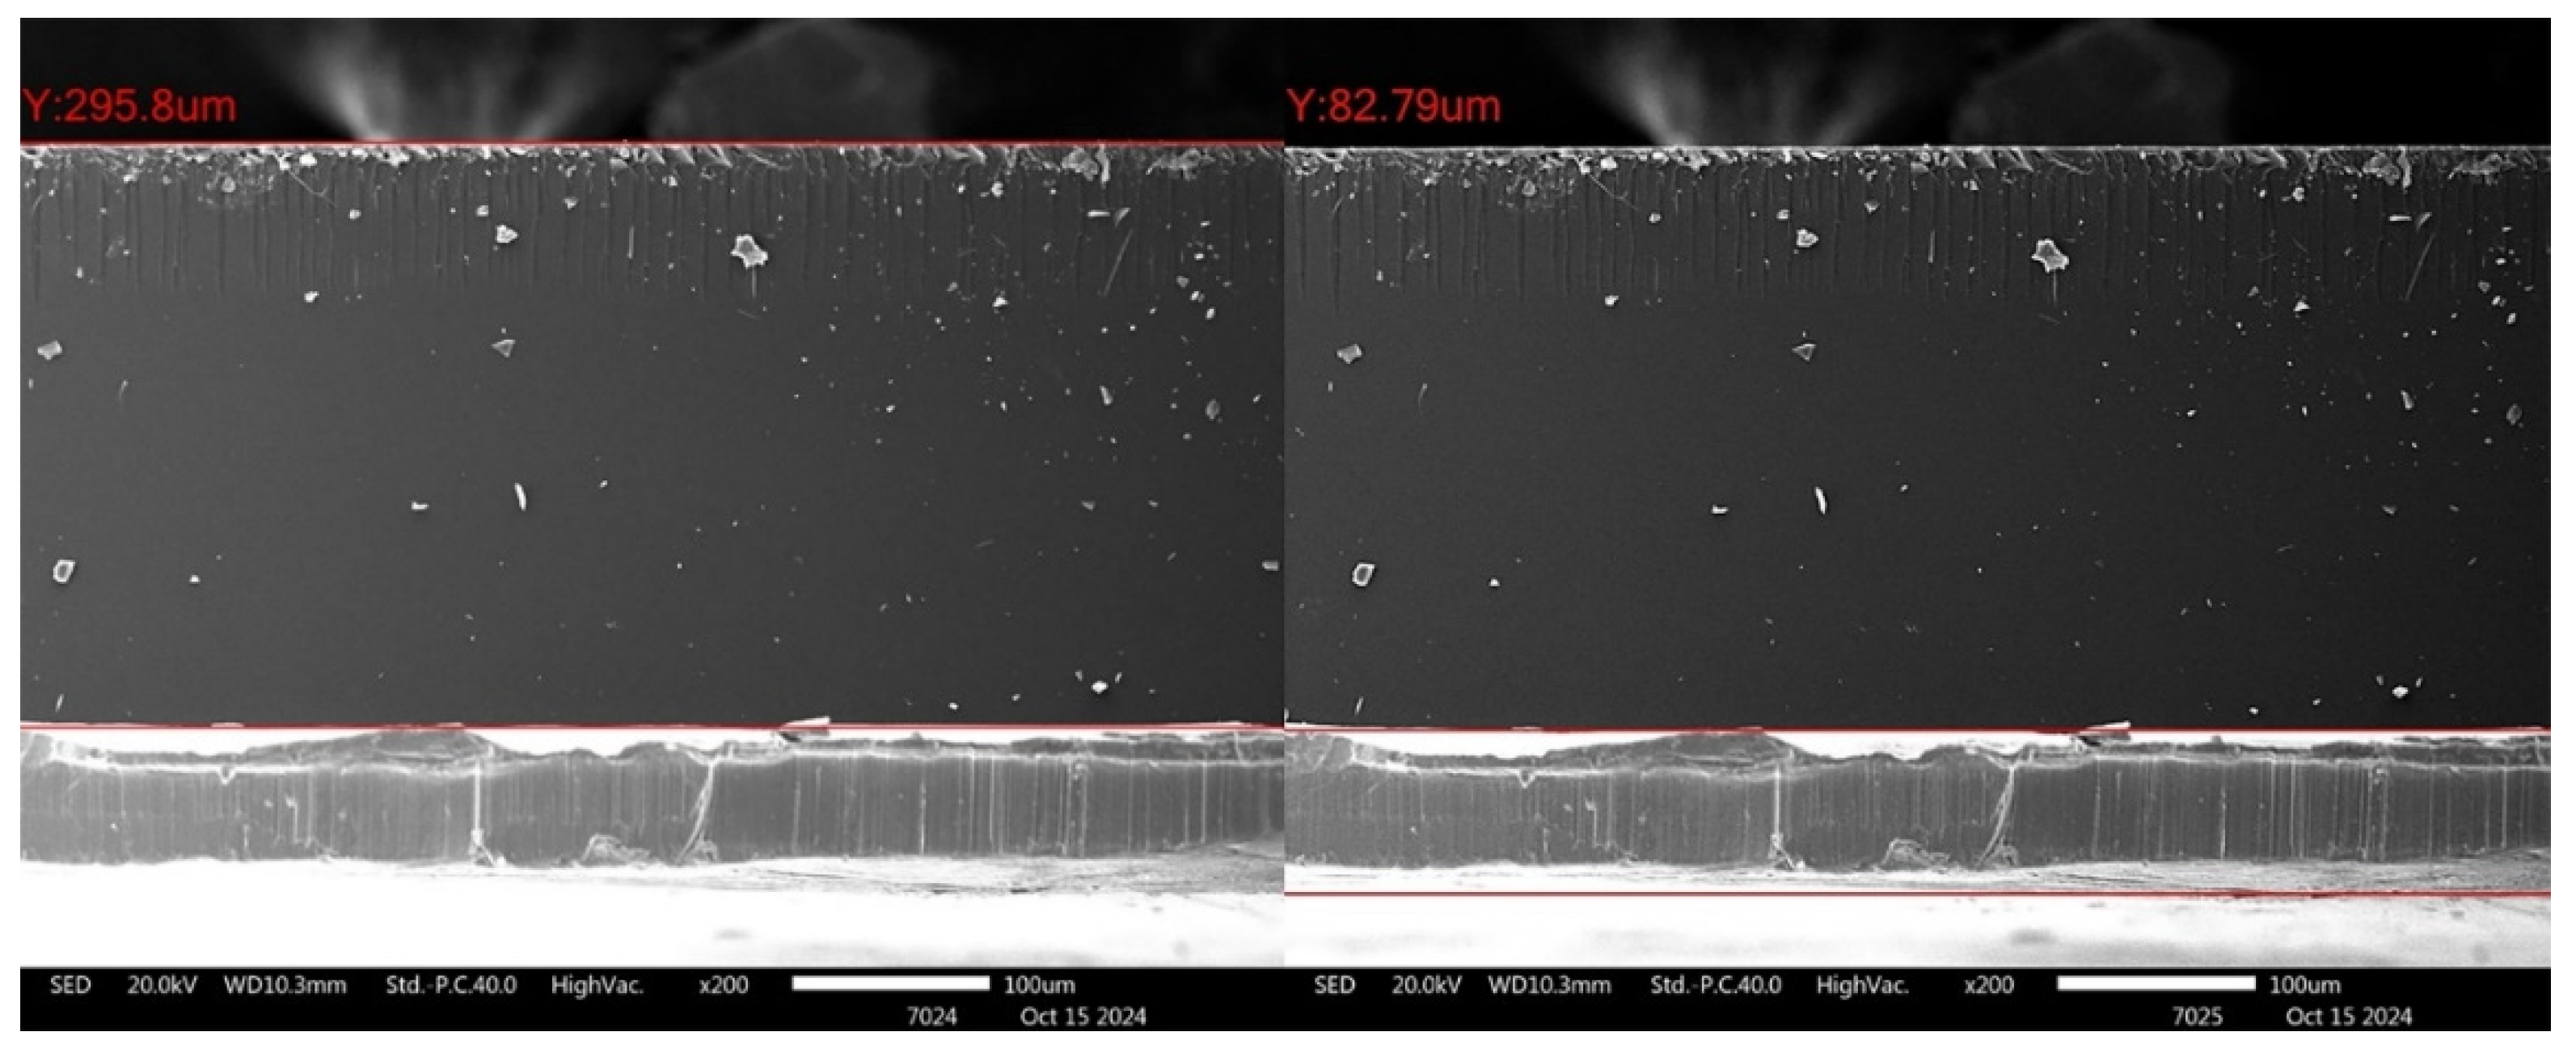
Figure 13.
Depth profiles of ‘gold glass’ Chu mirrors analyzed by XPS: (a) ancient glass side, (b) ancient lead side, (c) alternative glass side, and (d) alternative lead side.
Figure 13.
Depth profiles of ‘gold glass’ Chu mirrors analyzed by XPS: (a) ancient glass side, (b) ancient lead side, (c) alternative glass side, and (d) alternative lead side.
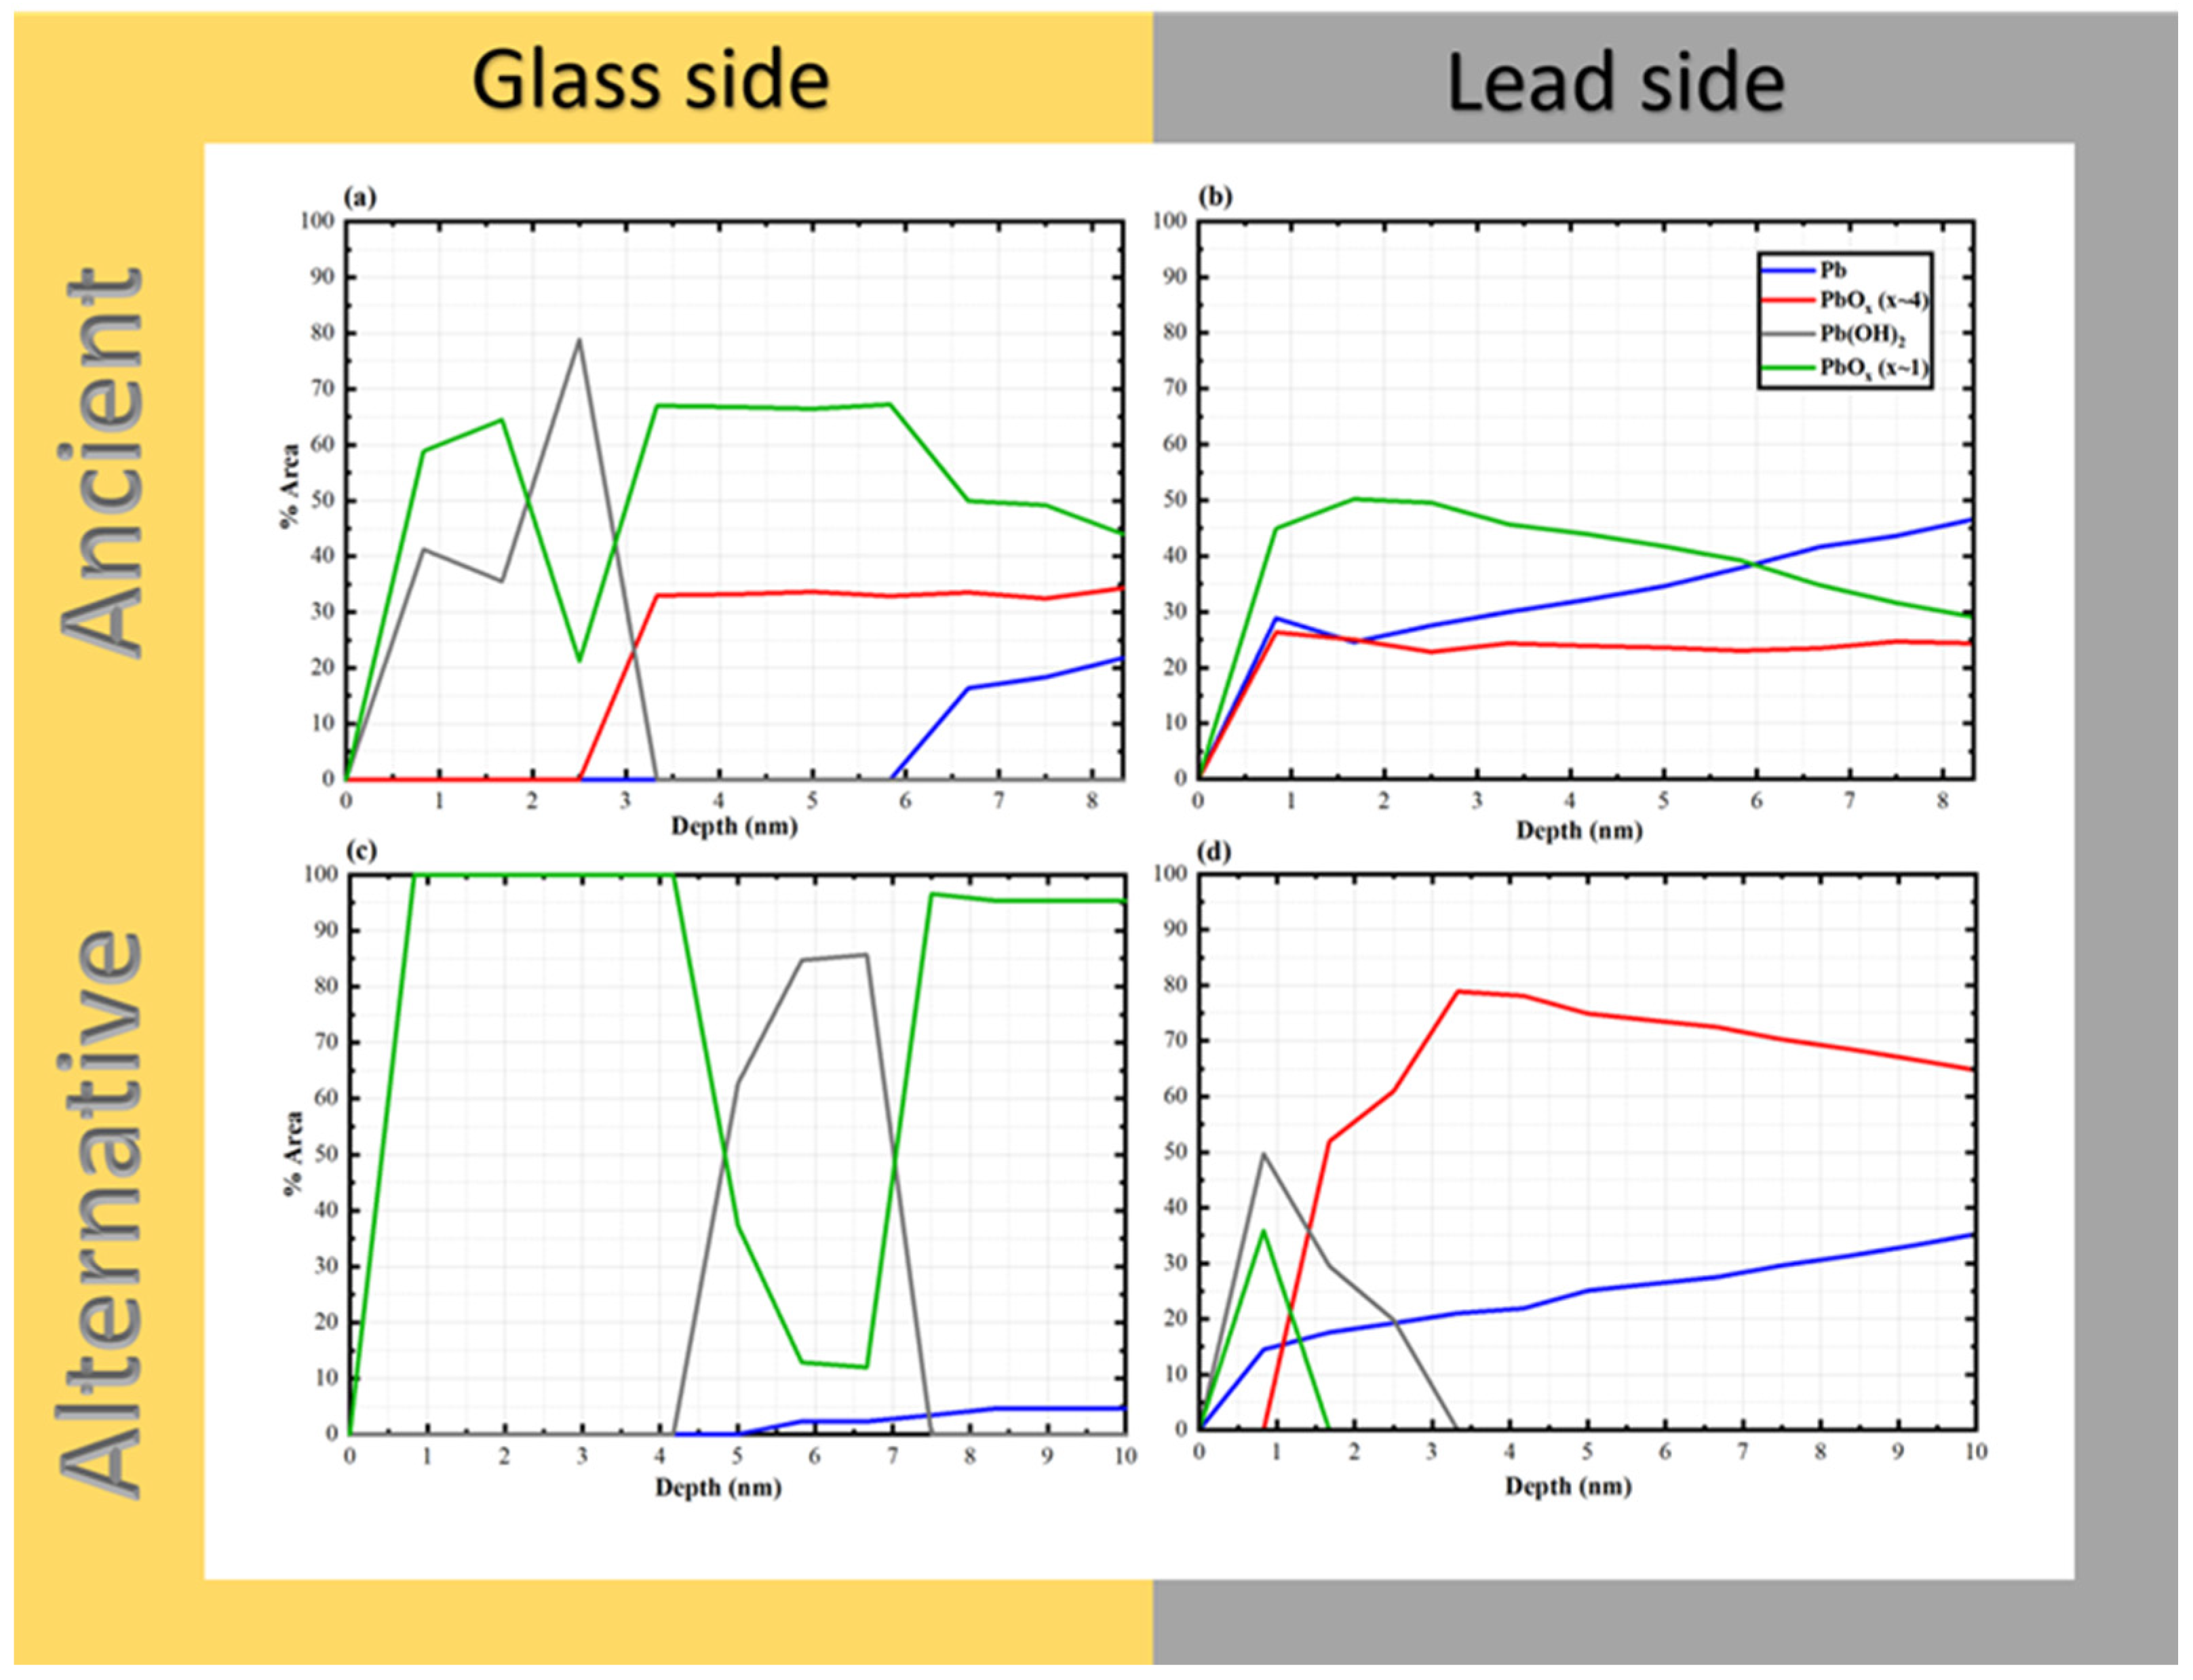
Table 1.
Nominal composition of the selected glass used for preparing the yellow glass sheet.
| Oxide | SiO2 | PbO | Na2O | K2O | P2O5 | CaO | Al2O3 | ZnO | CuO | Fe2O3 | MgO | MnO | TiO2 | BaO | SO3 |
|---|---|---|---|---|---|---|---|---|---|---|---|---|---|---|---|
| wt% | 49.7 | 17.3 | 13.2 | 4.0 | 0.5 | 2.5 | 2.2 | 0.3 | 0.1 | 6.4 | 0.9 | 1.1 | 0.2 | 0.1 | 1.5 |
Table 2.
Elemental composition (wt%) of “gold glass” Kriab and Chu mirrors analyzed from the yellow glass surface using a portable XRF technique. The data represent samples found in Thailand and Indonesia, excluding colorless samples from Pakistan.
Table 2.
Elemental composition (wt%) of “gold glass” Kriab and Chu mirrors analyzed from the yellow glass surface using a portable XRF technique. The data represent samples found in Thailand and Indonesia, excluding colorless samples from Pakistan.
| Element | LE | Mg | Al | Si | P | K | Ca | Ti | Mn | Fe | Cu | Zn | Sr | Zr | Nb | Cd | Pb |
|---|---|---|---|---|---|---|---|---|---|---|---|---|---|---|---|---|---|
| CM1 | 50.335 | 0 | 1.001 | 22.609 | 0 | 0.667 | 4.742 | 0 | 0.328 | 4.940 | 0.023 | 0.034 | 0 | 0 | 0.020 | 0 | 15.299 |
| CM2 | 58.469 | 0 | 1.094 | 21.312 | 0.266 | 0.581 | 3.855 | 0.079 | 0.633 | 4.490 | 0.056 | 0.043 | 0 | 0 | 0 | 0 | 9.123 |
| LPhu3 | 53.081 | 0 | 1.109 | 24.547 | 0 | 0.680 | 4.896 | 0 | 1.017 | 5.167 | 0.039 | 0.029 | 0 | 0 | 0.092 | 0 | 9.342 |
| LPhu5 | 7.193 | 0 | 0.998 | 27.152 | 0.433 | 2.074 | 1.167 | 0 | 0 | 5.917 | 0.060 | 0.021 | 0 | 0 | 0 | 0.015 | 54.971 |
| NAN4 | 55.044 | 0 | 1.101 | 24.505 | 0 | 1.097 | 4.569 | 0.055 | 0.926 | 4.903 | 0.064 | 0.045 | 0 | 0 | 0 | 0 | 7.683 |
| NAN6 | 15.493 | 0 | 0.892 | 15.485 | 0.293 | 2.881 | 1.736 | 0 | 0 | 3.175 | 0.083 | 0.026 | 0 | 0 | 0 | 0.023 | 59.910 |
| PHRAE1 | 55.688 | 0 | 0.936 | 22.487 | 0 | 1.219 | 3.619 | 0.050 | 0.480 | 3.668 | 0.037 | 0.119 | 0 | 0 | 0 | 0 | 11.697 |
| TAK5 | 59.620 | 0 | 1.260 | 19.690 | 0.310 | 0.500 | 3.620 | 0.080 | 0.710 | 3.870 | 0.050 | 0.040 | 0 | 0 | 0 | 0 | 10.260 |
| NRTWat1 | 5.438 | 0 | 1.437 | 14.956 | 0 | 3.421 | 1.265 | 0 | 0 | 6.852 | 0.098 | 0.040 | 0 | 0 | 0.116 | 0.030 | 66.346 |
| SoKhla15 | 22.357 | 0 | 0.369 | 17.364 | 0 | 1.887 | 1.692 | 0 | 0.032 | 7.351 | 0.091 | 0 | 0 | 0 | 0 | 0 | 48.857 |
| BKK2 | 1.194 | 0 | 0 | 17.162 | 0 | 3.704 | 0 | 0 | 0 | 3.004 | 0.081 | 0.098 | 0 | 0 | 0 | 0 | 74.756 |
| Autt1 | 2.170 | 0 | 16.422 | 16.422 | 0 | 1.730 | 0.425 | 0 | 0 | 5.461 | 0.104 | 0.031 | 0 | 0 | 0 | 0.026 | 73.286 |
| ChiN1 | 26.409 | 0 | 16.702 | 16.702 | 0 | 2.710 | 2.085 | 0 | 0 | 3.723 | 0.020 | 0.022 | 0 | 0 | 0 | 0.007 | 47.000 |
| Indonesia | 13.774 | 0 | 1.840 | 15.890 | 0 | 3.390 | 2.180 | 0 | 0 | 4.430 | 0.090 | 0.050 | 0 | 0 | 0.100 | 0.020 | 58.240 |
| Pakistan | 53.560 | 1.360 | 0.630 | 34.470 | 0 | 0.260 | 5.120 | 0.180 | 0 | 0.170 | 0 | 0.300 | 0.010 | 0.020 | 0 | 0 | 4.200 |
Table 3.
Chemical composition (wt%) of “gold glass” Kriab and Chu mirrors analyzed from the yellow glass surface using a WD-XRF technique.
Table 3.
Chemical composition (wt%) of “gold glass” Kriab and Chu mirrors analyzed from the yellow glass surface using a WD-XRF technique.
| Sample Code | Type | Century* | Na2O | MgO | Al2O3 | SiO2 | P2O5 | SO3 | K2O | CaO | TiO2 | MnO | Fe2O3 | NiO | CuO | ZnO | As2O3 | Rb2O | SnO2 | Sb2O3 | BaO | PbO |
|---|---|---|---|---|---|---|---|---|---|---|---|---|---|---|---|---|---|---|---|---|---|---|
| CM1 | Chu | 20th ~ 1922 | 2.52 | 0.85 | 5.91 | 42.94 | 0.44 | 0.24 | 5.01 | 2.98 | 0.22 | 0.04 | 6.10 | 0 | 0.07 | 0.03 | 0 | 0 | 0.36 | 0 | 0.06 | 32.24 |
| CM2 | Chu | 19th ~1818 | 7.87 | 0.58 | 3.78 | 62.52 | 1.28 | 0.47 | 1.47 | 7.89 | 0.18 | 0.86 | 6.91 | 0 | 0.08 | 0.06 | 0 | 0 | 0 | 0.04 | 0.10 | 5.90 |
| LPhu3 | Chu | 20th ~1933 | 10.92 | 0.58 | 3.19 | 62.22 | 0.09 | 0.24 | 1.33 | 8.32 | 0.15 | 1.11 | 6.42 | 0 | 0.04 | 0.04 | 0 | 0 | 0 | 0.02 | 0.11 | 5.21 |
| LPhu5 | Chu | ? | 0.59 | 0.41 | 3.00 | 56.59 | 1.75 | 0.34 | 2.42 | 2.48 | 0.15 | 0.05 | 4.56 | 0 | 0.06 | 0.02 | 0 | 0 | 0.07 | 0 | 0 | 27.51 |
| NAN1 | Chu | 18th ~1767 | 0.53 | 1.23 | 6.22 | 22.88 | 3.17 | 2.85 | 2.95 | 12.7 | 0.28 | 0.04 | 3.96 | 0 | 0.06 | 0.04 | 0.33 | 0 | 0 | 0 | 0.49 | 42.26 |
| NAN4 | Chu | 20th ~1901 | 10.91 | 0.58 | 3.28 | 62.85 | 0.06 | 0.23 | 1.96 | 8.04 | 0.15 | 0.97 | 6.19 | 0 | 0.07 | 0.05 | 0 | 0 | 0.17 | 0.04 | 0.13 | 4.31 |
| NAN6 | Chu | 20th ~1922 | 1.94 | 0.24 | 2.96 | 41.44 | 1.03 | 0.22 | 4.46 | 3.60 | 0.10 | 0.05 | 3.71 | 0 | 0.10 | 0.40 | 0 | 0 | 0.17 | 0 | 0 | 39.93 |
| PHRAE1 | Chu | 20th ~1920 | 9.86 | 0.53 | 2.97 | 62.07 | 0.08 | 0.24 | 2.37 | 7.46 | 0.13 | 0.59 | 5.28 | 0 | 0.05 | 0.15 | 0 | 0 | 0.11 | 0.06 | 0.10 | 7.94 |
| TAK5 | Chu | 20th ~1920 | 9.04 | 0.63 | 2.64 | 67.67 | 0.42 | 0.34 | 1.21 | 9.07 | 0.11 | 1.29 | 2.87 | 0 | 0.10 | 0.08 | 0.07 | 0 | 0.03 | 0.03 | 0.12 | 4.28 |
| PheRi3 | Chu | 18-19th | 0.03 | 1.13 | 4.30 | 19.83 | 2.03 | 4.5 | 4.55 | 22.47 | 0.20 | 0.04 | 1.05 | 0 | 4.60 | 1.65 | 0.44 | 0 | 0.04 | 0 | 0 | 33.14 |
| NRTWat1 | Chu | 19th~1873 | 2.25 | 0.22 | 3.76 | 30.89 | 0.09 | 0.11 | 4.4 | 2.78 | 0.22 | 0.02 | 6.43 | 0 | 0.11 | 0.05 | 0 | 0 | 0.5 | 0 | 0 | 48.17 |
| SoKhla15 | Chu | 19th ~1856 | 5.08 | 0.37 | 1.47 | 41.68 | 0.11 | 0.13 | 2.94 | 3.36 | 0.08 | 0.07 | 7.84 | 0 | 0 | 0 | 0 | 0 | 0.25 | 0 | 0 | 36.61 |
| BKK2 | Kriab | 18-19th | 0.97 | 0.21 | 1.05 | 41.71 | 0.32 | 0.15 | 4.75 | 1.53 | 0 | 0 | 3.23 | 0 | 0.11 | 0.12 | 0 | 0 | 1.06 | 0 | 0 | 44.78 |
| RatBR3 | Kriab | 19th~1824 | 3.72 | 0.49 | 3.91 | 56.78 | 1.85 | 0.53 | 1.55 | 10.32 | 0.16 | 0.92 | 6.02 | 0 | 0.08 | 0.05 | 0 | 0 | 0.14 | 0.07 | 0.22 | 13.18 |
| Autt1 | Kriab | 19th ~1847 | 0.28 | 0.22 | 1.14 | 38.7 | 1.11 | 0.24 | 2.78 | 2.10 | 0 | 0.03 | 6.03 | 0 | 0.12 | 0.03 | 0 | 0.02 | 0.05 | 0 | 0 | 47.16 |
| ChiN1 | Kriab | 18-19th | 3.98 | 0.49 | 3.78 | 42.22 | 0.68 | 0.2 | 4.47 | 4.46 | 0.16 | 0.06 | 4.69 | 0 | 0.04 | 0.04 | 0 | 0 | 0.21 | 0 | 0 | 34.52 |
| NaSiTh4 | Kriab | ? | 0.51 | 0.29 | 2.60 | 49.97 | 0.29 | 0.18 | 8.01 | 3.74 | 0.16 | 0.04 | 1.07 | 0 | 1.21 | 0.28 | 0.36 | 0 | 0.11 | 0.13 | 0 | 31.05 |
| Indonesia | Chu | ? | 3.18 | 0.77 | 4.01 | 29.26 | 0.56 | 2.65 | 7.13 | 4.48 | 0.27 | 0.14 | 6.77 | 0 | 0.05 | 0.04 | 0 | 0 | 0.34 | 0 | 0 | 40.35 |
| BKK [7]-1 | Kriab | 19-20th | 10.50 | 0 | 3.30 | 62.00 | 0 | 0 | 1.70 | 10.6 | 0.18 | 1.61 | 8.66 | 0.01 | 0.10 | 0.08 | 0 | 0 | 0 | 0 | 0.18 | 1.60 |
| BKK [7]-2 | Kriab | 19-20th | 9.60 | 0 | 3.80 | 61.00 | 0 | 0 | 1.60 | 9.90 | 0.21 | 1.69 | 9.36 | 0.01 | 0.08 | 0.07 | 0 | 0 | 0 | 0 | 0.17 | 2.10 |
| BKK [7]-3 | Kriab | 19-20th | 8.30 | 0 | 3.50 | 55.00 | 0 | 0 | 1.40 | 7.50 | 0.15 | 0.64 | 6.95 | 0.01 | 0.12 | 0.08 | 0 | 0 | 0 | 0 | 0.11 | 15.90 |
| BKK [7]-4 | Kriab | 19-20th | 8.30 | 0 | 3.50 | 55.00 | 0 | 0 | 1.40 | 7.60 | 0.16 | 0.65 | 7.07 | 0.01 | 0.13 | 0.08 | 0 | 0 | 0 | 0 | 0.10 | 15.30 |
| CM [8] | Chu | 19-20th | 18.08 | 0.57 | 3.39 | 59.36 | 0 | 0 | 1.56 | 5.57 | 0.04 | 1.12 | 2.50 | 0 | 0.24 | 0 | 0 | 0 | 0 | 0 | 0 | 7.57 |
| PheRi4(Green)# | Kriab | 18th~1703 | 0.45 | 0.91 | 1.66 | 37.88 | 1.71 | 1.91 | 4.04 | 2.92 | 0 | 0 | 0.39 | 0 | 3.71 | 0.77 | 0 | 0 | 0.29 | 0 | 0 | 43.36 |
The century* indicates the time period when the structure or object was originally built or restored. If specified as a period, such as “18th–19th century,” the estimate is derived from expert assessments conducted by the Department of Archaeology, Fine Arts Department. If marked with the symbol “?”, it indicates that there is no available documentation or evidence to estimate the age. PheRi4(Green)# is the oldest collected example and is green in color. At the time of its survey, no gold-colored glass specimens were recorded.
Table 4.
Comparison of elemental compositions determined by semi-quantitative WDS and high-performance WD-XRF techniques on the thin glass layer of the yellow ancient Chu mirror (CM1).
Table 4.
Comparison of elemental compositions determined by semi-quantitative WDS and high-performance WD-XRF techniques on the thin glass layer of the yellow ancient Chu mirror (CM1).
| Component |
Semi-quantitative WDS (3 points analysis) |
High-Performance WD-XRF (Bulk analysis) |
| wt % | wt% | |
| SiO2 | 41.22 | 47.25 |
| B2O3 | 13.33 | - |
| PbO | 10.63 | 14.25 |
| Na2O | 7.46 | 7.41 |
| K2O | 1.91 | 2.44 |
| MgO | 1.23 | 1.43 |
| CaO | 8.25 | 10.76 |
| Al2O3 | 3.24 | 4.24 |
| Fe2O3 | 3.65 | 4.53 |
| CuO | - | 0.37 |
| ZnO | 0.35 | 0.41 |
| MnO | 0.09 | 0.32 |
| P2O5 | 6.54 | 6.59 |
| NaCl | 2.10 | - |
Disclaimer/Publisher’s Note: The statements, opinions and data contained in all publications are solely those of the individual author(s) and contributor(s) and not of MDPI and/or the editor(s). MDPI and/or the editor(s) disclaim responsibility for any injury to people or property resulting from any ideas, methods, instructions or products referred to in the content. |
© 2025 by the authors. Licensee MDPI, Basel, Switzerland. This article is an open access article distributed under the terms and conditions of the Creative Commons Attribution (CC BY) license (https://creativecommons.org/licenses/by/4.0/).
Copyright: This open access article is published under a Creative Commons CC BY 4.0 license, which permit the free download, distribution, and reuse, provided that the author and preprint are cited in any reuse.


