
Submitted:
27 November 2025
Posted:
27 November 2025
You are already at the latest version
Abstract
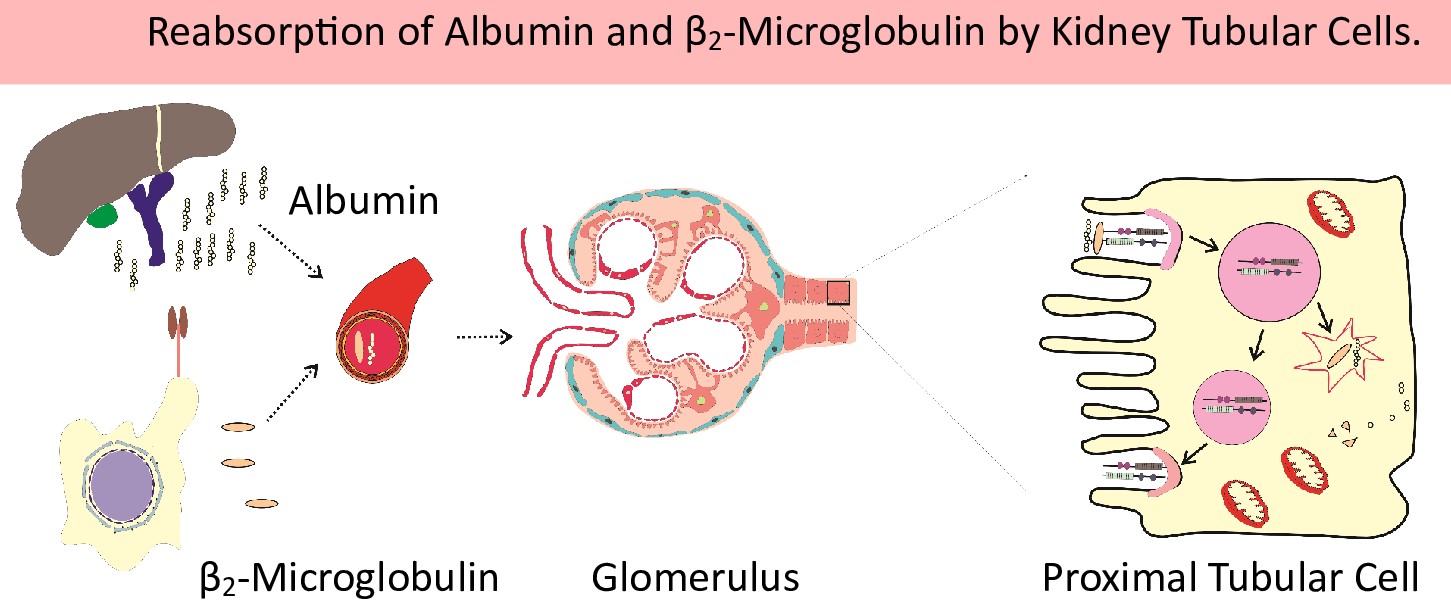
Accumulating evidence suggests that exposure to pollution from environmental cadmium (Cd) contributes to diabetic kidney disease as indicated by albuminuria and a progressive decrease in the estimated glomerular filtration rate (eGFR). This study examined the effects of Cd exposure on eGFR and the excretion rates of albumin (Ealb) and β2-microglobulin (Eβ2M) in 65 diabetics and 72 controls. Excretion of Cd (ECd) was a measure of exposure, while excretion of N-acetylglucosaminidase (ENAG) reflected the extent of kidney tubular cell injury. In participants with an elevated excretion of Eβ2M, the prevalence odds ratios (POR) for a reduced eGFR rose 6.4-fold, whereas the POR for albuminuria rose 4.3-fold, 4.1-fold, and 2.8-fold in those with a reduced eGFR, diabetes, and hypertension, respectively. By using covariance analysis, which adjusted for the interactions, 43% of the variation in Ealb among diabetics could be explained by female gender (η2 = 0.176), ENAG (η2 = 0.162), hypertension (η2 = 0.146), smoking (η2 = 0.107) and body mass index (η2 = 0.097), while the direct contribution of ECd to Ealb variability was minimal (η2 = 0.005). Results from a mediation analysis inferred that Cd could indirectly contribute to albuminuria and a falling eGFR through inducing additional tubular cell injury, leading to reduced reabsorption of filtered protein, albumin and β2M included.
Keywords:
albuminuria
; cadmium
; diabetic kidney disease
; estimated glomerular filtration rate
; hypertension
; N-acetylglucosaminidase
1. Introduction
Prediabetes and diabetes (DM) are respectively designated when fasting plasma glucose (FPG) concentrations ≥ 110 and ≥ 126 mg/dL [1]. Persistent albuminuria and a progressive decline in an estimated glomerular filtration rate (eGFR) are the complications of diabetes, known as diabetic kidney disease (DKD) [2,3,4]. The severity of DKD has been based on albumin excretion rate (Ealb), expressed as urinary albumin-to-creatinine ratio (ACR) where microalbuminuria and macroalbuminuria are described [3,4]. Notably, however, about 30% of DKD patients had abnormal eGFR together with normal ACR figures; <20 mg/g creatinine (cr) in men and <30 mg/g cr in women [4,5,6]. A wide spectrum of DKD has increasingly been recognized, suggesting involvement of different pathogenic factors. Dietary exposure to low doses of the metal contaminant cadmium (Cd) has emerged as one of the potential contributors to DKD onset and its progression; the mechanism, however, remains unclear.
The kidney and liver are the two organs in the body that produce and release glucose into the circulation [7,8,9,10]. In addition, the kidney is responsible for filtration, and retrieval of 160 to 180 g of glucose each day, mediated by the sodium glucose co-transporter 1 (SGLT1) and SGLT2 [10]. Increased abundance of the glucose transporters may raise the renal threshold for glucose excretion [8]. The deterioration of eGFR can be attenuated by SGLT2 inhibitors [11].
Acquired Cd accumulates mostly within the kidney tubular cells, where its levels increase through to the age of 50 years but decline thereafter due to its release into the urine as the injured tubular cells die [12]. Thus, excretion of Cd (ECd) reflects kidney accumulation of Cd and its nephrotoxicity [13]. A prospective cohort study causally linked a fall of eGFR at a high rate to ECd [14]. Furthermore, increased risks of prediabetes, diabetes and albuminuria were associated with ECd, while FPG correlated with ECd [15,16,17,18,19]. Excretion of N-acetylglucosaminidase (NAG) and kidney injury molecule-1 have also been related to ECd [20,21,22].
Intriguingly, the excretion rates of NAG (ENAG) and β2-microglobulin (Eβ2M) were enhanced in DM [23,24,25,26,27], while glycemic risk indices were associated with an elevated ENAG that preceded albuminuria [28]. This study explored how Cd exposure induces albuminuria and a falling eGFR by examining associations of Ealb, ENAG and eGFR in Cd-exposed DM (n = 65) and Cd-exposed controls (n = 72). Also, it was to show the effects of adjusting Ealb, ENAG, Eβ2M and ECd to creatinine excretion (Ecr) that obscured Cd effects.
2. Results
2.1. Descriptive Data on the Controls and Diabetics
Characteristics of the controls and diabetes are enlisted in Table 1.
This cohort had 30 men and 107 women with the overall mean age (range) 59.7 (41−80) years and the overall mean BMI (range) of 25.6 (15-48) kg/m2. Respective percentages (%) of smoking, reduced eGFR and hypertension were 10.4, 11.9 and 54.2. Nearly half (49.3%) had FPG ≥ 110 mg/dL, while 39.6 % had FPG ≥ 126 mg/dL. The overall % Ecr-based albuminuria was 22.4 and 26 for Ccr-based albuminuria.
Across the three study groups, % smoking and reduced eGFR were similar, while % hypertension was highest, middle, and lowest in the ≥ 10-yr DM (80), < 10-yr DM (54.1) and CTRL (44.9). Ccr-based microalbuminuria was highest, middle, and lowest in the ≥ 10-yr DM (52), <10-yr DM (33.3) and CTRL (12.9), while % macroalbuminuria were 0, 10.8 and 8. The variations in age, eGFR, DBP, ECd/Ecr, and ECd/Ccr across the three groups were insignificant. The variables showing significant variations across the three study groups were BMI, FPG, SBP, [β2M]s, [β2M]u, Ealb/Ecr , and Ealb/Ccr.
2.2. Comparing Cd Exposure and other Measured Variables in Three Study Groups
The distribution of ECd, eGFR, FPG ([Glc]p) and serum β2M are presented in Figure 1.
Neither ECd/Ccr (Figure 1A) nor eGFR (Figure 1B) show a significant variation across the three study groups, while FPG (Figure 1C) and serum β2M (Figure 1D) were higher in diabetics than controls.
Figure 2 presents the distribution of data on kidney tubular cell injury (ENAG/Ccr) and its function, assessed with Ealb/Ccr, Eβ2M/Ccr and FrTDβ2M.
2.3. Logistic Regression Modeling of Albuminuria and reduced eGFR
Logistic regression model analysis was used to define the determinants of the prevalence odds ratios (POR) for albuminuria and reduced eGFR using Ccr-based data (Table 2).
Age, BMI, ECd/Ccr, smoking and gender had little effects on the POR for albuminuria. However, this parameter was increased 4.3-fold, 4.1-fold, and 2.8-fold in those with reduced eGFR (p = 0.027), diabetes (p = 0.020), and hypertension (p = 0.032). Age and Eβ2M/Ccr ≥ 3, µg/L filtrate were associated with 1.15-fold and 6.4-fold increases in the POR for reduced eGFR, respectively.
For Ecr-based data (Table S1), the POR for albuminuria was increased 5.7-fold, 7.1-fold, and 3.7-fold in women (p = 0.015), those with diabetes (p < 0.001) and hypertension (p = 0.027). Notably, however, an association of Ecr-based albuminuria with reduced eGFR did not reach a statistically significance level (p = 0.052). Age was the only variable associated with reduced eGFR (POR 1.052, p = 0.002) (Table S2).
As shown in Table 3 and Table 4, variables altogether explained significant fractions of Ealb and eGFR variability in CTRL, DM, and women, but they explain a little Ealb variation in men was insignificant. Results of covariance analyses of Ealb and eGFR using Ecr-based data are provided in Tables S3 and S4.
In CTRL (Table 3), Ealb was influenced by FrTDβ2M (η2 = 0.228), hypertension (η2 = 0.210). smoking (η2 = 0.194) and gender (η2 = 0.115). In DM, Ealb in diabetes was influenced by gender (η2 = 0.176), ENAG (η2 = 0.162), hypertension (η2 = 0.146), smoking (η2 = 0.107), and BMI (η2 = 0.097), while ECd and FrTDβ2M. showed minimal effects.
In CTRL (Table 4), ENAG explained the largest fraction eGFR variation (η2 = 0.301). The eGFR variation among DM was explained by ENAG (η2 = 0.199), Eβ2M (η2 = 0.183) and age (η2 = 0.140). In women, eGFR was explained by ENAG (η2 = 0.222), FPG (η2 = 0.109), and Eβ2M (η2 = 0.072).
2.4. Bivariate Analysis of Ealb
Table 5 provides results of the Spearman’s rank correlation analysis.
Ealb varied inversely with FrTDβ2M (r = −0.237) and directly with FPG (r = 0.273), ENAG (r = 0.327) and Eβ2M (r = 0.265). A correlation between Ealb and ECd was insignificant. Apparently, the strength of Ealb/ENAG correlation was the highest, compared to other 4 variables tested. Consequently, scatterplots and regression analysis were used to further examined Ealb and ENAG/Ccr relationship in subgroups (Figure 3).
Ealb showed a moderate association with ENAG in diabetics but not in controls (Figure 3A). It was strongly associated only with those who had FPG ≥110 mg/dL (Figure 3B). Ealb showed a strong association with Eβ2M in diabetics (Figure 3C) and those with FPG ≥110 mg/dL (Figure 3D). The associations of Ealb with Eβ2M in controls and those with FPG <110 mg/dL were insignificant (Figure 3C,D).
2.5. The Indirect Effects of Cd on Ealb and eGFR
Because Cd explain minimally the variations in Ealb and eGFR (Table 4 and Table 5), a simple mediation model analysis was conducted to determine whether Cd could indirectly influence Ealb and eGFR (Figure 5).
In Figure 5, ENAG was depicted as the mediator of Cd effect on Ealb (model A) and eGFR (model B). In both models A and B, the Sobel test of the direct effects of Cd were insignificant, reflected by β values and p-values for the c′ parameter. The significant indirect effect (a*b) inferred that ENAG mediated fully the effects of Cd on Ealb and eGFR (Figure 4A,B).
3. Discussion
The present Thai cohort with a modest sample size (65 DM and 72 CTRL) has provided several insights into the effects of low-dose Cd in combination with a high fasting plasma glucose (one form of metabolic stress). Results of logistic regression modeling and covariance analyses of the two major outcomes; albuminuria and a reduced eGFR have revealed the dominant tubular basis of the nephrotoxicity from a low-dose Cd.
3.1. Effects of Cd on FPG and Albuminuria
The levels of Cd exposure experienced by cohort participants were insufficient to induce DM, evident from an insignificant correlation between ECd and FPG (r = 0.166, p = 0.053) (Table 5), and the ECd geometric mean below 1 µg/g cr. A study from Korea reported an association between increased risk of DM with ECd 2-3 µg/g cr, where a significant correlation was found between ECd and FPG [15]. In a study on U.S. population, ECd of 1–2 μg/g cr was associated with 24-48% increases in risk of prediabetes and diabetes adjusting for potential confounders [16]. Furthermore, macroalbuminuria was present only in the DM group although the DM and CTRL groups both had ECd in the same range (Table 1, Figure 1). Thus, the diabetogenic effects of Cd at the exposure levels in this cohort participants appeared to be minimal.
Notably, microalbuminuria (Ecr-based) was found in both CTRL and DM; 8.3% of CTRL had microalbuminuria, while 35.1% of the <10-yr DM and 44% in the ≥10-yr DM had microalbuminuria (Table 1). These data suggest Ealb was particularly sensitive to Cd, consistent with the studies from Spain and China, where the increment of albuminuria risk was observed at ECd below 0.5 µg/g cr [18,19]. Compared to the ACR-based, the % microalbuminuria (Ccr-based) were higher in the CTR (12.9), the <10-yr DM (33.3), and the ≥10-yr DM (52.0) groups, indicating the tendency to underestimate the nephrotoxicity of Cd when Ealb was adjusted to Ecr, illustrated in SM (Tables S1-S4).
3.2. Albuminuria and Reduced eGFR: The Tubular Rule
In an analysis of risk factors for albuminuria (Table 2), diabetes, reduced eGFR and hypertension independently increased the risk for albuminuria. Age, BMI, ECd/Ccr, smoking and gender had little effects on the prevalence odds for albuminuria in the present cohort. An impaired tubular function, indicated by Eβ2M/Ccr ≥ 3 µg/L filtrate and age were independent risk factors for reduced eGFR. Using Ecr-based data, the relationship between a reduced eGFR and risk of albuminuria was obscured as was the relationship between tubular dysfunction and a reduced eGFR (Tables S1 and S2).
Covariance analyses (Table 3 and Table 4) provide further evidence for the tubular roles in albuminuria onset and eGFR reduction. In CTRL, FrTDβ2M accounted for the largest fraction of the variation in Ealb (η2 = 0.228), while ENAG explained the largest fraction of the eGFR variation (η2 = 0.301). In DM, gender contributed the most to the variation in Ealb (η2 = 0.176) followed by ENAG (η2 = 0.162), hypertension (η2 = 0.146), smoking (η2 = 0.107), and BMI (η2 = 0.097). ENAG explained the largest fraction of eGFR variation in DM (η2 = 0.199), followed by Eβ2M (η2 = 0.183) and age (η2 = 0.140).
The above findings are in line with the SPRINT Trial, where clinical and demographic characteristics were found to be associated with unique profiles of tubular damage, which indicated under-recognized patterns of kidney tubule disease among individuals with reduced eGFR [29].
3.3. Mediation Analysis for the Indirect Effects of Cd
As shown in Table 5, Ealb correlated more strongly with ENAG than with FrTDβ2M, FPG and Eβ2M, while a correlation between Ealb and ECd was insignificant. In subgroup analysis (Figure 3), the Ealb/ENAG association was present only in DM and those with FPG ≥ 110 mg/dL. Of relevance, a cross-sectional study from Japan (DM = 245, CTRL= 39) showed that Ealb/Ecr and ENAG/Ecr were associated with glycemia risk index, and the elevation of ENAG/Ecr occurred before the onset of albuminuria.
As also shown in Table 5, eGFR inversely correlated with ENAG (r = −0.467), and its inverse association with ENAG was found in women together with an inverse association of eGFR with Ealb (Figure 5). The small number of men (n = 29) compared to women (n = 106) was a likely explanation for the absence of eGFR/ENAG and eGFR/Ealb associations among men. A further research study with enough men is required. By using mediation analysis (Figure 5), Cd indirectly influenced Ealb and eGFR, while the tubular damage, assessed with ENAG, was identified as the full mediator of Cd effects on these parameters.
In summary, covariance analysis of albuminuria and a reduced eGFR suggests that the contribution of Cd exposure to albuminuria and eGFR reductions both were minimal (Table 3 and Table 4). Consequently, mediation analysis was used to investigate the indirect effects of Cd (Figure 5). Results of the mediation analysis inferred that tubular injury (ENAG) could mediate the Cd effects on both albuminuria and a falling eGFR. These findings underscore the essential tubular role in maintaining plasma glucose. and the injury to tubular cells from any causes can potentially influence risk of hyperglycemia. The kidney is known for its producing and releasing glucose into the circulation as well as its filtration and reabsorption of glucose, mediated primarily by SGLT2 [7,8,9,10]. In clinical trial, reduction of glucose reuptake by SGLT2 inhibitors attenuated the loss of eGFR [11].
4. Materials and Methods
4.1. Participants
Individuals with diabetes (n = 65) and non-diabetic controls (n = 72) in the present study were chosen from a pre-existing cohort of 88 persons with diagnosed diabetes and 88 without diabetes [30]. They met the enrollment criteria, which included living at current addresses for at least 40 years and attending annual health checkups at the Pak Poon municipality health center, Nakhon Si Thammarat Province, Thailand. Exclusion criteria were non-resident status, pregnancy, breast feeding and those with records of ill-health status such as heart disease, stroke, and cancer.
Participants gave written informed consent and they received study objectives, study protocols, potential risks and benefits. Sociodemographic information, educational attainment and occupation were collected using structured interview questionnaires as were health status, family history of diabetes, use of dietary supplements, alcohol consumption, and smoking status [31].
4.2. Collection, Storage and Compositional Analysis of Blood and Urine Samples
Whole blood and urine samples were collected in the morning after an overnight fast at the Pak Poon health center. Urine samples were collected in metal-free polypropylene collection cups. For the glucose assay, blood samples were collected in heparinized tubes, using fluoride as an inhibitor of glycolysis. For analysis of blood metals, ethylene diamine tetra acetic acid was an anticoagulant. All test tubes, bottles, and pipettes used in metal analysis were acid-washed and rinsed thoroughly with deionized water.
Blood and urine samples were kept on ice during transportation to the laboratory, where sample aliquots were prepared. The pH of urine aliquots was adjusted to > 6 using 1M NaOH to prevent the degradation of β2M in acidic conditions. Aliquots of urine, whole blood, serum, and plasma were stored at −80°C for later analysis.
Graphite furnace atomic absorption spectrometry (GBC Scientific Equipment, Hampshire, IL, USA) was employed to determine Cd concentrations in urine and whole blood samples. To prepare samples for AAS, blood samples were deproteinized with 5% HNO3 as previously described [32]. For the instrumental calibration, the certified reference material of nine elements (Centipur®, Merck KGaA, Darmstadt, Germany) was used. Duplicate samples were analyzed for consistency checks. Blank samples were included for contamination monitoring. Reference urine and whole blood metal control levels 1, 2, and 3 (Lyphocheck, Bio-Rad, Hercules, CA, USA) were used for accuracy and precision assurance and quality control purposes.
The limit of detection (LOD) for blood Pb was 3 µg/dL and 0.1 µg/L for blood Cd. The LOD of urinary Cd was 0.1 µg/L. For urine and blood samples containing Cd and Pb concentrations below the LOD figures, the concentrations assigned were the LOD values divided by the square root of 2 [33].
The urinary NAG assay was based on colorimetry, using 4-nitrophenyl N-acetyl-β-D-glucosaminide as a substrate (Merck KGaA, Darmstadt, Germany). Urinary and serum concentrations of β2M were determined using the human beta-2 microglobulin/β2M ELISA pair set (Sino Biological Inc., Wayne, PA, USA). The lower limit of β2M detection was 3.13 pg/mL. The oxidase–peroxidase method (Glu Colorimetric Assay Kit, Elabscience, Catalog No: E-BC-K234-M, Houston, TX, USA) was used to determine plasma glucose concentrations [34]. Jaffe’s alkaline picrate method was used to determine urinary and plasma creatinine concentrations [35]. All assay gave the coefficients of variation (CV) within acceptable clinical chemistry standards.
4.3. Correction for Differences in Urine Dilution
Because urine samples were collected at a single time point (voided urine), a correction for differences among people in urine volume (dilution) was undertaken. Accordingly, Ealb, ENAG, Eβ2M and ECd were normalized to creatinine clearance (Ccr), using the equation; Ex/Ccr = [x]u[cr]p/[cr]u, where x = alb, NAG, β2M or Cd; [x]u = urine concentration of x (mass/volume); [cr]p = plasma creatinine concentration (mg/dL); and [cr]u = urine creatinine concentration (mg/dL). Ex/Ccr was expressed as an amount of x excreted per volume of the glomerular filtrate [36]. This Ccr-normalization is unaffected by variation in muscle mass, while correcting for both dilution and functioning nephrons.
Ealb, ENAG, Eβ2M and ECd were normalized to creatinine excretion (Ecr), using the equation; Ex/Ecr = [x]u/[cr]u, where x = alb, NAG, β2M or Cd; [x]u = urine concentration of x (mass/volume) and [cr]u = urine creatinine concentration (mg/dL). Ex/Ecr was expressed as an amount of x excreted per g of creatinine. Results of logistic regression and covariance analysis conducted with Ecr-based data are provided in SM (Tables S1–S4).
Ecr-normalization corrects for difference in urine dilution only and it is affected by a large variation in muscle mass, especially between men and women. Ecr-adjustment can create non-differential errors/imprecisions that can obscure or even nullify the dose-response relationships [37]. Previously, the risk of abnormal Eβ2M values was not significantly related to ECd when ECd and Eβ2M were adjusted to Ecr [38].
4.4. Computaion for eGFR and Fractional Tubular Degrdation of β2M
Chronic Kidney Disease Epidemiology Collaboration (CKD-EPI) equations were used to compute eGFR [39]. CKD stages 1, 2, 3, 4, and 5 corresponded to eGFR of 90–119, 60–89, 30–59, 15–29, and <15 mL/min/1.73 m2, respectively.
The fractional tubular degradation of filtered β2M (FrTDβ2M) (equation 1) was computed using rate of glomerular filtration of β2M (Fβ2M), mg/d (equation 2) and amount of β2M undergoing tubular degradation per volume of glomerular filtrate (TDβ2M/Ccr), mg/L filtrate) (equation 3) [40].
Equation 1: FrTDβ2M = (TDβ2M/Ccr)/[β2M]s
Equation 2: Fβ2M = eGFR[β2M]s
Equation 3: TDβ2M/Ccr = [β2M]s – Eβ2M/Ccr
4.5. Analysis for the Indirect Effects of Cd
The Baron and Kenny method was used to examine the indirect and/or direct effects Cd on Ealb and eGFR [41,42,43]. The mediation model with one mediator is depicted in Scheme 1.
The statistical parameters a, b, and c′ are β coefficients describing the effect of IV on M, the effect of M on DV and the direct effect of IV on DV, respectively. The product a*b indicates the indirect effect of IV on DV, mediated by M. The Sobel test is employed to define a statistical significance level of the indirect effect (a*b).
4.6. Statistical Analysis
Data were analyzed with IBM SPSS Statistics 21 (IBM Inc., New York, NY, USA). The Kruskal–Wallis’s test was employed to assess the variation in any continuous variable across three study groups; CTRL, <10-yr DM and ≥ 10-yr DM. The Pearson chi-squared test assessed differences in percentages across the three study groups. The one-sample Kolmogorov–Smirnov test assessed deviation from a normal distribution of any continuous variable. Logarithmic transformation was applied to ECd/Ccr, Ealb/Ccr, Eβ2M/Ccr and ENAG/Ccr that showed rightward skewing before they were subjected to parametric statistics analyses, scatterplots, and linear regressions.
The POR values for albuminuria and a reduced eGFR were obtained using logistic regression modeling, which adjusted for potential confounders (Table 2). The univariate of analysis of covariance was undertaken to identify the contributors to the variation in Ealb and eGFR (Table 3 and Table 4). Spearman’s rank correlation analysis was used to assess bivariate relationships of nine variables: Ealb/Ccr, age, BMI, eGFR, FPG, ECd/Ccr, ENAG/Ccr, Eβ2M/Ccr and FrTDβ2M (Table 5).
5. Conclusions
Exposure to low-level Cd, insufficient to induce abnormally high plasma glucose concentrations, is not associated with an increased risk of albuminuria or reduced eGFR. However, in the presence of diabetes and/or hyperglycemia, exposure to low-level Cd could enhance albumin excretion rates, while aggravating eGFR reduction through inducing tubular cell damage and functional impairment.
Supplementary Materials
The following supporting information can be downloaded at the website of this paper posted on Preprints.org.
Author Contributions
Conceptualization, S.S., D.A.V. and S.Y.; methodology, S.Y., T.K. and D.W.; formal analysis, S.Y. and S.S.; investigation, S.Y., D.W., and T.K..; resources, S.Y. and D.A.V.; original draft preparation, S.S., D.A.V., and S.Y.; review and editing, S.S. and D.A.V. All authors have read and agreed to the published version of the manuscript.
Funding
This research project was funded by the Research Grant, WU-IRG-63-026, of Walailak University, Nakhon Si Thammarat Province, Thailand.
Institutional Review Board Statement
This study was undertaken in compliance with the guidelines of the Declaration of Helsinki and approved by the Office of the Human Research Ethics Committee of Walailak University, Nakhon Si Thammarat Province, Thailand. Approval number WUEC-24-275-01 (7 August 2024).
Informed Consent Statement
Written informed consent was obtained from all subjects involved in the study.
Data Availability Statement
The original contributions presented in the study are included in the article/supplementary material. Further inquiries can be directed to a corresponding author.
Acknowledgments
We thank the staff of a health promoting center in Pakpoon Municipality, Nakhon Si Thammarat Province, Thailand for their assistance with collection of biological and biochemical samples and data.
Conflicts of Interest
The authors declare no conflicts of interest.
Abbreviations
The following abbreviations are used in this manuscript:
| GFR | glomerular filtration rate |
| eGFR | estimated GFR |
| Cd | cadmium |
| ECd | urinary excretion rate of Cd |
| alb | albumin |
| Ealb | urinary excretion rate of alb |
| NAG | N-acetylglucosaminidase |
| ENAG | urinary excretion rate of NAG |
| cr | creatinine |
| Ccr | creatinine clearance |
| β2M | β2-microglobulin |
| Fβ2M | rate of glomerular filtration of β2M |
| Eβ2M | urinary excretion rate of β2M |
| TDβ2M | rate of tubular degradation of β2M |
| FrTDβ2M | fractional tubular degradation of filtered β2M |
References
- Guariguata, L.; Whiting, D.R.; Hambleton, I.; Beagley, J.; Linnenkamp, U.; Shaw, J.E. Global estimates of diabetes prevalence for 2013 and projections for 2035. Diabetes Res. Clin. Pract. 2014, 103, 137–149. [Google Scholar] [CrossRef]
- Hung, P.-H.; Hsu, Y.-C.; Chen, T.-H.; Lin, C.-L. Recent Advances in Diabetic Kidney Diseases: From Kidney Injury to Kidney Fibrosis. Int. J. Mol. Sci. 2021, 22, 11857. [Google Scholar] [CrossRef] [PubMed]
- Zac-Varghese, S. Consultant in diabetes, diabetes and the kidney. Clin. Med. (Lond) 2025, 100512. [Google Scholar] [CrossRef]
- Fernández Fernández, B.; Elewa, U.; Sánchez-Niño, M.D.; Rojas-Rivera, J.E.; Martin-Cleary, C.; Egido, J.; Ortiz, A. 2012 update on diabetic kidney disease: the expanding spectrum, novel pathogenic insights and recent clinical trials. Minerva Med. 2012, 103, 219–234. [Google Scholar]
- Li, J.; Guo, K.; Qiu, J.; Xue, S.; Pi, L.; Li, X.; Huang, G.; Xie, Z.; Zhou, Z. Epidemiological status, development trends, and risk factors of disability-adjusted life years due to diabetic kidney disease: A systematic analysis of Global Burden of Disease Study 2021. Chin. Med. J. (Engl) 2025, 138, 568–578. [Google Scholar] [CrossRef]
- Ma, X. : Liu, R.; Xi, X.; Zhuo, H.; Gu, Y. Global burden of chronic kidney disease due to diabetes mellitus, 1990-2021, and projections to 2050. Front. Endocrinol. (Lausanne) 2025, 16, 1513008. [Google Scholar]
- Triplitt, C.L. Examining the mechanisms of glucose regulation. Am. J. Manag. Care 2012, 18, S4–S10. [Google Scholar] [PubMed]
- Wilding, J.P. The role of the kidneys in glucose homeostasis in type 2 diabetes: Clinical implications and therapeutic significance through sodium glucose co-transporter 2 inhibitors. Metabolism 2014, 63, 1228–1237. [Google Scholar] [CrossRef] [PubMed]
- Alsahli, M.; Gerich, J.E. Renal glucose metabolism in normal physiological conditions and in diabetes. Diabetes Res. Clin. Pract. 2017, 133, 1–9. [Google Scholar] [CrossRef]
- Dalga, D.; Verissimo, T.; de Seigneux, S. Gluconeogenesis in the kidney: In health and in chronic kidney disease. Clin. Kidney J. 2023, 16, 1249–1257. [Google Scholar] [CrossRef]
- Duo, Y.; Gao, J.; Yuan, T.; Zhao, W. Effect of sodium-glucose cotransporter 2 inhibitors on the rate of decline in kidney function: A systematic review and meta-analysis. J. Diabetes 2023, 15, 58–70. [Google Scholar] [CrossRef] [PubMed]
- Satarug, S.; Vesey, D.A.; Gobe, G.C.; Phelps, K.R. Estimation of health risks associated with dietary cadmium exposure. Arch. Toxicol. 2023, 97, 329–358. [Google Scholar] [CrossRef]
- Satarug, S.; Vesey, D.A.; Ruangyuttikarn, W.; Nishijo, M.; Gobe, G.C.; Phelps, K.R. The Source and Pathophysiologic Significance of Excreted Cadmium. Toxics 2019, 7, 55. [Google Scholar] [CrossRef]
- Xie, S.; Perrais, M.; Golshayan, D.; Wuerzner, G.; Vaucher, J.; Thomas, A.; Marques-Vidal, P. Association between urinary heavy metal/trace element concentrations and kidney function: A prospective study. Clin. Kidney J. 2024, 18, sfae378. [Google Scholar] [CrossRef] [PubMed]
- Son, H.S.; Kim, S.G.; Suh, B.S.; Park, D.U.; Kim, D.S.; Yu, S.D.; Hong, Y.S.; Park, J.D.; Lee, B.K.; Moon, J.D.; et al. Association of cadmium with diabetes in middle-aged residents of abandoned metal mines: The first health effect surveillance for residents in abandoned metal mines. Ann. Occup. Environ. Med. 2015, 27, 20. [Google Scholar] [CrossRef] [PubMed]
- Schwartz, G.G.; Il’yasova, D.; Ivanova, A. Urinary cadmium, impaired fasting glucose, and diabetes in the NHANES III. Diabetes Care 2003, 26, 468–470. [Google Scholar] [CrossRef]
- Wallia, A.; Allen, N.B.; Badon, S.; El Muayed, M. Association between urinary cadmium levels and prediabetes in the NHANES 2005-2010 population. Int. J. Hyg. Environ. Health 2014, 217, 854–860. [Google Scholar] [CrossRef]
- Grau-Perez, M.; Pichler, G.; Galan-Chilet, I.; Briongos-Figuero, L.S.; Rentero-Garrido, P.; Lopez-Izquierdo, R.; Navas-Acien, A.; Weaver, V.; García-Barrera, T.; Gomez-Ariza, J.L.; et al. Urine cadmium levels and albuminuria in a general population from Spain: A gene-environment interaction analysis. Environ. Int. 2017, 106, 27–36. [Google Scholar] [CrossRef]
- Feng, X.; Zhou, R.; Jiang, Q.; Wang, Y.; Chen, C. Analysis of cadmium accumulation in community adults and its correlation with low-grade albuminuria. Sci. Total Environ. 2022, 834, 155210. [Google Scholar] [CrossRef]
- Thomas, D.K.; Hodgson, S.; Nieuwenhuijsen, M.; Jarup, L. Early kidney damage in a population exposed to cadmium and other heavy metals. Environ. Health Perspect. 2009, 117, 181–184. [Google Scholar] [CrossRef]
- Tsai, K.-F.; Hsu, P.-C.; Lee, C.-T.; Kung, C.-T.; Chang, Y.-C.; Fu, L.-M.; Ou, Y.-C.; Lan, K.-C.; Yen, T.-H.; Lee, W.-C. Association between Enzyme-Linked Immunosorbent Assay-Measured Kidney Injury Markers and Urinary Cadmium Levels in Chronic Kidney Disease. J. Clin. Med. 2022, 11, 156. [Google Scholar] [CrossRef] [PubMed]
- Kim, Y.D.; Yim, D.H.; Eom, S.Y.; Moon, S.I.; Park, C.H.; Kim, G.B.; Yu, S.D.; Choi, B.S.; Park, J.D.; Kim, H. Temporal changes in urinary levels of cadmium, N-acetyl-β-d-glucosaminidase and β2-microglobulin in individuals in a cadmium-contaminated area. Environ. Toxicol. Pharmacol. 2015, 39, 35–41. [Google Scholar] [CrossRef] [PubMed]
- Nauta, F.L.; Boertien, W.E.; Bakker, S.J.; van Goor, H.; van Oeveren, W.; de Jong, P.E.; Bilo, H.; Gansevoort, R.T. Glomerular and tubular damage markers are elevated in patients with diabetes. Diabetes Care 2011, 34, 975–981. [Google Scholar] [CrossRef]
- Ouchi, M.; Suzuki, T.; Hashimoto, M.; Motoyama, M.; Ohara, M.; Suzuki, K.; Igari, Y.; Watanabe, K.; Nakano, H.; Oba, K. Urinary N-acetyl-β-D-glucosaminidase levels are positively correlated with 2-hr plasma glucose levels during oral glucose tolerance testing in prediabetes. J. Clin. Lab. Anal. 2012, 26, 473–480. [Google Scholar] [CrossRef]
- Kim, S.R.; Lee, Y.H.; Lee, S.G.; Kang, E.S.; Cha, B.S.; Kim, J.H.; Lee, B.W. Urinary N-acetyl-beta-D-glucosaminidase, an early marker of diabetic kidney disease, might reflect glucose excursion in patients with type 2 diabetes. Medicine (Baltimore) 2016, 95, e4114. [Google Scholar] [CrossRef]
- Lin, Z.H.; Dai, S.F.; Zhao, J.N.; Jiang, Y. Application of urinary N-acetyl-β-D-glucosaminidase combined with serum retinol-binding protein in early detection of diabetic nephropathy. World J. Diabetes 2023, 14, 883–891. [Google Scholar] [CrossRef] [PubMed]
- Huang, Q.; Fei, X.; Zhan, H.; Gong, J.; Zhou, J.; Zhang, Y.; Ye, X.; Song, Y.; Ma, J.; Wu, X. Urinary N-acetyl-beta-d-glucosaminidase-creatinine ratio is a valuable predictor for advanced diabetic kidney disease. J. Clin. Lab. Anal. 2023, 37, e24769. [Google Scholar] [CrossRef]
- Takagi, A.; Kusunoki, Y.; Ohigashi, M.; Osugi, K.; Inoue, C.; Inoue, M.; Tsunoda, T.; Kadoya, M.; Konishi, K.; Katsuno, T.; et al. Association between continuous glucose monitoring-derived glycemic control indices and urinary biomarkers of diabetic kidney disease: Hyogo Diabetes Hypoglycemia Cognition Complications study. Acta Diabetol. 2024, 61, 413–423. [Google Scholar] [CrossRef]
- Ikeme, J.C.; Katz, R.; Muiru, A.N.; Estrella, M.M.; Scherzer, R.; Garimella, P.S.; Hallan, S.I.; Peralta, C.A.; Ix, J.H.; Shlipak, M.G. Clinical Risk Factors For Kidney Tubule Biomarker Abnormalities Among Hypertensive Adults With Reduced eGFR in the SPRINT Trial. Am. J. Hypertens. 2022, 35, 1006–1013. [Google Scholar] [CrossRef]
- Yimthiang, S.; Pouyfung, P.; Khamphaya, T.; Kuraeiad, S.; Wongrith, P.; Vesey, D.A.; Gobe, G.C.; Satarug, S. Effects of Environmental Exposure to Cadmium and Lead on the Risks of Diabetes and Kidney Dysfunction. Int. J. Environ. Res. Public Health 2022, 19, 2259. [Google Scholar] [CrossRef]
- Adokwe, J.B.; Waeyeng, D.; Suwan, K.; Camsanit, K.; Kaiduong, C.; Nuanrat, P.; Pouyfung, P.; Yimthiang, S.; Petchoo, J.; Satarug, S.; et al. Plant-Based Diet and Glycemic Control in Type 2 Diabetes: Evidence from a Thai Health-Promoting Hospital. Nutrients 2024, 16, 619. [Google Scholar] [CrossRef]
- Trzcinka-Ochocka, M.; Brodzka, R.; Janasik, B. Useful and Fast Method for Blood Lead and Cadmium Determination Using ICP-MS and GF-AAS.; Validation Parameters. J. Clin. Lab. Anal. 2016, 30, 130–139. [Google Scholar] [CrossRef]
- Hornung, R.W.; Reed, L.D. Estimation of average concentration in the presence of nondetectable values. Appl. Occup. Environ. Hyg. 1990, 5, 46–51. [Google Scholar] [CrossRef]
- Xu, R.; Tan, X.; Li, T.; Liu, S.; Li, Y.; Li, H. Norepinephrine-induced AuPd aerogels with peroxidase- and glucose oxidase-like activity for colorimetric determination of glucose. Mikrochim. Acta 2021, 188, 362. [Google Scholar] [CrossRef]
- Apple, F.; Bandt, C.; Prosch, A.; Erlandson, G.; Holmstrom, V.; Scholen, J.; Googins, M. Creatinine clearance: Enzymatic vs Jaffé determinations of creatinine in plasma and urine. Clin. Chem. 1986, 32, 388–390. [Google Scholar] [CrossRef] [PubMed]
- Phelps, K.R.; Gosmanova, E.O. A generic method for analysis of plasma concentrations. Clin. Nephrol. 2020, 94, 43–49. [Google Scholar] [CrossRef] [PubMed]
- Grandjean, P.; Budtz-Jørgensen, E. Total imprecision of exposure biomarkers: Implications for calculating exposure limits. Am. J. Ind. Med. 2007, 50, 712–719. [Google Scholar] [CrossRef]
- Satarug, S.; Vesey, D.A.; Buha Đorđević, A. Use of Urinary β2-Microglobulin in the Assessment of the Health Risk from Environmental Cadmium Exposure. Preprints 2025, 2025092442. [Google Scholar] [CrossRef]
- Levey, A.S.; Becker, C.; Inker, L.A. Glomerular filtration rate and albuminuria for detection and staging of acute and chronic kidney disease in adults: A systematic review. JAMA 2015, 313, 837–846. [Google Scholar] [CrossRef]
- Phelps, K.R.; Yimthiang, S.; Pouyfung, P.; Khamphaya, T.; Vesey, D.A.; Satarug, S. Homeostasis of β2-microglobulin in diabetics and non-diabetics with modest cadmium intoxication. J. Environ. Expo. Assess. 2025, 4, 23. [Google Scholar] [CrossRef]
- Preacher, K.J. Advances in mediation analysis: A survey and synthesis of new developments. Annu. Rev. Psychol. 2015, 66, 825–852. [Google Scholar] [CrossRef] [PubMed]
- MacKinnon, D.P.; Warsi, G.; Dwyer, J.H. A simulation study of mediated effect measures. Multiv. Behav. Res. 1995, 30, 41–62. [Google Scholar] [CrossRef] [PubMed]
- Preacher, K.J.; Hayes, A.F. SPSS and SAS procedures for estimating indirect effects in simple mediation models. Behav. Res. Meth. Instrum. Comput. 2004, 36, 717–731. [Google Scholar] [CrossRef] [PubMed]
Figure 1.
Urinary Cd excretion rates and levels of eGFR, FPG and serum β2M in controls and diabetics. Boxplots of data on ECd/Ccr (A), eGFR (B), [Glc]p (C) and serum levels of β2M (D) in controls and subjects with diabetes for < 10 and ≥ 10 years, respectively. Each box represents the 25th and 75th percentile values of the variable indicated on the x-axis. A horizontal line inside each box represents the median. Circles and asterisks represent outliers.
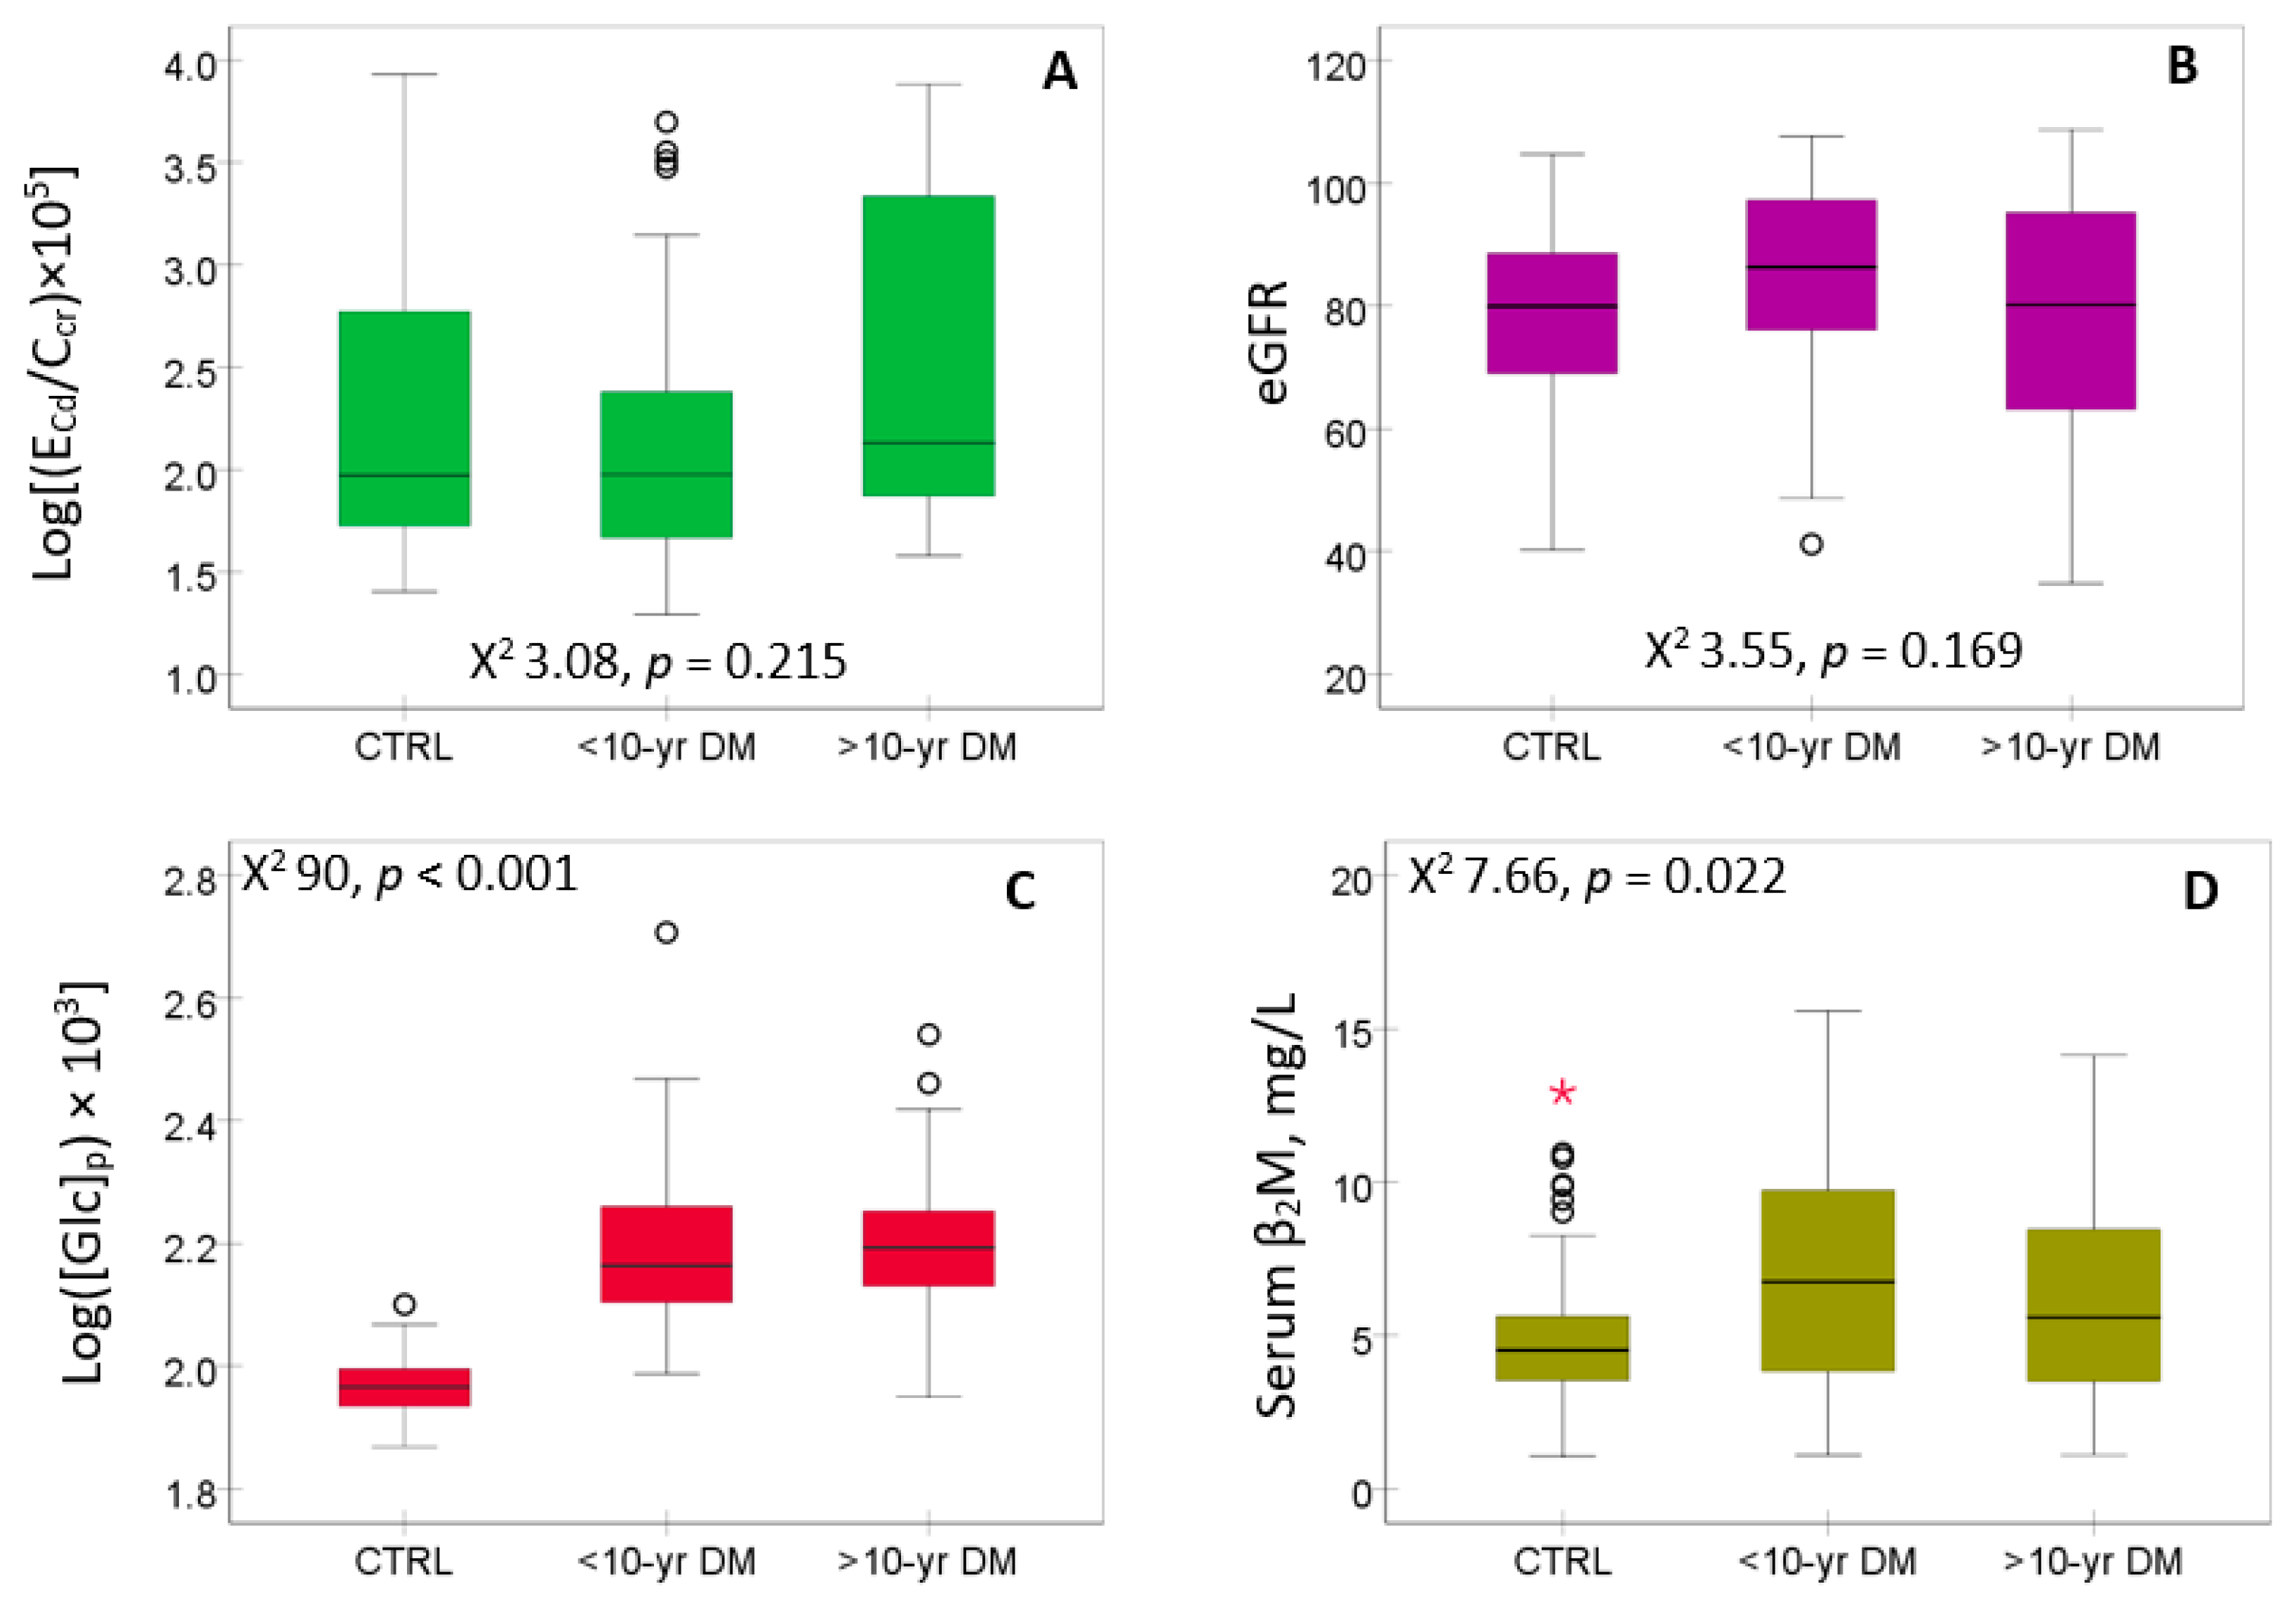
Figure 2.
Excretion rates of NAG, albumin and β2M and the fractional tubular degradation of β2M in controls and diabetics. Boxplots of data on ENAG/Ccr (A), Ealb/Ccr (B), Eβ2M/Ccr (C) and FrTDβ2M (D) in controls and subjects with DM for < 10 and ≥ 10 years, respectively. Each box represents the 25th and 75th percentile values of the variable indicated on the x-axis. A horizontal line inside each box represents the median. Circles and asterisks represent outliers.
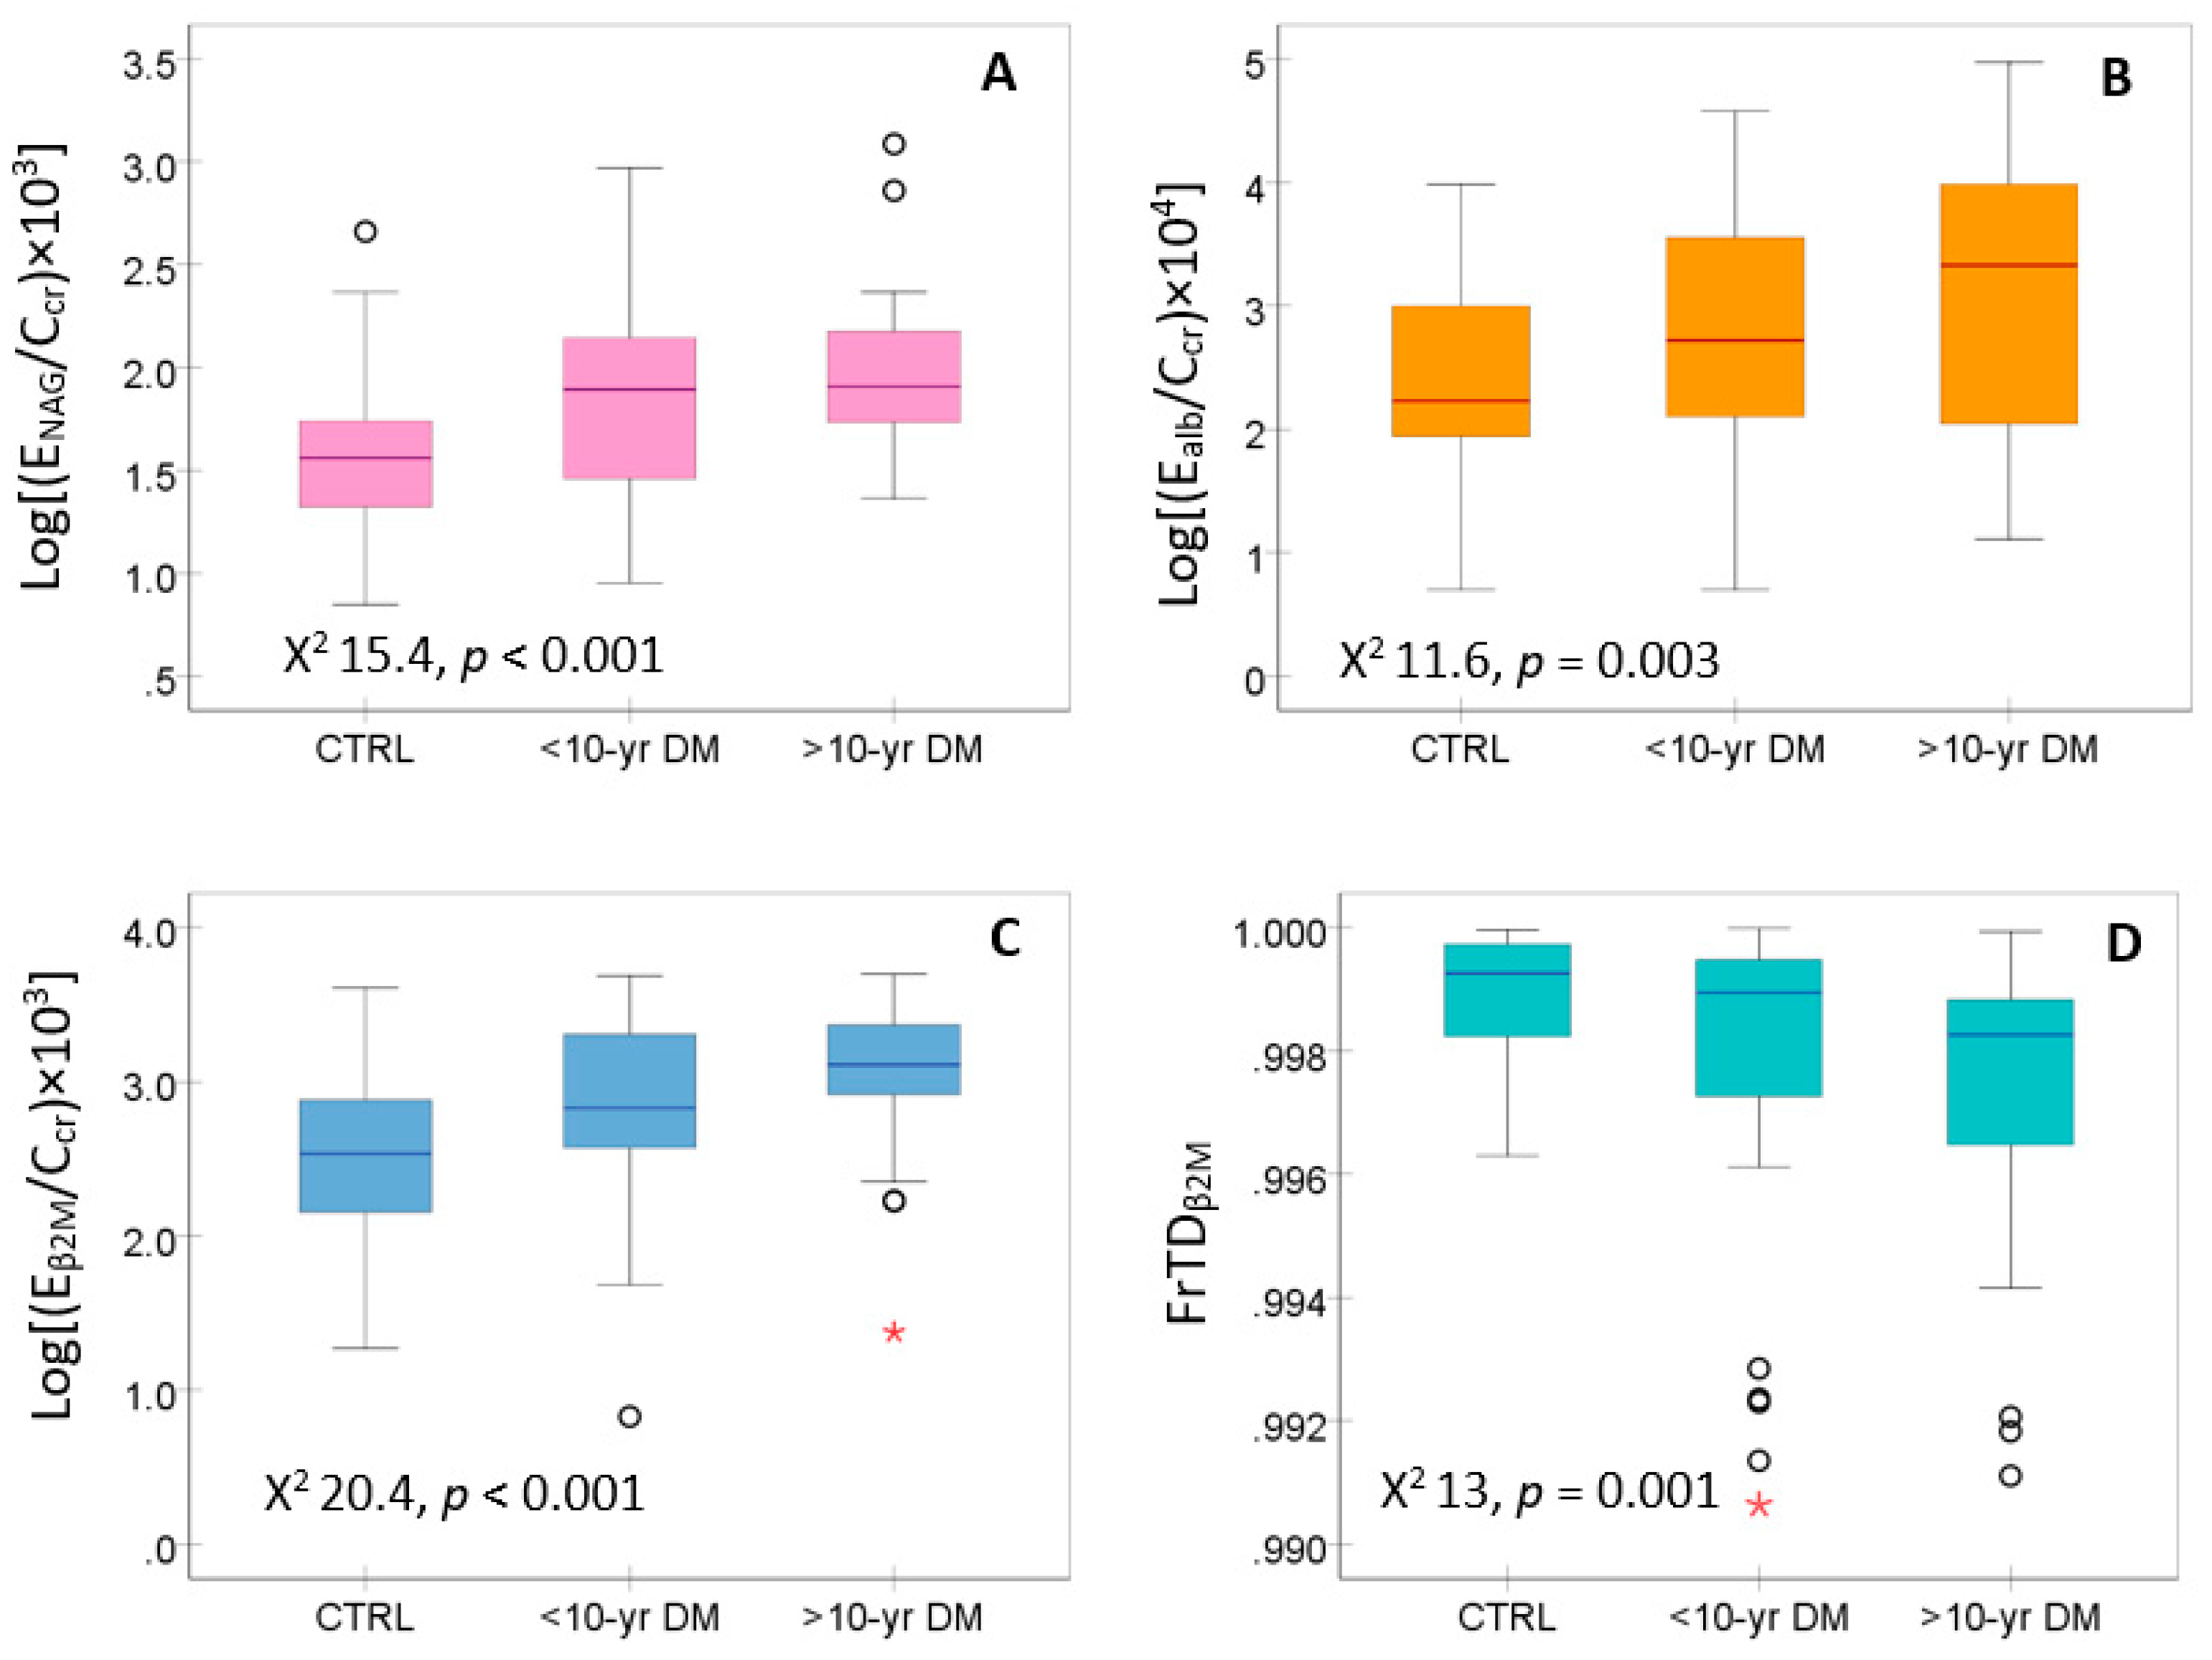
Figure 3.
Excretion of albumin and β2M in relation to the excretion of NAG. Scatterplots related Ealb/Ccr to ENAG/Ccr in controls and diabetics (A) and those with FPG <110 and ≥110 mg/dL (B). Scatterplots related Eβ2M/Ccr to ENAG/Ccr to controls and diabetics (C) and those with FPG <110 and ≥110 mg/dL (D).
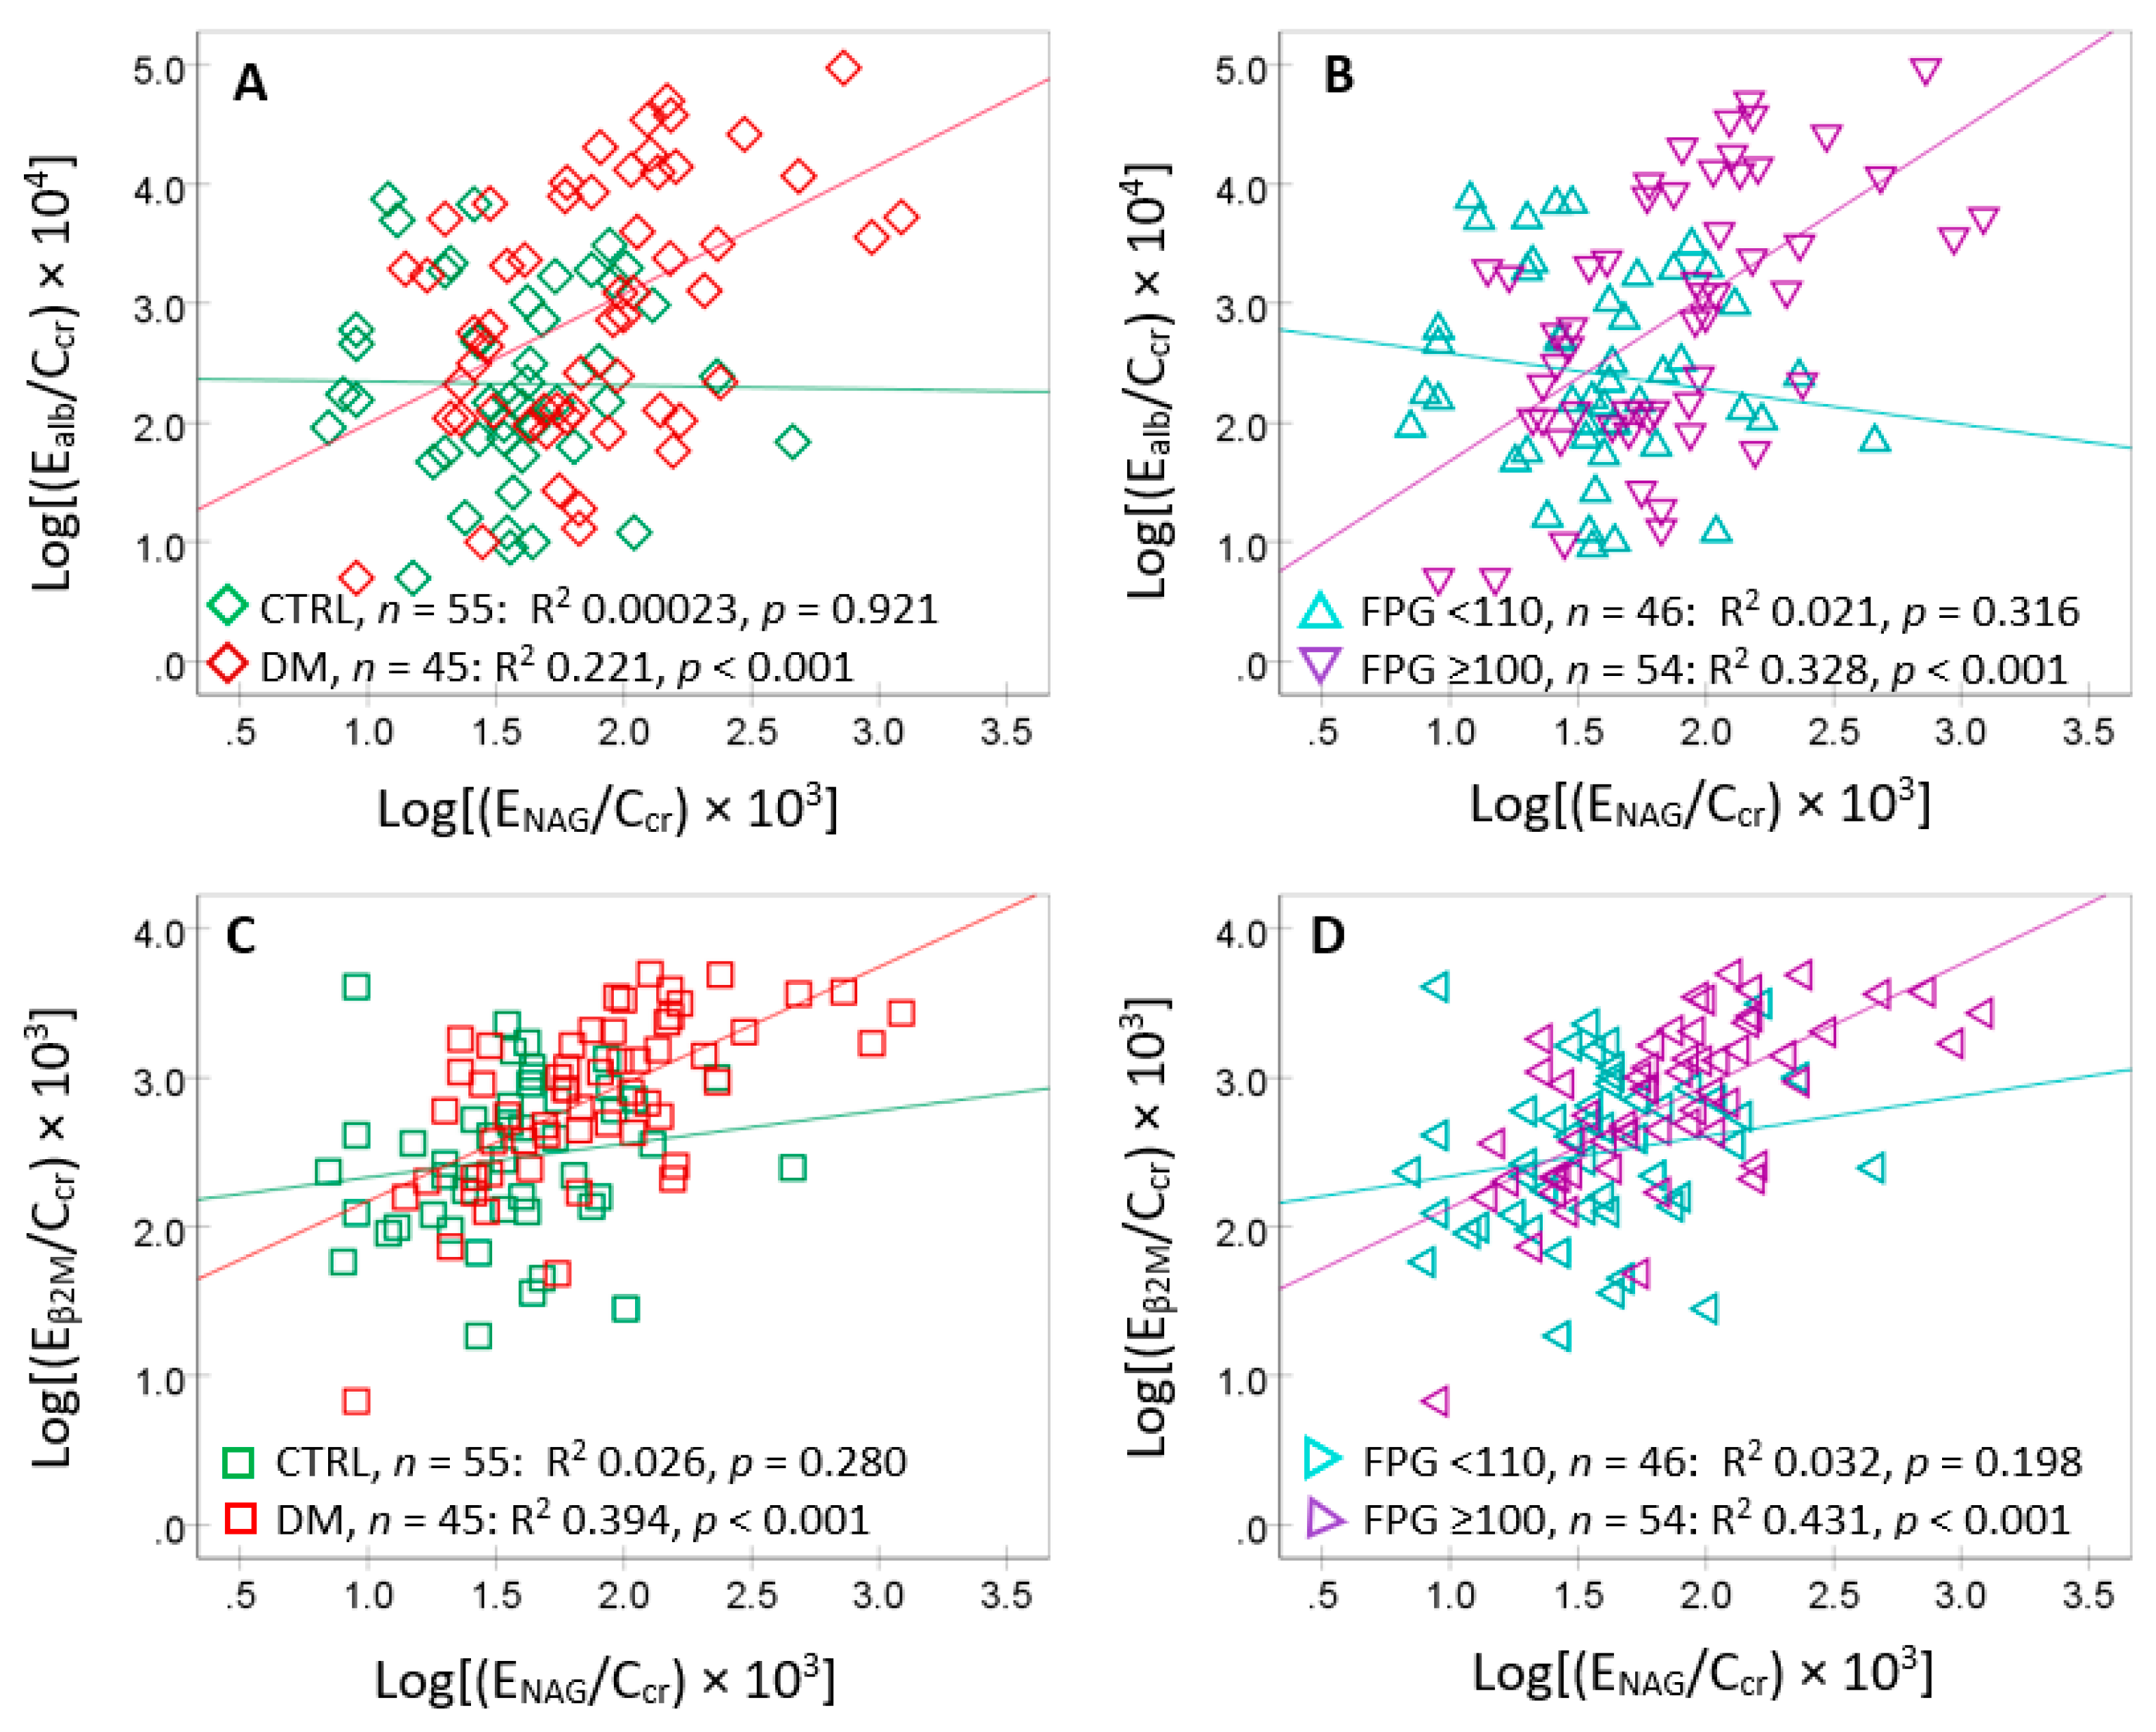
Figure 4.
Reduction in eGFR in relation to the excretion of albumin and NAG. Scatterplots related eGFR to Ealb/Ccr in men and women (A) subjects with and without hypertension (B). Scatterplots related eGFR to ENAG/Ccr in men and women (C) subjects with and without hypertension (D).
Figure 4.
Reduction in eGFR in relation to the excretion of albumin and NAG. Scatterplots related eGFR to Ealb/Ccr in men and women (A) subjects with and without hypertension (B). Scatterplots related eGFR to ENAG/Ccr in men and women (C) subjects with and without hypertension (D).
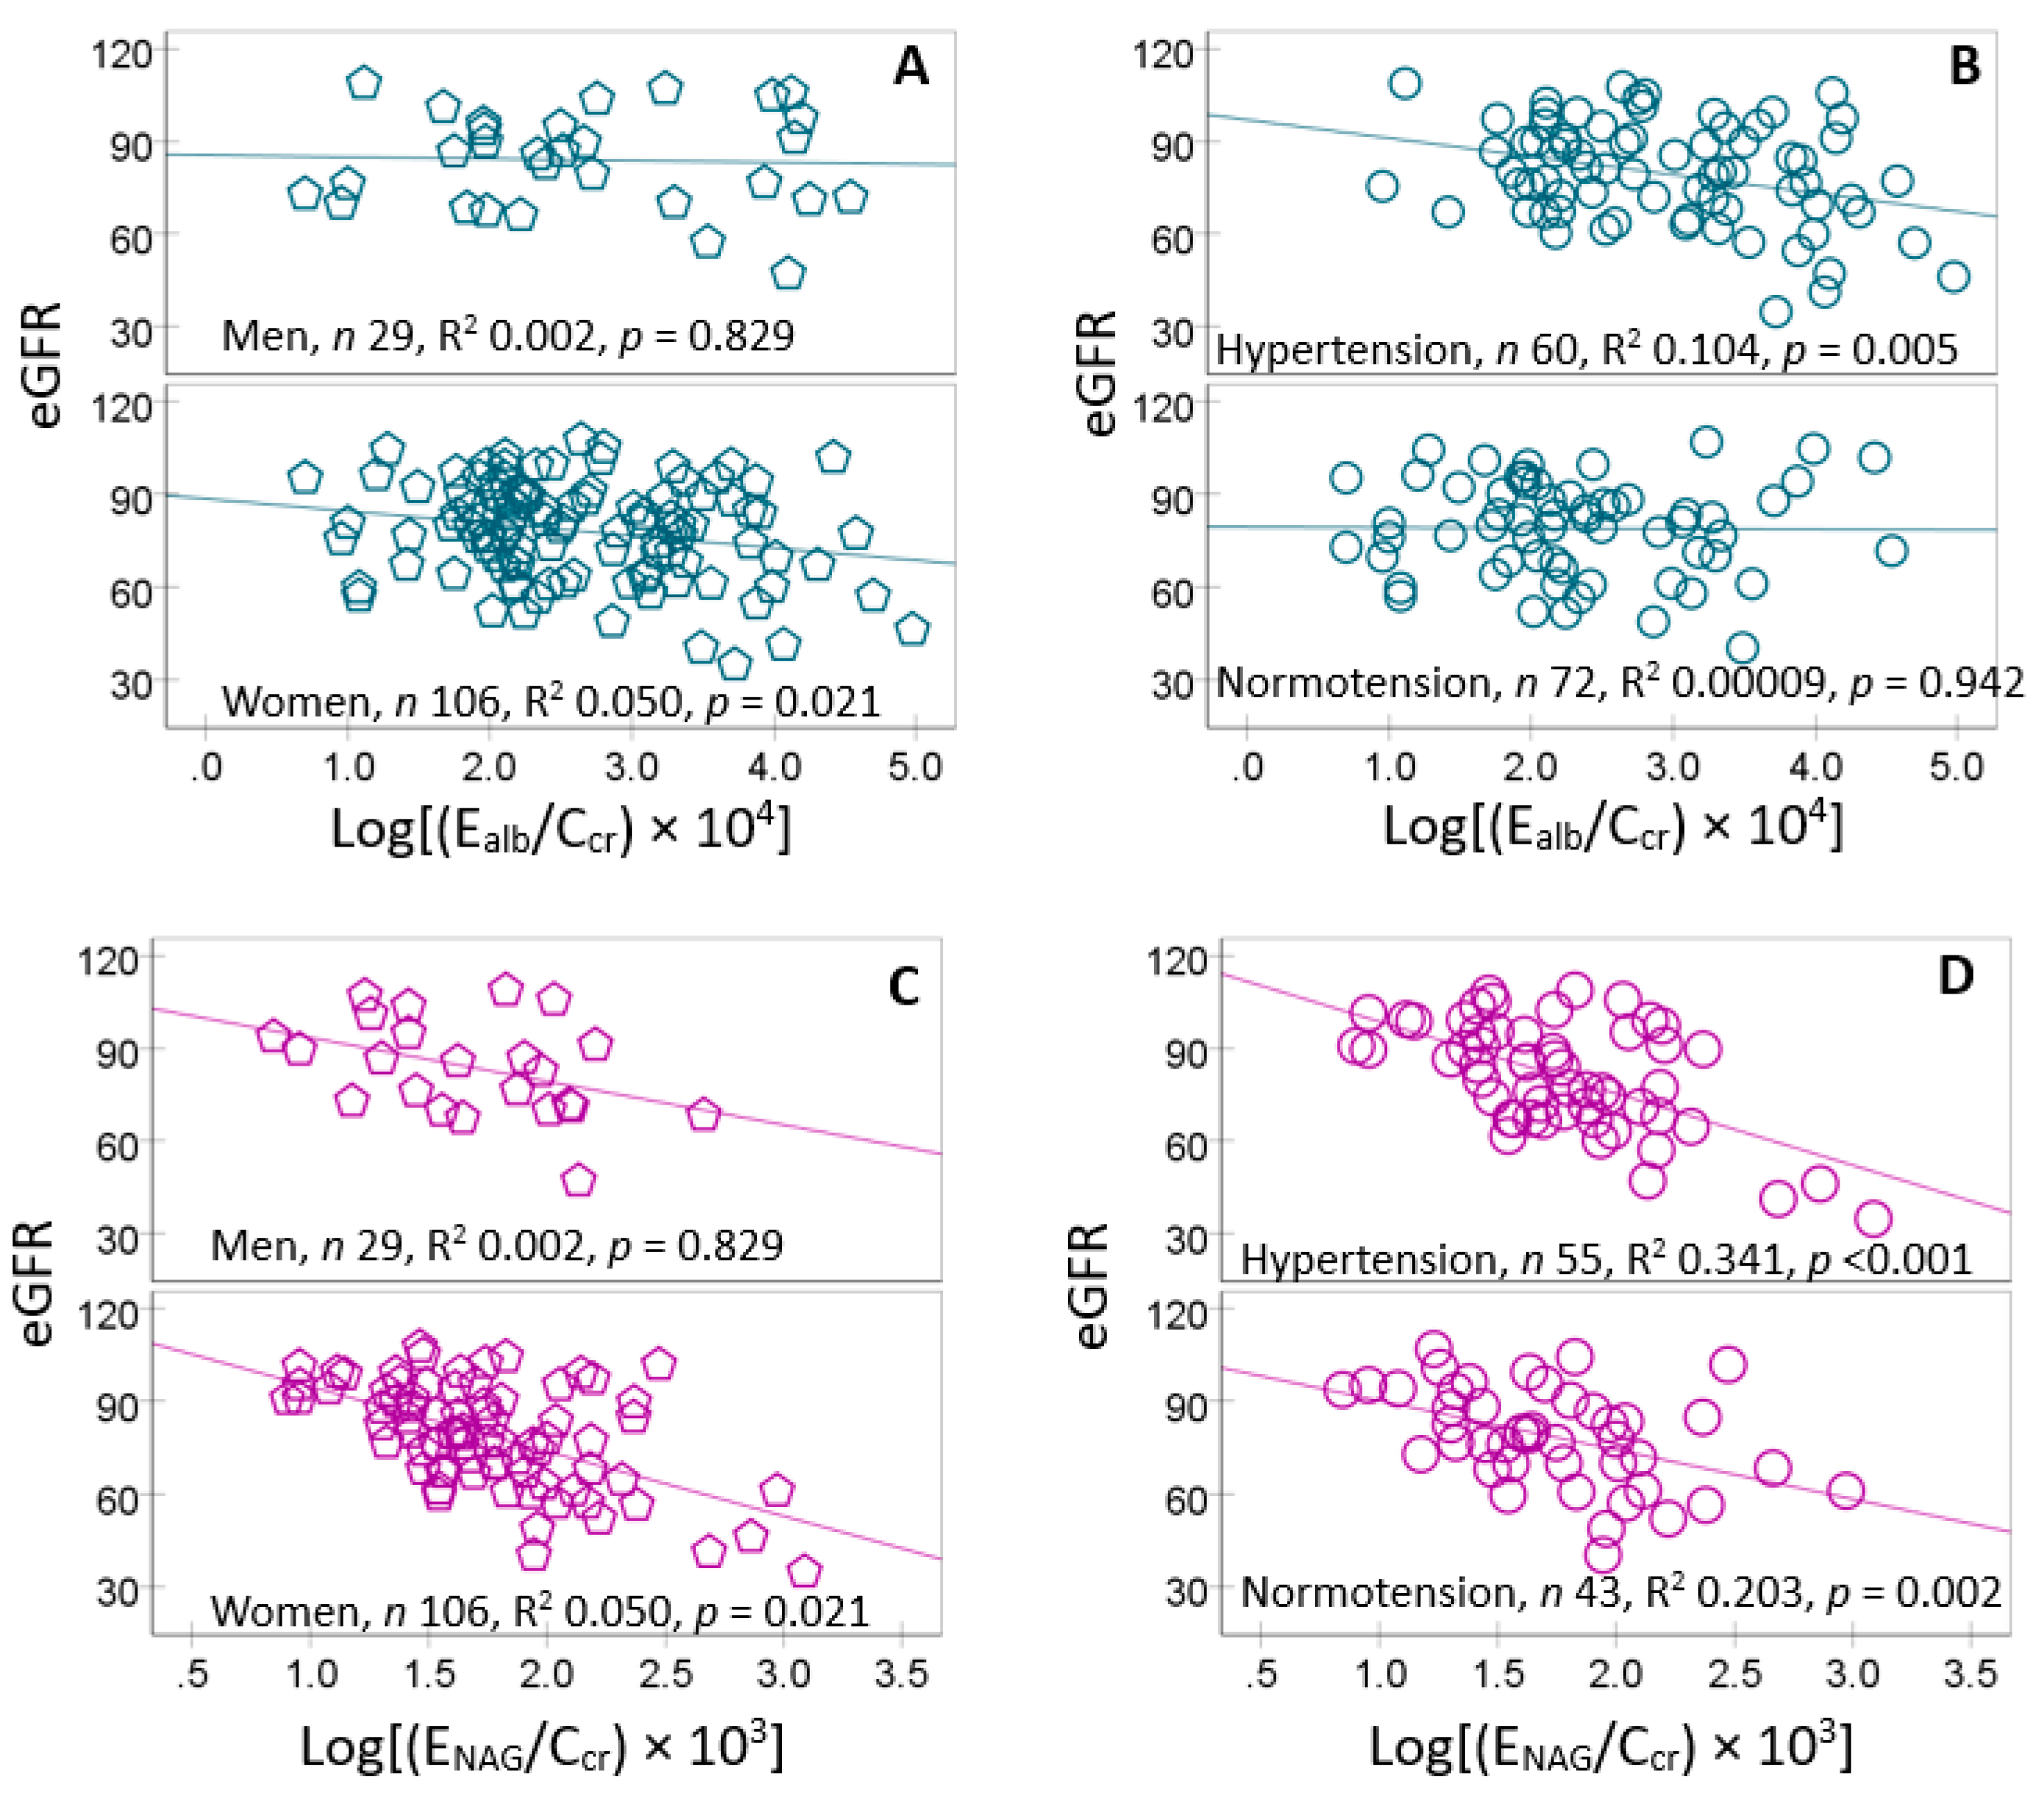
Figure 5.
Mediating effects of Cd by tubular injury and impaired functions. The Sobel test for the indirect effects of ECd on Ealb (a) and eGFR (b) mediating through ENAG. ECd, excretion of cadmium; Ealb, excretion of albumin; ENAG, excretion of NAG; Eβ2M, excretion of β2M; CI; bootstrapped confidence interval.

Scheme 1.
A simple mediation model with one mediator. IV, independent variable; DV, dependent variable; M, mediator.
Scheme 1.
A simple mediation model with one mediator. IV, independent variable; DV, dependent variable; M, mediator.


Table 1.
Descriptive characteristics of controls and diabetics.
| Variables | All subjects n = 137 |
CTRL n = 72 |
DM | p | |
|---|---|---|---|---|---|
| < 10 yrs, n = 37 | ≥ 10 yrs, n = 25 | ||||
| Women, % | 78.4 | 79.2 | 75.7 | 80.0 | 0.894 |
| Smoking, % | 10.4 | 11.1 | 10.8 | 8.0 | 0.905 |
| Mean age (range), years | 59.5 (41−80) | 61.2 (43−80) | 58.3 (42−75) | 56.6 (41−78) | 0.073 |
| Mean BMI (range), kg/m2 | 25.6 (15−48) | 24.6 (15−48) | 26.7 (15−36) | 26.6 (20−35) | 0.016 |
| FPG, mg/dL | 130 (61) | 94 (11) | 172 (76) | 170 (58) | <0.001 |
| FPG ≥ 110 mg/dL, % | 49.3 | 11.1 | 91.9 | 96.0 | <0.001 |
| FPG ≥ 126 mg/dL, % | 39.6 | 1.4 | 81.1 | 88.0 | <0.001 |
| eGFR, mL/min/1.73 m2 | 79.7 (15.9) | 78.5 (13.3) | 83.7 (17.1) | 77.2 (20.3) | 0.169 |
| a Reduced eGFR, % | 11.9 | 9.7 | 8.1 | 24.0 | 0.116 |
| Mean SBP (range) | 138 (103−187) | 134 (107−173) | 140 (106−184) | 144 (103−176) | 0.030 |
| Mean DBP (range) | 84 (61−106) | 84 (62−103) | 85 (65 – 106) | 86 (61−101) | 0.399 |
| Hypertension, % | 54.2 | 44.9 | 54.1 | 80.0 | 0.011 |
| [β2M]s, mg/L | 5.96 (3.32) | 5.02 (2.28) | 7.44 (4.20) | 6.4 (3.59) | 0.022 |
| [β2M]u, µg/L | 67 (58) | 42 (37) | 84 (58) | 114 (73) | <0.001 |
| ECd/Ecr, µg/g cr | 1.00 (1.87) | 0.99 (1.94) | 0.72 (1.54) | 1.41 (2.11) | 0.267 |
| Ealb/Ecr (ACR), mg/g cr | 39.8 (103) | 12.4 (26.1) | 59.8 (115) | 89.2 (177) | 0.002 |
| Microalbuminuria b, % | 22.4 | 8.3 | 35.1 | 44.0 | <0.001 |
| Macroalbuminuria, % | 3.7 | 0 | 8.1 | 8.0 | 0.046 |
| (ECd/Ccr) × 100, µg/L filtrate | 0.87 (1.70) | 0.86 (1.69) | 0.55 (1.17) | 1.37 (2.25) | 0.215 |
| (Ealb/Ccr) × 100, mg/L filtrate | 37.2 (107) | 9.76 (19.2) | 51.4 (96.8) | 95.2 (205) | 0.003 |
| Microalbuminuria c, % | 26 | 12.9 | 33.3 | 52.0 | <0.001 |
| Macroalbuminuria, % | 4.5 | 0 | 10.8 | 8 | 0.023 |
CTRL, control; DN, diabetes; BMI, body mass index; FPG, fasting plasma glucose; eGFR, estimated glomerular filtration rate; SBP, systolic blood pressure; DMP, diastolic blood pressure; β2M, β2-microglobulin; Cd, cadmium; cr, creatinine; Ecr, excretion of cr; alb, albumin; Ccr, creatinine clearance. Continuous variables are presented as arithmetic mean and standard deviation (SD) values. a Low eGFR was defined as eGFR ≤60 mL/min/1.73 m2. b Micro(macro)albuminuria was defined as Ealb/Ecr ≥ 20 (300) mg/g cr in men and ≥ 30 (300) mg/g cr in women. c Micro(macro)albuminuria was defined as Ealb/Ccr ≥ 0.2 (2) mg/L filtrate. For all tests, p ≤ 0.05 identifies statistical significance.
Table 2.
Determinants of the prevalence odds ratios for albuminuria and reduced eGFR.
| Independent Variables | Albuminuria a | Reduced eGFR b | ||
|---|---|---|---|---|
| POR (95% CI) | p | POR (95% CI) | p | |
| Age, years | 0.988 (0.936, 1.043) | 0.667 | 1.153 (1.055, 1.260) | 0.002 |
| BMI | 0.988 (0.899, 1.086) | 0.799 | 1.049 (0.920, 1.197) | 0.473 |
| Log[(ECd/Ccr)], µg/L filtrate | 0.870 (0.471, 1.608) | 0.658 | 1.542 (0.679, 3.502) | 0.301 |
| Smoking | 0.384 (0.062, 2.384) | 0.304 | 1.866 (0.119, 29.24) | 0.657 |
| Gender | 2.749 (0.769, 9.831) | 0.120 | 3.195 (0.218, 46.85) | 0.397 |
| Reduced eGFR | 4.294 (1.185, 15.56) | 0.027 | − | − |
| Diabetes | 4.081 (1.601, 10.40) | 0.003 | 1.883 (0.509, 6.969) | 0.343 |
| Hypertension | 2.786 (1.091, 7.114) | 0.032 | − | − |
| Eβ2M/Ccr ≥ 3 µg/L filtrate | − | − | 6.372 (1.137, 35.71) | 0.035 |
a Albuminuria was based on Ealb/Ccr ≥ 0.2 mg/L filtrate in women and men. b Reduced eGFR was defined as eGFR ≤ 60 mL/min/1.73 m2. POR, prevalence odds ratios; CI, confidence interval; BMI, body mass index; Cd, cadmium; ECd, excretion of Cd; cr, creatinine; Ccr, creatinine clearance; β2-microglobulin, β2M.
Table 3.
Covariance analysis for albumin excretion rates.
| Independent variables | Log10 [(Ealb/Ccr)], µg/L filtrate | |||||||
|---|---|---|---|---|---|---|---|---|
| CTRL, n = 44 | DM, n = 56 | Women, n = 77 | Men, n = 23 | |||||
| η2 | p | η2 | p | η2 | p | η2 | p | |
| Age | 0.073 | 0.117 | 0.016 | 0.395 | 0.007 | 0.493 | 0.010 | 0.709 |
| BMI | 0.050 | 0.196 | 0.097 | 0.033 | 0.002 | 0.724 | 0.011 | 0.699 |
| ECd/Ccr | 0.076 | 0.110 | 0.005 | 0.652 | 0.000028 | 0.965 | 0.038 | 0.470 |
| FrTDβ2M | 0.228 | 0.004 | 0.018 | 0.365 | 0.008 | 0.466 | 0.050 | 0.405 |
| Log10[(ENAG/Ccr)] | 0.061 | 0.153 | 0.162 | 0.005 | 0.054 | 0.050 | 0.268 | 0.040 |
| Gender | 0.115 | 0.046 | 0.176 | 0.003 | − | − | − | − |
| Smoking | 0.194 | 0.008 | 0.107 | 0.025 | − | − | 0.000044 | 0.981 |
| HTN | 0.210 | 0.006 | 0.146 | 0.008 | 0.121 | .003 | 0.109 | 0.212 |
| Gender × HTN | 0.044 | 0.226 | 0.122 | 0.016 | − | − | ||
| Smoking × HTN | 0.021 | 0.408 | 0.178 | 0.003 | − | − | 0.035 | 0.489 |
| Unadjusted (adjusted) R2 |
0.422 (0.246) |
0.028 | 0.535 (0.431) | <0.001 | 0.237 (0.172) | 0.003 | 0.434 (0.111) | 0.301 |
η2 = eta squared; HTN, hypertension; ×, represents an interaction term; R2, coefficient of determination. η2 indicates the fraction of Ealb/Ccr variation explained by each independent variable. Adjusted R2 indicates the fraction of total variation of Ealb/Ccr explained by all independent variables. For all tests, p-values ≤ 0.05 indicate statistically significant levels.
Table 4.
Covariance analysis for eGFR.
| Independent variables | eGFR | |||||||
|---|---|---|---|---|---|---|---|---|
| CTRL, n = 44 | DM, n = 56 | Women, n = 77 | Men, n = 23 | |||||
| η2 | p | η2 | p | η2 | p | η2 | p | |
| Age | 0.026 | 0.364 | 0.183 | 0.003 | 0.099 | 0.008 | 0.019 | 0.626 |
| BMI | 0.005 | 0.694 | 0.005 | 0.653 | 0.018 | 0.265 | 0.047 | 0.439 |
| ECd/Ccr | 0.063 | 0.151 | 0.009 | 0.520 | 0.008 | 0.445 | 0.066 | 0.357 |
| Log10[(ENAG/Ccr)] | 0.301 | 0.001 | 0.199 | 0.002 | 0.222 | <0.001 | 0.307 | 0.032 |
| Log10[(Eβ2M/Ccr)] | 0.018 | 0.454 | 0.140 | 0.010 | 0.072 | 0.023 | 0.031 | 0.532 |
| FPG | 0.013 | 0.526 | 0.054 | 0.119 | 0.109 | 0.005 | 0.147 | 0.158 |
| Gender | 0.053 | 0.192 | 0.009 | 0.520 | − | − | − | − |
| Smoking | 0.058 | 0.169 | 0.019 | 0.366 | − | − | 0.032 | 0.527 |
| HTN | 0.005 | 0.680 | 0.020 | 0.348 | 0.014 | 0.324 | 0.004 | 0.829 |
| Gender × HTN | 0.005 | 0.698 | 0.003 | 0.741 | − | − | − | − |
| Smoking × HTN | 0.016 | 0.476 | 0.049 | 0.140 | − | − | 0.110 | 0.227 |
| Unadjusted (adjusted) R2 | 0.510 (0.341) | 0.007 | 0.683 (0.603) | <0.001 | 0.564 (0.520) | <0.001 | 0.562 (0.258) | 0.151 |
eGFR, estimated glomerular filtration rate; η2 = eta squared; HTN, hypertension; ×, represents an interaction term; R2, coefficient of determination. η2 indicates the fraction of the eGFR variation explained by a corresponding independent variable. Adjusted R2 indicates the fraction of total variation in eGFR explained by all independent variables in the first column. For all tests, p-values ≤ 0.05 indicate statistically significant levels.
Table 5.
Bivariate relationship analysis of DKD indicators.
| Variables | Spearman’s rank correlation coefficient | |||||||
|---|---|---|---|---|---|---|---|---|
| EAlb/Ccr | Age | BMI | eGFR | FPG | ECd/Ccr | ENAG/Ccr | Eβ2M/Ccr | |
| Age | 0.085 | |||||||
| BMI | 0.076 | −0.262** | ||||||
| eGFR | −0.136 | −0.356** | 0.161 | |||||
| FPG | 0.273** | −0.222** | 0.184* | 0.089 | ||||
| ECd/Ccr | 0.106 | 0.078 | −0.083 | −0.227** | 0.166 | |||
| ENAG/Ccr | 0.327** | −0.115 | 0.002 | −0.467** | 0.278** | 0.328** | ||
| Eβ2M/Ccr | 0.265** | 0.170* | −0.066 | −0.515** | 0.306** | 0.496** | 0.534** | |
| FrTDβ2M | −0.237** | −0.096 | 0.048 | 0.434** | −0.215* | −0.527** | −0.536** | −0.891** |
BMI, body mass index; eGFR, estimated glomerular filtration rate FPG, fasting plasma glucose concentration; FrTDβ2M, fractional tubular degradation of β2-microglobulin. * Significant correlation at the 0.05 level. ** Significant correlation at the 0.01 level.
Disclaimer/Publisher’s Note: The statements, opinions and data contained in all publications are solely those of the individual author(s) and contributor(s) and not of MDPI and/or the editor(s). MDPI and/or the editor(s) disclaim responsibility for any injury to people or property resulting from any ideas, methods, instructions or products referred to in the content. |
© 2025 by the authors. Licensee MDPI, Basel, Switzerland. This article is an open access article distributed under the terms and conditions of the Creative Commons Attribution (CC BY) license (http://creativecommons.org/licenses/by/4.0/).
Copyright: This open access article is published under a Creative Commons CC BY 4.0 license, which permit the free download, distribution, and reuse, provided that the author and preprint are cited in any reuse.


