Submitted:
24 November 2025
Posted:
27 November 2025
You are already at the latest version
Abstract
Mesoporous TiO2 microspheres with a large surface area were synthesized via a hydrothermal reaction using titanium glycolate. The samples were subsequently subjected to different vacuum oven treatment times (2, 4, 6, and 8 hours), resulting in Ti³⁺ self-doping. Comprehensive characterization was performed using transmission electron microscopy (TEM), X-ray diffraction (XRD), and X-ray photoelectron spectroscopy (XPS). The synthesized TiO2 microspheres exhibited significantly enhanced photocurrent and efficient photocatalytic activity under visible light irradiation, demonstrating their potential for applications in solar-driven water splitting. The results highlight the influence of Ti³⁺ self-doping on improving the photoactivity and photosensitivity of the material.
Keywords:
TiO2
; photocatalytic
; band gap
; solar-driven
; self-doping
1. Introduction
Titanium dioxide (TiO2) nanoparticles have garnered significant attention as ideal photocatalysts due to their excellent oxidation capabilities and broad applicability. However, the wide band gap (3.2 eV) of TiO2 limits its ability to absorb and utilize visible light, restricting its photocatalytic performance to ultraviolet light with wavelengths shorter than 387 nm, which hinders its practical use in various applications [1,2,3]. To overcome this limitation, considerable efforts have been devoted to enhancing the photocatalytic activity of TiO2 through morphological modifications. For instance, synthesizing TiO2 in specific morphologies such as rod-like or spherical structures can significantly increase the surface area and light scattering capabilities, improving solar light utilization efficiency. Additionally, substantial research has focused on enhancing TiO2’s photocatalytic activity under visible light, including surface defect engineering to modulate its electronic structure and improve light absorption [4,5,6].
Mingyang Xing and colleagues have employed vacuum high-temperature activation treatments on P25 TiO2 at different time intervals, revealing the formation of Ti³⁺ and oxygen vacancies (OV) in the treated samples, which led to enhanced photocatalytic performance. Their findings suggest that this simple, cost-effective activation method could serve as a key strategy for expanding the application of photocatalysts [7,8,9]. These advancements highlight the potential for modifying TiO2 to improve its photocatalytic activity and sensitivity under visible light.
Inspired by these studies, we hypothesize that mesoporous TiO2 microspheres, which are capable of absorbing a small portion of solar energy (mainly UV light, which constitutes only 4% of the solar spectrum), can benefit from vacuum high-temperature activation treatment.[10,11,12,13] This treatment may enhance their photosensitivity and photoelectric conversion efficiency, making them more effective for solar-driven applications.[14,15,16,17,18,19] In this study, mesoporous TiO2 microspheres were treated using vacuum high-temperature activation at different times (2, 4, 6, and 8 hours), resulting in 2hTiO2, 4hTiO2, 6hTiO2, and 8hTiO2 samples.[20,21] The photocatalytic degradation of Rhodamine B (RHB), photocurrent generation, and water oxidation experiments were conducted to investigate the photo-induced charge properties and photocatalytic performance of these samples. The results were compared to determine the optimal treatment time. Finally, X-ray photoelectron spectroscopy (XPS) and flat band potential measurements were performed to further understand the superior photoelectric properties of the optimal sample.
2. Results and Discussion
2.1. TEM Analysis
Figure 1 presents the transmission electron microscope (TEM) images of mesoporous TiO2 and TiO2 samples treated under high-temperature vacuum conditions. As shown in Figure 1, all five samples exhibit an average particle diameter of approximately 250 nm [22,23], with a rough surface structure that facilitates the scattering of incident solar light, thereby enhancing light utilization. The structures are relatively loose, with numerous pores present on the surface, which significantly increases the surface area of the microspheres.
The structural morphology of the four activated samples (2hTiO2, 4hTiO2, 6hTiO2, and 8hTiO2) remains largely similar to that of the untreated TiO2, with only slight signs of sintering observed. This suggests that the vacuum high-temperature treatment did not significantly alter the microscopic morphology of the samples. The modest sintering effect indicates that the activation process primarily affects the electronic properties of the material rather than causing significant structural changes.
These results suggest that the vacuum treatment time does not dramatically influence the overall morphology but may lead to subtle modifications in the surface properties and defects, which could play a critical role in enhancing the photocatalytic activity and photoelectric performance of the TiO2 microspheres. Further investigation into the relationship between surface characteristics and photocatalytic efficiency is necessary to identify the optimal treatment conditions for improved solar-driven applications.
2.2. XRD Analysis
Figure 2 shows the X-ray diffraction (XRD) patterns of TiO2, 2hTiO2, 4hTiO2, 6hTiO2, and 8hTiO2. The mesoporous TiO2 microspheres exhibit characteristic diffraction peaks at 2θ values of 25.5°, 37.9°, 48.2°, 54.1°, and 63.1°, corresponding to the typical anatase phase of TiO₂. The XRD patterns of the treated samples (2hTiO2, 4hTiO2, 6hTiO2, and 8hTiO2) show diffraction peaks that are consistent with the TiO2 anatase phase, with no significant phase transformation observed.
Upon comparing the main peaks with standard reference patterns, it is evident that all five samples exhibit the anatase phase, though the intensity of the peaks decreases progressively with increasing treatment time. Notably, the intensity reduction is more pronounced in the 8hTiO2 sample, indicating that the vacuum high-temperature treatment leads to a decrease in the crystallinity of TiO2, rather than altering its crystal structure. This suggests that while the treatment does not induce a phase transition, it does impact the degree of crystallization, which may influence the material’s photocatalytic properties by increasing the number of surface defects and altering electron transport characteristics.
These findings indicate that the vacuum high-temperature treatment primarily affects the crystallinity of TiO2, and the decrease in peak intensity with treatment time is consistent with the expected reduction in crystallite size or the formation of amorphous regions, which could be beneficial for enhancing the photocatalytic activity by providing more active sites for photocatalysis.
2.3. UV-Vis Analysis
Figure 3 shows the solid-state UV-Vis absorption spectra of all five samples. The UV-Vis spectrum of the vacuum high-temperature treated samples (2hTiO2, 4hTiO2, 6hTiO2, and 8hTiO2) demonstrates an increase in absorption starting at 800 nm, indicating that these samples can absorb light in the visible light region. This shift toward longer wavelengths, known as a redshift, suggests that the treatment extends the light absorption range of TiO2 into the visible spectrum.
In contrast, the untreated pure TiO2 mesoporous microspheres exhibit significant absorption only in the ultraviolet (UV) region with wavelengths shorter than 400 nm. The UV-Vis spectra qualitatively show that the vacuum high-temperature activation treatment significantly enhances the light absorption capability of TiO2 in the visible region. This indicates a notable improvement in the photosensitivity of the treated samples, likely due to the formation of defects or electronic structure modifications induced by the high-temperature treatment, which facilitate the absorption of visible light.
These results confirm that the vacuum high-temperature activation treatment effectively improves the photocatalytic properties of TiO2 by expanding its absorption spectrum into the visible light range, thereby increasing its potential for applications in solar-driven photocatalysis. The redshift observed in the treated samples is consistent with the enhancement of the material’s light-harvesting capability, which is crucial for improving the efficiency of photocatalytic processes under solar irradiation.
2.4. Kinetics of Photodegradation Analysis
The photocatalytic activity of TiO2, 2hTiO2, 4hTiO2, 6hTiO2, and 8hTiO2 was evaluated by simulating sunlight using a xenon lamp, optical filters, and a condenser, with Rhodamine B (RHB) degradation as the test reaction. Figure 4 presents the degradation results for these samples over a 2.5-hour period. The degradation rates of TiO2, 2hTiO2, 4hTiO2, 6hTiO2, and 8hTiO2 were 25.9%, 71.4%, 95.8%, 89.8%, and 80.7%, respectively. Notably, the 4hTiO2 sample exhibited the highest photocatalytic activity, with a degradation rate of approximately 95%, indicating its superior performance compared to the other samples.
Comparing the results, it is evident that all four treated samples (2hTiO2, 4hTiO2, 6hTiO2, and 8hTiO2) achieved degradation rates greater than 60% under visible light irradiation over 2.5 hours, demonstrating that the vacuum high-temperature activation treatment significantly enhanced the photocatalytic efficiency of TiO2 for RHB degradation.
TiO2, as a wide band-gap semiconductor with a band gap of approximately 3.2 eV, primarily responds to UV light, leading to electron-hole separation. However, the observed photocatalytic activity of the treated samples under simulated visible light irradiation can be attributed to the sensitization effect of RHB. The enhanced photocatalytic activity under visible light is likely due to the extension of the TiO2 absorption spectrum into the visible region, as shown in the UV-Vis results, along with the possible formation of surface defects or dopant-induced changes that facilitate electron transfer and improve charge separation.
These findings highlight the effectiveness of the vacuum high-temperature treatment in enhancing the visible light photocatalytic activity of TiO2, making it a promising material for solar-driven photocatalysis applications.
2.5. Photocurrent Analysis
Figure 5 presents the photocurrent cycling comparison for TiO2, 2hTiO2, 4hTiO2, 6hTiO2, and 8hTiO2 under light and dark conditions. From the figure, it is evident that the photocurrent density of all five samples is approximately 0.13 μA•cm⁻² under light/dark cycles. However, the photocurrent density of the TiO2 microspheres treated under vacuum high-temperature conditions is significantly enhanced. Among the treated samples, 4hTiO2 exhibited the highest photocurrent density, indicating that the vacuum high-temperature treatment has a notable effect on TiO2.
The increased photocurrent density for the treated TiO2 microspheres suggests that the high-temperature treatment promotes the separation of photogenerated electrons and holes within the material, which is essential for efficient photocatalytic processes. This improvement in charge carrier separation is likely due to the formation of surface defects or changes in the electronic structure induced by the vacuum treatment. The enhancement in photocurrent density further supports the hypothesis that the high-temperature treatment significantly improves the material’s ability to efficiently separate and transport charge carriers, which is critical for enhancing its photocatalytic performance under light irradiation.
These results highlight the positive impact of the vacuum high-temperature treatment on the photoelectric properties of TiO2 microspheres, demonstrating that this process can effectively enhance charge separation and improve the photocurrent response, which is beneficial for applications in solar-driven photocatalysis.
2.6. SPV Analysis
Figure 6 shows the surface photovoltage (SPV) spectra for TiO2 and 4hTiO2. The SPV response of TiO2 mesoporous microspheres is observed in the 300-380 nm range, while 4hTiO2 exhibits a response across the entire spectrum. This broadening of the SPV response range in 4hTiO2 can be attributed to the vacuum high-temperature treatment, which likely enhances the surface properties and promotes more effective charge separation.
The transmission electron microscopy (TEM) images of both TiO2 and 4hTiO2 indicate that their surfaces are relatively rough, which can lead to the formation of defect states at the grain boundaries. Additionally, the gaps between microcrystals could adsorb gas molecules, contributing to surface states. For 4hTiO2, the extended vacuum high-temperature treatment time reduces the crystallinity of the material, leading to an increase in lattice defects and impurities. These structural modifications enhance the formation of surface states, which are responsible for the extended SPV response observed across the entire spectral range.
The presence of defect states and surface states creates temporary intermediate energy levels within the band gap. Under light irradiation, charge transitions between the valence band, these intermediate states, and the conduction band generate the observed photocurrent response. The broad SPV response of 4hTiO2 indicates that the increased surface defects and impurities facilitate the generation of intermediate energy levels, promoting charge carrier excitation and improving the photocatalytic activity over a wider range of the electromagnetic spectrum.
These findings demonstrate that the vacuum high-temperature treatment significantly influences the surface properties and electronic structure of TiO2, leading to an enhanced photocatalytic performance due to the increased surface states and the associated charge carrier dynamics.
2.7. XPS Analysis
Figure 7 shows the Ti 2p (a) and O 1s (b) X-ray photoelectron spectroscopy (XPS) spectra of the 4hTiO2 sample. The Ti 2p binding energies for pure TiO2 are typically observed around 464.5 eV and 459.0 eV [24]. However, in the 4hTiO2 sample, the presence of Ti³⁺ results in a shift of the binding energies to lower values [25]. The Ti 2p peak is complex, with four sub-peaks corresponding to Ti³⁺ 2p₃/₂ at approximately 456.8 eV, Ti⁴⁺ 2p₃/₂ at around 458.5 eV, Ti³⁺ 2p₁/₂ at approximately 463.2 eV, and Ti⁴⁺ 2p₁/₂ at around 464.5 eV [26,27]. As shown in Figure 7(a), the intensity of the Ti³⁺ peak is relatively weak, indicating that the concentration of Ti³⁺ in the 4hTiO2 sample is low.
The O 1s binding energy of Ti-O bonds is typically in the range of 529.5 eV to 530.5 eV [28]. Figure 7(b) presents the O 1s XPS spectrum of the 4hTiO2 sample, where three distinct peaks are observed within this range. These peaks suggest that the oxygen is predominantly in the form of Ti-O bonds. The peak at 529.7 eV corresponds to the Ti-O bond, while the peak at 531.9 eV is characteristic of surface oxygen vacancies (Ov) [29]. The weak peak at 533.4 eV corresponds to the hydroxyl (-OH) group [30], indicating the presence of -OH species on the sample surface.
The introduction of Ti³⁺ and oxygen vacancies (Ov) in TiO2 creates localized states approximately 0.75–1.18 eV below the conduction band. These localized states enable TiO2 to absorb visible and infrared light. As the concentrations of Ti³⁺ and Ov increase, these localized states merge to form an intermediate energy band, which effectively narrows the band gap of TiO2 [31]. This modification in the electronic structure enhances the photocatalytic activity by extending the material’s absorption spectrum into the visible and infrared regions, thus improving its overall photocatalytic efficiency under solar irradiation.
These XPS results confirm the presence of Ti³⁺ and oxygen vacancies, which play a crucial role in improving the light absorption properties and photocatalytic performance of TiO2 under visible light. The formation of an intermediate energy band through the introduction of Ti³⁺ and Ov significantly contributes to reducing the band gap of TiO2, facilitating its use in solar-driven photocatalysis.
2.8. Mott-Schottky Analysis
The flat band potential of a semiconductor can be determined from the Mott-Schottky plot, which reveals the type of semiconductor behavior. A positive slope in the Mott-Schottky curve indicates that the material is an n-type semiconductor, while a negative slope suggests it is a p-type semiconductor. Figure 8 presents the Mott-Schottky plots for TiO2, 2hTiO2, 4hTiO2, 6hTiO2, and 8hTiO2. According to the Mott-Schottky equation:
From the Mott-Schottky plots, the inverse capacitance squared (1/C21/C2) is plotted against the applied voltage (EE), which yields a linear relationship. The intersection of the curve with the x-axis corresponds to the flat band potential (approximately equal to the conduction band). As shown in Figure 8, the slope of the Mott-Schottky curves is positive, indicating that all the samples exhibit n-type semiconductor behavior. This result suggests that the vacuum high-temperature treatment does not alter the semiconductor type of TiO2.

Table 1.
Flat band potential (Efb) values of TiO2 and its treated variants (2hTiO2, 4hTiO2, 6hTiO2, and 8hTiO2).
Table 1.
Flat band potential (Efb) values of TiO2 and its treated variants (2hTiO2, 4hTiO2, 6hTiO2, and 8hTiO2).
| TiO2 | 2h TiO2 | 4h TiO2 | 6h TiO2 | 8h TiO2 | |
|---|---|---|---|---|---|
| Efb (ev) | -0.37 | -0.04 | 0.17 | -0.15 | 0.16 |
2.9. Visible-Light Activation Mechanism of Brown TiO₂
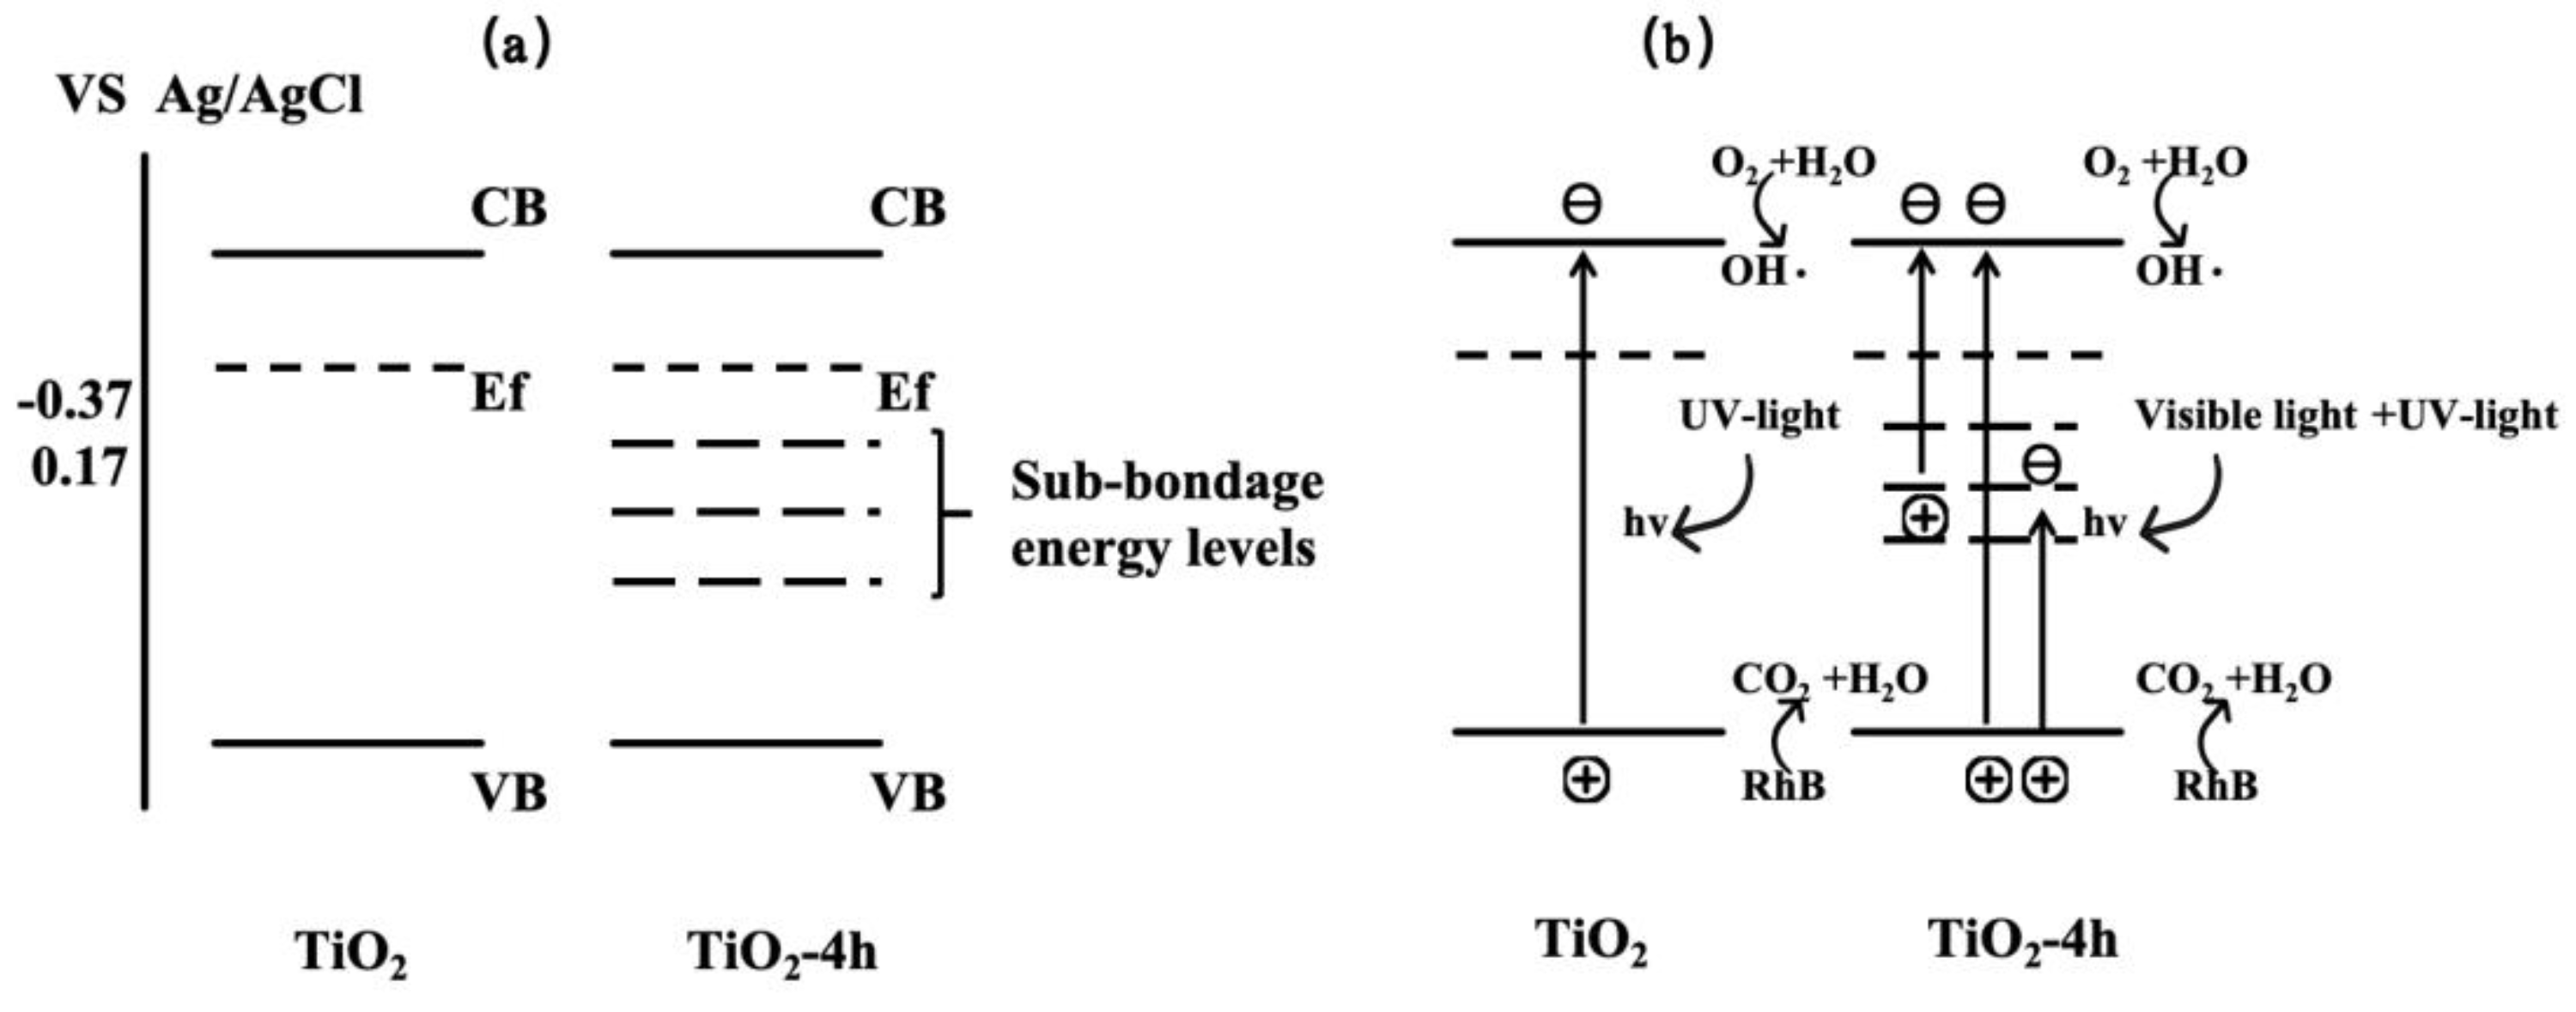
Furthermore, based on the Mott-Schottky theory, the flat band potentials (approximately equal to the Fermi level) for TiO2, 2hTiO2, 4hTiO2, 6hTiO2, and 8hTiO2 were approximately -0.37 V, -0.04 V, 0.17 V, -0.15 V, and 0.16 V vs Ag/AgCl, respectively. These values demonstrate that the flat band potential shifts with the treatment time, which may be linked to changes in the electronic structure or the formation of surface defects during the vacuum treatment. The variation in the flat band potential suggests modifications in the electron density and electronic properties of the material, which can influence its photocatalytic performance. Based on the above results, the band structure of brown TiO₂ can be qualitatively analyzed, as illustrated in Fig. a. After high-temperature vacuum treatment, the samples exhibit a lower Fermi level, indicating the formation of a greater number of sub-bandgap energy levels located deeper within the forbidden band between the valence band and the conduction band. Under visible-light irradiation, electrons can be excited from the valence band to these empty sub-bandgap states, or further promoted from these states to the conduction band, thereby generating photogenerated holes and reactive radicals that participate in the oxidation of RhB. This mechanism is consistent with the broad absorption band observed between 400 and 800 nm in the UV–vis absorption spectra. The detailed nature and internal structure of these sub-bandgap energy levels may be further elucidated in future work by first-principles calculations.
Figure 9.
visible-light activation mechanism of brown TiO₂.
3. Experiment
3.1. Materials and Methods
The chemical reagents used in this study are of analytical grade, and no additional purification was performed. The specific reagents and their sources are as follows: Titanium tetrabutoxide, Ethylene glycol, Propanol, Rhodamine B,Anhydrous ethanol, provided by Sigma-Aldrich (St. Louis, MO, USA).
Main instruments: X-ray diffractometer (XRD), Rigaku D/MAX-2500 (Rigaku Corporation, Tokyo, Japan), used for characterizing the crystal structure of nano-ZnO. Transmission electron microscope (TEM), JEOL JEM-2100 (JEOL Ltd., Tokyo, Japan), was used to observe the sample’s morphology and particle size. X-ray photoelectron spectroscopy (XPS), PHI 5000 (Physical Electronics, Chanhassen, MN, USA), was used to analyze the sample’s surface chemical state.
3.2. Sample Preparation
Sample Preparation for TiO2 Mesoporous Microspheres
Titanium dioxide (TiO2) mesoporous microspheres were synthesized following a sol-gel method. At room temperature, 25 mL of ethylene glycol was added to a round-bottom flask, followed by 1 mL of titanium tetrabutoxide (TBT). The mixture was vigorously stirred, and nitrogen gas was introduced for 10 minutes to expel air from the system. The reaction was sealed and stirred for 24 hours. After the reaction, the mixture was quickly poured into a solution of 100 mL acetone and 1 mL deionized water, and stirred for approximately 10 minutes. The solution was then allowed to stand for about 16 hours.
After aging, the white solid was collected via centrifugation. To remove residual organic impurities, the solid was washed five times with acetone and ethanol. The washed white solid was then dried in a convection oven.
For the hydrothermal treatment, 1 g of the dried sample was transferred to a 100 mL high-pressure reaction vessel, and 80 mL of ultra-pure water was added. The vessel was sealed and heated at 180 °C for approximately 4 hours. After the reaction, the vessel was removed from the oven and allowed to cool to room temperature. The white precipitate was separated by centrifugation and washed multiple times with ultra-pure water and ethanol. The resulting white precipitate was dried, yielding the TiO2 mesoporous microspheres, which were subsequently stored for further use.
Vacuum High-Temperature Treatment of TiO2 Mesoporous Microspheres
The TiO2 mesoporous microspheres obtained from the synthesis process were placed in a vacuum drying oven. The temperature was gradually increased to 190 °C, and the vacuum pressure was set to 2 × 10⁴ Pa. The samples were subjected to high-temperature treatment for varying durations of 2 hours, 4 hours, 6 hours, and 8 hours, resulting in the formation of 2h TiO2,4h TiO2,6h TiO2and 8h TiO2 samples, respectively.
3.3. Test of Photocatalytic
Photocatalytic Degradation under Visible Light
To evaluate the photocatalytic degradation performance, 25 mg of each sample was accurately weighed and placed in a photoreactor. Then, 20 mL of a 20 mg·L⁻¹ Rhodamine B (RHB) aqueous solution was added. The photoreactor was wrapped with aluminum foil and stirred for 30 minutes to ensure proper mixing. After the stirring period, 1 mL of the supernatant was collected using a micropipette. The aluminum foil was removed, and a xenon lamp was switched on. A filter (wavelength < 400 nm) and a condenser were used to ensure that the incident light remained within the visible light range. The system was irradiated continuously, and 1 mL of the supernatant was sampled every 30 minutes. Four samples were sequentially withdrawn, labeled, and their concentrations were measured using a visible light spectrophotometer. The concentration data were used to generate C/C₀ vs. time plots for analysis of the photocatalytic activity of the samples.
Photocurrent Measurement under Visible Light
For photocurrent measurements, 50 mg of each sample was placed in a sample bottle, and 1 mL of deionized water was added. The mixture was stirred with a magnetic stirrer until a paste-like consistency was achieved. A small amount of this paste was transferred using a pipette and applied onto an FTO (fluorine-doped tin oxide) glass substrate with dimensions approximately 5 mm × 5 mm. The coated FTO glass was allowed to dry at room temperature, forming the working electrode.
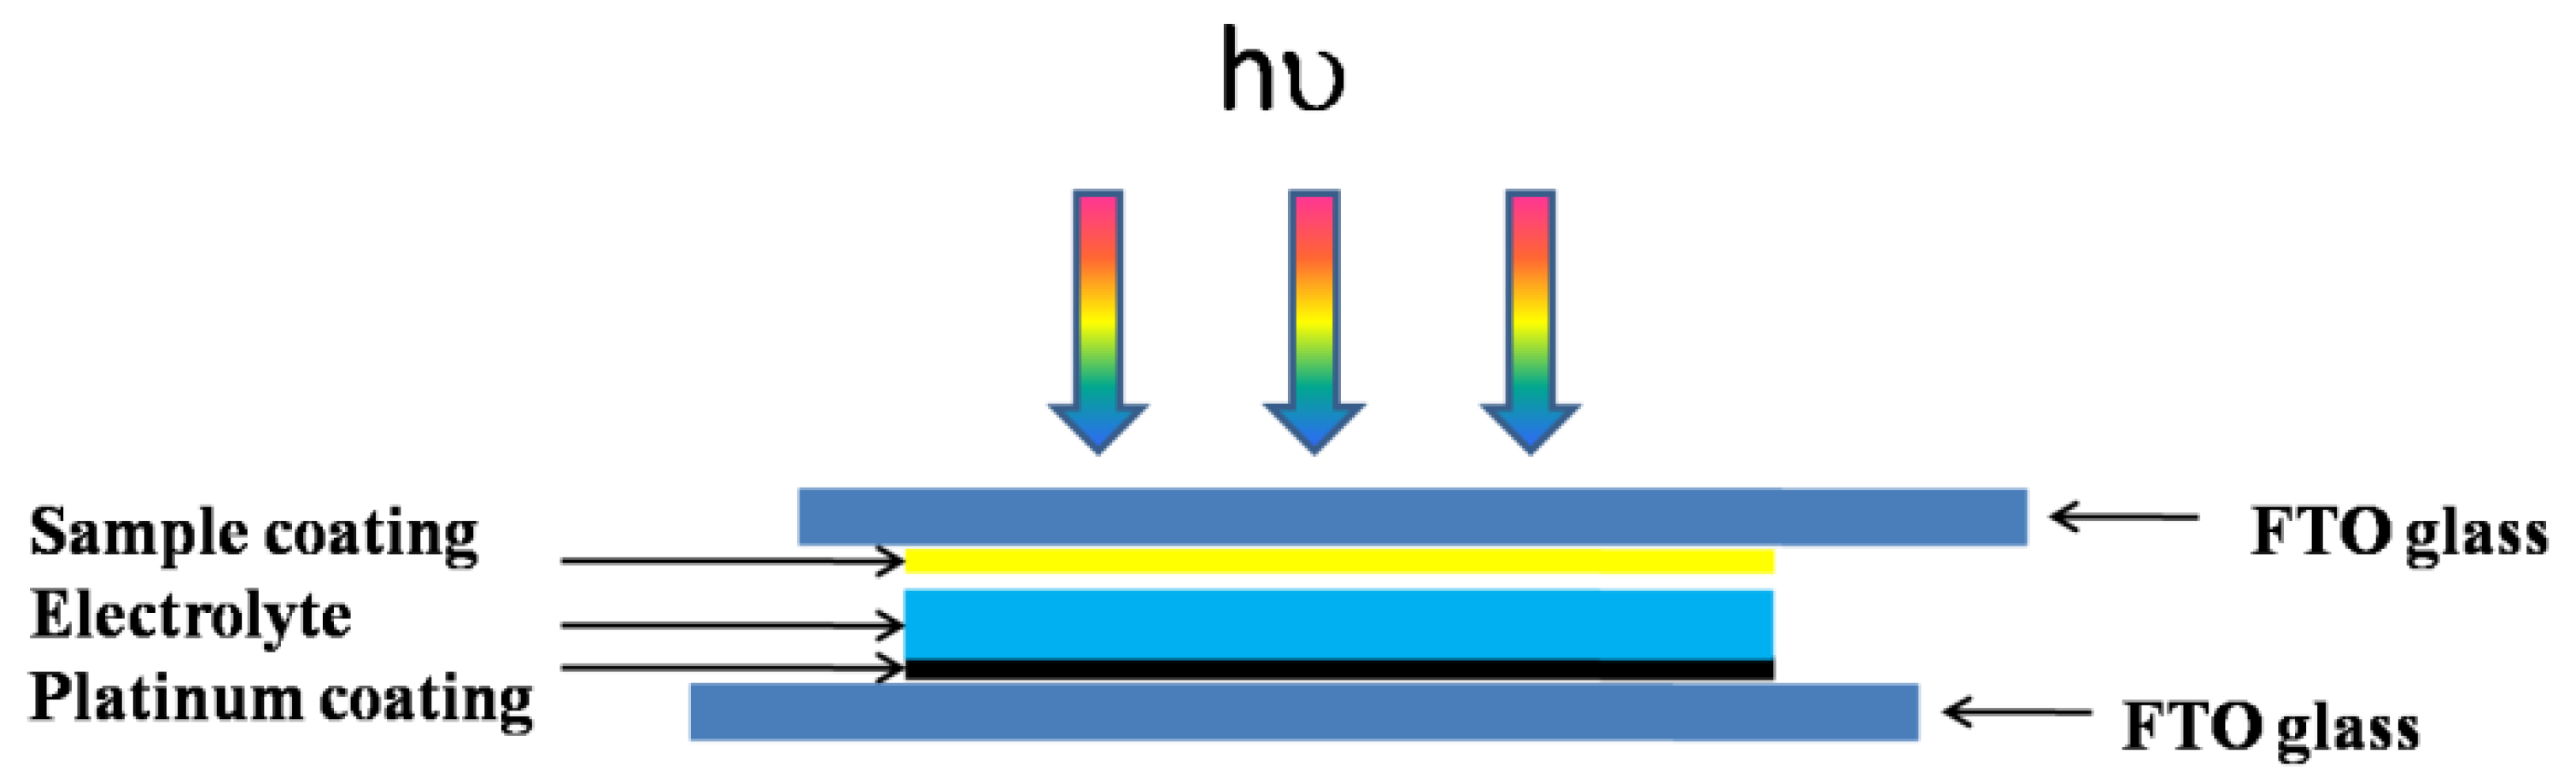
The working electrode and a platinum counter electrode were securely clamped. A 1 mol/L I₃⁻/I⁻ electrolyte solution was injected between the two electrodes using a 50 μL micropipette. The working electrode, which contained the sample, was positioned between the FTO conductive glass, while the reference electrode and counter electrode were attached to the platinum electrode. The system was exposed to light from a xenon lamp, with the light intensity adjusted to 100 mW·cm⁻². A filter (wavelength < 400 nm) was used to ensure that the incident light was within the visible light range. The photocurrent was measured using the setup depicted in Figure 10.
Measurement of Flat Band Potential
For the measurement of the flat band potential, 50 mg of each sample was weighed and placed into a sample bottle. Then, 1 mL of deionized water was added, and the mixture was stirred with a magnetic stirrer until a paste-like consistency was achieved. A small amount of the paste was transferred using a pipette and applied onto an FTO (fluorine-doped tin oxide) glass substrate with dimensions approximately 5 mm × 5 mm. The coated FTO glass was left to dry at room temperature to form the working electrode.
A platinum electrode was used as the counter electrode, and an Ag/AgCl electrode served as the reference electrode. The flat band potential was measured by placing the sample-coated FTO glass as the working electrode in the system, and the measurements were conducted under standard electrochemical conditions.
3.4. Material Characterization
X-ray powder diffraction (XRD) was used to analyze the diffraction patterns of the materials, providing information on their chemical composition and internal atomic or molecular structure. Material morphology was examined by field-emission scanning electron microscopy (FE-SEM) and transmission electron microscopy (TEM).
4. Conclusions
In this study, TiO2 microspheres with a diameter of approximately 250 nm were synthesized via a hydrothermal method using tetrabutyl titanate as the precursor. The TiO2 microsphere powder was then subjected to vacuum high-temperature treatment for 2, 4, 6, and 8 hours. Transmission electron microscopy (TEM) characterization revealed that the vacuum high-temperature treatment did not alter the morphology or structure of the microspheres, which remained loose and porous, thereby enhancing their ability to utilize solar light.
Photocatalytic degradation of Rhodamine B (RHB) under simulated visible light conditions showed that the 4hTiO2 sample exhibited the highest degradation rate among all the samples, indicating its superior photocatalytic performance. The flat band potential of 4hTiO2 was found to be 0.17 V vs Ag/AgCl, corresponding to the highest conduction band position. X-ray photoelectron spectroscopy (XPS) analysis revealed that the 4hTiO2 sample, after vacuum high-temperature activation, contained Ti³⁺ and oxygen vacancies, which contributed to enhanced light absorption and the generation of a large number of photogenerated electrons and holes. These results suggest that the 4hTiO2 sample possesses improved photocatalytic water splitting capabilities, driven by its enhanced photosensitivity and the presence of surface defects. Therefore, vacuum high-temperature treatment effectively enhances the photocatalytic performance of TiO2 microspheres, making them promising candidates for solar-driven photocatalytic applications.
Author Contributions
Material preparation, catalytic experiments and writing—original draft,Y.G.; writing—review & editing, T.F.; data analysis, X.Q., H.Y.; theoretical investigation, Y.Z.; original idea and supervision, J.D.,J.Z. All authors have read and agreed to the published version of the manuscript.
Funding
The study was supported by the university-level team research project of Hainan Vocational University of Science and Technology in 2024 “Research on Polyionic Liquid Materials and Their Catalytic Properties (HKKY2024-TD-17)”; Hainan Province 2025 Higher Education Teaching Reform Research Project: Research on the Ideological and Political Teaching Model of the “Principles of Chemical Engineering” Course Based on Target Problem-Oriented Approach (Hnjg2025ZC-127), Hainan Province 2025 Higher Education Scientific Research Project: Study on Polyionic Liquid Materials and Their Photocatalytic Performance (Hnky2025-66), Research on Teaching Methods of Mechanical Manufacturing Courses under Informationization Conditions (HKJG2024-35). The Hainan University of Science and Technology Vocational College Innovation and Entrepreneurship Training Program for College Students also provided support (2025).
Data Availability Statement
The data that support the findings of this study are available from the corresponding author upon reasonable request.
Conflicts of Interest
The authors declare no conflict of interest.
References
- Thompson T L, Yates J T Jr. Chem Rev, 2006, 106, 4428.
- J. Zhang, Y. Wu, M. Xing, S.A.K. Leghari, S. Sajjad, Energy Environ. Sci. 2010, 3, 715.
- Y. Cong, J.L. Zhang, F. Chen, M. Anpo, J. Phys. Chem. C 2007, 111, 6976.
- J. L. Zhang, T. Ayusawa, M. Minagawa, K. Kinugawa, H. Yamashita, M. Matsuoka,M. Anpo, J. Catal. 2001, 198, 1.
- Justicia, P. Ordejón, G. Canto, J.L. Mozos, J. Fraxedas, G.A. Battiston, R. Gerbasi, A. Figueras, Adv. Mater. 2002, 14, 1399–1402. [Google Scholar]
- W. Choi, A. Termin, M.R. Hoffmann, J. Phys. Chem. 1994, 98, 13669–13679.
- M. Xing, D. Qi, J. Zhang, F. Chen, Chem. Eur. J. 2011, 17, 11432–11436.
- Hoffman M R, Martin S T, Choi W, Bahnemann D W. Chem Rev, 1995, 95, 69.
- Tachikawa T, Fujitsuka M, Majima T. J Phys Chem C, 2007, 111, 5259.
- R. Asahi, T. Morikawa, T. Ohwaki, K. Aoki, Y. Taga, Science 2001, 293, 269.
- M. Xing, J. Zhang, F. Chen, Appl. Catal. B 2009, 89, 563.
- M. -Y. Xing, W.-K. Li, Y.-M. Wu, J.-L. Zhang, X.-Q. Gong, J. Phys. Chem. C 2011, 115, 7858.
- X. Chen, X. Wang, Y. Hou, J. Huang, L. Wu, X. Fu, J. Catal. 2008, 255, 59.
- L. Zhao, X. Chen, X. Wang, Y. Zhang, W. Wei, Y. Sun, M. Antonietti, M.-M.Titirici, Adv. Mater. 2010, 22, 3317. [Google Scholar]
- S. Sakthivel, H. Kisch, Angew. Chem. Int. Ed. 2003, 42, 4908.
- Y. M. Wu, M.Y. Xing, J.L. Zhang, F. Chen, Appl. Catal. B Environ. 2010, 97, 182.
- P. Xu, T. Xu, J. Lu, S. Gao, N.S. Hosmane, B. Huang, Y. Dai, Y. Wang, Energy Environ. Sci. 2010, 3, 1128.
- T. Ohno, Z. Miyamoto, K. Nishijima, H. Kanemitsu, F. Xueyuan, Appl. Catal. A, 2006, 302, 62.
- Hoffman M R, Martin S T, Choi W, Bahnemann D W. Chem Rev. 1995, 95, 69.
- Tachikawa T, Fujitsuka M, Majima T. J Phys Chem C, 2007, 111, 5259.
- F. Z. Huang, D.H. Chen, X.L. Zhang, R.A. Caruso, Y.B. Cheng, Dual-Function Scattering Layer of Submicrometer-Sized Mesoporous TiO2Beads for High- Efficiency Dye-Sensitized Solar Cells, Adv. Funct. Mater. 2010, 20, 1301.
- Y. J. Kim, M.H. Lee, H.J. Kim, G. Lim, Y.S. Choi, N.G. Park, K. Kim, W.I. Lee, Formation of Highly Efficient Dye-Sensitized Solar Cells by Hierarchical Pore Generation with Nanoporous TiO2Spheres, Adv. Mater. 2009, 21, 3668.
- Yu F H, Wang J H, Zhao K F, Yin J, Jin C Z, Liu X. Chin J Catal, 2013, 34, 1216.
- Etacheri V, Seery M K, Hinder S J, Pillai S C. Chem Mater, 2010, 22, 3843.
- Q. D. Zhao, T.F. Xie, L.L. Peng, Y.H. Lin, P. Wang, L. Peng, D.J. Wang, Size- and Orientation-Dependent Photovoltaic Properties of ZnO Nanorods, J. Phys. Chem. C 2007, 111, 17136. [CrossRef]
- Y. Zhang, L.L. Wang, B.K. Liu, J.L. Zhai, H.M. Fan, D.J. Wang, Y.-H. Lin, T.F. Xie, Synthesis of Zn-doped TiO2microspheres with enhanced photovoltaic performance and application for dye-sensitized solar cells, Electrochimica Acta 2011, 56, 6517–6523. [CrossRef]
- B. K. Liu, D.J. Wang, L.L. Wang, Y.J. Sun, Y.H. Lin, X.Q. Zhang, T.F. Xie, Glutathione-assisted hydrothermal synthesis of CdS-decorated TiO2 nanorod arrays for quantum dot-sensitized solar cells, Electrochimica Acta 2013, 113, 661–667. [CrossRef]
- Zou J, Gao J C, Wang Y. J Photochem Photobiol A, 2009, 202, 128.
- Szczepankiewicz S H, Moss J A, Hoffmann M R. J Phys Chem B, 2002, 106, 2922.
- Liu G, Yan X X, Chen Z G, Wang X W, Wang L Z, Lu G Q, Cheng H H. J Mater Chem, 2009, 19, 6590.
- Mingyang Xing, Jinlong Zhang,* Feng Chen and Baozhu Tian, Chem. Commun., 2011, 47, 4947–4949.
Figure 1.
TEM images of samples obtained after vacuum activate for different time. (a) TiO2;(b)2h TiO2; (c)4hTiO2;(d)6hTiO2; (e)8hTiO2.
Figure 1.
TEM images of samples obtained after vacuum activate for different time. (a) TiO2;(b)2h TiO2; (c)4hTiO2;(d)6hTiO2; (e)8hTiO2.
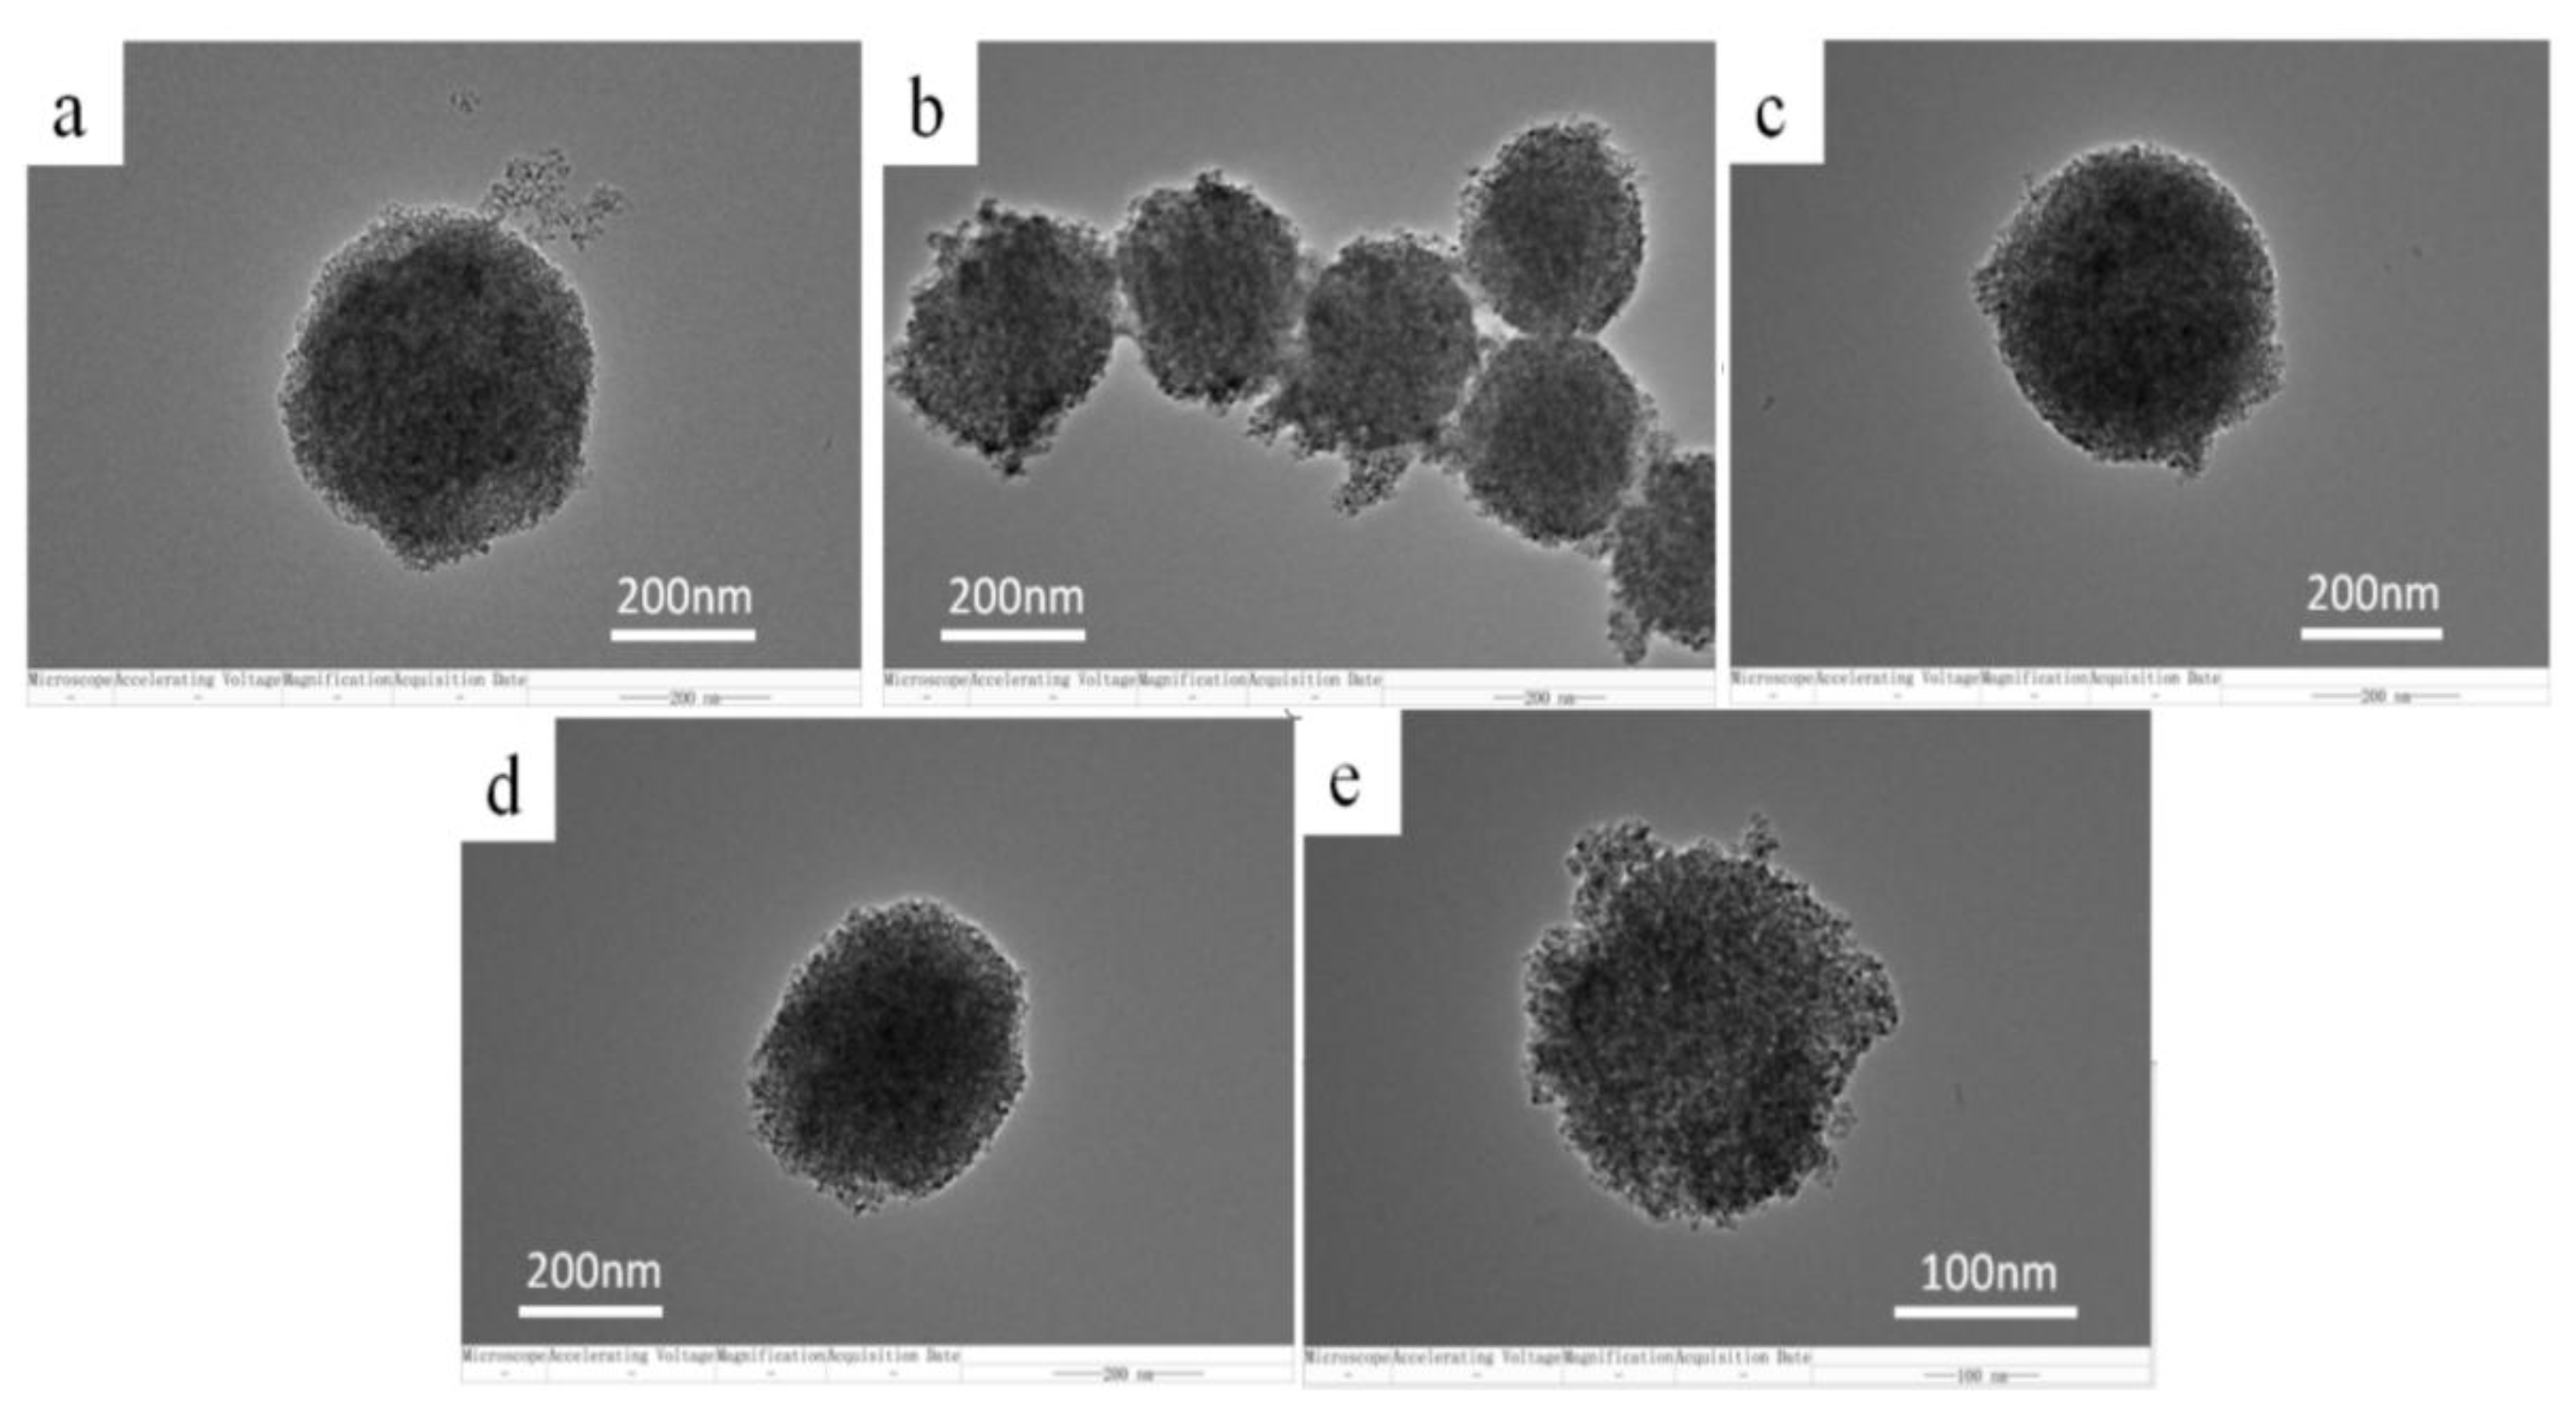
Figure 2.
XRD patterns of mesoporous TiO2 microspheres and 2h TiO2,4h TiO2,6h TiO2,8h TiO2.
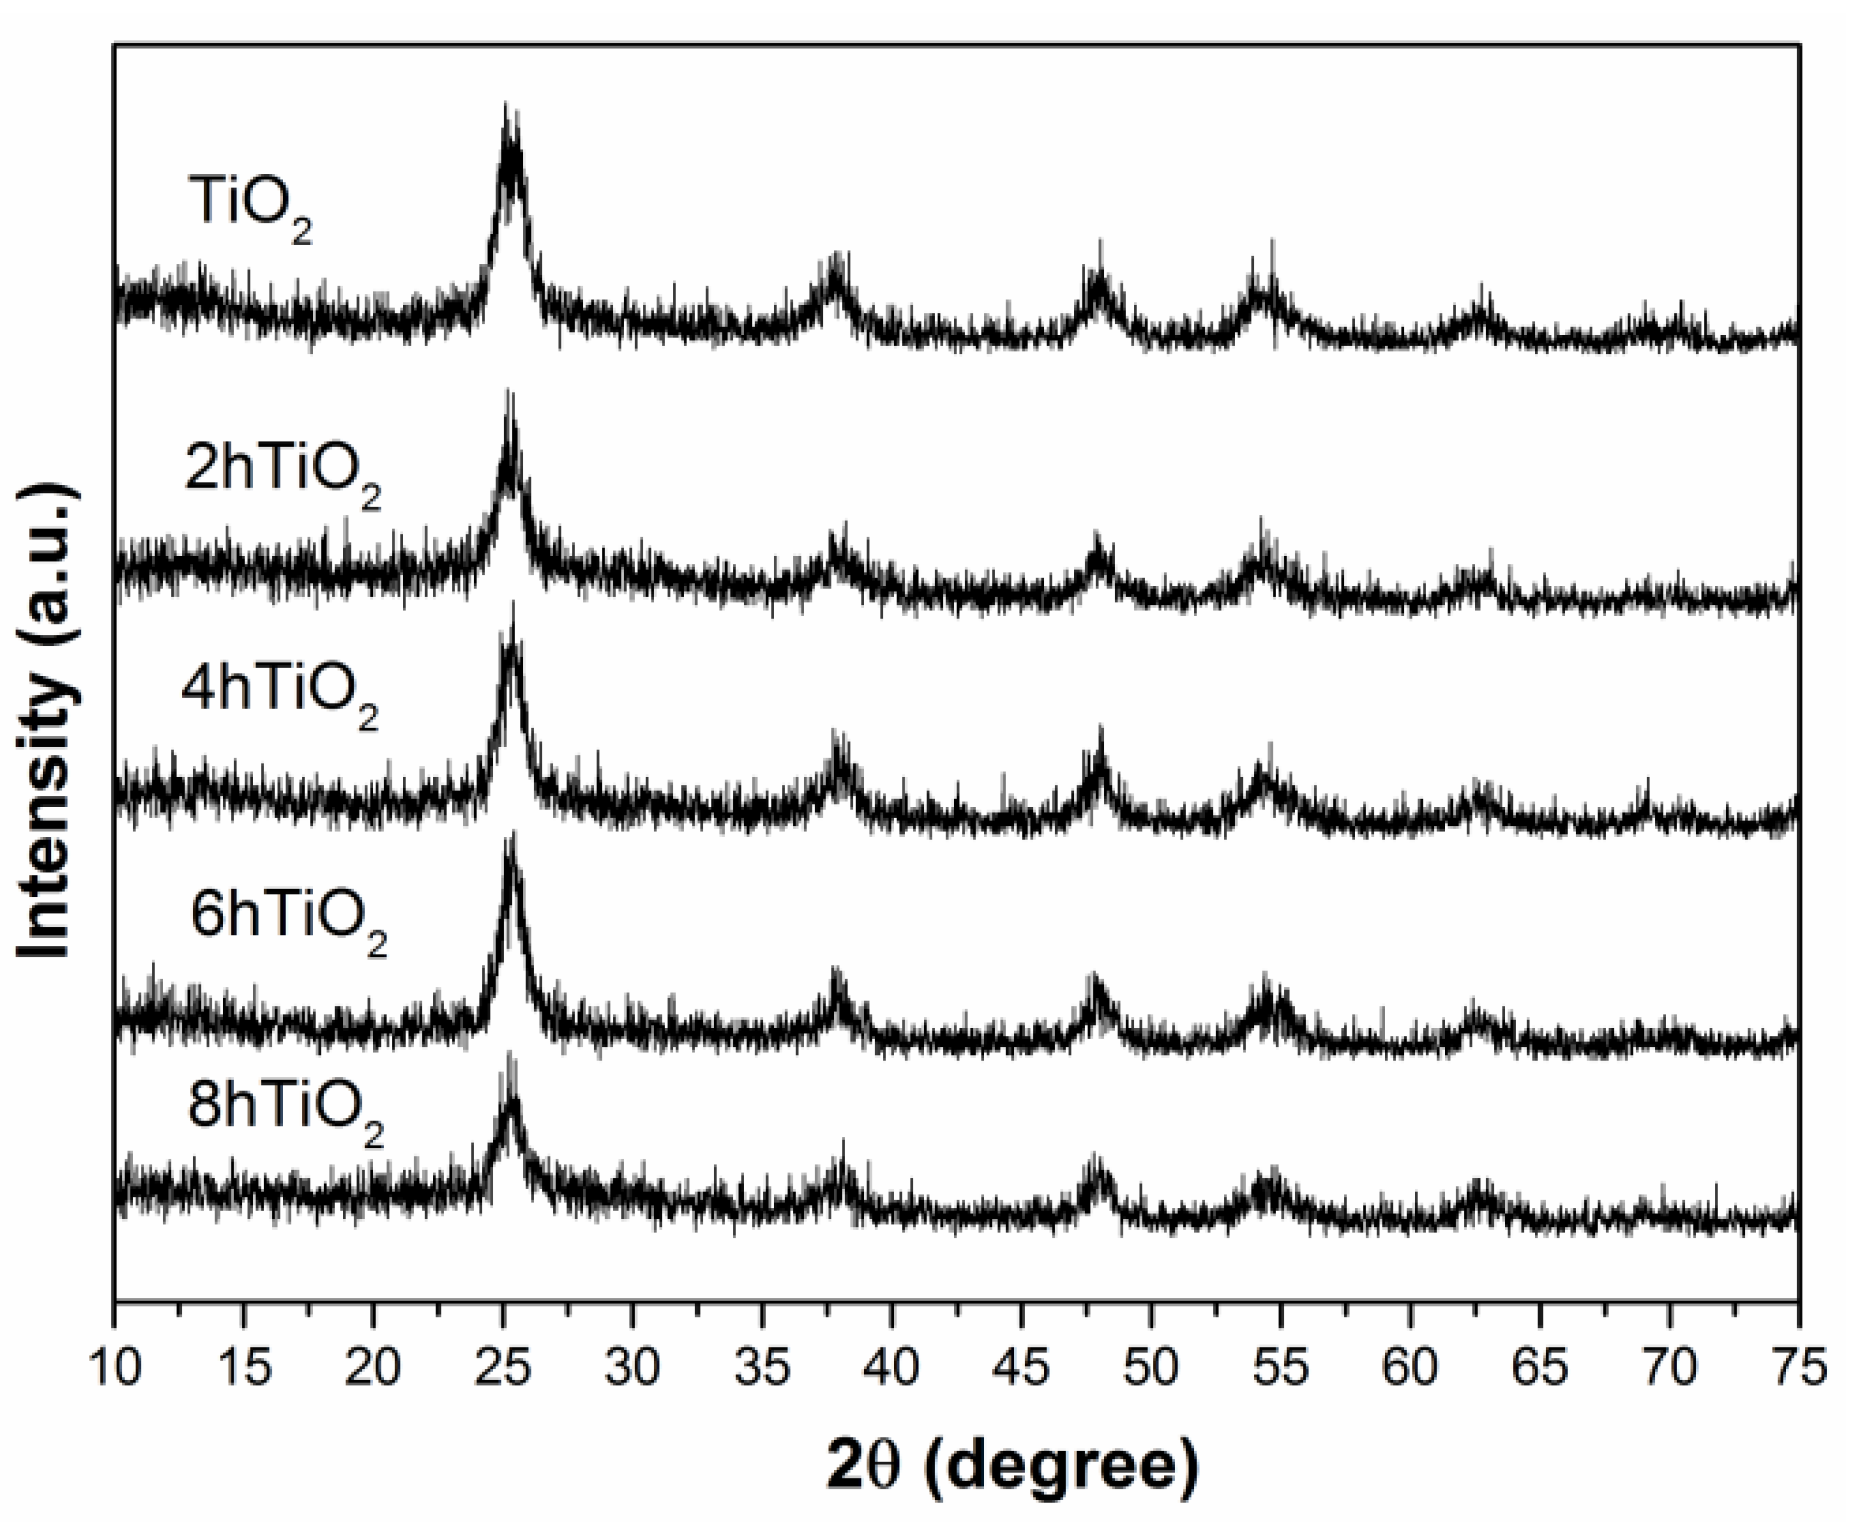
Figure 3.
UV-vis absorption spectra for mesoporous TiO2 microspheres and the vacuum activated samples.
Figure 3.
UV-vis absorption spectra for mesoporous TiO2 microspheres and the vacuum activated samples.
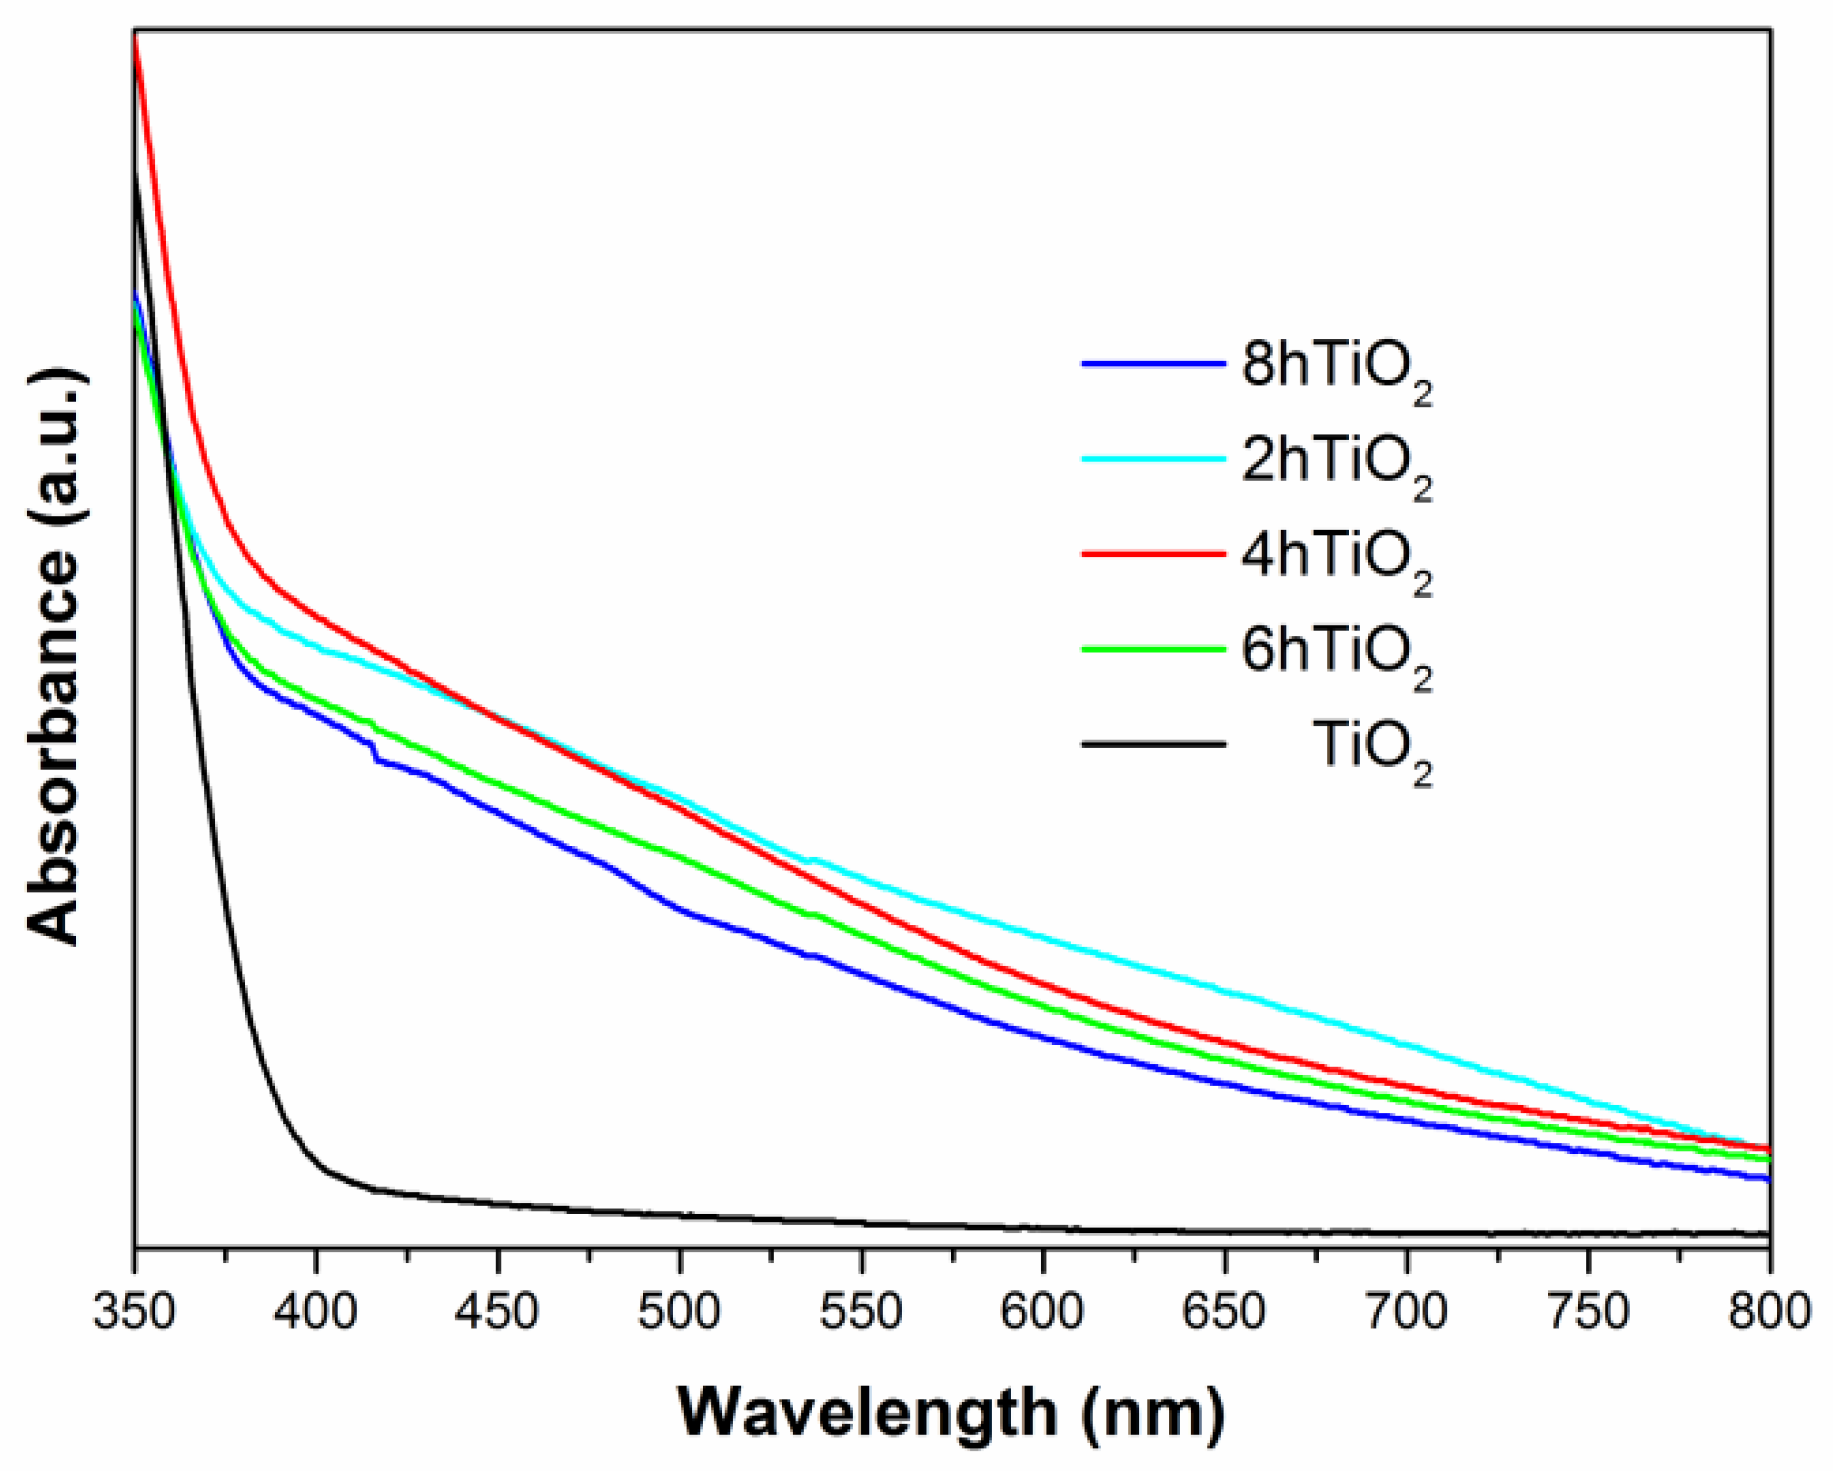
Figure 4.
Kinetics of photodegradation of 20 mg L-1 Rhodamine B(RhB)by vacuum activated TiO2 under visible light irradiation for 2.5 h.
Figure 4.
Kinetics of photodegradation of 20 mg L-1 Rhodamine B(RhB)by vacuum activated TiO2 under visible light irradiation for 2.5 h.
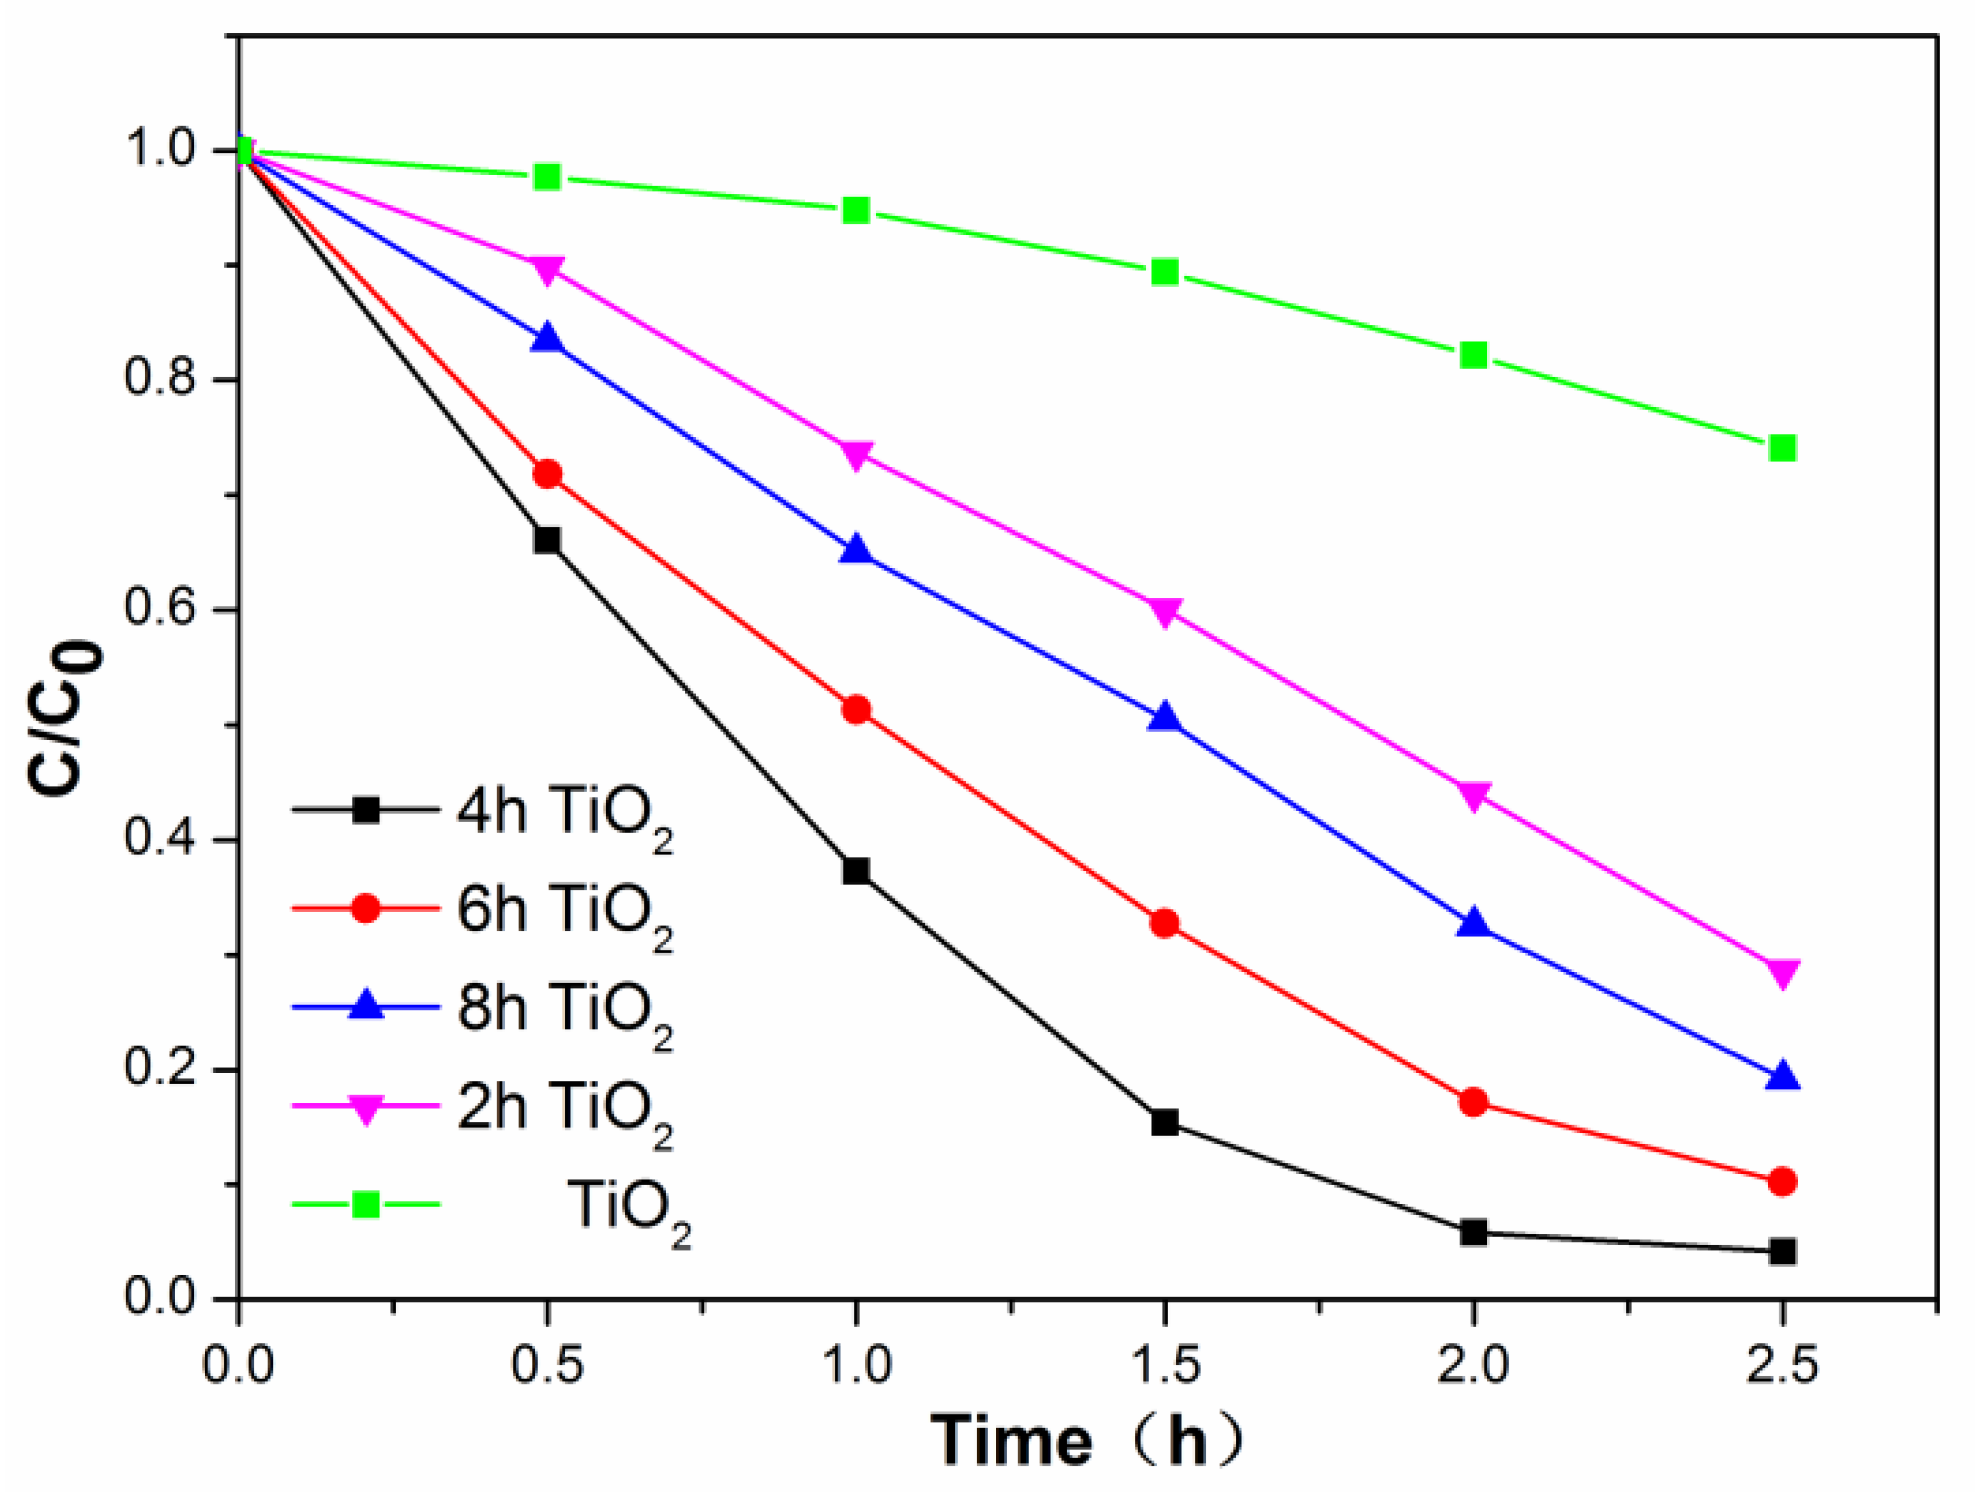
Figure 5.
Photocurrent of TiO2, 2h TiO2,4h TiO2,6h TiO2 and 8h TiO2 under visible light (>400 nm) on/off cycles.
Figure 5.
Photocurrent of TiO2, 2h TiO2,4h TiO2,6h TiO2 and 8h TiO2 under visible light (>400 nm) on/off cycles.
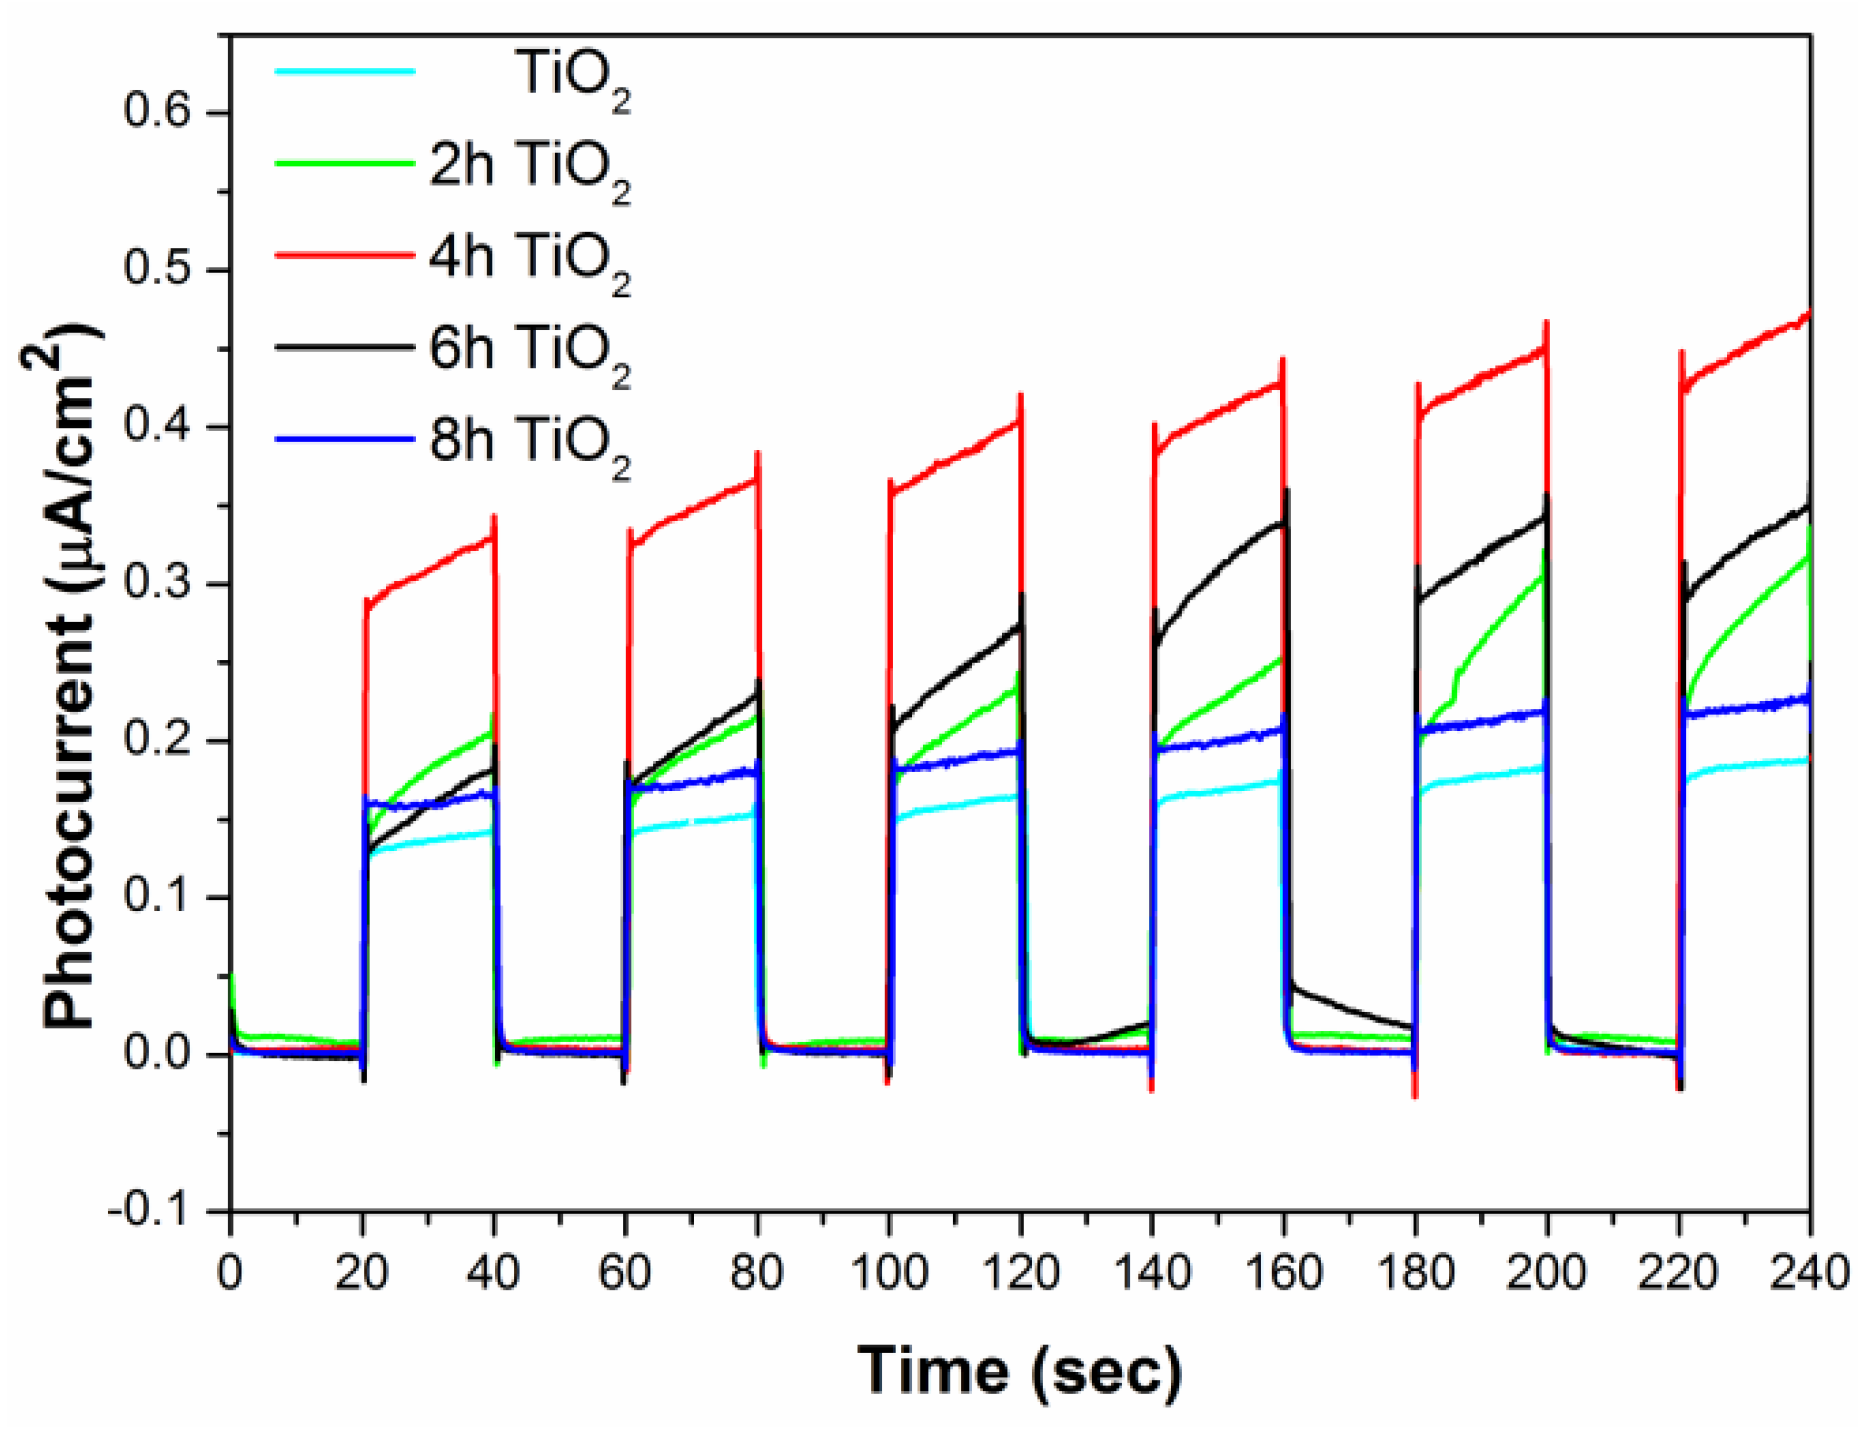
Figure 6.
Surface photovoltage spectra.
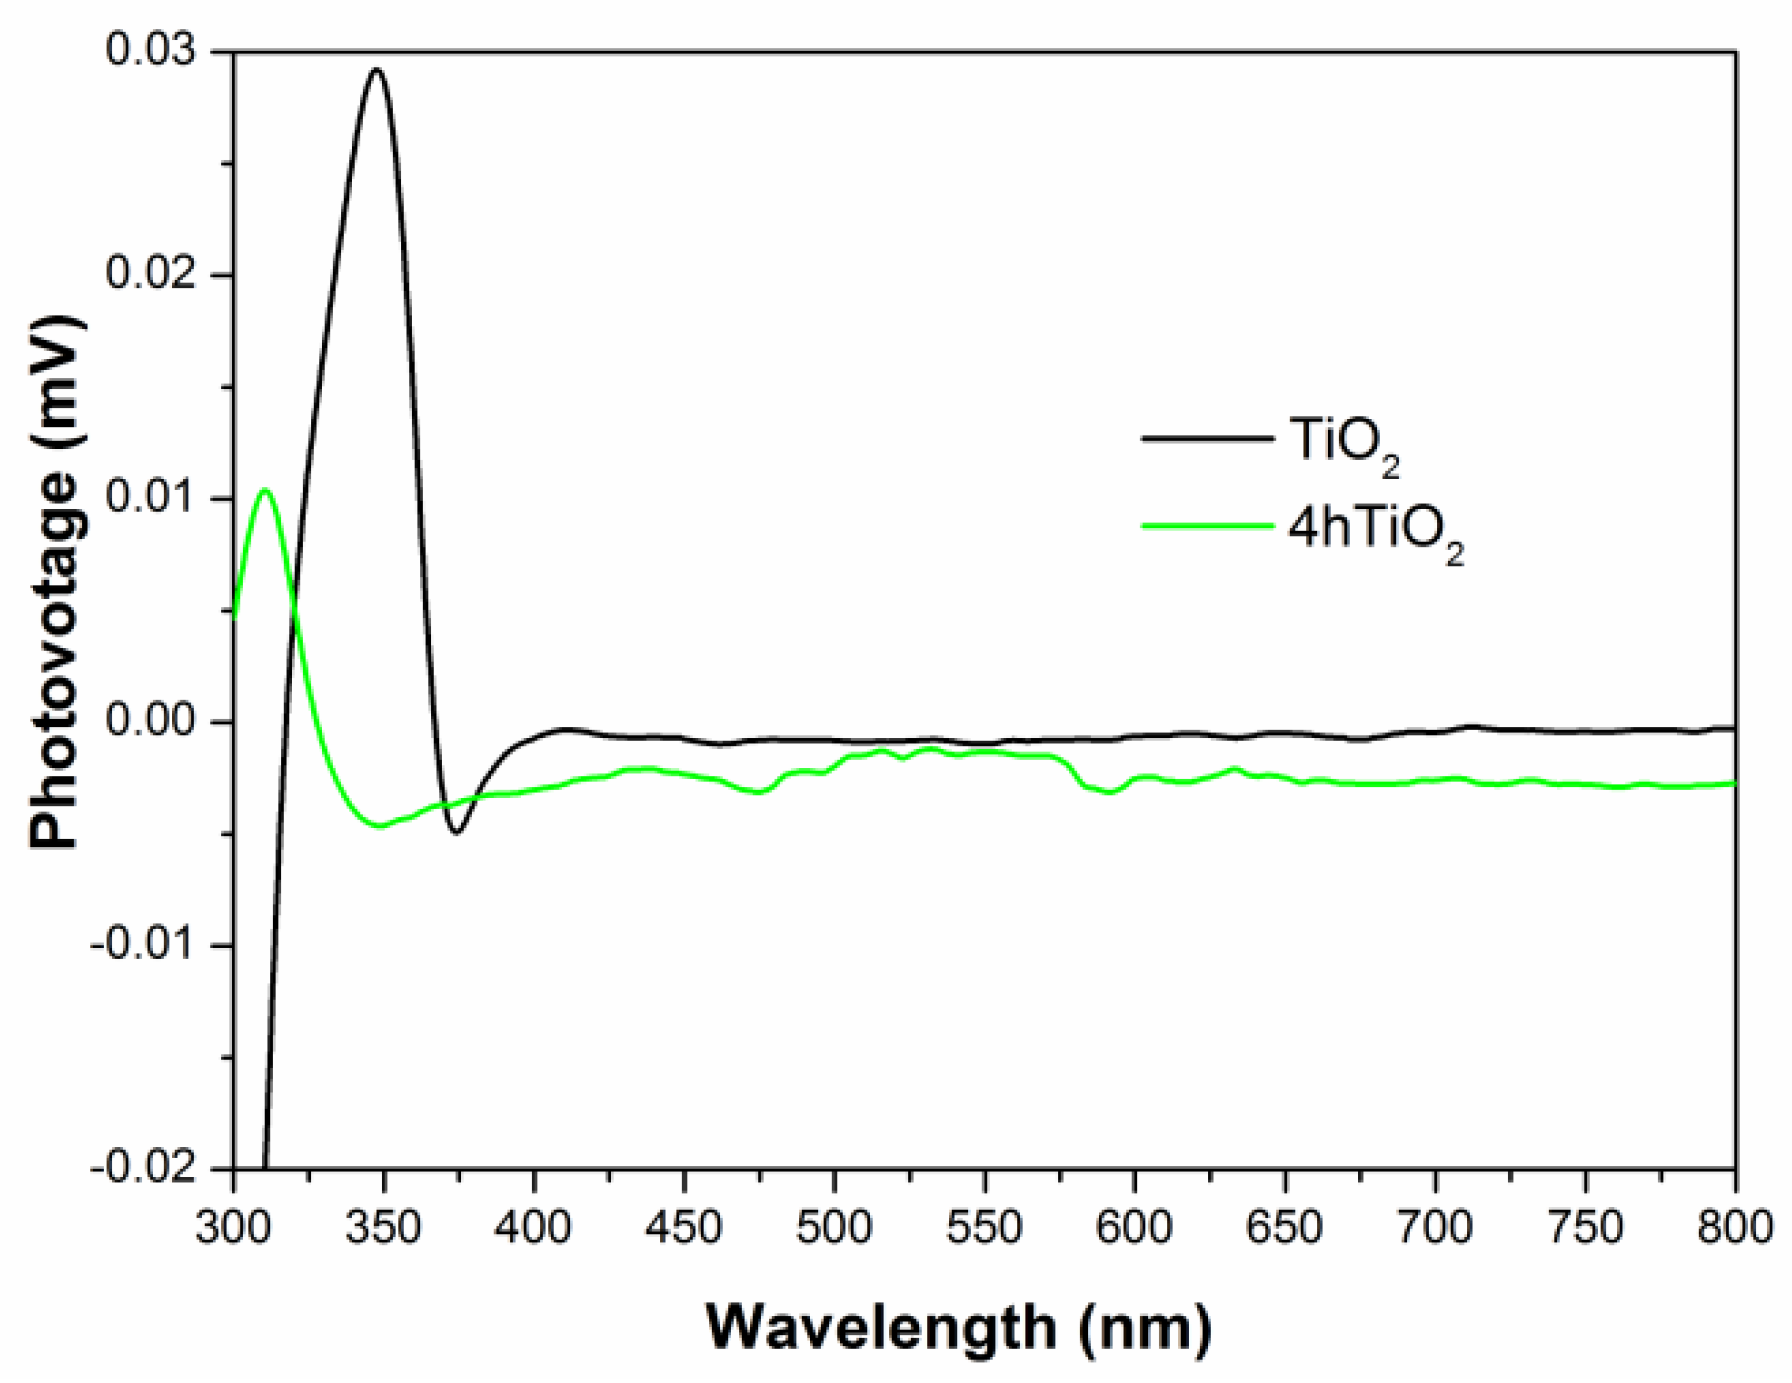
Figure 7.
High-resolution XPS spectra of Ti 2p (a) and O 1s (b) for 4hTiO2.
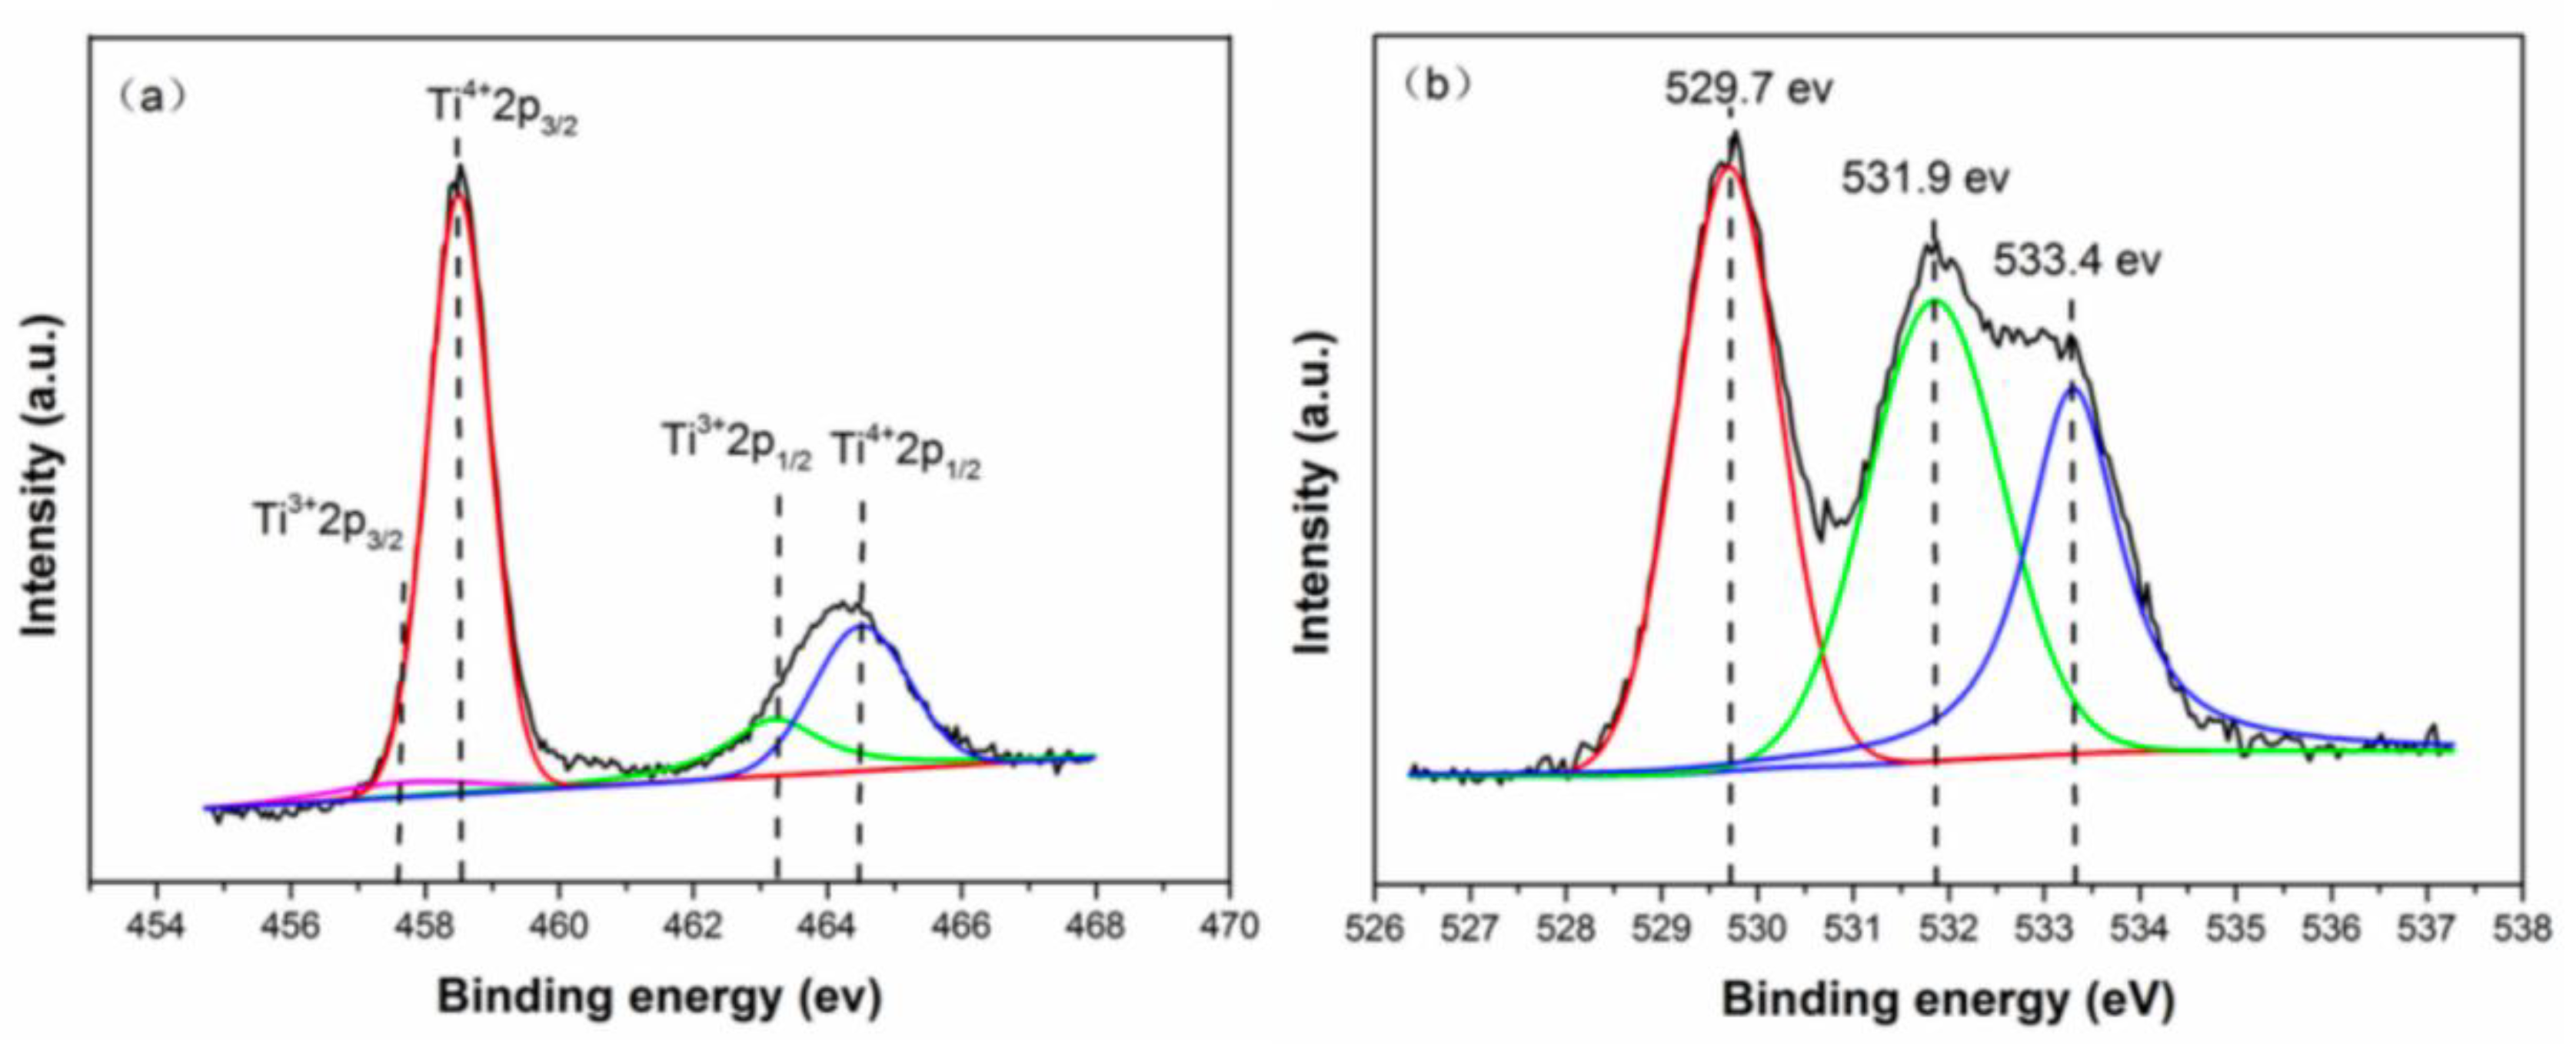
Figure 8.
Mott–Schottky plots of TiO2, 2h TiO2,4h TiO2,6h TiO2and 8h TiO2in 0.2M Na2SO4 solution.
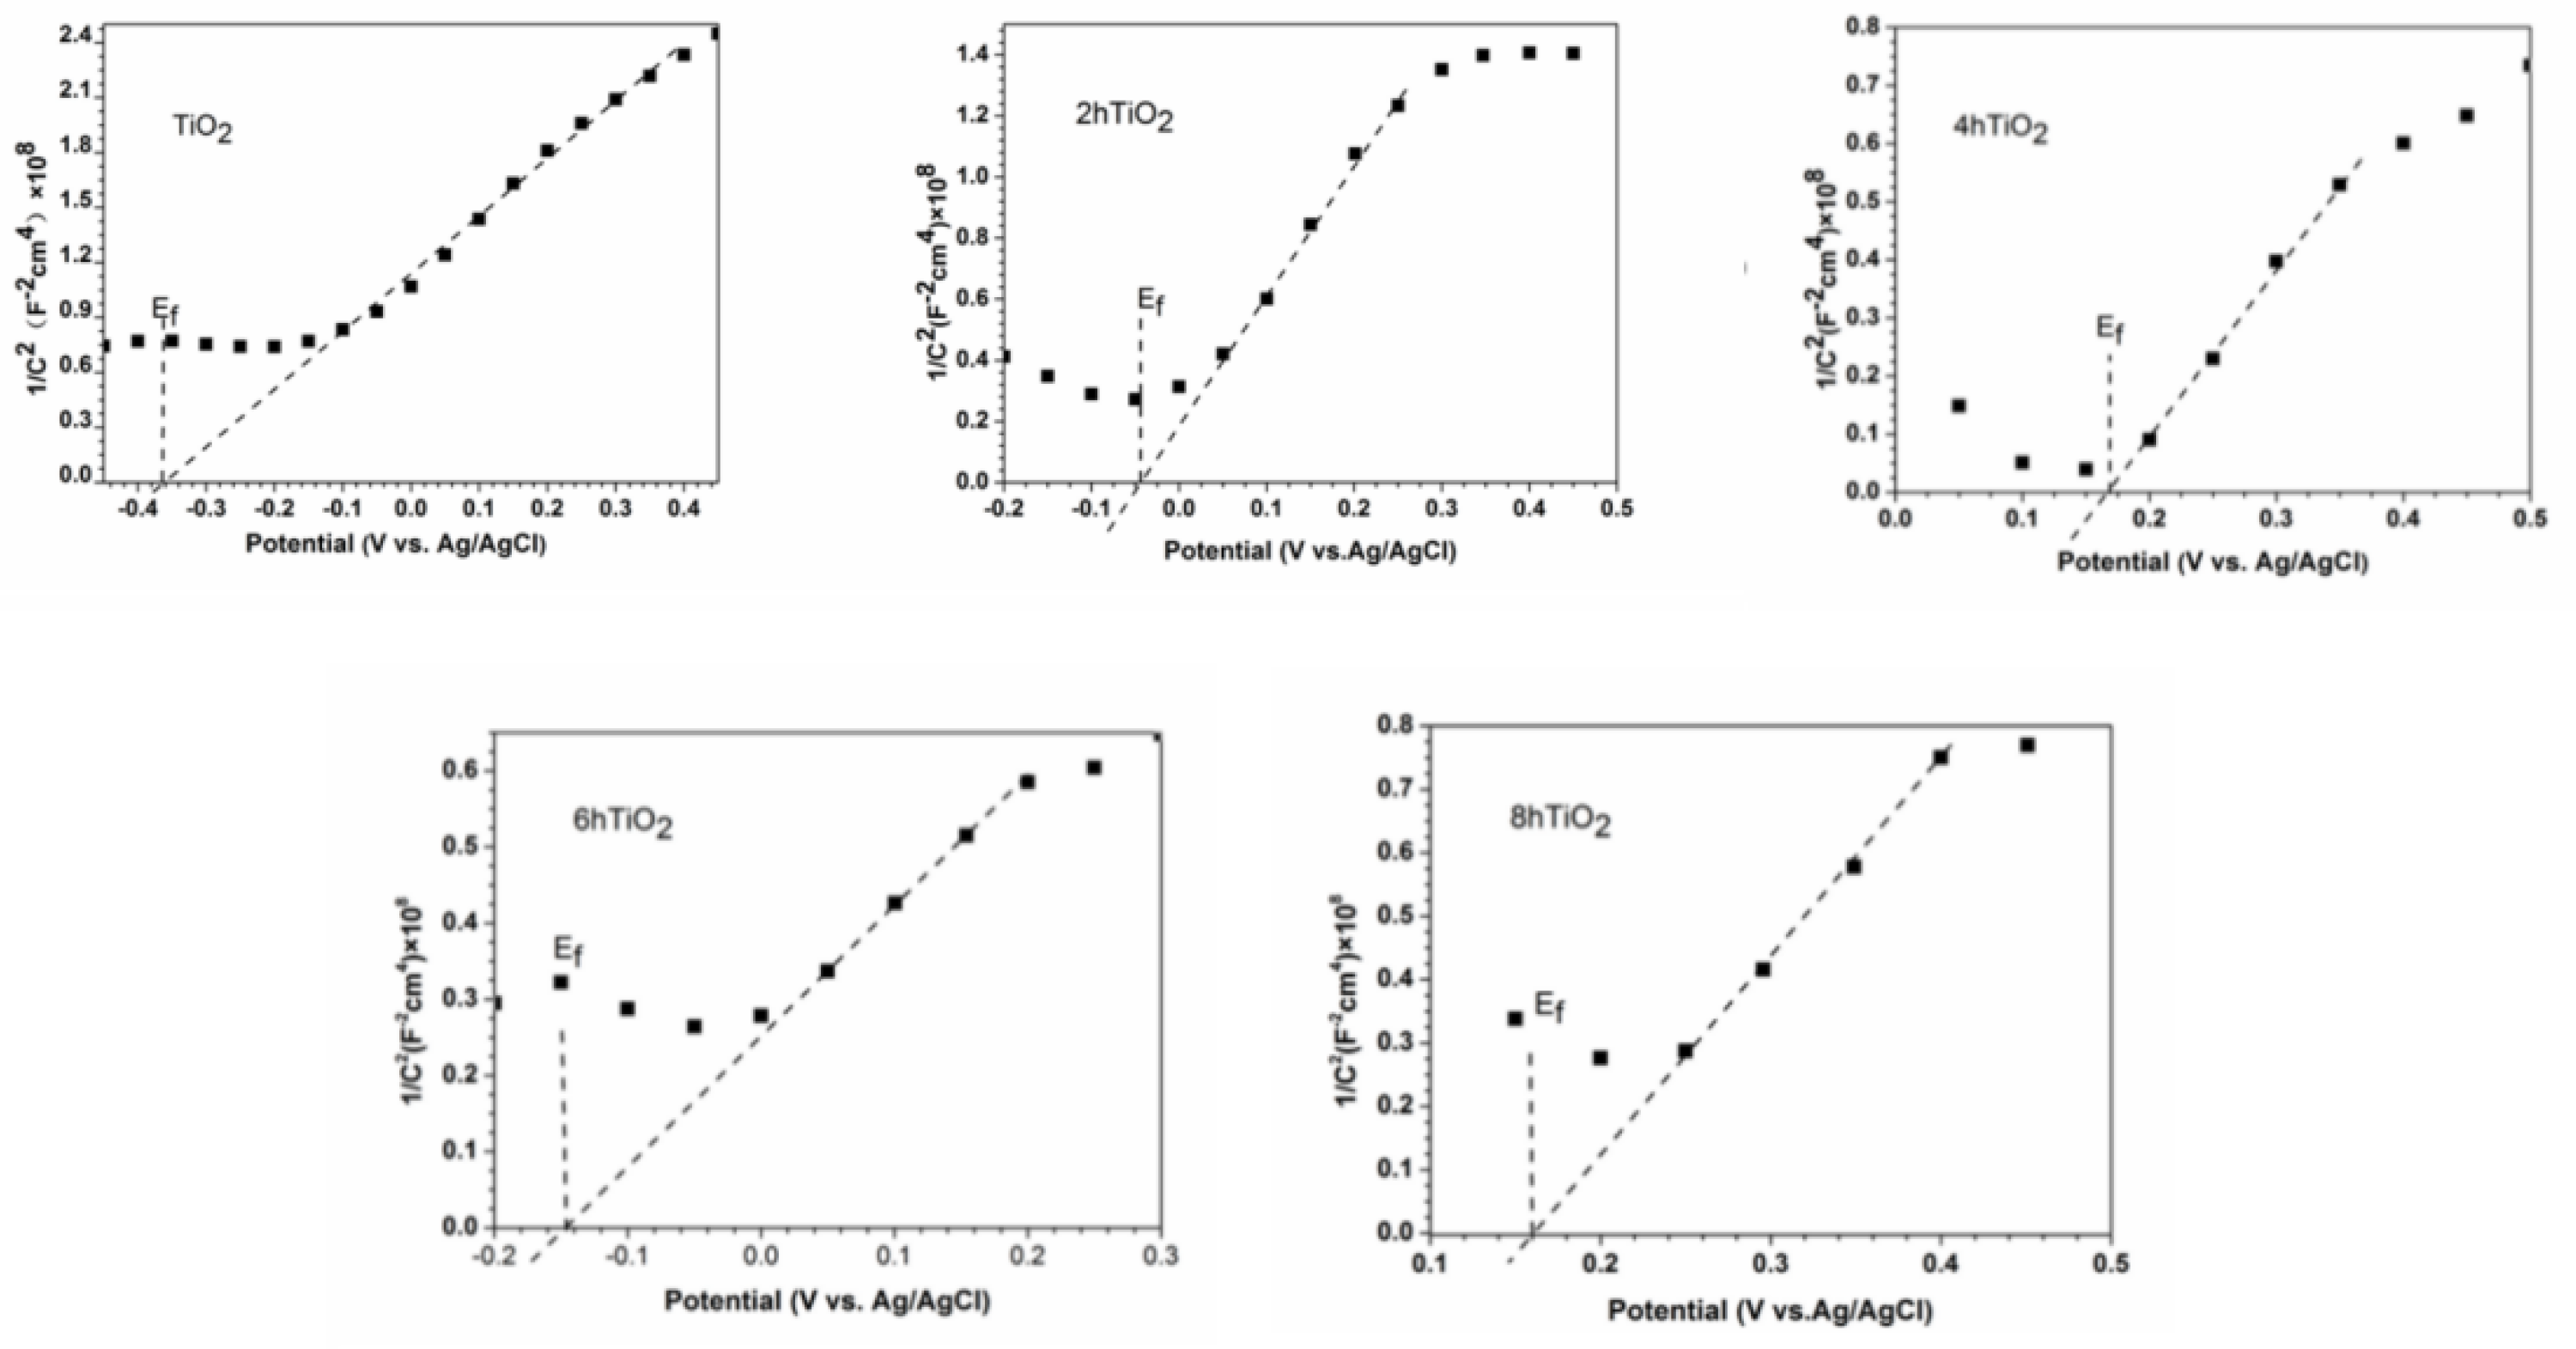
Figure 10.
Schematic Diagram of the Photocurrent Measurement System.
Disclaimer/Publisher’s Note: The statements, opinions and data contained in all publications are solely those of the individual author(s) and contributor(s) and not of MDPI and/or the editor(s). MDPI and/or the editor(s) disclaim responsibility for any injury to people or property resulting from any ideas, methods, instructions or products referred to in the content. |
© 2025 by the authors. Licensee MDPI, Basel, Switzerland. This article is an open access article distributed under the terms and conditions of the Creative Commons Attribution (CC BY) license (http://creativecommons.org/licenses/by/4.0/).
Copyright: This open access article is published under a Creative Commons CC BY 4.0 license, which permit the free download, distribution, and reuse, provided that the author and preprint are cited in any reuse.


