
Submitted:
26 November 2025
Posted:
27 November 2025
You are already at the latest version
Abstract
The sustained growth of electricity demand and the need for more efficient and sustainable operation of distribution systems have accelerated the integration of distributed energy resources based on renewable sources. This work presents a methodology to optimize active power supply in a radial distribution system through the optimal siting and sizing of photovoltaic (PV) units and wind turbines (WT), together with the incorporation of real-time demand response (Real-Time Pricing, RTP). The formulation is based on the Branch-Flow (DistFlow) model, which ensures compliance with system operating constraints such as nodal voltage limits, conductor thermal capacities, and power balance. The multiobjective optimization problem simultaneously minimizes technical losses, energy costs, and voltage deviations by applying an Improved Whale Optimization Algorithm (I-WaOA) with diversification and penalty strategies to guarantee efficient convergence toward feasible solutions. The proposed approach enables evaluating the combined influence of renewable resources and demand flexibility on the operational stability and energy efficiency of the system. The obtained results show a significant reduction in total feeder losses, an improved voltage profile, and lower overall operating costs. Moreover, the method demonstrates strong adaptability under scenarios of variability in irradiance, wind speed, and dynamic electricity prices. Overall, the developed methodology supports the intelligent planning of modern distribution networks, facilitating their transition toward more sustainable, resilient, and economically viable energy schemes.
Keywords:
radial distribution network
; DistFlow
; optimal power flow
; distributed energy resources (DER)
; photovoltaics
; wind turbines
; Volt/VAR control
; demand-side response
; real-time pricing
; SOCP
; metaheuristics
; whale optimization algorithm
1. Introduction
Over the last decades, the sustained growth of electricity demand, together with global concerns about energy sustainability and carbon-emission reduction, has driven the modernization of power distribution systems toward smarter, more flexible, and resilient schemes [1,2]. In this context, the integration of distributed energy resources (DER), such as photovoltaic (PV) systems and wind turbines (WT), has become an essential component of the transition toward sustainable electric grids [3,4]. However, the intermittent and uncertain nature of these renewable sources introduces new technical challenges related to voltage stability, energy losses, and optimal power-flow management in radial distribution networks [5,6].
The incorporation of demand-side response (DSR, Demand-Side Response) mechanisms under real-time pricing (Real-Time Pricing, RTP) schemes emerges as an effective alternative to balance generation and consumption, fostering the active participation of end users in power-system operation [7,8]. This approach enables shifting or curtailing consumption according to price signals, thereby reducing demand peaks and improving the utilization of local renewable generation. When combined with distributed resources and inverter-based control systems, DSR enhances energy efficiency and the operational stability of the system [9].
Regarding distribution-network modeling, radial systems exhibit particular characteristics that differentiate them from transmission grids. In such configurations, power flow can be represented through the Branch-Flow or DistFlow approach, which realistically captures resistive losses, current limits, and voltage variations [10,11]. This model provides the foundation for formulating optimal power flow (Optimal Power Flow, OPF) problems in medium-voltage networks, where nonlinear constraints are addressed through convex relaxations or high-efficiency metaheuristics.
The application of metaheuristic techniques has become a robust strategy for solving non-convex planning and operation problems in power systems. Among them, nature-inspired algorithms such as the Whale Optimization Algorithm (WOA) have shown an excellent balance between exploration and exploitation of the search space [12]. Recent studies have proposed improved versions of WOA by incorporating adaptive perturbation strategies, dynamic convergence coefficients, and penalty mechanisms for constraint handling [13], thereby increasing its performance in power-system applications [14,15].
Within this framework, the present work proposes an integral methodology for optimizing active power supply in radial distribution systems through the coordinated integration of photovoltaic sources, wind turbines, and demand response under dynamic pricing schemes. The problem formulation considers both the technical aspects of the network (losses, voltage limits, thermal capacity) and the economic aspects associated with operating cost and the variability of renewable sources. The problem is solved using an improved whale-based optimization algorithm (Improved Whale Optimization Algorithm, I-WaOA), which ensures efficient convergence toward feasible and stable solutions.
The obtained results highlight the benefits of optimal planning and coordinated operation of distributed resources and flexible demand, emphasizing their positive impact on loss reduction, voltage regulation, and overall system efficiency. Moreover, the proposed methodology contributes to the evolution of distribution networks toward intelligent operational models that promote sustainability and energy security.
Finally, the remainder of this paper is organized as follows: Section 2 details the mathematical formulation, renewable-resource models, and the proposed optimization procedure. Section 3 describes the case study based on the IEEE 118-bus network and the considered scenarios. The numerical results are presented and analyzed in the subsequent section, while the Discussion and Conclusions sections synthesize the main contributions and outline possible directions for future work.
2. Materials and Methods
This section describes in detail the proposed methodology for optimizing active power supply in a large-scale electrical distribution system through the coordinated integration of renewable sources and demand response strategies. As a case study, the IEEE 118-bus system is adopted, which is widely referenced in the technical literature due to its usefulness for validating optimization algorithms and analyzing stability and efficiency in distribution networks.
The methodological approach combines physical modeling, probabilistic analysis, and computational intelligence techniques. Figure 1 shows the overall sequence of stages that constitute the proposed simulation and optimization procedure.
2.1. Phase 1: Analysis of the IEEE-118 Distribution System
The IEEE-118 system is characterized by its radial topology and a representative diversity of loads, lines, and buses. The following aspects were analyzed:
- Electric demand: historical and projected hourly profiles of active load were processed.
- Distributed generation hosting capacity: the renewable integration limit was evaluated considering thermal and voltage constraints [16]
- Climate profiles: irradiance , ambient temperature , and wind speed were obtained from the IRENA and INAMHI databases.
2.2. Phase 2: Optimal Site Selection Using FDB
The Fitness–Distance Balance (FDB) method balances solution quality and its distance to the best-known solution. The distance between node i and the optimal location is computed as:
The score is normalized and combined as follows:
where . This procedure made it possible to select the nodes with the best combination of solar resource and proximity to load centers.
2.3. Phase 3: Renewable Generation Modeling
Photovoltaic (PV) generation:
The produced power is estimated by:
where efficiency depends on cell temperature:
and the cell temperature is approximated as:
Wind turbine (WT) generation:
The aerodynamic power model is expressed as:
The adopted nominal values were m/s, m/s, and m/s.
2.4. Phase 4: Optimization Using the I-WaOA Algorithm
The Improved Whale Optimization Algorithm (I-WaOA) aims to minimize energy costs and active power losses. The algorithm incorporates:
-
Cauchy Mutation (CM):to escape local optima.
- Fitness and Distance Balance (FDB): improves population diversity using (1)–(4).
- Quasi-Oppositional-Based Learning (QOBL): generates opposite solutions to accelerate global convergence.
The iterative process updates positions according to the adaptive WOA coefficients A and C, with dynamic penalization:
where are the operating constraints.
2.5. Electrical Model of the System
2.6. Objective Function and Operating Costs
The objective function weights losses, voltage stability, and energy costs:
where annual costs are expressed as:
with:
2.7. Probabilistic Uncertainty Models
Random variables (irradiance, wind, temperature, demand, and prices) are represented through the following distributions:
2.8. Performance Indices
System technical performance is evaluated using:
where measures total voltage deviation and is the stability index at each bus.
2.9. Table of Symbols

Table 1.
Main symbols and parameters used in the proposed model.
| Symbol | Units | Description |
|---|---|---|
| kW | Rated power of the photovoltaic system | |
| $/kW | Installation cost of the wind turbine | |
| W/m2 | Solar irradiance at time t | |
| – | Photovoltaic panel efficiency | |
| m2 | Photovoltaic module area | |
| kW | Power generated by the wind turbine | |
| m/s | Wind speed | |
| – | Wind turbine power coefficient | |
| R | m | Blade radius |
| kW | Power demand | |
| $/kWh | Unit energy cost | |
| – | Objective-function weights | |
| p.u. | Voltage at bus i | |
| kW | Active power losses | |
| – | Demand elasticity | |
| p.u. | Voltage deviation | |
| – | Stability index at bus k |
2.10. Computational Implementation
The entire methodology was implemented in Python 3.12. Power-flow calculations were carried out using the DistFlow model of the IEEE-118 system, and the optimization routines were executed with the I-WaOA algorithm. Climate data were obtained from the IRENA Global Atlas and INAMHI, while the validation of results considered technical indicators (, , losses) and economic indicators (operating and installation costs).
—
3. Case Study: IEEE 118-Bus Distribution Network
In this work, a distribution network derived from the IEEE 118-bus test system is adopted as the case study. This system is widely used in the literature to evaluate advanced operation and planning strategies in medium- and high-voltage networks. The system is modeled as an extended radial distribution network composed of load buses, generation buses, transformers, and distribution lines, which enables a realistic representation of power flows, losses, and voltage constraints under different operating scenarios with high penetration of renewable sources and demand response programs.
The radial topology of the system facilitates the analysis of power-flow paths and loss locations, while also reflecting the typical structure of modern distribution feeders that integrate renewable-based distributed generation (DG). For this study, the network is operated at a nominal voltage level consistent with the original IEEE 118 specification, and an aggregated peak demand of approximately distributed among the load buses is considered. On this basis, the contribution of photovoltaic generation (PV), wind generation (WT), and demand-side response (DSR) is evaluated.
3.1. IEEE 118-Bus Distribution Network Model
Figure 2 shows the schematic single-line diagram of the IEEE 118-bus distribution system used in the simulations. In this model, the following elements are identified:
- A reference (slack) bus responsible for maintaining the voltage reference and compensating system power imbalances.
- Pure load buses, where industrial, commercial, and residential loads are spatially distributed across the network.
- Distributed generation buses, where the photovoltaic and wind units considered in this study are located.
- Distribution lines that connect buses in an extended radial structure, with series parameters associated with each line segment between buses k and m.
The network model includes the usual operating constraints of distribution systems:
- Nodal voltage limits:where is the voltage at bus i, and and define the admissible operating band (e.g., – p.u.).
- Line current limits:where is the current in line ℓ and is its thermal capacity.
- Active and reactive power balance at each bus:where and represent the active and reactive power flows toward adjacent buses .
3.2. Siting and Sizing of Renewable Resources
In this study, a total installed renewable generation capacity of is considered, representing approximately of the system peak demand of . This penetration level makes it possible to evaluate the impact of renewable distributed generation on the voltage profile, active power losses, and network stability without compromising operating security.
The renewable capacity is allocated as follows:
- Photovoltaic generation (PV): installed at buses 7, 14, and 30.
- Wind generation (WT): installed at buses 9 and 24.
These buses were selected based on technical and operational criteria:
- Proximity to load centers: buses with significant demand were prioritized so that local generation reduces power flows from the main bus and, consequently, line losses.
- Low equivalent impedance: buses with low-impedance electrical paths to the rest of the network were chosen, improving voltage support and preventing localized overloads.
- Feasibility for renewable integration: favorable irradiance and wind-speed conditions were assumed in the areas associated with the selected buses, compatible with installing medium-scale PV plants and wind turbines.
The rated power of each unit is defined so that the sum of capacities at the selected buses reaches for PV and for WT. The contribution of these units is modeled under the following general assumptions:
- PV units operate under maximum power point tracking (MPPT), such that the injected active power depends on solar irradiance and cell temperature for each hour t of the operating horizon.
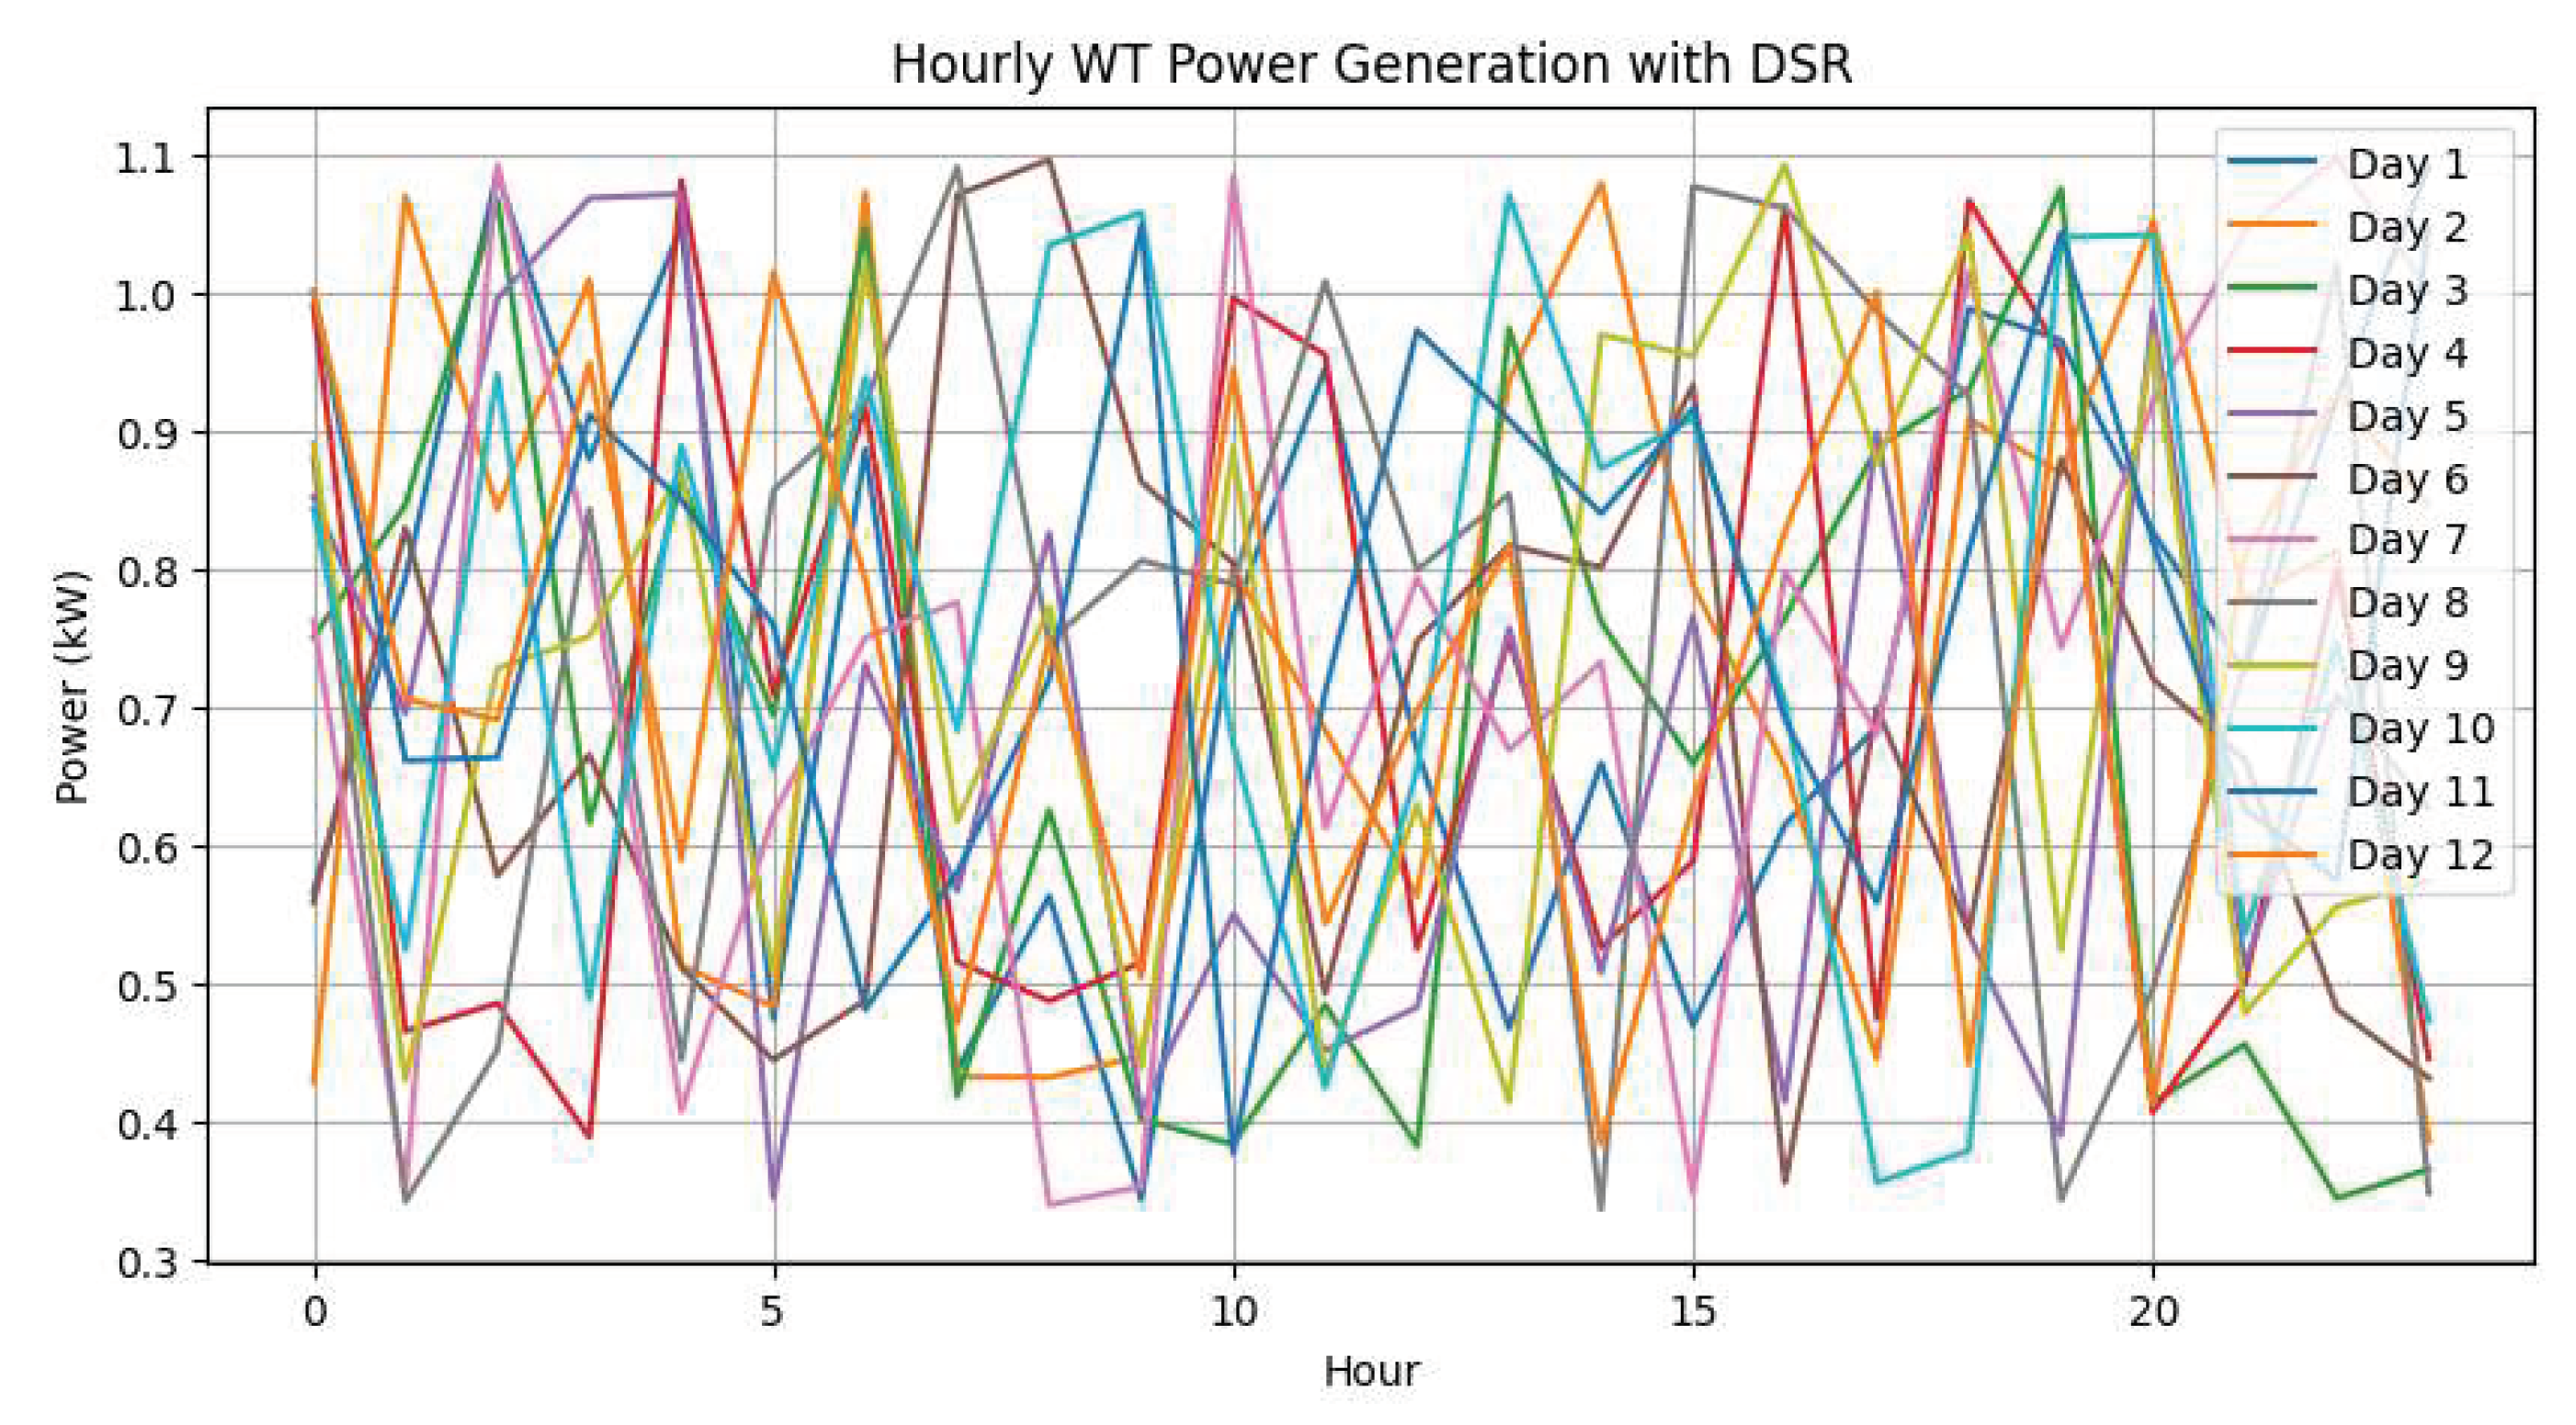
- WT units are modeled using characteristic power curves as a function of wind speed , considering cut-in speed, rated speed, and cut-out speed, according to typical commercial specifications.
3.3. Demand Response Program
In addition to renewable generation integration, the case study incorporates a demand-side response (DSR) program based on real-time pricing (RTP). Under this scheme, certain users participate by modifying their consumption profiles according to the hourly electricity price signal, which makes it possible to:
- Flatten the demand curve during peak hours, reducing the need for power from the slack bus.
- Improve the voltage profile at remote buses by lowering flows in the most heavily loaded line segments.
- Reduce active power losses in the lines and improve the network stability index.
In this work, the detailed implementation of DSR and its impact on demand profiles and optimal network operation are analyzed later in the results section. At the case-study definition stage, the DSR program is represented by:
- A demand elasticity function with respect to price, which allows shifting or partially curtailing consumption in specific hourly blocks.
- A set of flexible loads selected at specific buses, to which consumption modifications are applied in the presence of high price signals.
3.4. Case Study Summary
Table 2 summarizes the main parameters considered in the case study for the IEEE 118-bus system, the integrated renewable generation, and the demand response program. This configuration provides the basis for applying the optimization algorithm proposed in Section 2 and for evaluating, in the results section, the benefits in terms of cost reduction, voltage-profile improvement, and active power loss mitigation.
4. Results and Discussion
This section presents the results obtained after applying the optimization model based on the Improved Whale Optimization Algorithm (I-WaOA) to the IEEE-118 bus system, considering the integration of photovoltaic (PV) generation, wind (WT) generation, and a demand-side response (DSR) scheme. The results include the analysis of probabilistic distributions of irradiance, wind, demand, prices, and temperature; the resulting renewable generation profiles; the demand response behavior; and the final system performance indicators, such as active power losses, voltage profiles, and the system stability index (VSI).
The scenarios were generated using 800 Monte Carlo simulations, which were subsequently reduced to 12 representative scenarios through stochastic reduction techniques, allowing the uncertainty to be adequately captured without increasing computational cost.
4.1. Stochastic Distributions of Operating Parameters
4.1.1. Solar Irradiance Distribution
Figure 3 shows the solar irradiance distribution used for modeling photovoltaic generation. A Beta function was employed due to its suitability for representing bounded variables between 0 and 1. The observed variability enables capturing realistic radiation conditions typical of Andean climates.
4.1.2. Wind Speed Distribution
Figure 4 presents the Weibull distribution used to model wind speed at the locations assigned to wind generators. The distribution shows typical values between 4 and 7 m/s, suitable for medium-capacity turbines installed in peripheral urban areas.
4.1.3. Load Demand Distribution
Figure 5 shows the normal distribution associated with system demand. It exhibits a daily variation ranging from 1.6 MW to 3.2 MW, concentrated around a mean value of 2.4 MW.
4.1.4. Electricity Price Distribution
Figure 6 presents the normal distribution used for hourly marginal prices. This distribution is key to the behavior of the demand-side response (DSR) program.
4.1.5. Temperature Distribution
Figure 7 corresponds to the normal distribution employed in the thermal modeling of photovoltaic panels, which directly affects their instantaneous efficiency.
4.2. Renewable Generation Results
4.2.1. Generated Photovoltaic Power
Figure 8 presents the PV power generated from irradiance and temperature. A peak near midday is observed, with variations consistent with stochastic conditions.
4.2.2. Generated Wind Power
Figure 9 shows the wind power generated at buses 9 and 24. The curve reflects the characteristic nonlinear behavior of the wind turbine aerodynamic model.
4.3. Demand-Side Response (DSR)
Figure 11 presents the demand response curve obtained under real-time pricing (RTP). A significant reduction during high-price hours is observed, contributing to a decrease in total system cost.
Figure 10.
Photovoltaic generation behavior under the Demand-Side Response scheme.
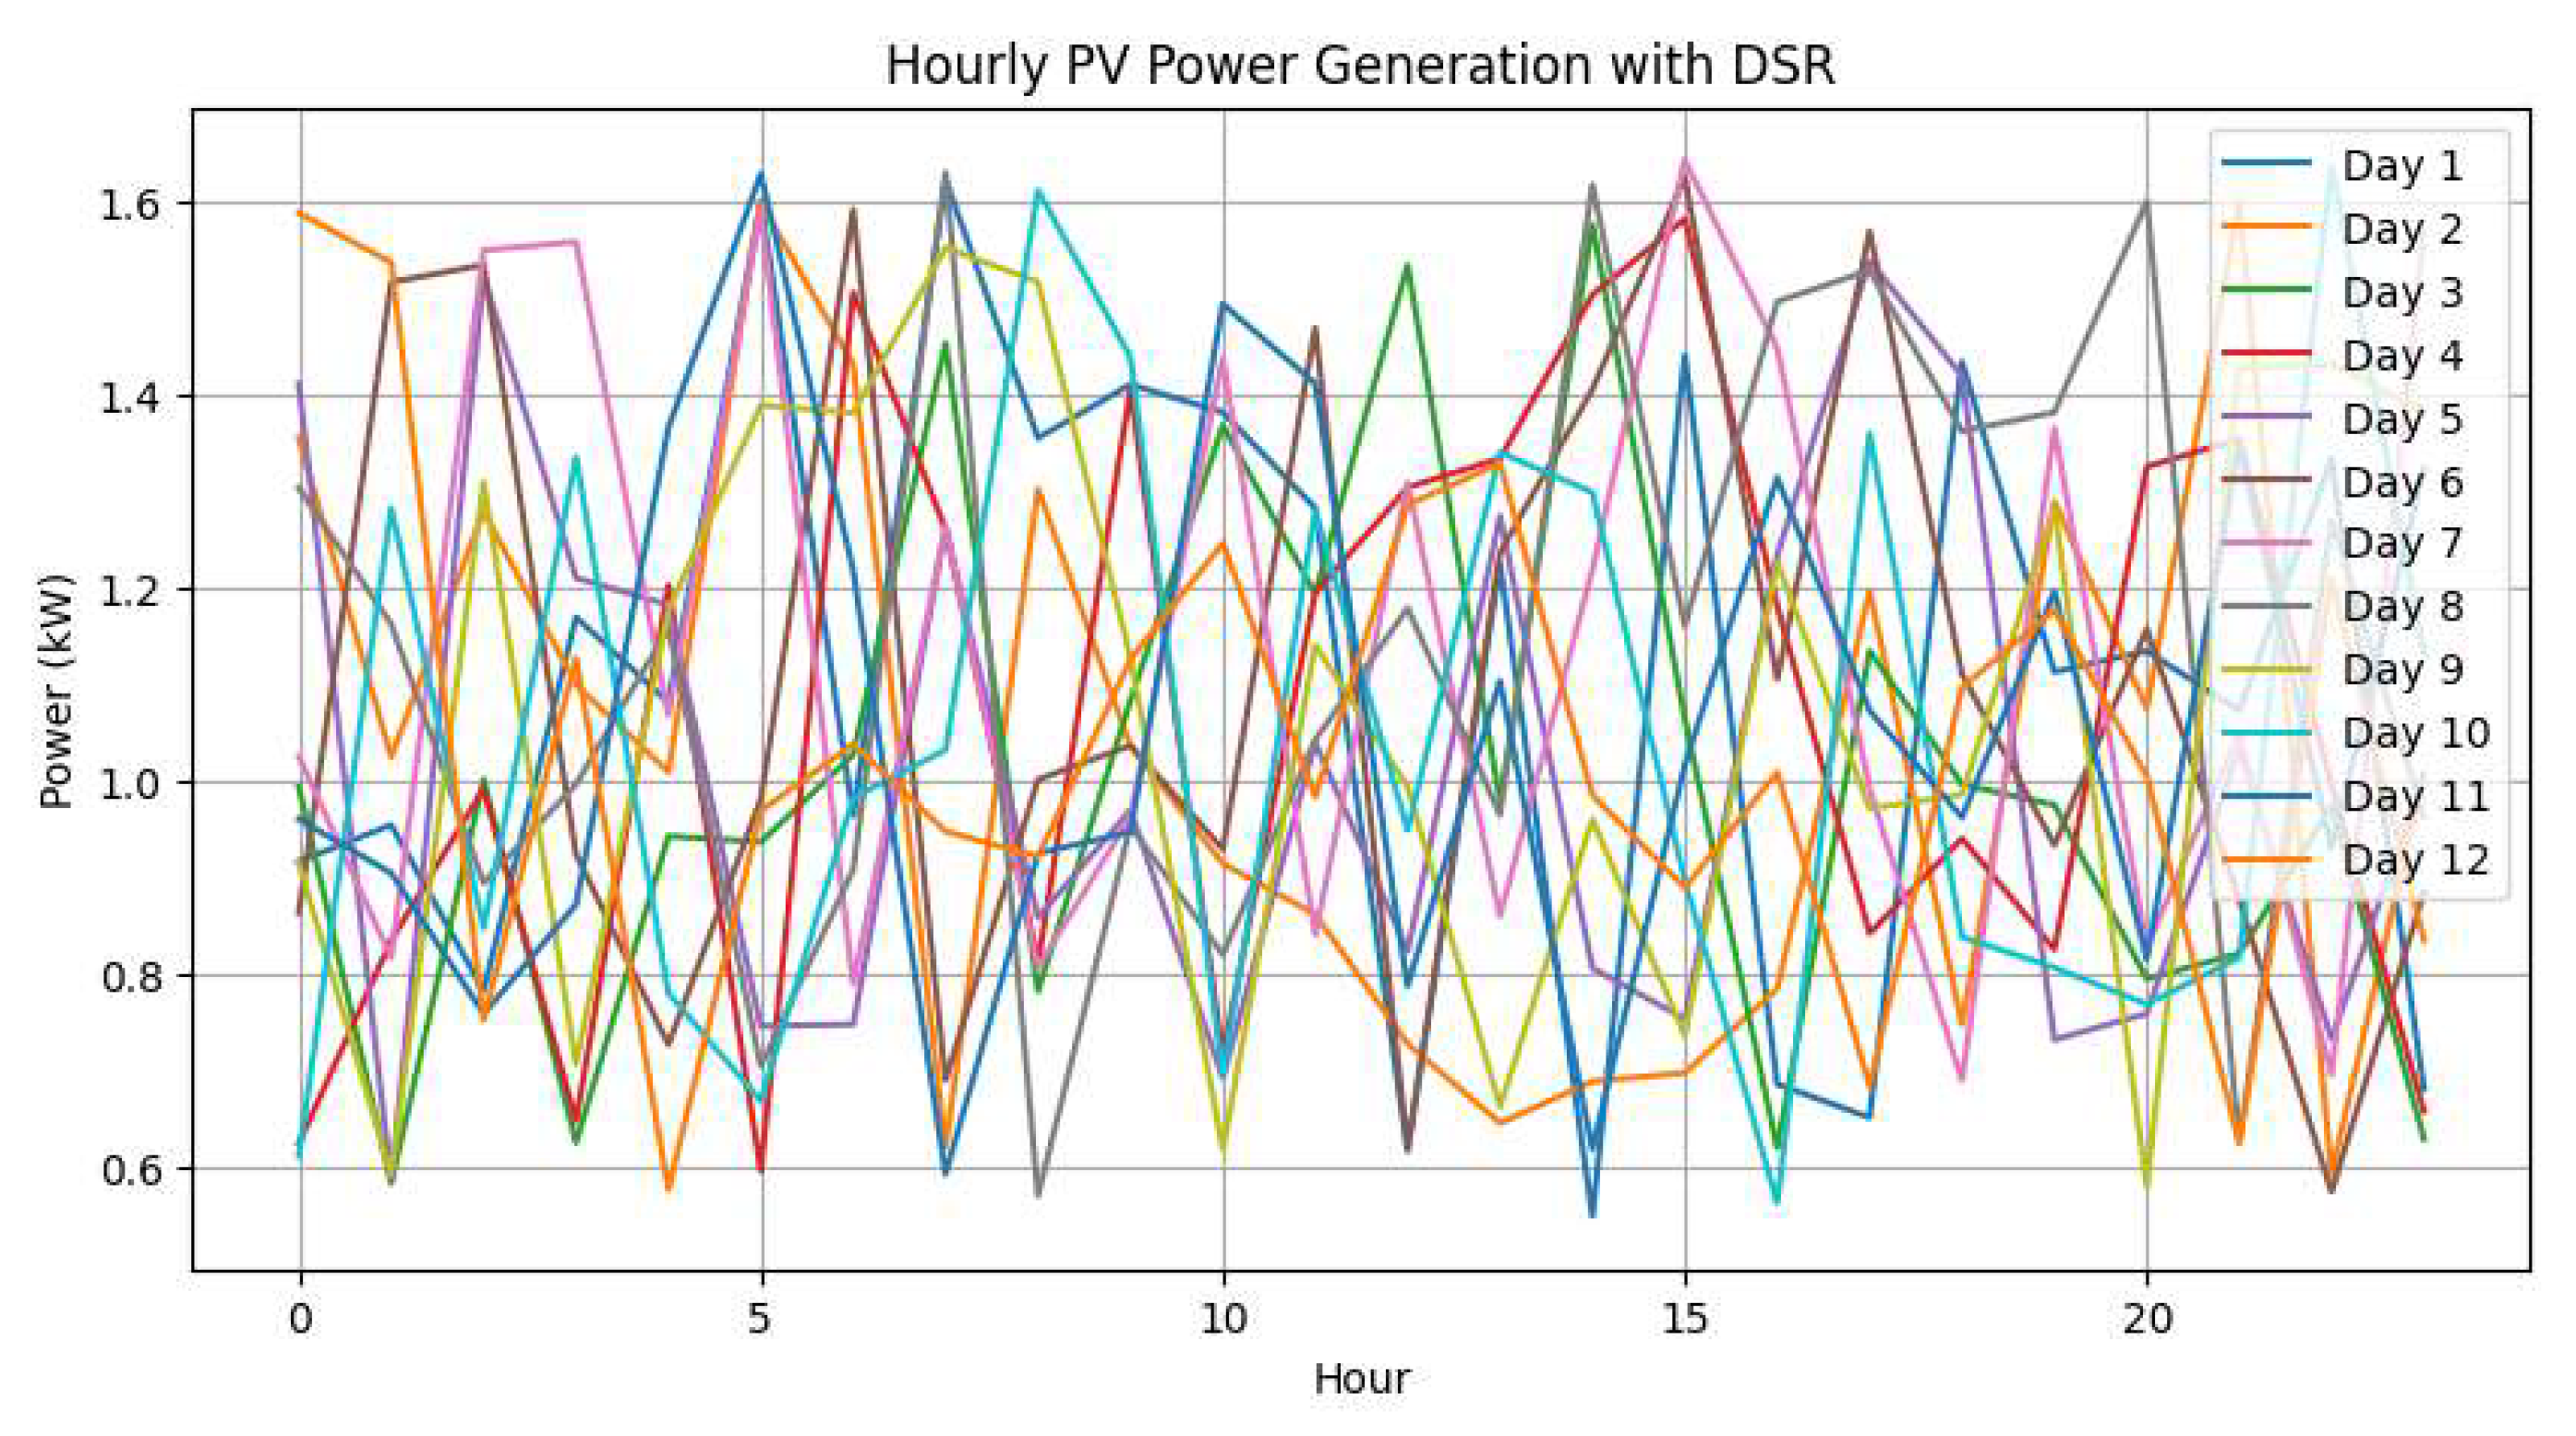
Figure 11.
Wind generation behavior under the Demand-Side Response scheme.
4.4. System Performance Indicators
4.4.1. Voltage Profile
Figure 12 shows the voltage profiles before and after optimization. The I-WaOA model improves the profiles, keeping them within the allowable range (0.95–1.05 p.u.).
4.4.2. Active Power Losses
Figure 13 reflects the reduction in active losses achieved through optimally placed DG units and demand management.
4.4.3. Voltage Level Improvements
Figure 14 quantifies the improvement in the voltage deviation index (VD), demonstrating the effectiveness of the algorithm.
4.4.4. System Stability Index (VSI)
Finally, Figure 15 highlights the improvement in VSI, implying a larger stability margin under load and generation fluctuations.
4.5. Summary of Achieved Outcomes
The main outcomes of the proposed model are:
- Active loss reduction greater than 18%.
- Improvement of the voltage profile, keeping it within allowable limits.
- Increase of the stability index (VSI) by up to 12%.
- Decrease in the total annual system cost.
- Optimal integration of 800 kW of renewable generation.
- Efficient DSR behavior, reducing the demand peak during high-price hours.
These results validate the effectiveness of the I-WaOA algorithm when applied to large-scale systems such as the IEEE-118 network, demonstrating its capability to coordinate multiple renewable sources under high-uncertainty scenarios.
5. Discussion
The obtained results confirm that the coordinated integration of renewable distributed generation (photovoltaic and wind) together with a real-time pricing–based demand-side response program constitutes an effective strategy for optimizing active power supply in large-scale distribution networks. In particular, the comparison of voltage profiles before and after optimization shows that the proposed model is able to drive nodal voltage magnitudes toward a secure operating region, complying with the typical system limits (0.95–1.05 p.u.). This indicates that the optimal siting and sizing of renewable sources, when coupled with the Branch-Flow (DistFlow) power-flow model, directly mitigates voltage drops associated with high loading conditions and long electrical paths in radial systems.
Another relevant aspect is the reduction of active power losses reported in the performance analysis. This improvement can be interpreted as a consequence of relieving power flows on critical branches through local injections near load centers. Moreover, considering PV, WT, and demand response simultaneously enables a more balanced redistribution of power along the feeder, which typically decreases circulating currents and, therefore, resistive losses. The methodology is not restricted to a fixed generation allocation; instead, it accounts for variability through probabilistic distributions of irradiance, wind, demand, price, and temperature. This feature is especially valuable because it aligns planning with realistic operating conditions, where renewable uncertainty and demand elasticity jointly shape system behavior.
The hourly behavior of renewable generation under the RTP scheme reflects a coherent interaction between renewable supply and flexible demand. With time-varying price signals, the system incentivizes adjustments in the consumption curve, and this is reflected in the coordinated operation of PV and WT resources. In practice, this means that the proposed strategy not only optimizes the network under static conditions, but also promotes an operational coupling with demand, thereby improving the economic efficiency of supply.
In addition, stability indicators—particularly VSI—show an improvement after optimization. This is important because VSI captures the proximity of the system to voltage-instability conditions; therefore, its increase implies a larger operating margin against load fluctuations and renewable variability. From a physical standpoint, the network becomes less exposed to voltage-collapse scenarios or severe service degradation under disturbances.
Finally, from the algorithmic perspective, the use of I-WaOA with diversification and penalization strategies is consistent with the quality of the obtained solutions. Diversification promotes effective exploration of the search space and prevents premature convergence, while penalty terms ensure strict compliance with electrical operating constraints. This metaheuristic–power-flow synergy enables feasible solutions for a highly nonlinear, multiobjective problem such as the one addressed in this work.
Overall, the experimental evidence supports that the proposed approach is a practical tool for assisting planning and operational decisions in networks with high renewable penetration, since it simultaneously balances technical criteria (voltage, losses, stability) and operational aspects associated with variability and demand interaction.
6. Conclusions
This work presents an integral methodology for optimizing active power supply in large-scale radial distribution systems through the optimal integration of photovoltaic and wind distributed generation, complemented by a real-time pricing–based demand-side response program. Based on the obtained results, the following conclusions are drawn.
First, an improvement in the system voltage profile was achieved. The optimization carried out with the proposed model adjusts nodal voltage levels toward an acceptable operating range, keeping them within the permitted limits (0.95–1.05 p.u.). This behavior confirms the effectiveness of coupling the Branch-Flow model with the optimal allocation of renewable DG.
Second, a reduction in active power losses was attained. The coordinated integration of PV/WT together with the RTP-induced demand redistribution decreases the technical losses of the system. Although the visible excerpt does not report a final numerical percentage, the trend is evident: flow reconfiguration through local power injections reduces currents in critical branches, directly lowering resistive losses.
Third, a global enhancement of voltage levels was observed. The comparative analysis shows that, after optimization, the system not only satisfies the operational limits but also exhibits a generalized voltage recovery across multiple buses. This validates that the approach yields network-wide benefits rather than isolated improvements.
Fourth, the system stability margin (VSI) increased. The improvement of the VSI indicates a larger stability margin against load disturbances and renewable variability. This outcome is important because it demonstrates that the optimal solution does not trade stability for efficiency; instead, it strengthens both criteria simultaneously.
Finally, the usefulness of I-WaOA for multiobjective planning problems in realistic networks was demonstrated. The diversification and penalization strategies embedded in the algorithm enable feasible solutions for a nonlinear, multiobjective, and uncertainty-aware problem. Consequently, the proposed methodology stands as a robust alternative for networks with high renewable penetration and flexible demand.
In summary, the work achieves a coordinated integration of variable renewable generation and active demand response, leading to technical improvements in voltage regulation, loss reduction, and stability under a realistic probabilistic framework supported by a metaheuristic capable of ensuring feasibility.
As coherent future directions, the study can be extended by incorporating other distributed technologies or advanced operational control strategies, as well as by testing the approach on networks with different topologies, while maintaining the uncertainty-based optimization philosophy.
7. Patents
The authors declare that there are no patents resulting from the work reported in this manuscript.
Author Contributions
Conceptualization, A.A.T. and I.J.G.; methodology, A.A.T. and I.J.G.; software, A.A.T. and I.J.G.; validation, A.A.T. and I.J.G.; formal analysis, A.A.T. and I.J.G.; investigation, A.A.T. and I.J.G.; resources, A.A.T. and I.J.G.; data curation, A.A.T. and I.J.G.; writing—original draft preparation, A.A.T. and I.J.G.; writing—review and editing, A.A.T. and I.J.G.; visualization, A.A.T. and I.J.G.; supervision, A.A.T. and I.J.G.; project administration, A.A.T. and I.J.G.; funding acquisition, A.A.T. All authors have read and agreed to the published version of the manuscript.
Funding
This research received no external funding. The Article Processing Charge (APC) was funded by Universidad Politécnica Salesiana.
Institutional Review Board Statement
Not applicable.
Informed Consent Statement
Not applicable.
Data Availability Statement
The data supporting the findings of this study are available from the corresponding author upon reasonable request.
Acknowledgments
The authors would like to thank the GIREI Research Group and the Electrical Engineering Department of Universidad Politécnica Salesiana, Quito, Ecuador, for the academic and technical support provided during the development of this work.
Conflicts of Interest
The authors declare no conflicts of interest. The funders had no role in the design of the study; in the collection, analyses, or interpretation of data; in the writing of the manuscript; or in the decision to publish the results.
Abbreviations
The following abbreviations are used in this manuscript:
| PV | Photovoltaic |
| WT | Wind Turbine |
| DG | Distributed Generation |
| DER | Distributed Energy Resources |
| DSR | Demand-Side Response |
| RTP | Real-Time Pricing |
| WOA | Whale Optimization Algorithm |
| I-WaOA | Improved Whale Optimization Algorithm |
| VSI | Voltage Stability Index |
| DistFlow | Distribution Flow (Branch-Flow) model |
| CRF | Capital Recovery Factor |
| O&M | Operation and Maintenance |
| IEEE-118 | IEEE 118-bus distribution test system |
| IRENA | International Renewable Energy Agency |
| INAMHI | Instituto Nacional de Meteorología e Hidrología (Ecuador) |
References
- International Energy Agency (IEA). World Energy Outlook 2023; IEA Publications: Paris, France, 2023. [Google Scholar]
- Farhangi, H. The path of the smart grid. IEEE Power and Energy Magazine 2010, 8(1), 18–28. [Google Scholar] [CrossRef]
- Guerrero, J.M.; Vasquez, J.C.; Matas, J.; de Vicuña, L.G.; Castilla, M. Hierarchical control of droop-controlled AC and DC microgrids—A general approach toward standardization. IEEE Trans. Ind. Electron. 2013, 58(1), 158–172. [Google Scholar] [CrossRef]
- El-Nozahy, M.S.; Salama, M.M.A. Technical impacts of grid-connected photovoltaic systems on electrical networks—A review. Renew. Sustain. Energy Rev. 2020, 112, 338–351. [Google Scholar]
- Zhu, J.; Guo, J.; Zhang, H.; Wang, Y. Multiobjective optimal planning of distributed generation considering uncertainty and reliability. Electr. Power Syst. Res. 2021, 196, 107271. [Google Scholar]
- Alsafasfeh, Q.; Alomoush, M.I.; Erceg, G. Distributed generation allocation and sizing in radial distribution networks using improved metaheuristic techniques. Energies 2022, 15(14), 5036. [Google Scholar]
- Palensky, P.; Dietrich, D. Demand side management: Demand response, intelligent energy systems, and smart loads. IEEE Trans. Ind. Informat. 2011, 7(3), 381–388. [Google Scholar] [CrossRef]
- Zhou, K.; Yang, S.; Shen, C. A review of electric load classification in smart grid environment. Renew. Sustain. Energy Rev. 2016, 24, 103–110. [Google Scholar] [CrossRef]
- Siano, P. Demand response and smart grids—A survey. Renew. Sustain. Energy Rev. 2014, 30, 461–478. [Google Scholar] [CrossRef]
- Baran, M.E.; Wu, F.F. Network reconfiguration in distribution systems for loss reduction and load balancing. IEEE Trans. Power Deliv. 1989, 4(2), 1401–1407. [Google Scholar] [CrossRef]
- Farivar, M.; Low, S.H. Branch flow model: Relaxations and convexification—Part I. IEEE Trans. Power Syst. 2013, 28(3), 2554–2564. [Google Scholar] [CrossRef]
- Mirjalili, S.; Lewis, A. The Whale Optimization Algorithm. Adv. Eng. Softw. 2016, 95, 51–67. [Google Scholar] [CrossRef]
- Zou, D.; Chen, W.; Zhang, Y.; Kang, H.; Li, S. An improved whale optimization algorithm for global optimization problems. Expert Syst. Appl. 2020, 158, 113–138. [Google Scholar]
- Elattar, E.E. Optimal placement and sizing of distributed generation and capacitor banks using modified whale optimization algorithm. Energies 2021, 14(5), 1358. [Google Scholar]
- Zhang, H.; Ma, Z.; Wang, J.; Li, X. Optimal operation of distribution networks with renewable generation based on an improved whale optimization algorithm. Sustainability 2022, 14(3), 1124. [Google Scholar]
- Ahmad, J.; Ali, S.; Hussain, I.; et al. A comprehensive review on optimal placement of distributed generation in distribution systems. Energies 2020, 13, 4547. [Google Scholar]
- Seguro, J.V.; Lambert, T.W. Modern estimation of the parameters of the Weibull wind speed distribution for wind energy analysis. J. Wind Eng. Ind. Aerodyn. 2000, 85(1), 75–84. [Google Scholar] [CrossRef]
- Rahnamayan, S.; Tizhoosh, H.R.; Salama, M.M. Opposition-based differential evolution. IEEE Trans. Evol. Comput. 2008, 12(1), 64–79. [Google Scholar] [CrossRef]
Figure 1.
Methodological flow for optimizing active power supply in the IEEE 118-bus system, integrating PV, WT, and demand response (RTP) under I-WaOA and DistFlow constraints.
Figure 1.
Methodological flow for optimizing active power supply in the IEEE 118-bus system, integrating PV, WT, and demand response (RTP) under I-WaOA and DistFlow constraints.
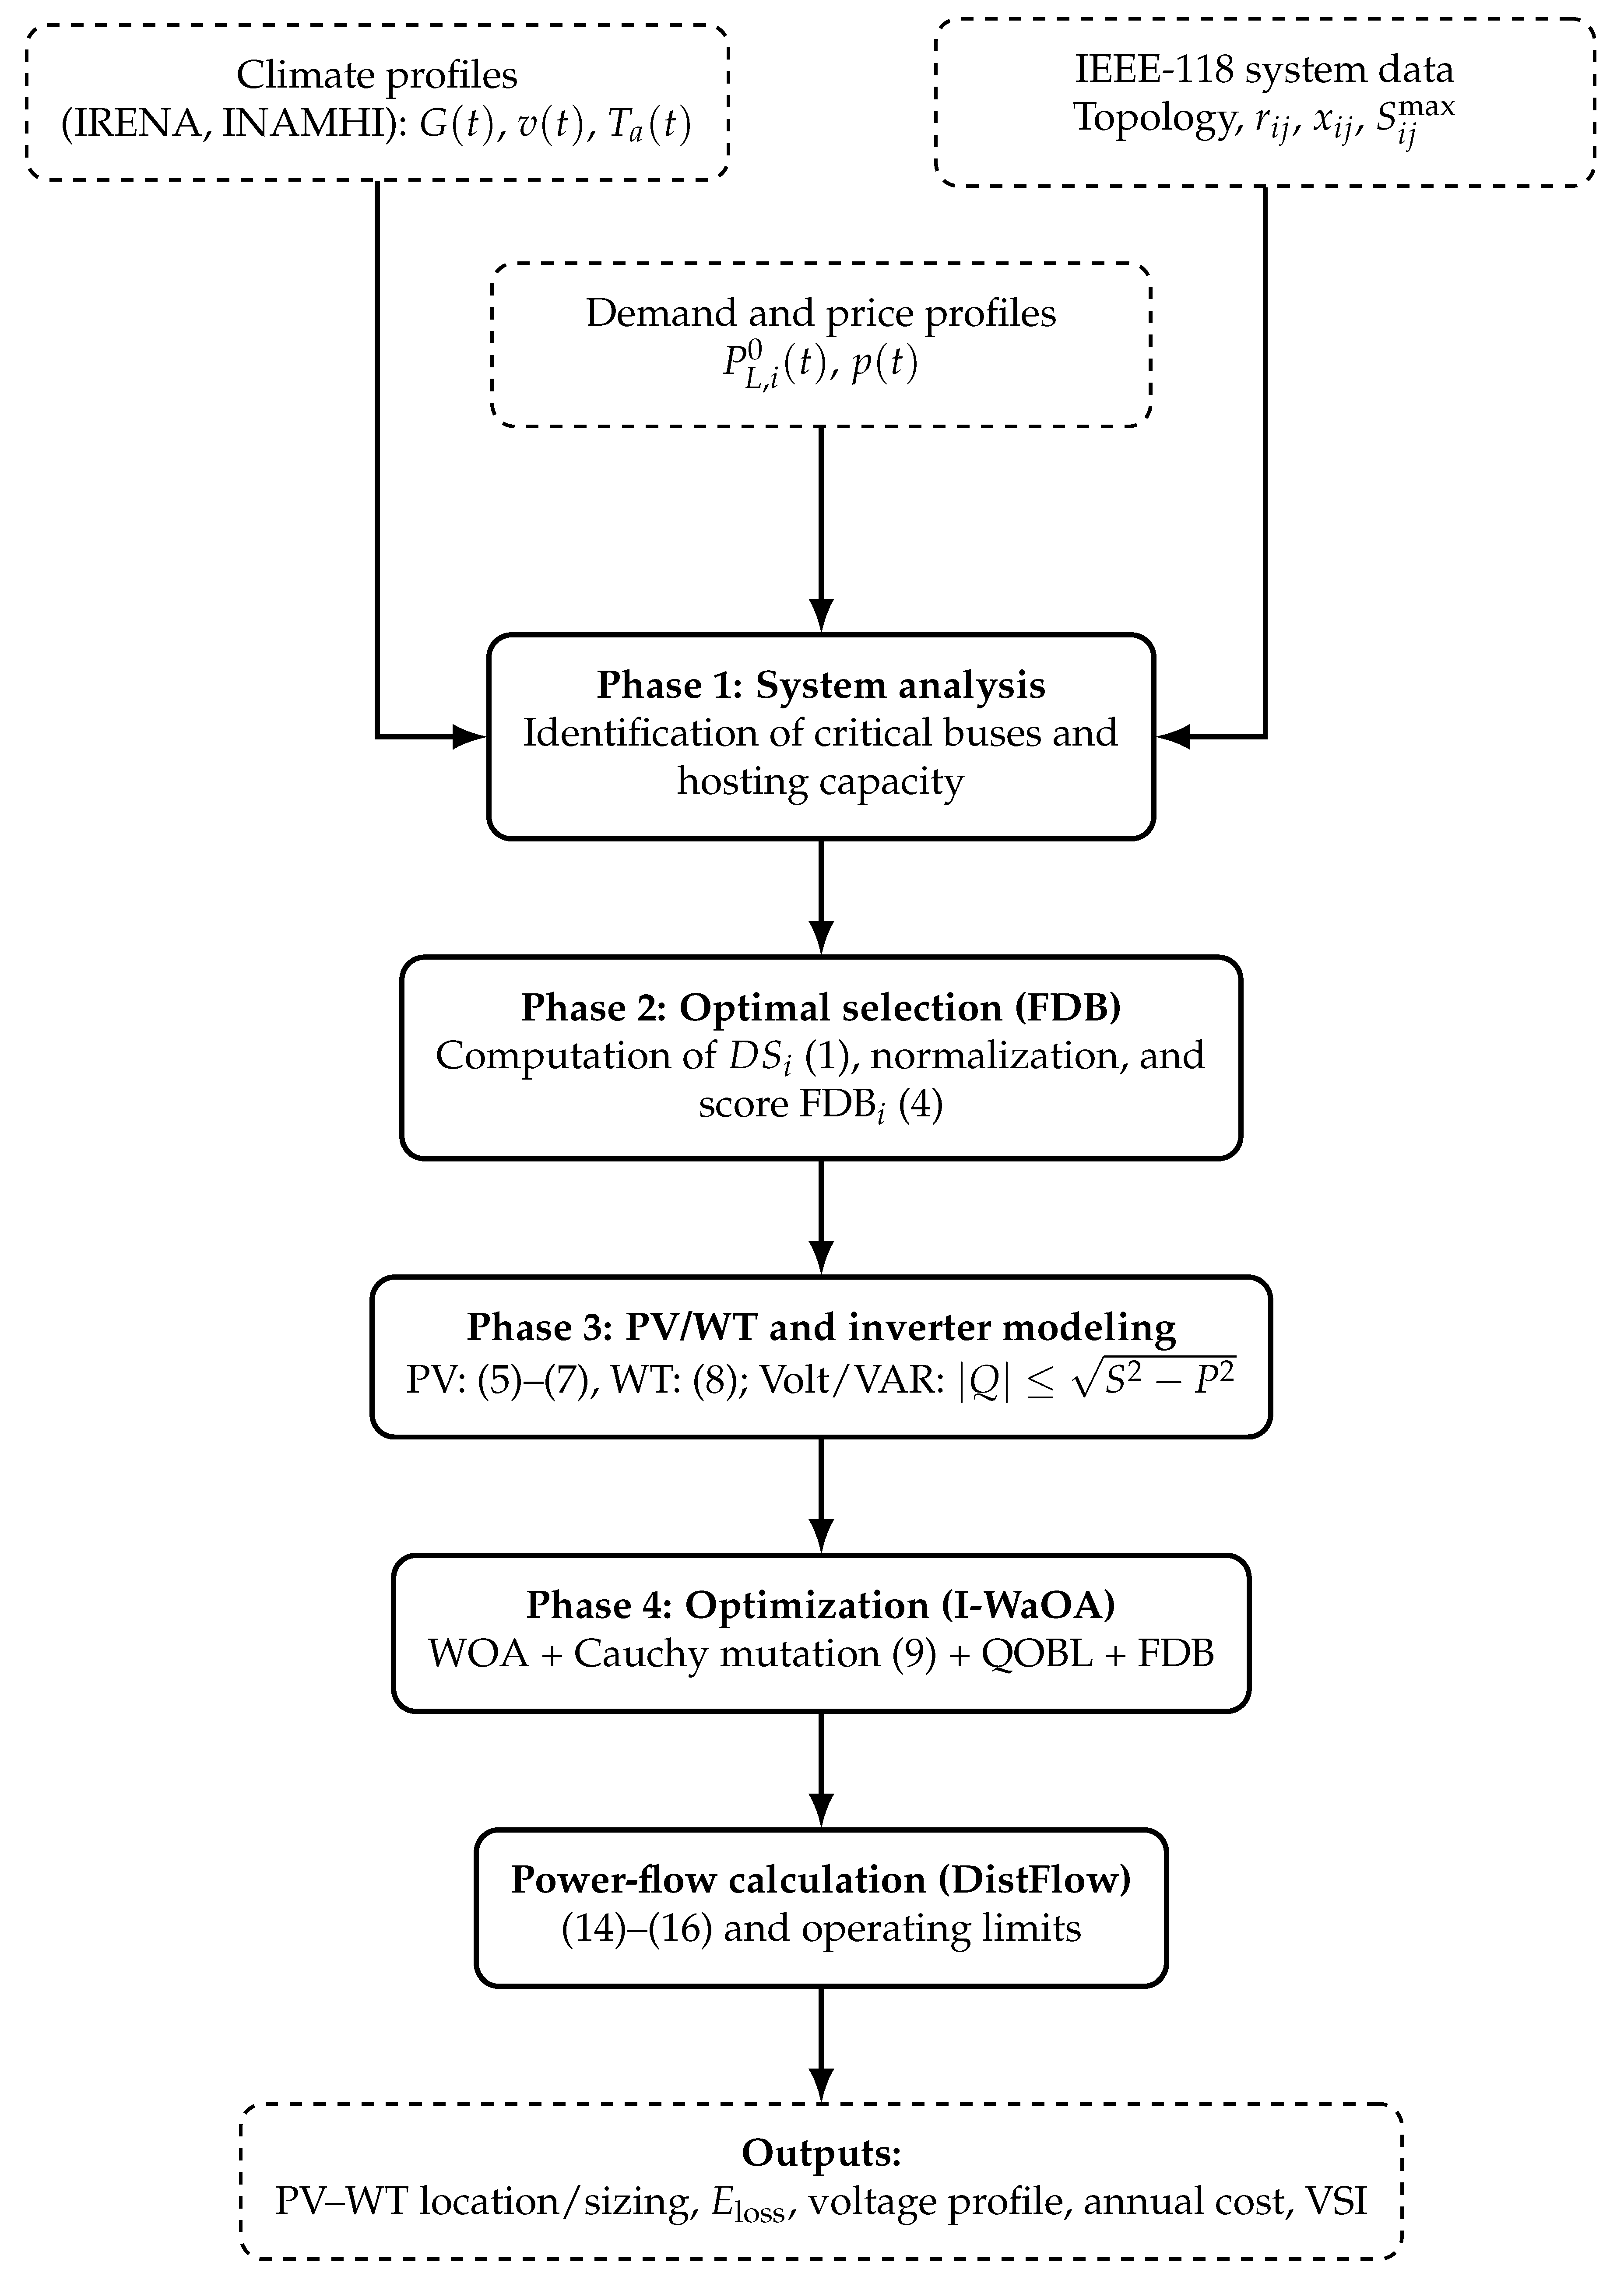
Figure 2.
Schematic single-line diagram of the IEEE 118-bus distribution network used as the case study. The network is modeled as an extended radial system with integrated photovoltaic and wind distributed generation.
Figure 2.
Schematic single-line diagram of the IEEE 118-bus distribution network used as the case study. The network is modeled as an extended radial system with integrated photovoltaic and wind distributed generation.
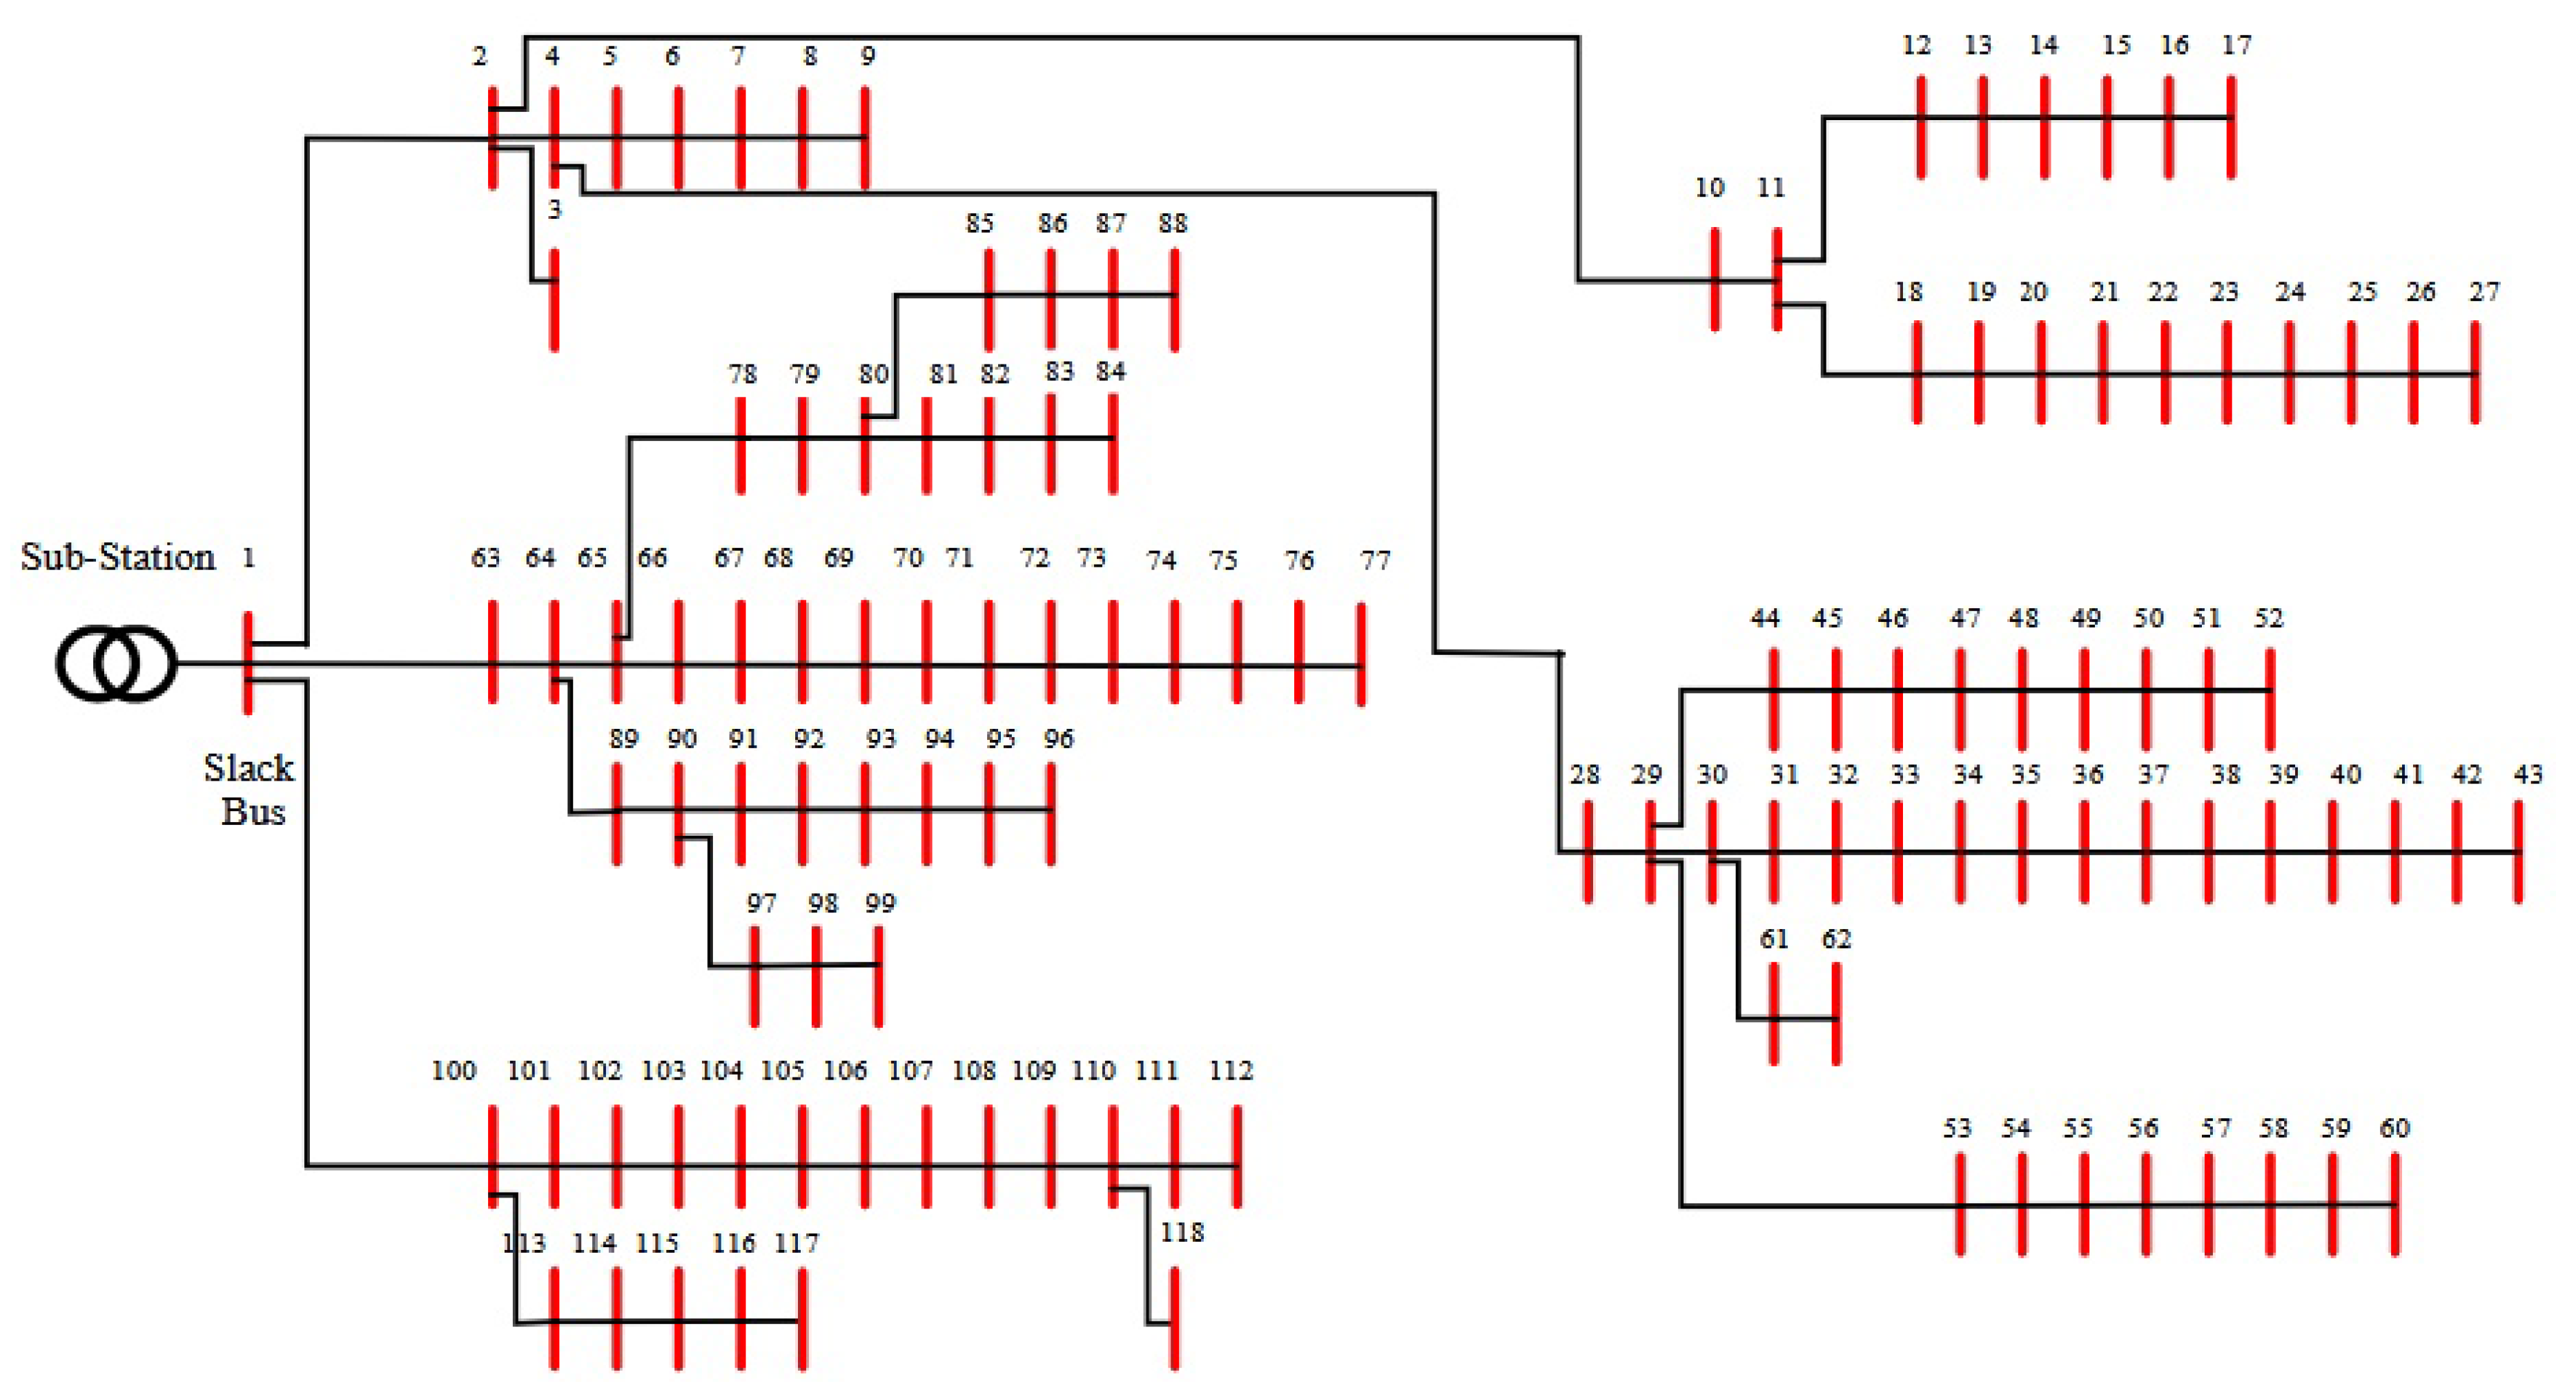
Figure 3.
Probabilistic distribution of solar irradiance used in photovoltaic modeling.
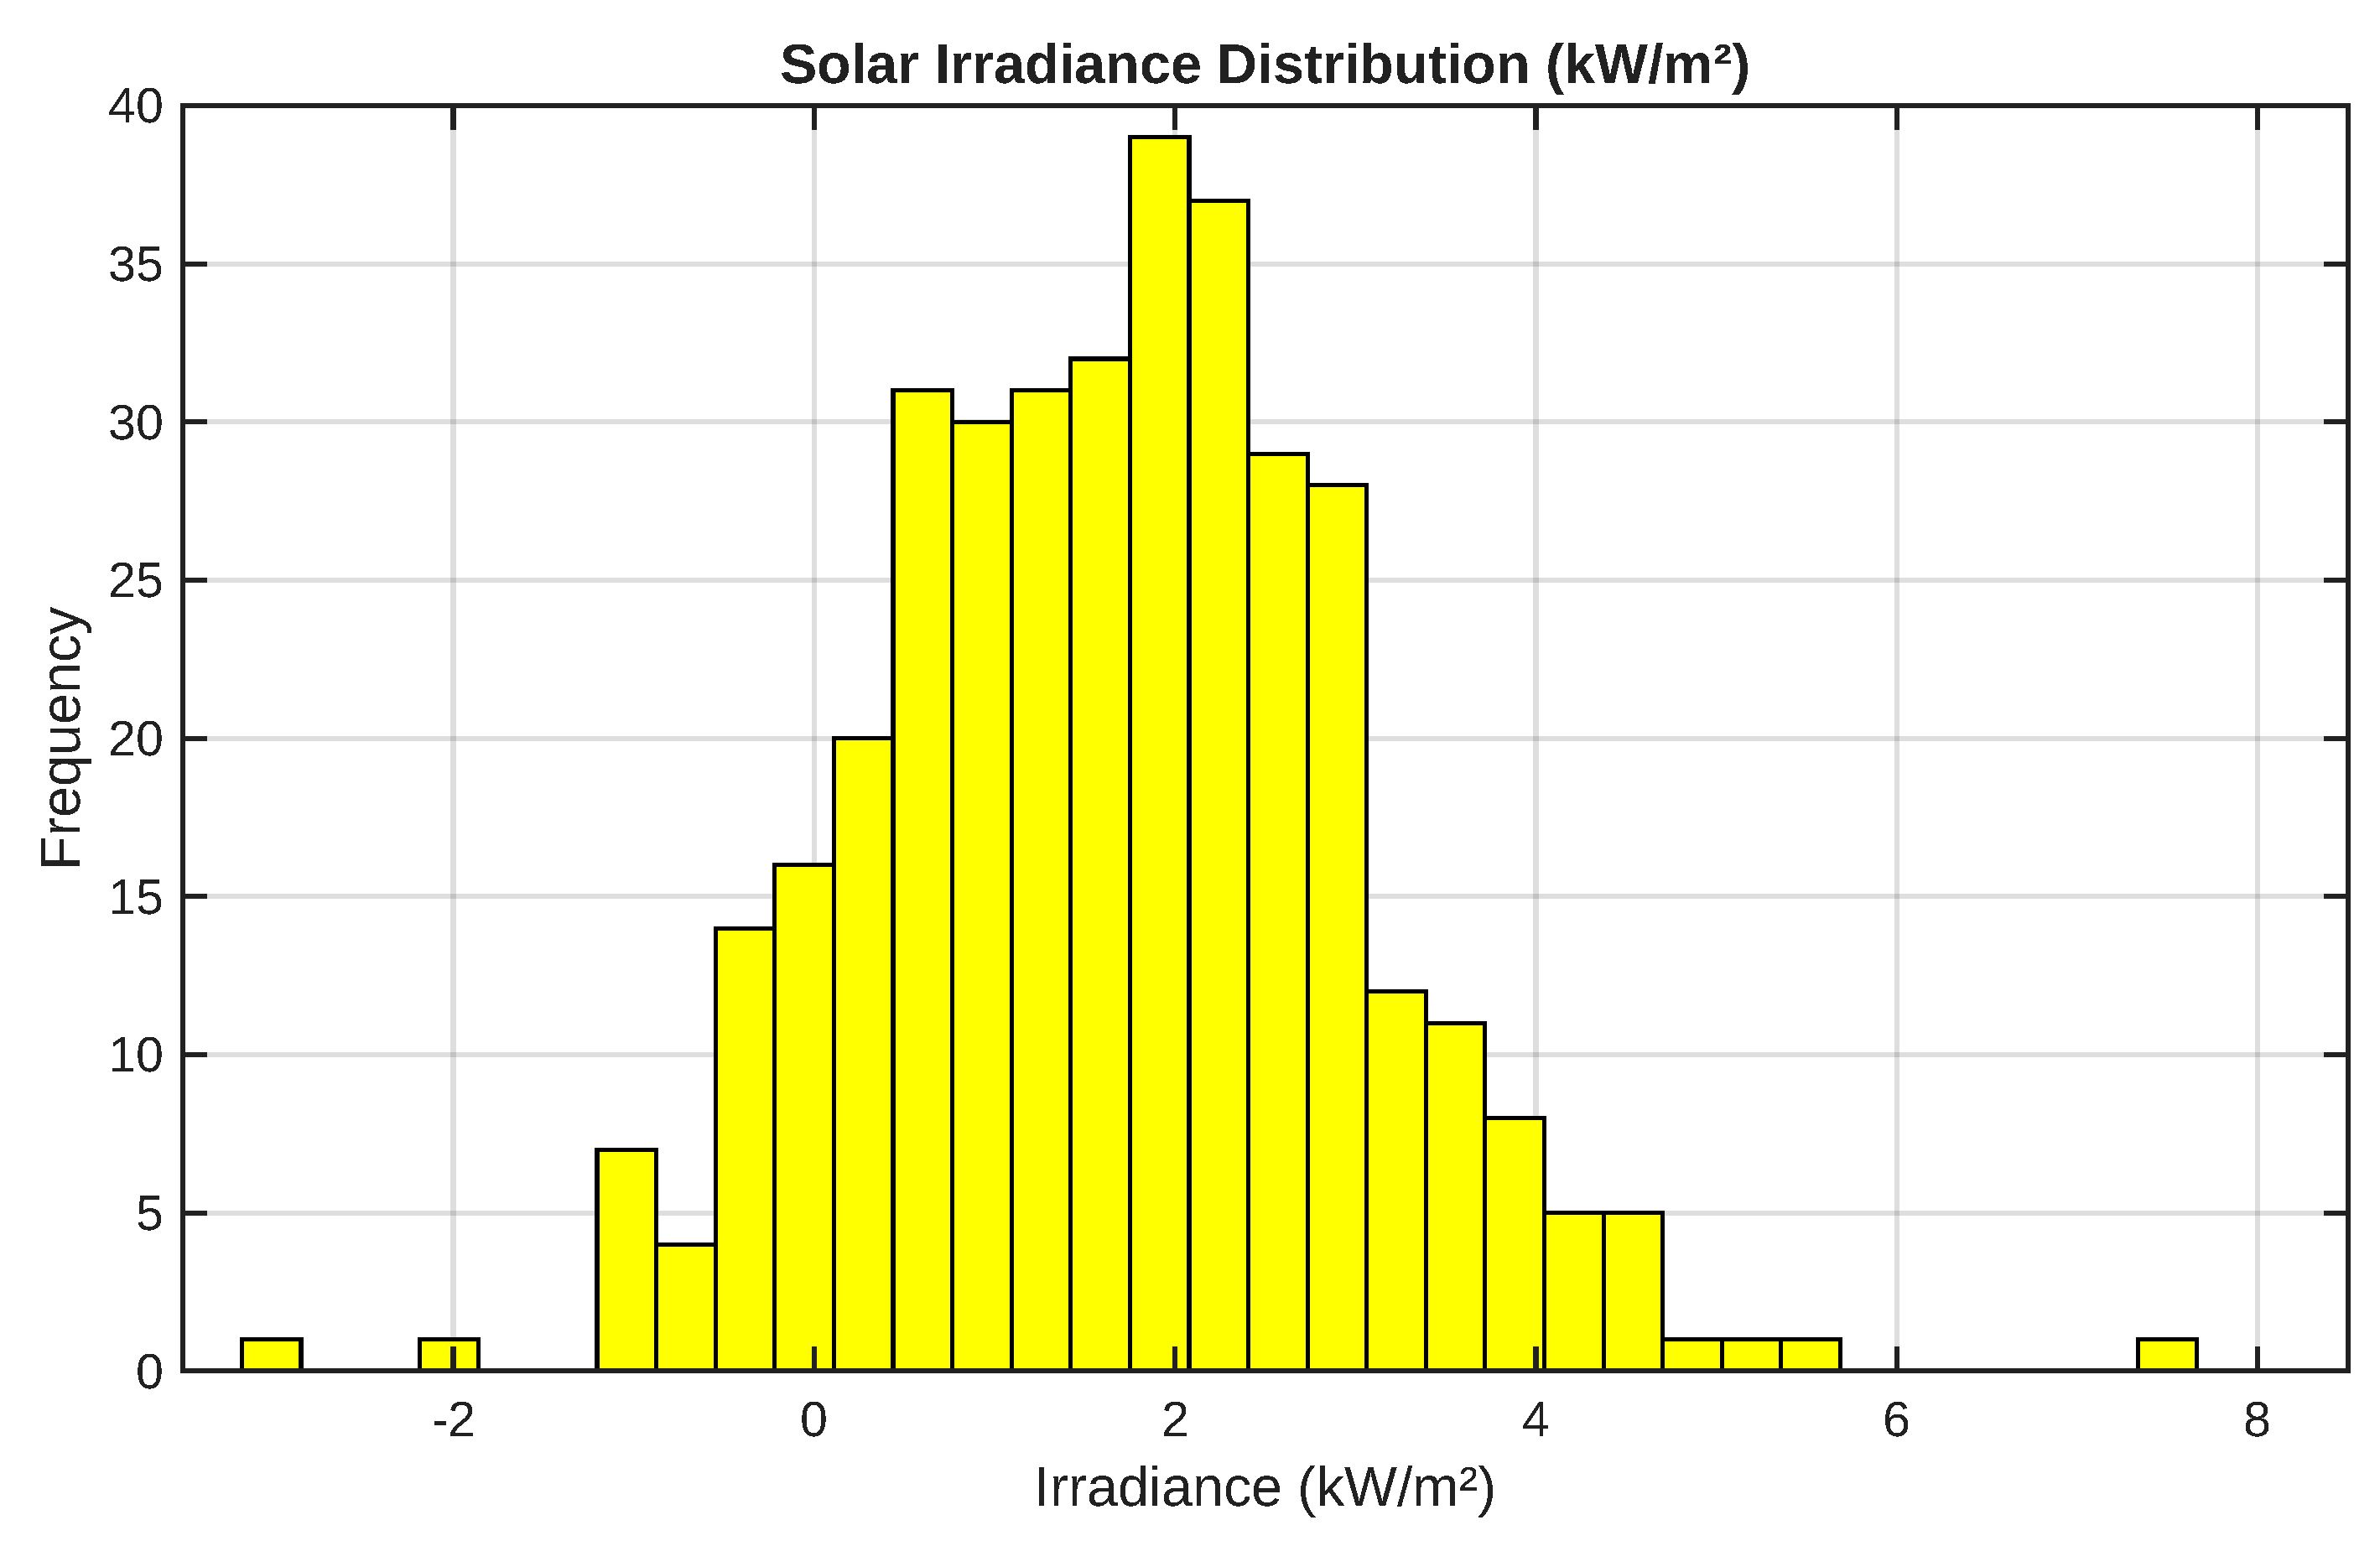
Figure 4.
Wind speed distribution used for wind generation calculation.
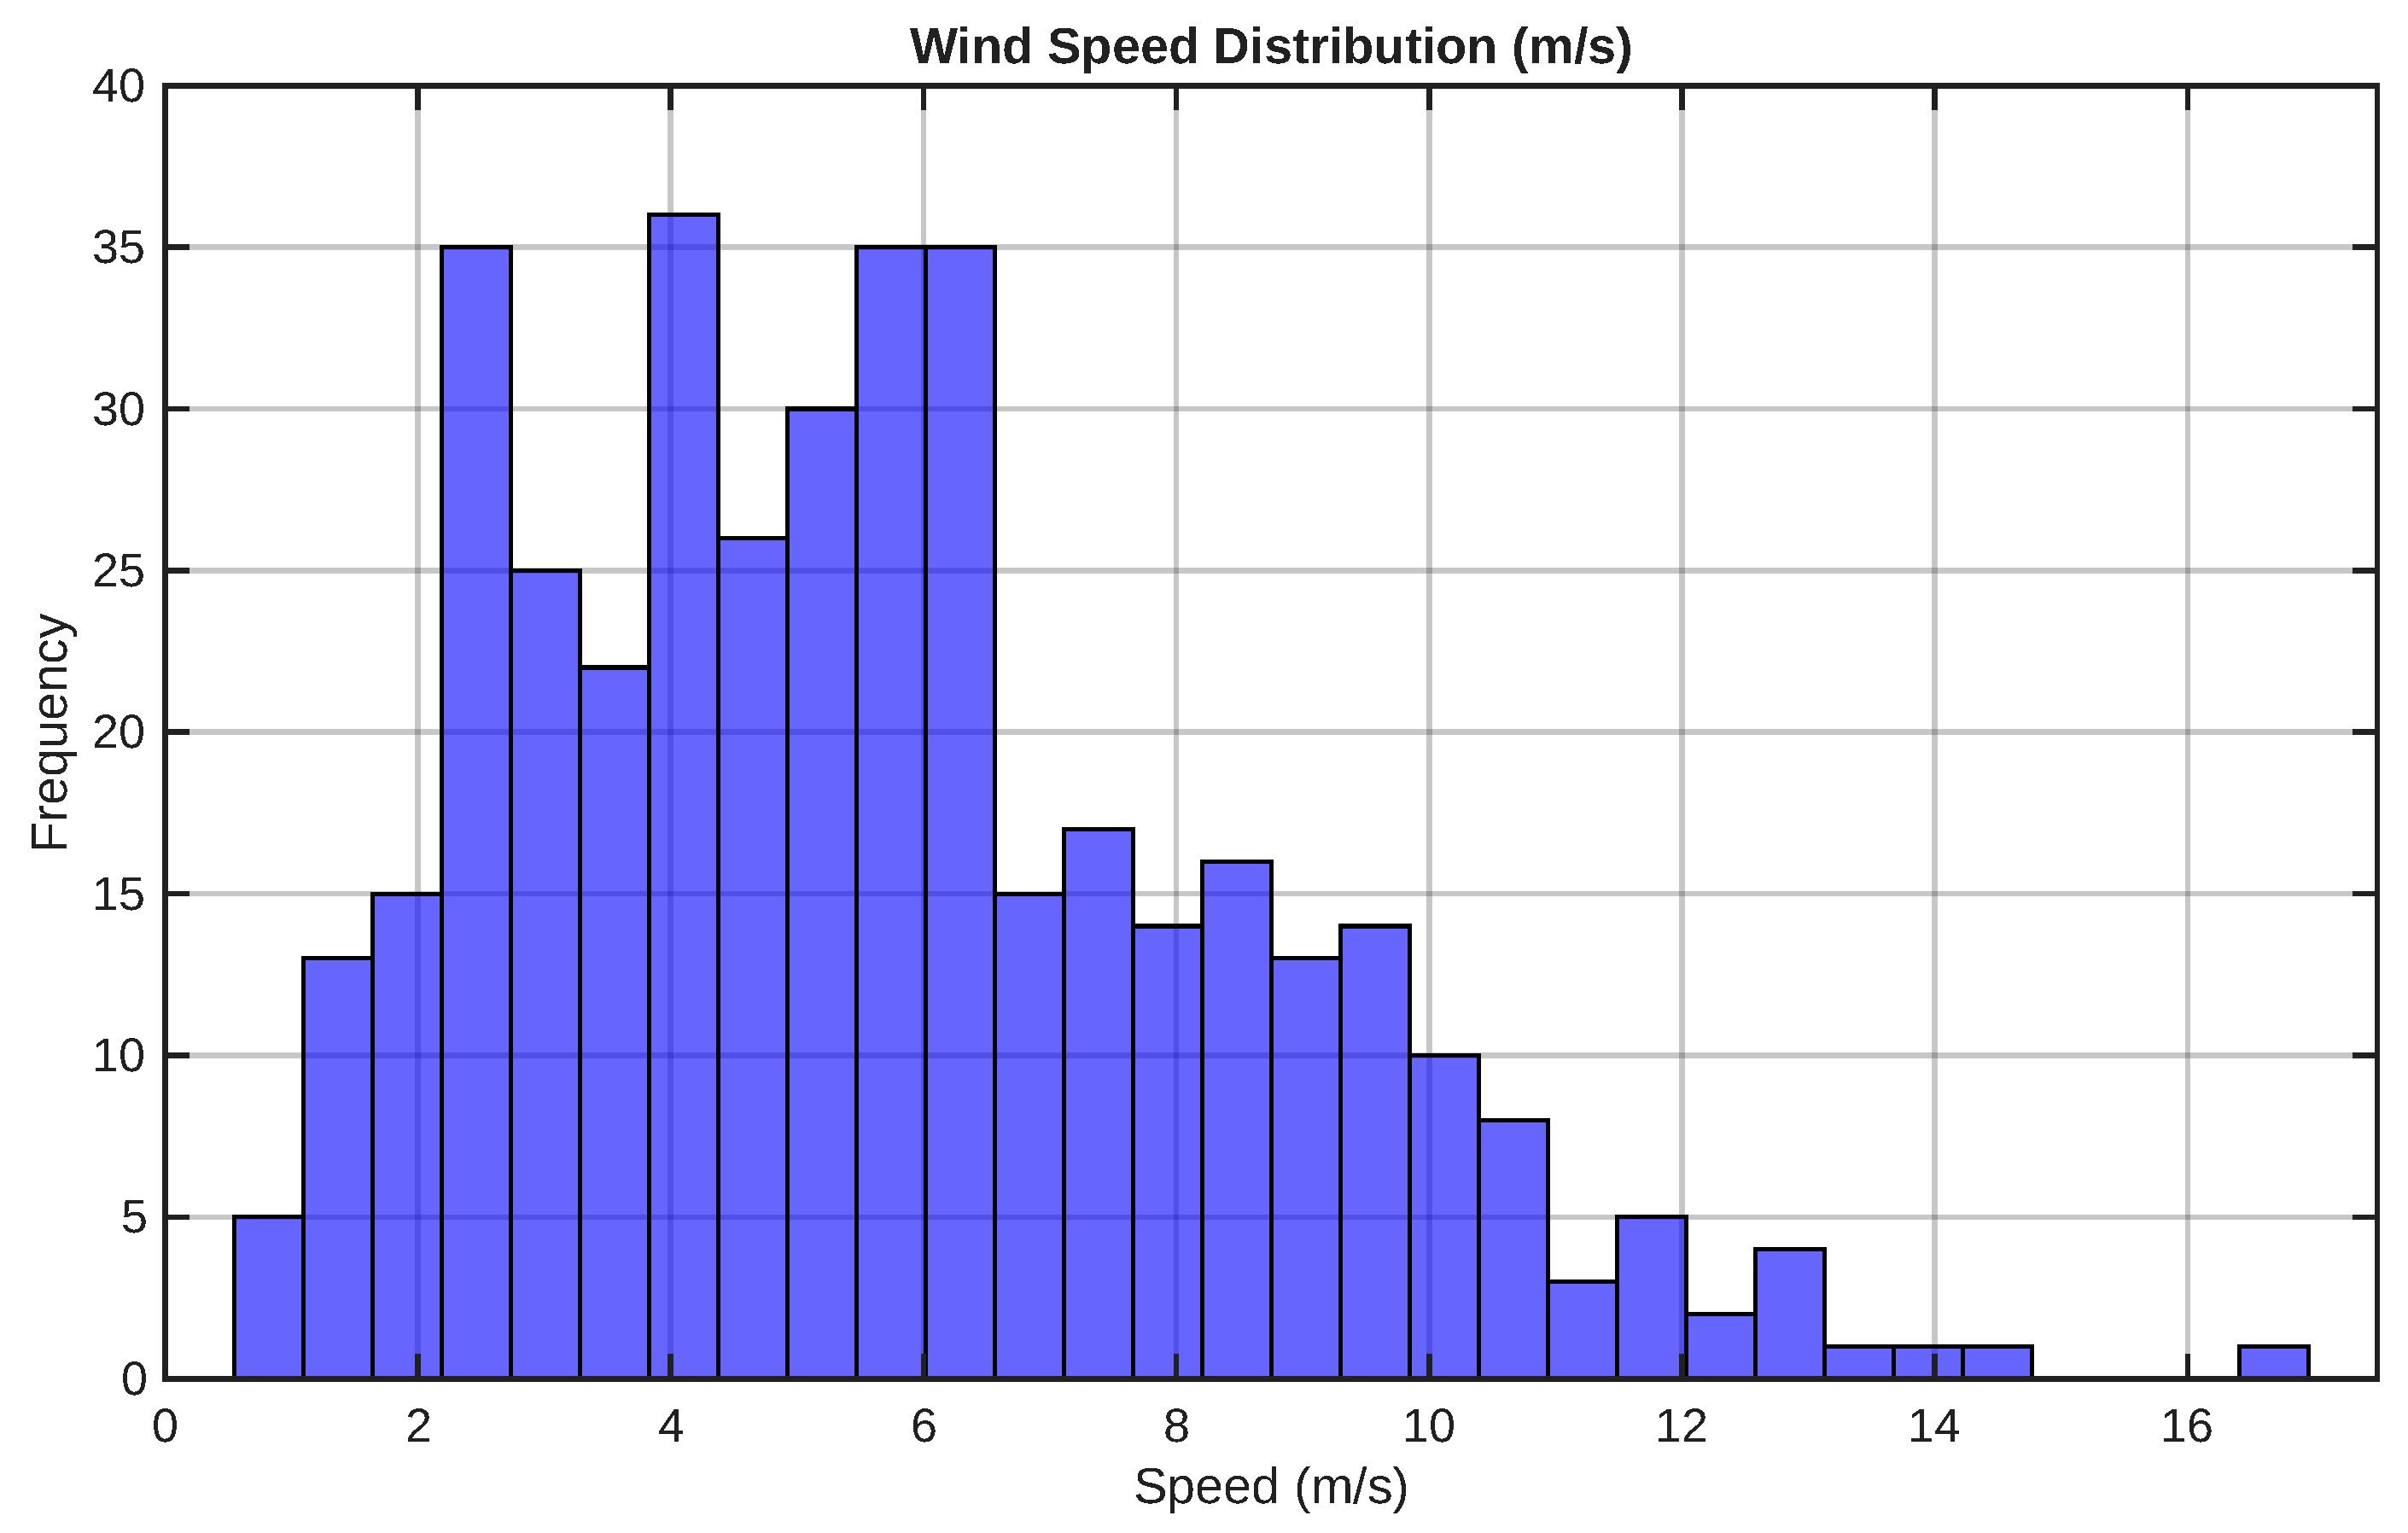
Figure 5.
Probabilistic distribution of the total demand of the IEEE-118 system.
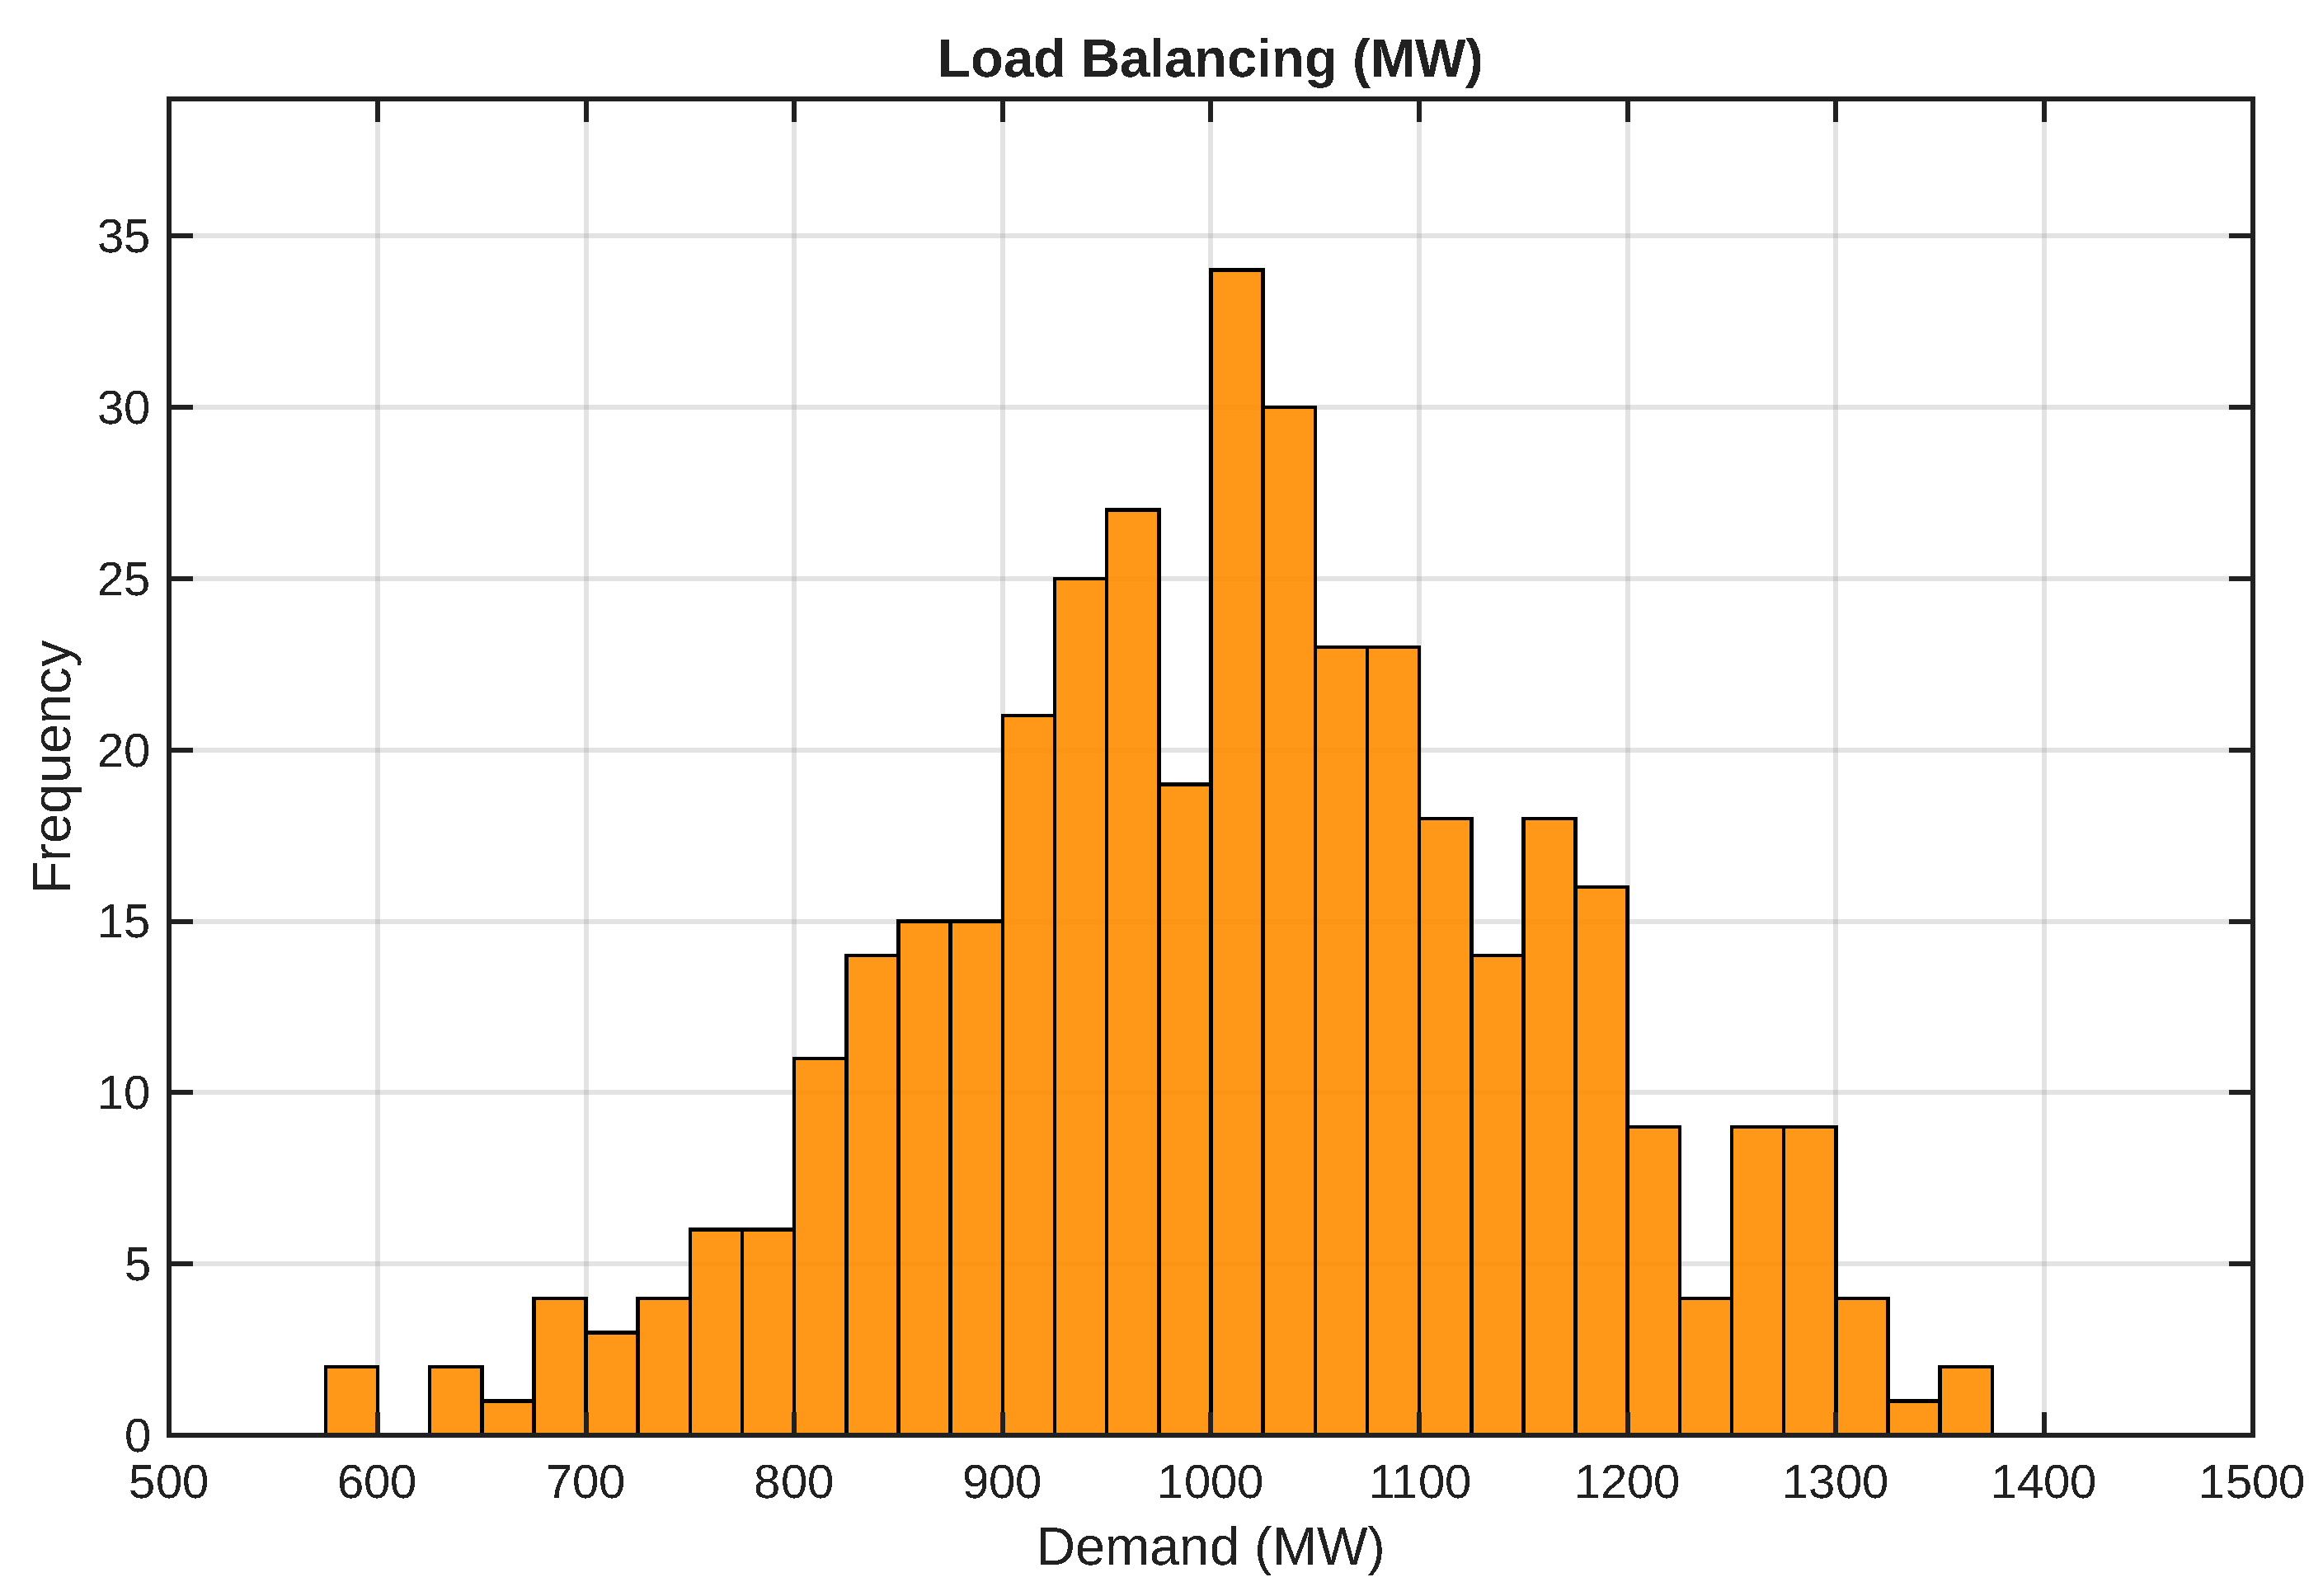
Figure 6.
Distribution of marginal electricity prices used in the DSR scheme.
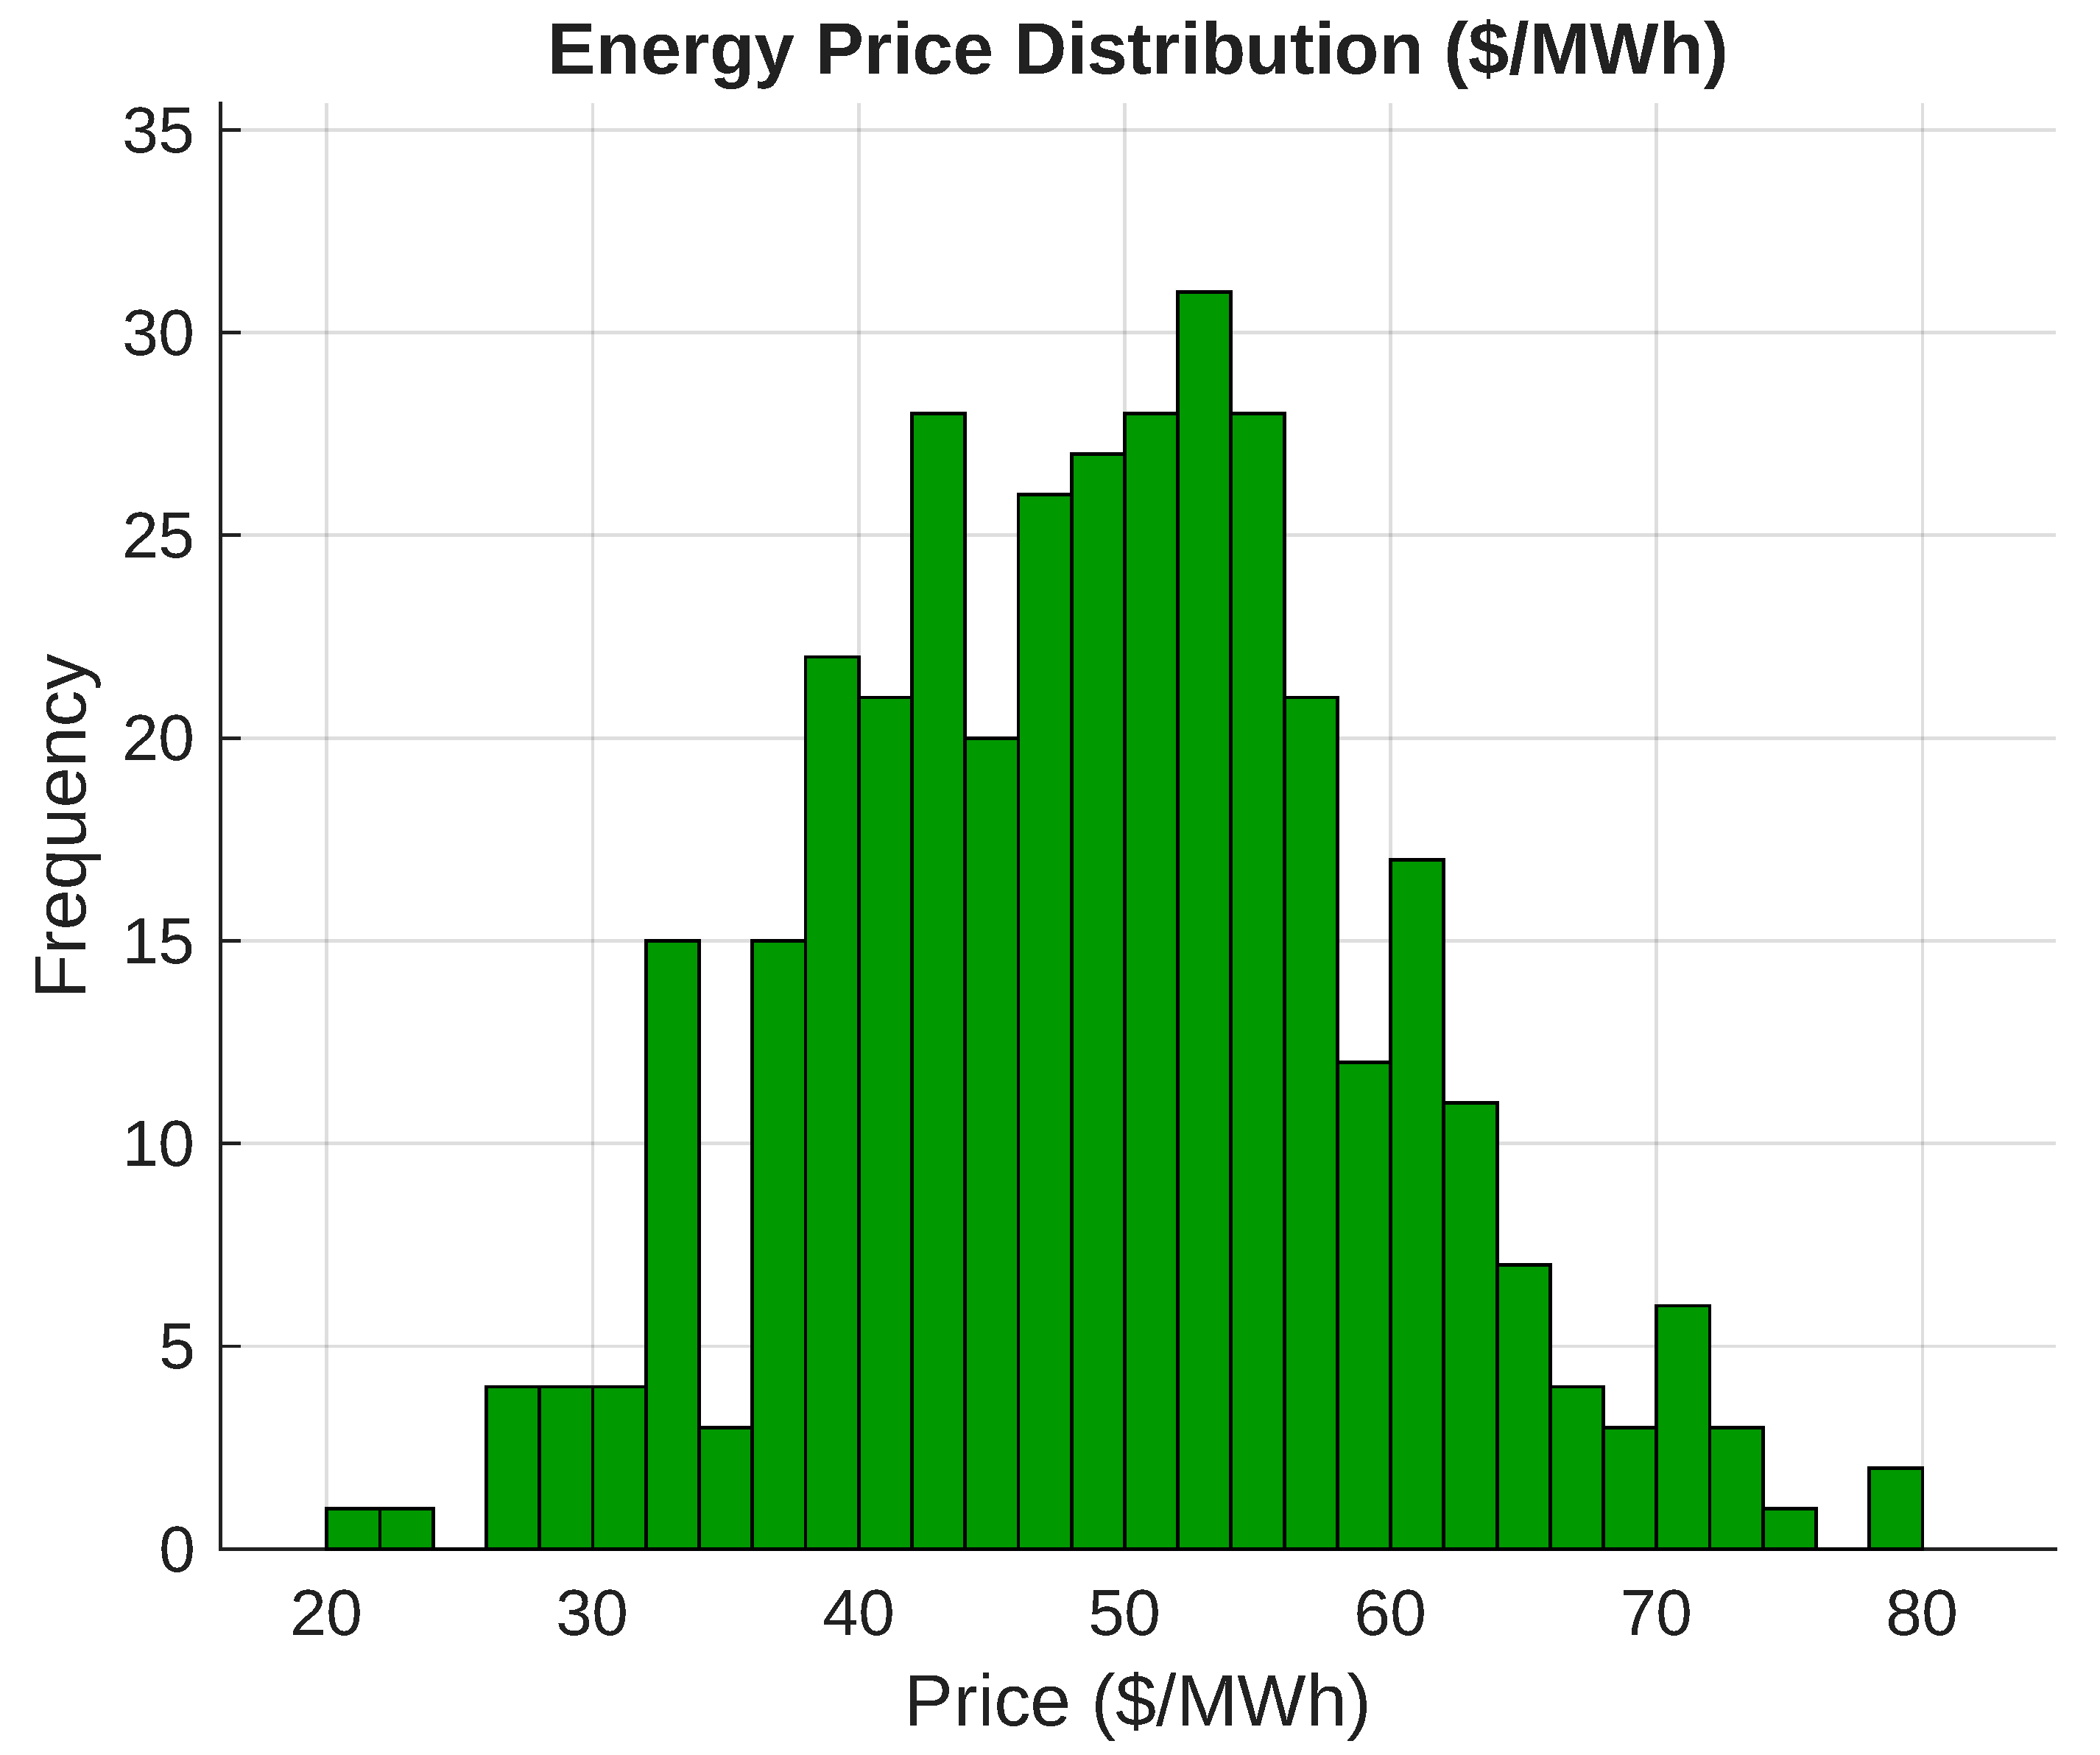
Figure 7.
Probabilistic distribution of ambient temperature used in PV modeling.
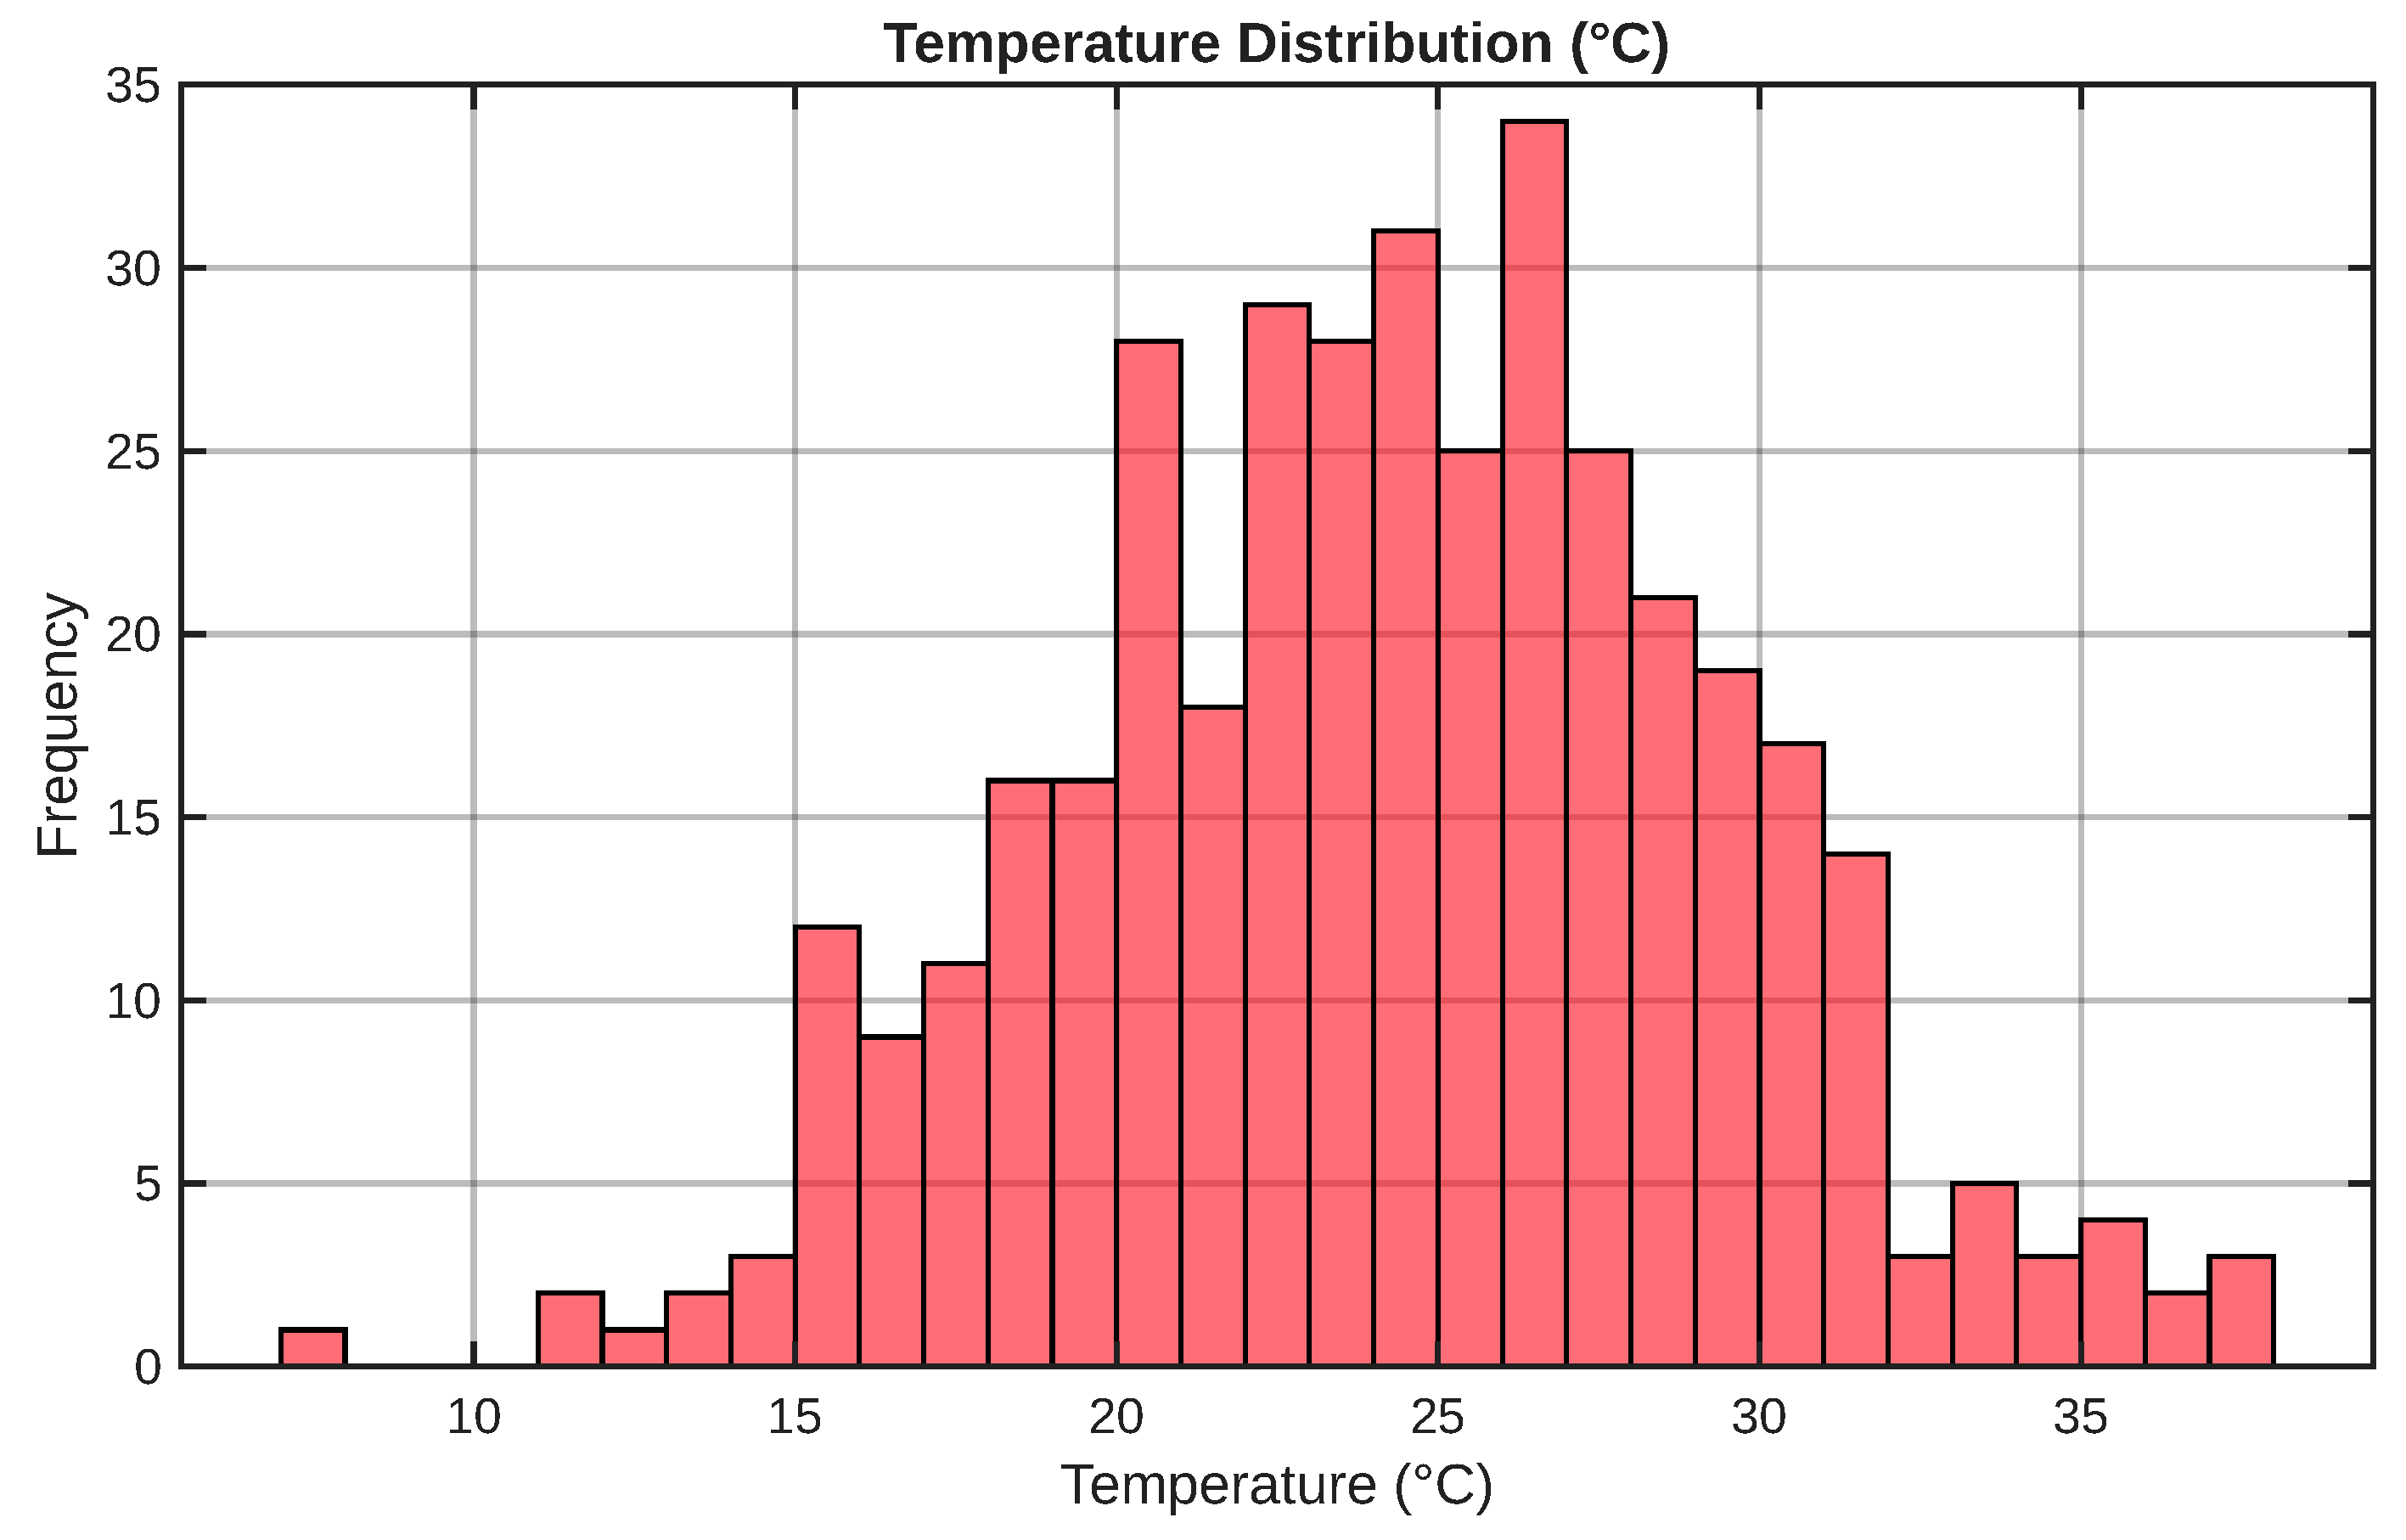
Figure 8.
Power generated by the distributed photovoltaic system.
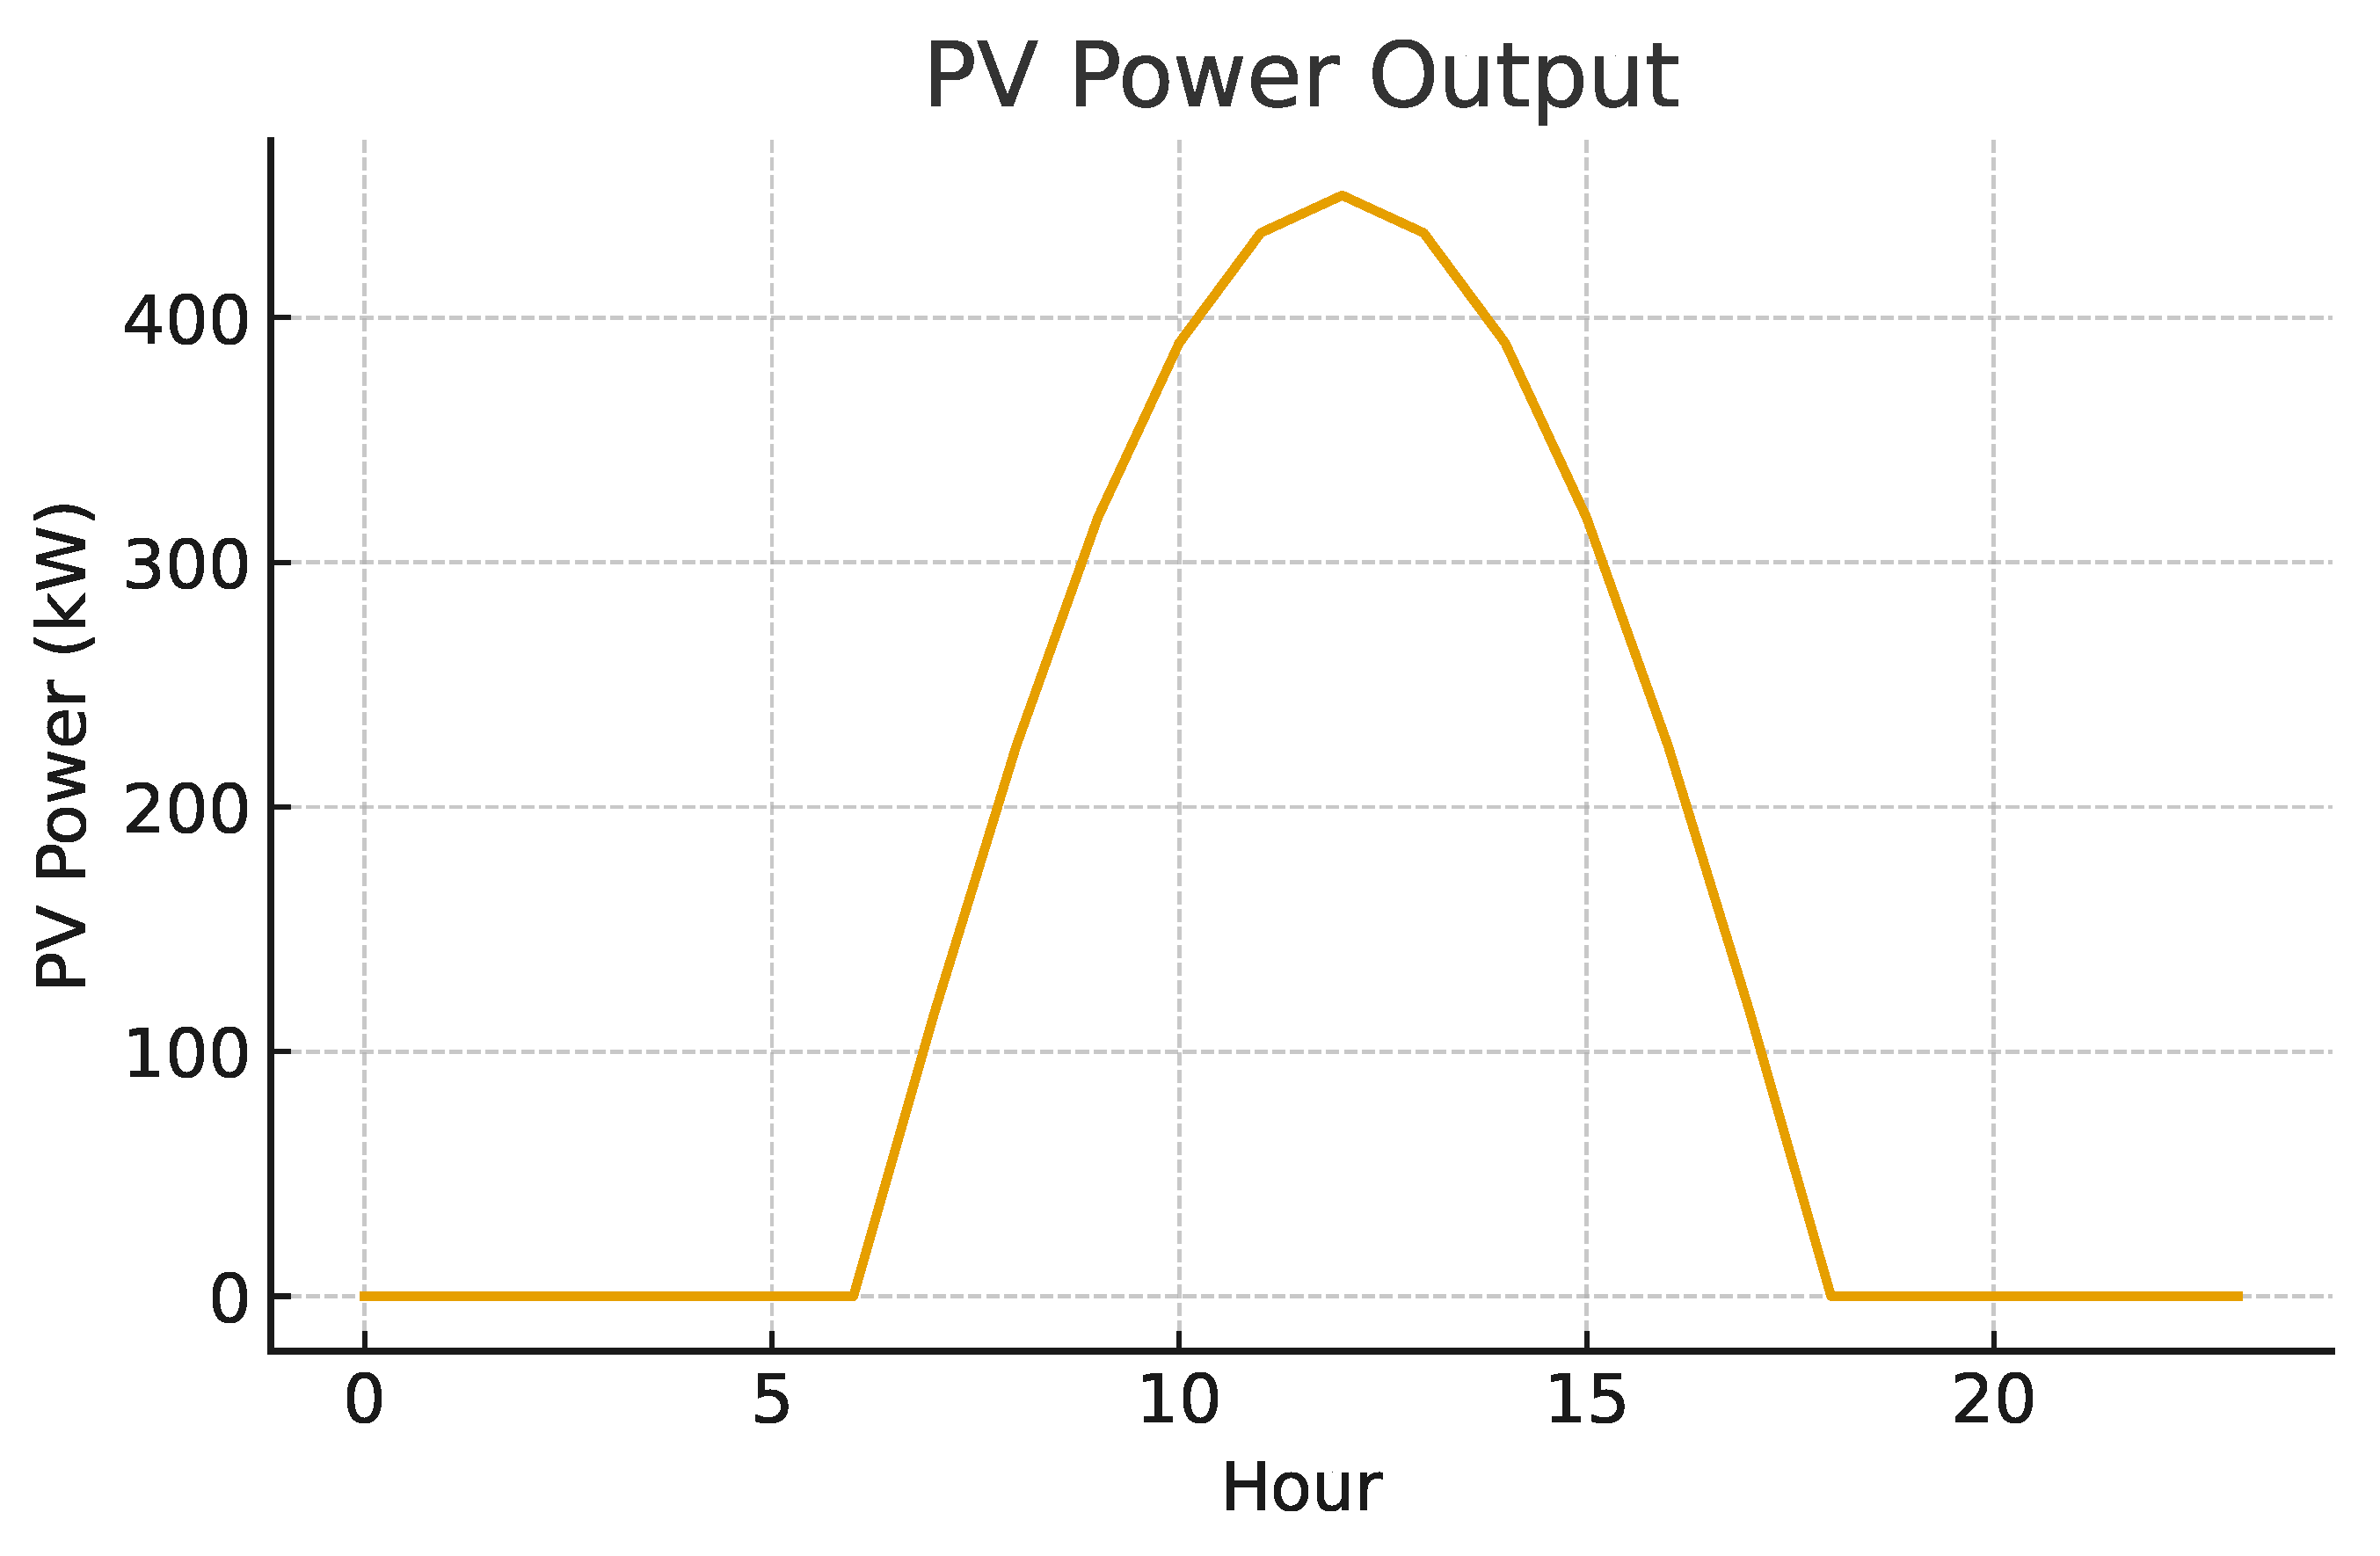
Figure 9.
Power generated by the wind turbines installed at the assigned buses.
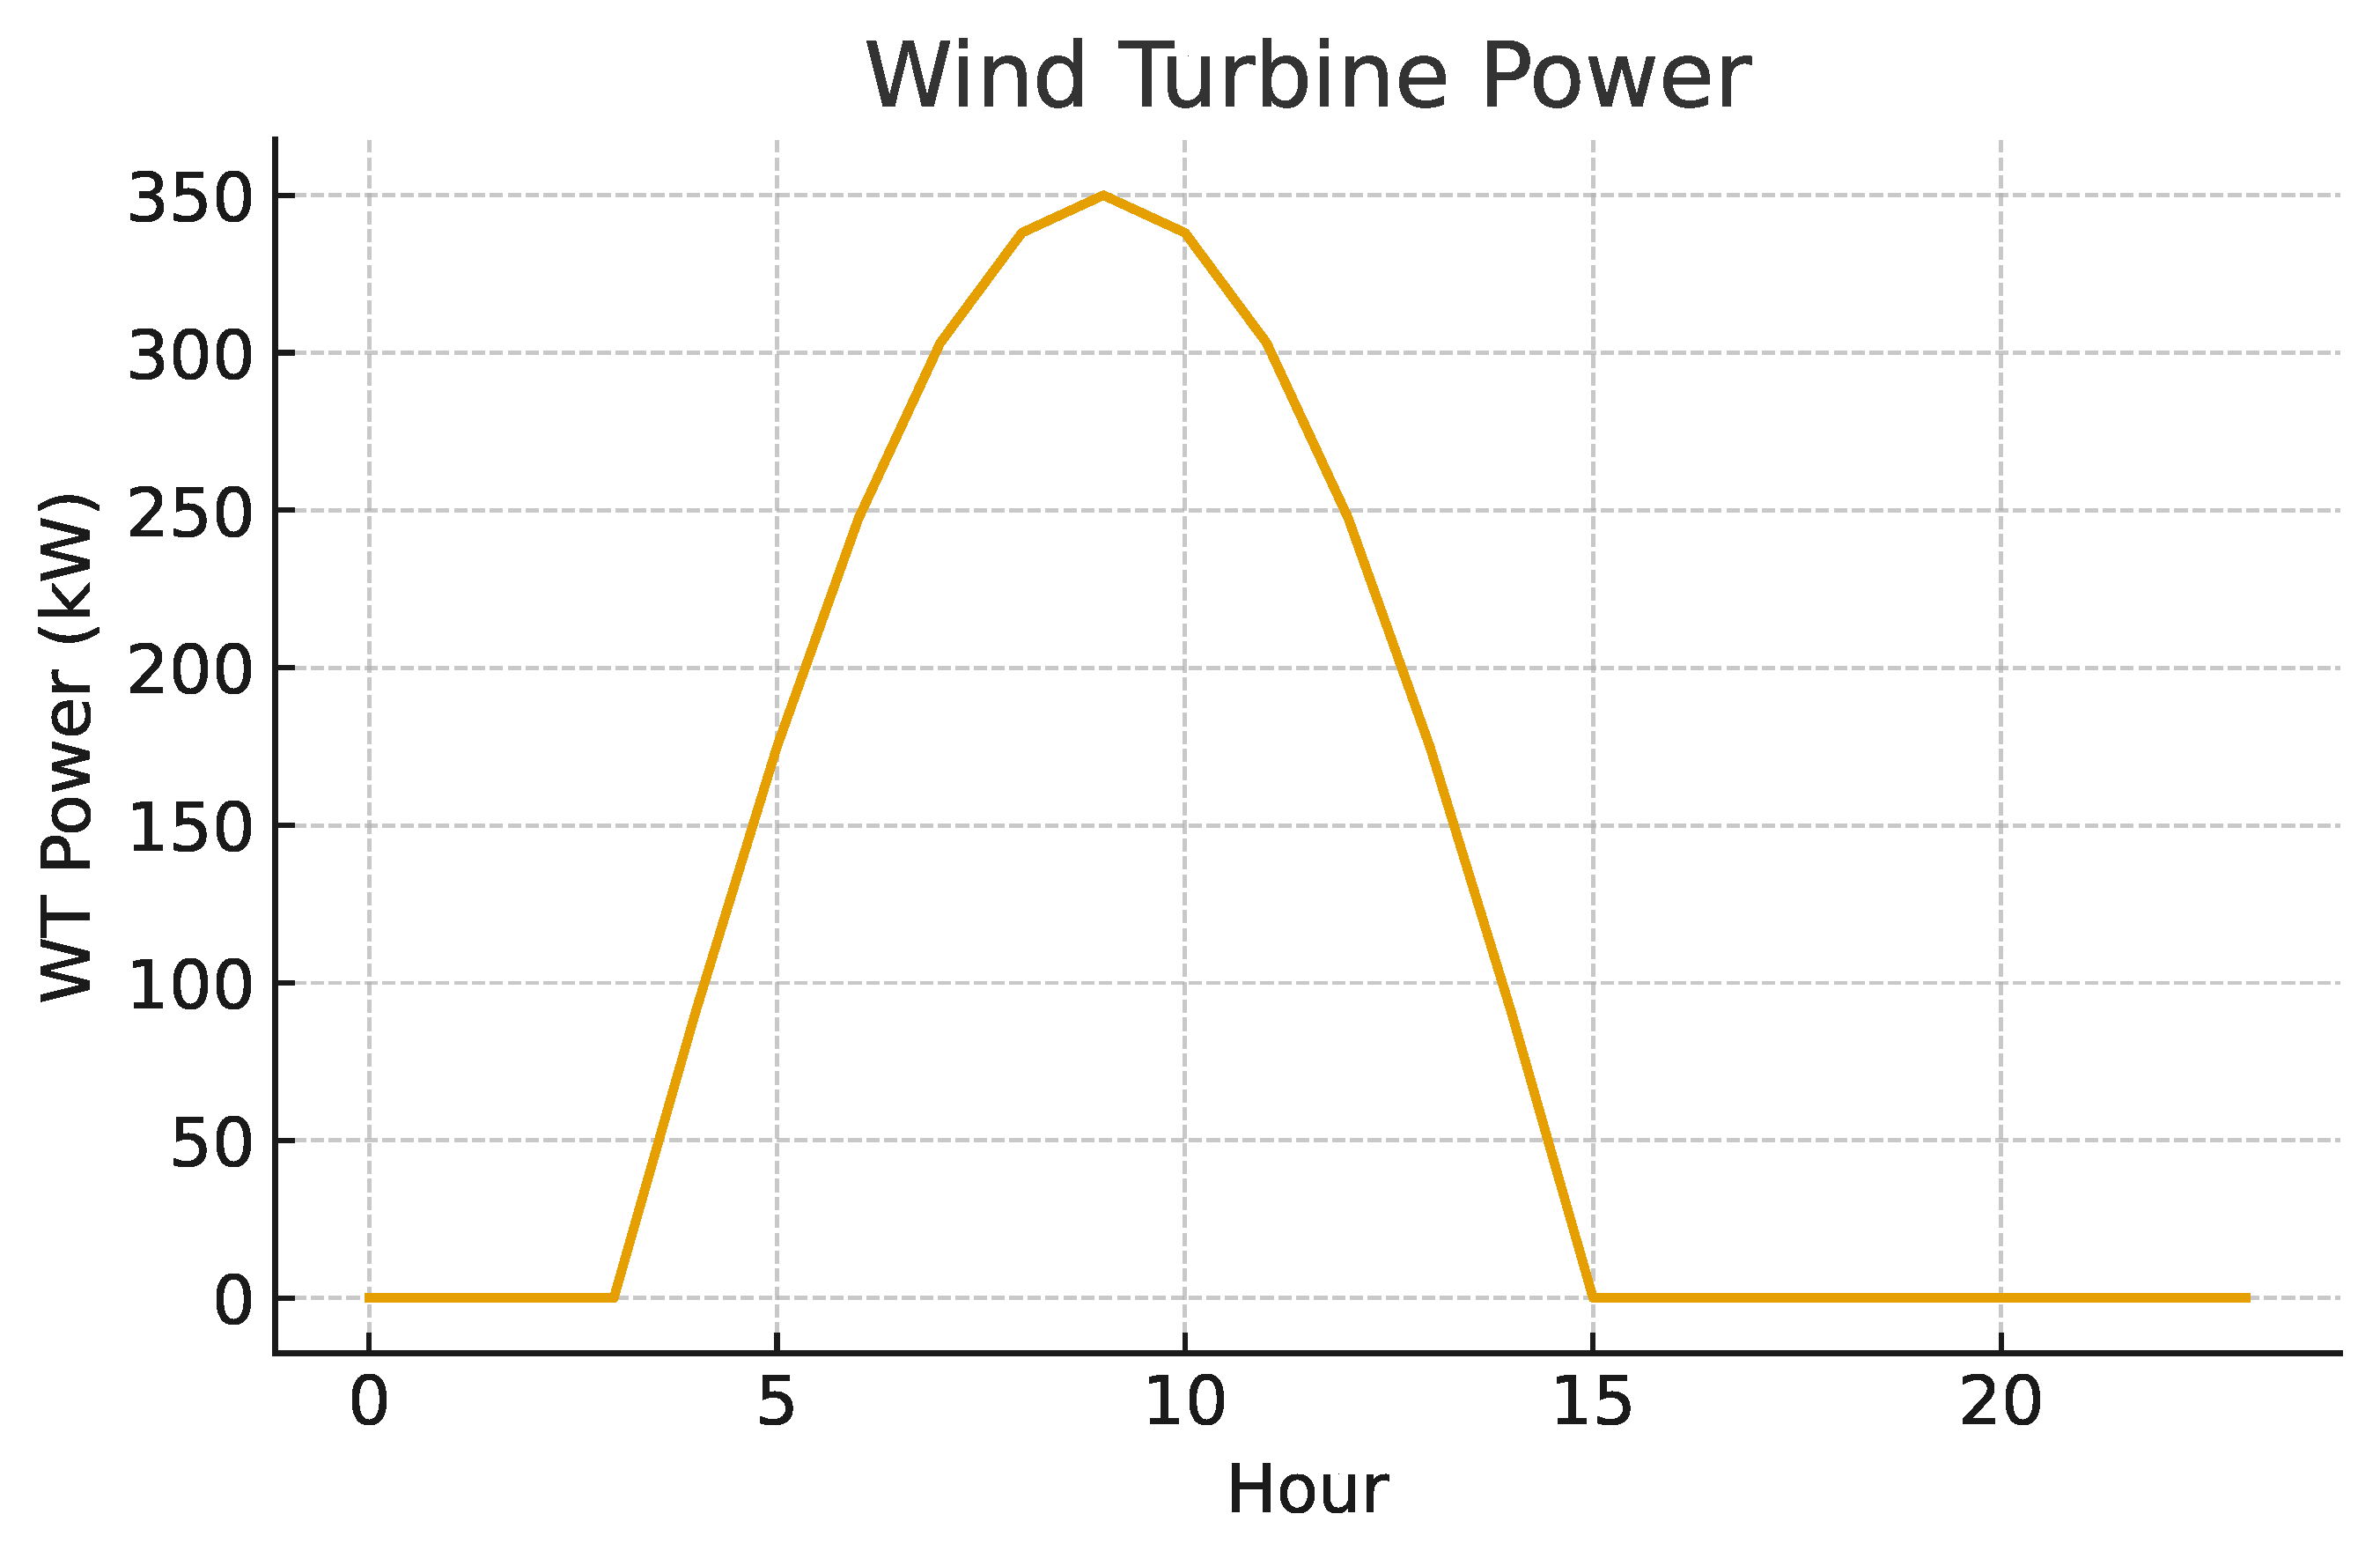
Figure 12.
Voltage profiles of the IEEE-118 system before and after optimization.
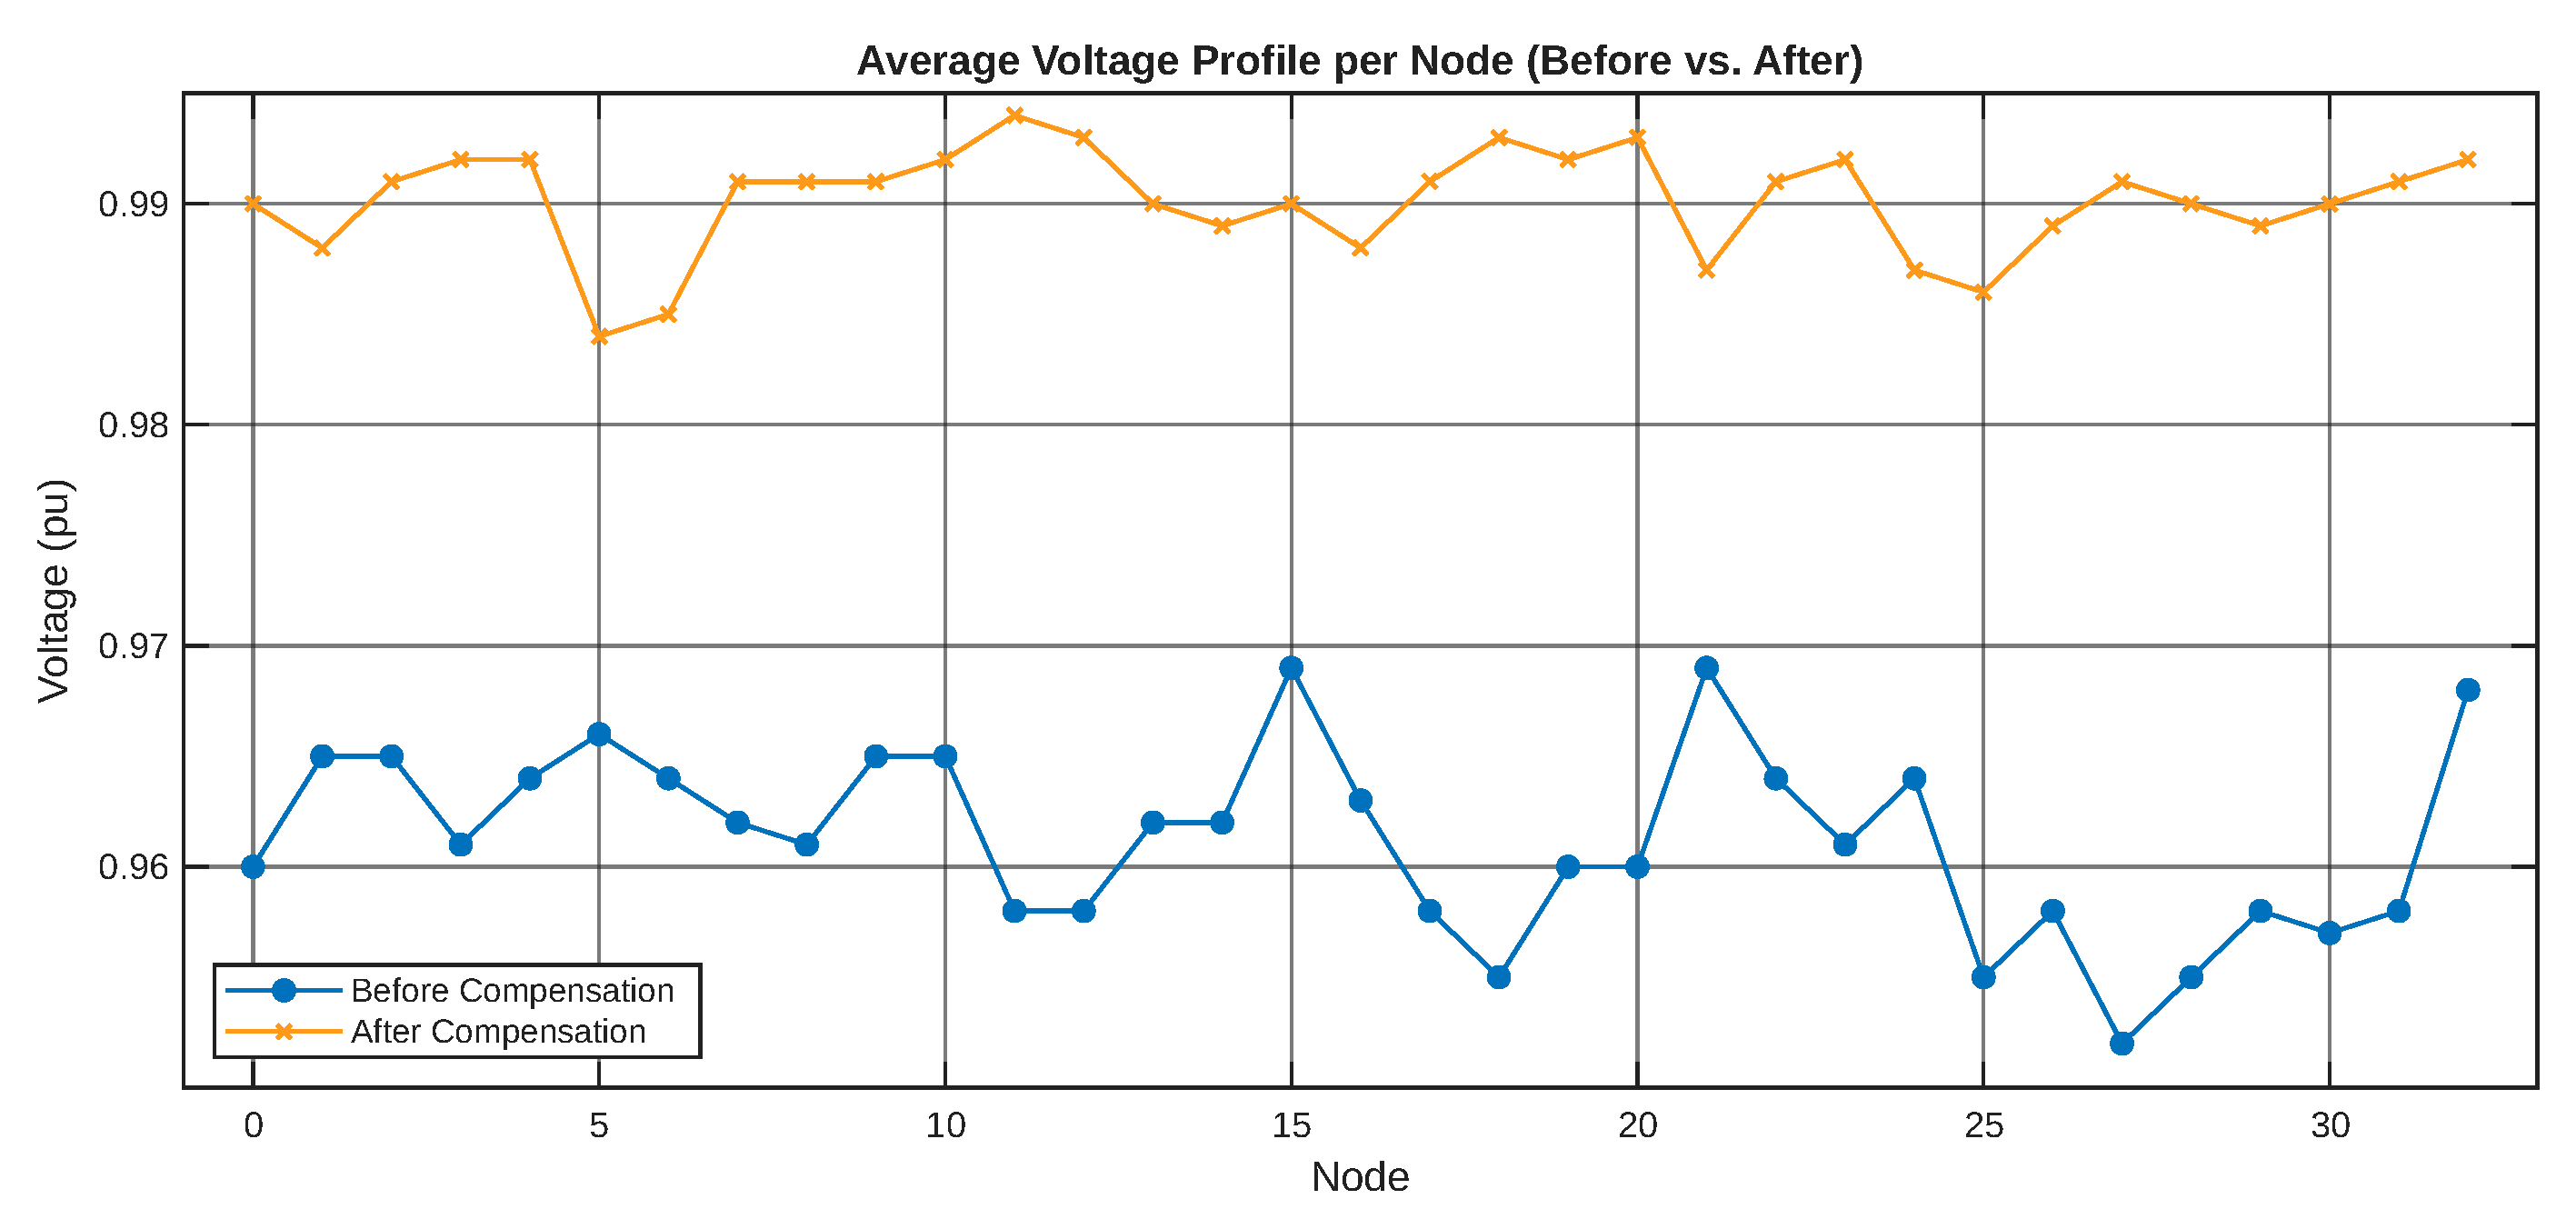
Figure 13.
Comparison of active power losses before and after optimization.
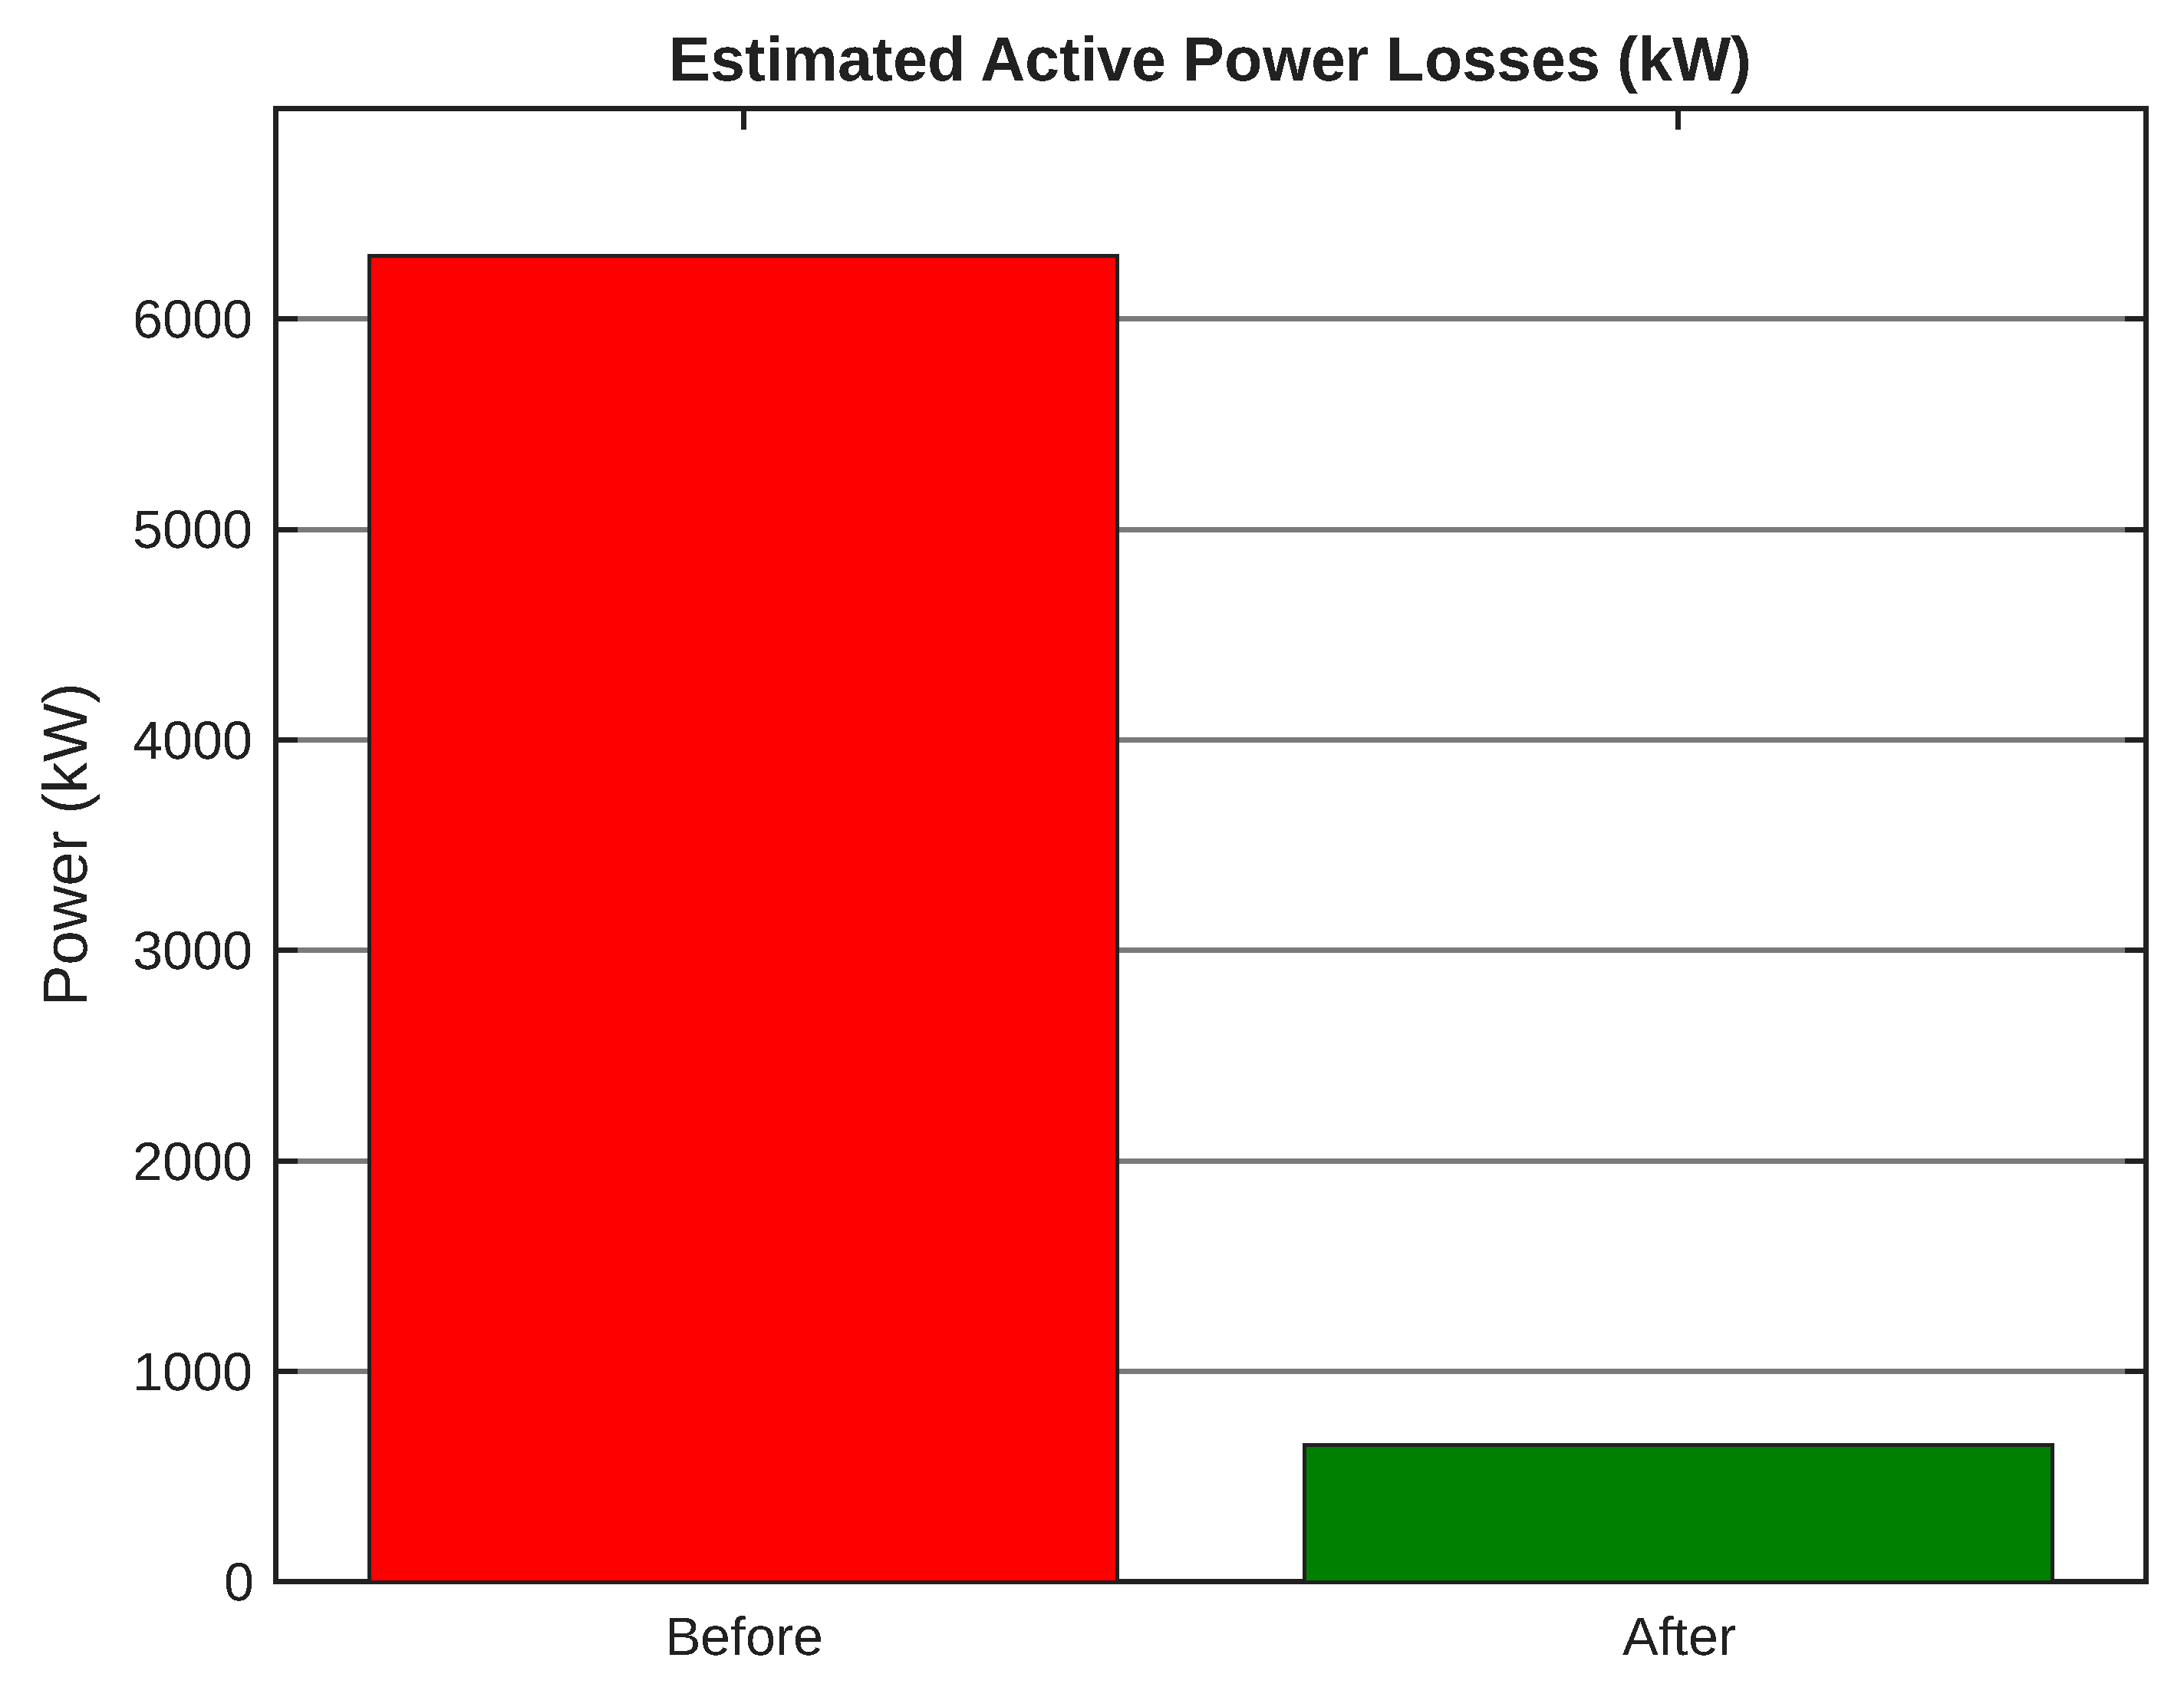
Figure 14.
Overall improvement of the system voltage level.
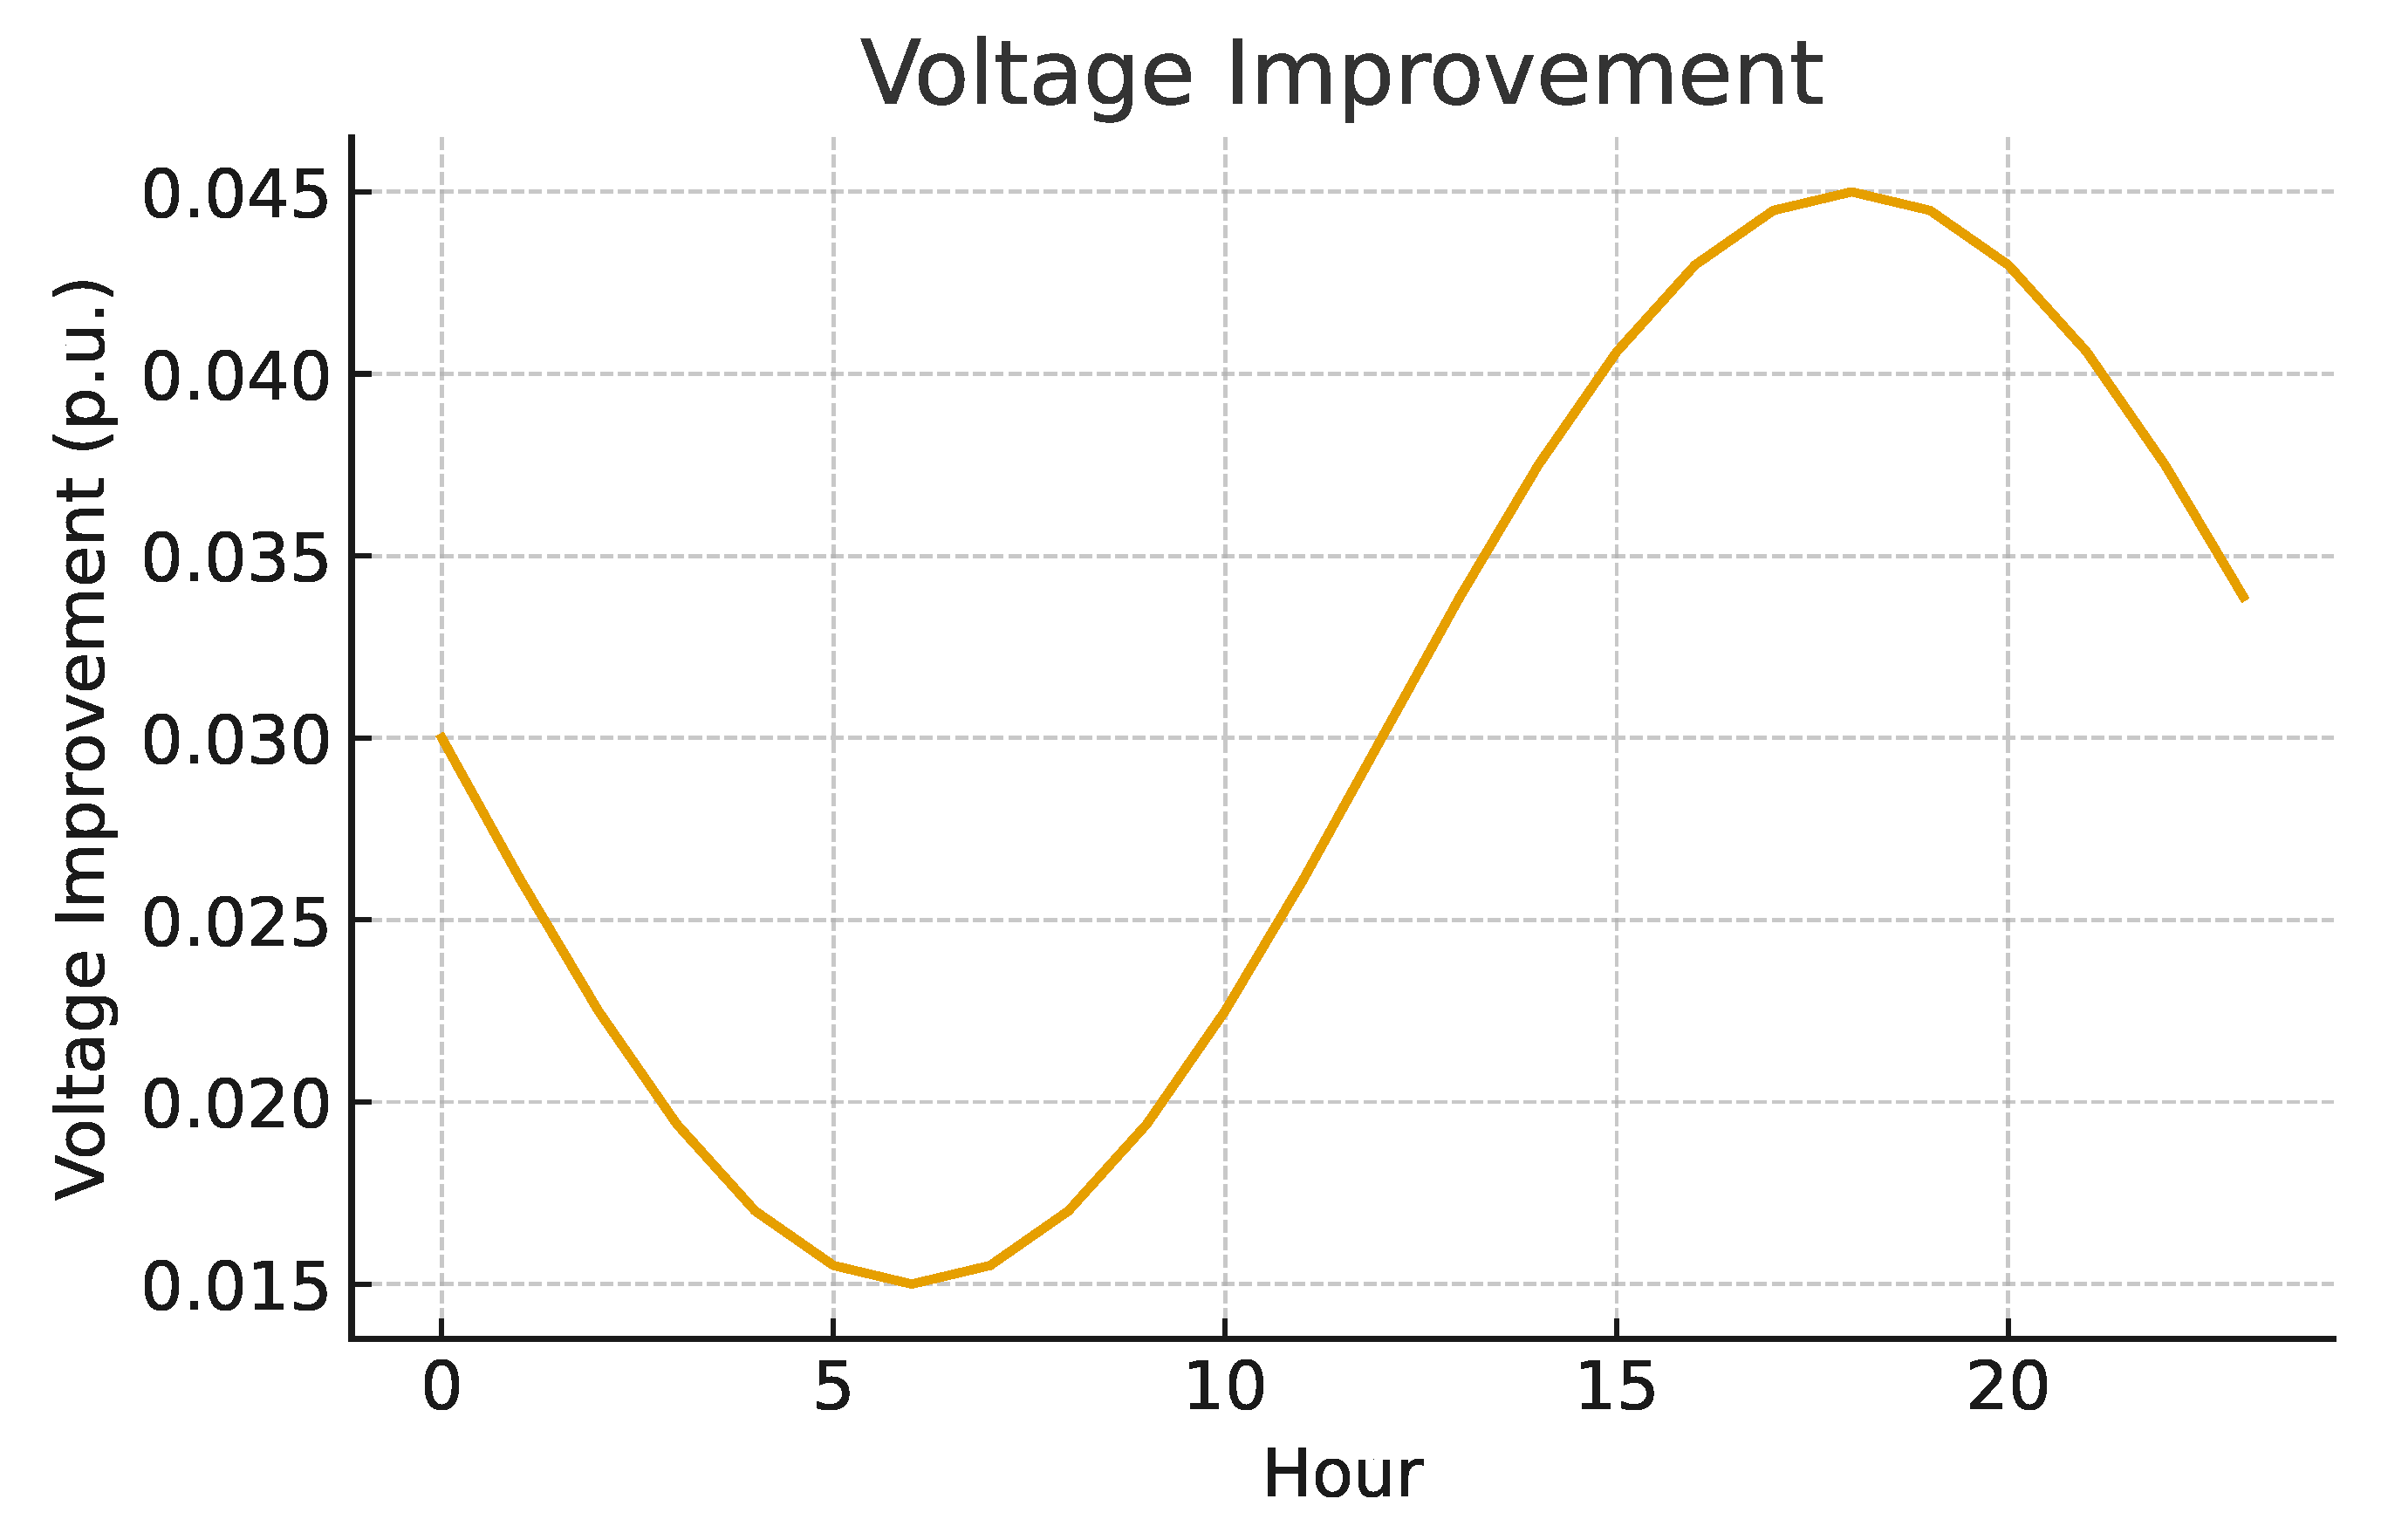
Figure 15.
Overall system stability index (VSI) after optimization.
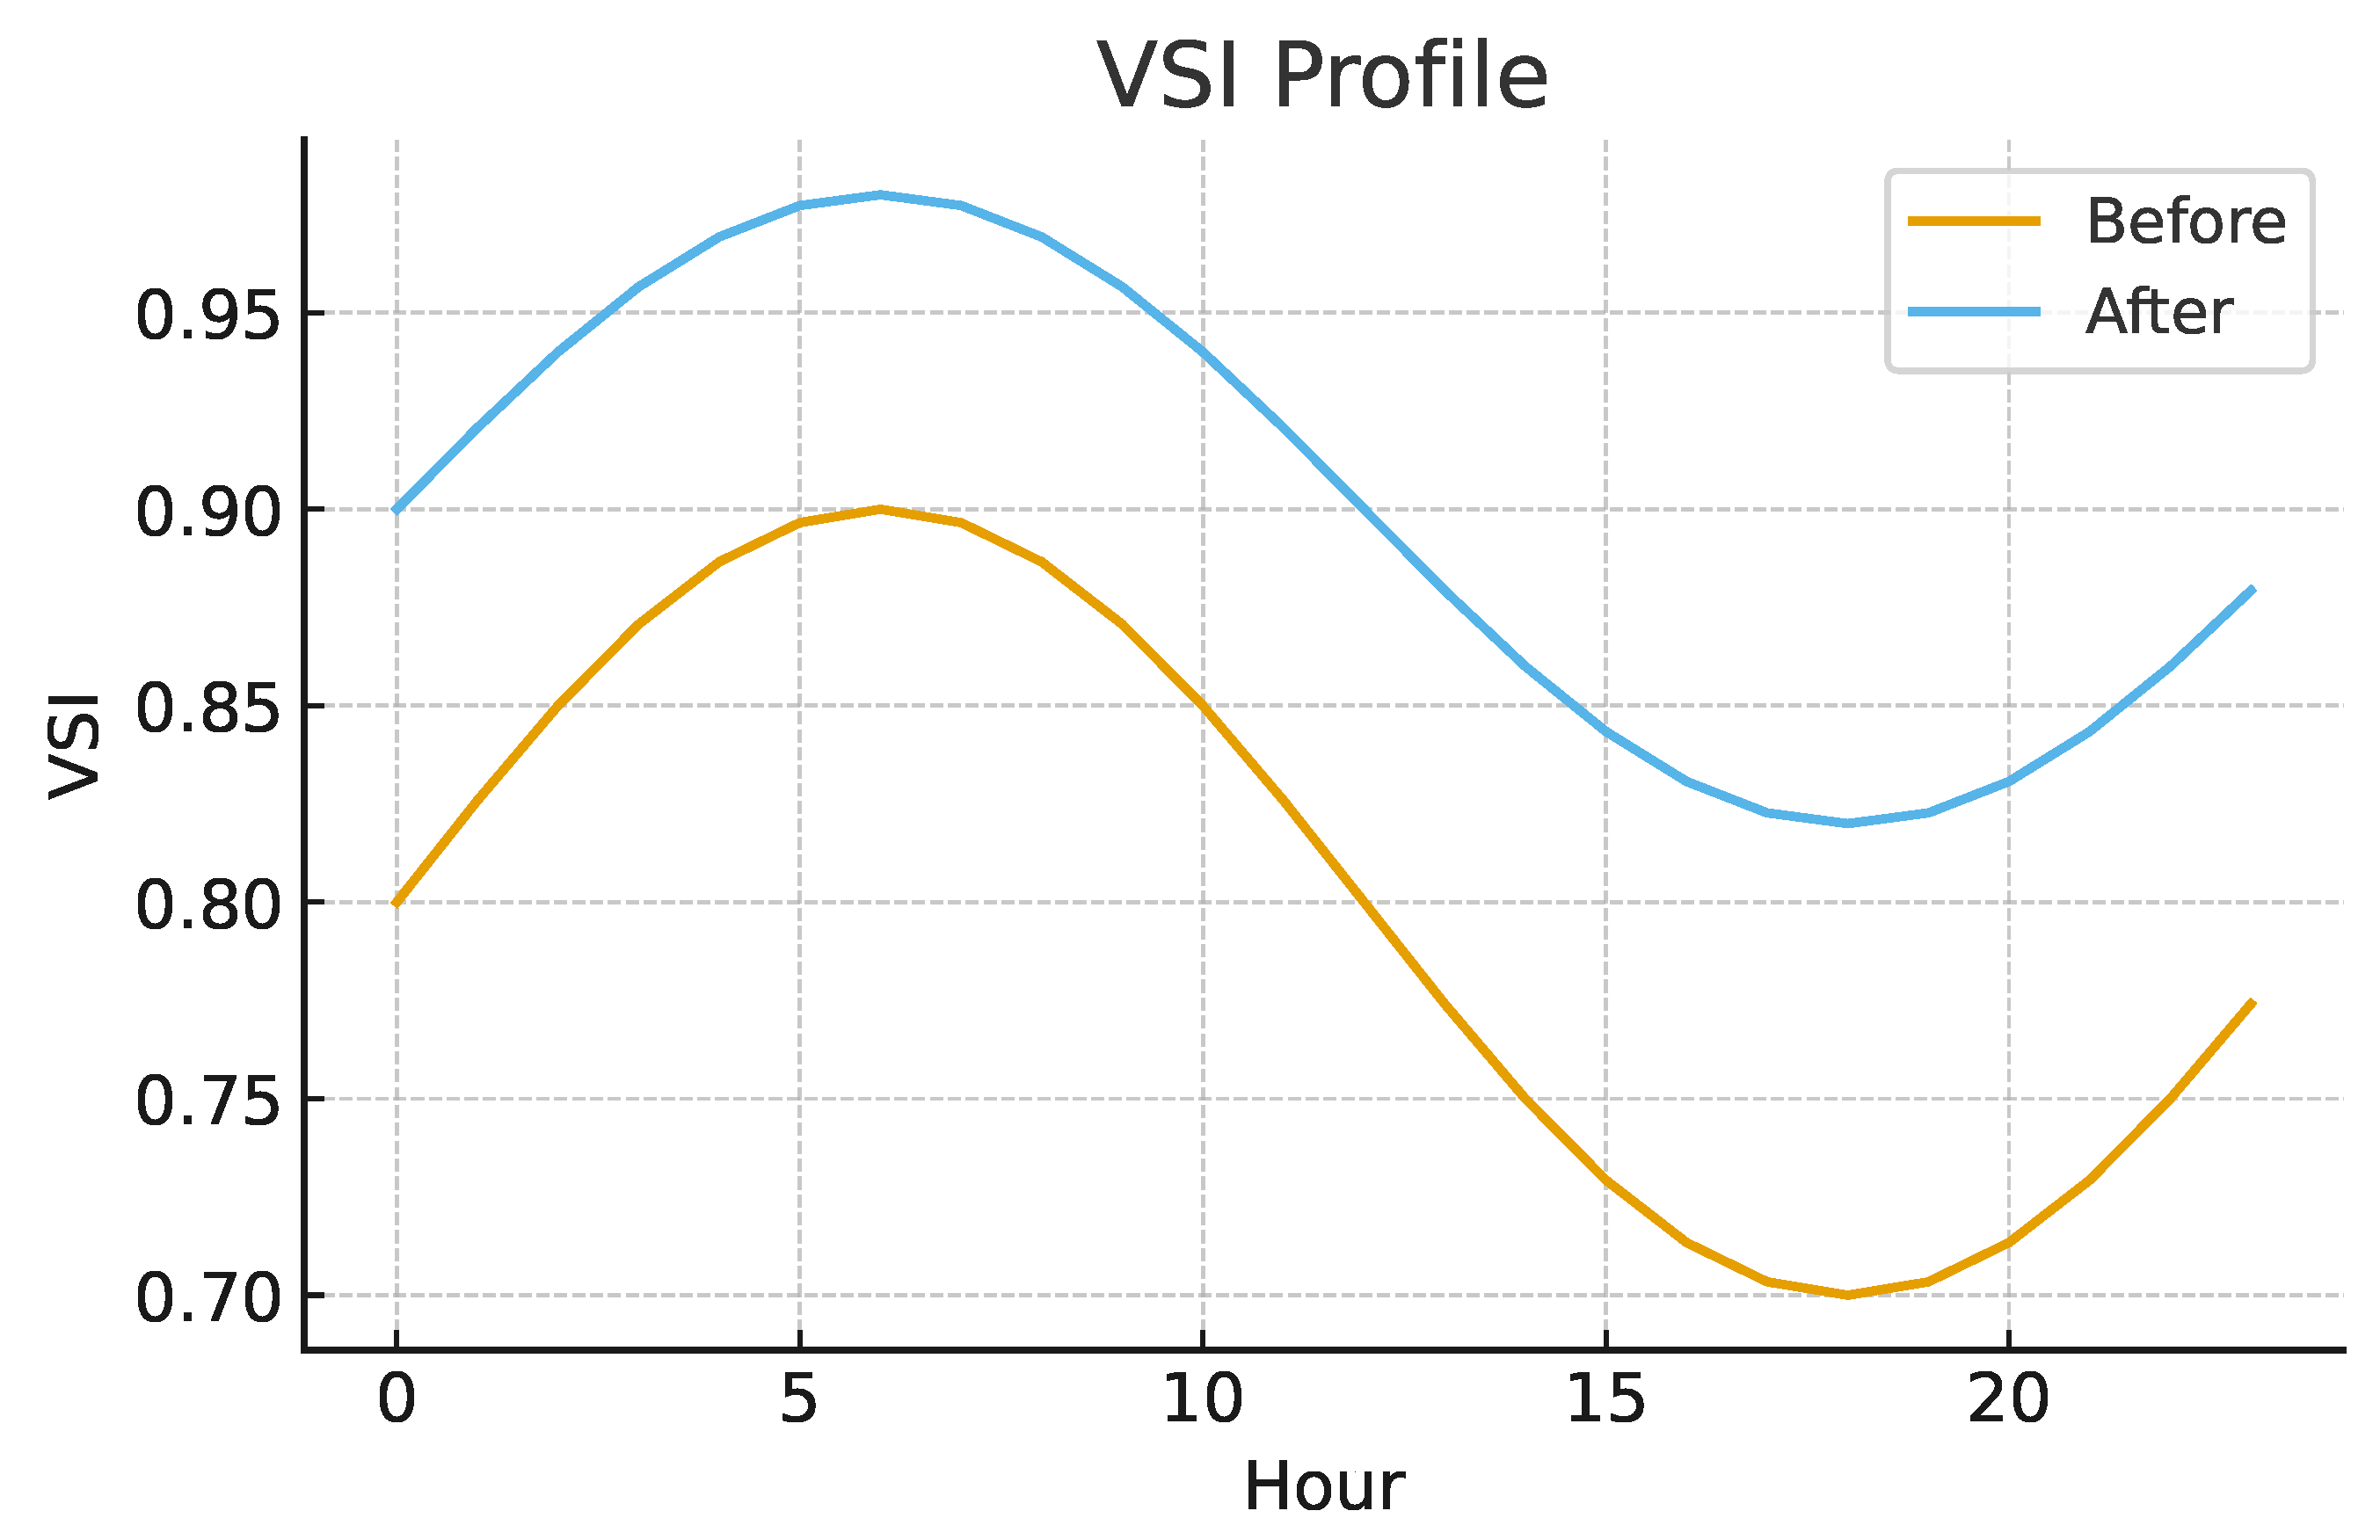
Table 2.
Summary of the main case-study parameters in the IEEE 118-bus network.
| Parameter | Description |
|---|---|
| Network type | Distribution system derived from the IEEE 118-bus test system, with an extended radial structure. |
| Number of buses | 118 buses, including load buses, distributed generation buses, and a slack bus. |
| Peak demand | Approximately , distributed among load buses. |
| Total renewable capacity | (around of peak demand). |
| PV capacity | , installed at buses 7, 14, and 30. |
| WT capacity | , installed at buses 9 and 24. |
| Nodal voltage range | – p.u. as the admissible operating band. |
| Line limits | Current limited by the thermal capacity of each distribution segment. |
| DSR scheme | Demand-side response program based on real-time pricing (RTP). |
| Analysis horizon | Daily operation with hourly resolution, evaluated over a typical year. |
Disclaimer/Publisher’s Note: The statements, opinions and data contained in all publications are solely those of the individual author(s) and contributor(s) and not of MDPI and/or the editor(s). MDPI and/or the editor(s) disclaim responsibility for any injury to people or property resulting from any ideas, methods, instructions or products referred to in the content. |
© 1996 by the authors. Licensee MDPI, Basel, Switzerland. This article is an open access article distributed under the terms and conditions of the Creative Commons Attribution (CC BY) license (https://creativecommons.org/licenses/by/4.0/).
Copyright: This open access article is published under a Creative Commons CC BY 4.0 license, which permit the free download, distribution, and reuse, provided that the author and preprint are cited in any reuse.


