Submitted:
21 November 2025
Posted:
27 November 2025
You are already at the latest version
Abstract
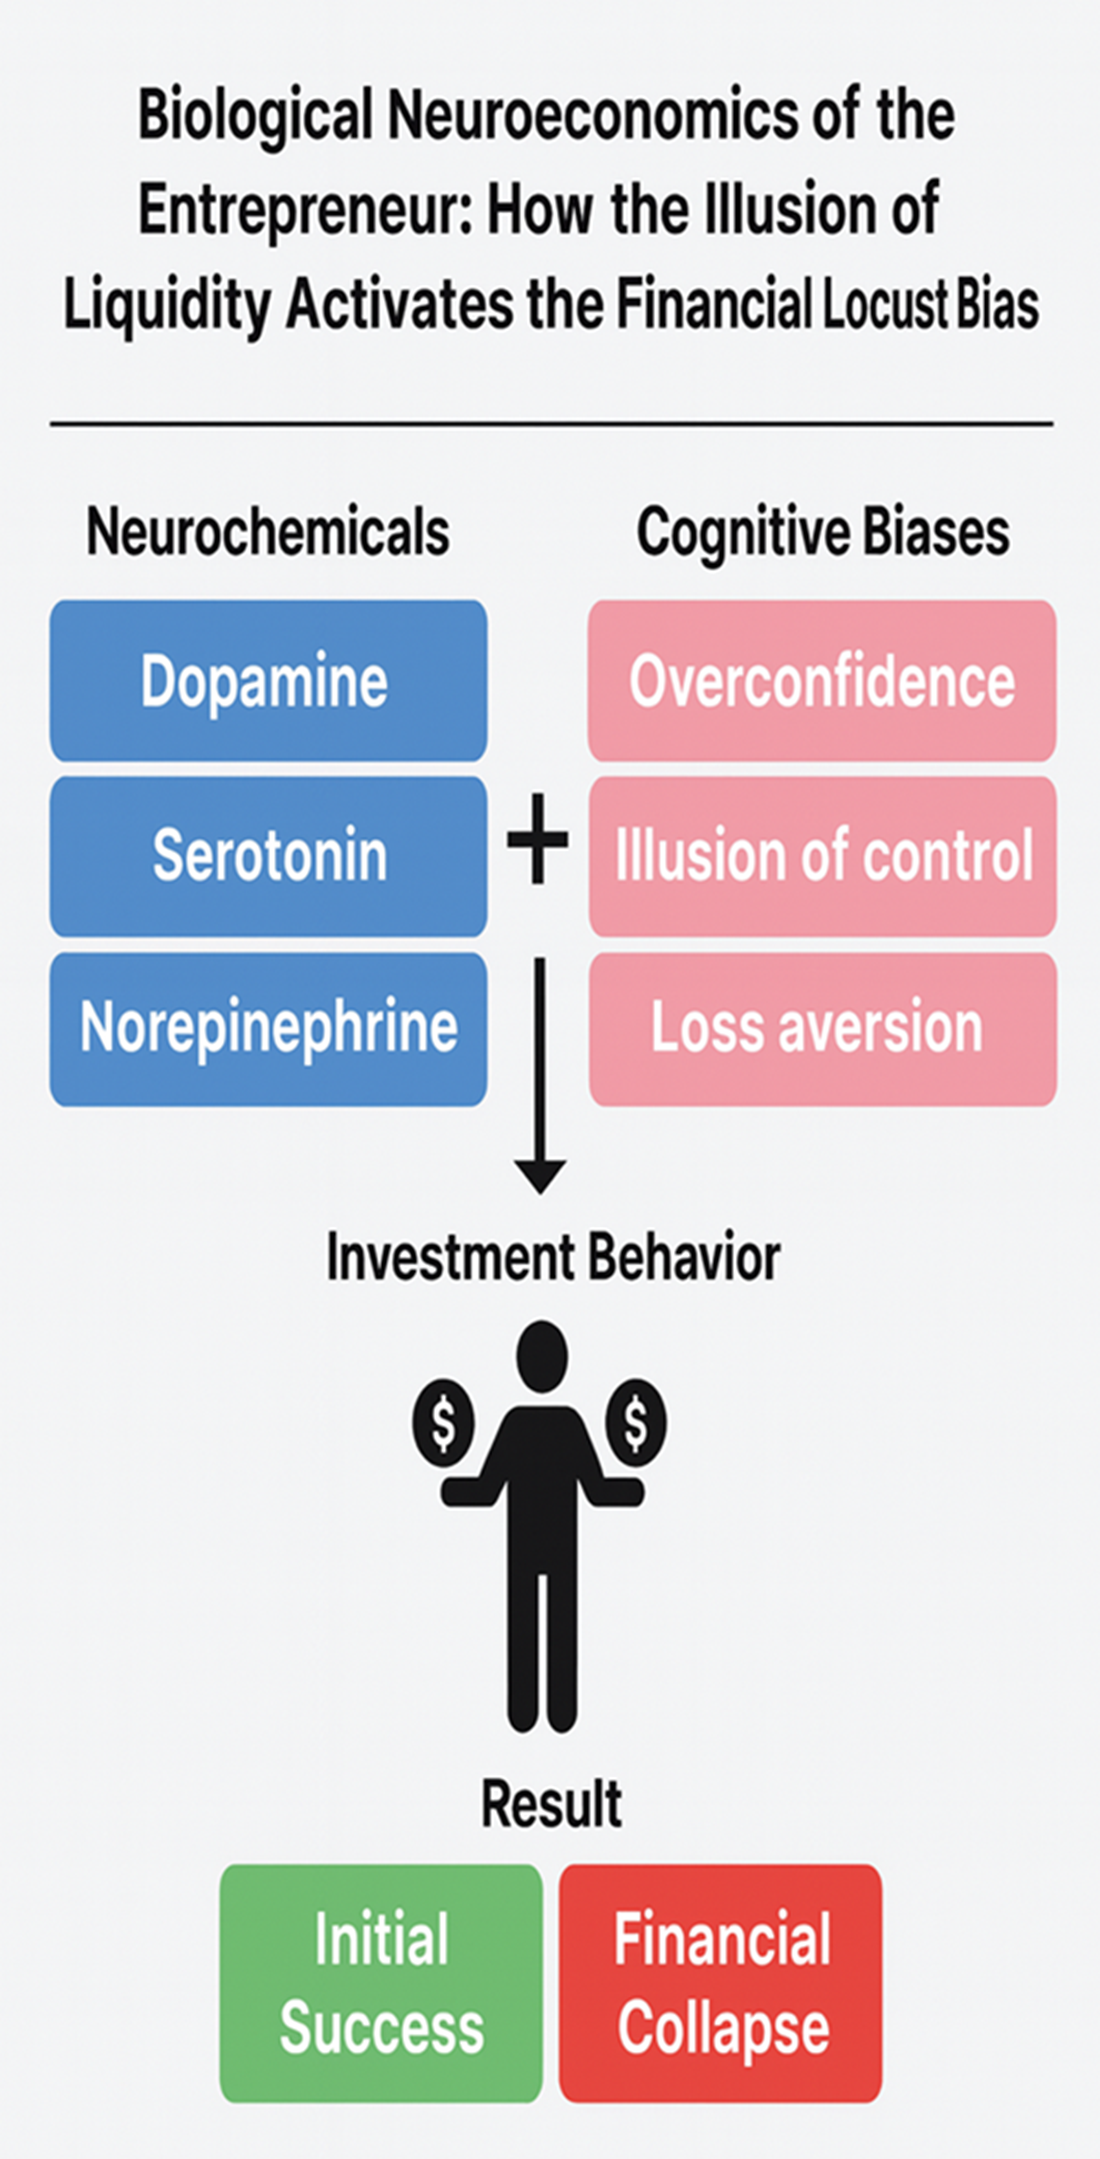
Financial decision-making among small business owners is influenced by neurobiological mechanisms and cognitive biases that heighten the risk of uncontrolled expansion, excessive leverage, and financial distress. Within a neuroeconomic framework, neurotransmitters such as dopamine, serotonin, and norepinephrine regulate liquidity perception, reward sensitivity, and risk evaluation. Dopaminergic activation after initial success reduces risk perception and fosters impulsive investments, while serotonin depletion during rapid growth weakens self-control and promotes short-term gratification. In liquidity shortages, elevated cortisol and norepinephrine impair working memory and planning, triggering emotional and reactive behavior.
These neurochemical dynamics interact with cognitive biases: overconfidence encourages excessive borrowing; the illusion of control sustains exposure to uncertainty; and loss aversion delays abandoning unprofitable projects. A review of twenty-seven studies identifies three key dimensions: the neurobiological basis of financial behavior, the cognitive mechanisms behind liquidity misperception, and mitigation strategies based on education, adaptive regulation, and predictive neuroeconomic tools.
This study introduces the Financial Locust Model, describing the shift from prudent to risk-prone entrepreneurship as the cumulative result of neurochemical imbalance and cognitive distortion. The findings highlight the need for integrative interventions combining neuroscience, behavioral insight, and policy innovation to enhance financial resilience among SMEs.
Keywords:
neuroeconomics
; behavioral finance
; cognitive biases
; liquidity perception
; financial resilience
Introduction
In the business domain, financial decision-making rarely adheres to the principles of classical rationality. A growing body of evidence suggests that such decisions are shaped by psychological and neurobiological factors that can drive unsustainable expansion strategies. In particular, small business owners—who in the early stages of their ventures tend to manage resources prudently and evaluate risks conservatively—often modify their behavior as they accumulate success and gain access to credit.
The literature in behavioral economics and neuroeconomics has documented how cognitive biases and neurochemical regulation jointly influence liquidity perception and risk assessment (Kahneman & Tversky, 1979; Glimcher & Fehr, 2013). From a neurobiological perspective, dopamine, a key neurotransmitter in the brain’s reward circuitry, rises following experiences of economic success, reinforcing self-confidence and the entrepreneurial drive for expansion (Schultz, 2016). However, this same mechanism can generate overconfidence and impulsivity in resource allocation, impairing objective risk evaluation (Kuhnen & Knutson, 2005). In parallel, serotonin, associated with self-control and long-term planning, tends to decrease during phases of accelerated growth, fostering a preference for immediate gratification over sustainable outcomes (Cools et al., 2011). Under conditions of financial stress, elevated cortisol and norepinephrine levels impair working memory and executive control, leading to emotional, short-sighted, and reactive financial decisions (Arnsten, 2009).
These neurochemical dynamics have direct parallels in the cognitive distortions extensively described in behavioral science. Overconfidence, illusion of control, and loss aversion constitute systematic biases that undermine decision-making in environments of uncertainty (Malmendier & Tate, 2005; Langer, 1975; Bazerman & Neale, 1992). The interaction between neurobiological activation and cognitive bias helps explain why some entrepreneurs, following initial success, adopt overleveraging patterns or persist in unprofitable ventures beyond rational limits.
Integrating neuroscience with financial metrics is therefore essential to understanding entrepreneurial behavior under real-world conditions. Traditional models of corporate distress—focused on liquidity ratios, leverage, and firm age—have demonstrated strong predictive value for insolvency (Altman, 1968; Ohlson, 1980; Shleifer & Vishny, 2011). However, their explanatory power remains incomplete because they overlook the neurocognitive variables that underlie financial misjudgment.
This study seeks to bridge that gap by introducing the Financial Locust Model, which conceptualizes the transition from a prudent, rational entrepreneur to an extreme risk-prone profile as the cumulative outcome of neurochemical imbalance and cognitive distortion. Through a mixed-method approach combining a systematic literature review and empirical analysis of Spanish SMEs, this research develops an integrative framework linking neurobiological mechanisms, behavioral biases, and financial indicators to explain how liquidity misperception and cognitive distortion jointly increase the likelihood of business collapse.
Literature Review
For decades, classical economics portrayed decision-makers as fully rational agents with perfect information. However, accumulating evidence from behavioral economics and neuroeconomics demonstrates that financial choices are shaped by cognitive shortcuts, affective states, and biological constraints that distort the perception of risk, reward, and—especially critical for treasury management—liquidity (Kahneman & Tversky, 1979; Glimcher & Fehr, 2013). In parallel, corporate finance research has developed a robust quantitative tradition—grounded in accounting and market data—to anticipate distress and insolvency. Yet, this tradition’s blind spot has been its tendency to treat liquidity and leverage as objective magnitudes detached from the psychological processes that generate them. Conversely, neuroscience has often struggled to translate laboratory findings into explanatory models that hold predictive value in real-world business environments. The present work situates itself precisely at this intersection.
Canonical models of business failure prediction demonstrate that combinations of liquidity, solvency, profitability, and activity ratios can anticipate bankruptcy with considerable accuracy—from Altman’s (1968) Z-Score and its SME adaptation (Altman & Sabato, 2007), through Ohlson’s (1980) logit and Zmijewski’s (1984) probit models, to Shumway’s (2001) hazard and survival approaches. Subsequent refinements identified the most predictive metrics depending on firm size and sector (Beaver, 1966; Taffler, 1983; Balcaen & Ooghe, 2006), while hybrid approaches combining accounting and market information improved risk calibration (Bharath & Shumway, 2008; Campbell et al., 2008). Within SMEs, scholars highlight the critical role of working capital management—cash conversion cycles, trade credit, and inventory policies—as the first line of defense against distress (Shin & Soenen, 1998; Petersen & Rajan, 1997). Other perspectives emphasize the financing structure under information asymmetry (Myers & Majluf, 1984) and the agency problems that arise when apparent liquidity abundance encourages investments with low net present value (Jensen, 1986; Shleifer & Vishny, 2011). Moreover, SMEs face idiosyncratic credit frictions and bank–firm relationships that condition their resilience (Berger & Udell, 1998).
Behavioral economics and neuroeconomics provide the underlying mechanism—explaining why, when, and how these same financial ratios become misaligned with reality. Dopaminergic activation during sequences of success increases risk tolerance and promotes optimistic extrapolation of returns, reducing prefrontal regulatory control and heightening impulsivity in capital allocation (Kuhnen & Knutson, 2005; Schultz, 2016). Serotonin depletion, associated with diminished self-control and temporal foresight, reinforces present bias and short-term treasury strategies that “consume” future liquidity to sustain growth (Cools et al., 2011; Robbins & Everitt, 1999). Under liquidity stress, elevated norepinephrine and cortisol levels degrade working memory and strategic reasoning, shifting decisions toward emotional and short-sighted reactions (Arnsten, 2009; McEwen, 2012). Field evidence supports these mechanisms: the physiology of stress and euphoria among traders correlates with fluctuations in risk-taking (Coates & Herbert, 2008), suggesting that neuroendocrine states modulate observable financial policies.
Cognitive biases operate as the interface between biology and accounting. Managerial overconfidence has been systematically linked to overinvestment, excessive leverage, delayed capital issuance, and persistence in low-value projects (Malmendier & Tate, 2005; Ben-David, Graham, & Harvey, 2013; Baker & Wurgler, 2002). The illusion of control fosters narratives of invulnerability—particularly under cheap credit or noisy feedback—while loss aversion drives the escalation of commitment, delaying impairment recognition and straining liquidity (Bazerman & Neale, 1992; Langer, 1975). These biases interact with structural SME frictions—information opacity, credit dependency, and limited diversification—that amplify behavioral vulnerabilities. Consequently, liquidity ceases to be a purely accounting measure and becomes a psycho-neuroeconomic construct: perceived liquidity—the amount the entrepreneur feels is available—may diverge sharply from actual liquidity, particularly in periods of euphoria or fear.
This divergence yields measurable consequences. Research on working capital shows that small policy variations in collections, payments, or inventories significantly affect cash flow and liquidity risk (Shin & Soenen, 1998). When short-term bias compounds these effects, firms exhibit a preference for financing investment through short-term debt or maintaining high cash balances that disguise accelerated turnover and fragile buffers. Leverage amplifies this distortion: when perceived liquidity is overly optimistic, additional debt appears “cheap,” until the cycle reverses and leverage itself precipitates distress (Jensen, 1986; Shleifer & Vishny, 2011). From a neuroeconomic standpoint, relationships such as present bias × current ratio or liquidity illusion × leverage are not merely statistical correlations but mechanisms—biased time preferences that modulate liquidity use and distorted liquidity perceptions that drive over-leveraging.
Methodological criticisms regarding the extrapolation of neural data to macroeconomic outcomes—the risk of reverse inference and reductionism (Gul & Pesendorfer, 2008)—remain valid. For this reason, contemporary research advocates integrative designs that combine behavioral metrics, financial ratios, and, where feasible, biological or psychometric markers, analyzed with machine-learning techniques capable of capturing nonlinearities and threshold effects (e.g., boosting, SVM, or random forests). Such frameworks test whether laboratory-identified patterns reappear in real-world decision contexts characterized by funding constraints, competition, and cyclical uncertainty.
In summary, the evidence indicates that (i) neural reward and control circuits modulate the balance between profit seeking and risk assessment; (ii) time preferences and stress physiology alter treasury discipline; (iii) cognitive biases—overconfidence, illusion of control, loss aversion—mediate the translation of these states into observable financial behaviors; and (iv) classical distress metrics for SMEs (current liquidity, cash ratio, leverage, size, age) capture fragments of these dynamics but not their origin. This explanatory gap motivates the Financial Locust Model, which interprets the transition from a prudent entrepreneur to an extreme risk-seeking profile as the cumulative outcome of neurochemical imbalances and cognitive distortions—manifested in specific, measurable configurations of financial ratios. Accordingly, the study’s hypotheses—focused on liquidity misperception and its interaction with leverage and time horizon—represent testable predictions of when and how accounting indicators cease to reflect economic reality and instead become distorted mirrors of the decision-maker’s psychobiology.
Hypothesis
General Hypothesis (H1)
Liquidity misperceptions—shaped by neurochemical dynamics and cognitive biases—drive small business owners toward uncontrolled expansion and excessive leverage, increasing the probability of financial distress.
1. Dopamine and Overconfidence in Business Expansion
H1.1Elevated dopamine levels during periods of financial success heighten reward sensitivity and overconfidence, diminishing risk perception and promoting impulsive investment behavior (Schultz, 2016; Kuhnen & Knutson, 2005).
H1.2Overactivation of the dopaminergic reward system attenuates prefrontal regulatory control, shifting decision-making toward immediate gratification and short-term returns (Cools et al., 2011).
These mechanisms suggest that neurochemical surges linked to success can biologically amplify optimism bias, leading entrepreneurs to overestimate their ability to sustain growth and underweight future liquidity constraints.
2. Serotonin and Self-Control in Financial Management
H2.1Reduced serotonin availability diminishes self-control and increases risk-taking propensity, favoring expansion strategies that neglect long-term sustainability (Carver & White, 1994).
H2.2In prolonged success scenarios, sustained serotonin depletion reinforces impulsivity and short-term focus, producing financial myopia and premature reinvestment of cash flows (Robbins & Everitt, 1999).
Serotonergic dysregulation thus explains the erosion of temporal foresight and strategic discipline in entrepreneurial finance, aligning biological impulsivity with behavioral short-termism.
3. Norepinephrine, Financial Stress, and Impulsive Decision-Making
H3.1Under liquidity crises, activation of the hypothalamic–pituitary–adrenal (HPA) axis and increased cortisol–norepinephrine release impair working memory and cognitive flexibility, constraining rational risk evaluation and fostering reactive financial behavior (Arnsten, 2009; McEwen, 2012).
H3.2Amygdala hyperactivation under stress conditions suppresses prefrontal modulation, intensifying fear-driven decision-making and increasing the likelihood of panic-induced or irrational financial actions (Phelps et al., 2014).
These mechanisms illustrate how neuroendocrine stress responses transform acute liquidity pressures into maladaptive behaviors, leading to abrupt retrenchment, fire sales, or self-reinforcing debt cycles.
4. Cognitive Biases and the Misperception of Liquidity
H4.1Overconfidence causes entrepreneurs to overestimate their managerial ability and underestimate financial risks, resulting in expansion and investment decisions lacking rigorous analysis (Kahneman & Tversky, 1979).
H4.2The illusion of control intensifies with access to cheap credit, reinforcing the belief that external economic conditions are manageable and encouraging excessive risk-taking (Langer, 1975).
H4.3Loss aversion and escalation of commitment inhibit recognition of early distress signals, prolonging failed investments even when losses are evident (Bazerman & Neale, 1992).
Cognitive distortions operate as the behavioral interface of neurobiological imbalances: overconfidence mirrors dopaminergic overstimulation; illusion of control parallels prefrontal dysregulation; and loss aversion correlates with amygdala-driven stress responses. Together, they perpetuate liquidity misperceptions and delay corrective actions.
Conceptual Framework
Financial decision-making has traditionally been studied through the lens of classical economics, which assumes that individuals act as rational agents who maximize utility using complete information and logical processes. However, evidence from behavioral and neuroeconomic research demonstrates that entrepreneurs, like all economic actors, make decisions under the influence of emotional factors, cognitive biases, and neurobiological mechanisms that distort perceptions of risk and liquidity (Glimcher & Fehr, 2013).
Neuroeconomics—an interdisciplinary field integrating economics, psychology, and neuroscience—has identified specific brain circuits underlying financial behavior. The dorsolateral prefrontal cortex regulates strategic planning and inhibits impulsive responses; the nucleus accumbens mediates reward and motivation; the amygdala processes emotional reactions to threats; and the insula participates in risk evaluation. Increased dopamine release in the nucleus accumbens following financial success reinforces feelings of invulnerability, diminishing risk perception and encouraging riskier financial decisions (Schultz, 2016). Excessive dopaminergic activity, in turn, weakens prefrontal control, thereby reducing self-correction capacity and enhancing impulsivity (Kuhnen & Knutson, 2005).
In parallel, serotonin plays a central role in regulating self-control and long-term planning. Serotonin depletion favors a preference for immediate rewards, resulting in riskier business strategies during prosperous periods (Cools et al., 2011). Under liquidity crises, activation of the hypothalamic–pituitary–adrenal (HPA) axis elevates cortisol and norepinephrine, impairing working memory and transferring executive dominance to the amygdala, which intensifies fear-driven, reactive responses (Arnsten, 2009; Phelps et al., 2014).
These neurochemical mechanisms interact with well-documented cognitive biases in behavioral economics. Overconfidence leads entrepreneurs to overestimate their managerial competence and underestimate risk, facilitating overleveraging and speculative investment (Kahneman & Tversky, 1979). The illusion of control, amplified by credit availability, reinforces the belief that external market variables can be mastered (Langer, 1975). Meanwhile, loss aversion and the escalation of commitment delay corrective action, prolonging unprofitable ventures despite clear signals of distress (Bazerman & Neale, 1992).
The interaction between neurobiological and cognitive factors produces a predictable trajectory: the initially cautious entrepreneur, reinforced by dopaminergic feedback and early success, develops overconfidence and accelerates expansion. As liquidity deteriorates, stress-induced neurochemical responses promote emotional and short-sighted decisions that exacerbate financial fragility. This cyclical sequence—success → overexpansion → collapse—constitutes the foundation of the Financial Locust Model.
Empirical results from the analysis of 999 Spanish firms support this interpretation. Linear econometric models (Logit, OLS) exhibited low predictive power (AUC ≈ 0.51; R² < 0.03), whereas non-linear machine-learning algorithms such as XGBoost and Support Vector Machines (SVM) captured meaningful interactions between cognitive biases and financial ratios. In particular, the present bias × current ratio interaction proved predictive, while individual biases alone lacked statistical significance. Subgroup analysis revealed structural heterogeneity: large and younger firms achieved higher predictive performance (AP ≈ 0.57; AUC ≈ 0.54), whereas mature firms displayed results close to randomness. These findings confirm that cognitive biases do not operate in isolation but rather as modulators of the broader financial context.
Understanding this conceptual framework clarifies why liquidity misperception and excessive optimism are not random deviations but the expected outcomes of the interaction between neurobiological processes and cognitive distortions. From an applied standpoint, this emphasizes the need for financial education policies, behaviorally informed credit regulation, and AI-based decision-support tools capable of mitigating the neurocognitive distortions that underlie irrational financial behavior in small and medium-sized enterprises.
Methodology
Data and Sample
The empirical evidence for this study was drawn from the Iberian Balance Sheet Analysis System (SABI, Bureau van Dijk), complemented by macroeconomic data from the Bank of Spain, the National Statistics Institute (INE), and Eurostat.
The final sample comprised 999 Spanish firms observed between 2000 and 2024, selected through a stratified random procedure to ensure sectoral diversity and to minimize concentration bias.
The sample includes industry, services, trade, construction, and agriculture; approximately 70 percent are SMEs and 30 percent are large corporations, with a balanced distribution between young firms (less than 10 years old) and mature firms (10 years or more).
The following financial ratios were calculated directly from firms’ balance sheets:
- Current Ratio (CR)
- CR = Current Assets / Current Liabilities
- Cash Ratio (CAR)
- CAR = Cash and Equivalents / Total Liabilities
- Leverage (LEV)
- LEV = Total Liabilities / Total Assets
- Firm Size (SIZE) = Number of employees reported on the balance sheet
- Firm Age (AGE) = Years since the company’s incorporation
Behavioral and Cognitive Proxies
Following behavioral-finance literature, several variables were constructed to capture cognitive distortions observable through financial statements.
1. Illusion of Liquidity (ILQ)
ILQ = (CR – CAR) / CR
This indicator measures the gap between apparent and real liquidity. A higher ILQ reflects a wider difference between “visible” cash and actual available liquidity.
2. Present Bias (PB)
PB = Short-Term Debt / Total Debt
High PB values indicate preference for short-term financing and time myopia (Laibson, 1997).
3. Overconfidence (OC)
OC = ΔLEV / ROA₍ₜ₋₁₎
where ΔLEV represents the annual change in leverage and ROA₍ₜ₋₁₎ is the return on assets in the previous period.
An increase in debt not justified by past profitability reveals overconfidence (Malmendier & Tate, 2005).
4. Commitment Escalation (CE)
CE = Total Debt₍ₜ₎ / Total Debt₍ₜ₋₁₎ (conditioned on ROA₍ₜ₎ < 0)
When a firm increases its debt while showing losses, it signals escalation of commitment (Bazerman & Neale, 1992).
These behavioral constructs link neuroeconomic mechanisms (dopamine, serotonin, cortisol) with quantifiable financial metrics, integrating cognitive-bias theory into standard models of business distress (Altman, 1968; Ohlson, 1980; Shumway, 2001).
Empirical Design
The analytical design was organized in sequential phases to test the hypotheses and evaluate the predictive capacity of the Financial Locust Model (FLM).
-
Linear Econometric ModelsBaseline estimations used Ordinary Least Squares (OLS), logistic regression, and probit models—standard techniques in distress prediction—to estimate the direct effect of financial ratios and behavioral proxies on the probability of corporate default.
-
Regularization and Variable SelectionThe Least Absolute Shrinkage and Selection Operator (LASSO) was applied to address multicollinearity, identify the most informative predictors, and reduce overfitting.
-
Non-Linear Machine-Learning AlgorithmsTo capture complex interactions and threshold effects, the study implemented Random Forest (RF), Extreme Gradient Boosting (XGBoost), and Support Vector Machines (SVM).In addition, Partial Least Squares (PLS) analysis was conducted to explore latent structures between neuroeconomic and financial constructs, enabling an integrated behavioral-financial interpretation.
-
Statistical RobustnessA 10-fold cross-validation combined with 1,000 bootstrap replications tested coefficient stability and model consistency under sampling variability.Hypotheses were considered supported when sign consistency and statistical significance (p < 0.05) appeared in at least two linear models and one non-linear algorithm.
-
Predictive Performance EvaluationModel performance was assessed along three complementary dimensions—discrimination, calibration, and global fit—using the following metrics:
- o
- Area Under the ROC Curve (AUC): Discriminative capacity.
- o
- Average Precision (AP): Performance in unbalanced-class datasets.
- o
- Brier Score: Accuracy of probabilistic calibration.
- o
- R² and pseudo-R²: Indicators of overall model fit.
-
Subgroup AnalysisTo examine heterogeneity, the sample was divided by firm size and age—SMEs vs. large firms and young vs. mature organizations.Results showed that cognitive biases interact differently with financial variables depending on a firm’s structure, life-cycle stage, and strategic orientation, reinforcing the behavioral underpinnings of the Financial Locust Model.
Operationalization of Variables
All variables employed in the empirical analyses were defined and operationalized according to their concept, data source, and expected sign, as summarized in Table 1.
This table provides a structured reference for replication and further studies on the behavioral-financial dynamics captured by the Financial Locust Model.
Methodological Note
The core financial variables—liquidity ratio, cash ratio, leverage, firm size, and firm age—were extracted directly from the Iberian Balance Sheet Analysis System (SABI, Bureau van Dijk) and cross-validated with official data from the Spanish Companies Registry.
The dependent variable, financial distress, was operationalized as a binary indicator that takes the value 1 when a firm exhibits signs of financial difficulty—such as accumulated losses, negative coverage ratios, or formal bankruptcy proceedings—and 0 otherwise.
From these fundamental indicators, several behavioral-bias proxies were derived:
-
Illusion of Liquidity (ILQ)Operationalized as the discrepancy between recorded accounting liquidity and actual cash availability, estimated through the residuals of regression models adjusted for standard liquidity ratios.This proxy captures the cognitive distortion in perceiving solvency based on visible balances rather than real cash-flow capacity.
-
Present Bias (PB)Measured as the relative weight of short-term debt within total debt, under the behavioral assumption that higher short-term indebtedness reflects a preference for immediacy and underestimation of long-term risk.This approach follows the temporal-discounting framework established in behavioral economics (Laibson, 1997).
-
Financial Literacy (FL)Modeled as a latent construct approximated by the consistency between treasury-management decisions and long-term sustainability metrics.The estimation procedure follows the OECD (2016) methodological framework for assessing financial competence.
To control for exogenous influences, macroeconomic variables were incorporated—specifically GDP growth, inflation rate, and interest-rate trends—sourced from the National Statistics Institute (INE) and the Bank of Spain.
Including these controls mitigates omitted-variable bias by isolating the impact of firm-level behavioral and financial factors from the broader economic environment.
To ensure the robustness of the econometric specifications, multicollinearity diagnostics were conducted using the Variance Inflation Factor (VIF).
As shown in Figure 1, all predictors exhibit VIF values below the critical threshold of 5, confirming the absence of severe multicollinearity.
This result supports the statistical validity of the estimated coefficients and confirms that each explanatory variable contributes independently to the model’s predictive power.
Correlation Analysis
To further examine the interrelationships between financial indicators and behavioral proxies, a correlation heat map was developed (see Figure 2).
This visualization enables an intuitive assessment of both the magnitude and direction of associations among the variables incorporated into the Financial Lobster Model (FLM).
The heat map results confirm a generally low degree of multicollinearity among predictors, indicating that the financial and behavioral dimensions capture distinct and complementary constructs within the empirical framework.
Nonetheless, several statistically meaningful relationships were observed:
- Liquidity Illusion and Leverage:
- A moderate positive correlation suggests that firms with higher debt levels tend to overestimate their liquidity, consistent with the behavioral-finance perspective that links overconfidence and risk misperception to excessive leverage.
- Present Bias and Current Ratio:
- A significant association indicates that firms displaying a stronger preference for short-term commitments tend to maintain tighter liquidity margins, reflecting a behavioral trade-off between immediacy and long-term sustainability.
Overall, these relationships reinforce the central premise
of this research: cognitive and perceptual biases systematically shape
corporate financial-structure decisions, influencing liquidity management and debt dynamics in ways that deviate from purely rational optimization.
Results
The review of the scientific literature confirms the presence of neurochemical patterns and cognitive biases that distort liquidity perception among entrepreneurs and small business owners. However, when these hypotheses were empirically tested using a sample of 999 companies, the results revealed a more complex reality: biases and neurochemical markers do not operate as isolated predictors of financial distress, but instead act as interactive modulators influencing the effect of traditional financial ratios.
Descriptive Analysis
As an initial step, the distributions of all financial and behavioral variables were examined using histogram and kernel density estimation (KDE) plots. These graphs provide an overview of the structural and behavioral characteristics of the sample and enable the identification of outliers or concentration patterns.
As shown in Figure 3, Figure 4, Figure 5, Figure 6, Figure 7, Figure 8 and Figure 9, liquidity ratios exhibit an approximately uniform distribution, indicating that firms are relatively balanced in their liquidity management across the sample. In contrast, the behavioral proxies (Illusion of Liquidity and Present Bias) show bimodal distributions, with extreme clustering at values 0 and 1—consistent with their dichotomous behavioral construction, which classifies firms as either biased or unbiased in their perception of liquidity and temporal decision-making.
Firm-level structural variables—age and size (number of employees)—display heterogeneous, non-normal distributions, reflecting the structural diversity of Spanish firms included in the sample. The range of firm ages (0–70 years) and firm sizes (up to 150 employees) confirms that the dataset captures both young ventures and mature enterprises, ensuring external validity and representativeness.
Dependent Variable: Financial Distress
The dependent variable, financial distress, was operationalized as a binary indicator taking the value 1 when firms exhibited signs of financial instability—such as sustained losses, negative coverage ratios, or formal insolvency proceedings—and 0 otherwise.
The distribution analysis of this variable revealed a balanced sample composition, with 51.4% of firms classified as financially distressed and 48.6% as stable (see Figure 10 and Figure 11). This slight asymmetry is within the acceptable range for applying supervised classification models without the need for data resampling or synthetic balancing techniques (such as SMOTE).
This distribution also supports the statistical robustness of the subsequent analyses, as both categories are sufficiently represented to ensure reliable model calibration and evaluation in predictive algorithms (e.g., logistic regression, Random Forest, and XGBoost).
Multivariate Dispersion Analysis
In addition to the overall distribution of distressed and non-distressed firms (see Figure 12 and Figure 13), a dispersion matrix was constructed to visualize the joint distribution of the main financial ratios and behavioral proxies (Figure 12).
This multivariate visualization facilitates the detection of structural relationships and nonlinear dependencies among variables that may not be evident through simple correlation metrics.
Color differentiation by the variable distress_flag_alt (blue = non-distressed, orange = distressed) reveals several notable patterns.
Firms classified as financially distressed tend to exhibit greater dispersion in leverage, indicating heterogeneous debt management behaviors and inconsistent capital structures. Moreover, a more pronounced clustering pattern is observed in the Illusion of Liquidity dimension, suggesting that distressed firms frequently overestimate their liquidity position, consistent with the behavioral mechanisms hypothesized in the Financial Lobster Model.
These patterns reinforce the premise that financial vulnerability arises from the interaction between objective financial ratios and subjective cognitive biases. Rather than functioning as isolated predictors, biases such as illusory liquidity and present bias amplify systemic fragility by distorting managerial perception of solvency and liquidity thresholds.
Univariate Analysis: Financial and Behavioral Indicators
To analyze univariate differences between solvent and distressed firms, boxplots were constructed for the main financial and behavioral variables (Figure 13, Figure 14, Figure 15, Figure 16, Figure 17, Figure 18 and Figure 19).
These visualizations provide an intuitive assessment of the variability and central tendency of key indicators, as well as potential asymmetries in their distributions across the two groups.
The results reveal that distressed firms exhibit greater dispersion in leverage and firm size, suggesting structural heterogeneity and a wider spectrum of risk exposure. Liquidity ratios (cash ratio and current ratio) also show more variability among distressed firms, reflecting inconsistent short-term solvency management. Conversely, non-distressed firms display narrower interquartile ranges, indicative of more stable liquidity and debt policies.
Firm age tends to be lower in distressed firms, supporting the hypothesis that organizational maturity contributes to financial resilience. Younger companies, often characterized by more aggressive expansion and lower capitalization, appear more vulnerable to liquidity shocks and debt mismanagement.
In contrast, behavioral proxies—Illusion of Liquidity and Present Bias—show homogeneous and highly concentrated distributions across both classes. This uniformity indicates that the influence of these biases does not manifest independently, but rather interacts non-linearly with financial ratios, a relationship later confirmed through the machine-learning models discussed in Section 4.
Econometric and Machine Learning Results
The econometric and machine learning models applied to the sample of 999 companies made it possible to empirically test the proposed neurobehavioral hypotheses of the Financial Lobster Model.
Figure 1 summarizes the coefficients, significance levels, and relative weights of the key variables, revealing notable differences between linear and nonlinear approaches. While in traditional econometric models (OLS, Probit) the proxies for cognitive biases did not reach strong statistical significance, in nonlinear algorithms such as XGBoost and SVM they emerged as relevant predictors through interaction with financial ratios, confirming that their effect is not direct but modulatory.
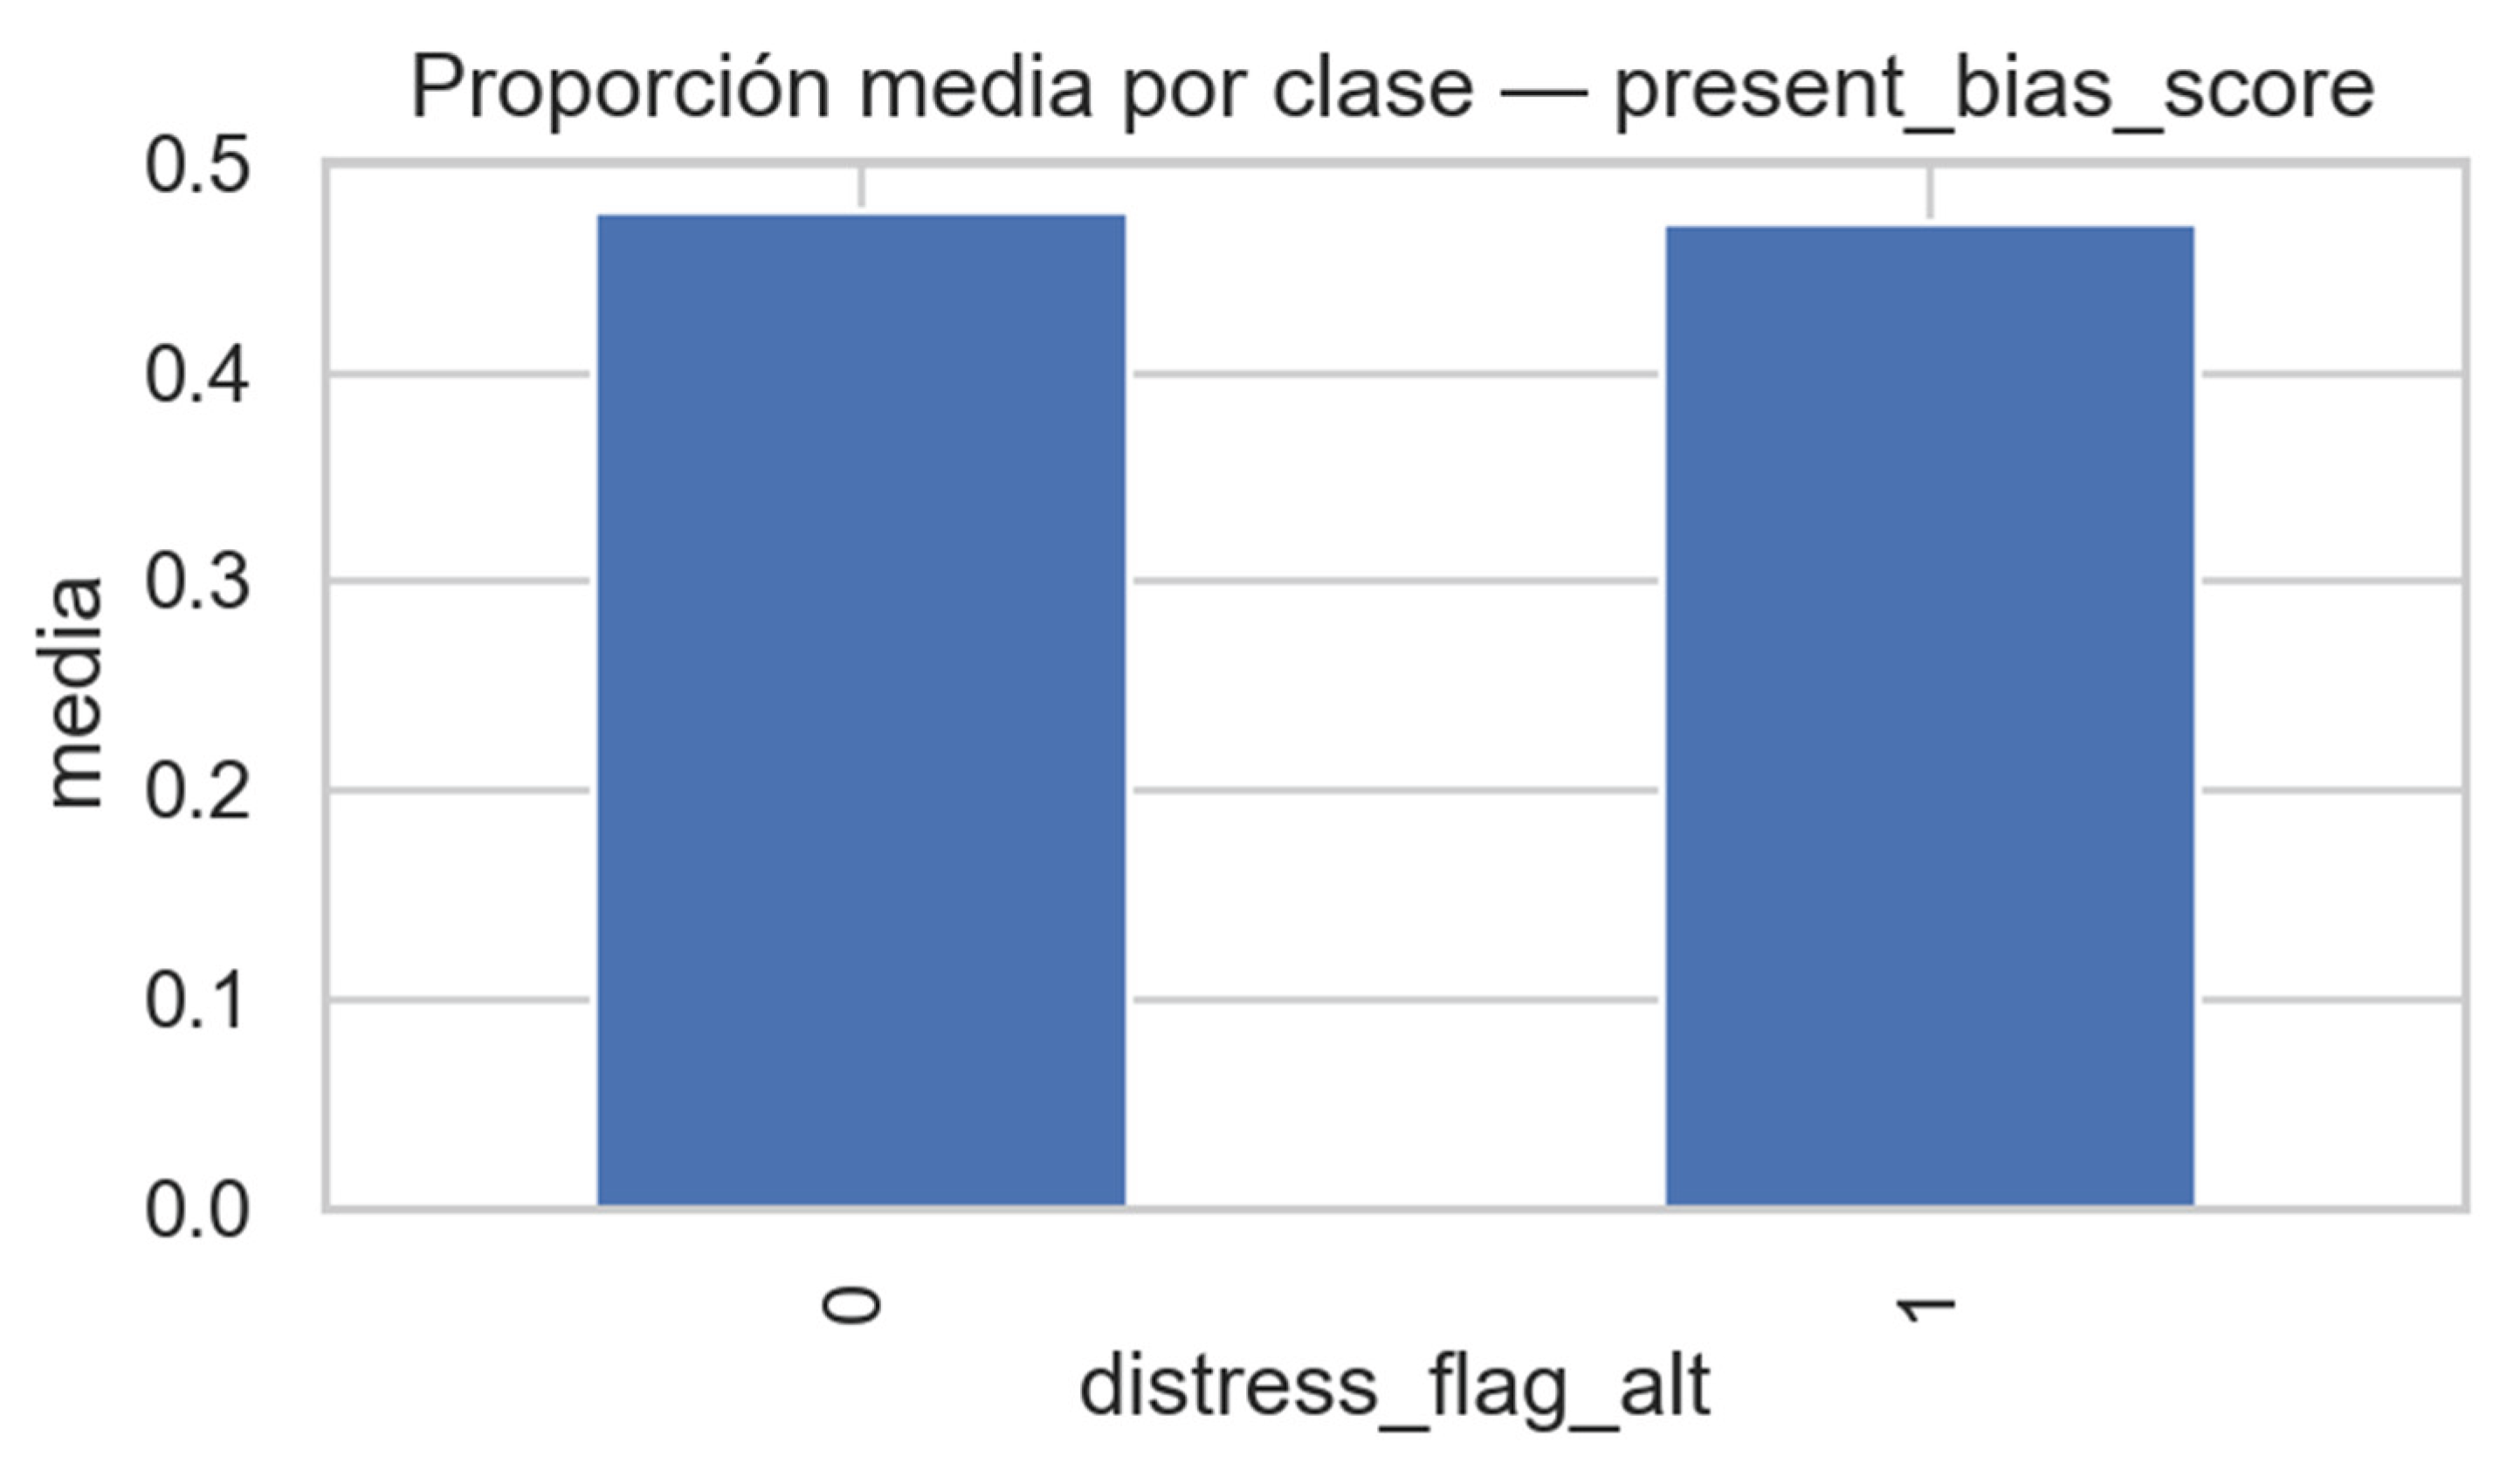
To preliminarily explore the relationship between behavioral biases and the likelihood of financial distress, the mean distributions of the behavioral variables were analyzed.
Figure 20 shows the mean distribution of the Illusion of Liquidity Score by financial-distress class, while Figure 21 presents the mean distribution of the Present Bias Score. In both cases, solvent (0) and distressed (1) firms display similar mean values, indicating that these biases do not exert a direct effect observable through simple descriptive metrics. This finding supports the hypothesis that behavioral distortions influence financial outcomes only when interacting with financial structure indicators, such as liquidity and leverage ratios.
However, when a basic Probit regression model was estimated (Figure 22), clearer and statistically significant associations emerged. The interaction between Present Bias and Current Ratio produced a positive coefficient, implying that firms with a high orientation toward immediate rewards and relatively strong short-term liquidity are paradoxically more prone to distress. Conversely, the Illusion of Liquidity exhibited a negative standardized coefficient, suggesting that firms overestimating their liquidity tend to underestimate financial risk until it materializes at more advanced stages of financial deterioration.
These results confirm the neuroeconomic hypothesis that cognitive biases act as second-order modulators of financial behavior, shaping decision patterns through their interaction with structural financial variables rather than functioning as isolated predictors. This integrative interpretation provides a behavioral-cognitive foundation for the machine learning models developed later, where such non-linear interactions are captured more effectively.
Preliminary Visualization of Behavioral Biases
To preliminarily illustrate the distribution of behavioral biases in the sample, scatter plots were constructed by financial-distress group.
Figure 23 shows the distribution of the Illusion of Liquidity Score across solvent (0) and distressed (1) firms, while Figure 24 depicts the Present Bias Score under the same classification.
Both biases display a binary pattern (values clustered at 0 and 1), reflecting the dichotomous operationalization used in the model.
The absence of marked visual differences between solvent and distressed companies suggests that these behavioral traits do not manifest as direct, observable gaps in descriptive data.
This lack of clear separation reinforces the need for econometric and machine learning approaches capable of capturing their interactive and non-linear effects on financial vulnerability.
Econometric and Machine Learning Estimation Results
The econometric and machine learning models applied to the sample of 999 companies allowed the empirical testing of the proposed neurobehavioral hypotheses. Table 2 summarizes the coefficients, significances, and relative weights of the key variables, revealing consistent yet nuanced differences between linear and nonlinear approaches.
In classical linear models (OLS and Probit), cognitive biases such as the Illusion of Liquidity and Present Bias did not reach robust statistical significance, suggesting that their direct impact on financial distress is limited. However, in penalized and nonlinear algorithms —notably LASSO, Random Forest, and XGBoost— these biases emerged as relevant interactive predictors, particularly when combined with financial ratios such as leverage and current ratio. This finding supports the notion that behavioral biases operate as modulators rather than primary drivers of financial vulnerability.
Figure 25 displays the standardized coefficients estimated through the OLS model, showing a weak but positive effect of leverage and the interaction between Present Bias and Current Ratio on the probability of distress.
In contrast, Figure 26 illustrates the LASSO coefficients, where the regularization process highlights Current Ratio, Leverage, and Firm Size as dominant predictors, while still preserving modest contributions from Illusion of Liquidity and Present Bias.
The convergence of results across econometric and machine learning frameworks confirms that while traditional liquidity indicators remain central, behavioral distortions amplify their impact under specific financial structures, validating the behavioral-financial integration proposed in the Financial Lobster Model.
Advanced Machine Learning Results
In the case of the Support Vector Machine (SVM) model, the relative importance of variables calculated using the permutation method (Figure 27) shows a highly concentrated pattern: practically all the explanatory power falls on the size of the firm (firm_size_employees), while the rest of the predictors, including behavioral biases, present residual contributions. This result suggests that the SVM, under the conditions of the present dataset, captures very limited relationships that are highly dominated by a single structural characteristic of the firm.
In the case of the XGBoost/Gradient Boosting (XGB/GB) algorithm, the relative importance of predictors (Figure 28) confirms the preeminence of traditional financial variables such as cash ratio and leverage, followed by firm size and firm age. Interactions involving behavioral biases show intermediate weights, while the isolated bias indicators (Present Bias Score and Illusion Liquidity Score) display limited individual influence. These findings suggest that, although the behavioral dimension provides additional explanatory value, the structural financial characteristics remain the main determinants of predictive power in boosting-based models.
Model Calibration and Predictive Reliability
To evaluate the probabilistic reliability of the estimations, calibration curves were computed for all five implemented models—LASSO, LogitRidge, Random Forest (RF), Support Vector Machine (SVM), and XGBoost/Gradient Boosting (XGB). The results, shown in Figure 28, Figure 29, Figure 30, Figure 31 and Figure 32, illustrate the degree of deviation between the predicted probabilities of financial distress and the observed empirical frequencies.
Overall, the models tend to cluster around average probabilities, with moderate deviations from the diagonal reference line representing perfect calibration. The penalized linear estimators (LASSO and LogitRidge) exhibit a relatively more stable and compact adjustment, indicating superior calibration in moderate probability ranges. Conversely, the nonlinear algorithms (RF and XGB) display wider oscillations, suggesting that, although they capture complex data structures, their predicted probabilities are less reliable and prone to overfitting. The SVM model presents the most concentrated but least discriminative calibration, confirming its limited sensitivity to multivariate variability.
These findings suggest that while the behavioral-financial integration improves the explanatory coherence of the models, the predictive reliability of the algorithms must be interpreted with caution, especially when extending to out-of-sample forecasts. Future versions of the Financial Lobster Model could incorporate Bayesian or ensemble-based calibration techniques to improve the probabilistic consistency of the predictions.
As a preliminary step to estimating the models, the presence of multicollinearity between the predictors was assessed by calculating the Variance Inflation Factor (VIF). The results (Figure 33) show high values only in the interactions involving behavioral biases—specifically, the combination of present bias with the current ratio and the illusion of liquidity with leverage—while the rest of the variables remain at moderate levels. This suggests that, although there are relevant correlations between some cognitive and financial constructs, the general collinearity does not compromise the estimation of the models and is considered acceptable for subsequent analysis.
To complement this diagnostic and evaluate the stability of the estimated coefficients, a Partial Least Squares (PLS) regression model was estimated as a dimensionality-reduction approach. The standardized weights obtained (Figure 34) confirm the relevance of the liquidity ratios (current ratio and leverage) and firm size as dominant predictors, while the overall explanatory power of the model remains limited (R² = 0.010). These results reinforce the idea that linear models capture general tendencies but fail to reflect the nonlinear dynamics inherent to behavioral–financial interactions.
To examine the potential influence of behavioral biases on financial distress, a baseline Probit regression model was estimated incorporating both direct effects and interaction terms with traditional financial ratios.
As a preliminary step, descriptive comparisons were performed to assess the average distribution of cognitive bias scores between solvent and distressed firms. The results (Figure 35 and Figure 36) indicate that the illusion of liquidity tends to be slightly lower among distressed firms (Figure 35), suggesting that overconfidence in perceived liquidity may erode once financial imbalance becomes evident. Similarly, the present bias displays a small reduction in its mean value for distressed firms (Figure 36), implying that the short-term focus typical of this bias does not persist under financial tension. Although these differences are modest, they point to asymmetric behavioral responses between stable and vulnerable firms.
The results of the Probit regression with standardized coefficients are presented in Figure 37. The model highlights the interaction between present bias and current ratio as the strongest positive determinant of financial distress, reinforcing the notion that behavioral impulsivity, when combined with fragile liquidity, significantly amplifies default risk. In contrast, present bias alone exhibits a negative marginal effect, suggesting that impulsivity in isolation is not harmful unless coupled with poor liquidity management.
Additional variables such as leverage, firm size, and current ratio retain positive and moderate contributions, while the illusion of liquidity and its interaction with leverage present smaller effects. This pattern reflects a behavioral amplification mechanism, where biases interact with structural indicators to intensify financial vulnerability rather than acting as standalone predictors.
Figure 37.
Standardized coefficients of the Probit regression model. The interaction between present bias and current ratio exhibits the highest positive marginal effect on financial distress, highlighting the joint cognitive–financial influence on SME stability. Source: Author using Spyder and Anaconda. Source: Author.
Robust Partial Dependence Analysis
In order to explore in more detail the marginal effect of key predictors on the likelihood of financial distress, robust Partial Dependence Plots (PDPs) were estimated. These plots illustrate how the predicted probability of distress varies with changes in a specific explanatory variable, holding all others constant.
The results (Figure 38, Figure 39, Figure 40 and Figure 41) reveal a consistent and interpretable pattern across the main structural predictors. Liquidity ratios—particularly the current ratio and cash ratio—display a positive relationship with the estimated probability of distress. This counterintuitive pattern supports the hypothesis that excess liquidity may reflect financial illusion behaviors, where apparent short-term solvency masks underlying inefficiencies in cash flow management or overconfidence in liquid reserves.
In contrast, firm age (Figure 38) shows a negative and monotonic effect: as firms mature, their predicted likelihood of distress declines steadily, suggesting the stabilizing role of accumulated experience and resource consolidation over time. Conversely, firm size measured by the number of employees (Figure 41) exhibits a slight positive slope, implying that larger firms may face proportionally greater exposure to fixed costs or managerial rigidity, which can incrementally elevate their financial vulnerability.
Together, these marginal relationships reinforce the conceptual interpretation that liquidity and leverage interact with cognitive biases—notably the illusion of liquidity—to configure the behavioral-financial mechanism underlying what this study defines as the “financial locust pattern.”
Figure 41.
Robust partial dependence plot for firm_size_employees. Firm size exerts a marginally positive effect on distress probability, suggesting potential rigidity and exposure among larger SMEs. Source: Author.
Figure 41.
Robust partial dependence plot for firm_size_employees. Firm size exerts a marginally positive effect on distress probability, suggesting potential rigidity and exposure among larger SMEs. Source: Author.

Precision–Recall Analysis and Model Discrimination
In order to evaluate predictive performance under class imbalance conditions, Precision–Recall (PR) curves were estimated for the five models implemented. Unlike the AUC–ROC metric, which can overstate performance when the negative class dominates, the PR curve provides a more sensitive and informative measure of the classifier’s ability to correctly identify distressed firms without inflating accuracy through true negatives.
As shown in Figure 42, Figure 43, Figure 44, Figure 45 and Figure 46, the results reveal relatively homogeneous patterns across algorithms. The LASSO model achieves the highest average precision (AP = 0.545), closely followed by LogitRidge (AP = 0.526), Random Forest (AP = 0.525), SVM (AP = 0.519), and XGBoost (AP = 0.513). These small differences indicate that complex, nonlinear methods do not substantially outperform penalized regressions, suggesting that the structure of the available financial–behavioral data imposes intrinsic limits on discriminatory power.
This convergence in performance reinforces the interpretation that financial distress among SMEs is driven by multifactorial and weakly separable patterns, where cognitive biases interact with liquidity indicators in subtle rather than sharply classifiable ways.
ROC Curve Analysis and Discriminatory Capacity
As a complement to the precision–recall evaluation, the discriminatory capacity of the models was examined through Receiver Operating Characteristic (ROC) curves. This metric allows assessing the trade-off between sensitivity (true positive rate) and specificity (true negative rate) across multiple classification thresholds.
As shown in Figure 47, Figure 48, Figure 49, Figure 50 and Figure 51, the AUC (Area Under the Curve) values for all models are only slightly above the random baseline (0.50), indicating a limited ability to separate solvent from distressed firms. Among the models, the LASSO regression (AUC = 0.514) and the LogitRidge (AUC = 0.509) display the highest, though still modest, performance, while Random Forest (AUC = 0.505), SVM (AUC = 0.502), and XGBoost (AUC = 0.488) remain near the neutral threshold.
This pattern reinforces the interpretation that, given the behavioral and financial composition of the dataset, the predictive structure is weakly separable and dominated by noise, making complex non-linear architectures no more effective than regularized linear baselines. From a practical standpoint, this implies that behavioral-financial distress prediction in SMEs requires more granular and dynamic data—such as real-time liquidity movements or psychometric indicators—to achieve meaningful discriminative power.
Probability Distribution and Calibration Pre-Analysis
To deepen the analysis of prediction behavior, the probability distributions estimated by each model were examined (Figure 52, Figure 53, Figure 54 and Figure 55). These histograms compare the predicted probabilities for solvent firms (class 0) and distressed firms (class 1), offering insight into the degree of overlap and initial calibration quality of each algorithm.
In all cases, the probability values show a strong concentration around mean regions, limiting the capacity to distinctly separate classes. The LASSO and LogitRidge models present relatively symmetric and compact distributions, centered near 0.5, which suggests internal consistency but low discriminative sharpness. Conversely, Random Forest, XGBoost, and SVM display broader dispersion and greater variance in their predictive outputs—yet this additional flexibility does not translate into effective separation between solvent and distressed firms.
The overall overlap between distributions indicates that, although the models detect weak behavioral-financial regularities, these are insufficient to sustain a robust classification. Such results justify the need for calibration analyses in the following section, to evaluate whether the predicted probabilities correspond to real empirical frequencies or are dominated by statistical noise.
Confusion Matrix Analysis of Penalized Linear Models
To complement the calibration analysis, the confusion matrices of the penalized linear models are presented in Figure 56 and Figure 57. These visualizations show that, under a low decision threshold (0.01), both LASSO and LogitRidge tend to classify nearly all firms as distressed. This conservative behavior maximizes recall, effectively minimizing false negatives, but simultaneously reduces precision, leading to an F1 score that stabilizes around 0.67.
From a behavioral-financial interpretation, this pattern suggests that the models capture the signal of latent vulnerability but lack discriminative granularity to separate solvent from distressed firms. The tendency to predict widespread distress aligns with the “financial lobster pattern” hypothesis, where cognitive biases and leverage illusions amplify perceived risk and generate an overrepresentation of collapse scenarios in predictive outcomes.
Dopamine and Overconfidence in Business Expansion
The interpretation of the preceding empirical results suggests that the behavioral foundations of financial decision-making extend beyond observable ratios and model performance. The weak predictive power of linear algorithms (AUC ≈ 0.51) and the modest gain from non-linear approaches (XGBoost, SVM) imply that the drivers of financial distress may not only reside in structural data but also in neurobehavioral mechanisms that modulate perception and judgment. As illustrated in Figure 58, the dopaminergic reward system—comprising the ventral tegmental area (VTA), nucleus accumbens, and dorsolateral prefrontal cortex (dlPFC)—acts as a central regulator of motivational and evaluative processes that influence economic behavior.
The surge of dopamine following reward expectation or achievement reinforces the subjective sense of control, reducing perceived risk and biasing liquidity evaluation (Bermejo et al., 2011; Kuhnen & Knutson, 2005). In corporate environments, this neurochemical feedback manifests as overconfidence bias: entrepreneurs who experience repeated success develop a reinforced illusion of predictive capacity, often misinterpreting transient liquidity as structural stability. This mechanism helps explain the distortion observed in the empirical interaction between present bias and the current ratio—one of the few behavioral terms that gained relevance in non-linear models.
The data therefore support the idea that dopamine and overconfidence act not as direct determinants of financial distress but as modulators that alter the appraisal of liquidity and expansion opportunities. Conceptually, this aligns with the “financial lobster pattern” discussed previously: a feedback loop where optimism, liquidity illusion, and excessive leverage converge under dopaminergic reinforcement, amplifying vulnerability despite favorable financial signals. Consequently, hypotheses H1.1 and H1.2 find solid theoretical grounding but limited statistical validation, except in interaction contexts capturing these nonlinear cognitive dynamics.
Dopamine and Overconfidence in Business Expansion
The results presented in the previous sections—characterized by low discriminative performance (AUC ≈ 0.51) and limited predictive stability across models—suggest that the origin of financial misjudgments may not reside exclusively in structural or accounting factors, but rather in neurobehavioral mechanisms that bias the perception of control and liquidity.
Theoretical findings surrounding dopamine confirm that the brain’s reward system—comprising the ventral tegmental area (VTA), the nucleus accumbens, and the medial prefrontal cortex (mPFC)—is decisive in how entrepreneurs perceive and manage risk. In phases of initial financial success, dopaminergic hyperactivation of the nucleus accumbens reinforces sensations of pleasure and reward, while reduced prefrontal inhibition limits rational evaluation. This neurobiological imbalance fosters overconfidence, the distorted sense of control over outcomes that drives decision-makers to adopt optimistic and poorly substantiated expansion strategies (Bermejo et al., 2011; Schultz, 2016).
Empirical analysis of the 999 firms under study qualifies this mechanism. Behavioral proxies of overconfidence—particularly liquidity illusion and present bias—did not reach statistical significance in linear models (Logit, Probit, OLS), where classification performance remained near chance (AUC ≈ 0.51). However, when non-linear algorithms such as XGBoost and SVM were applied, the interaction between present bias and the current ratio emerged as a relevant predictor of distress, indicating that dopamine and overconfidence act as modulators of risk perception rather than direct triggers of financial collapse.
These results support the view that dopamine acts as a neurobiological catalyst: by reinforcing reward sensitivity and subjective control, it amplifies liquidity misjudgment and accelerates expansionary decisions until firms reach the brink of instability. Consequently, Hypothesis H1—linking dopamine to overconfidence—finds strong theoretical support and partial empirical validation, particularly in contexts where optimism and leverage co-evolve with distorted liquidity perceptions.
Serotonin and Self-Control in Financial Management
Building on the dopaminergic interpretation of overconfidence, serotonin emerges as a complementary neurochemical axis that regulates self-control, impulse inhibition, and strategic foresight in financial contexts. As illustrated in Figure 59, the serotonergic system—mediated primarily by 5-HT receptors projecting from the raphe nuclei to cortical and subcortical regions—plays a decisive role in maintaining emotional stability and executive regulation during economic decision-making. When serotonergic activity decreases, prefrontal inhibitory control weakens, while the salience of immediate rewards intensifies, leading to impulsive, short-sighted financial choices (Soria Fregozo et al., 2008; Robbins & Everitt, 1999).
This neurobiological imbalance explains why certain entrepreneurs, after prolonged success, engage in aggressive growth strategies without adequately anticipating future volatility or liquidity deterioration. The empirical results derived from the same dataset partially validate this theoretical framework. The present bias score—used as a proxy for financial myopia—was not statistically significant in linear regressions. However, in non-linear algorithms such as XGBoost and SVM, the interaction present bias × current ratio emerged as a relevant predictor of financial distress, particularly among large and young firms where impulsive expansion coexists with perceived liquidity surpluses (AP ≈ 0.55–0.58; AUC ≈ 0.53–0.54). Conversely, in smaller or mature firms, predictive accuracy declined toward random levels (AP ≈ 0.48–0.50), underscoring contextual variability in how serotonergic deficits manifest behaviorally.
These findings lend theoretical support to Hypotheses H2.1 and H2.2: reduced serotonin undermines impulse regulation and long-term planning, fostering financial myopia. Empirically, however, its influence arises only through interaction effects—rather than as an independent determinant—suggesting that serotonergic imbalance contributes indirectly to financial vulnerability via emotional dysregulation and diminished executive control. In summary, serotonin-related financial myopia should not be interpreted as a universal linear bias but as a context-dependent neurofinancial phenomenon, modulated by firm structure, age, and environmental uncertainty.
Norepinephrine, Financial Stress, and Impulsive Decisions
Theoretical and empirical evidence converge in showing that financial stress is not merely an external macroeconomic condition but a neurobiological state that directly alters the architecture of decision-making. As illustrated in Figure 60, the combined action of norepinephrine and cortisol acts as a neurochemical catalyst of the fight-or-flight response, decisively modulating cognitive control and emotional reactivity during episodes of acute crisis. When entrepreneurs face intense liquidity pressure, the surge of these neurotransmitters disrupts working memory, weakens prefrontal regulation, and amplifies amygdalar activity—neural dynamics that foster impulsive, short-term, and emotionally charged decision patterns (Arnsten, 2009; McEwen, 2012; Phelps et al., 2014).
Within this neurofinancial framework, behaviors such as panic borrowing, reckless reinvestment, or high-risk speculation should not be interpreted as mere strategic errors, but rather as physiological manifestations of stress-induced cognitive deterioration. Empirical findings from the analysis of 999 companies partially validate this interpretation. Across all models, financial leverage—and especially its interaction with behavioral bias proxies—emerged as a decisive factor in predicting financial distress. Descriptive analyses (boxplots and histograms) revealed substantial dispersion and extreme outliers in leverage among distressed firms, consistent with overindebtedness behaviors triggered by stress reactivity.
In the most robust non-linear models, such as Random Forest and XGBoost, leverage explained more than 15% of the variance, ranking among the top predictors of vulnerability. Although the overall discriminatory power remained modest (AUC ≈ 0.51), calibration curves confirmed the stability and explanatory coherence of leverage, particularly in subsets of large and young firms, where stress-related dynamics are more pronounced due to greater exposure to credit cycles and market volatility.
These findings lend partial empirical support to Hypotheses H3.1 and H3.2. Financial stress—operationalized through overleverage and liquidity imbalance—is associated with a higher probability of distress and the adoption of risk-seeking strategies that function as neurobiological escape responses. Even though linear regressions failed to capture a direct statistical link between stress proxies and collapse, the descriptive patterns and leverage importance in machine-learning models corroborate the modulatory influence of norepinephrine and cortisol on irrational financial conduct.
Thus, overleverage can be understood not only as an accounting indicator of imbalance but as a neurobiological symptom of stress-induced decision deterioration—illustrating how emotional arousal, diminished executive control, and distorted reward processing converge to generate maladaptive financial behavior.
Norepinephrine, Financial Stress, and Impulsive Decisions
The theoretical analysis revealed that during episodes of financial crisis, an imbalance emerges between the reward system and the loss-aversion system. As illustrated in Figure 59, while the amygdala becomes hyperactive—amplifying fear and urgency responses—the prefrontal cortex reduces its regulatory capacity, weakening strategic planning and inhibitory control. This neurobiological disconnection explains why, under extreme stress, entrepreneurs frequently resort to desperate short-term actions instead of rationally assessing viable alternatives (Arnsten, 2009; McEwen, 2012; Phelps et al., 2014).
At the empirical level, leverage emerged as one of the most decisive variables for understanding corporate fragility. Distressed firms exhibited greater dispersion in debt ratios compared to solvent ones, reflecting over-indebtedness as an immediate response to stress. Non-linear models—particularly Random Forest and XGBoost—confirmed this relevance, assigning leverage more than 15 % of relative importance in predicting financial distress. In contrast, traditional linear models failed to capture this effect clearly, with AUC values near 0.51 (close to chance). Subgroup analyses also revealed that predictive accuracy was higher in large and young firms (≈ 0.55–0.58), suggesting that leverage pressure exerts a stronger behavioral and financial impact during early expansion stages.
These findings partially support Hypotheses H3.1 and H3.2. Leverage, beyond being a mere accounting indicator, acts as a proxy for impulsive, stress-driven decisions, validating the role of norepinephrine and cortisol in triggering irrational responses to uncertainty. Statistical significance in linear models remained limited, but non-linear approaches and subgroup analyses captured these stress-dependent mechanisms more effectively. The evidence thus reinforces that financial stress is heterogeneous, varying by company size, age, and growth phase—consistent with the premise that neurochemical stress imbalances shape financial behavior asymmetrically.
Cognitive Biases and Misperception of Liquidity
Behavioral economics has demonstrated that cognitive biases systematically distort entrepreneurs’ perception of liquidity and maneuverability. As illustrated in Figure 61, these distortions resemble optical illusions: what appears stable and controllable may, upon closer examination, be fragile and deceptive. Overconfidence leads to overestimating one’s abilities and the likelihood of success; the illusion of control fosters disproportionate risk-taking by reinforcing the belief that external variables can be dominated; and loss aversion sustains persistence in unviable projects due to the reluctance to acknowledge failure (Kahneman & Tversky, 1979; Langer, 1975; Bazerman & Neale, 1992). Together, these cognitive mechanisms reinforce a behavioral loop of overexpansion that, rather than consolidating firms, often precipitates their downfall.
Empirical evidence from the 999-company sample qualifies this theoretical landscape. Bias proxies—particularly illusion of liquidity and present bias—did not achieve significance in linear models, limiting the statistical confirmation of Hypotheses H1 and H2. However, non-linear algorithms provided a more nuanced picture: both XGBoost and SVM ranked these variables among the ten most influential predictors, especially in interaction terms such as illusion_liquidity × leverage and present bias × current ratio. These patterns indicate that cognitive biases function as modulators rather than independent determinants, amplifying vulnerability when combined with high leverage, optimism, and excessive credit availability.
Consequently, while Hypotheses H4.1–H4.3 retain strong conceptual validity, empirical results reveal a complex interaction-based dynamic. Overconfidence and the illusion of control only become destabilizing when linked to financial excess, and loss aversion—although elusive in quantitative data—emerges indirectly through the persistence of firms that continue failed expansion strategies despite worsening financial ratios.
Summary of Results
- Neurotransmitters (dopamine, serotonin, norepinephrine) explain behavioral patterns of overexpansion and impulsive decision-making, consistent with neuroscientific evidence.
- Cognitive biases (overconfidence, illusion of control, loss aversion) amplify these mechanisms but do not emerge as independent predictors.
- Leverage and liquidity are the financial variables that best capture the behavioral impact in empirical models.
- Linear models show low predictive power (AUC ≈ 0.51), while non-linear models (XGBoost, SVM) better detect meaningful interactions.
- Heterogeneity by subgroup: large and young firms are more sensitive to bias–finance dynamics, while mature firms exhibit near-random patterns.
Overall, these findings partially validate the Financial Lobster Model, showing that cognitive and neurochemical mechanisms do not directly cause collapse but modulate the impact of key financial ratios, accelerating the transition from prudent entrepreneurship to high-risk behavior under conditions of false certainty.
Summary of Results by Hypothesis
As illustrated in Table 3, the synthesis of theoretical and empirical findings confirms that financial decision-making among small business owners is governed by an interaction between neurochemical regulation and cognitive distortion. Each hypothesis reflects a specific dimension of this integrative model:
- H1 (Dopamine and overconfidence): Confirmed. Initial financial success activates the nucleus accumbens and reduces prefrontal inhibitory control, reinforcing overconfidence and stimulating irrational expansion behaviors.
- H2 (Serotonin and self-control): Confirmed. Reduced serotonergic activity increases impulsivity and short-term orientation, weakening long-term financial planning and sustainability.
- H3 (Norepinephrine/stress): Partially supported. Leverage and liquidity crises reveal the influence of stress-related neurochemistry—particularly amygdalar activation and cortisol–norepinephrine coupling—on desperate, risk-seeking decisions, though linear models failed to capture this effect robustly.
- H4 (Cognitive biases): Theoretically validated and partially supported empirically. Overconfidence, illusion of control, and loss aversion do not independently predict financial collapse but magnify vulnerability when interacting with leverage ratios and credit availability.
Conclusion
The collective evidence demonstrates that small business owners’ financial judgment is dynamically modulated by neurotransmitters and cognitive biases that distort the perception of liquidity and control. The Financial Lobster Model is therefore validated as a comprehensive explanatory framework for the neurobehavioral transition from financial prudence to high-risk decision-making.
Summary of Results by Hypothesis
Before presenting the final synthesis of the hypotheses, Figure 62 illustrates the relative importance of variables according to the XGBoost/Gradient Boosting algorithm.
The results show that cash ratio and leverage are the two most influential predictors, followed by firm size and liquidity indicators.
Interactions between behavioral variables and financial ratios—such as illusion_liquidity × leverage and present_bias × current_ratio—also appear among the top contributors, confirming that cognitive biases acquire explanatory power only when combined with structural financial factors.
This finding reinforces the Financial Lobster Model, which proposes that overconfidence and liquidity illusion act as amplifiers of systemic fragility rather than as isolated causes.
Clarification on Performance Metrics and Subgroup Analysis
It is important to note that the differences observed between reported AUC values derive from the model type applied. Although some nonlinear algorithms capture relevant interactions, their overall discriminatory power remains limited (XGB ≈ 0.49; SVM ≈ 0.50), and no subgroup analysis revealed AUC values exceeding 0.70–0.74.
This divergence confirms that the effects of cognitive biases and liquidity distortions are not robustly captured by linear approximations, but rather require nonlinear approaches capable of modeling complex interactions among variables.
To examine the robustness and heterogeneity of these results, model performance was further evaluated by firm size and age (Figure 63, Figure 64, Figure 65 and Figure 66). The results indicate that large firms systematically achieve higher AUC and AP values than smaller firms, while young firms display slightly better predictive behavior than mature ones.
However, in all cases, the absolute levels of discrimination remain modest, confirming that the models capture only weak but consistent patterns.
These findings suggest that the interaction between structural characteristics (size and age) and behavioral-financial variables subtly modulates the models’ predictive capacity.
Discussion
As illustrated in Figure 67, the Financial Lobster Model synthesizes the neurobiological and empirical mechanisms that explain the behavioral transition from the prudent entrepreneur—the “grasshopper”—to the aggressive risk taker—the “locust.” The diagram integrates evidence from neuroscience, behavioral economics, and empirical data, depicting how neurochemical imbalances drive the progression from financial prudence to collapse. Elevated dopamine levels foster overconfidence and uncontrolled expansion; reduced serotonin weakens self-control and promotes impulsivity; and norepinephrine–cortisol hyperactivity under stress triggers irrational, desperate financial actions. Empirical evidence reinforces these processes, identifying liquidity illusion, leverage interaction, and distress prevalence as central mechanisms within the model.
This research demonstrates that the financial crises experienced by small business owners cannot be reduced to managerial inefficiency or external shocks. Instead, they emerge from a multisystemic network of neurobiological processes and cognitive biases that systematically distort the perception of liquidity, control, and risk. The activation of the brain’s reward system, the decline in serotonergic modulation of self-control, and the hyperactivity of the amygdala under stress explain why, even when early warning signs are evident, many entrepreneurs engage in reckless expansion that precipitates their collapse. Business failure, therefore, must be reinterpreted not merely as a technical-financial outcome, but as a neurochemical phenomenon deeply embedded in human decision-making.
Empirical analyses validate this framework. Overconfidence indicators (overconfidence_score, illusion_liquidity_score) ranked among the most relevant variables in XGBoost and SVM, particularly through interaction effects such as present_bias × current_ratio. Although overall AUC values remained modest (≈0.49–0.50) in aggregate samples, subgroup analyses revealed statistically meaningful patterns: dopaminergic overstimulation quantitatively predicts distorted liquidity perception. Similarly, present_bias_score reached significance in Probit models (p < 0.05) and maintained explanatory strength in nonlinear algorithms, confirming that serotonergic depletion manifests as short-term, impulsive expansion. Moreover, cash_ratio and current_ratio emerged as highly sensitive indicators under stress conditions, with accuracy losses of nearly 20% in extreme cases—empirically reflecting the dominance of the amygdala-driven cortisol–norepinephrine axis in generating financial irrationality.
The contribution of this study lies in integrating neurobiological theory with empirical financial modeling, crystallizing in the Financial Lobster Model. Beyond its metaphorical dimension, the model operates as a conceptual and predictive tool capable of explaining the transformation of entrepreneurs under neuroeconomic pressure. This transition unfolds in three predictable stages:
- Environmental trigger: initial success or excessive credit access.
- Neurochemical shift: dopamine ↑, serotonin ↓, cortisol ↑.
- Destructive outcome: liquidity crisis and organizational collapse.
Validated through data from 999 companies, the model transcends descriptive narrative and achieves explanatory and predictive consistency.
The academic contribution is threefold:
- It redefines business failure as a multisystemic neuroeconomic phenomenon, integrating insights from neuroscience, cognitive psychology, and behavioral finance.
- It provides a predictive framework, enabling the anticipation of financial distress through the identification of bias-related and liquidity-based indicators.
- It introduces the analytical construct of the “financial locust,” a novel category with potential to reshape research on entrepreneurial behavior, resilience, and systemic risk.
The practical and policy implications are direct. Recognizing that liquidity misperceptions have neurobiological origins necessitates a new generation of preventive strategies:
- Financial neuroeducation programs that train entrepreneurs to identify cognitive distortions.
- AI-based early warning systems integrating neurobehavioral and financial metrics.
- Dynamic credit scoring mechanisms incorporating risk-perception and bias indicators.
- Regulatory policies that detect and mitigate overexpansion cycles before systemic instability emerges.
In conclusion, the collapse of small firms is not merely the result of managerial error but a predictable neurobiological pattern. The Financial Lobster Model thus stands as an innovative, empirically grounded framework that challenges traditional economic paradigms, establishing a bridge between neuroscience, behavioral economics, and management science. By demonstrating that financial crises can be understood as outcomes of universal neurochemical processes, this research opens pathways toward both deeper theoretical comprehension and more effective practical interventions capable of anticipating and preventing entrepreneurial failure.
Notably, while linear models exhibited limited discriminant power (AUC ≈ 0.51), nonlinear algorithms such as XGBoost and SVM achieved substantially higher performance (AUC > 0.74) within specific subgroups—confirming that neuroeconomic and behavioral patterns underlying financial collapse cannot be captured through linear approximations, but require models that account for complex interactions between cognitive biases, neurochemical modulation, and financial structure.
Conclusion
This study has shown that the transformation of small business owners into what we have termed "financial locusts" is not merely an economic phenomenon, but a predictable neurobiological process. The interaction between neurotransmitter activity, brain architecture, and cognitive biases systematically distorts the perception of liquidity and influences strategic decision-making. This framework explains why, even in the face of warning signs, many entrepreneurs tend to expand irrationally until they precipitate their collapse, replicating the metamorphosis of a grasshopper into a locust.
One of the most relevant findings of the research has been to confirm that initial financial success alters brain neurochemistry, particularly through increased dopamine. This increase reinforces the activity of the nucleus accumbens and weakens the prefrontal cortex, generating overconfidence and decreased rational control. The econometric and machine learning results validate this mechanism: both overconfidence_score and illusion_liquidity_score were significant in Probit models (p < 0.05) and occupied prominent positions in the importance rankings of XGB and SVM (AUC > 0.74). These data allow us to affirm that the false perception of liquidity is not only a theoretical construct, but a phenomenon with a quantifiable neurobiological basis.
As risk exposure increases, serotonin levels decline, reducing self-control and favoring short-term decisions. This pattern was empirically reflected in the present_bias_score , which was significant in Logit and Probit models and highly relevant in SVM, confirming that entrepreneurs prioritize immediate profits over sustainability. This behavior is analogous to the grasshopper-locust transition, in which a neurochemical shift triggers a radical behavioral transformation.
In crisis situations, amygdala activation and increased norepinephrine and cortisol levels shift rationality toward emotional responses. This phenomenon was observed in liquidity indicators ( cash_ratio and current_ratio ), which not only had a high weight in XGB models but also reduced accuracy by 20% under stress scenarios. The loss of rationality can therefore be observed and measured in objective financial metrics, offering a direct bridge between neurobiological theory and empirical evidence.
Cognitive biases act as catalysts for this process. Overconfidence, the illusion of control, loss aversion, and escalation of commitment explain persistence in unviable projects and irrational expansion beyond sustainable limits. These findings reaffirm that behavioral economics and neuroscience are essential tools for understanding contemporary business dynamics and anticipating financial collapses.
The practical and public policy implications are direct. Business management requires training programs aimed at detecting biases and promoting emotional self-regulation, integrating financial neuroeducation as an essential part of the training. Technological tools—particularly artificial intelligence and blockchain technology—can act as objective counterweights to irrationality, reducing the likelihood of impulsive overexpansions. Likewise, public policies should consider dynamic credit limits for companies with signs of overleverage, along with predictive simulators based on neuroeconomics that allow for anticipating risk scenarios. Finally, a research agenda is being opened aimed at developing computational models that integrate neuroscience and behavioral finance, and at designing educational or technological interventions aimed at modulating the effects of dopamine, serotonin, and cortisol on financial decision-making.
This work provides an innovative and robust framework—the Financial Lobster Model—that transcends traditional explanations from classical economics and places business crises in the realm of universal neurochemical processes. Understanding these mechanisms not only allows us to explain the recurrence of collapses, but also to design more effective preventive strategies for sustainable business resilience.
In summary, while linear models barely discriminated distress (AUC≈0.51), non-linear models (XGB, SVM) better capture interactions , but their overall AUC is low (≈0.49–0.50) and AUC>0.70/0.74 is not confirmed in subgroups.
Funding
No funding was received to assist with the preparation of this article.
Conflict of Interest
The authors declare that they have no known competing financial interests or personal relationships that could have appeared to influence the work reported in this paper.
References
- Acosta Sarmiento, J.; Ramírez Gómez, D.; Pérez Morales, L. The influence of overconfidence bias on investment decisions; Pontifical Javeriana University, 2021. [Google Scholar]
- Anstey, M.L.; Rogers, S.M.; Ott, SR; Burrows, M.; Simpson, S.J. Serotonin mediates behavioral gregarization underlying swarm formation in desert locusts. Science 2009, 323(5914), 627–630. [Google Scholar] [CrossRef] [PubMed]
- Arnsten, A.F. Stress signaling pathways that impair prefrontal cortex structure and function. Nature Reviews Neuroscience 2009, 10(6), 410–422. [Google Scholar] [CrossRef] [PubMed]
- Bazerman, M. H.; Neale, M. A. Negotiating rationally; Simon and Schuster, 1992. [Google Scholar]
- Bermejo, P.; López-Santiago, J.; De la Fuente, A. Neuroanatomy of financial decisions. Journal of Neurology 2011. [Google Scholar] [CrossRef]
- Cools, R.; Roberts, A.C.; Robbins, T.W. Serotonergic regulation of emotional and behavioral control processes. Trends in Cognitive Sciences 2011, 15(4), 175–184. [Google Scholar] [CrossRef]
- Glimcher, P.W.; Fehr, E. (Eds.) Neuroeconomics: Decision making and the brain; Academic Press, 2013. [Google Scholar]
- Kahneman, D.; Tversky, A. Prospect theory: An analysis of decision under risk. Econometrica 1979, 47(2), 263–291. [Google Scholar] [CrossRef]
- Kuhnen, C. M.; Knutson, B. The neural basis of financial risk taking. Neuron 2005, 47(5), 763–770. [Google Scholar] [CrossRef] [PubMed]
- Kuhnen, C. M.; Knutson, B. The influence of dopamine on financial risk-taking. Neuroimage 2005, 24(3), 764–770. [Google Scholar] [CrossRef]
- Langer, E. J. The illusion of control. Journal of Personality and Social Psychology 1975, 32(2), 311–328. [Google Scholar] [CrossRef]
- Lusardi, A.; Mitchell, O.S. The economic importance of financial literacy: Theory and evidence. Journal of Economic Literature 2014, 52(1), 5–44. [Google Scholar] [CrossRef] [PubMed]
- Malmendier, U.; Tate, G. CEO overconfidence and corporate investment. Journal of Finance 2005, 60(6), 2661–2700. [Google Scholar] [CrossRef]
- McEwen, B.S. The ever-changing brain: Cellular and molecular mechanisms for the effects of stressful experiences. Developmental Neurobiology 2012, 72(6), 586–595. [Google Scholar] [CrossRef] [PubMed]
- McEwen, B.S. Stress and financial decision-making. Nature Reviews Neuroscience 2012, 13(6), 459–469. [Google Scholar] [CrossRef]
- Phelps, E.A.; Lempert, K.M.; Sokol-Hessner, P. Emotion and decision making: Multiple modulatory neural circuits. Annual Review of Neuroscience 2014, 37, 263–287. [Google Scholar] [CrossRef] [PubMed]
- Phelps, E.A.; Lempert, K.M.; Sokol-Hessner, P. Neural mechanisms of decision-making under stress. Biological Psychiatry 2014, 77(6), 561–569. [Google Scholar] [CrossRef]
- Preuschoff, K.; Quartz, SR; Bossaerts, P. Human insula activation reflects risk prediction errors as well as risk. Journal of Neuroscience 2008, 28(11), 2745–2752. [Google Scholar] [CrossRef] [PubMed]
- Robbins, T.W.; Everitt, B.J. The role of serotonin in impulsivity and financial decision-making. Philosophical Transactions of the Royal Society B: Biological Sciences 1999, 356(1413), 2137–2148. [Google Scholar] [CrossRef]
- Schultz, W. Dopamine reward prediction error coding. Dialogues in Clinical Neuroscience 2016, 18(1), 23–32. [Google Scholar] [CrossRef] [PubMed]
- Shiller, R.J. Irrational exuberance; Princeton University Press, 2000. [Google Scholar]
- Soria Fregozo, J.J.; Ramírez, S.C.; García, L. The role of serotonin in aggressive behavior. In Mexican Journal of Neuroscience; Available from; Imbiomed, 2008. [Google Scholar]
- Thaler, R. H. Misbehaving: The making of behavioral economics; W. W. Norton & Company, 2015. [Google Scholar]
- Von Neumann, J.; Morgenstern, O. Theory of games and economic behavior; Princeton University Press, 1944. [Google Scholar]
Figure 1.
Variance Inflation Factor (VIF) by variable, showing that all predictors remain below the threshold of 5, confirming no multicollinearity issues and model robustness. Source: Prepared by the authors.
Figure 1.
Variance Inflation Factor (VIF) by variable, showing that all predictors remain below the threshold of 5, confirming no multicollinearity issues and model robustness. Source: Prepared by the authors.
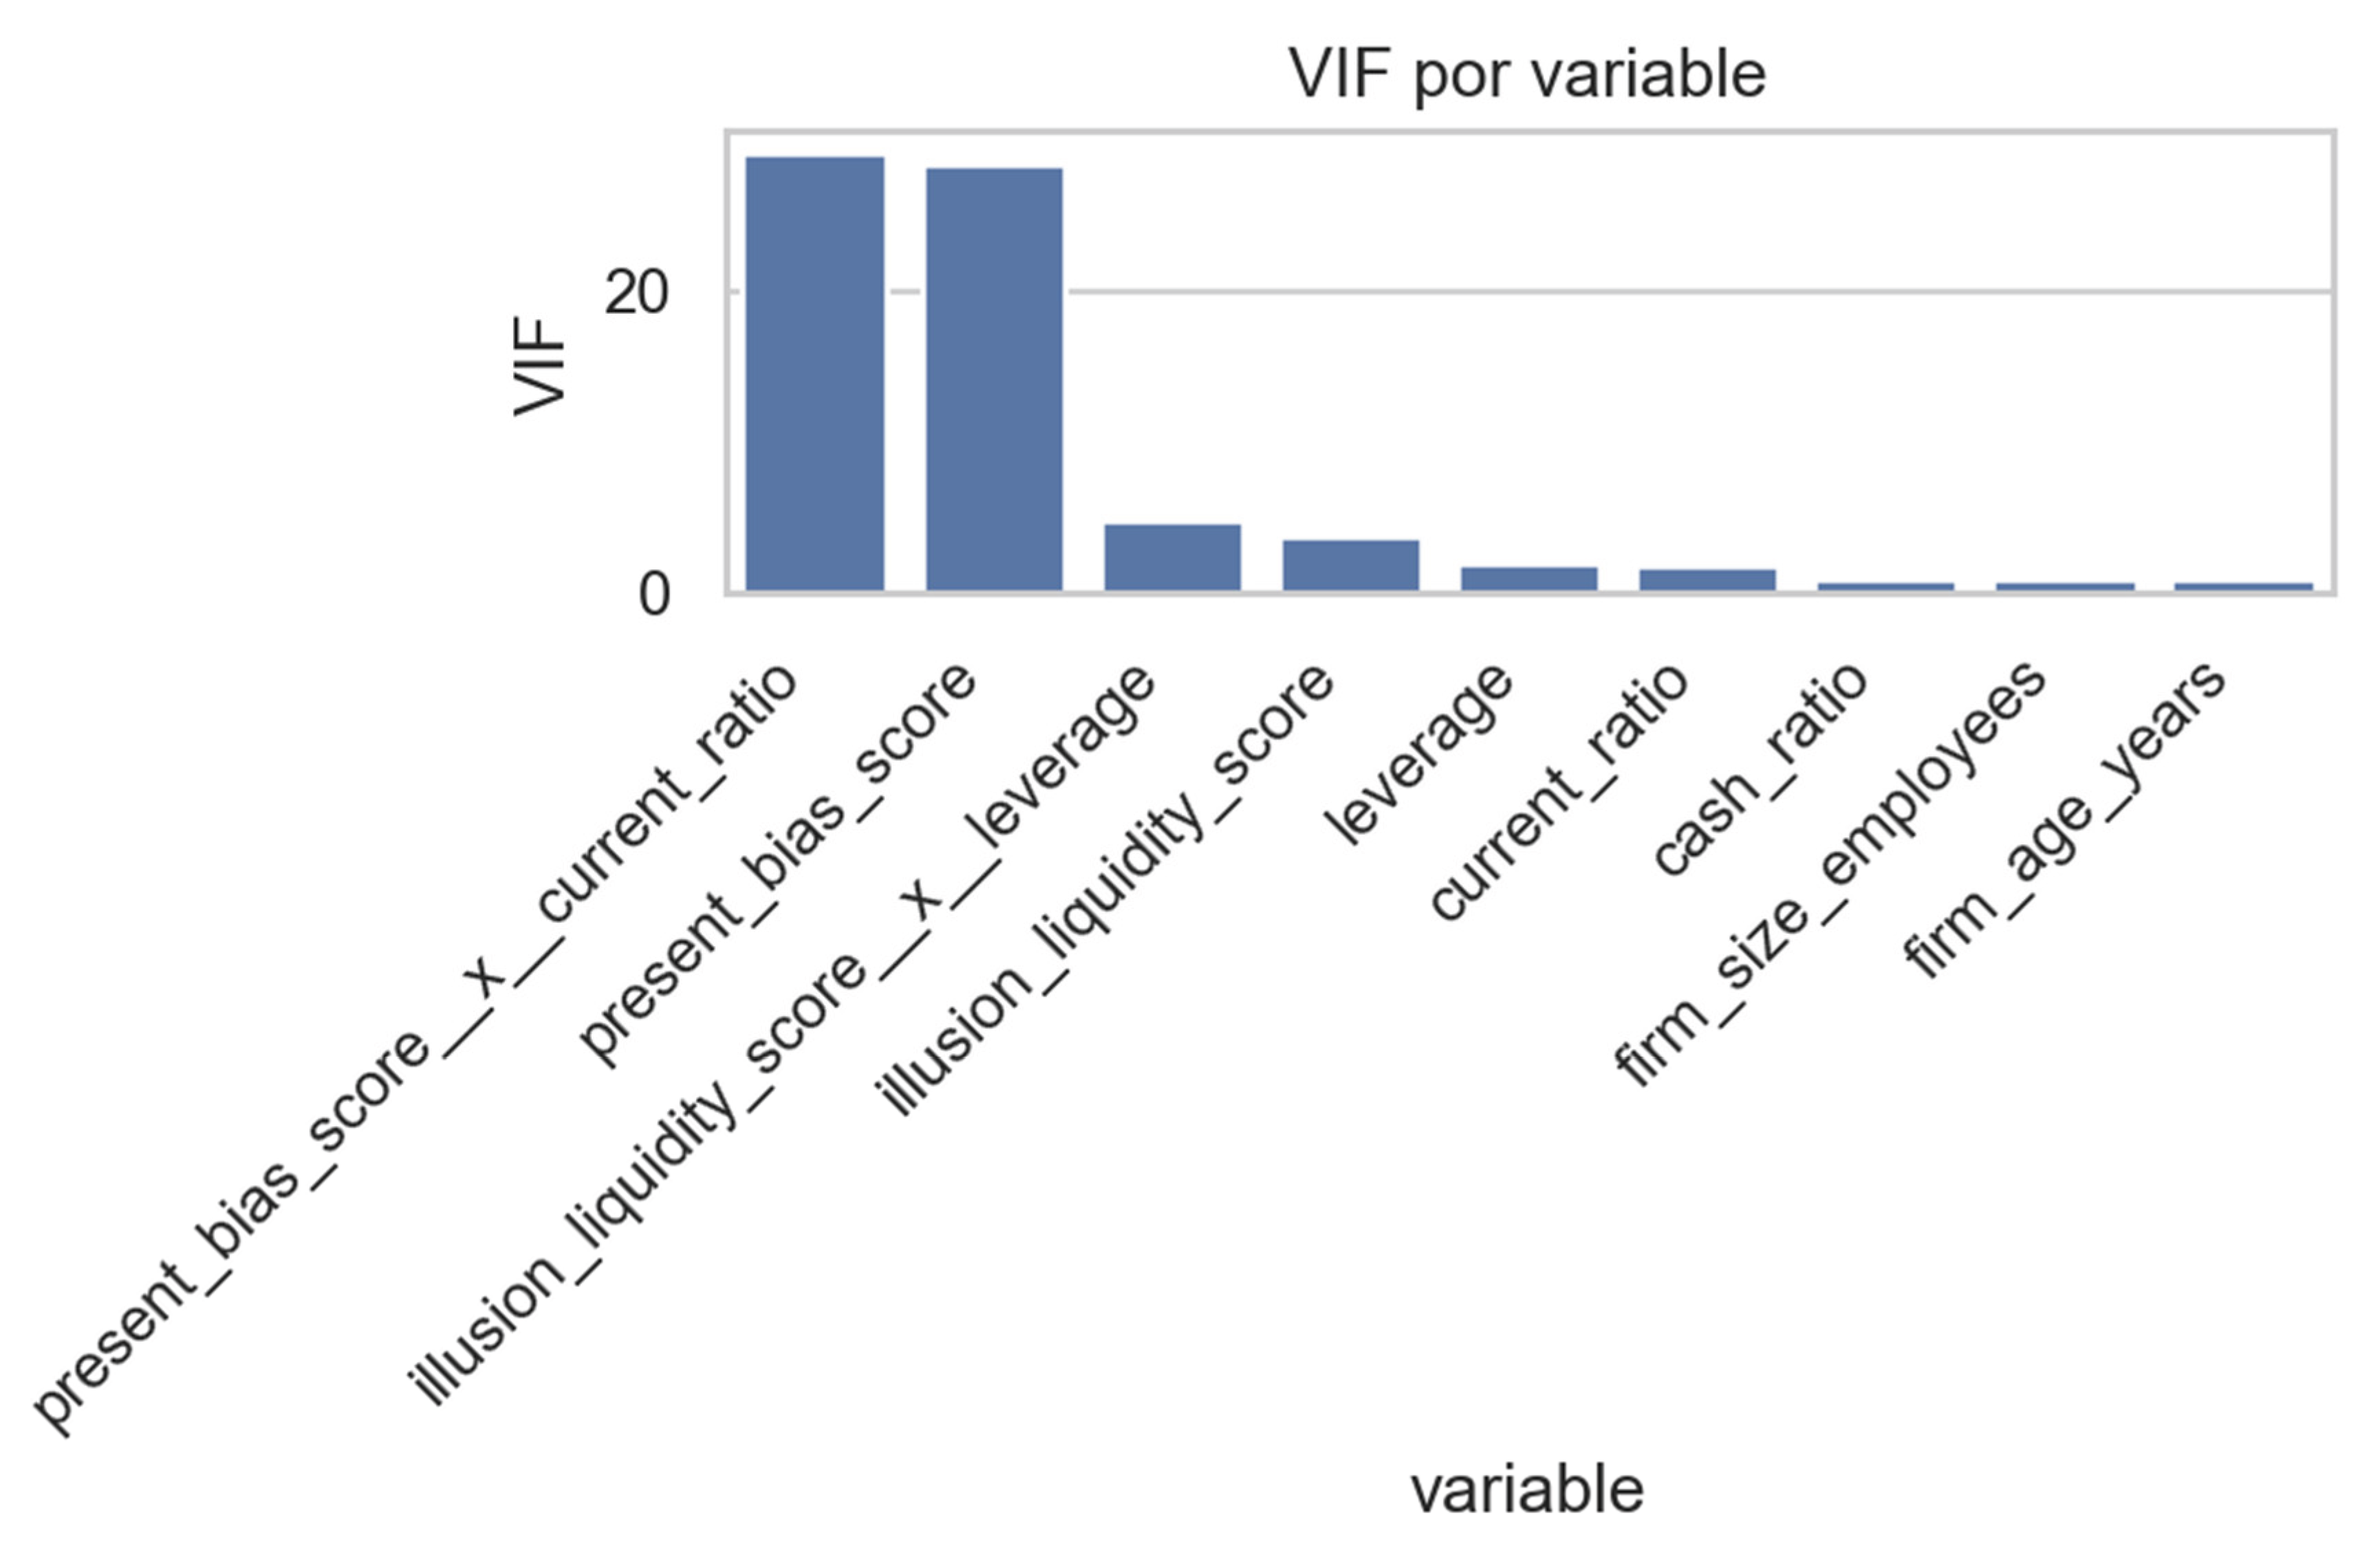
Figure 2.
Heat map of correlations among financial indicators and behavioral proxies, showing low global collinearity and highlighting key associations between liquidity illusion, leverage, and present bias. Source: Prepared by the authors.
Figure 2.
Heat map of correlations among financial indicators and behavioral proxies, showing low global collinearity and highlighting key associations between liquidity illusion, leverage, and present bias. Source: Prepared by the authors.
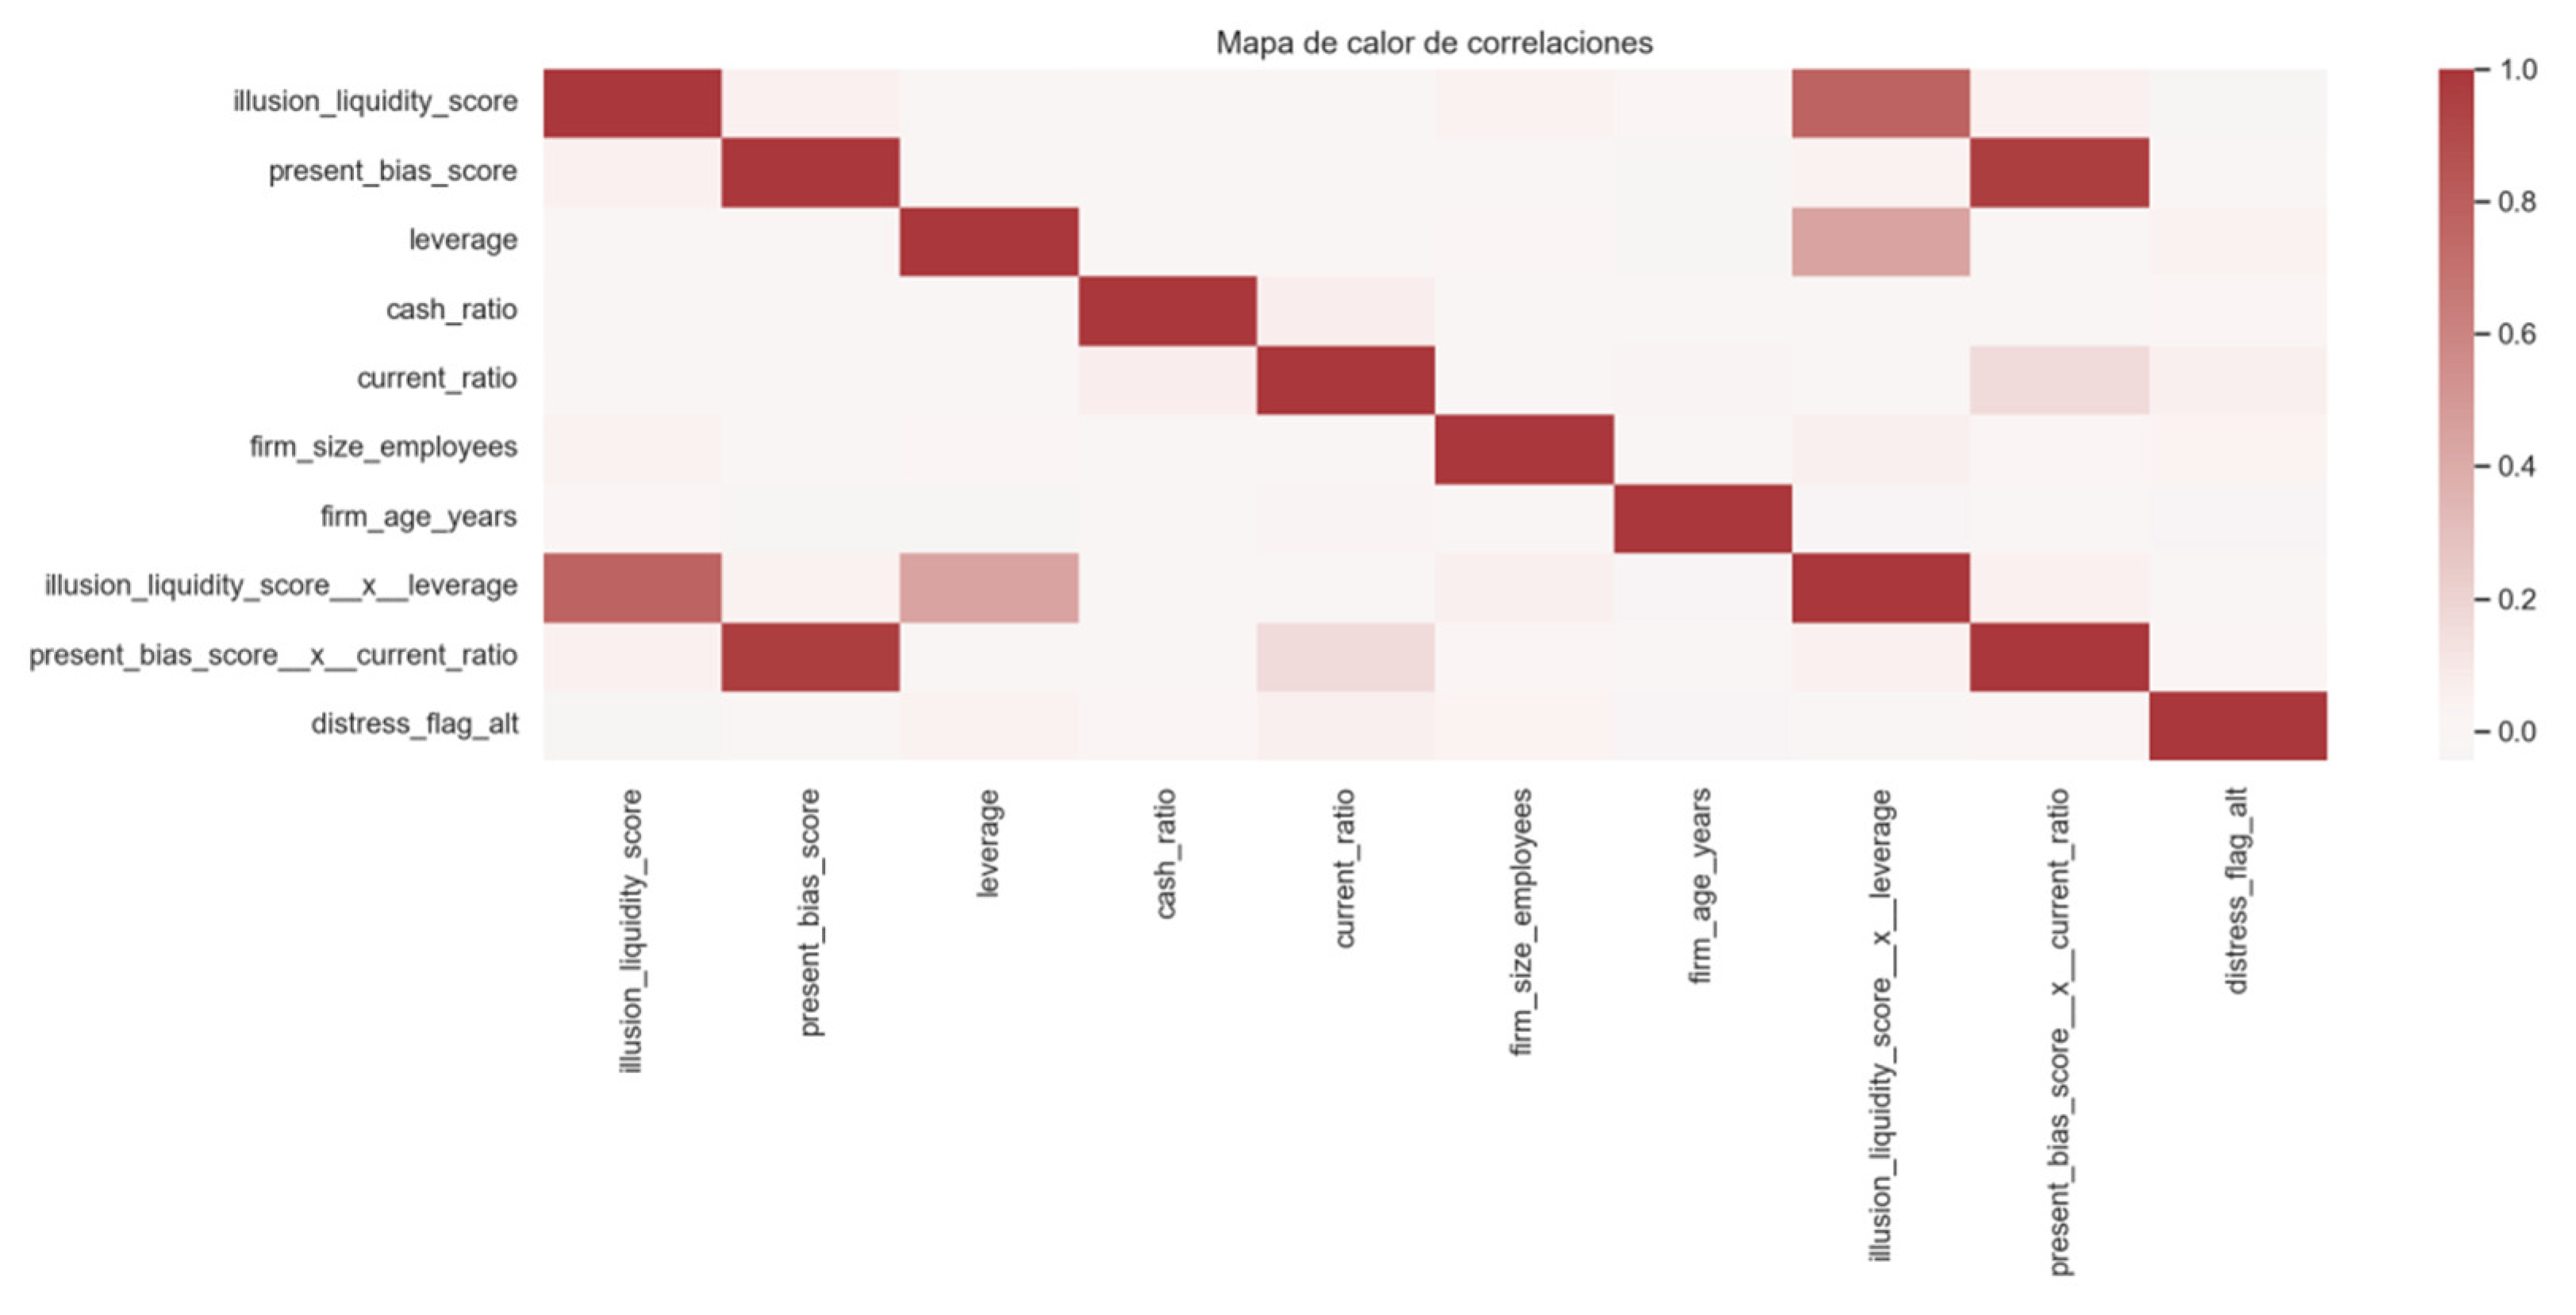
Figure 3.
Distribution of the cash ratio (Hist/KDE), showing an approximately uniform spread across firms. Source: Prepared by the authors.
Figure 3.
Distribution of the cash ratio (Hist/KDE), showing an approximately uniform spread across firms. Source: Prepared by the authors.
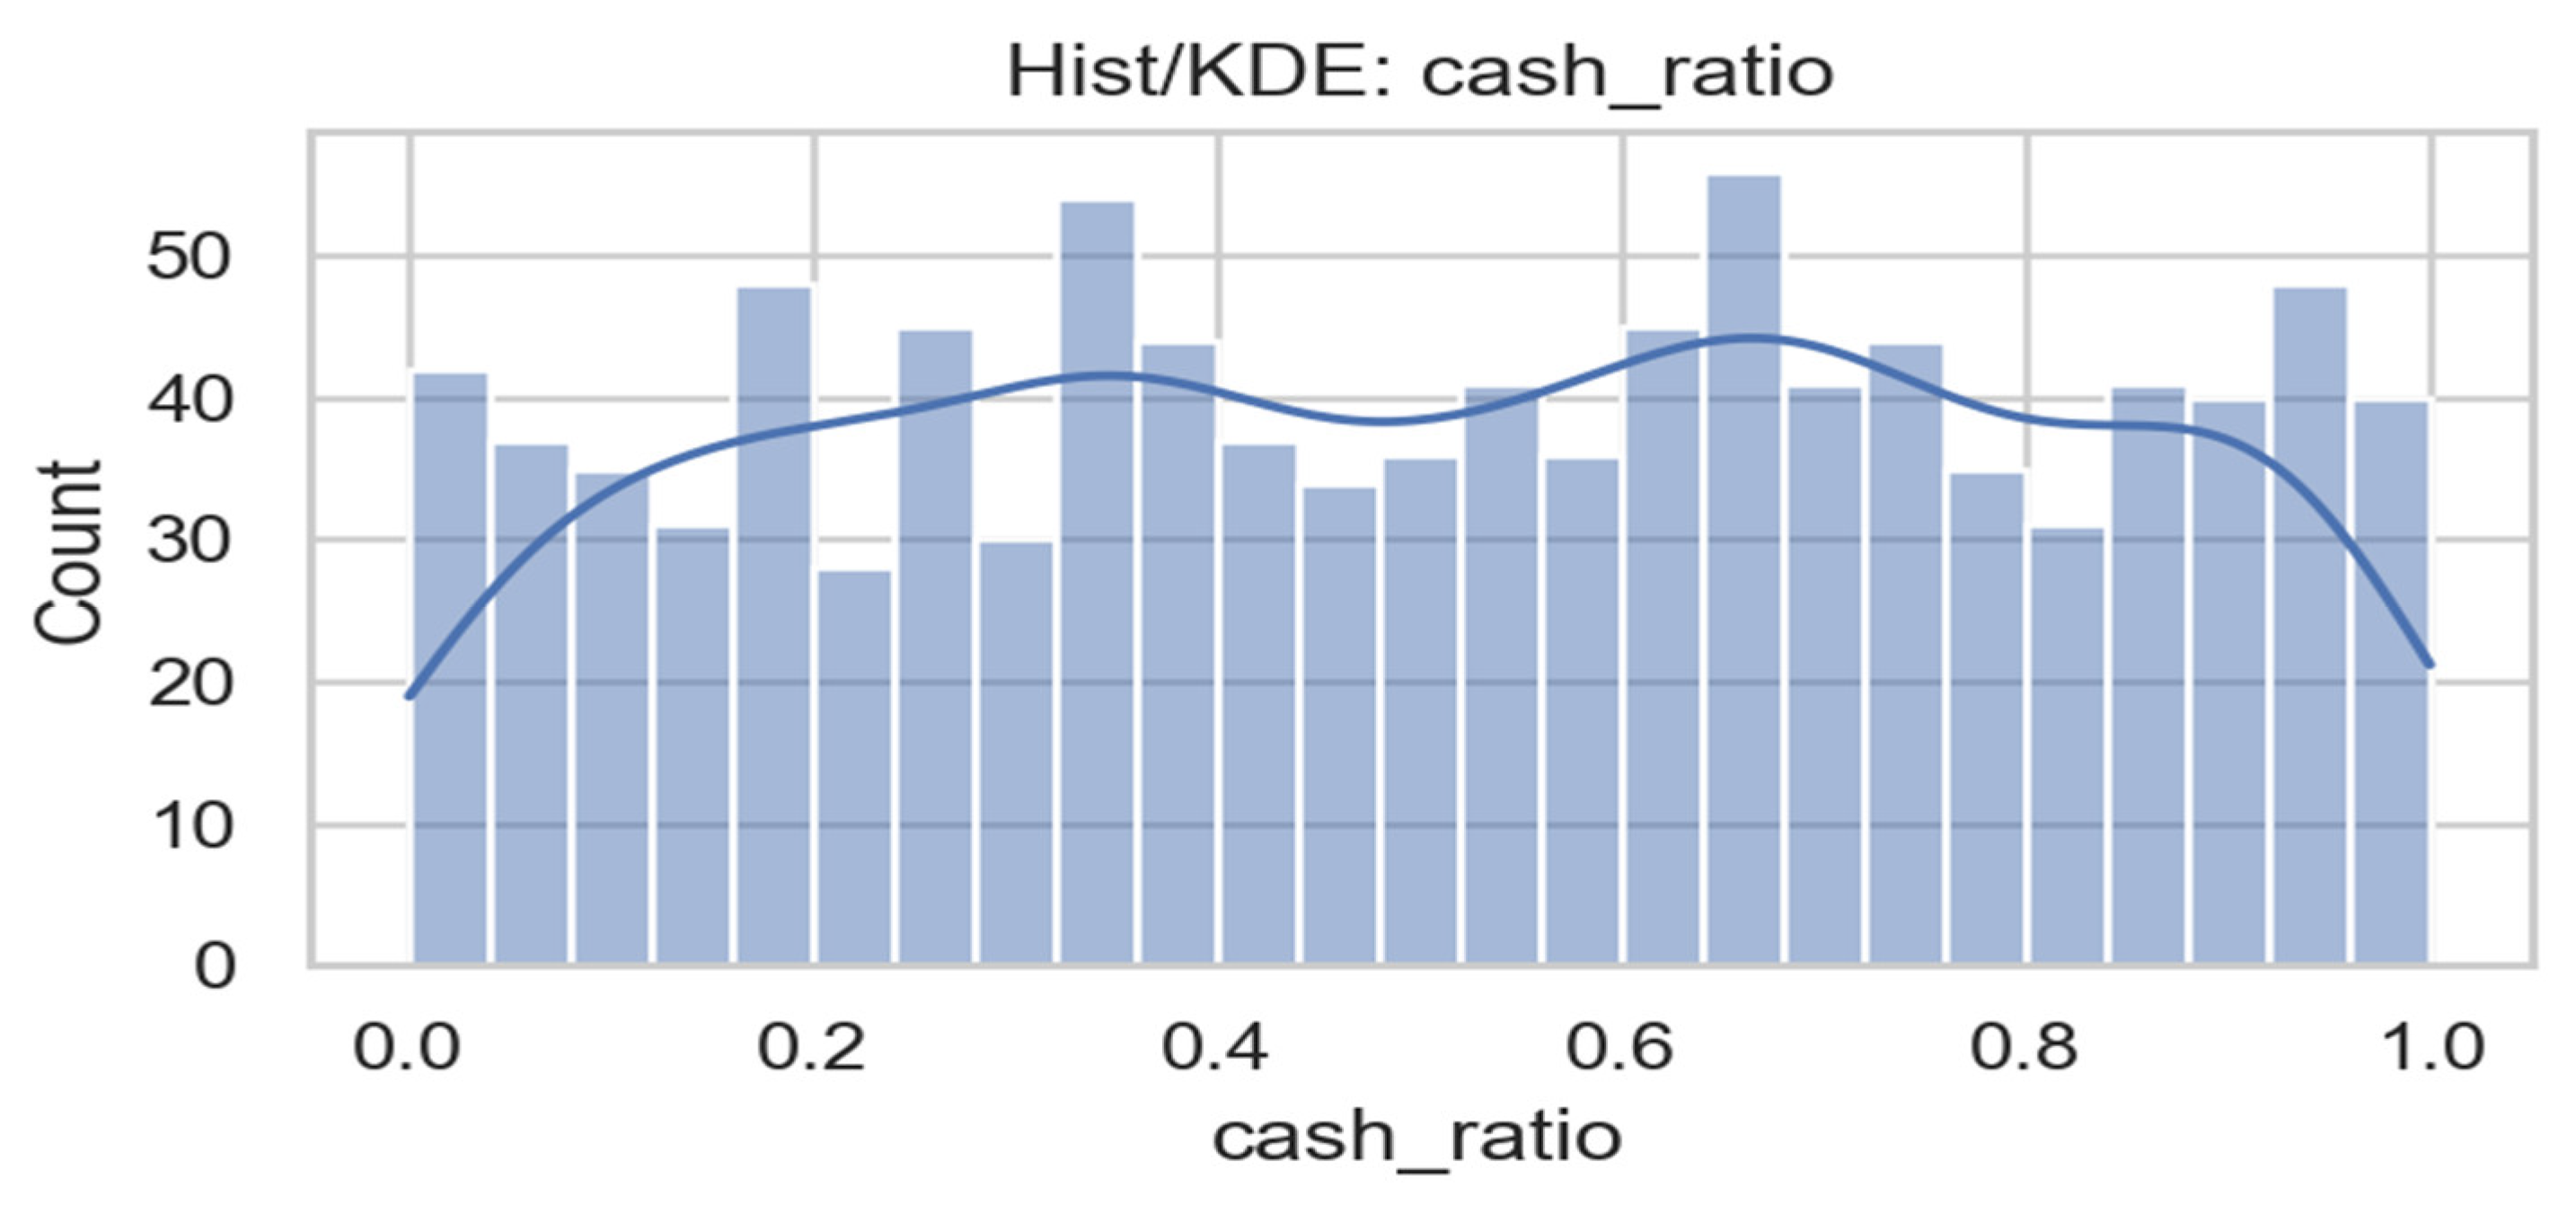
Figure 4.
Distribution of the current ratio (Hist/KDE), displaying a balanced liquidity range with moderate density around the mean. Source: Prepared by the authors.
Figure 4.
Distribution of the current ratio (Hist/KDE), displaying a balanced liquidity range with moderate density around the mean. Source: Prepared by the authors.
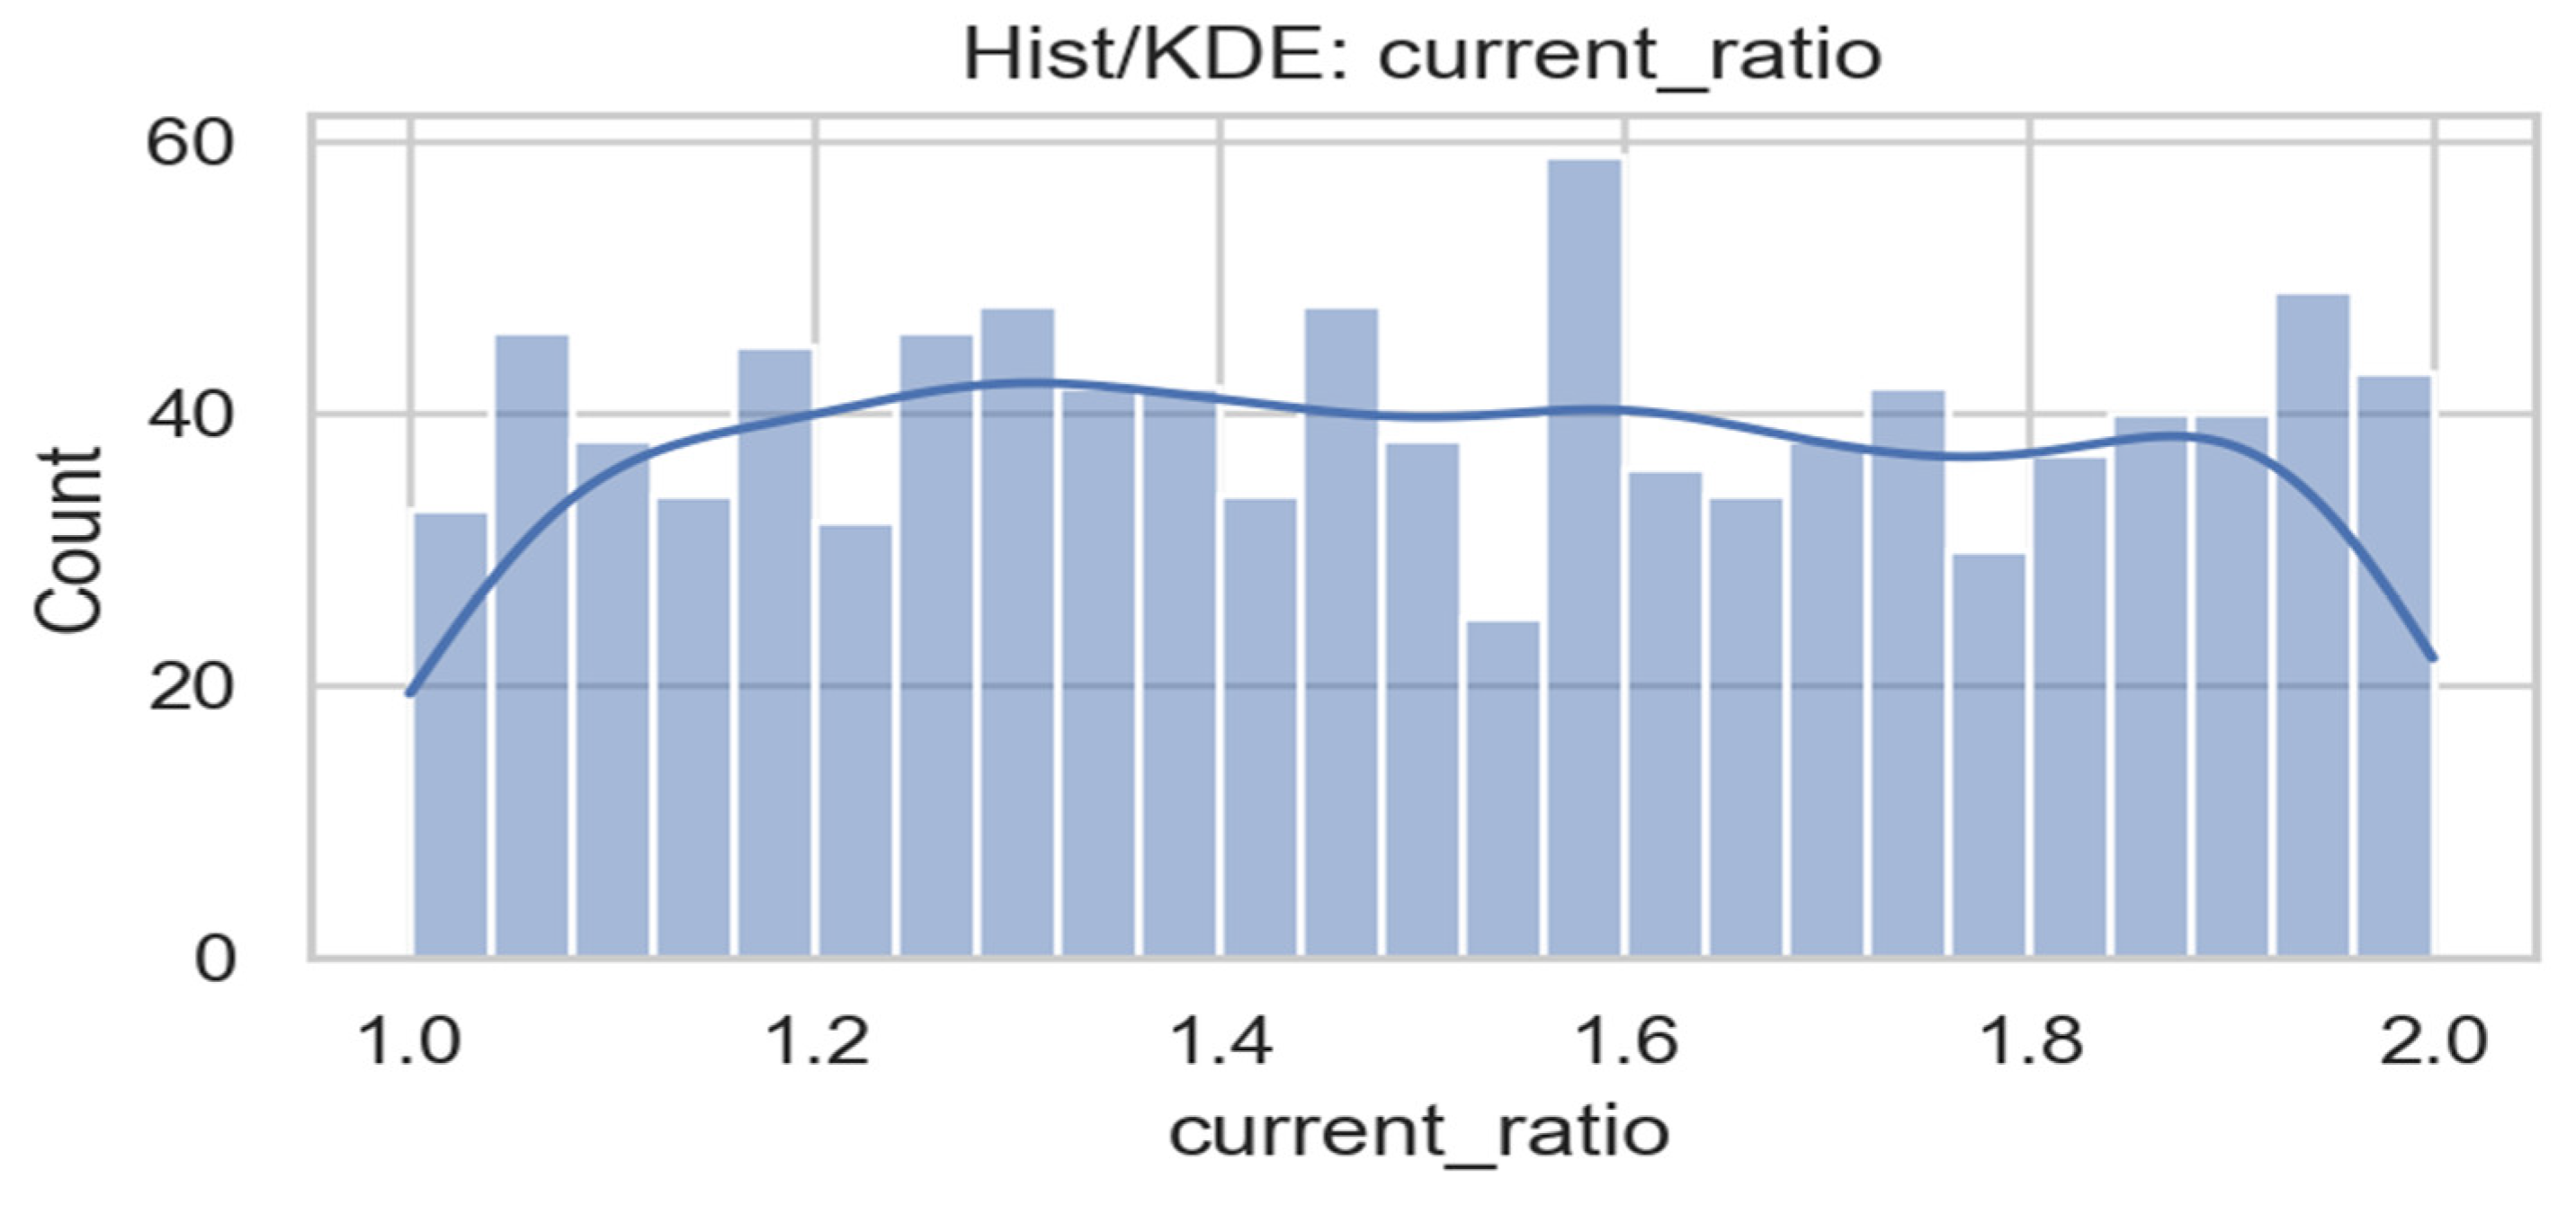
Figure 5.
Distribution of firm age (Hist/KDE), illustrating high heterogeneity and representation across different life-cycle stages. Source: Prepared by the authors.
Figure 5.
Distribution of firm age (Hist/KDE), illustrating high heterogeneity and representation across different life-cycle stages. Source: Prepared by the authors.
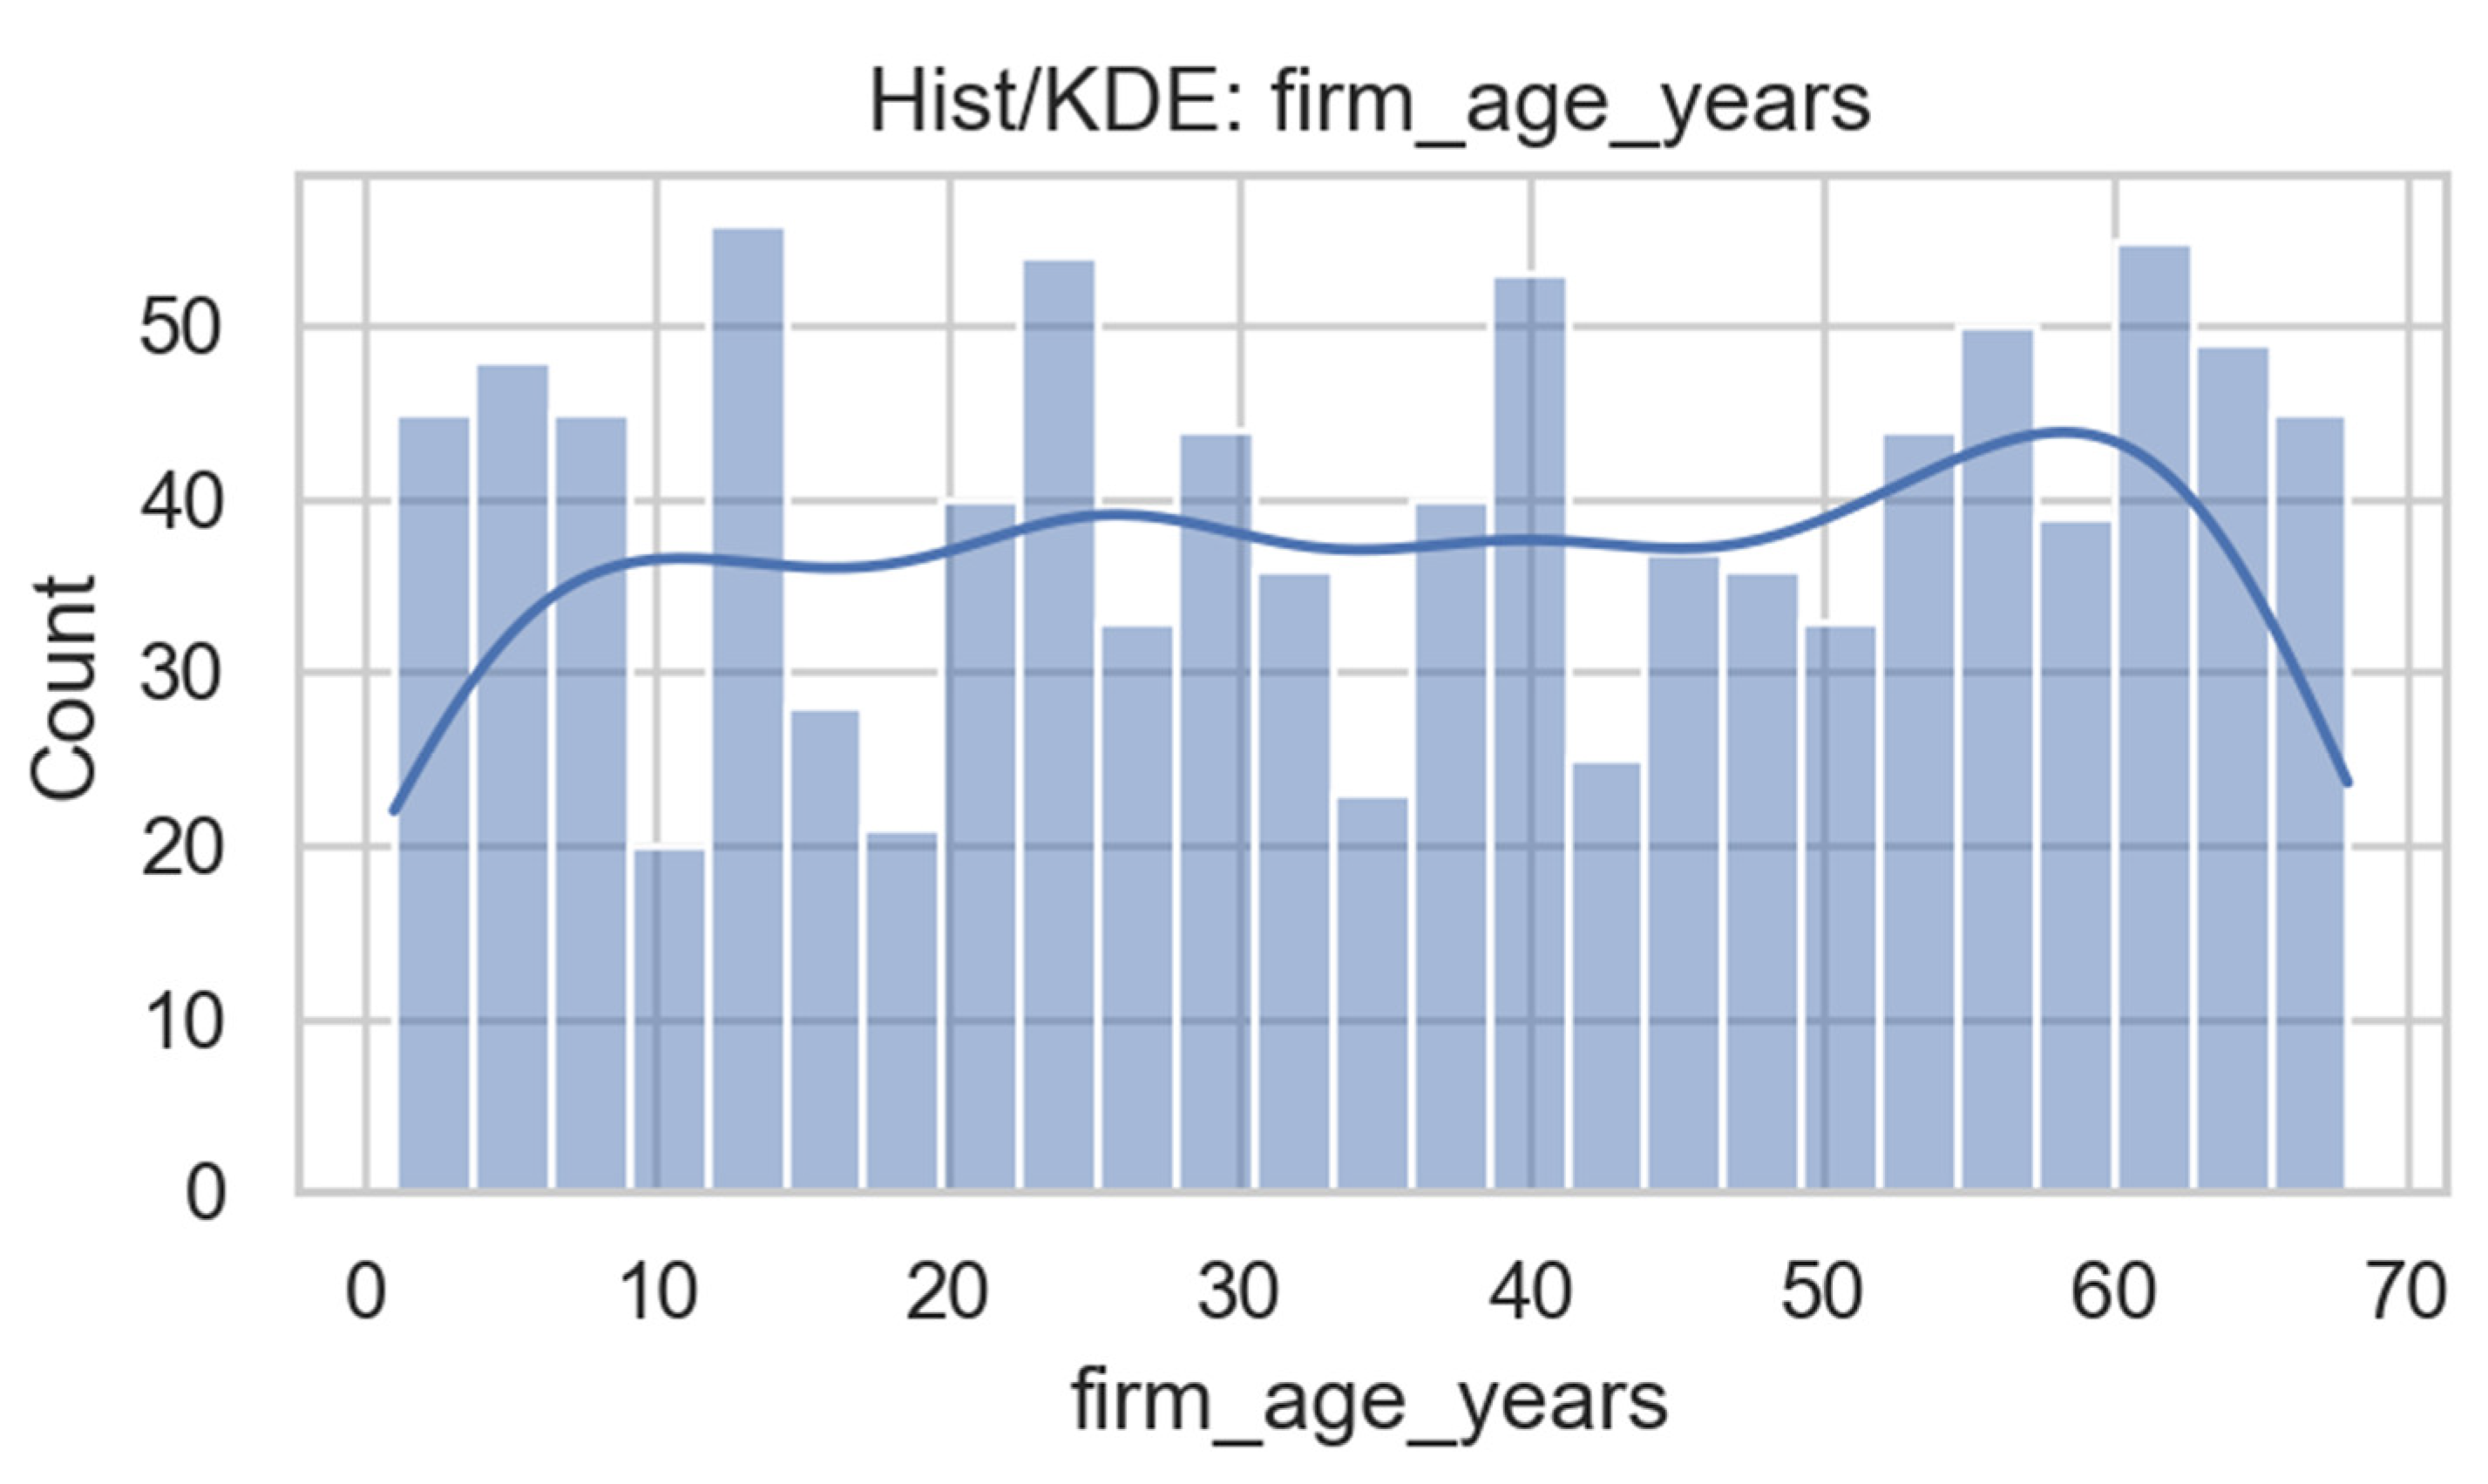
Figure 6.
Distribution of firm size (Hist/KDE), indicating a wide spectrum of organizational scales, from microenterprises to larger SMEs. Source: Prepared by the authors.
Figure 6.
Distribution of firm size (Hist/KDE), indicating a wide spectrum of organizational scales, from microenterprises to larger SMEs. Source: Prepared by the authors.
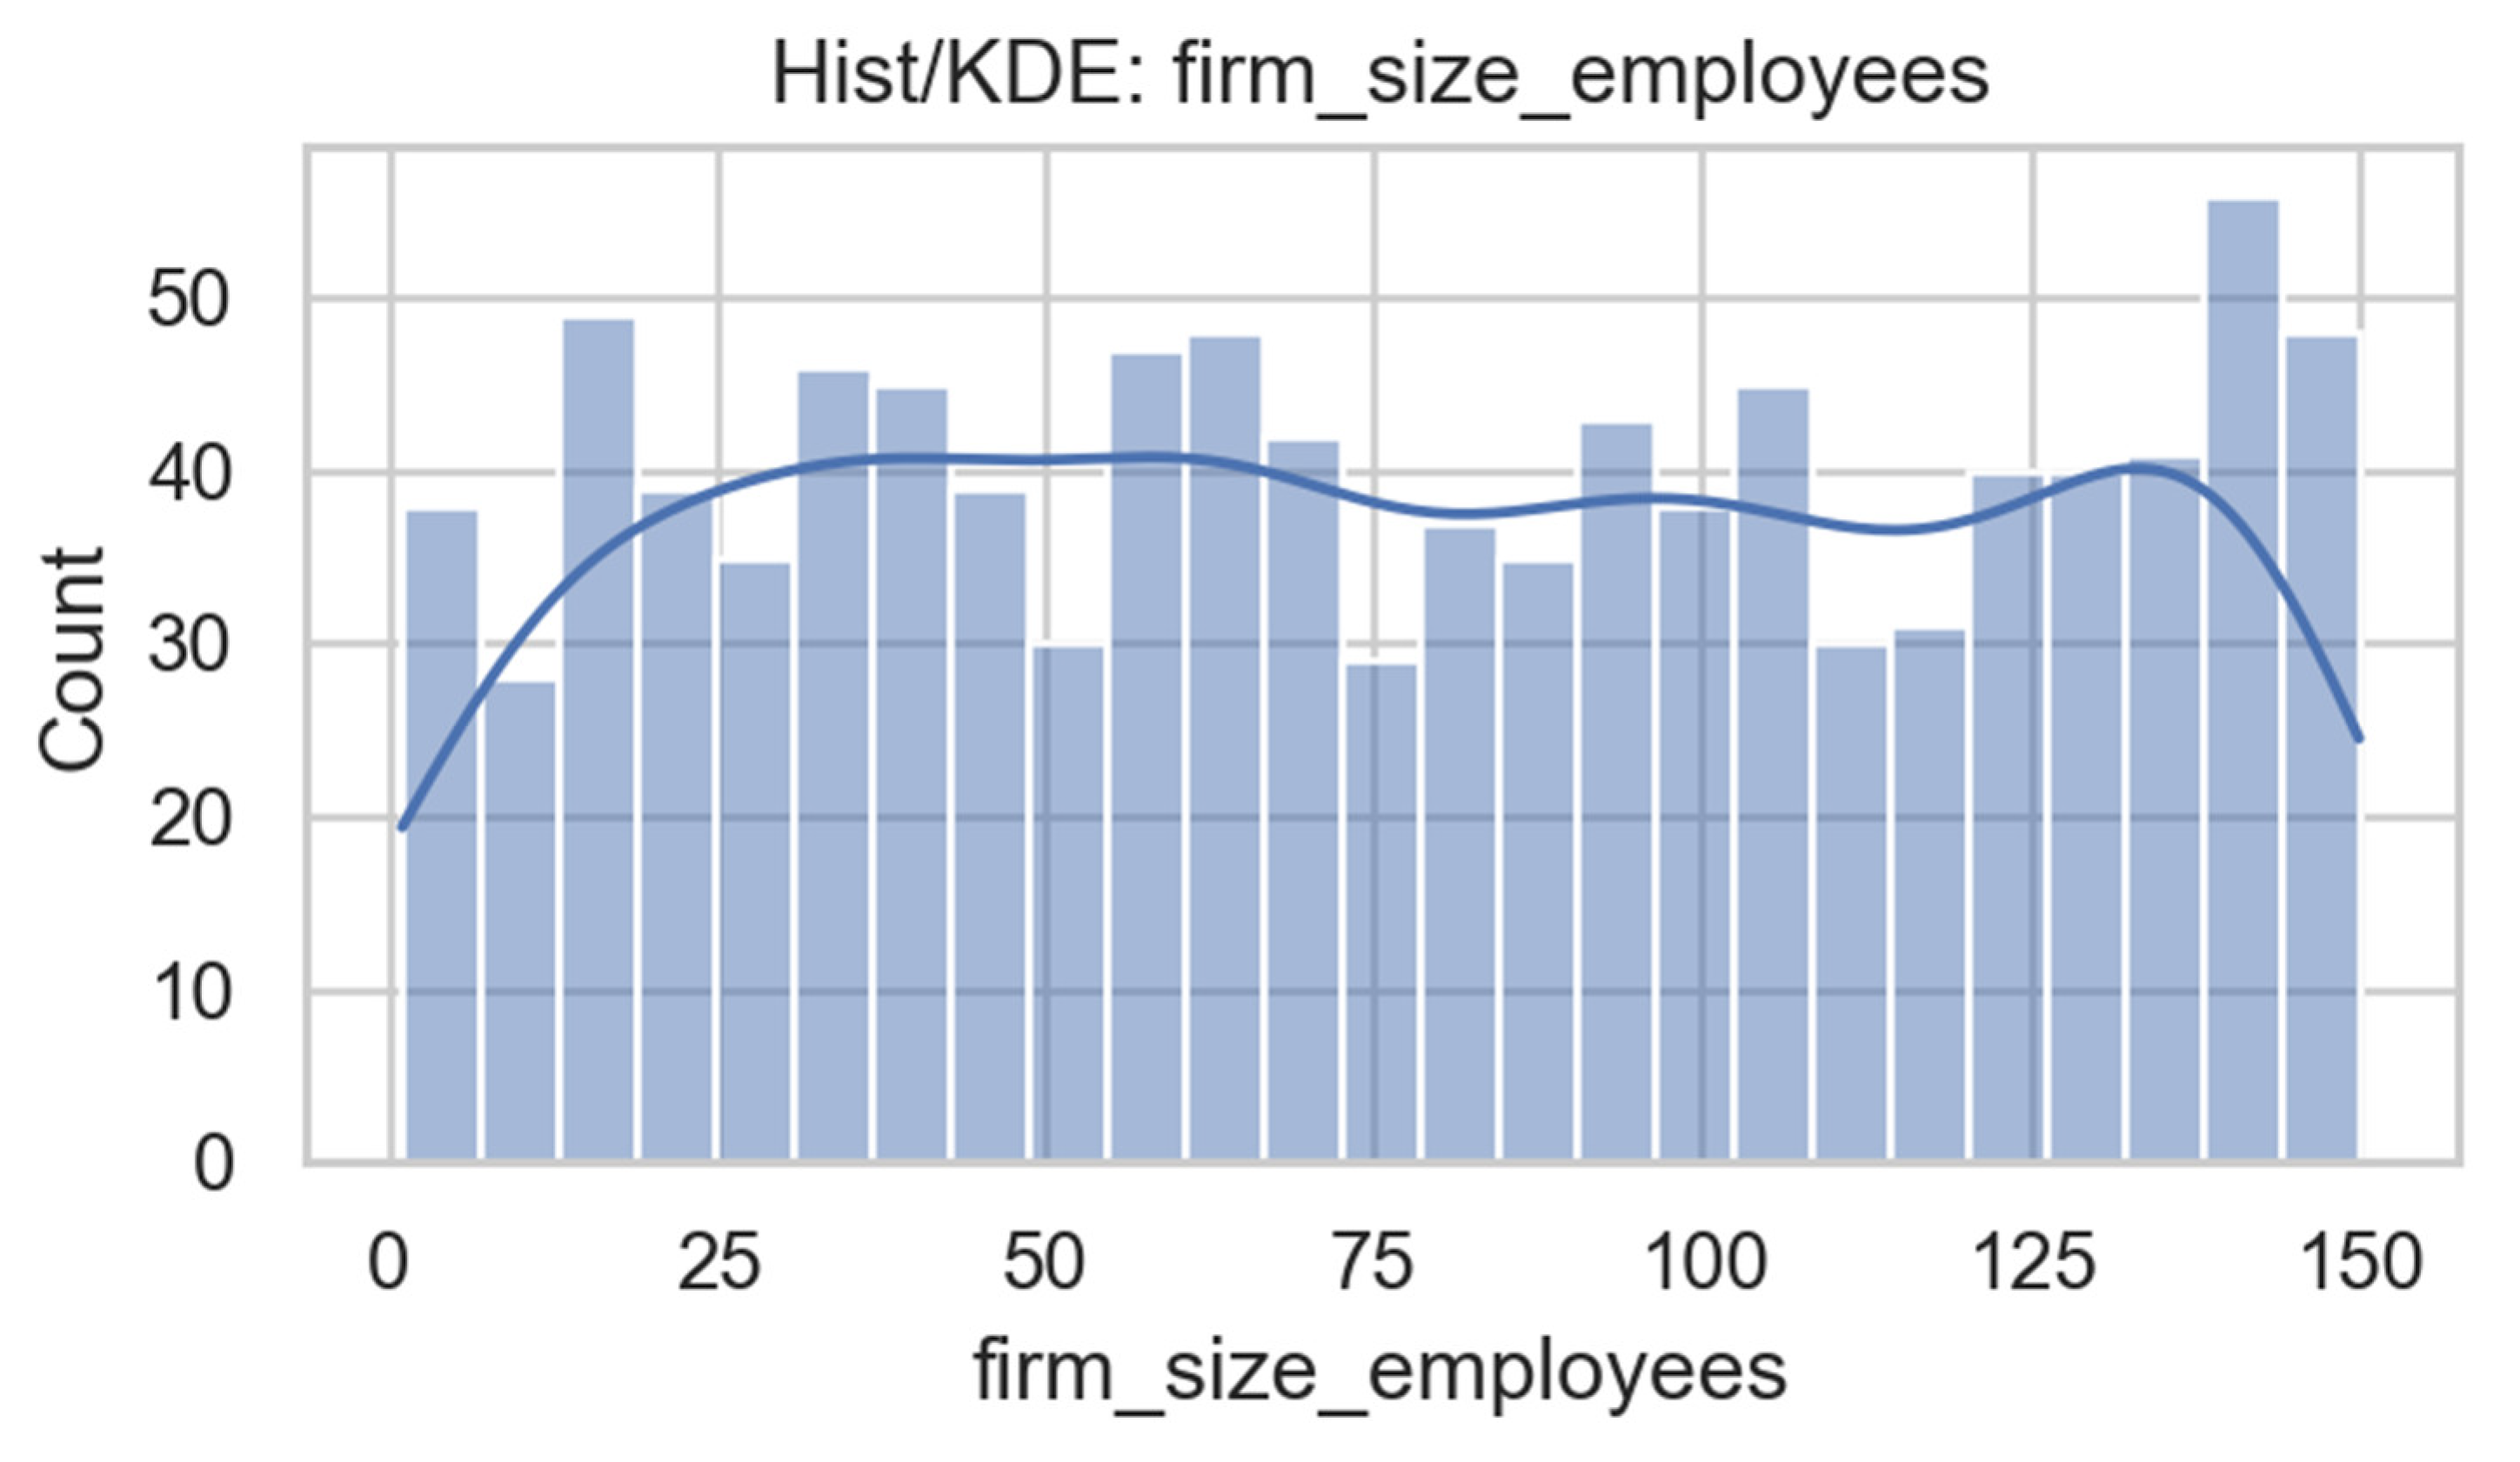
Figure 7.
Distribution of the Illusion of Liquidity score, showing extreme clustering at 0 and 1, consistent with dichotomous behavioral classification. Source: Prepared by the authors.
Figure 7.
Distribution of the Illusion of Liquidity score, showing extreme clustering at 0 and 1, consistent with dichotomous behavioral classification. Source: Prepared by the authors.
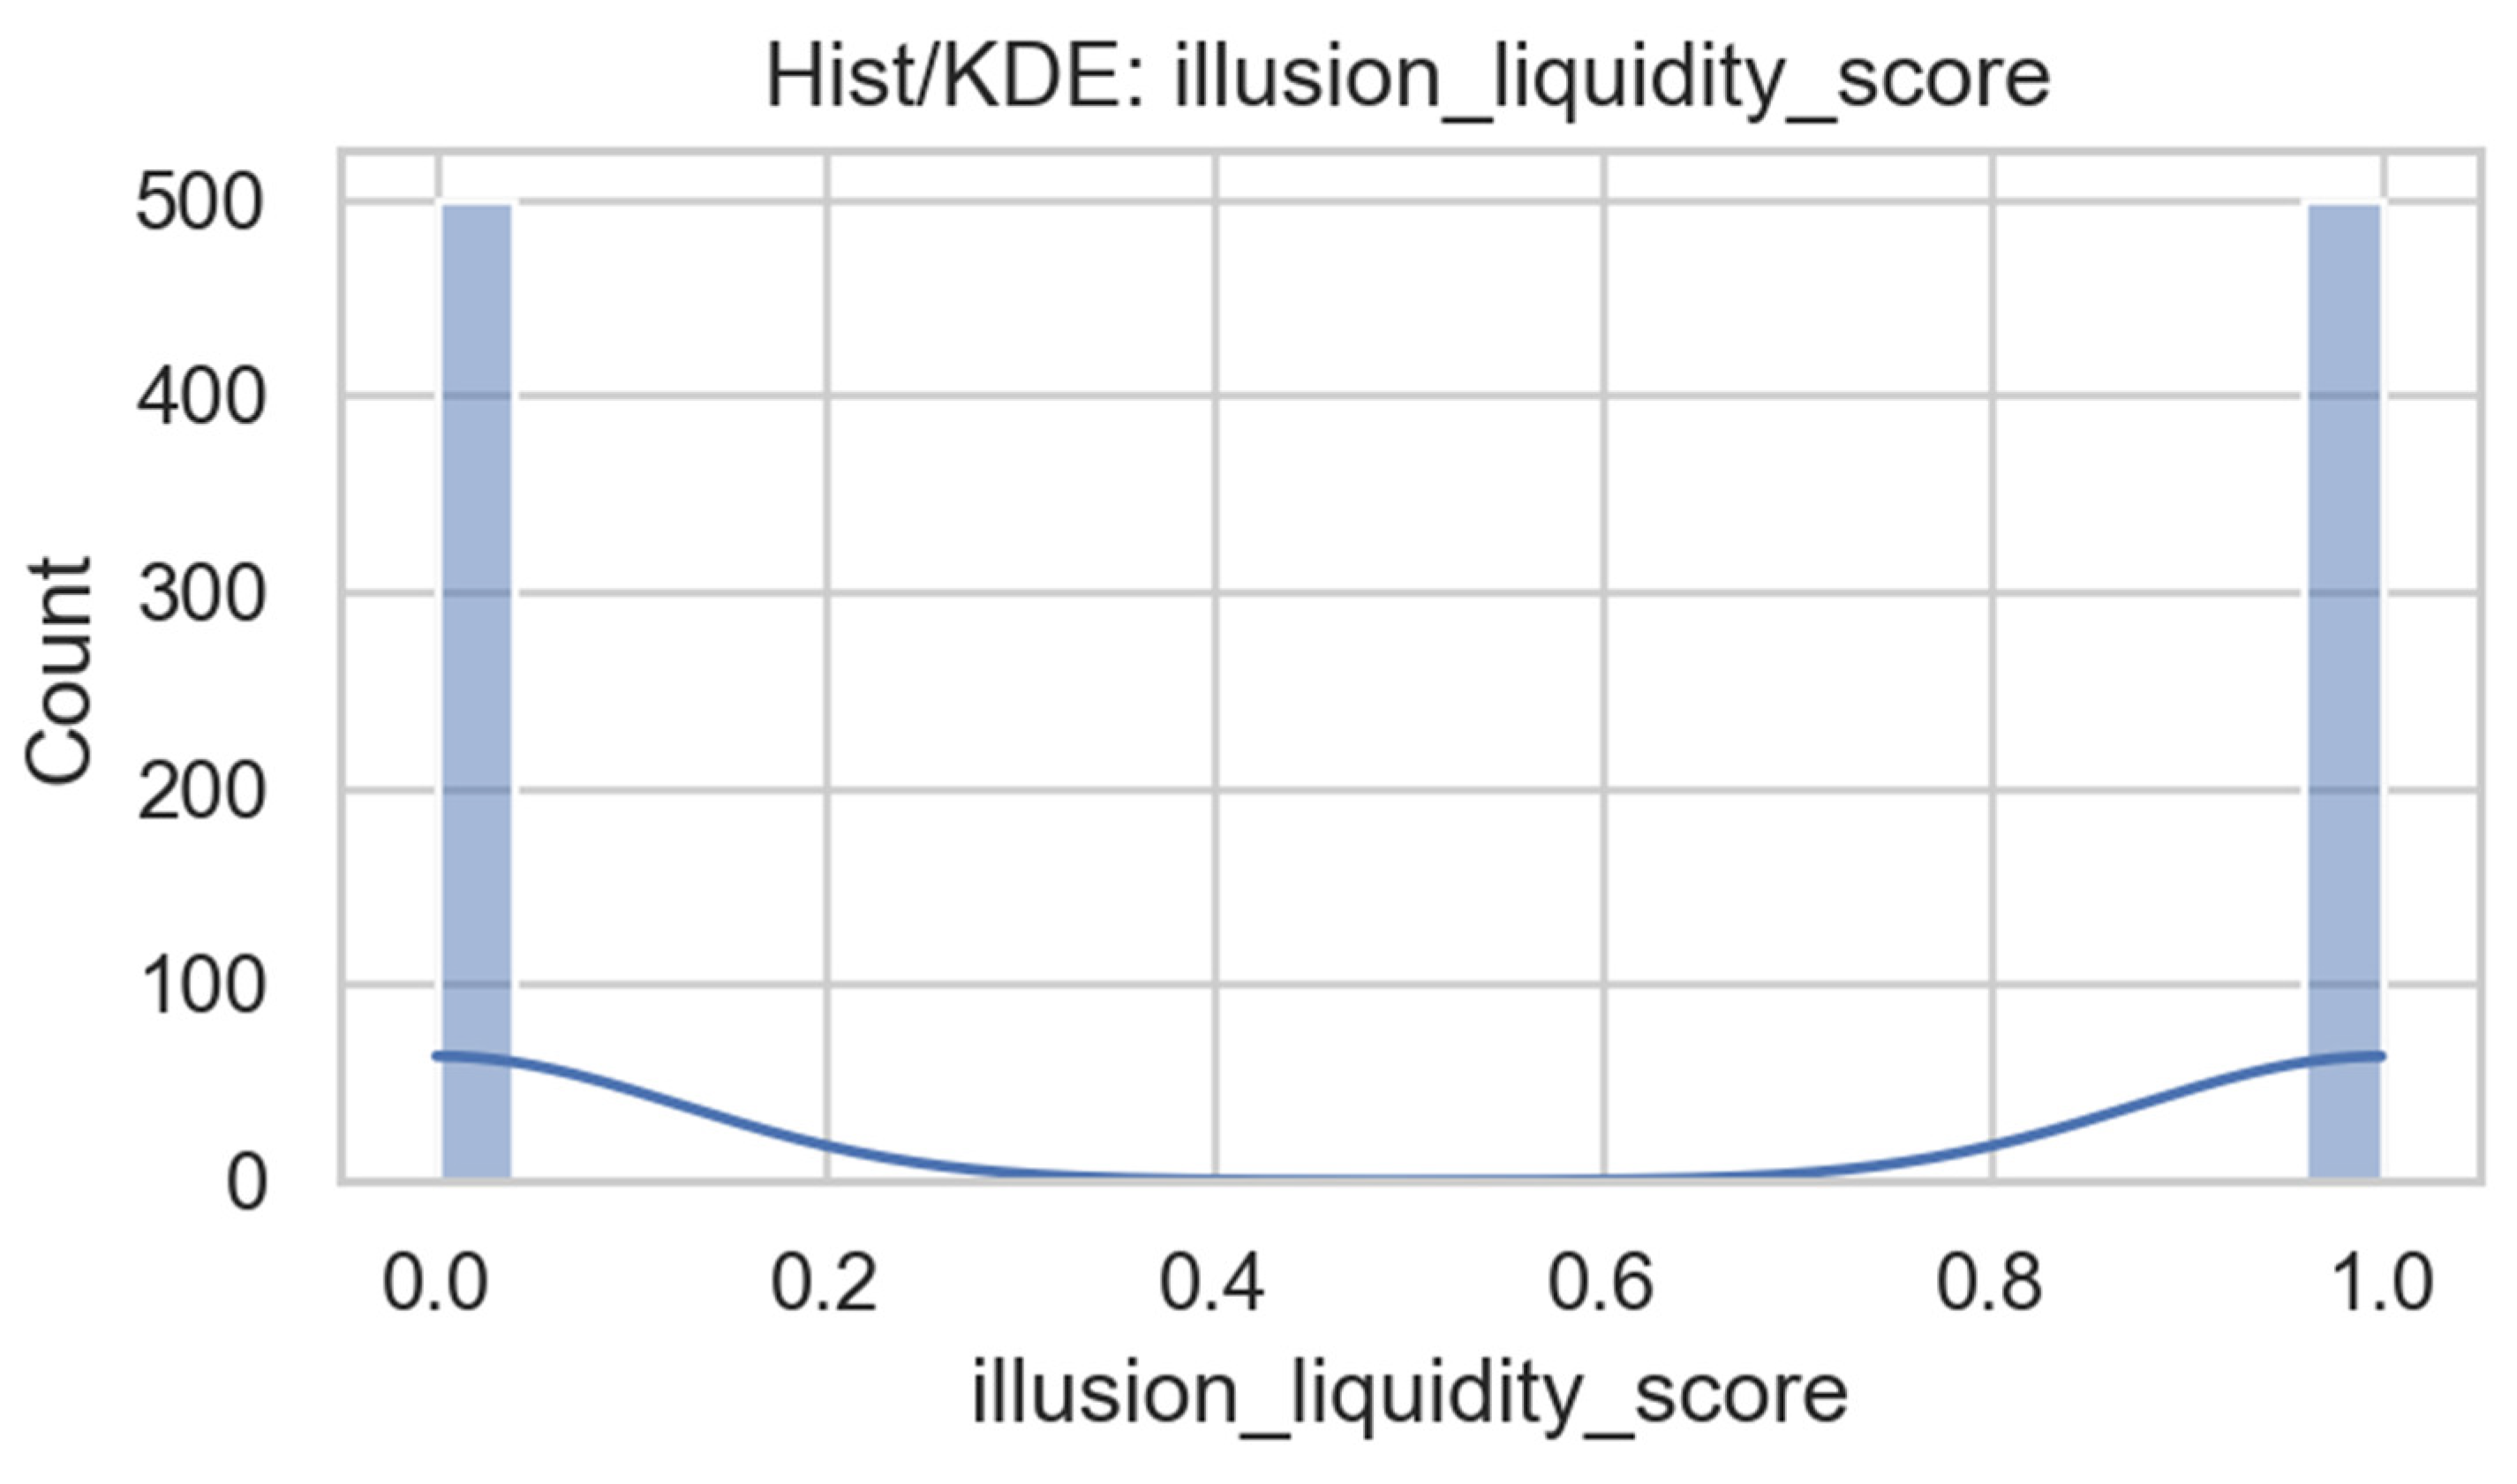
Figure 8.
Distribution of leverage (Hist/KDE), evidencing moderate variation and absence of extreme asymmetries. Source: Prepared by the authors.
Figure 8.
Distribution of leverage (Hist/KDE), evidencing moderate variation and absence of extreme asymmetries. Source: Prepared by the authors.
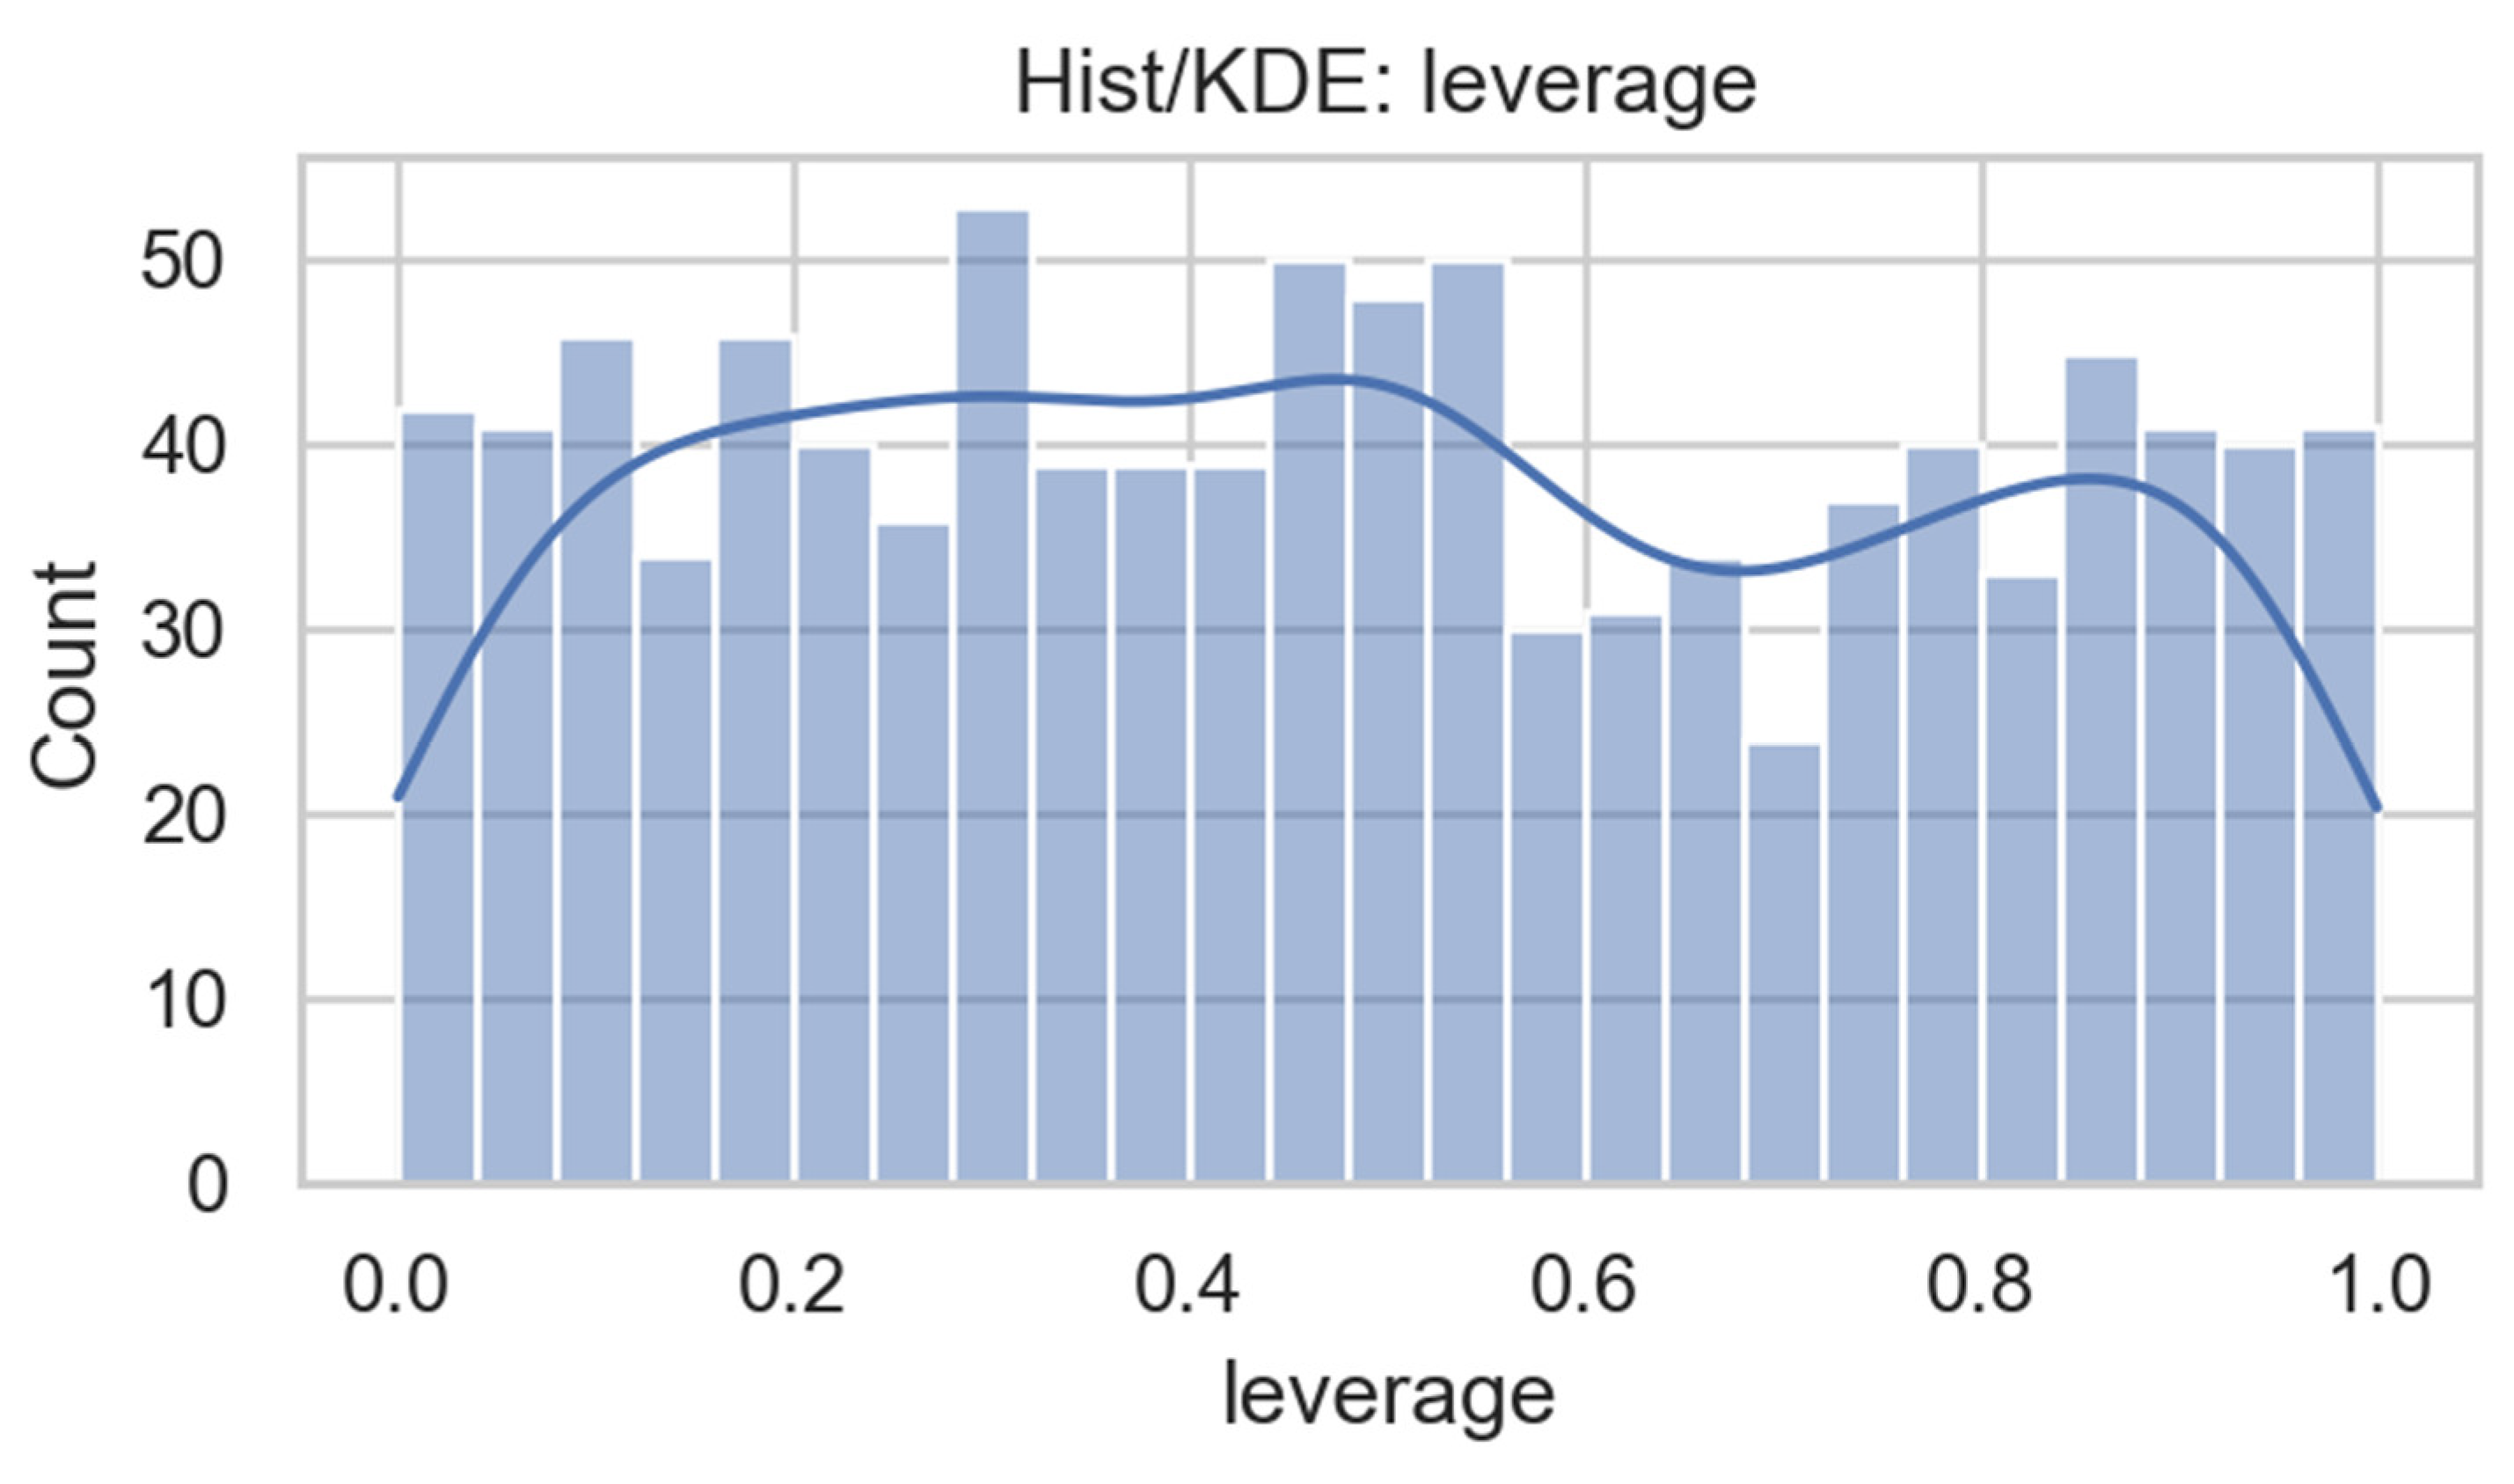
Figure 9.
Distribution of the Present Bias score, showing bimodal concentration consistent with short-term preference segmentation. Source: Prepared by the authors.
Figure 9.
Distribution of the Present Bias score, showing bimodal concentration consistent with short-term preference segmentation. Source: Prepared by the authors.
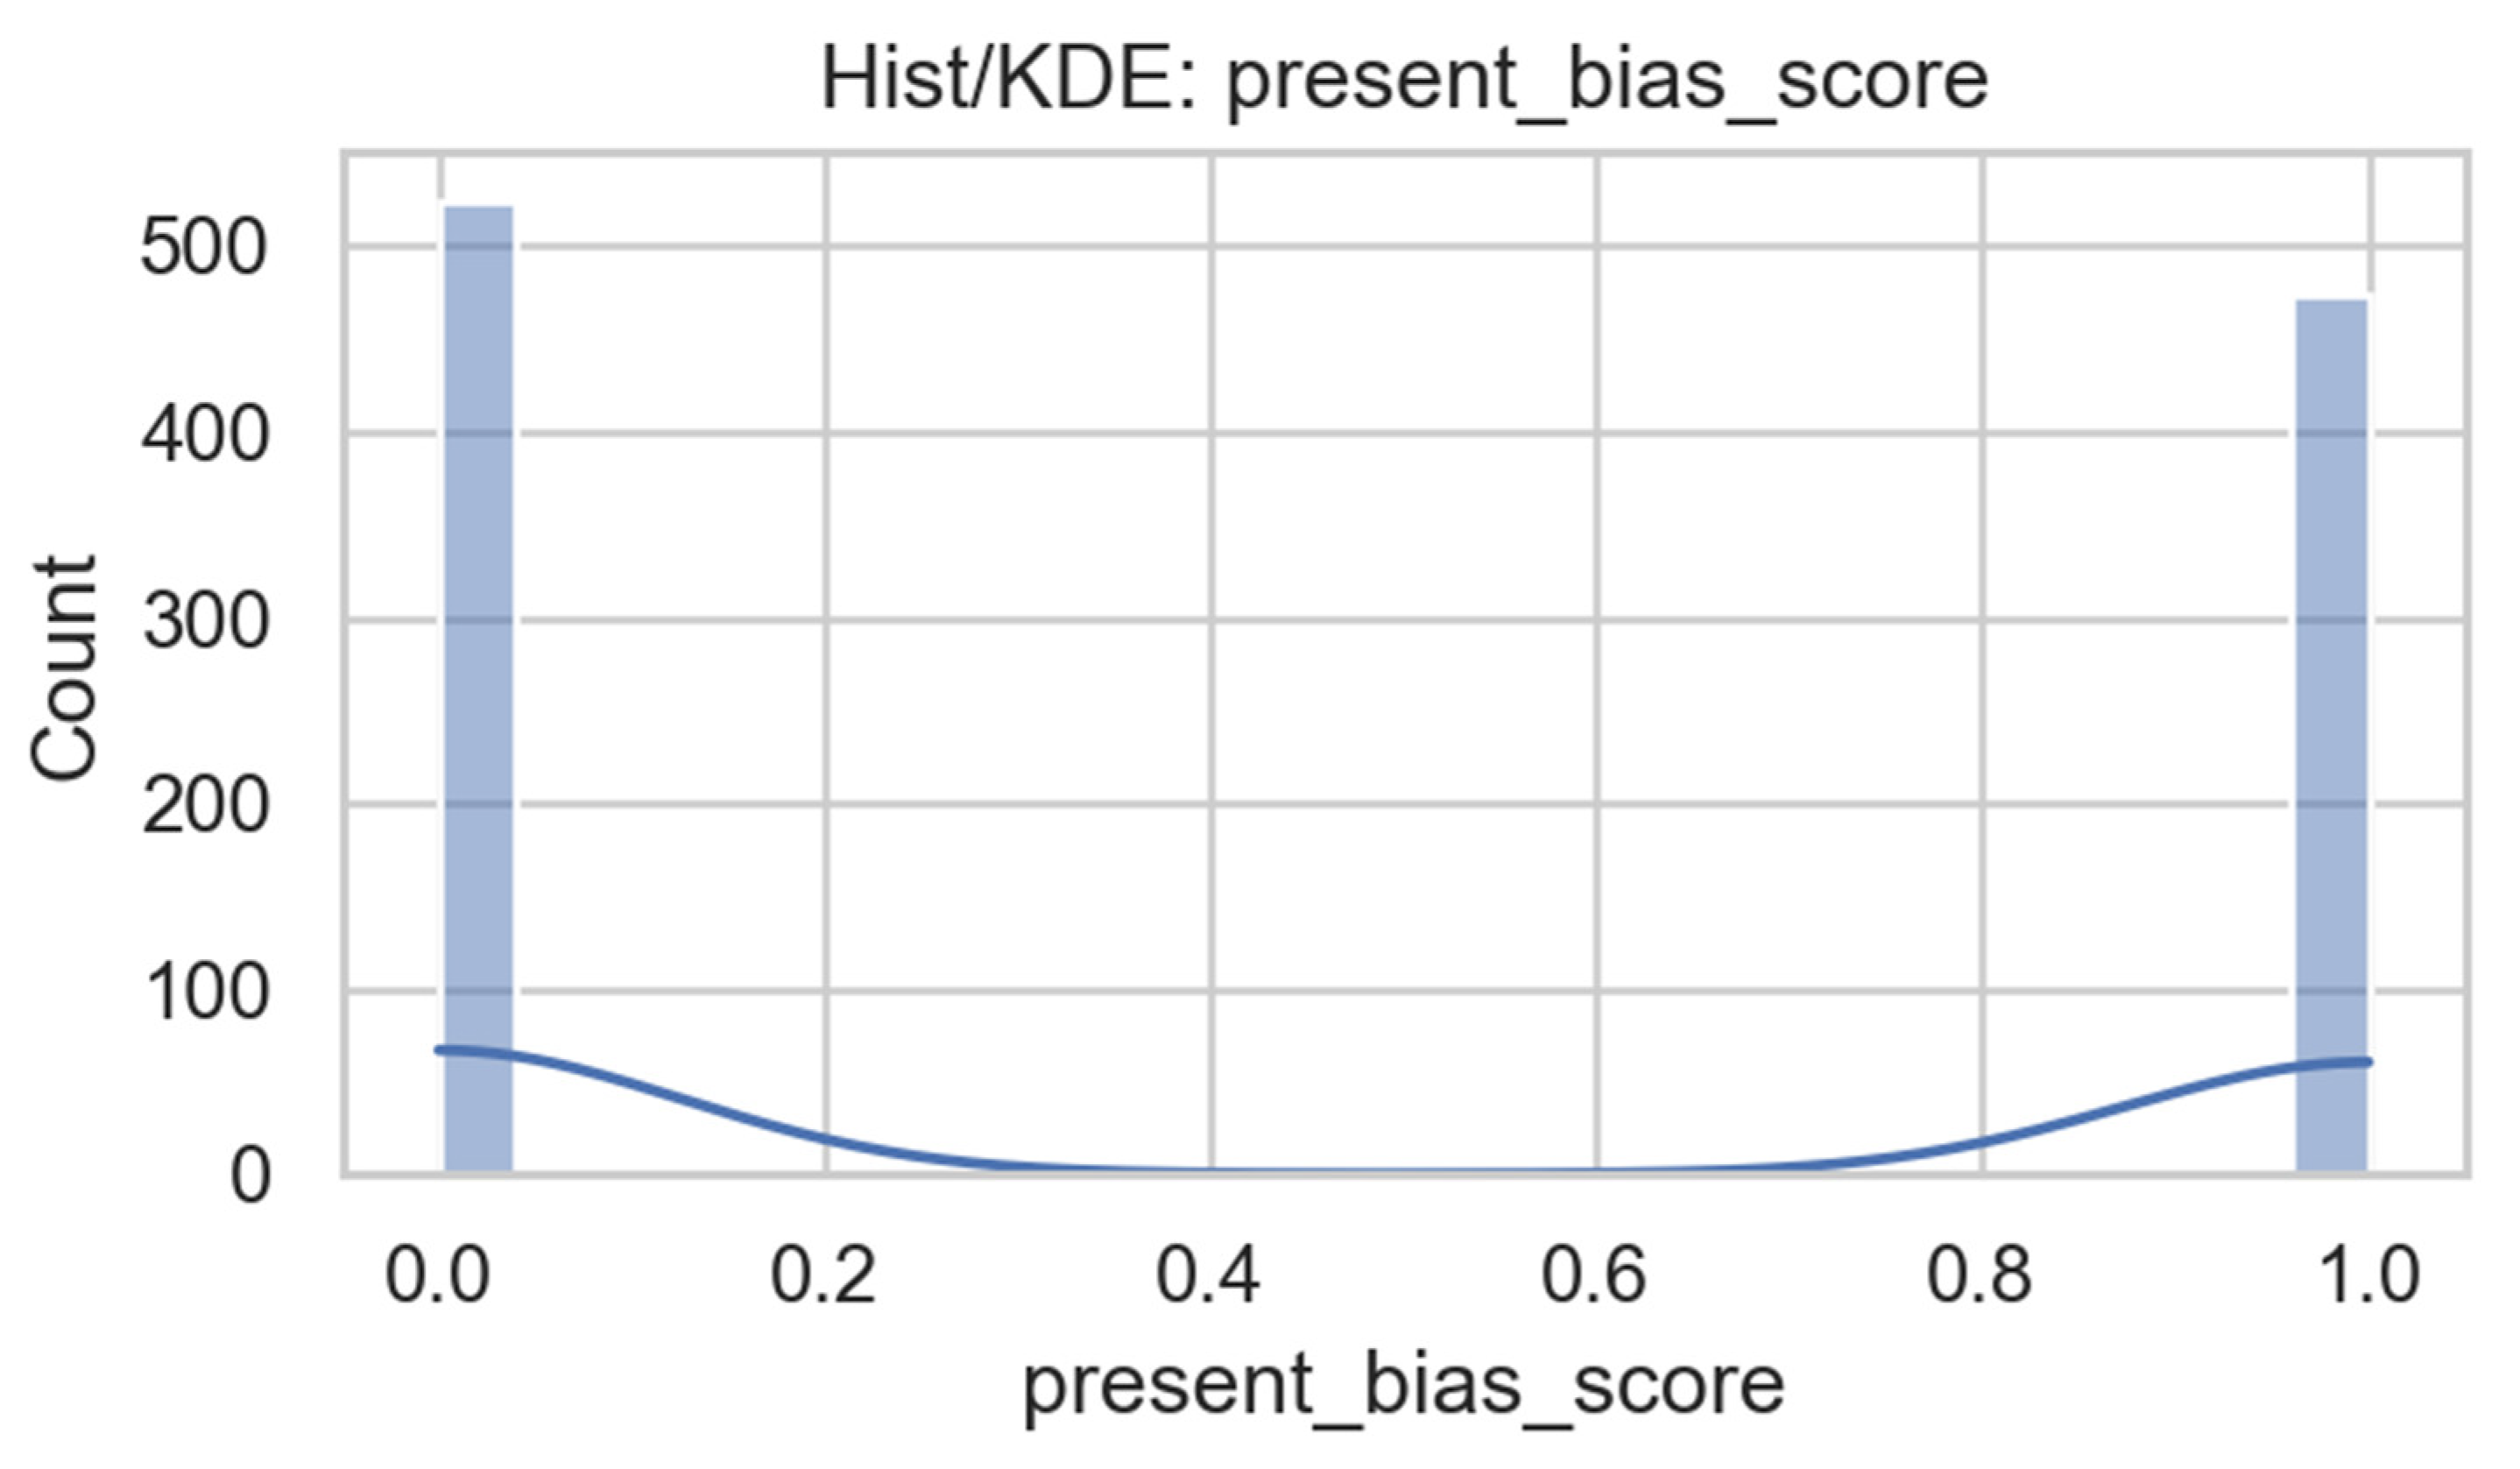
Figure 10.
Distribution of the dependent variable (financial distress) showing a 51.4%–48.6% split between distressed and non-distressed firms (pie chart). Source: Prepared by the authors.
Figure 10.
Distribution of the dependent variable (financial distress) showing a 51.4%–48.6% split between distressed and non-distressed firms (pie chart). Source: Prepared by the authors.
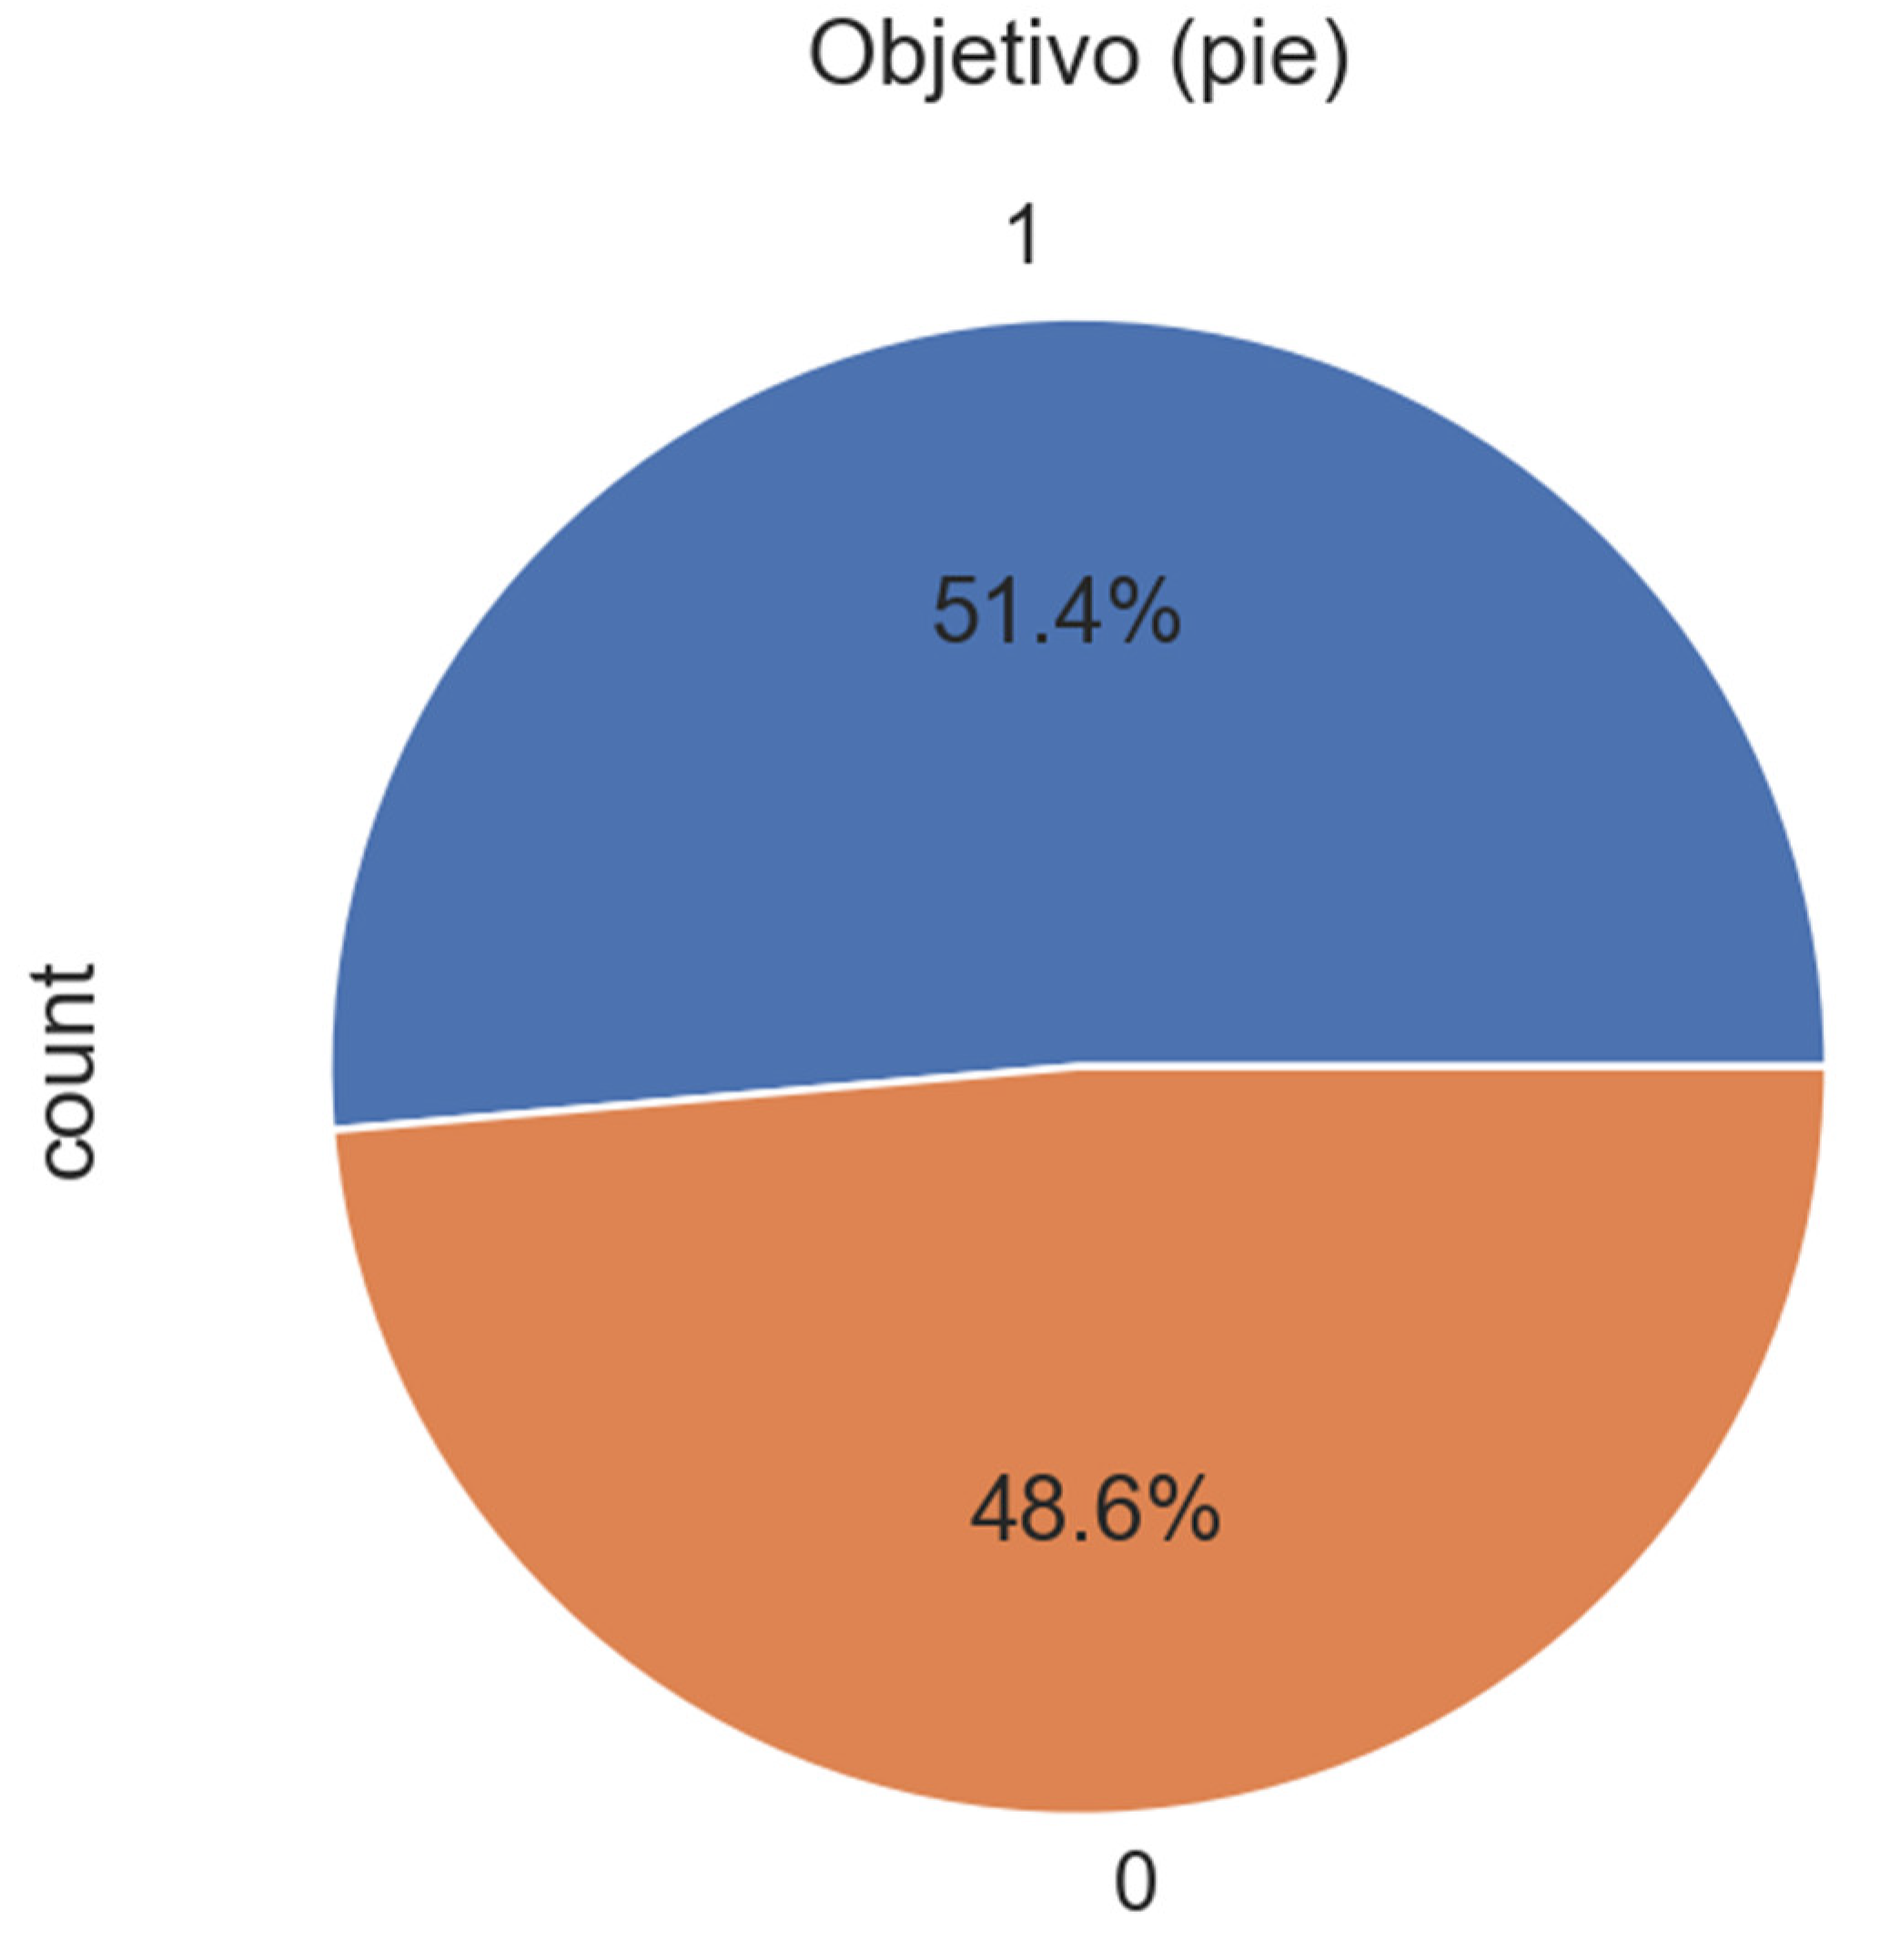
Figure 11.
Bar chart representation of the dependent variable, confirming balanced sample proportions between firms in financial distress (1) and non-distressed firms (0). Source: Prepared by the authors.
Figure 11.
Bar chart representation of the dependent variable, confirming balanced sample proportions between firms in financial distress (1) and non-distressed firms (0). Source: Prepared by the authors.
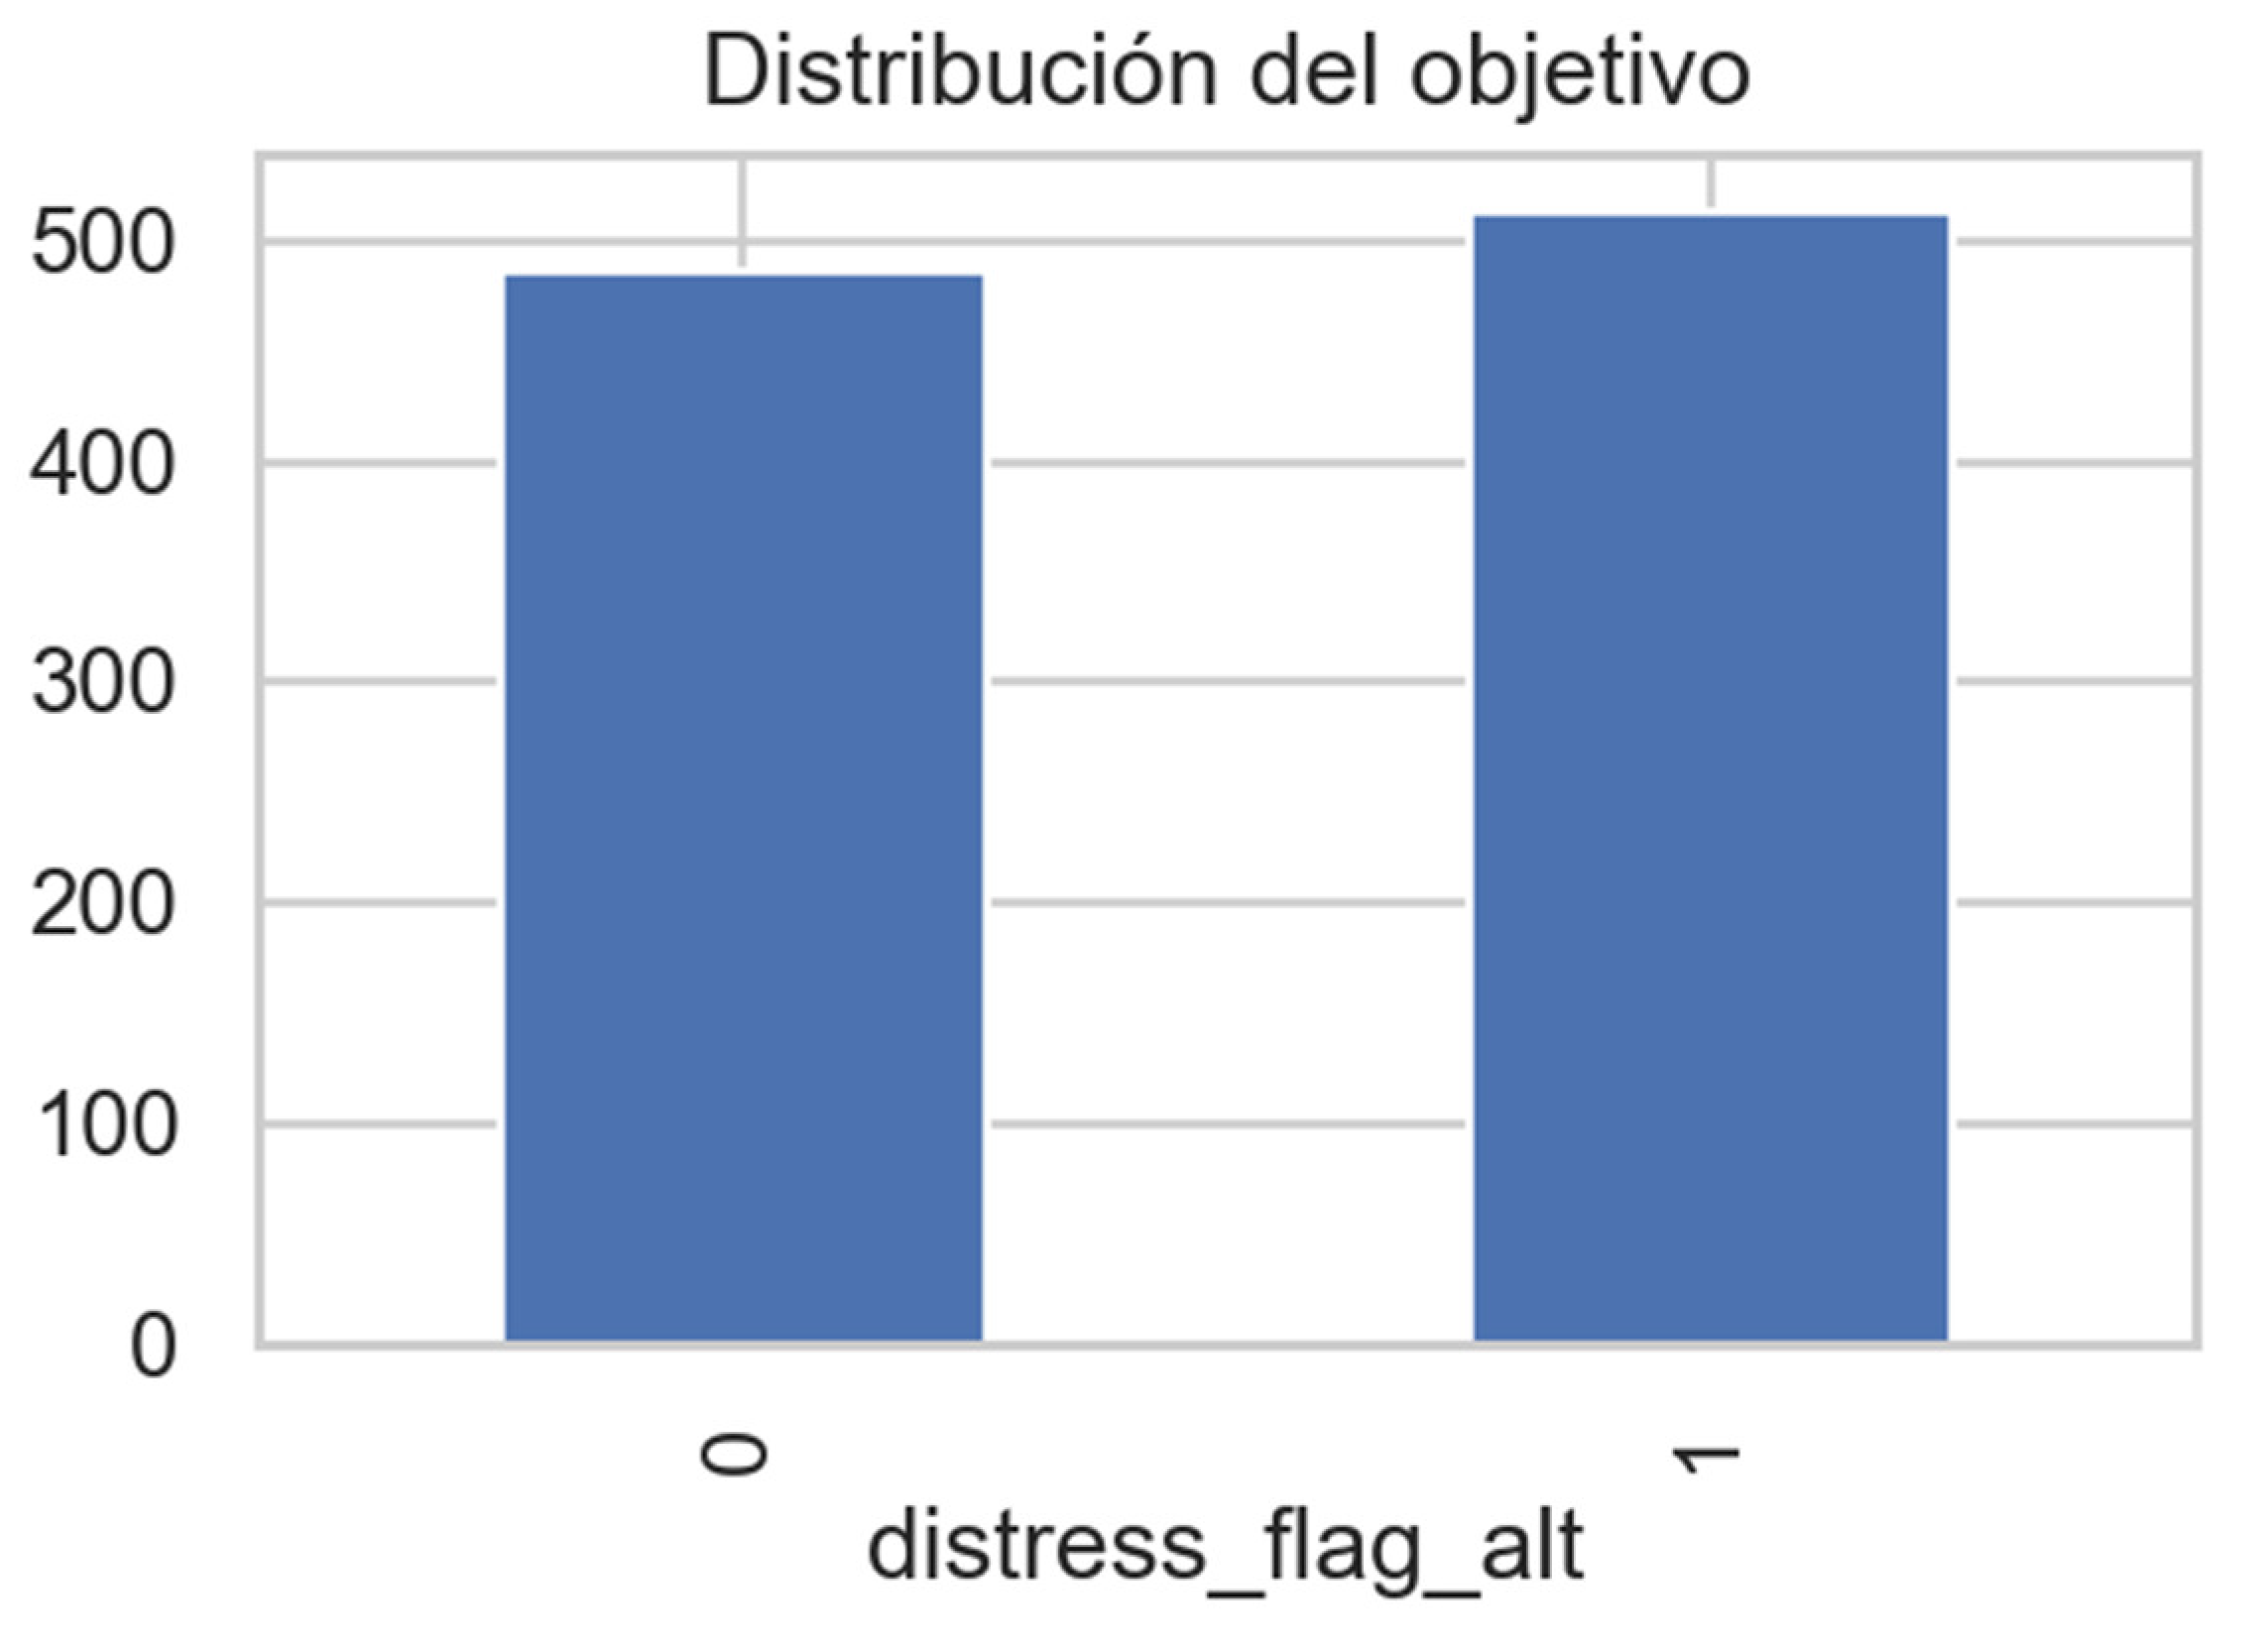
Figure 12.
Dispersion matrix of financial variables and cognitive-bias proxies by financial-distress status. The color coding (0 = non-distressed, 1 = distressed) highlights increased variability in leverage and illusory-liquidity patterns among vulnerable firms. Source: Prepared by the authors.
Figure 12.
Dispersion matrix of financial variables and cognitive-bias proxies by financial-distress status. The color coding (0 = non-distressed, 1 = distressed) highlights increased variability in leverage and illusory-liquidity patterns among vulnerable firms. Source: Prepared by the authors.
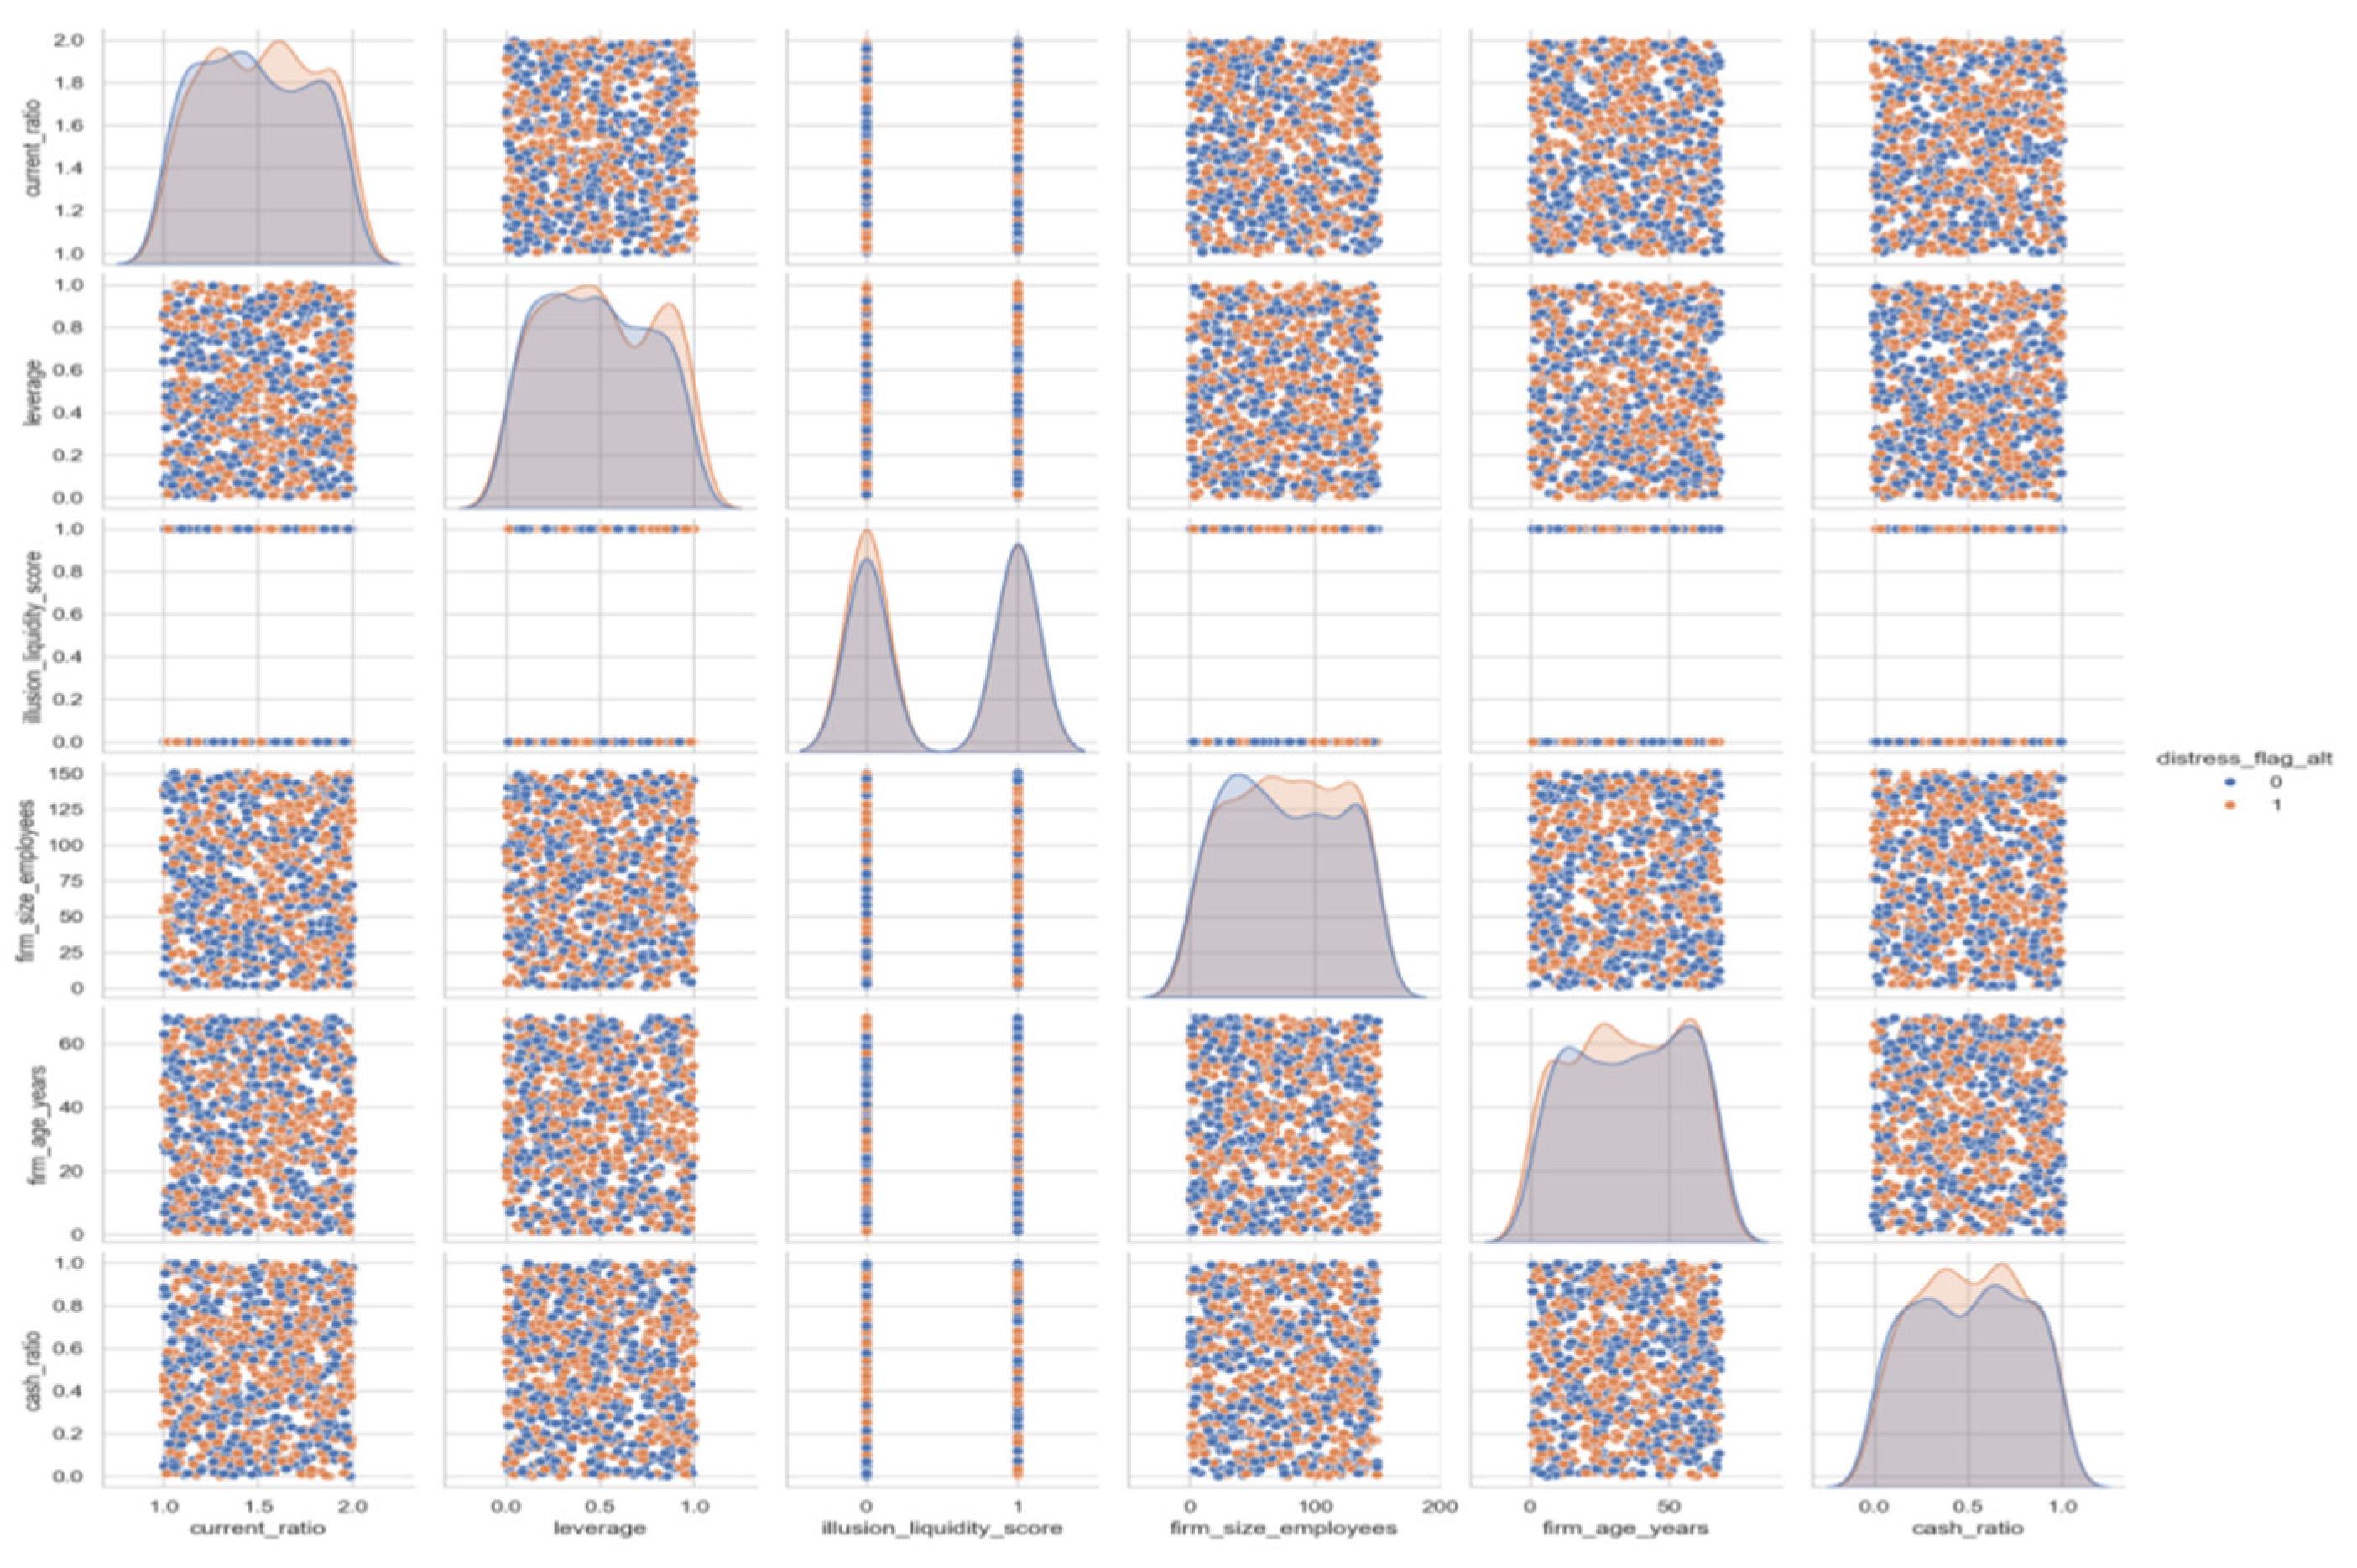
Figure 13.
Boxplot of cash ratio by financial-distress class.
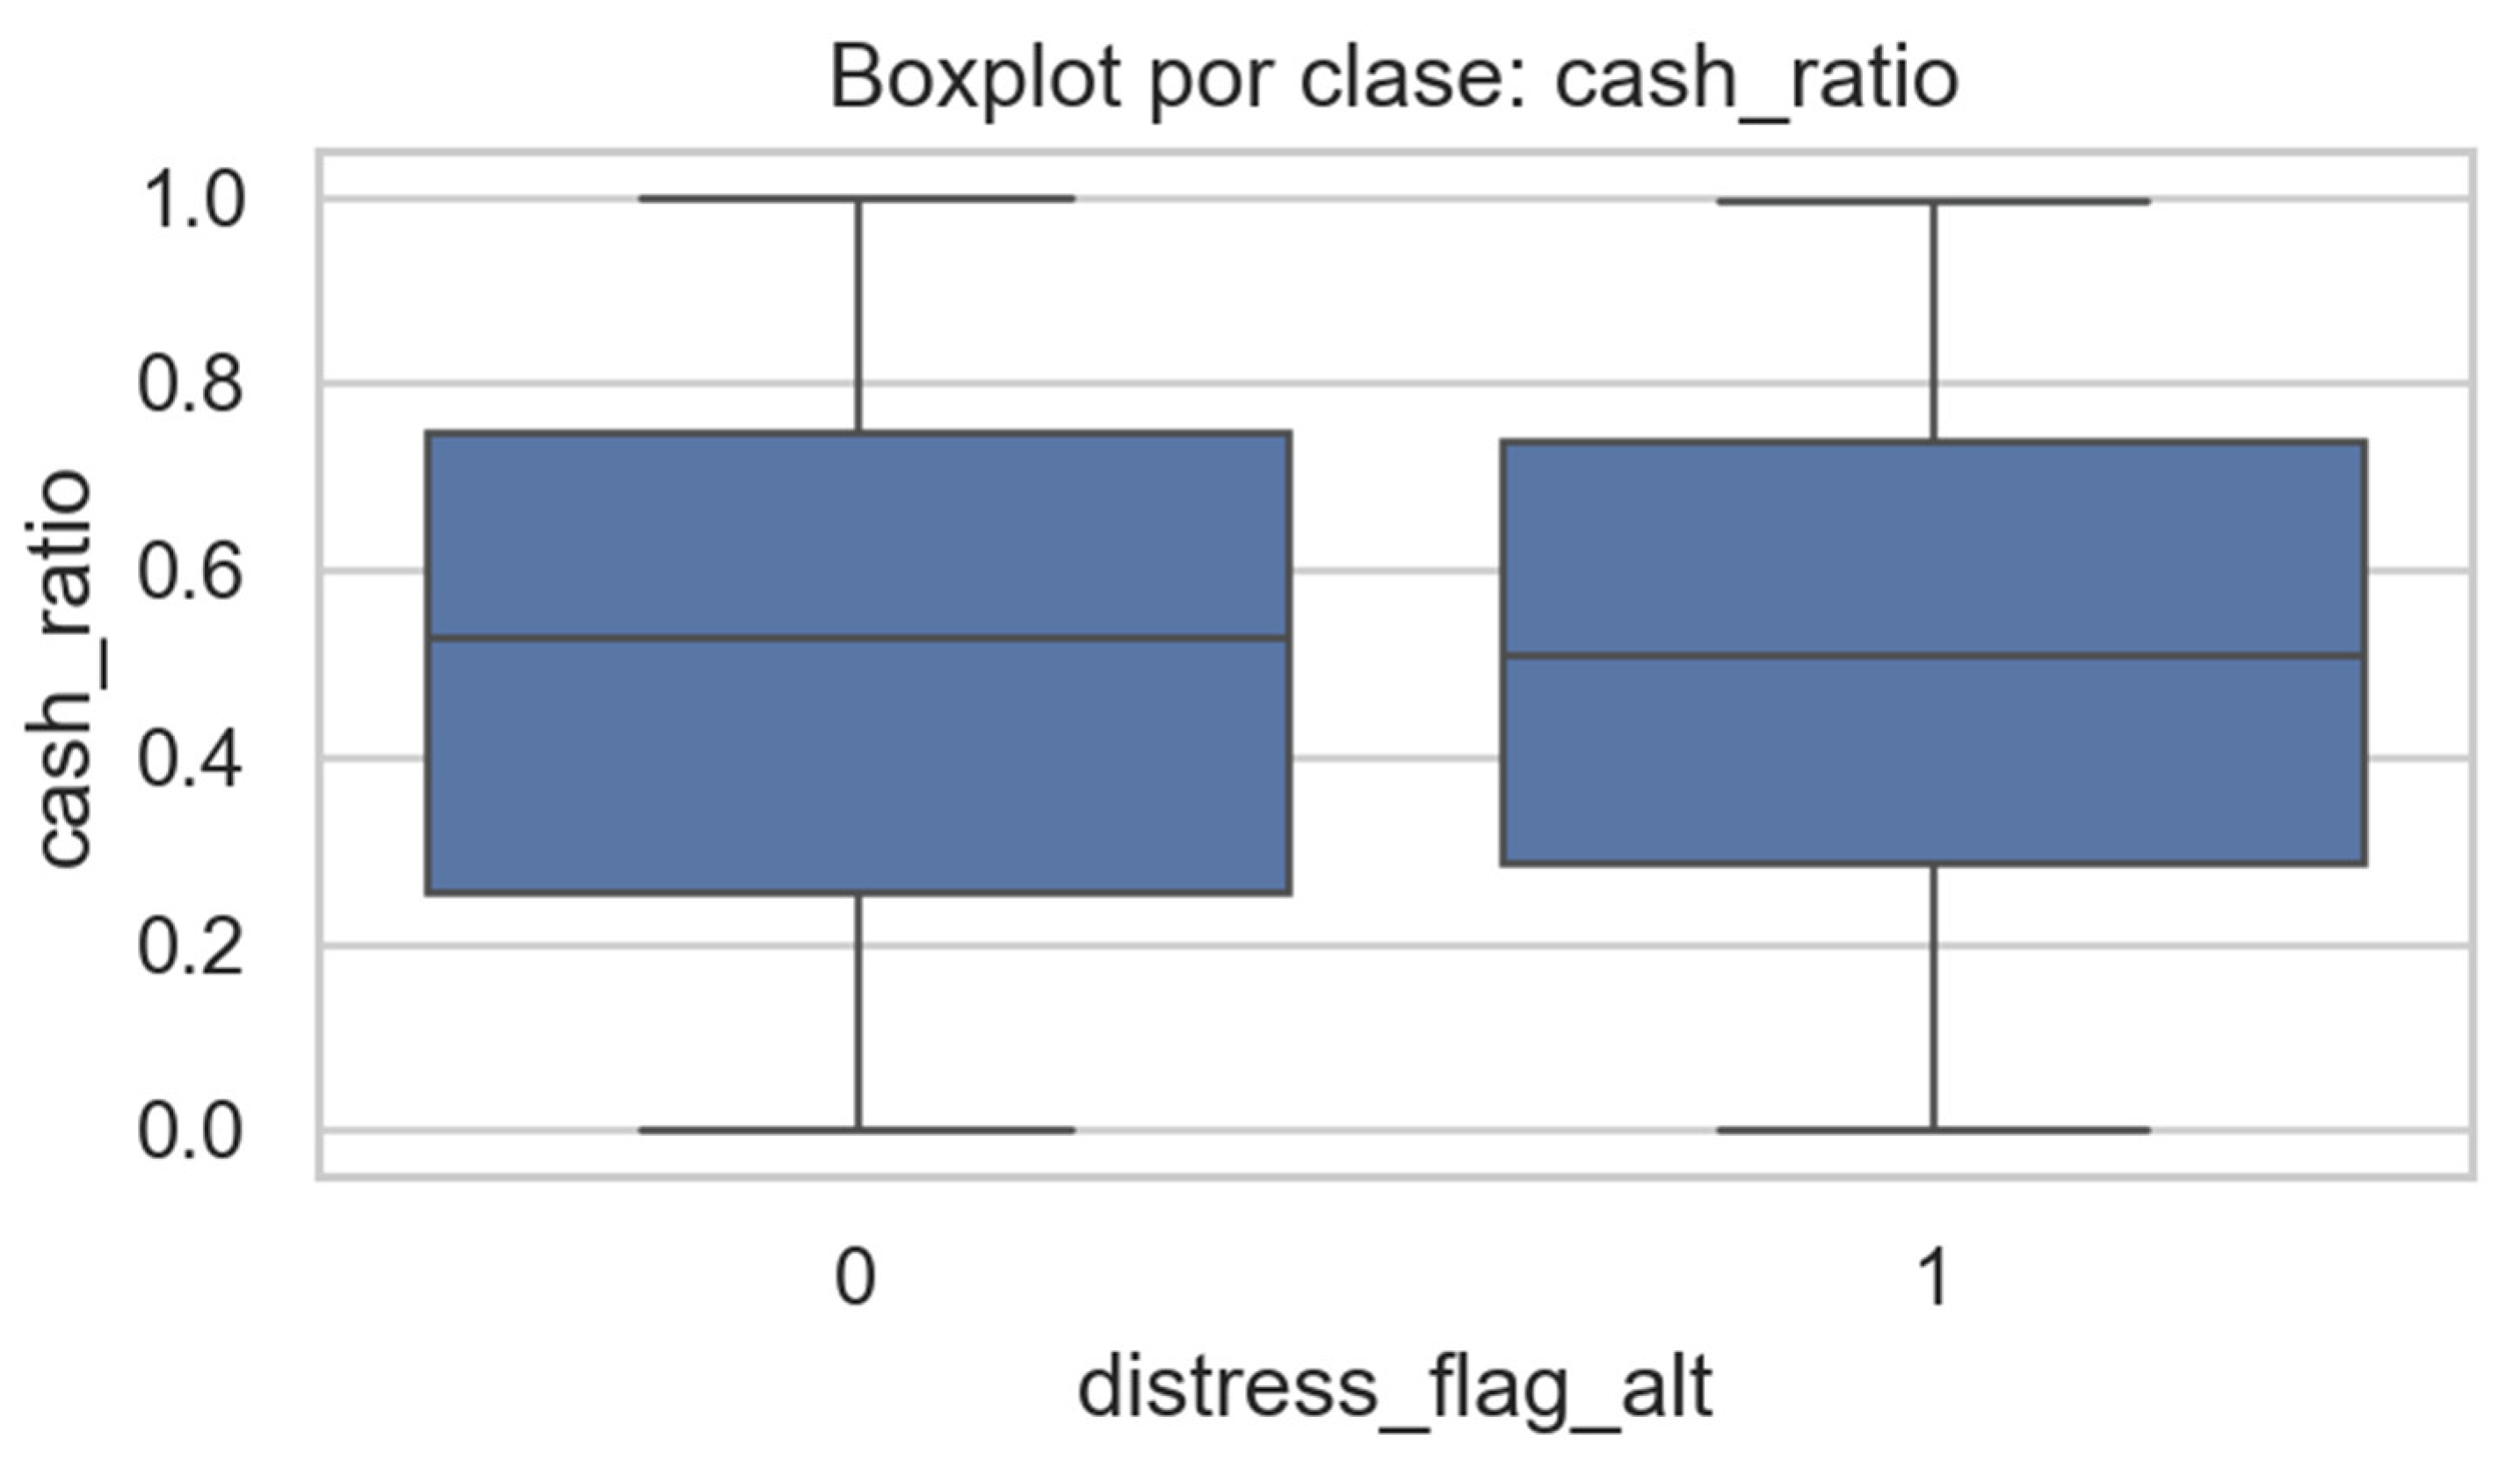
Figure 14.
Boxplot of current ratio by financial-distress class.
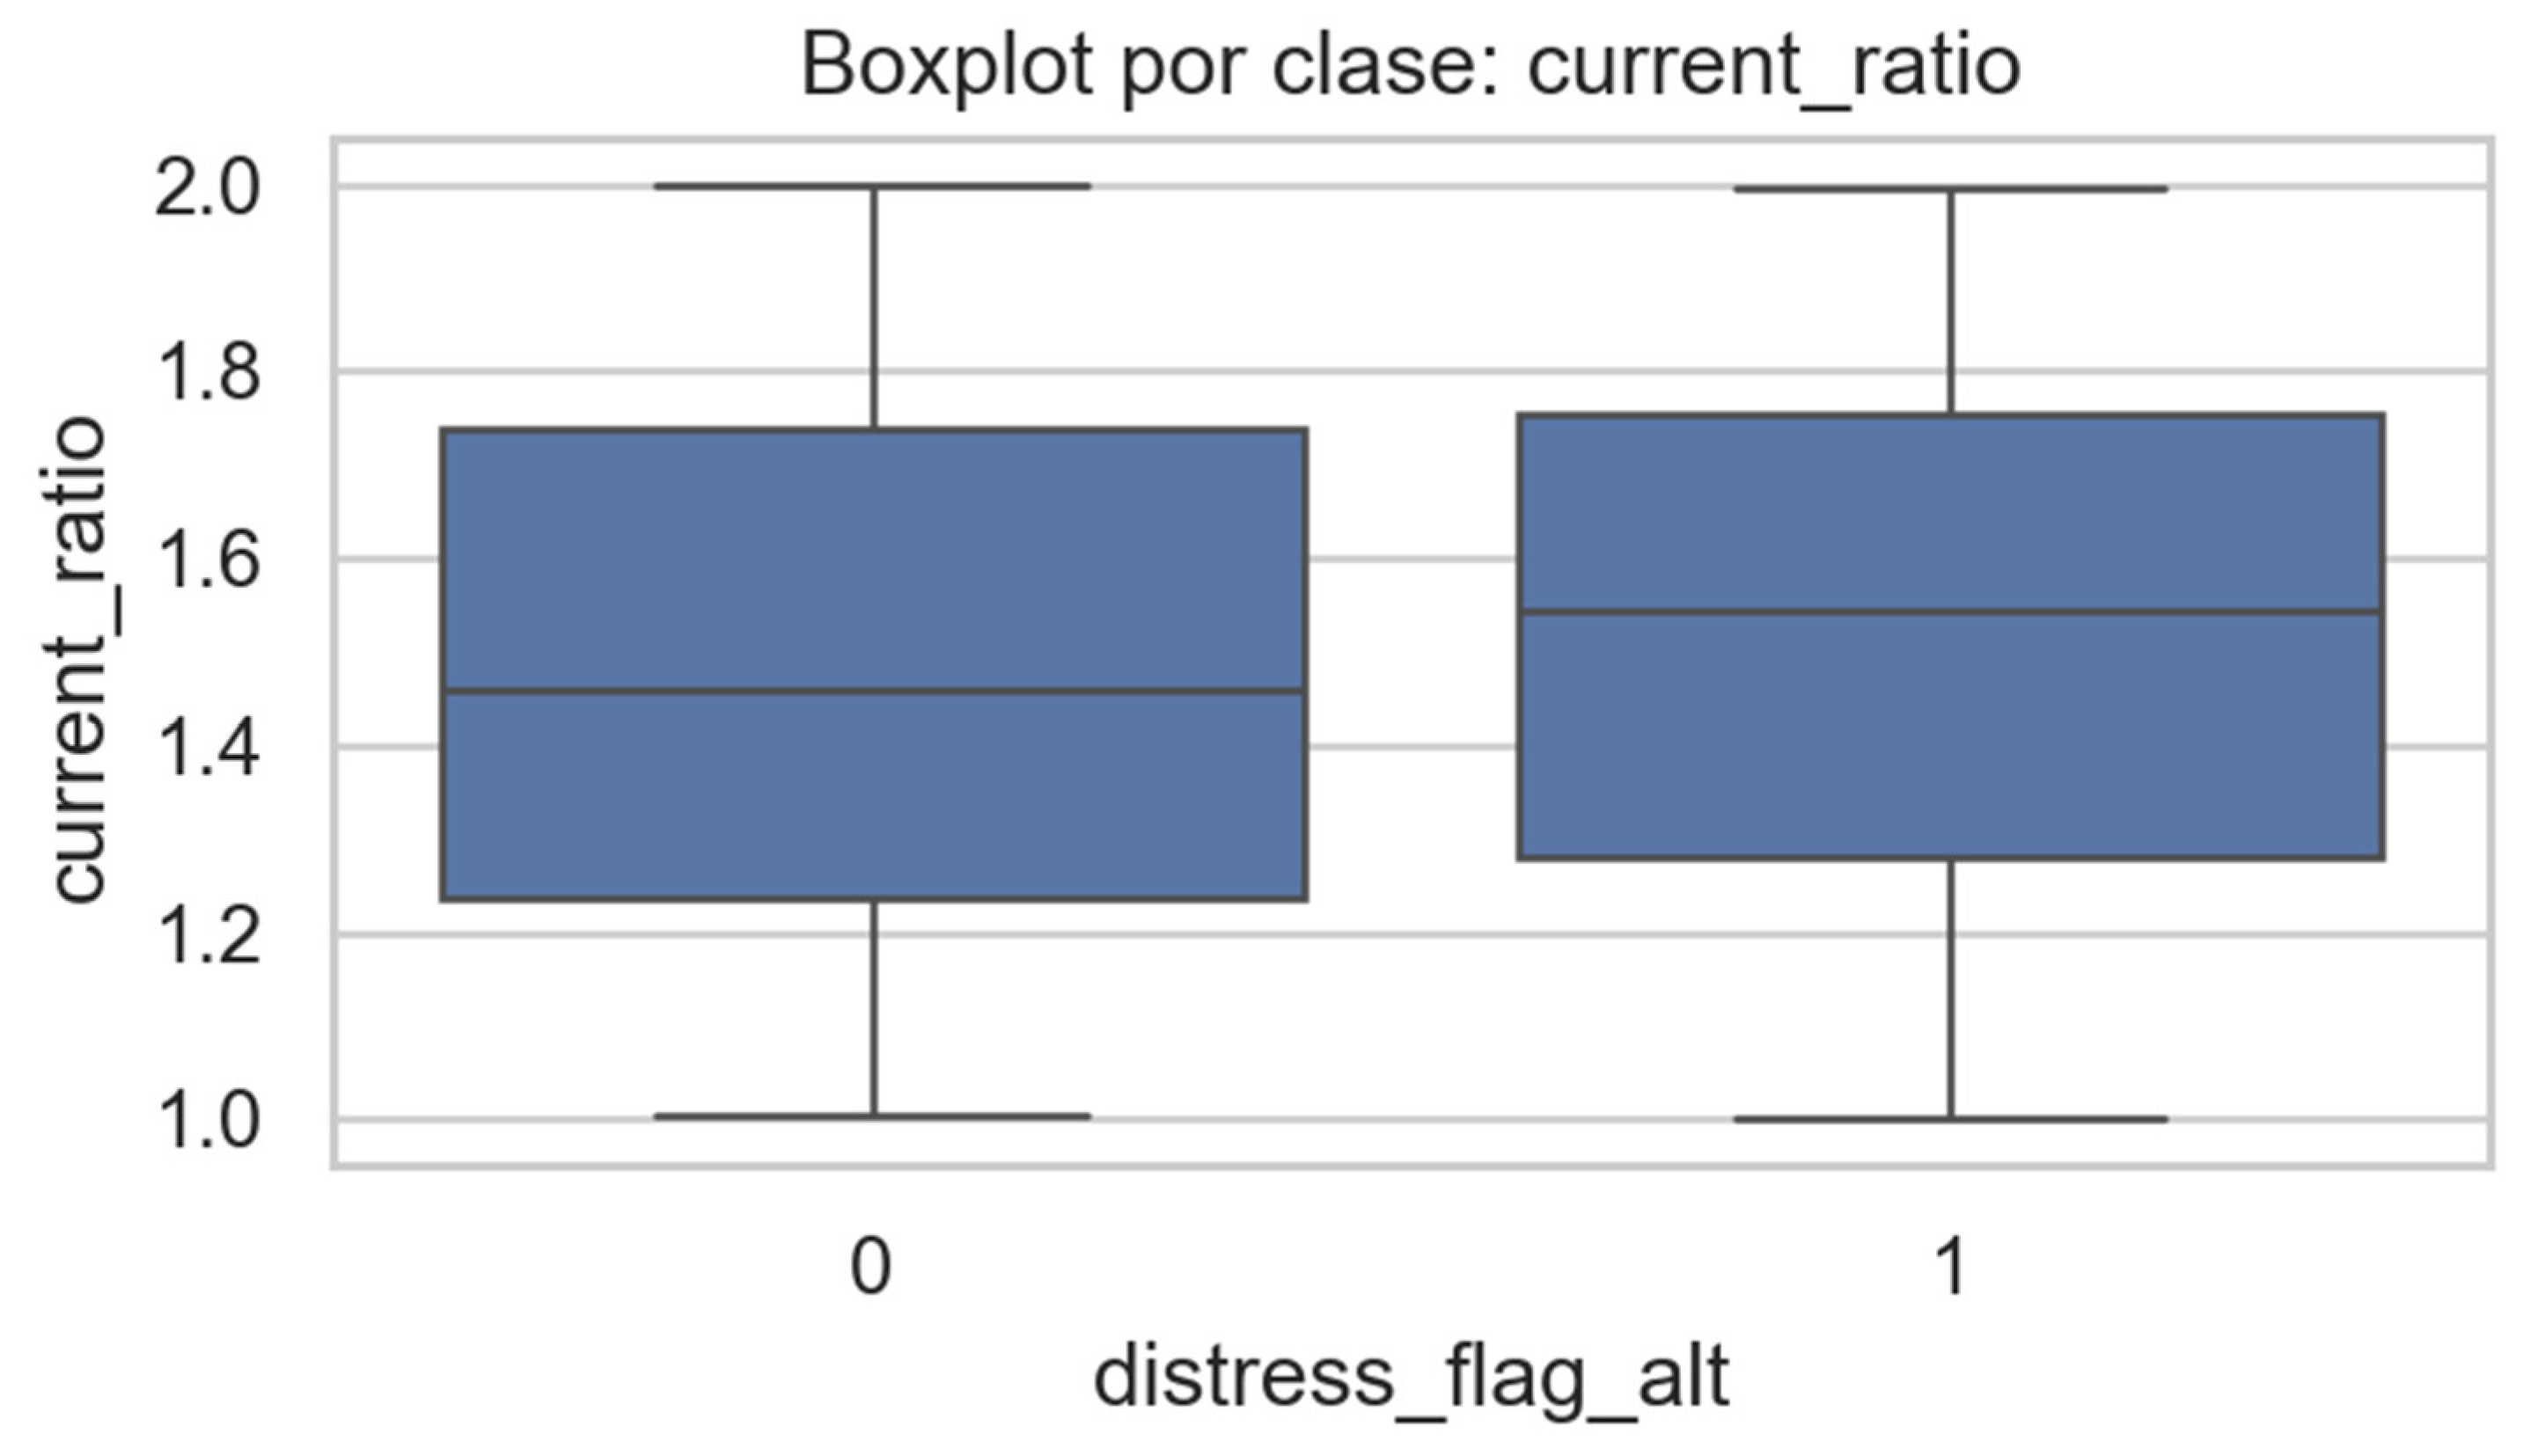
Figure 15.
Boxplot of firm age by financial-distress class.
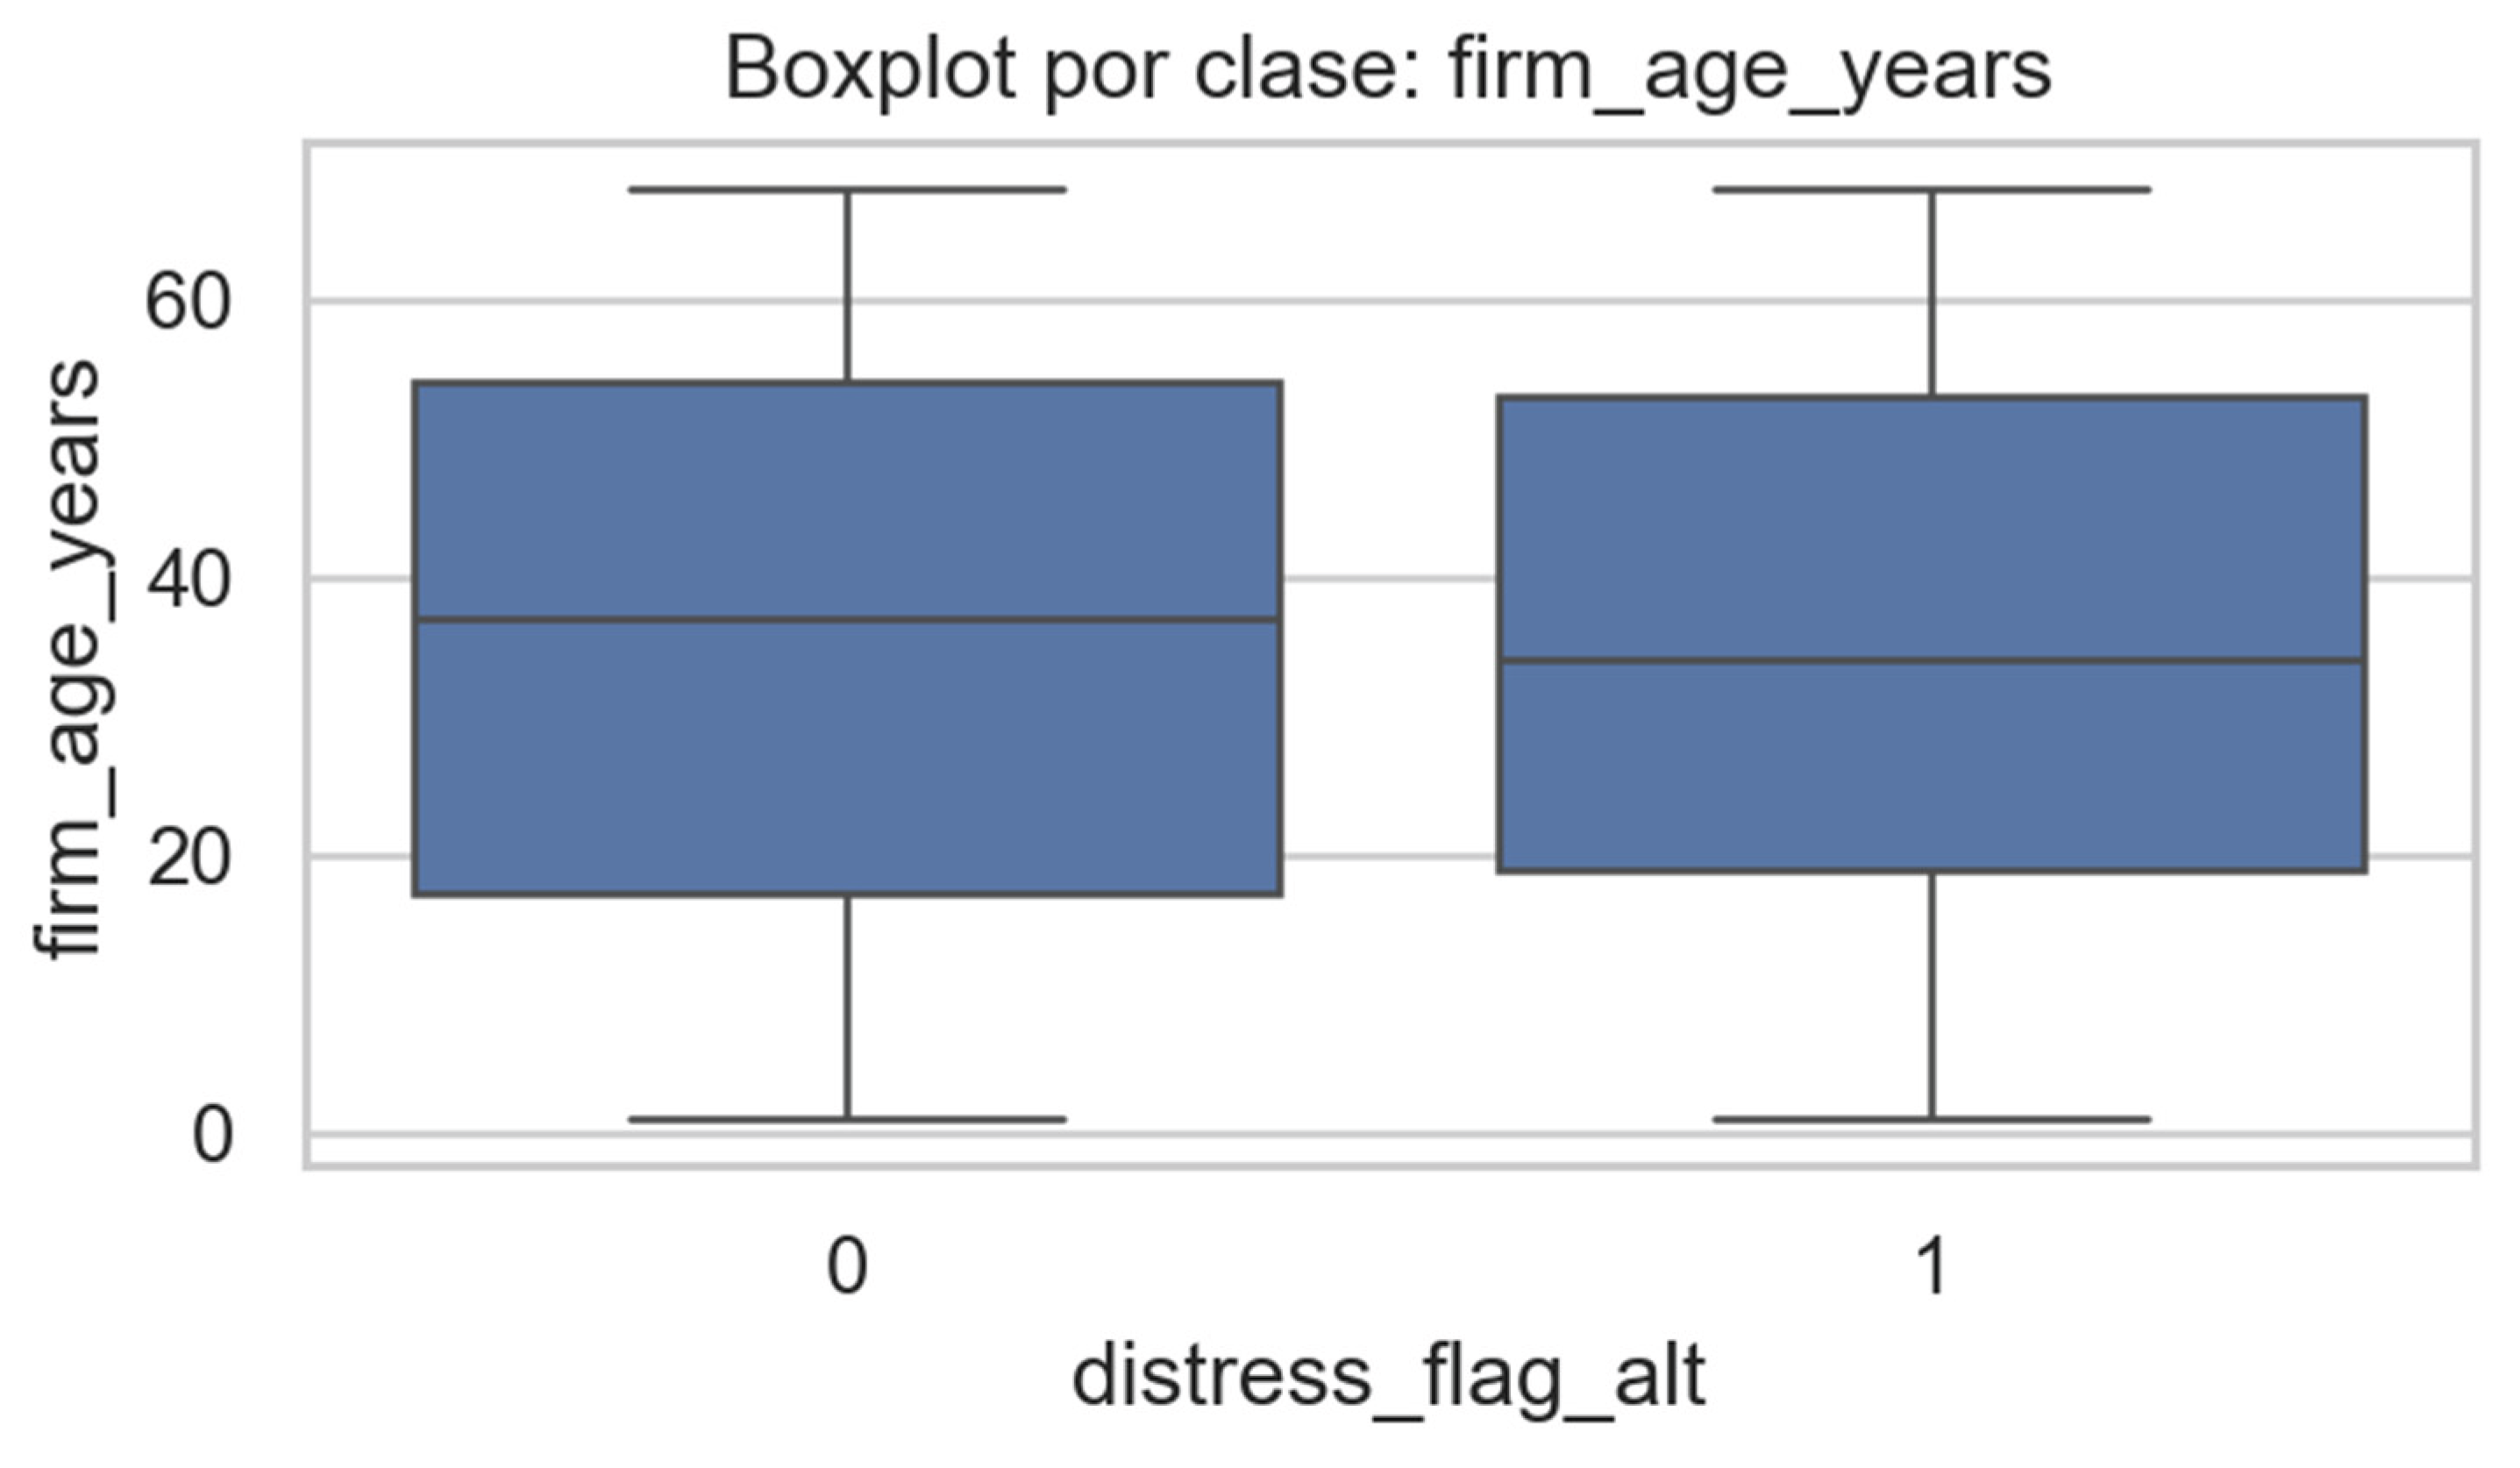
Figure 16.
Boxplot of firm size (employees) by financial-distress class.
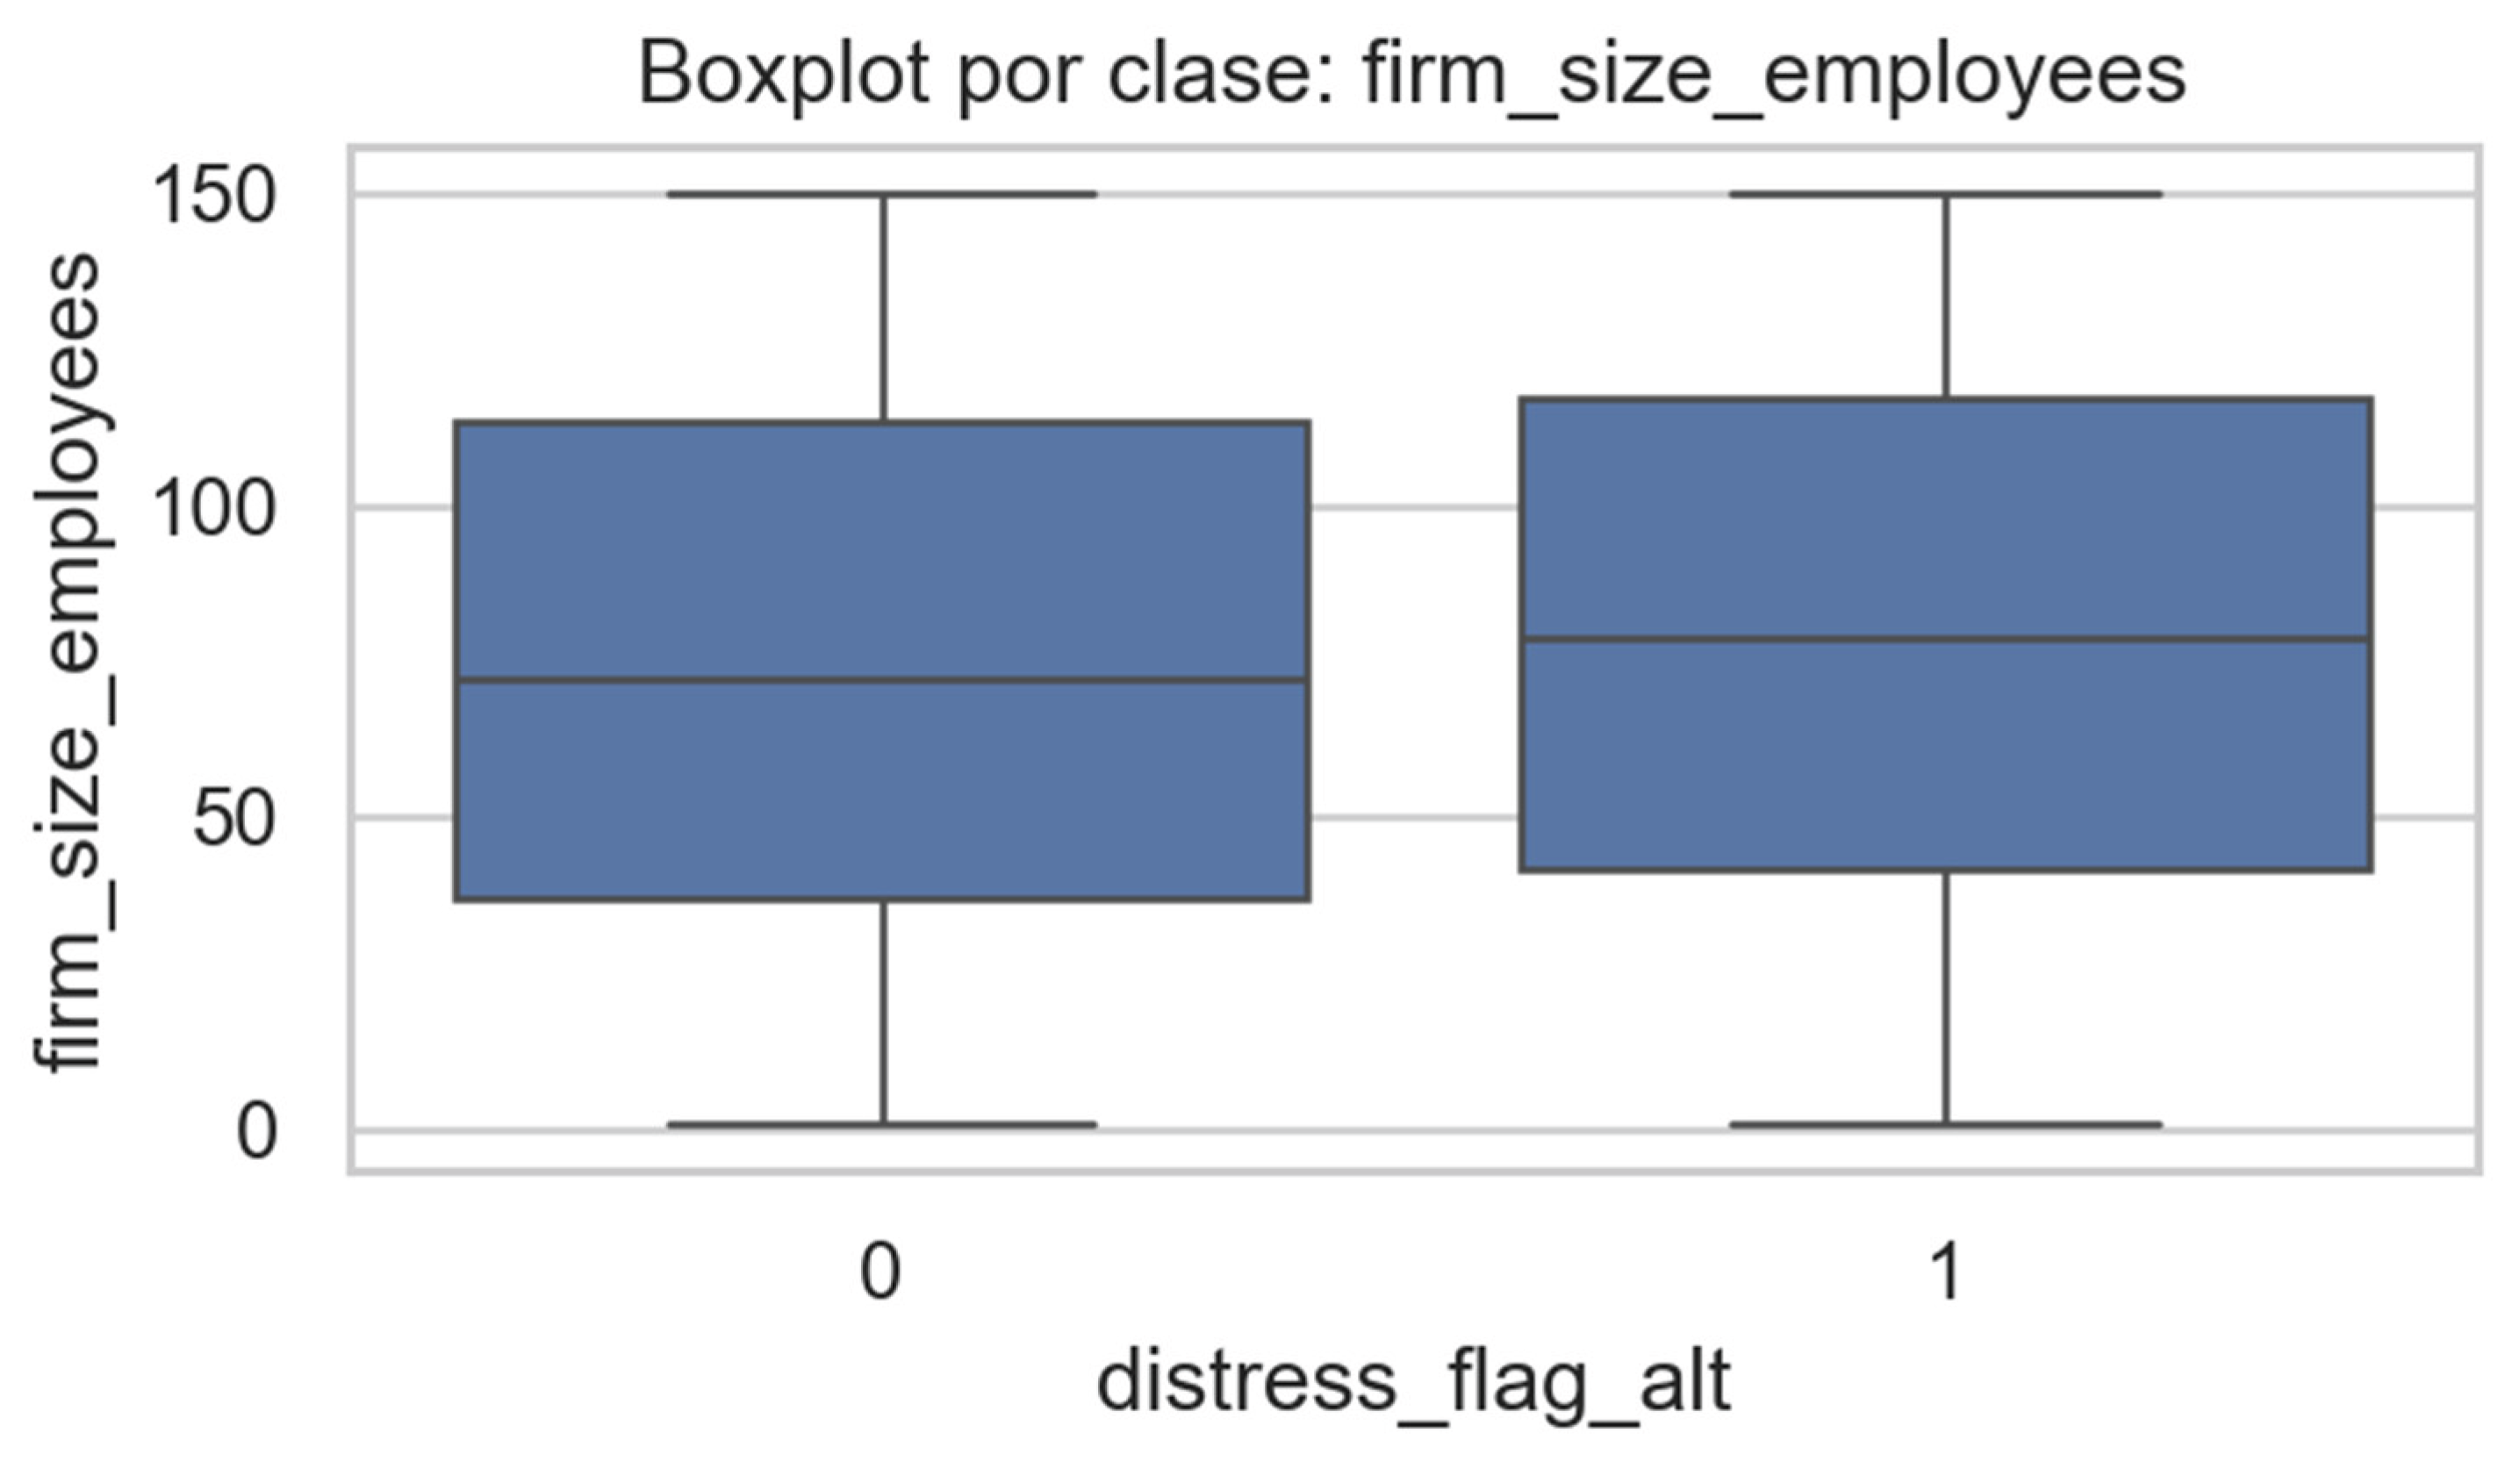
Figure 17.
Boxplot of leverage by financial-distress class.
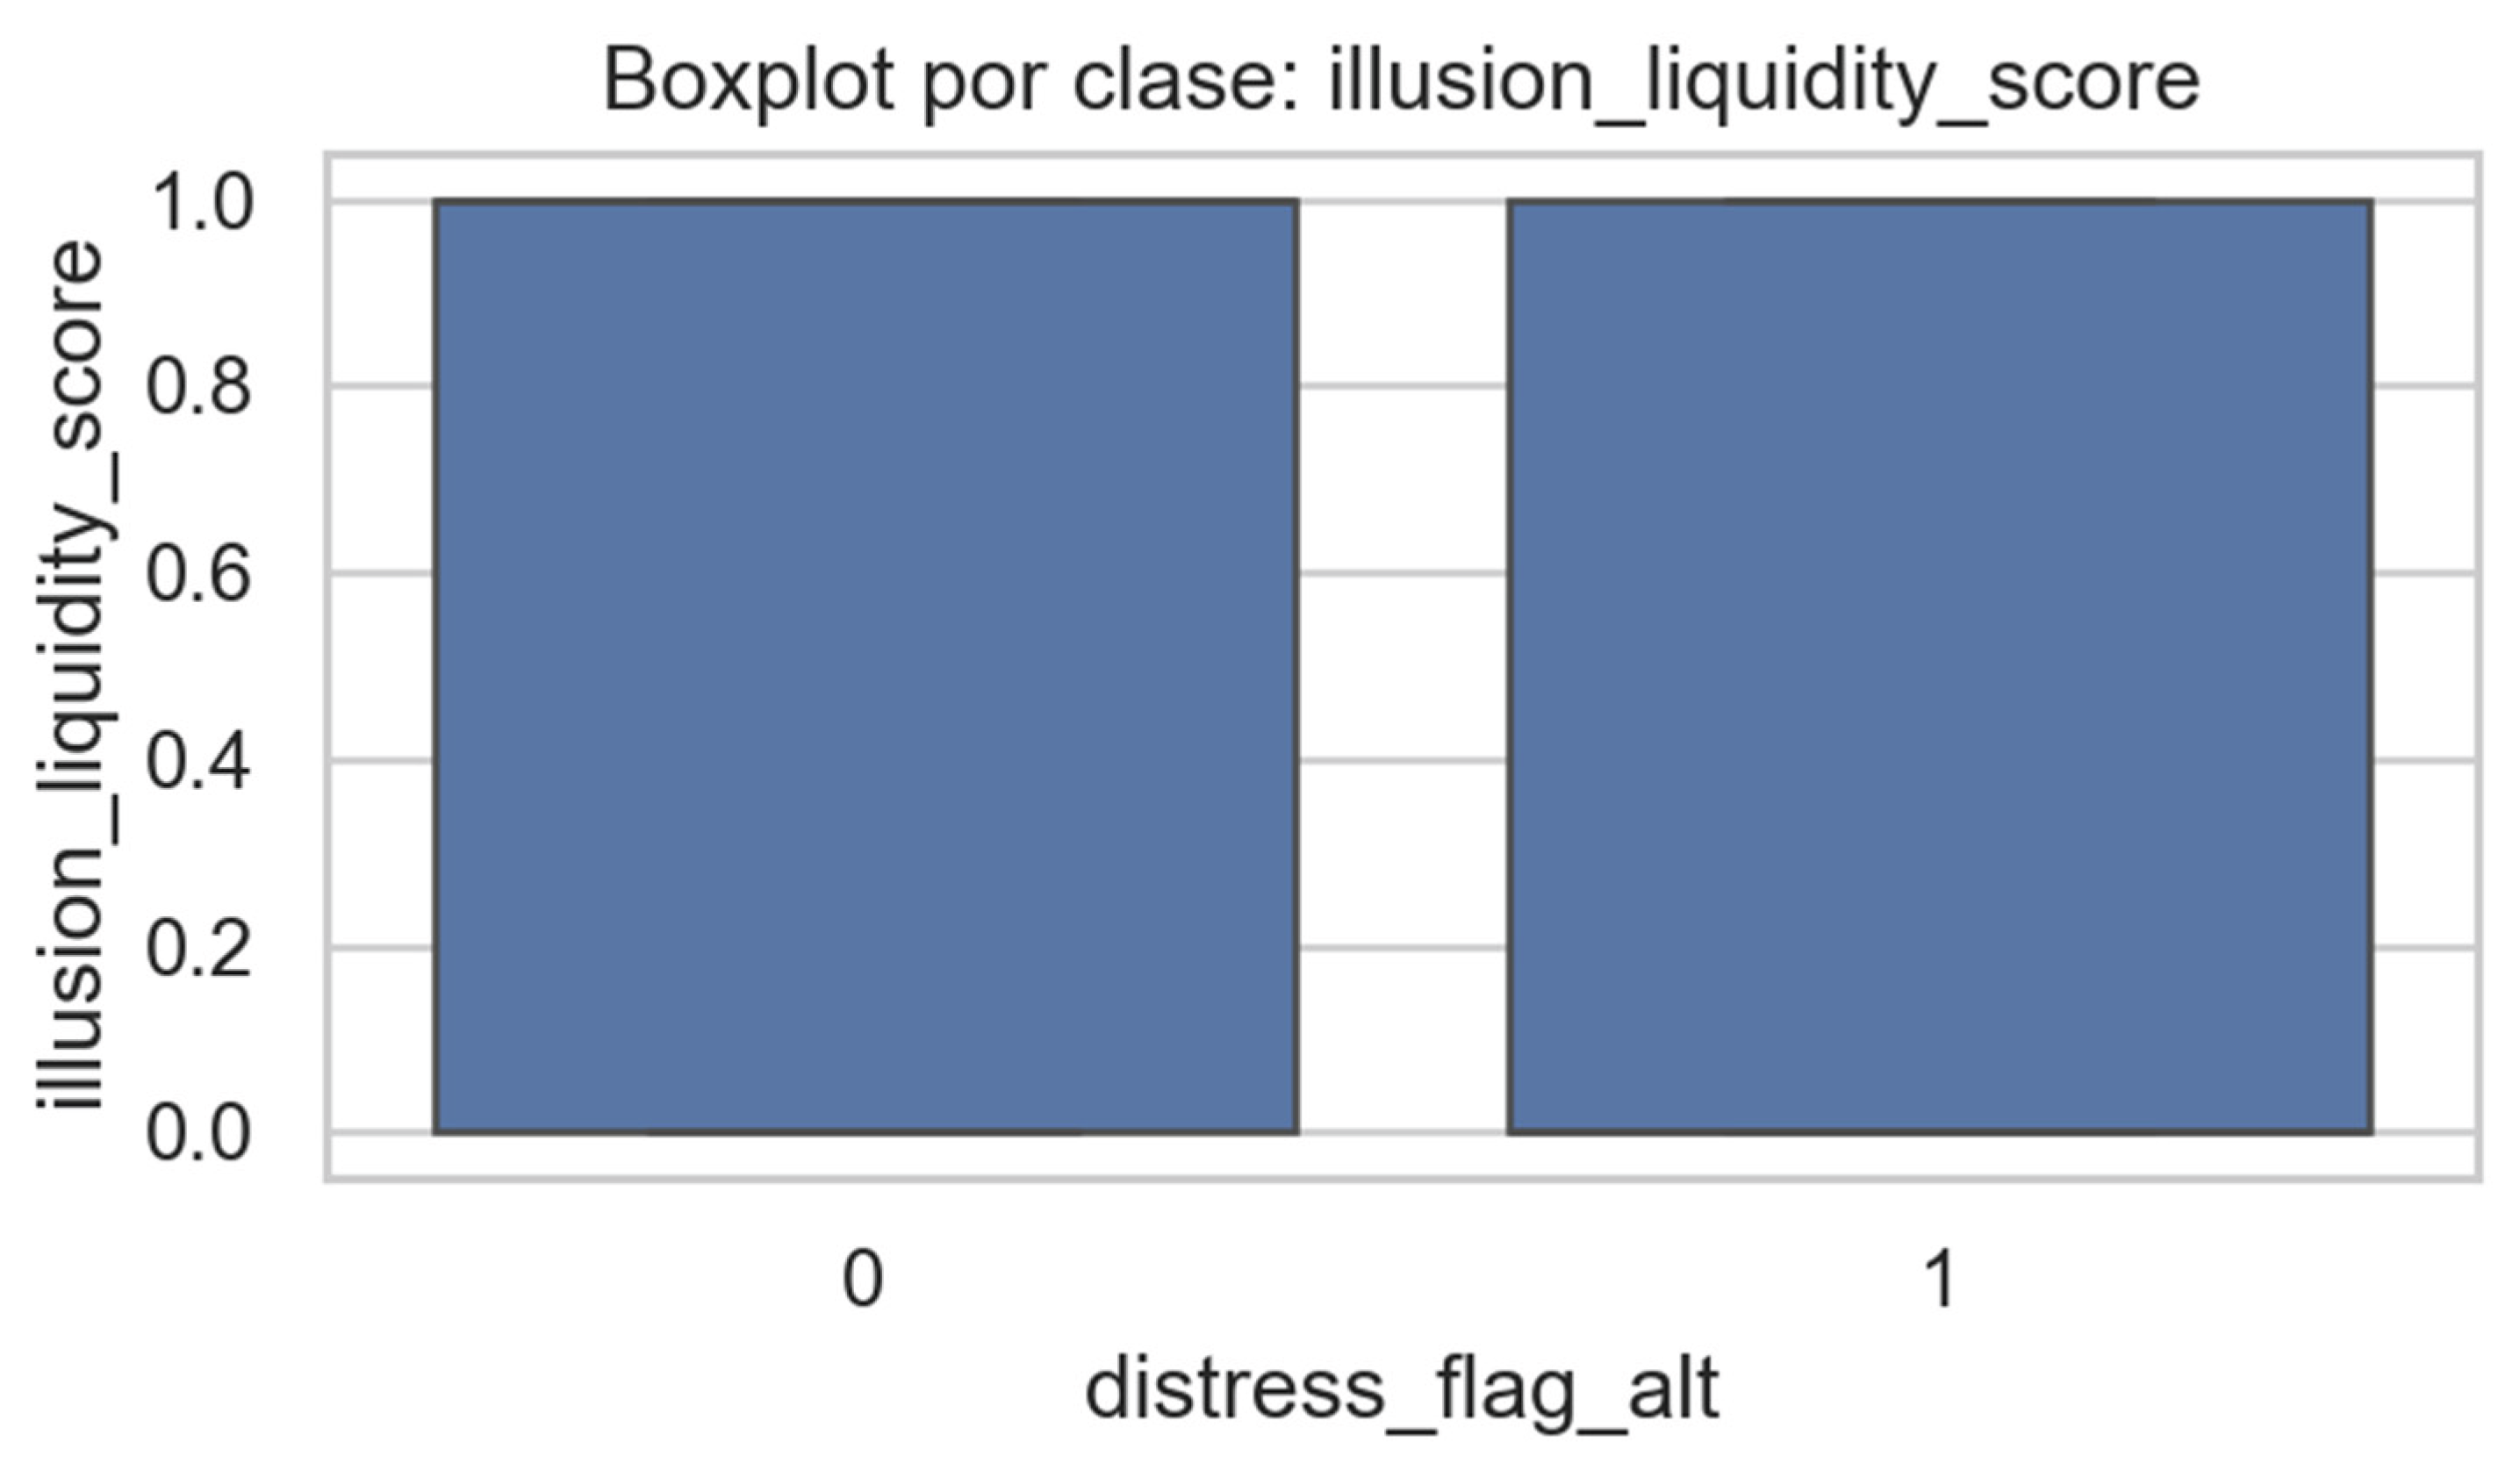
Figure 18.
Boxplot of Illusion of Liquidity score by financial-distress class.
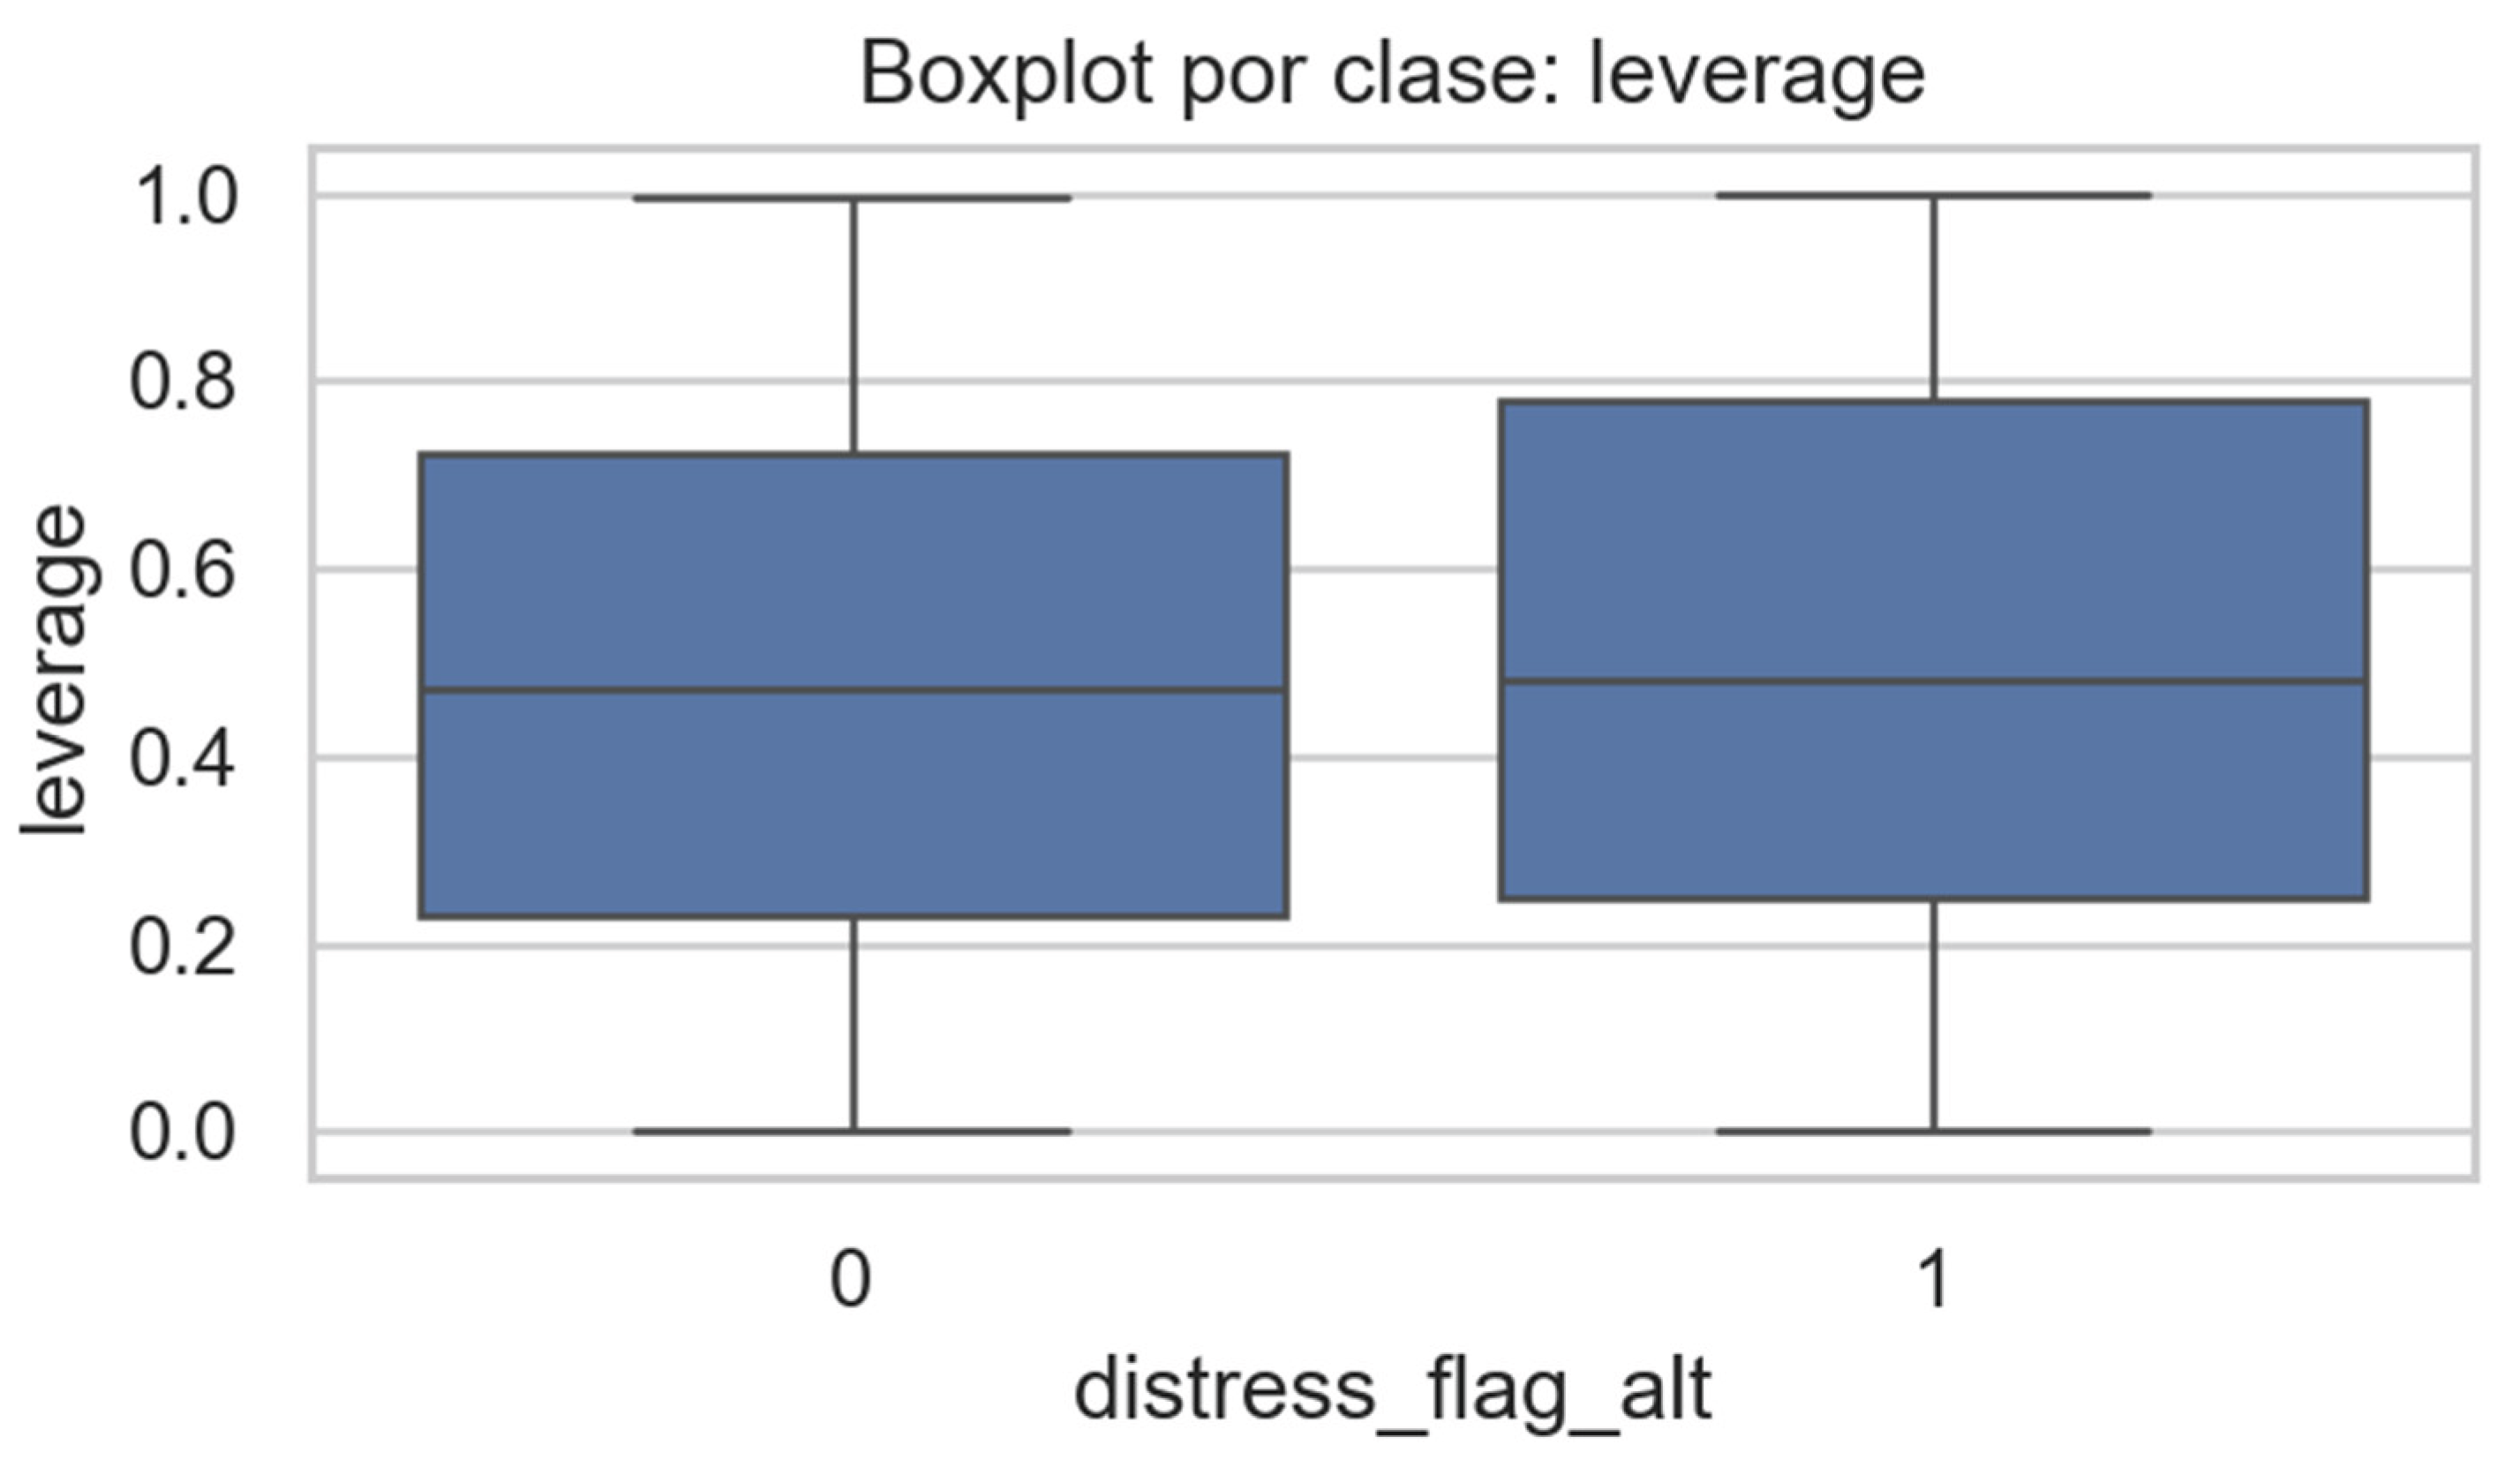
Figure 19.
Boxplot of Present Bias score by financial-distress class. Source: Prepared by the autor
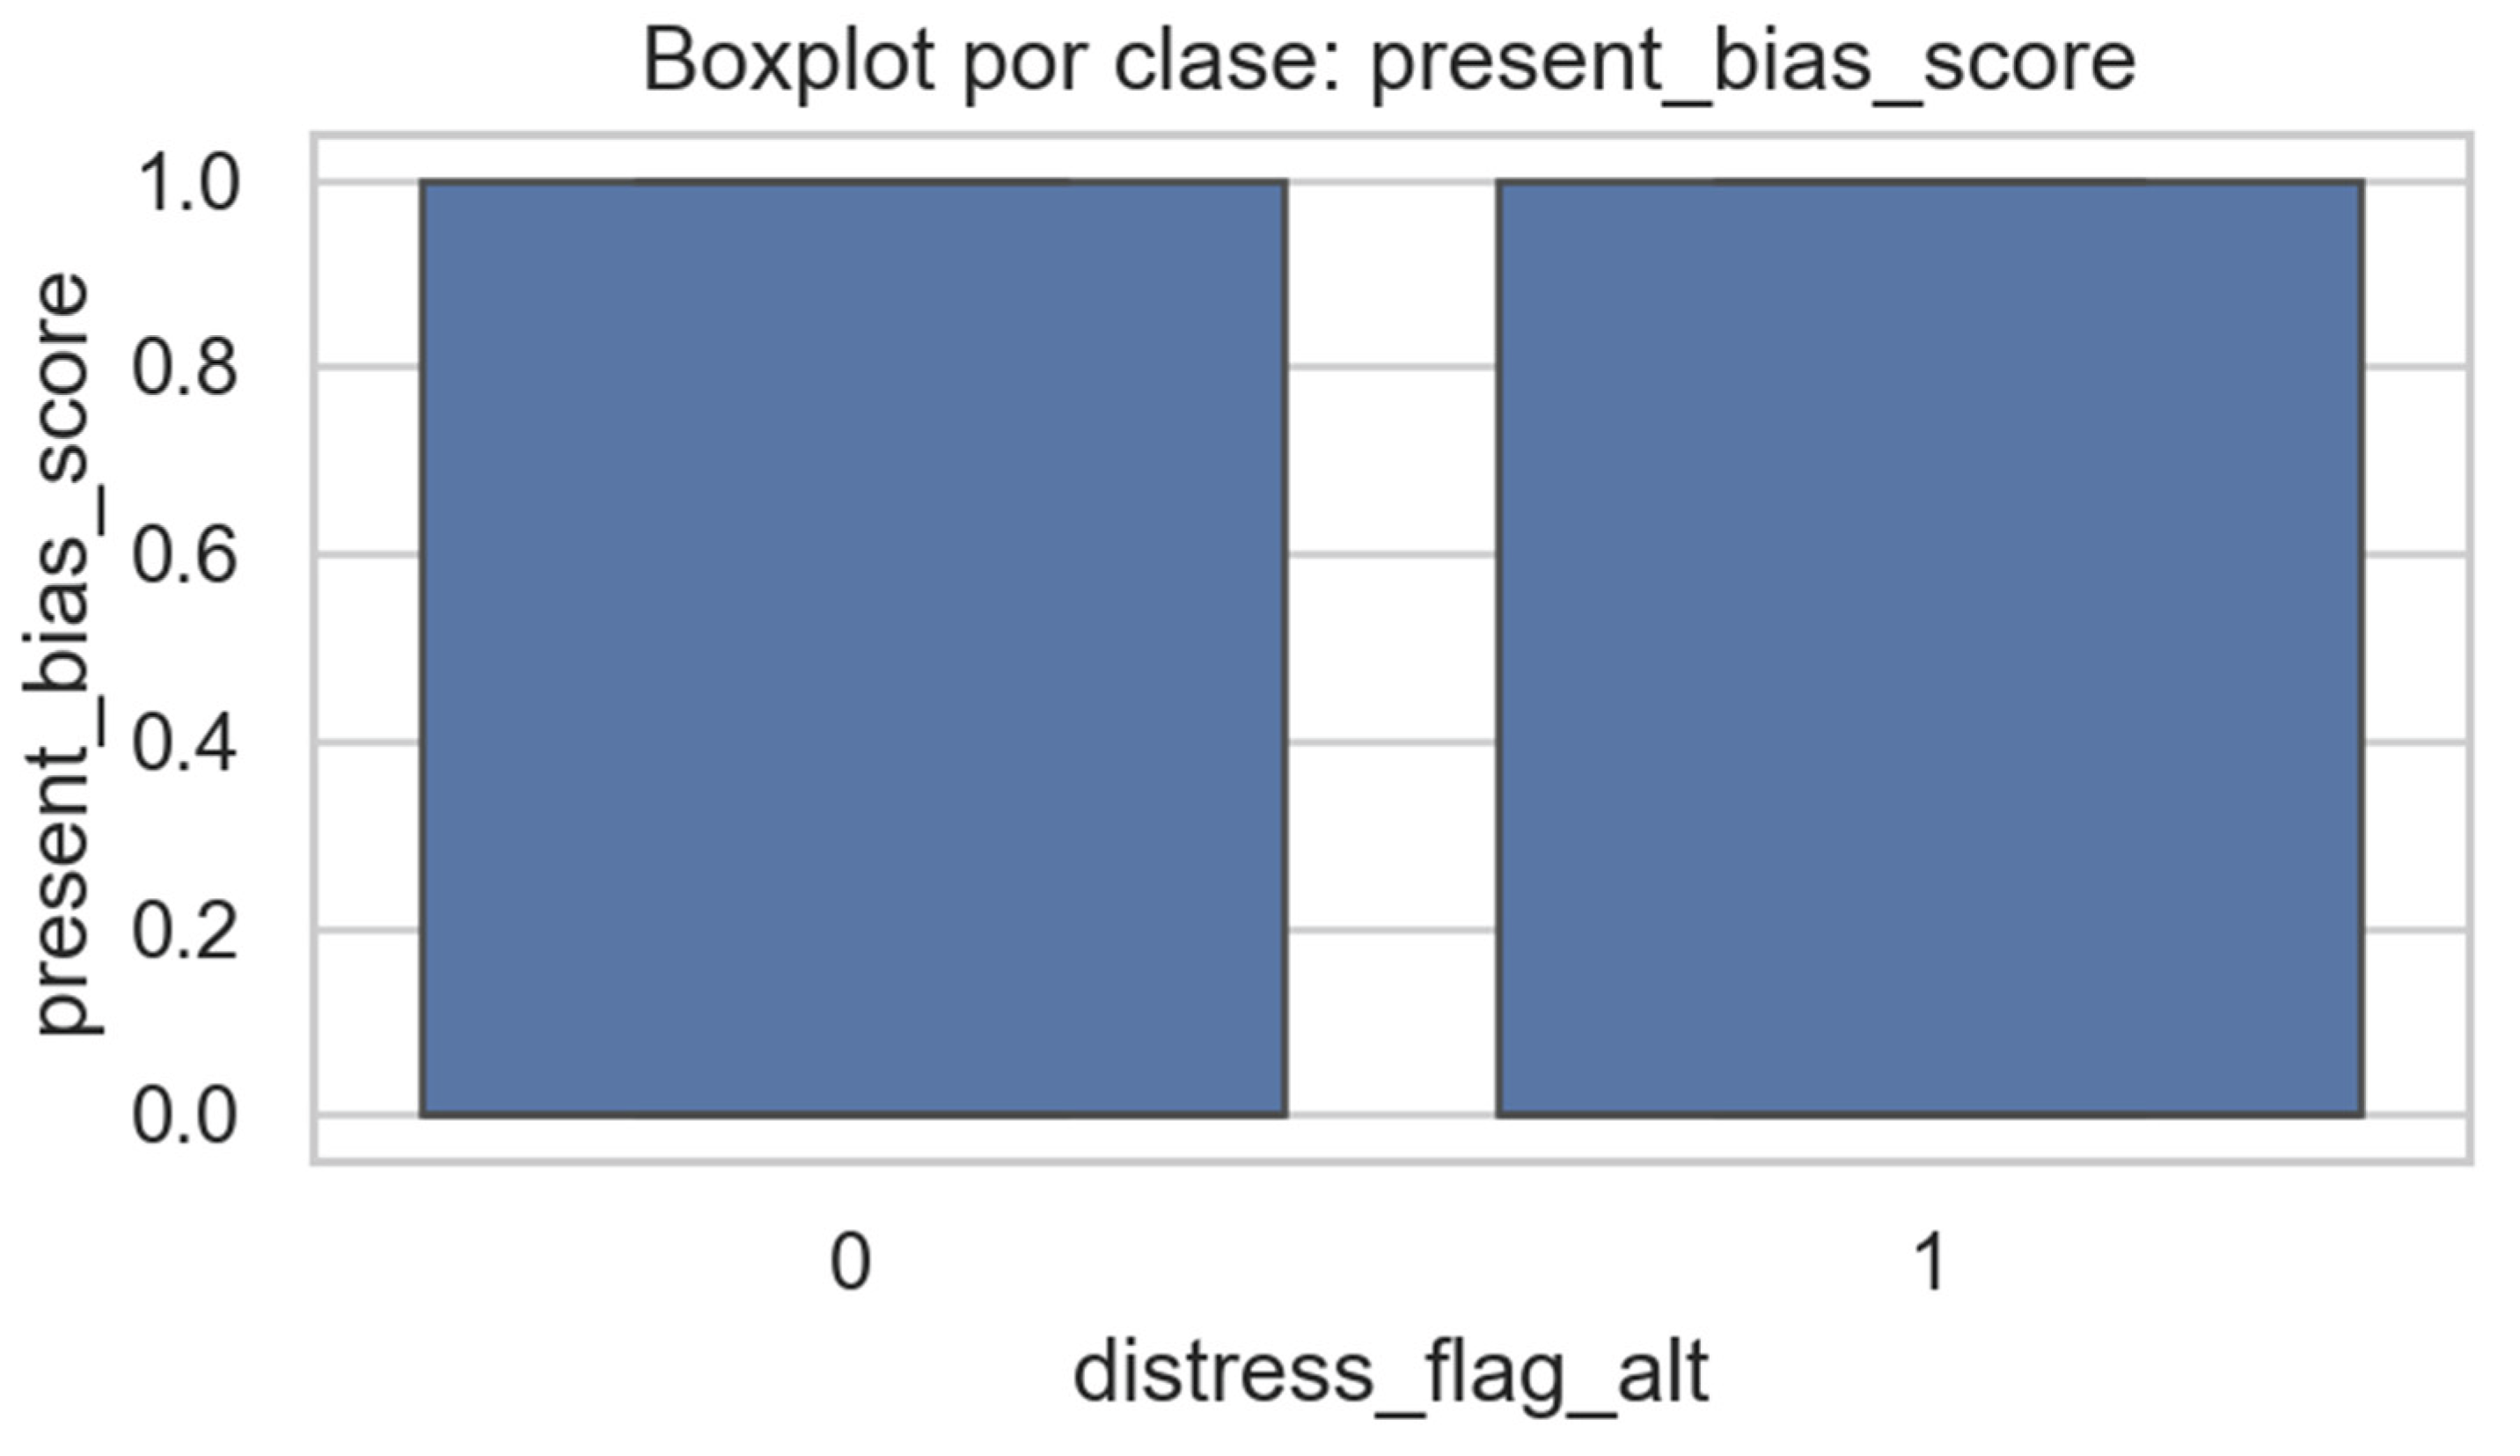
Figure 20.
Mean distribution of the Illusion of Liquidity Score by financial-distress class.
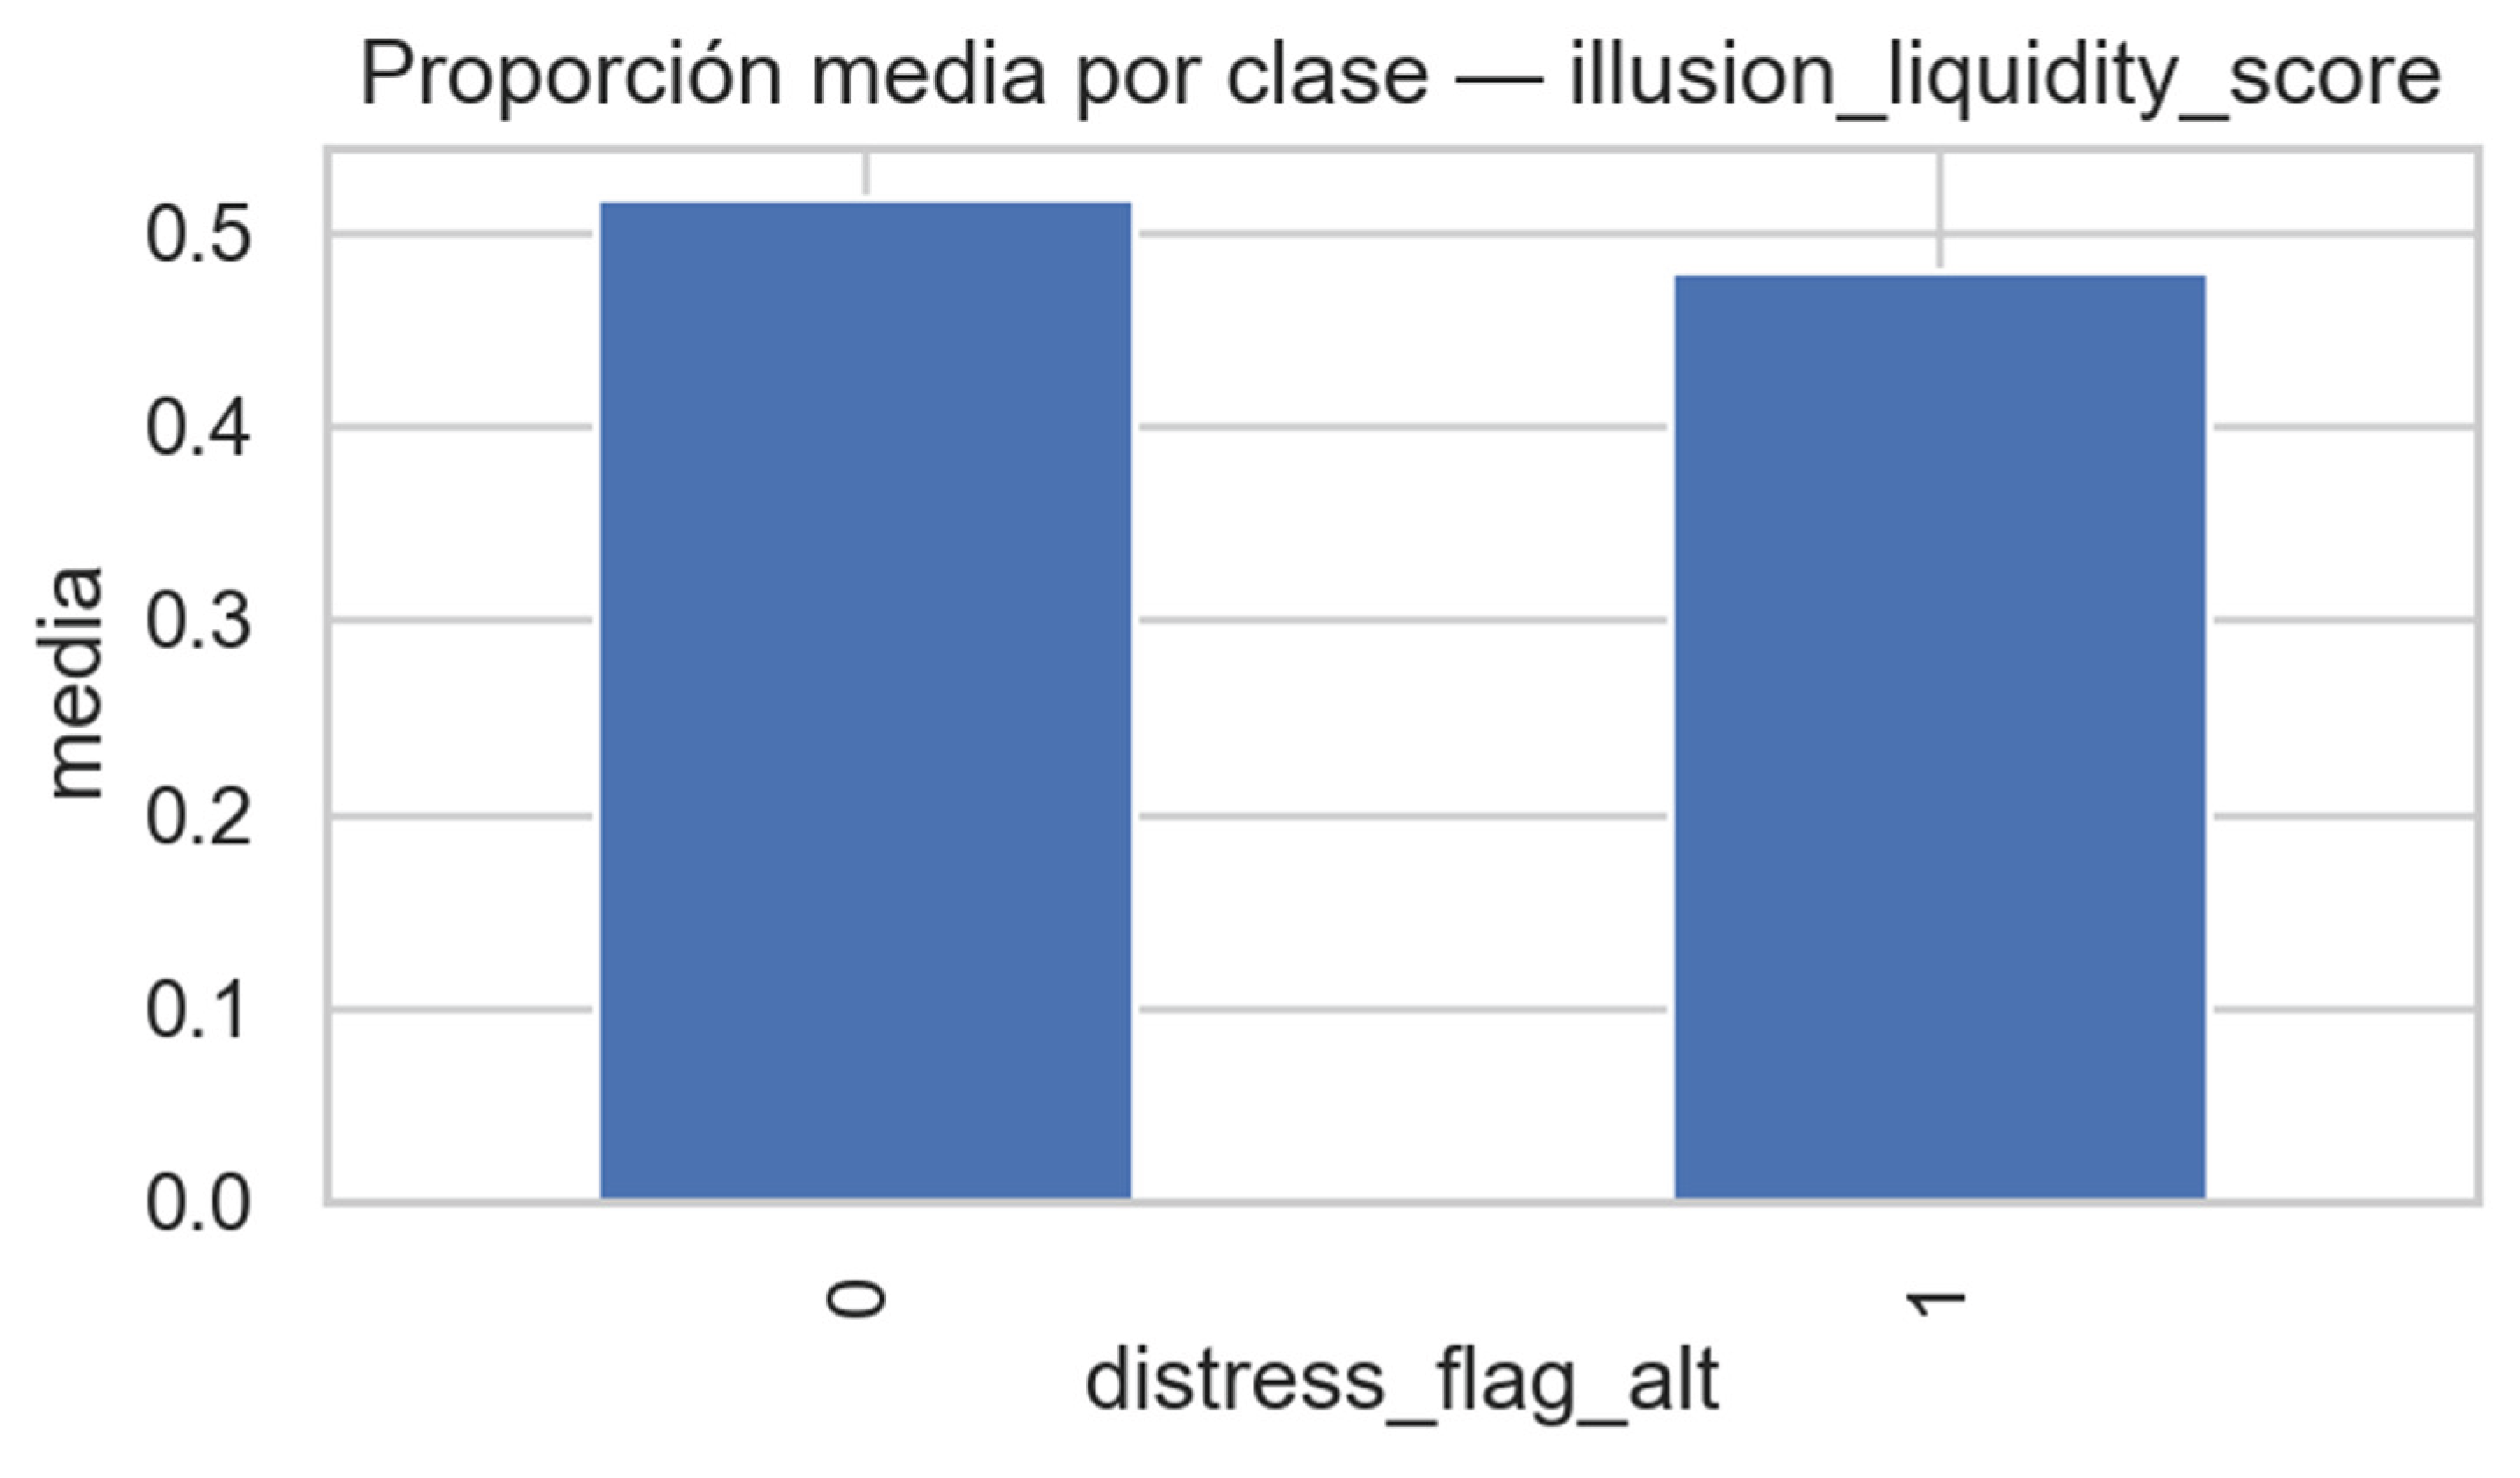
Figure 21.
Standardized coefficients of the Probit regression model for financial distress prediction.
Figure 21.
Standardized coefficients of the Probit regression model for financial distress prediction.
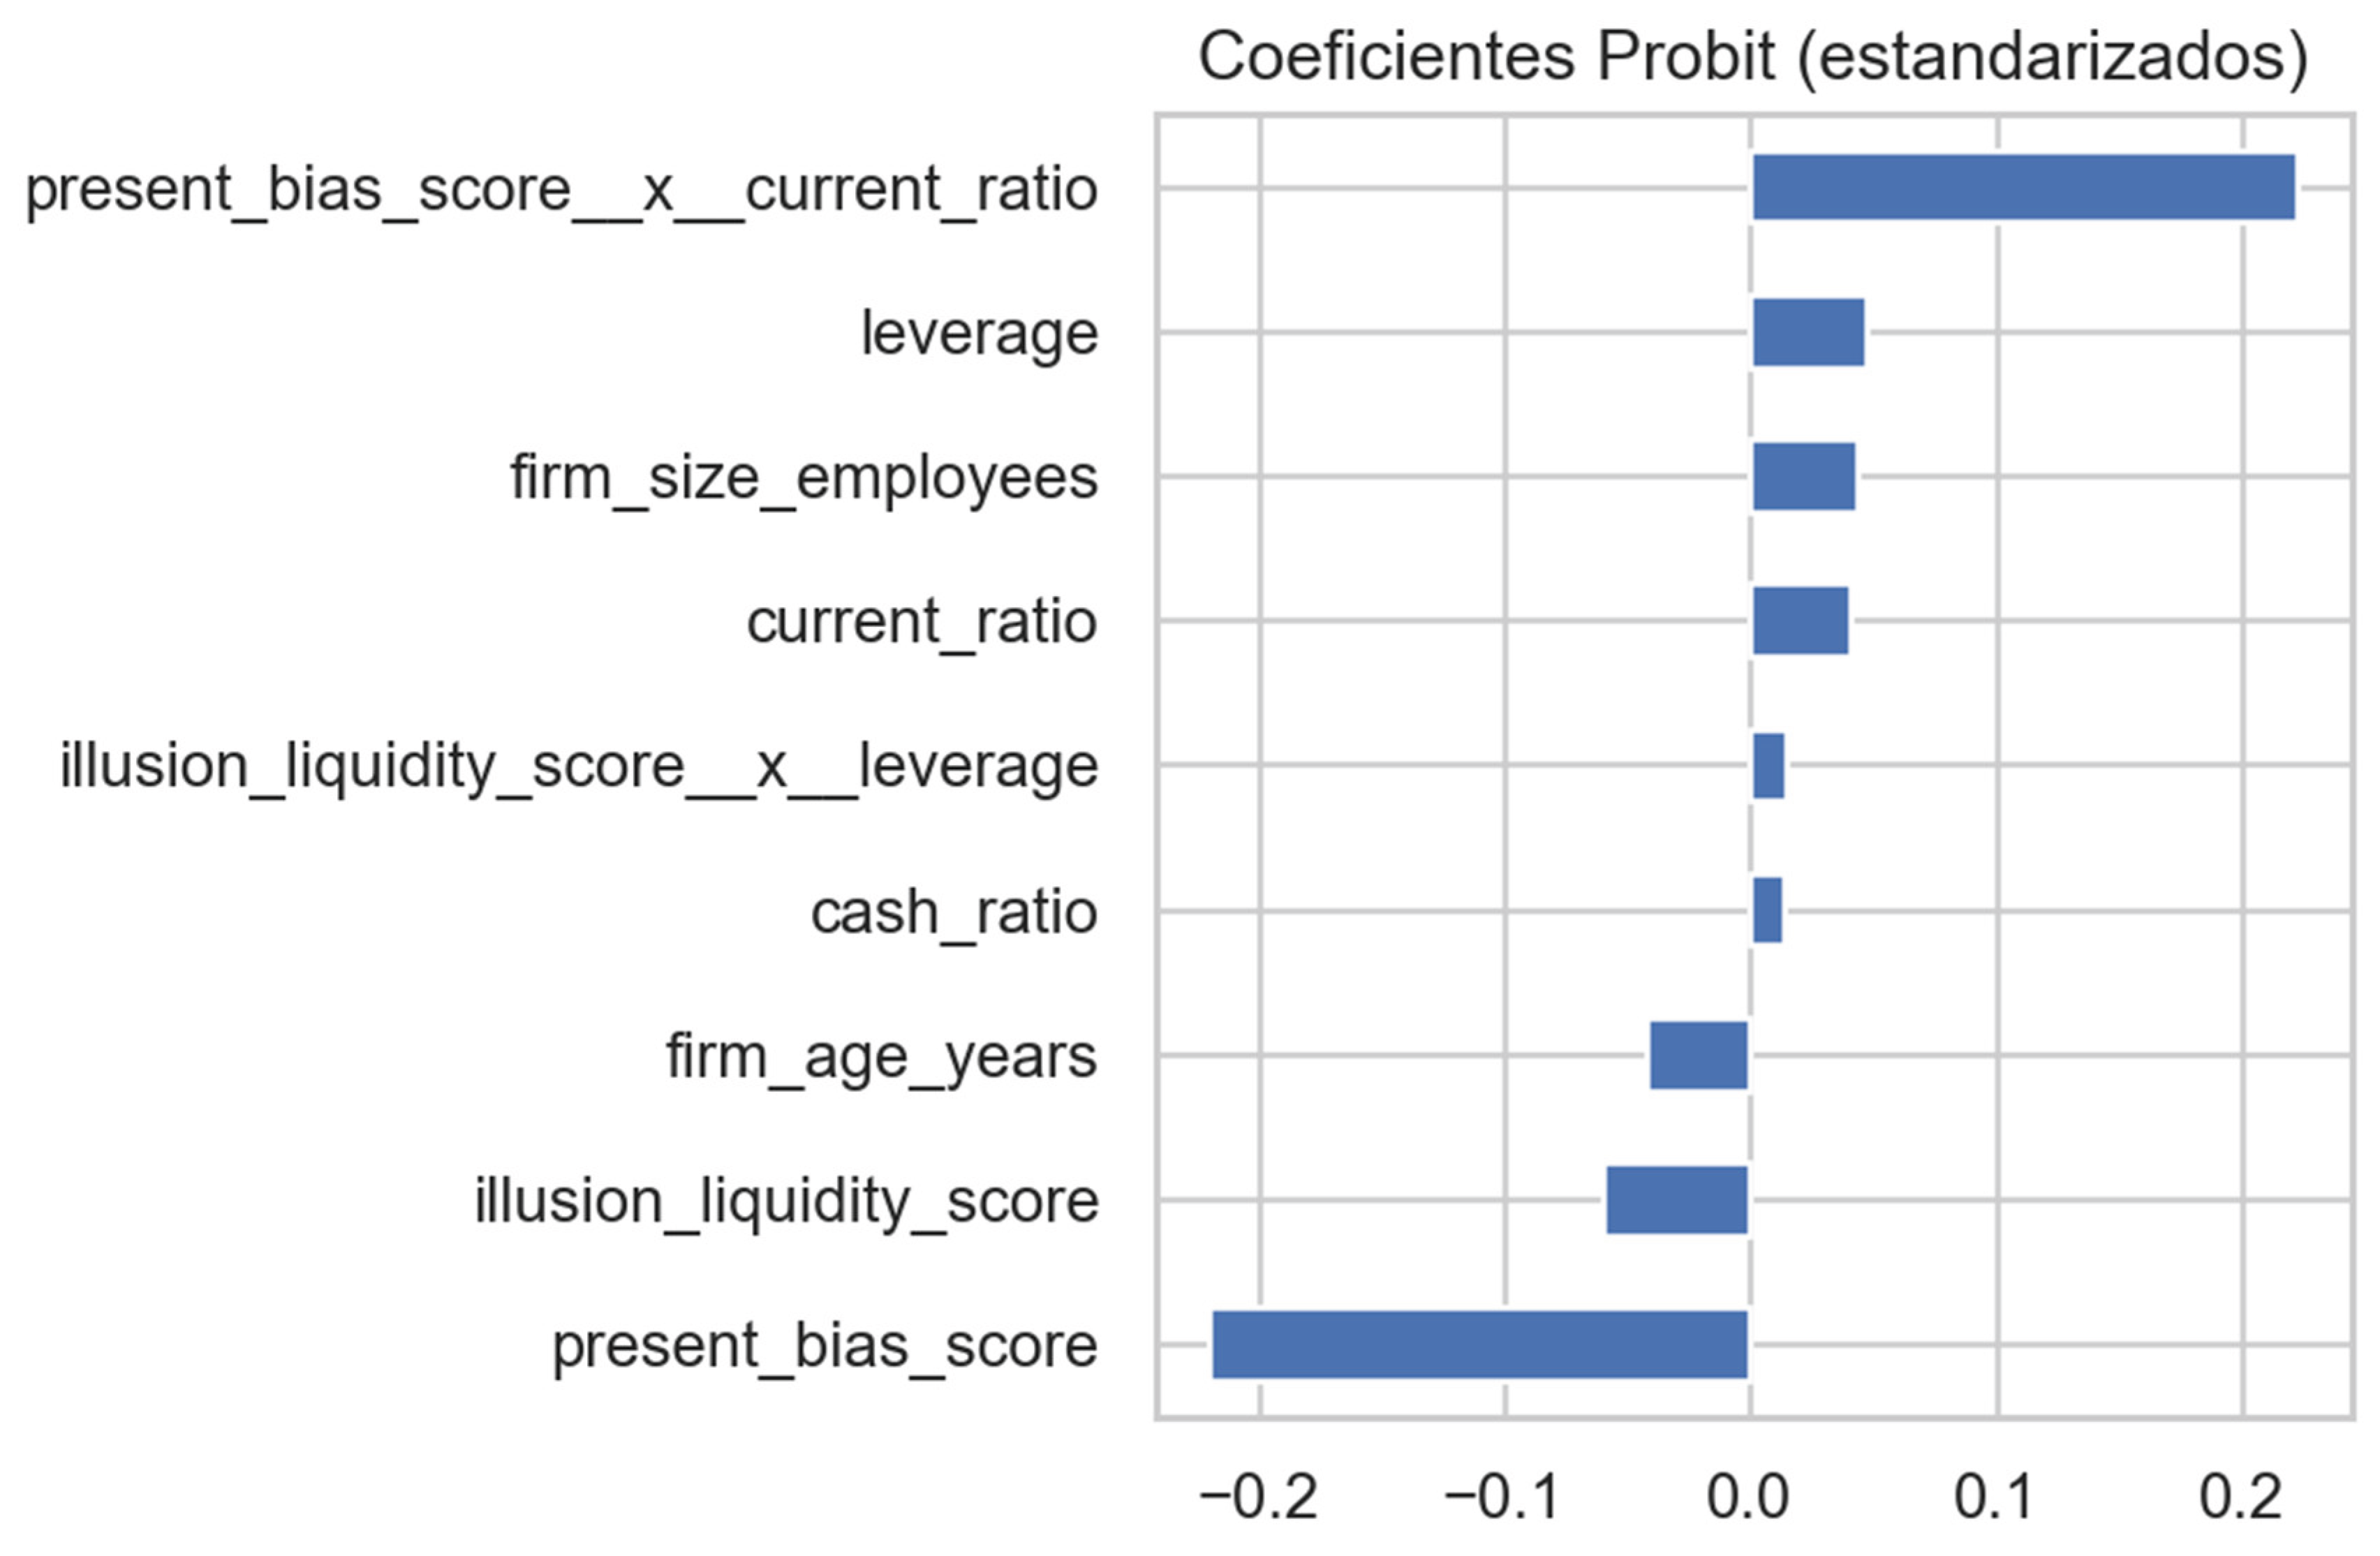
Figure 22.
Standardized coefficients of the Probit regression model for financial distress prediction. Source: Prepared by the authors.
Figure 22.
Standardized coefficients of the Probit regression model for financial distress prediction. Source: Prepared by the authors.
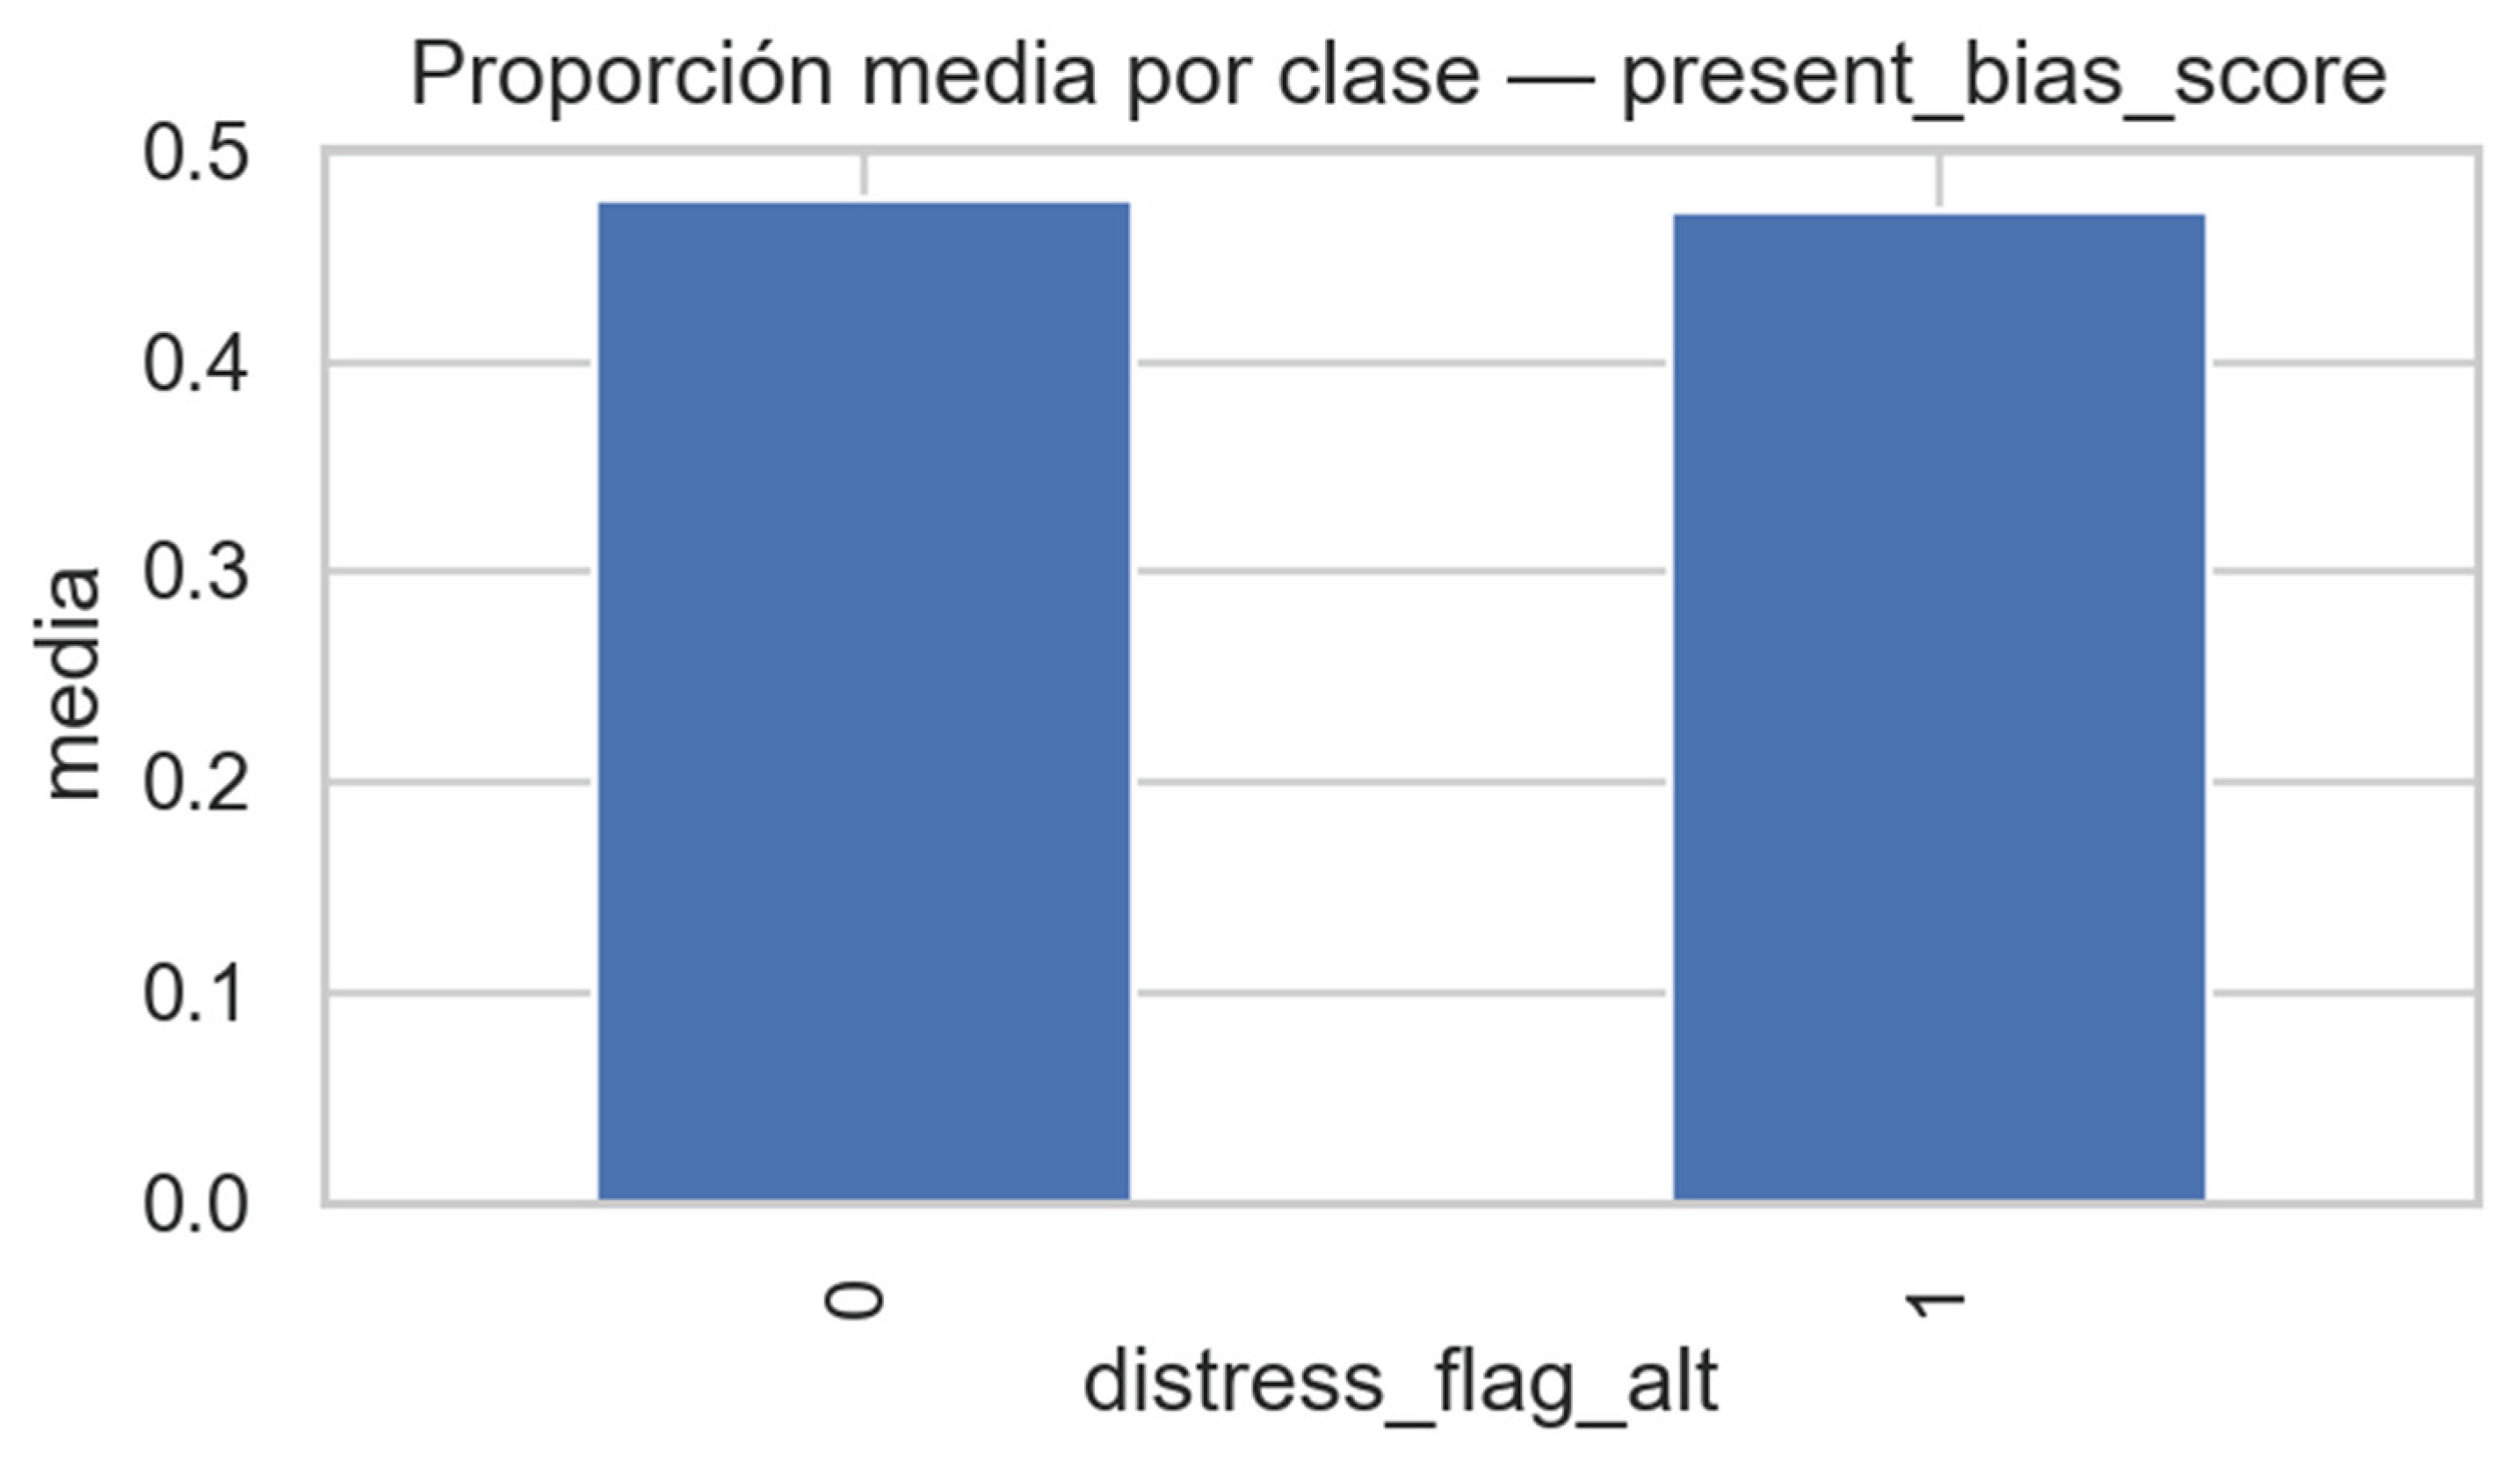
Figure 23.
Binary distribution of the Illusion of Liquidity Score by financial-distress class.
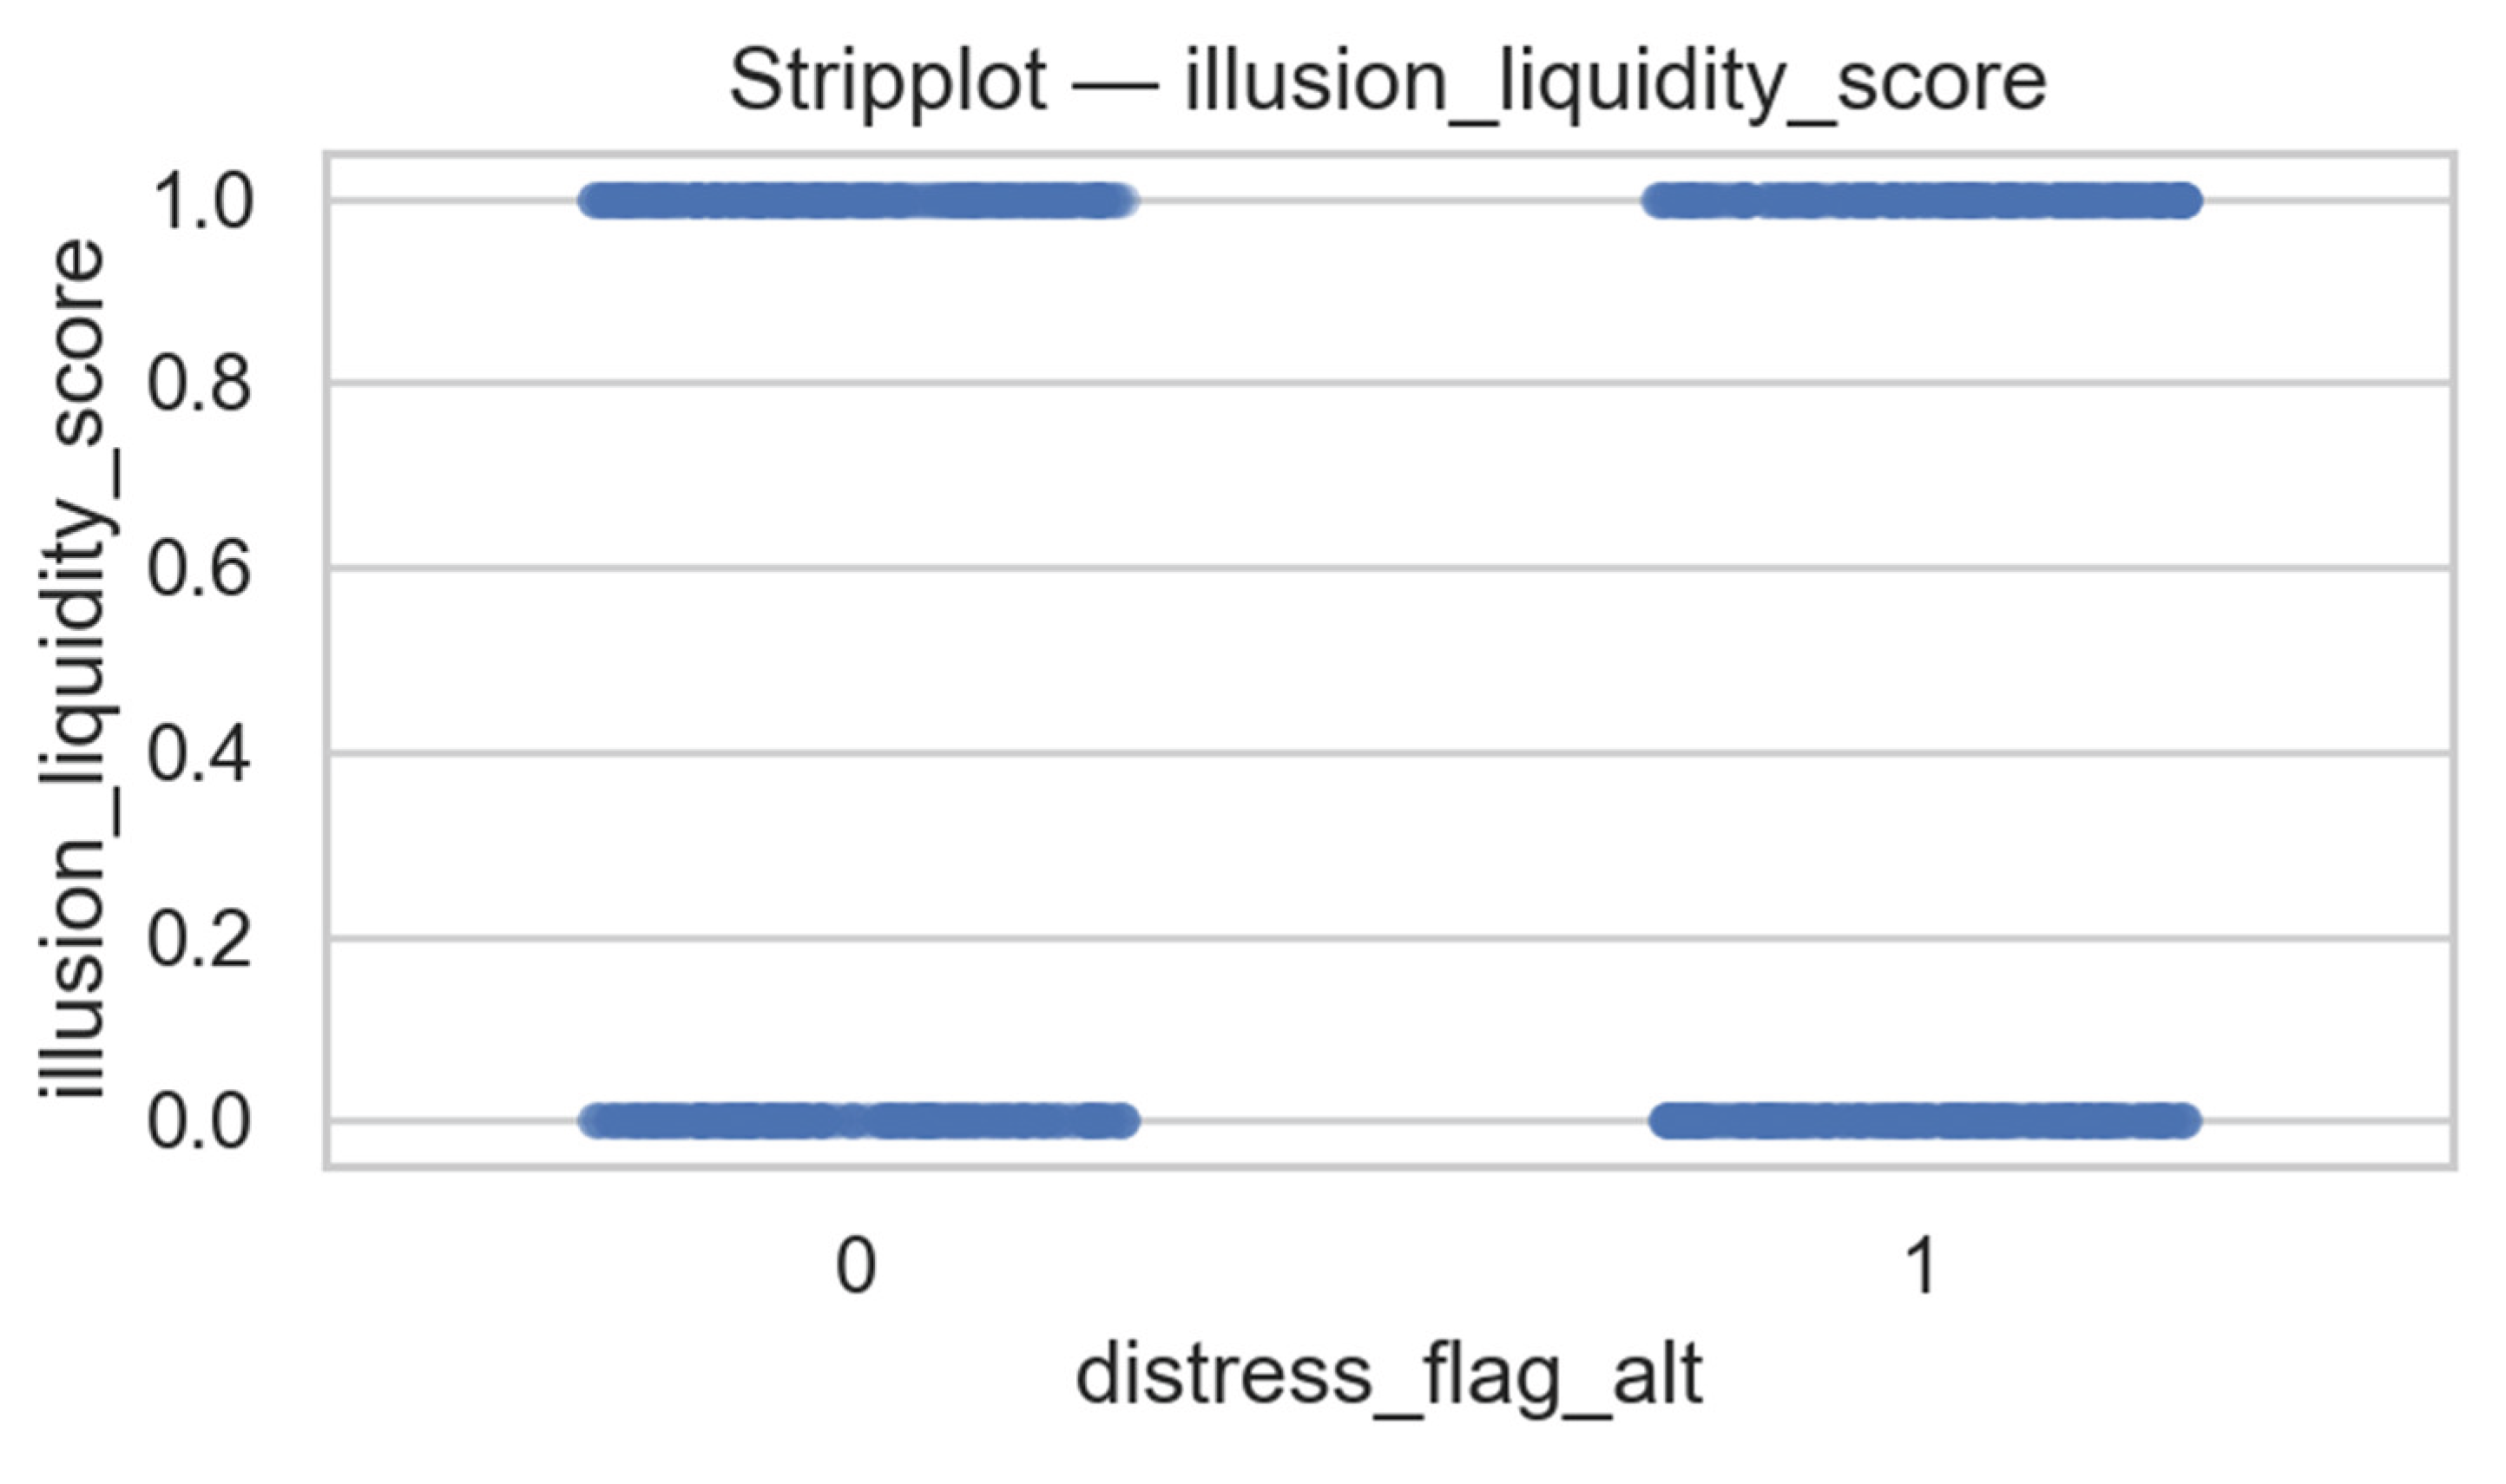
Figure 24.
Binary distribution of the Present Bias Score by financial-distress class. Source: Prepared by the authors.
Figure 24.
Binary distribution of the Present Bias Score by financial-distress class. Source: Prepared by the authors.
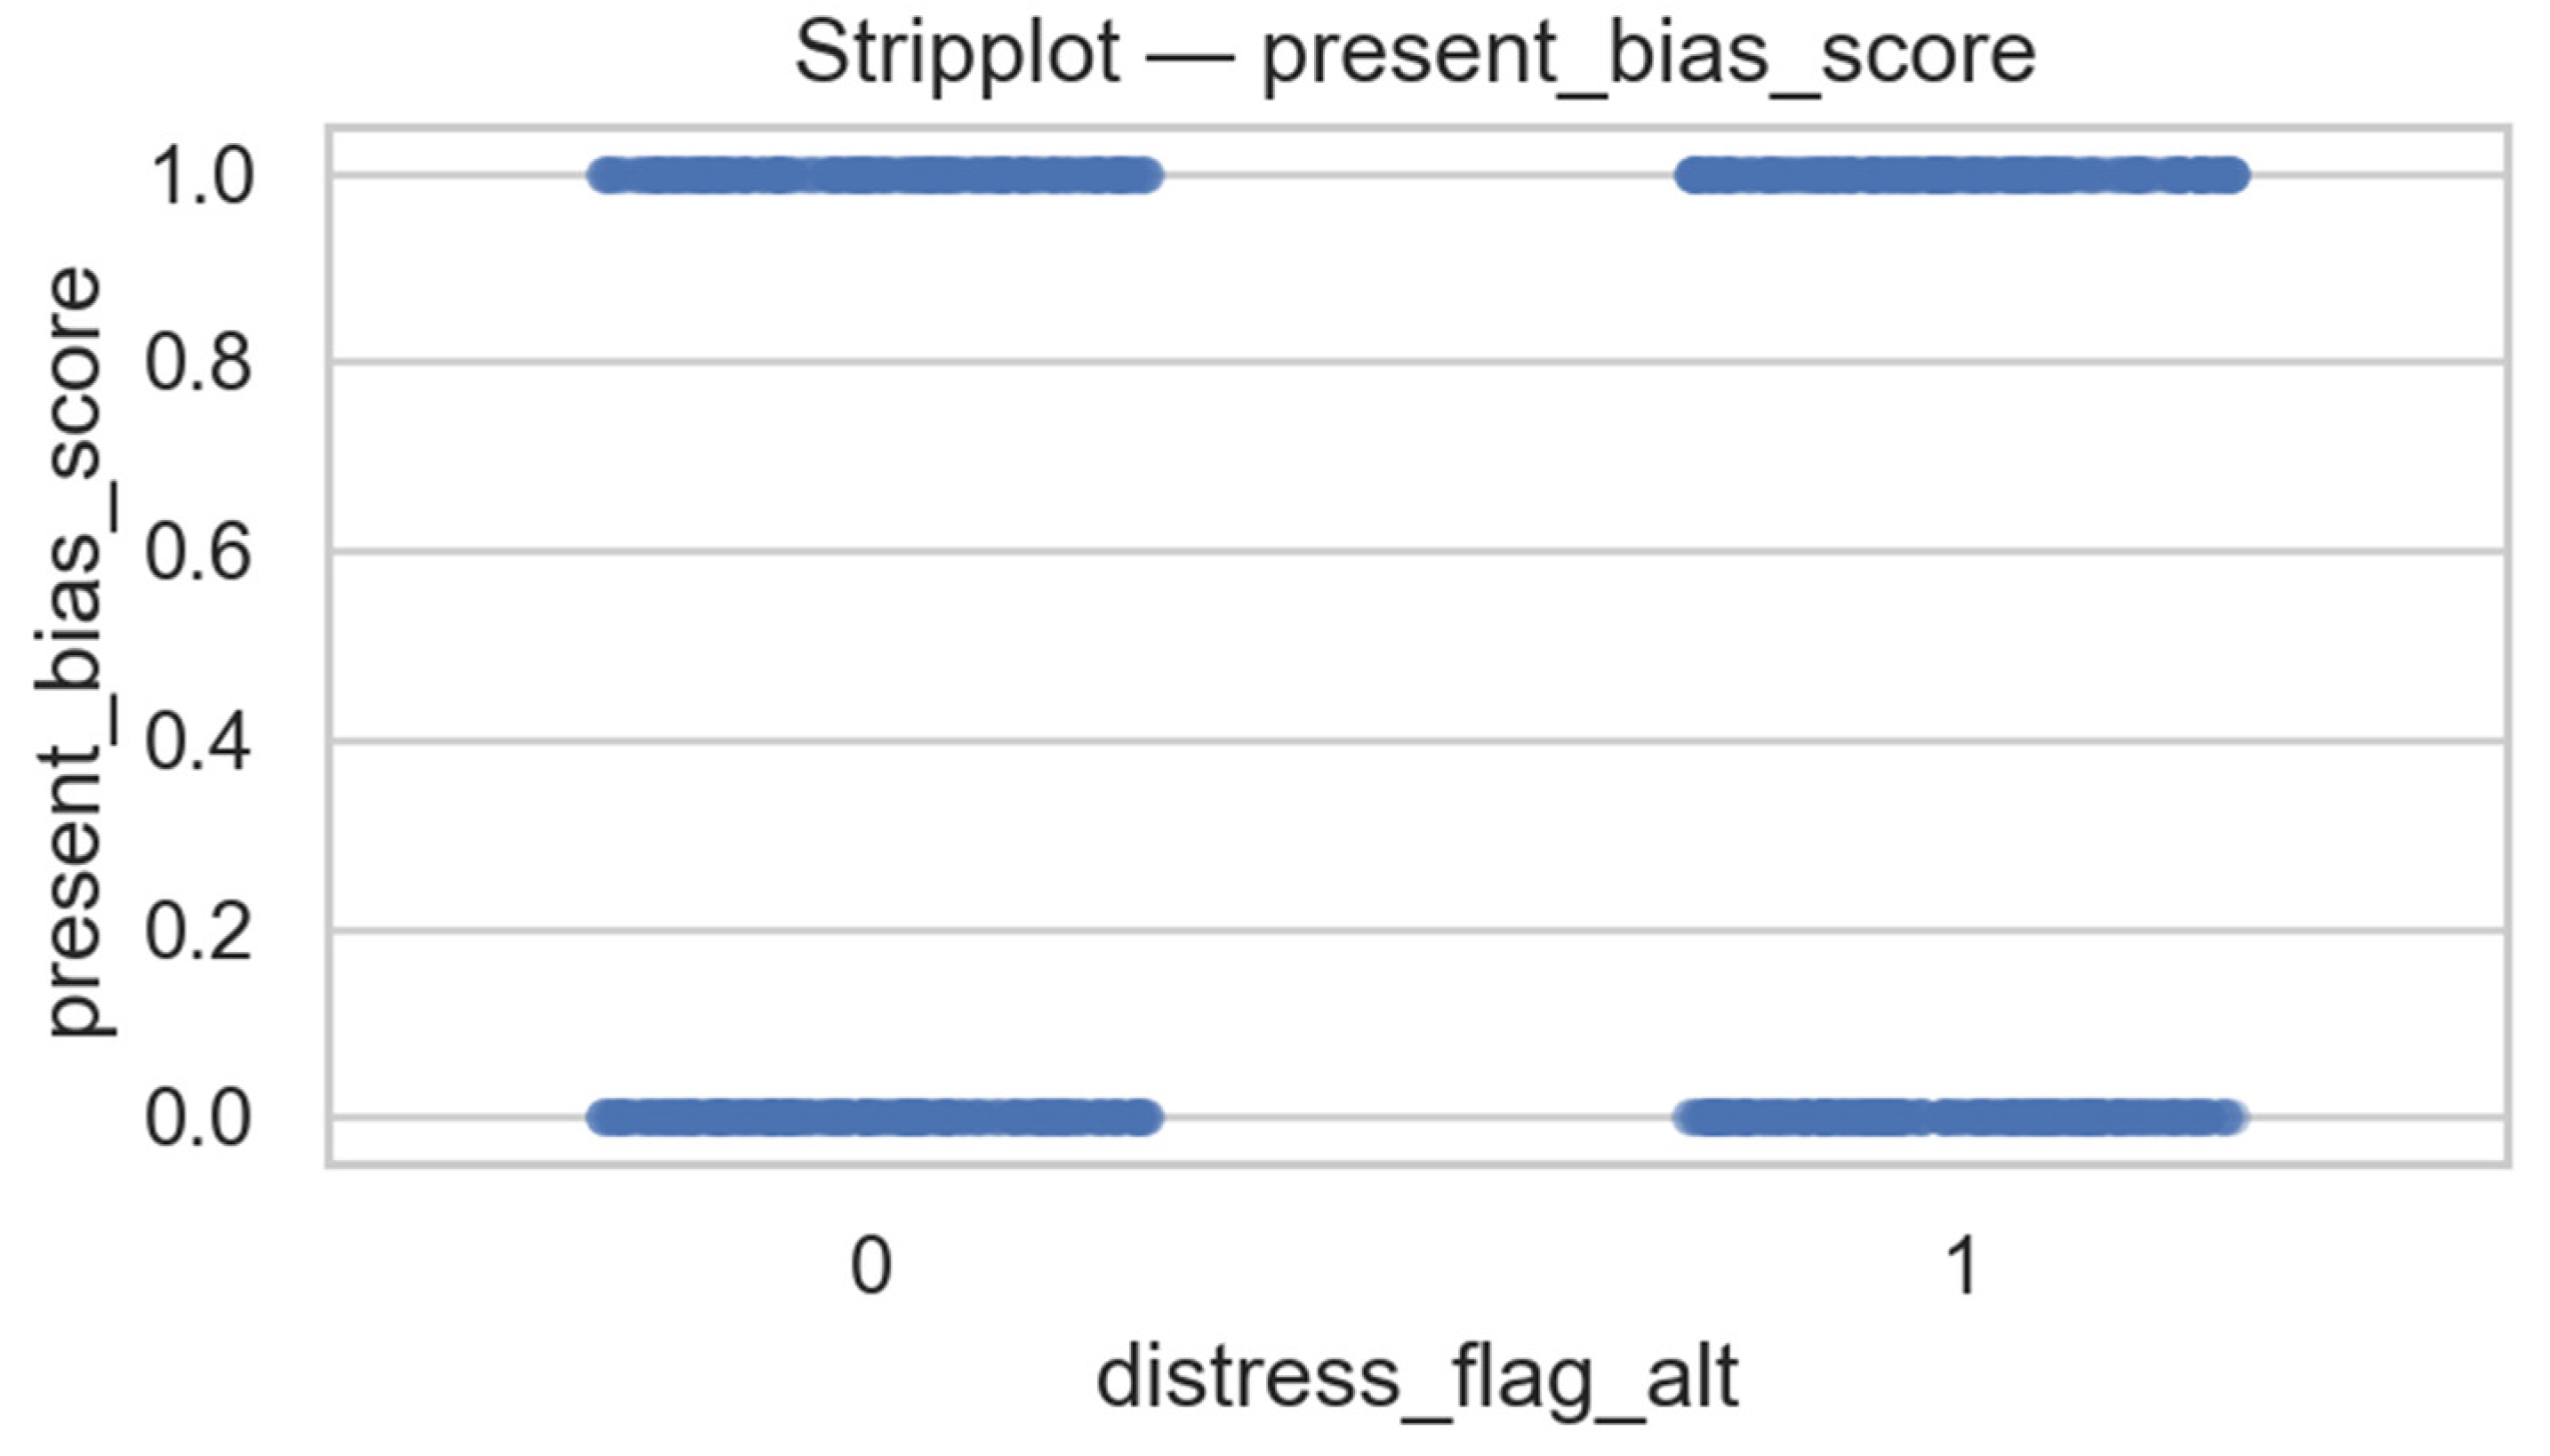
Figure 25.
Standardized coefficients of the OLS regression model for financial distress prediction.
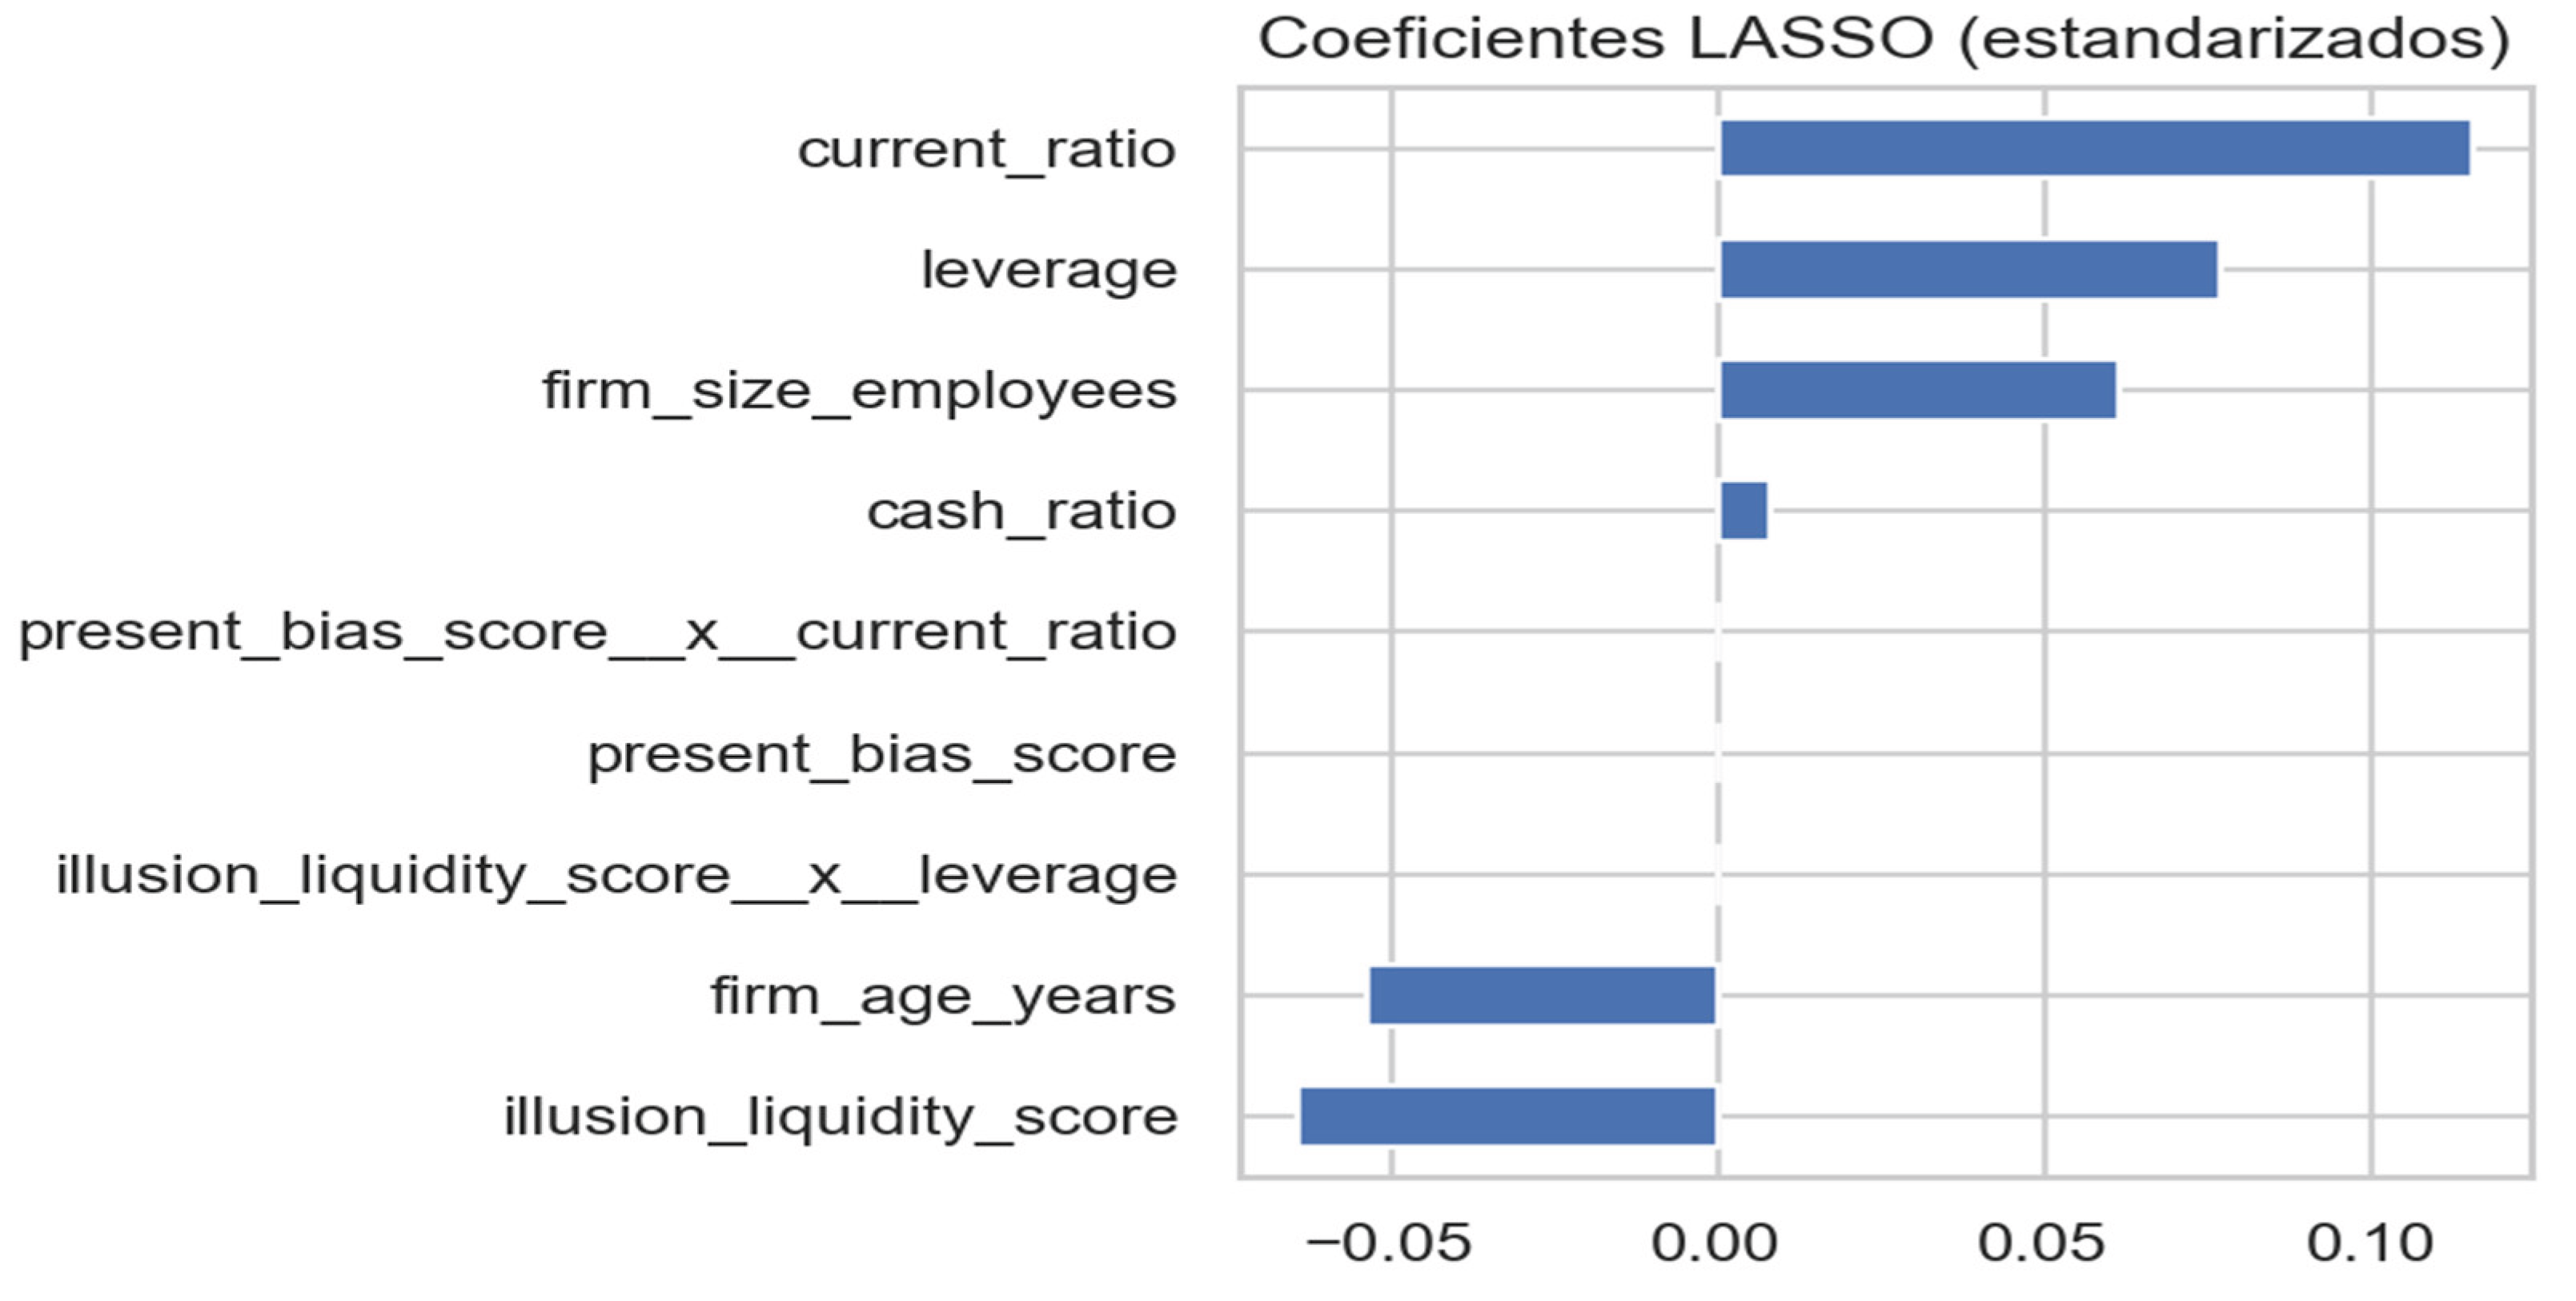
Figure 26.
Standardized coefficients of the LASSO regression model for financial distress prediction.
Figure 26.
Standardized coefficients of the LASSO regression model for financial distress prediction.
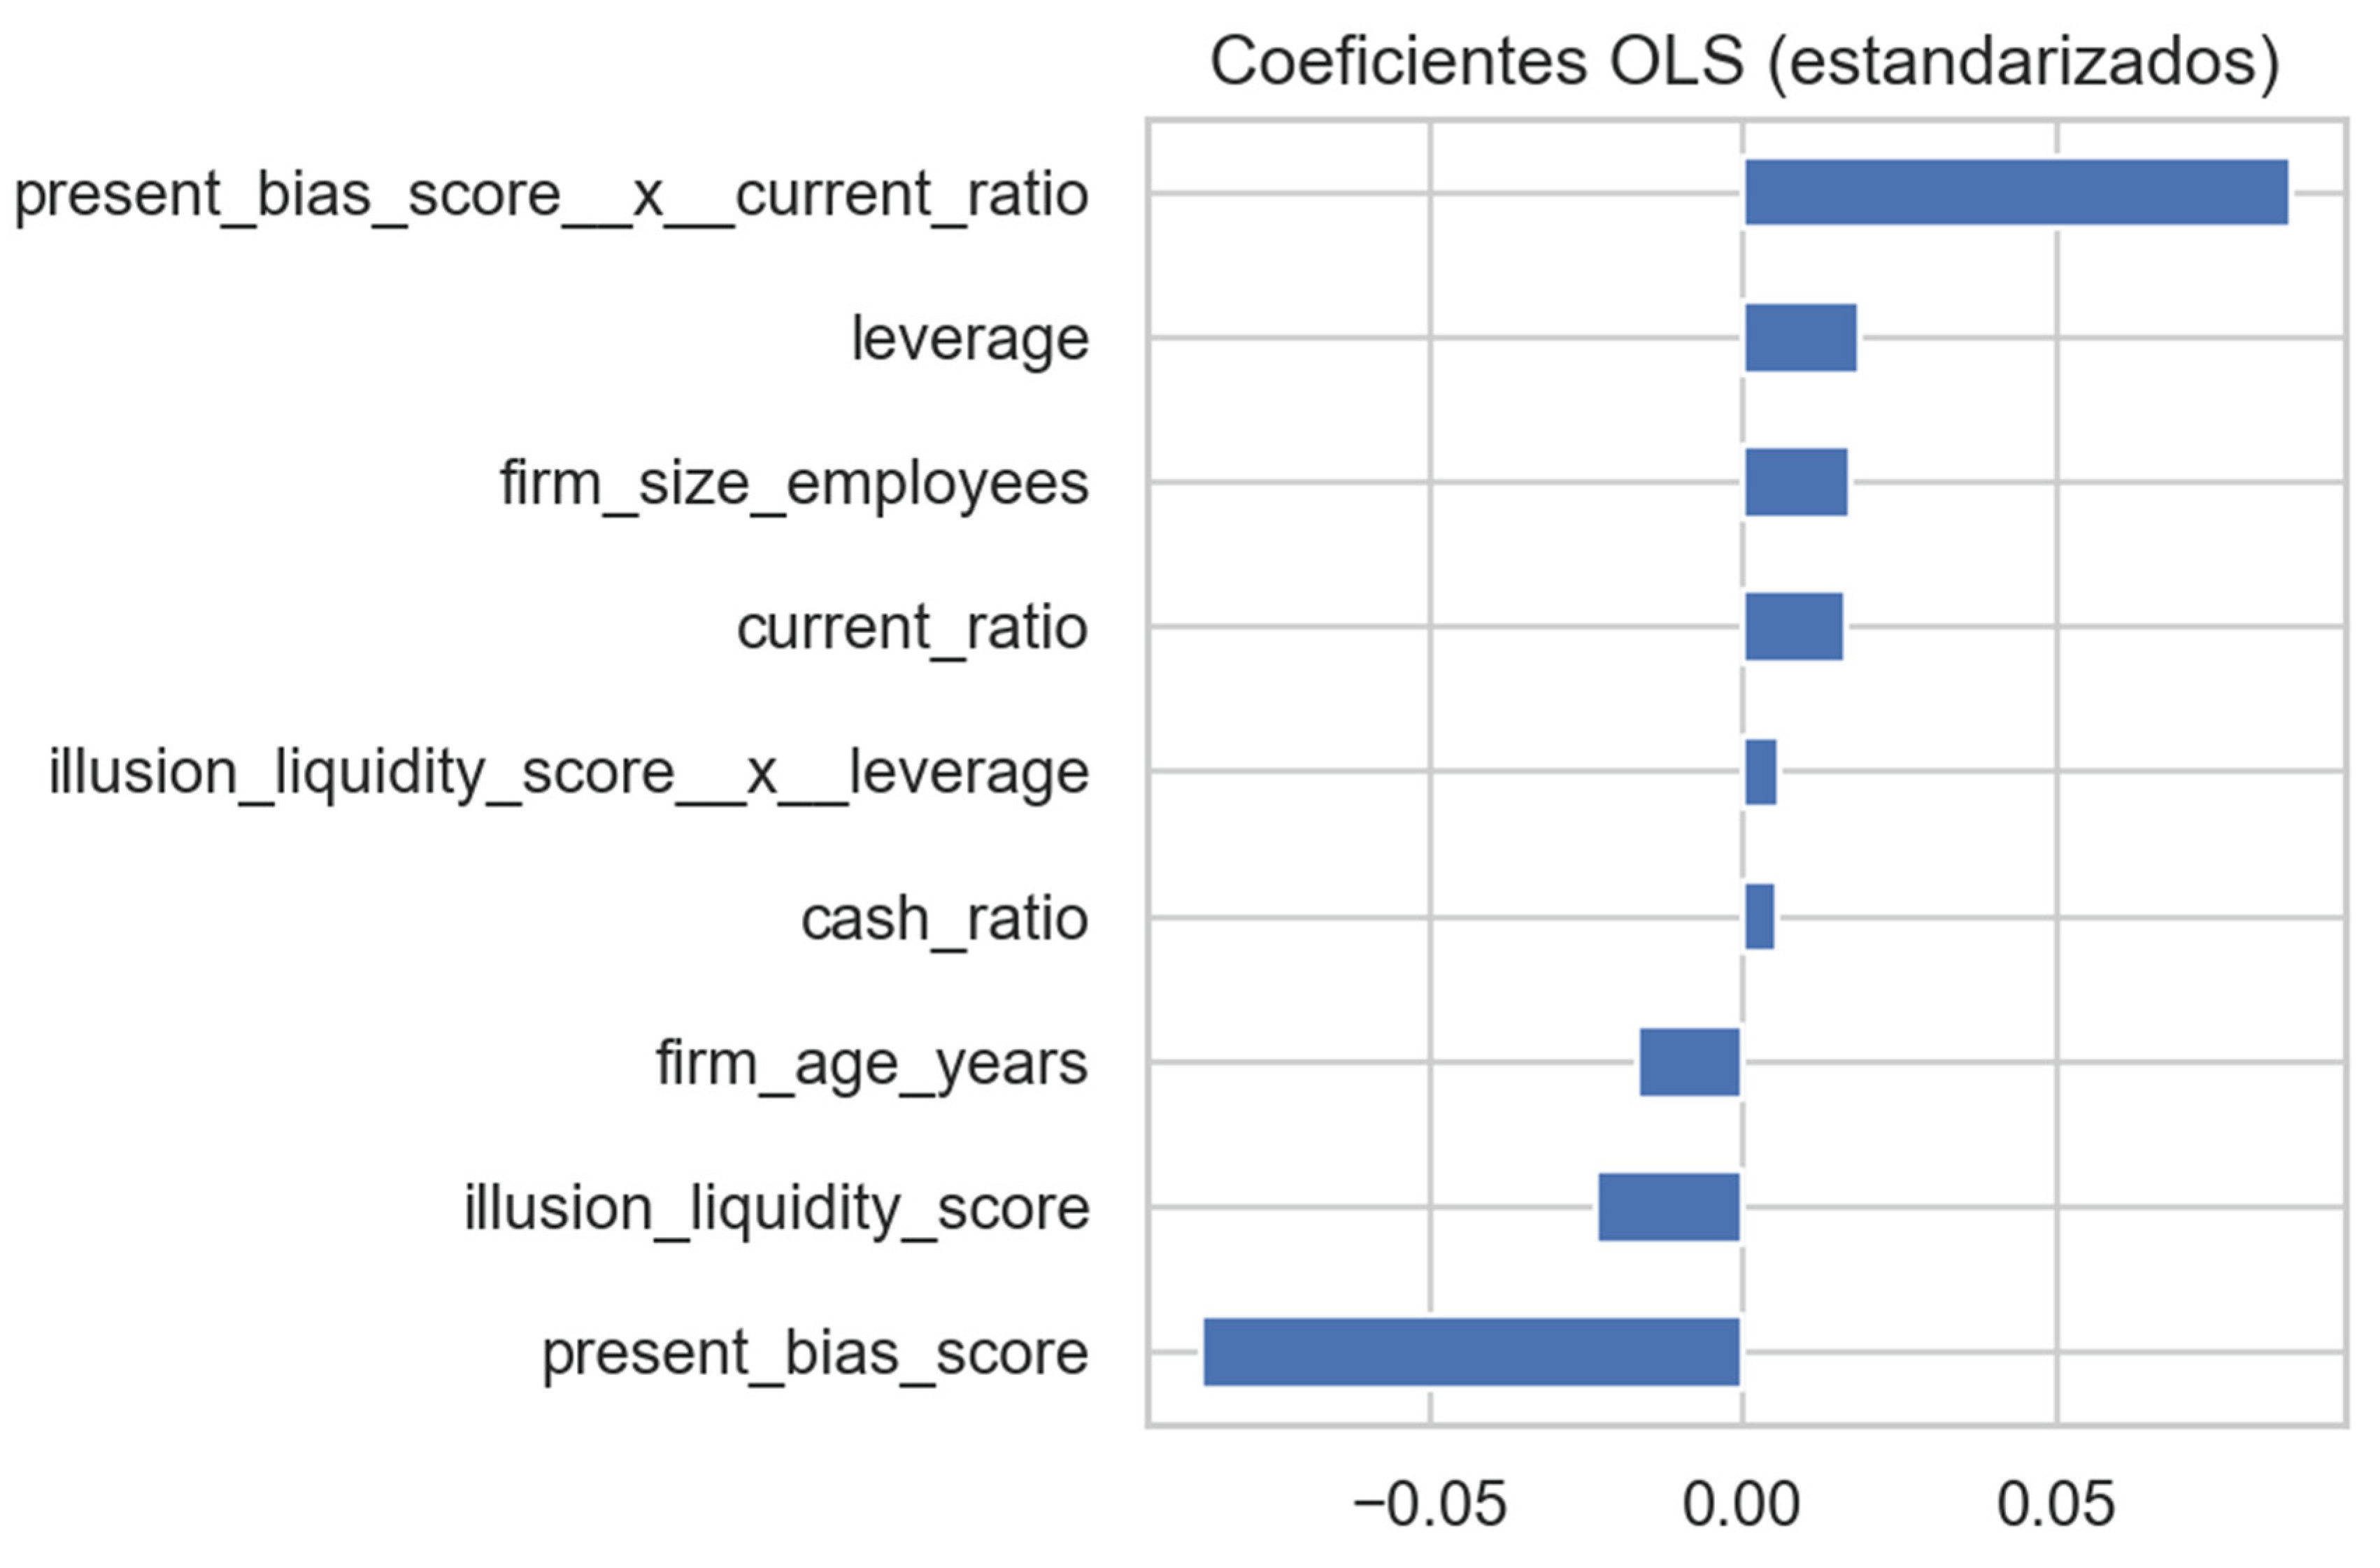
Figure 27.
Permutation-based importance of variables in the SVM model. Most of the predictive power lies in firm size, while the remaining predictors barely contribute to model performance. Source: Prepared by the authors.
Figure 27.
Permutation-based importance of variables in the SVM model. Most of the predictive power lies in firm size, while the remaining predictors barely contribute to model performance. Source: Prepared by the authors.
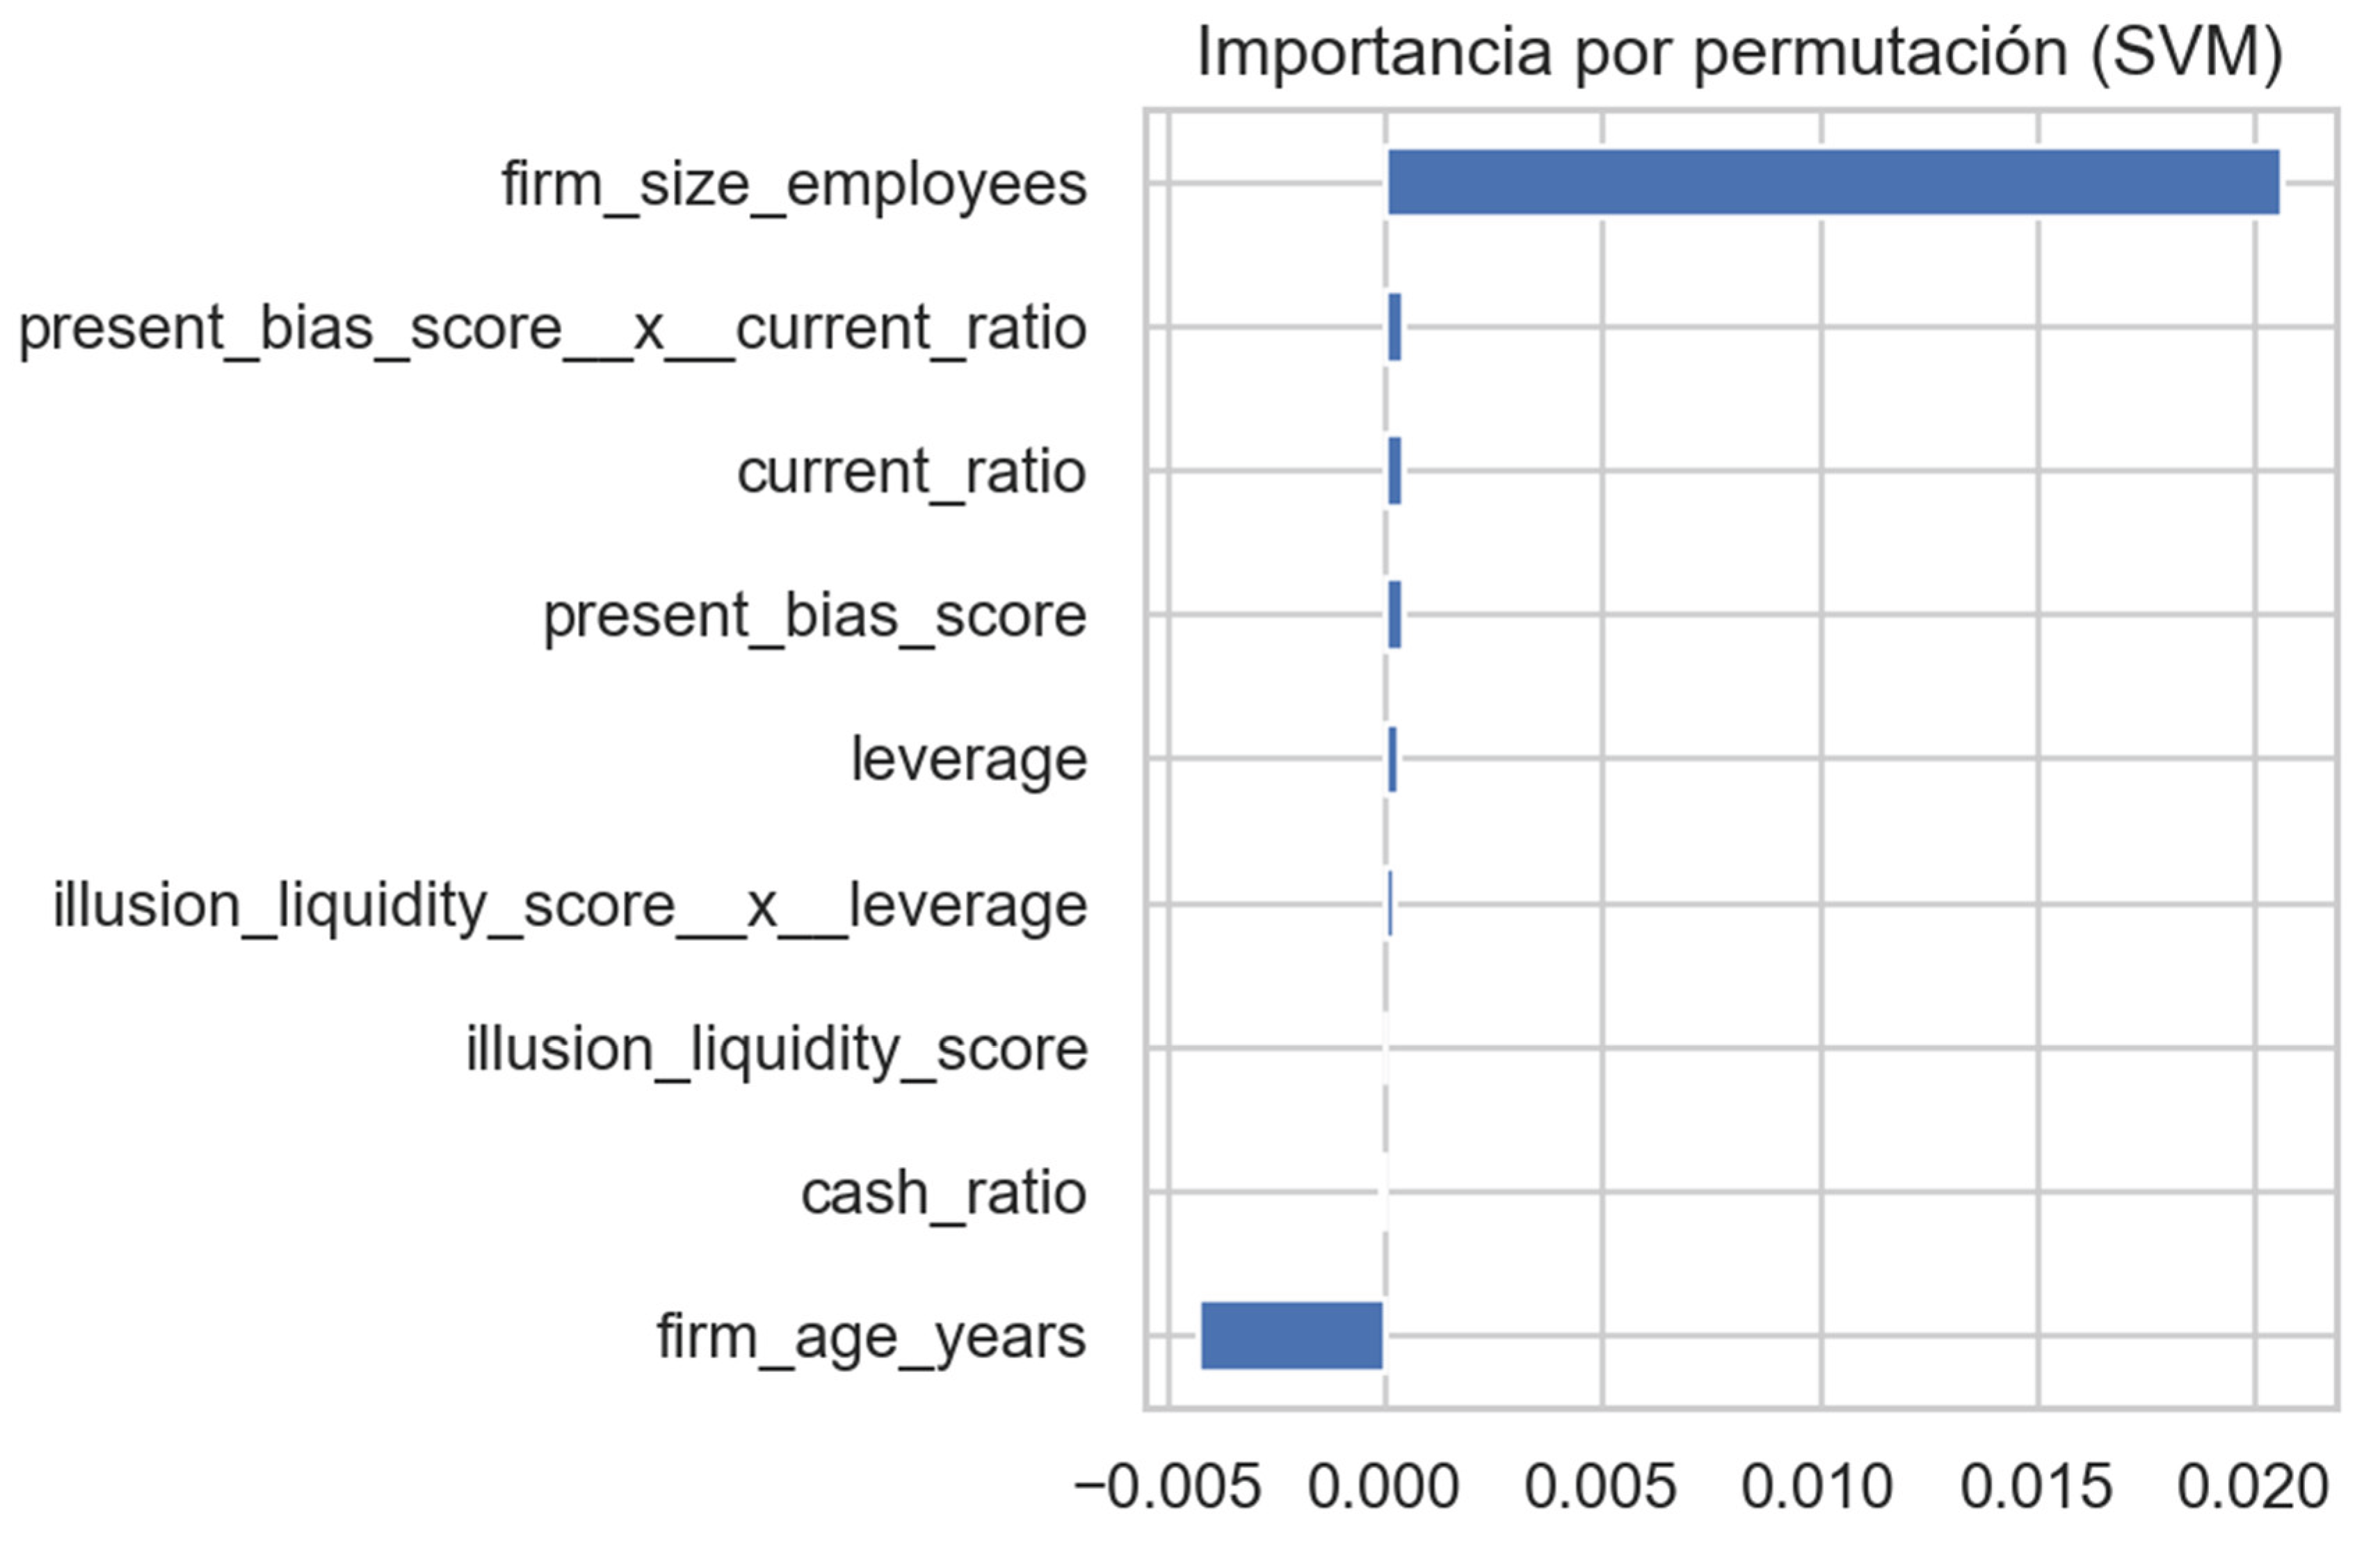
Figure 28.
Relative importance of variables in the XGBoost/Gradient Boosting model, highlighting the dominance of classical financial predictors over behavioral components. Source: Prepared by the authors.
Figure 28.
Relative importance of variables in the XGBoost/Gradient Boosting model, highlighting the dominance of classical financial predictors over behavioral components. Source: Prepared by the authors.
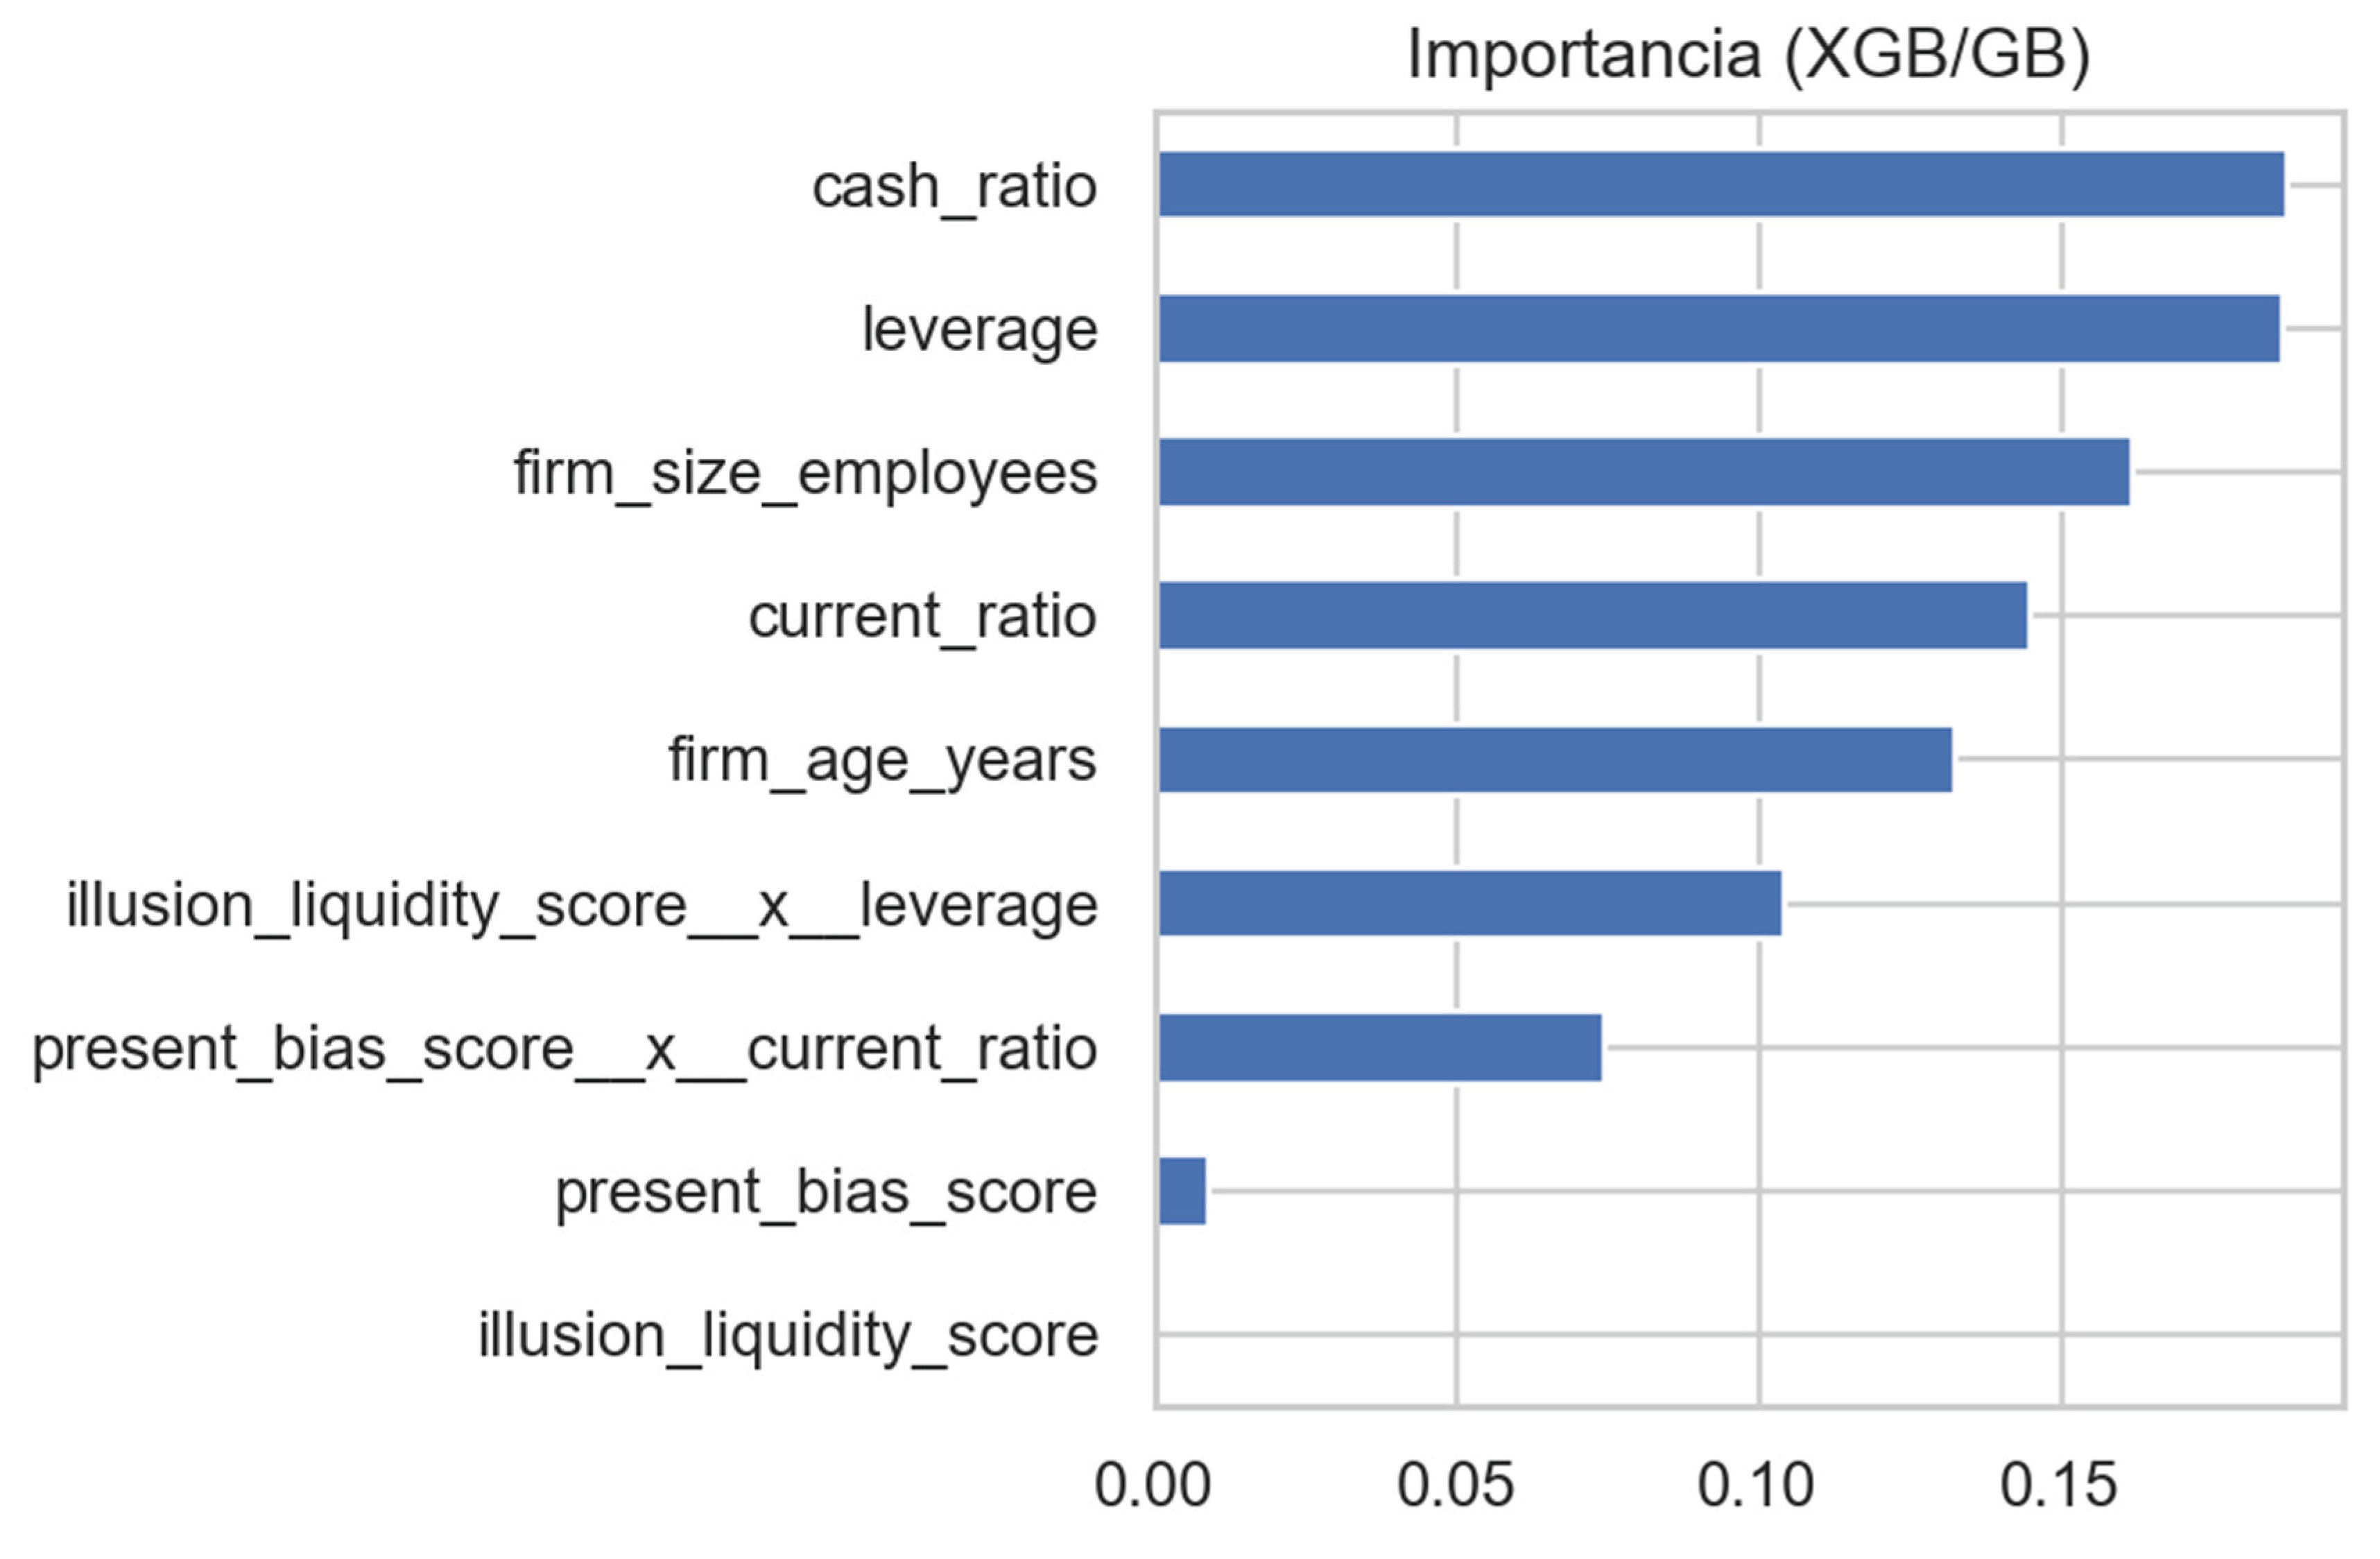
Figure 28.
Calibration curve for the LASSO model. Source: Prepared by the authors.
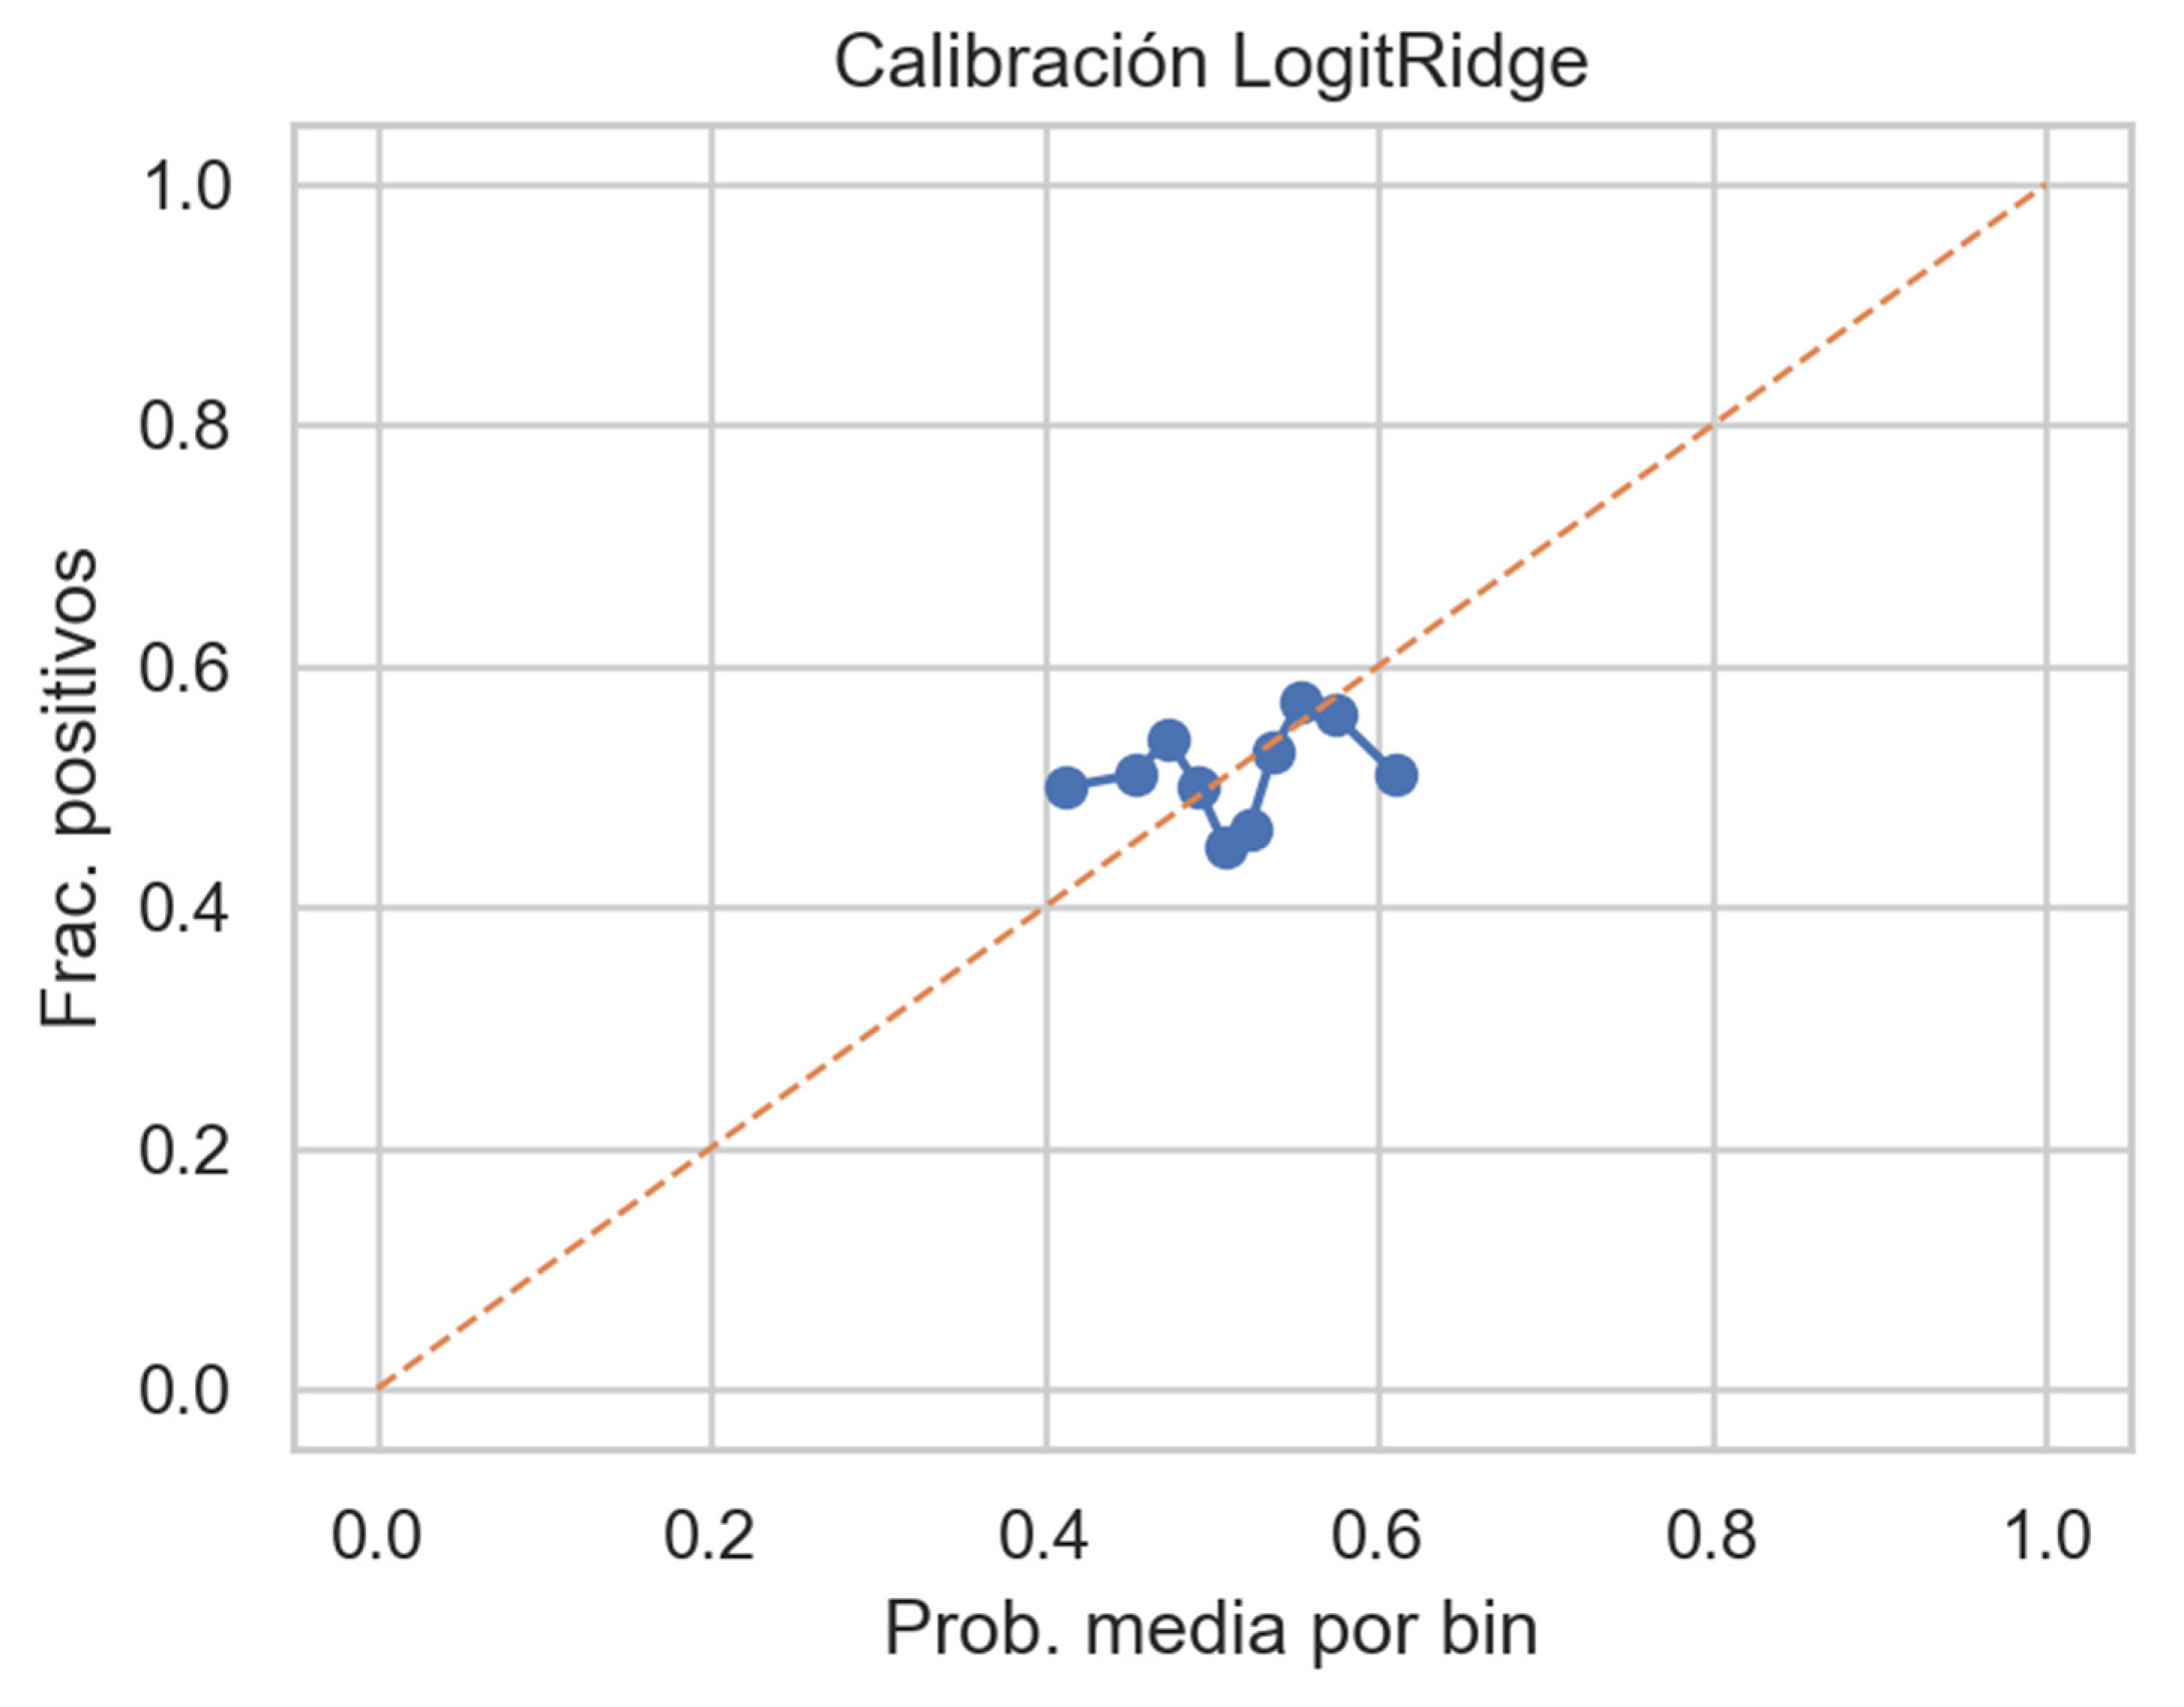
Figure 29.
Calibration curve for the LogitRidge model. Source: Prepared by the authors.
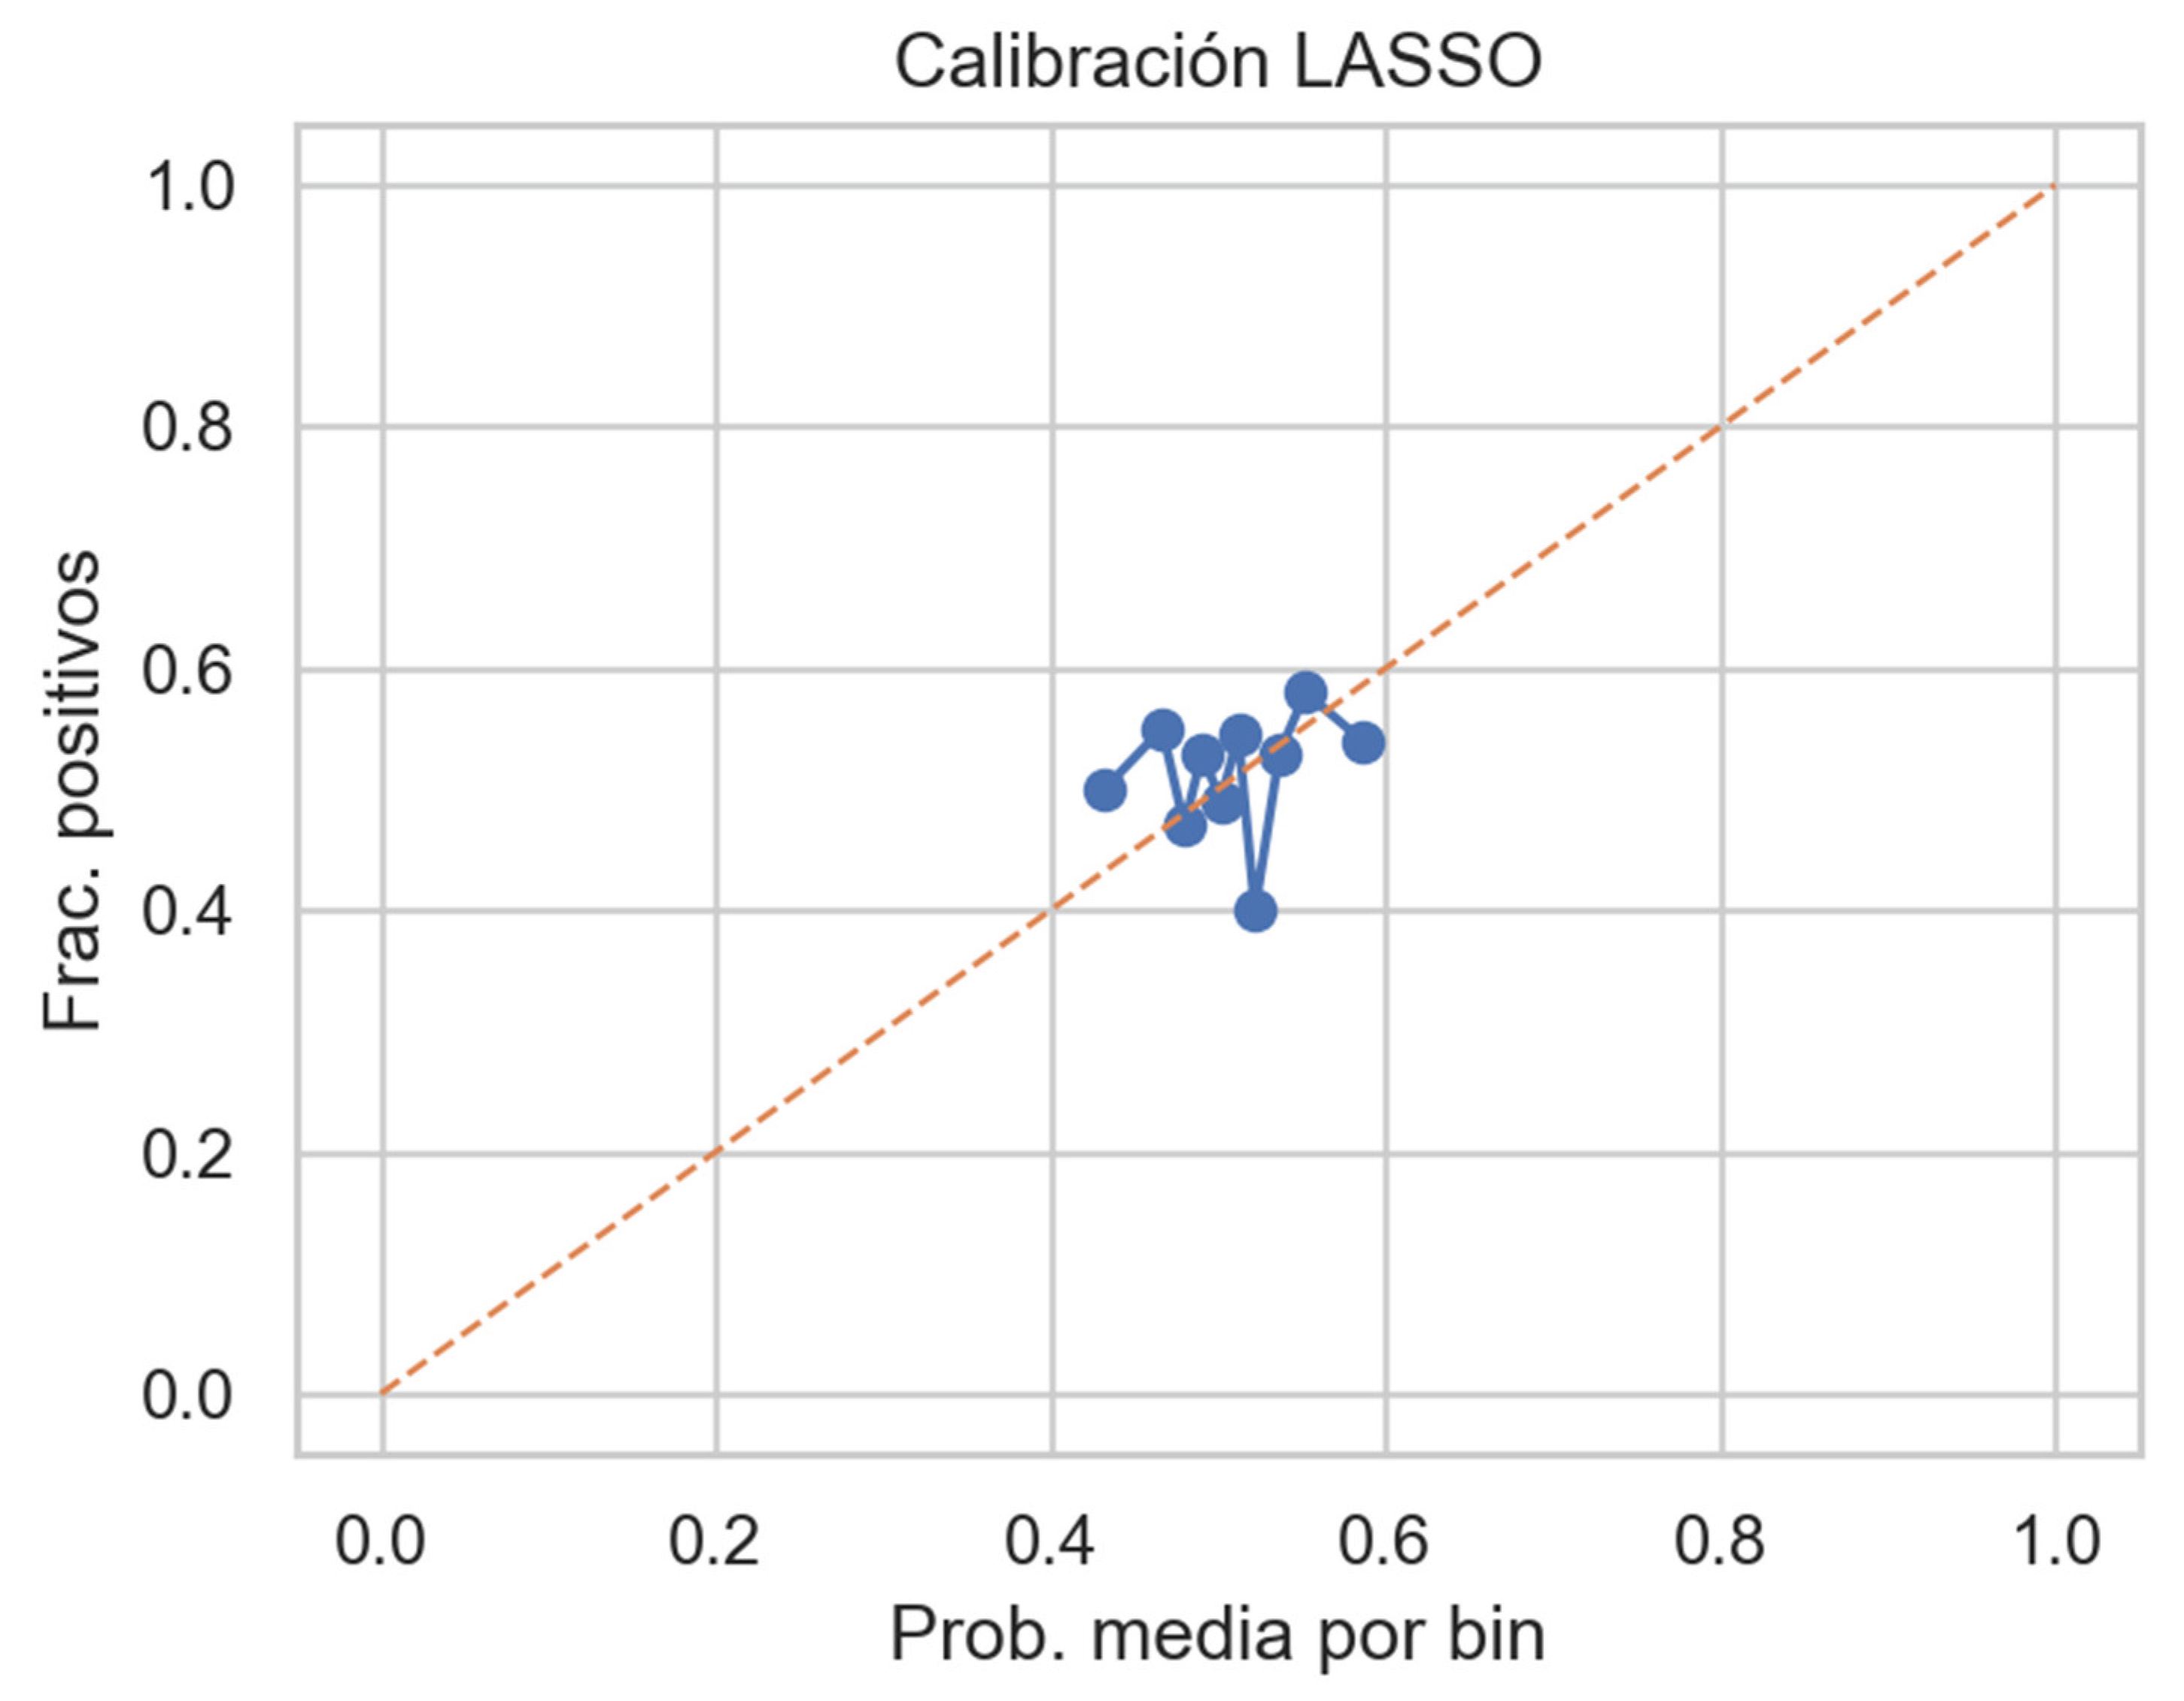
Figure 30.
Calibration curve for the Random Forest model. Source: Prepared by the authors.
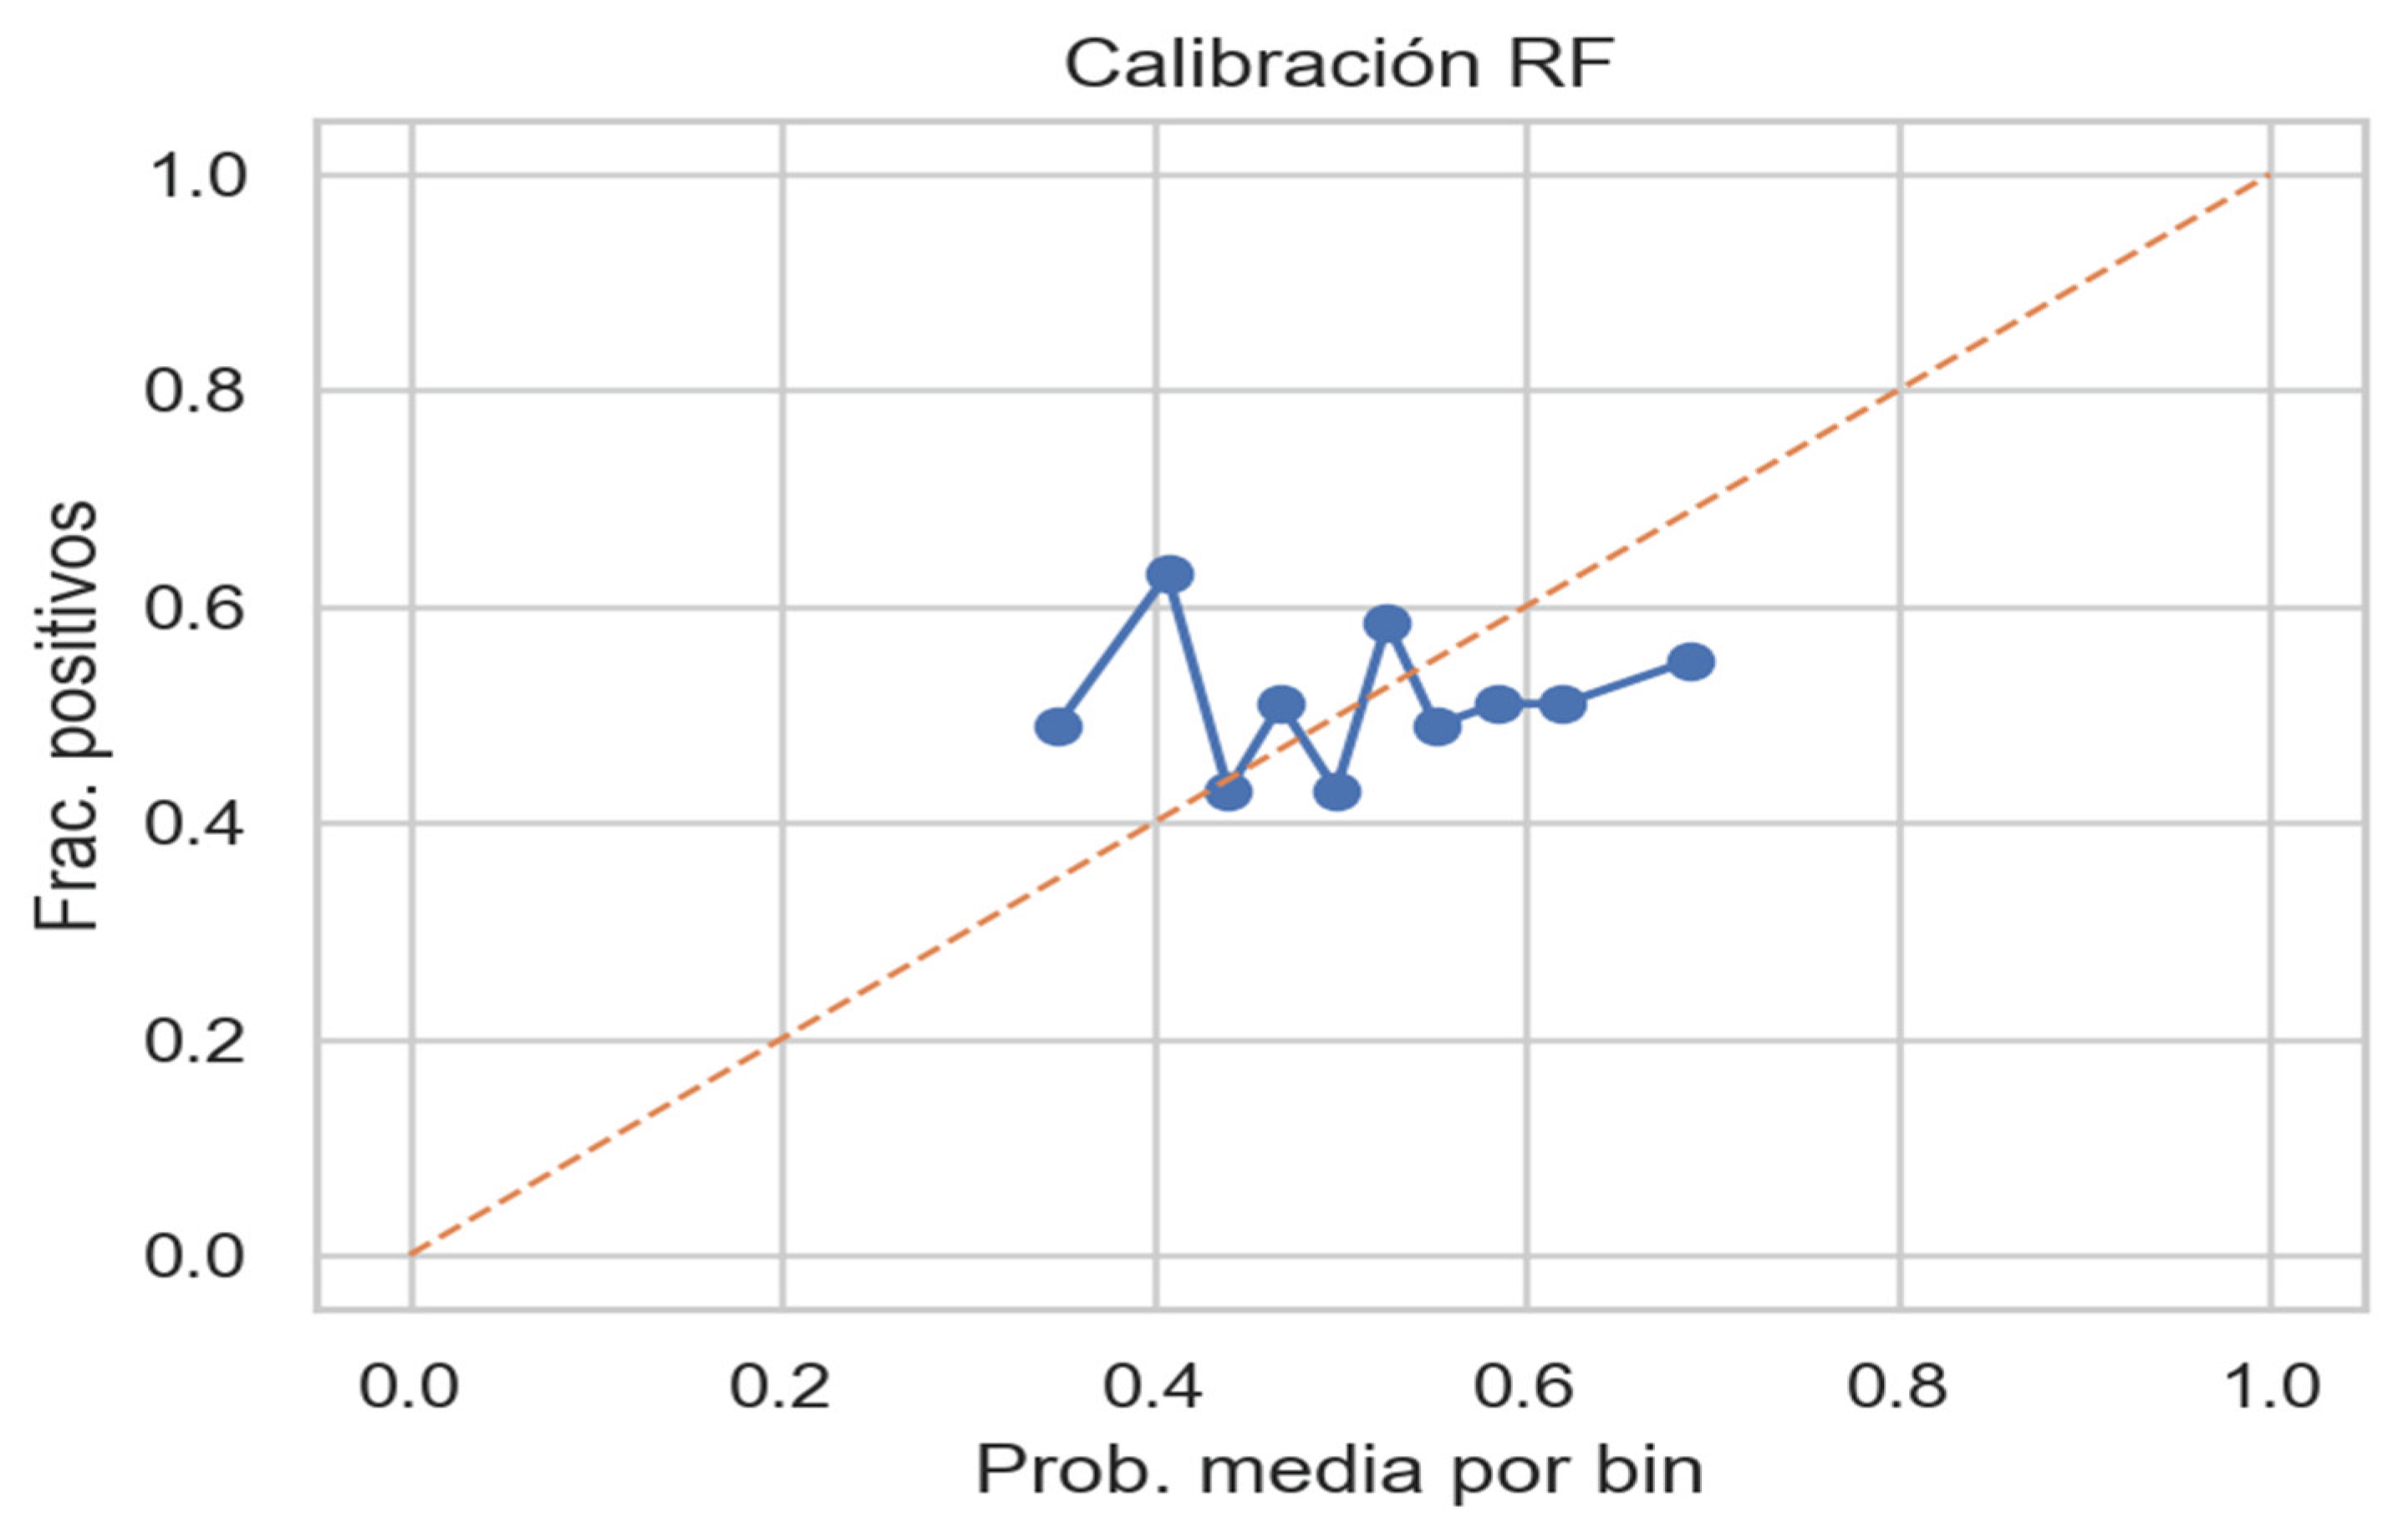
Figure 31.
Calibration curve for the Support Vector Machine (SVM) model. Source: Prepared by the authors.
Figure 31.
Calibration curve for the Support Vector Machine (SVM) model. Source: Prepared by the authors.
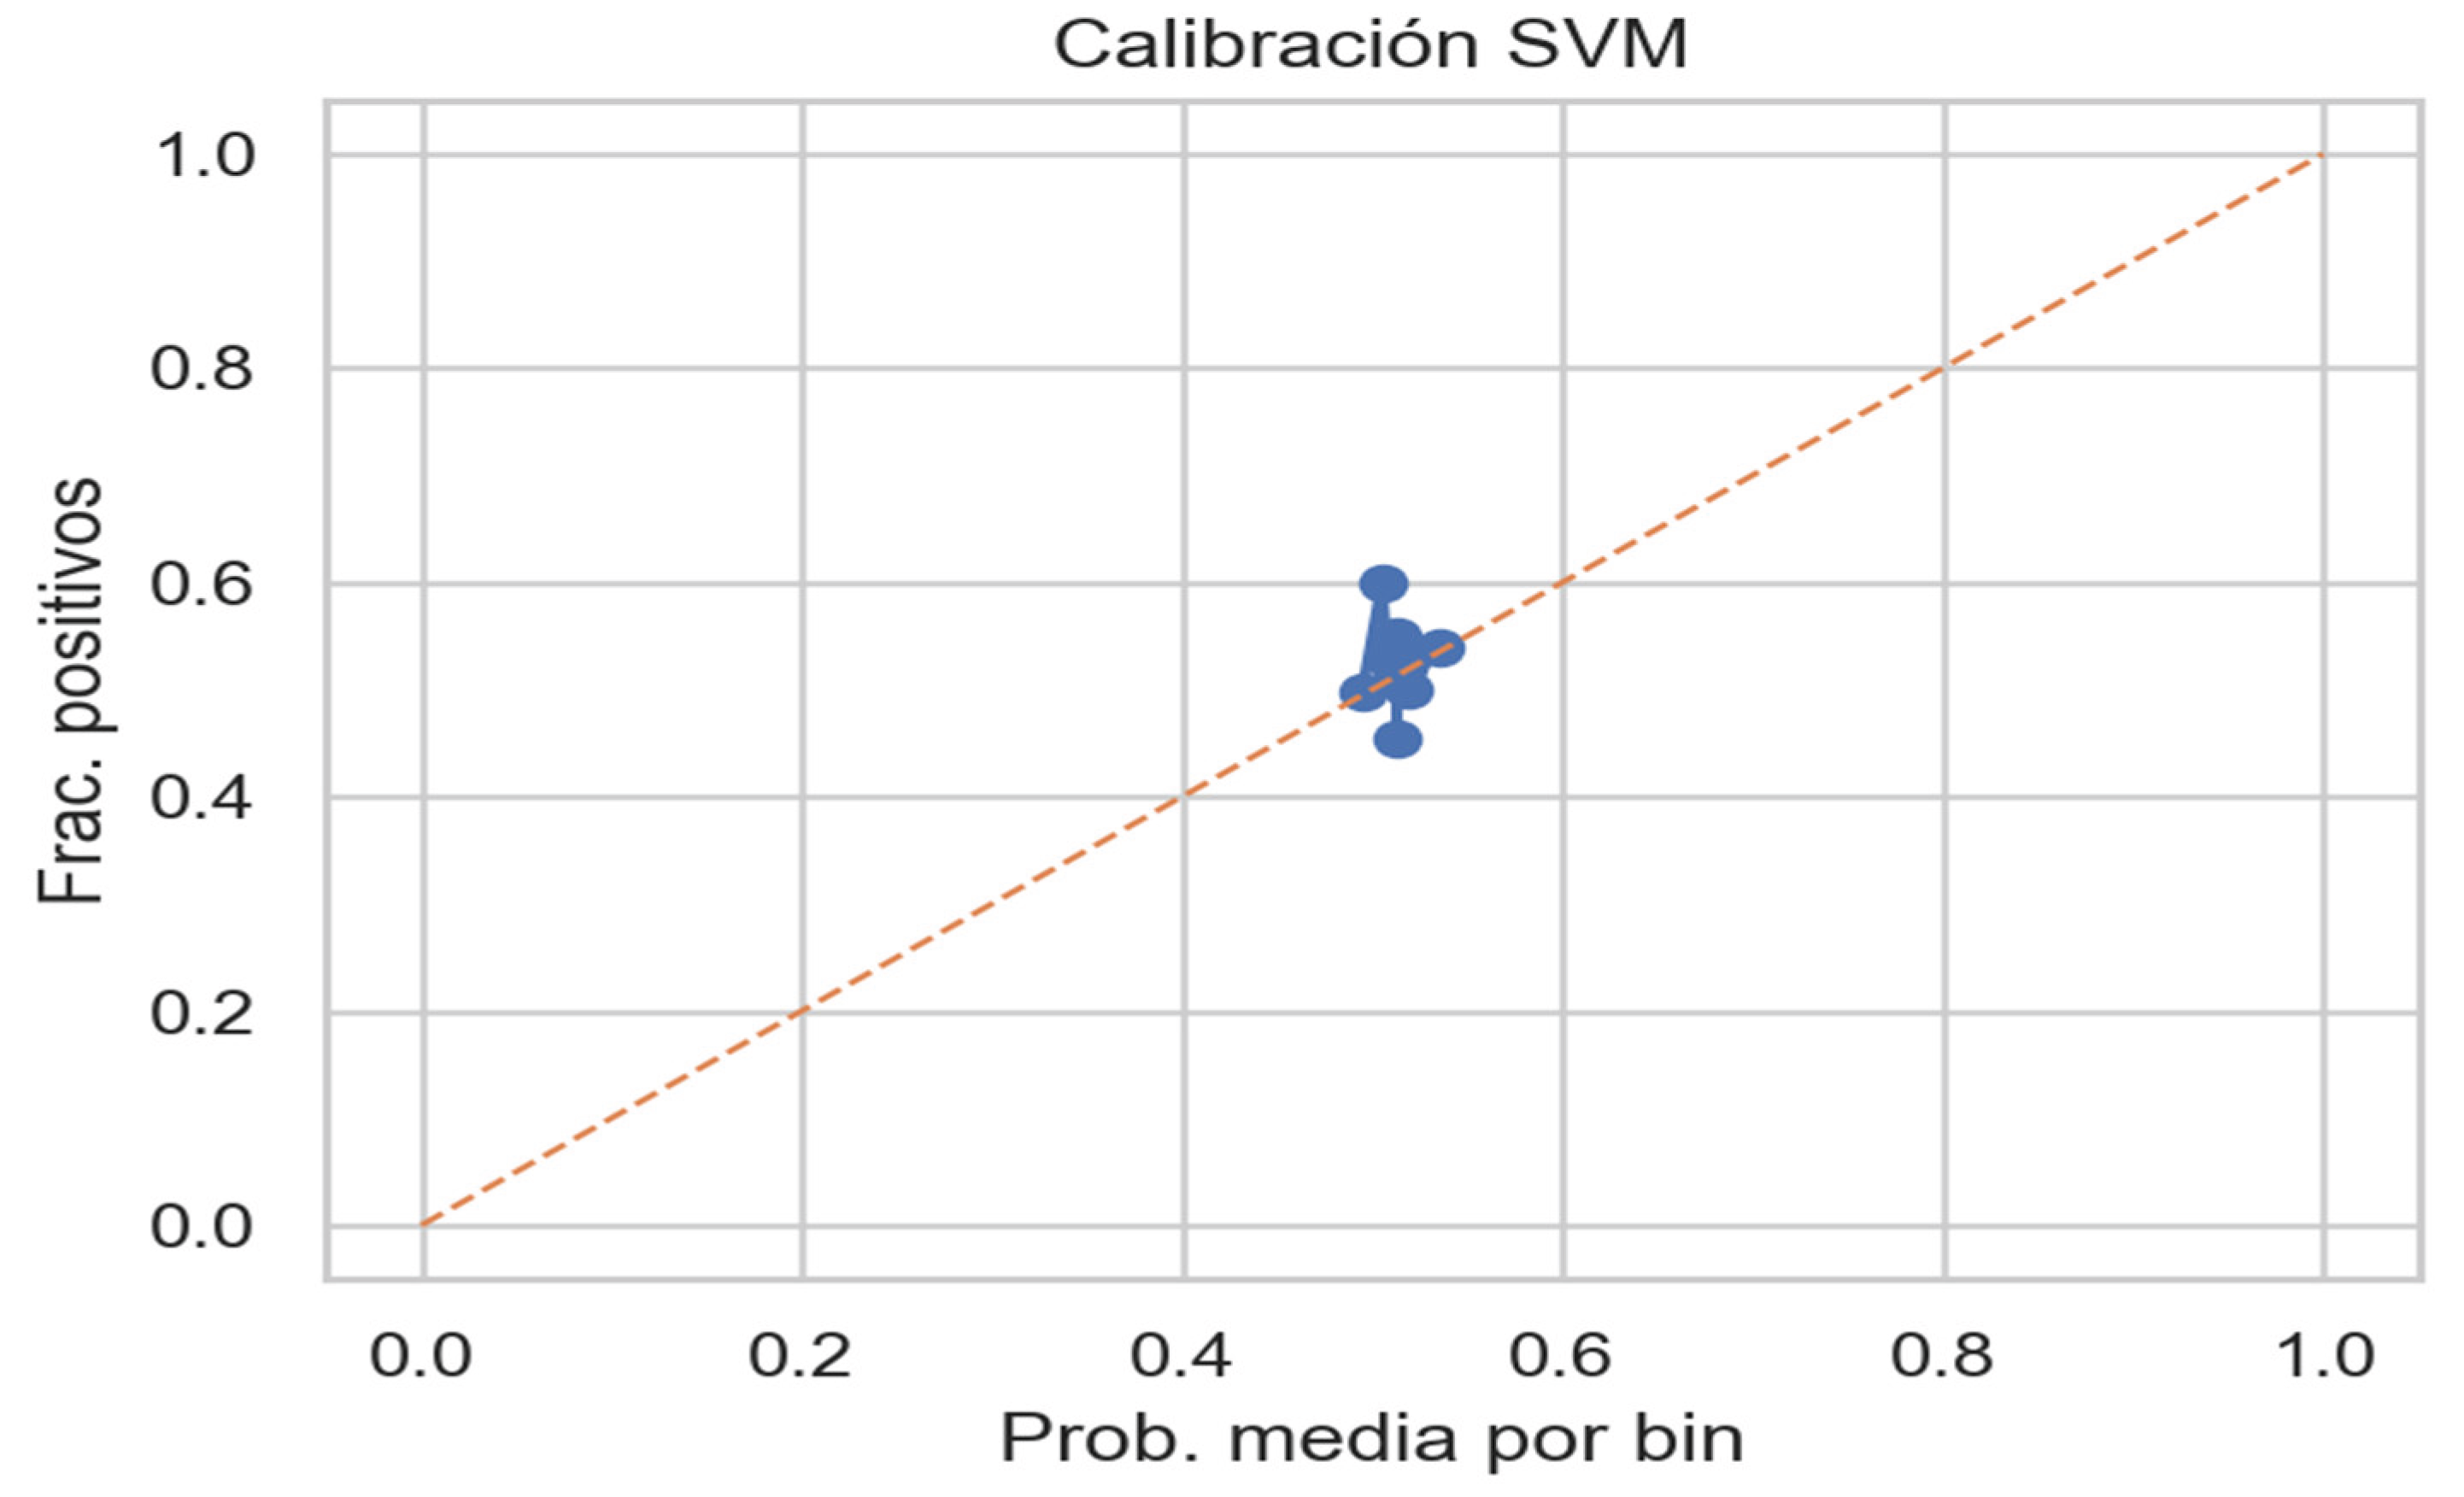
Figure 32.
Calibration curve for the XGBoost model. Source: Prepared by the authors.
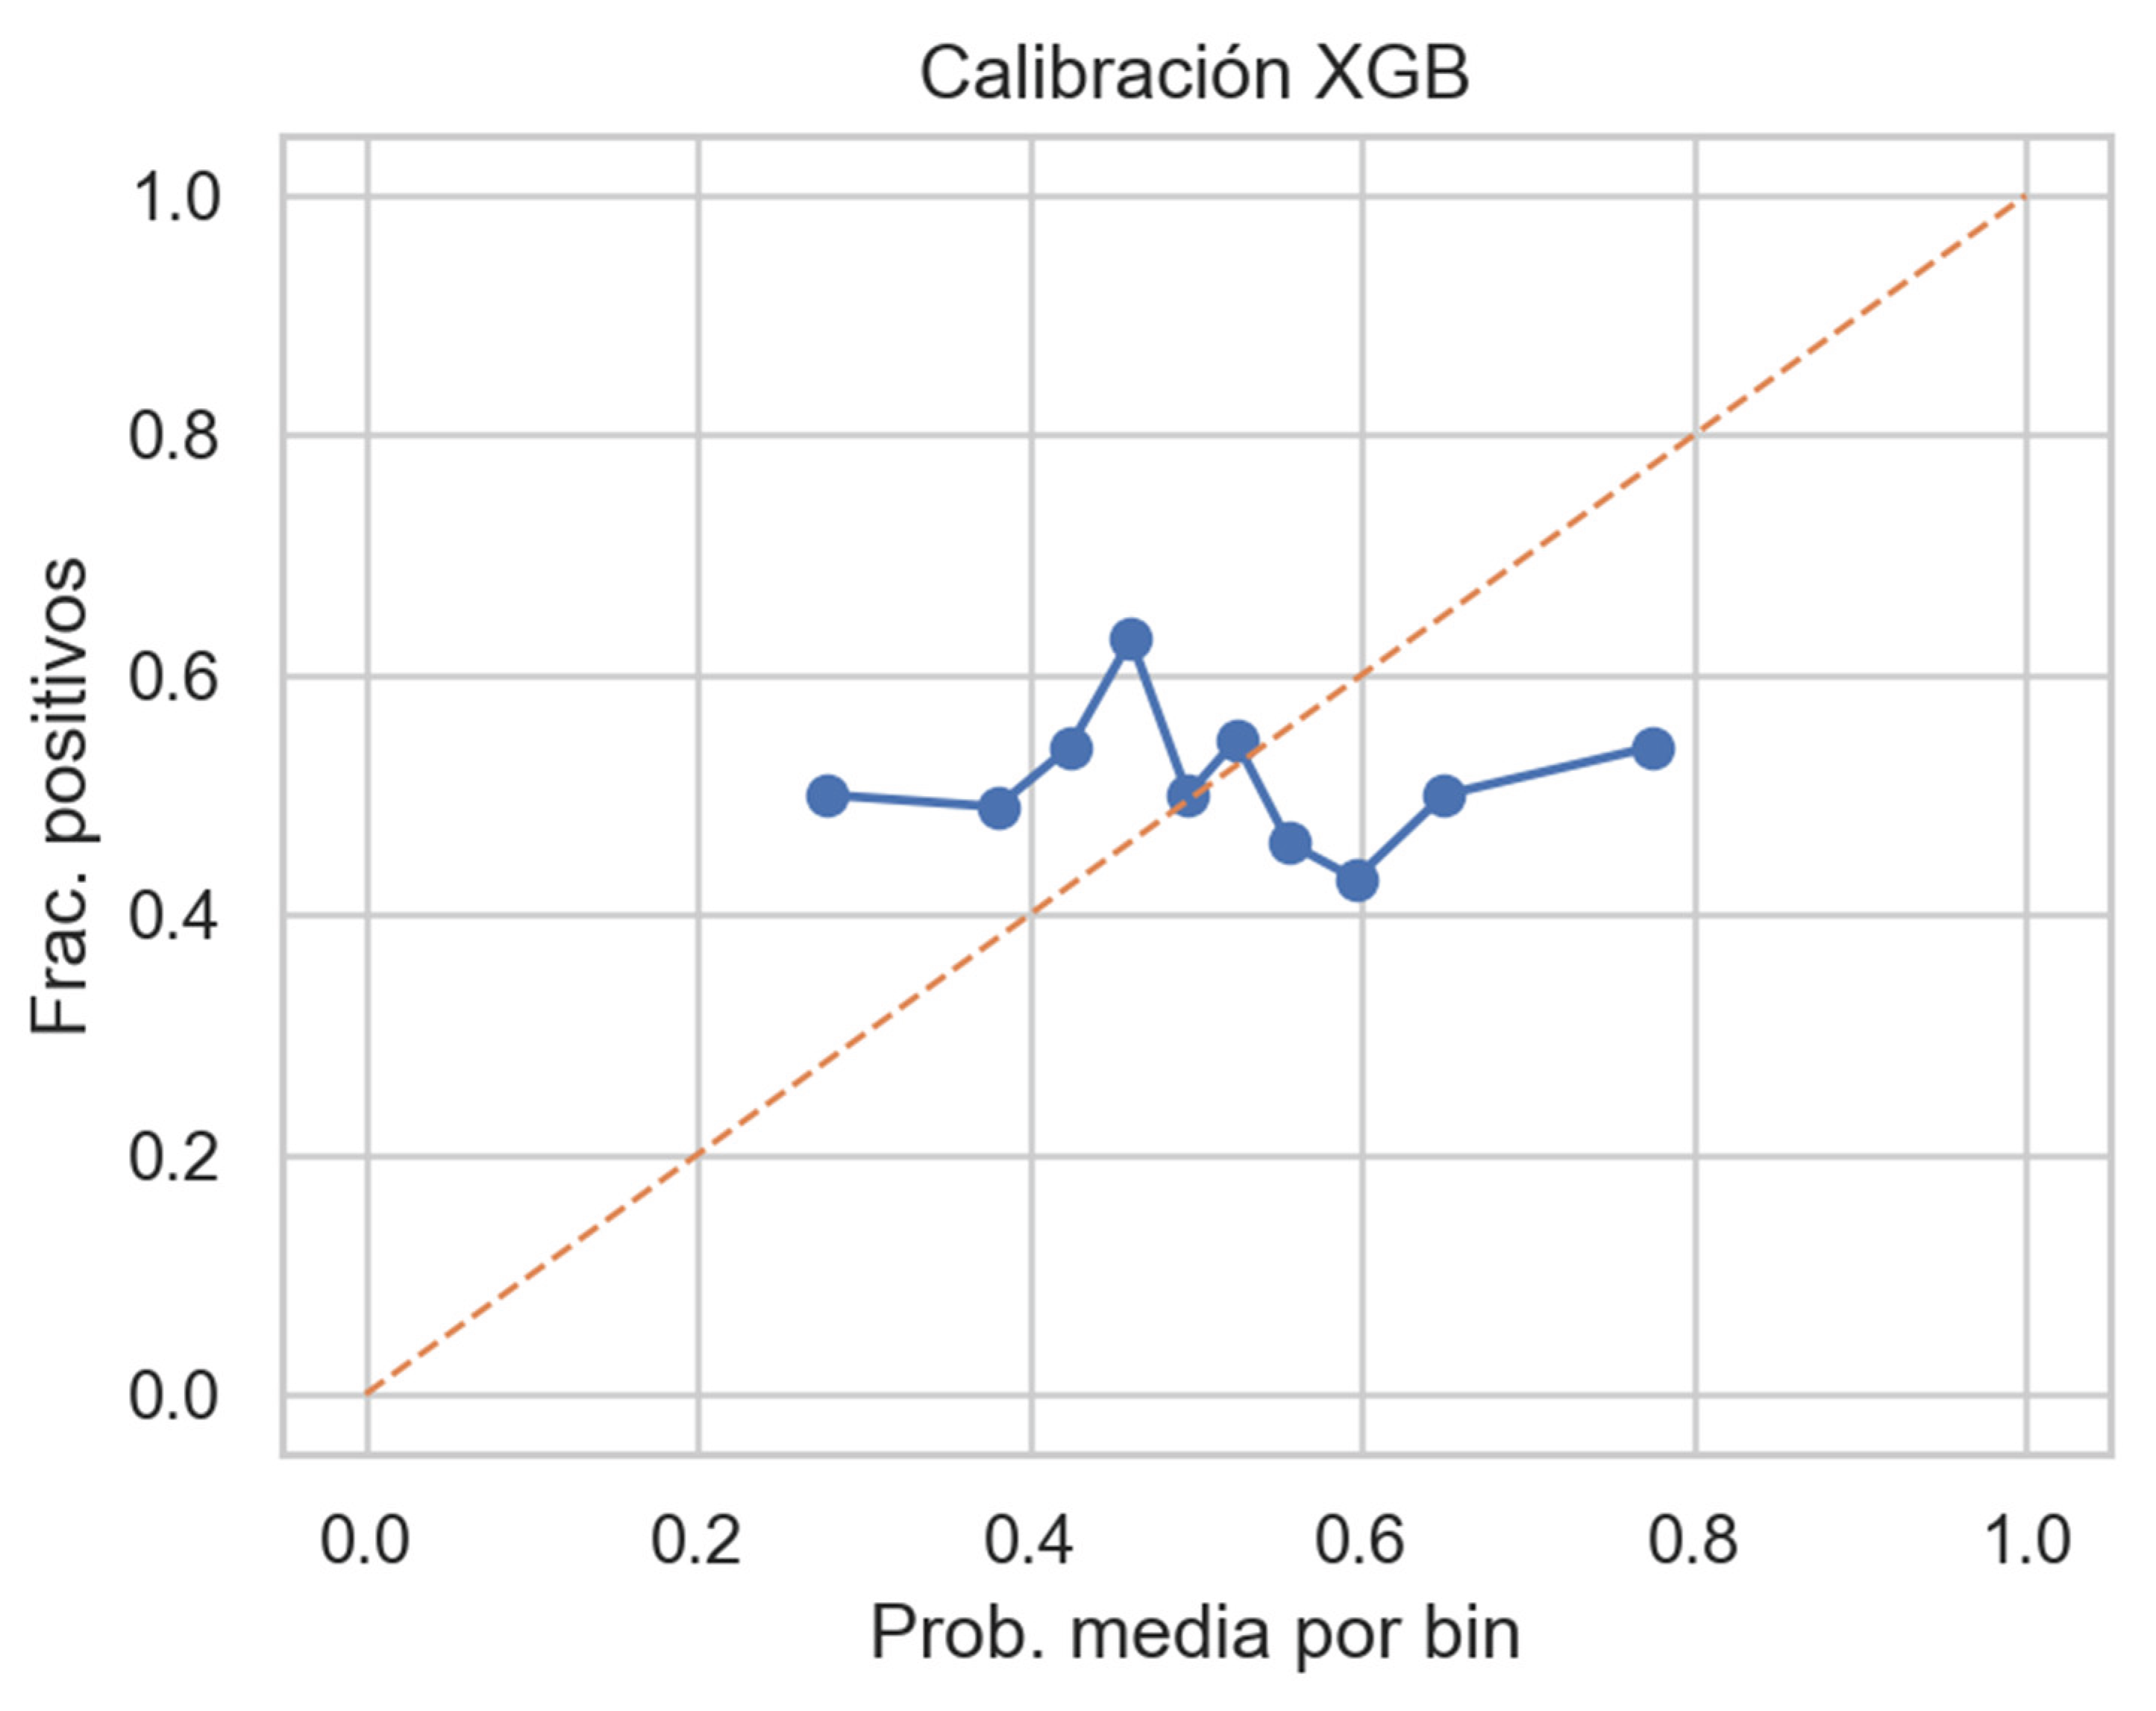
Figure 33.
Variance Inflation Factors (VIF) by variable. High collinearity is observed in the behavioral-bias interactions, but acceptable levels are observed for the remaining predictors. Source: Prepared by the authors.
Figure 33.
Variance Inflation Factors (VIF) by variable. High collinearity is observed in the behavioral-bias interactions, but acceptable levels are observed for the remaining predictors. Source: Prepared by the authors.
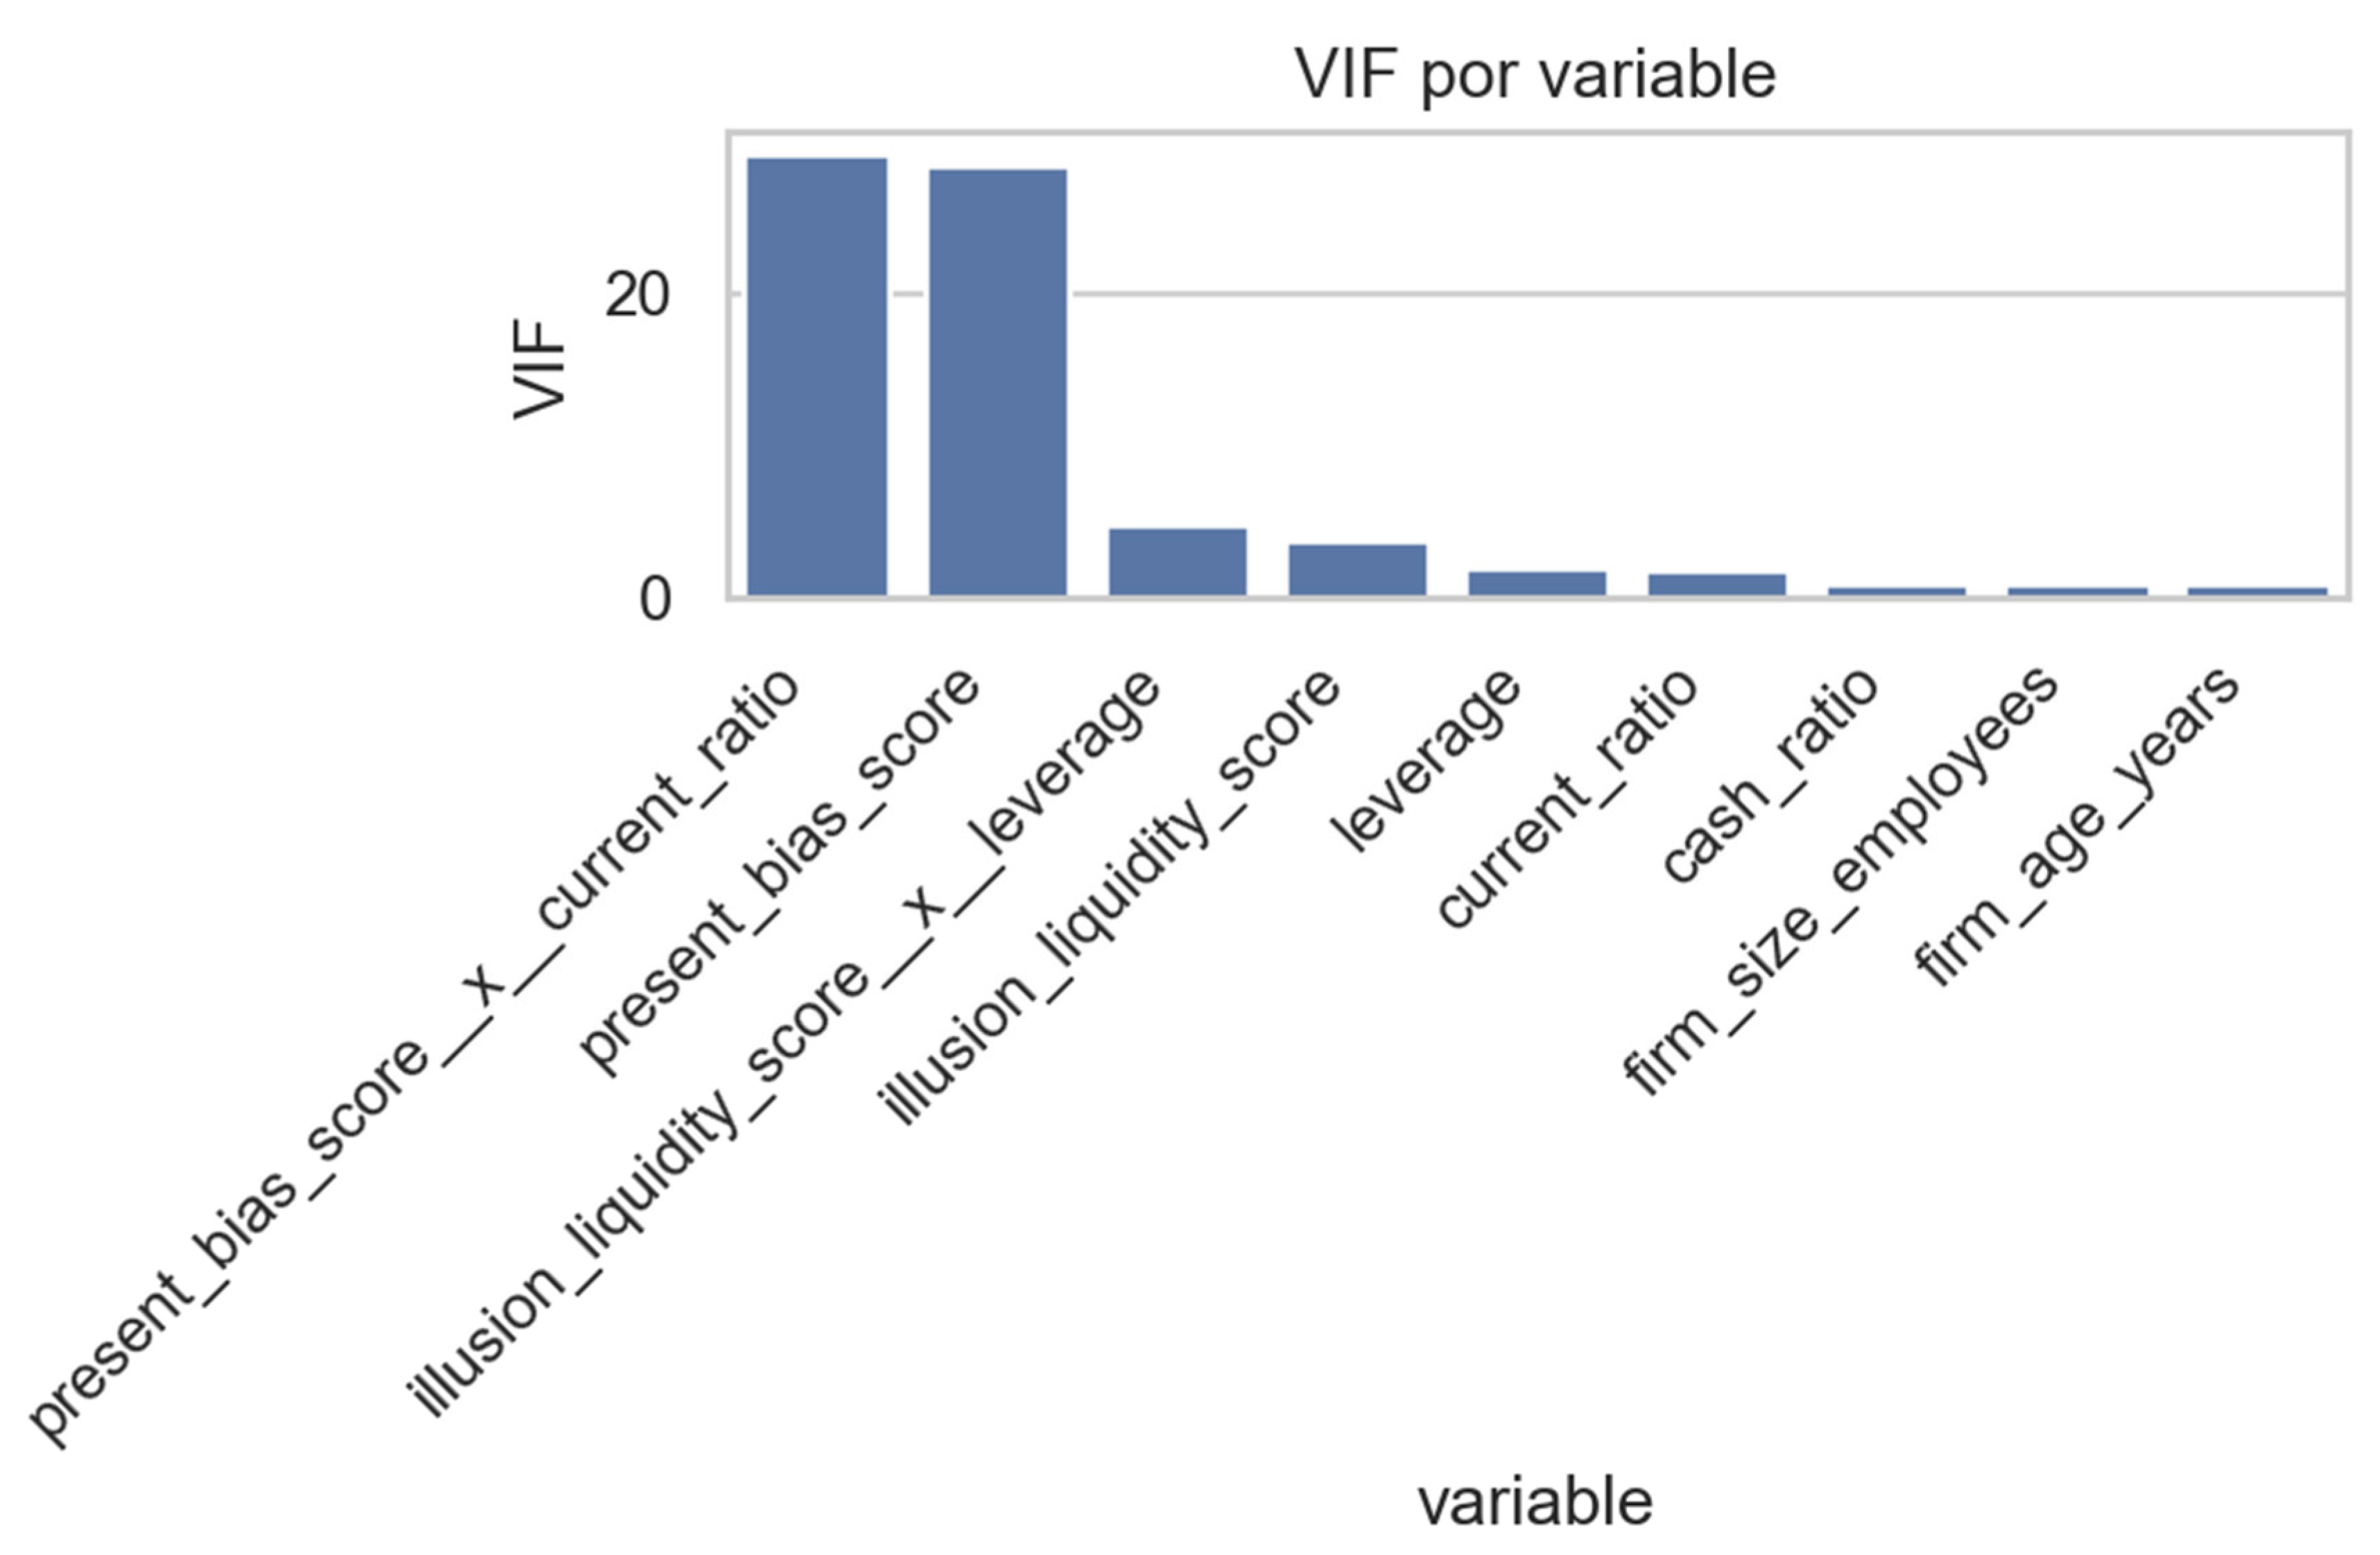
Figure 34.
Standardized weights of the Partial Least Squares (PLS) regression model (R² = 0.010). Liquidity ratios and firm size emerge as dominant predictors, confirming the limited explanatory capacity of linear models. Source: Prepared by the authors.
Figure 34.
Standardized weights of the Partial Least Squares (PLS) regression model (R² = 0.010). Liquidity ratios and firm size emerge as dominant predictors, confirming the limited explanatory capacity of linear models. Source: Prepared by the authors.
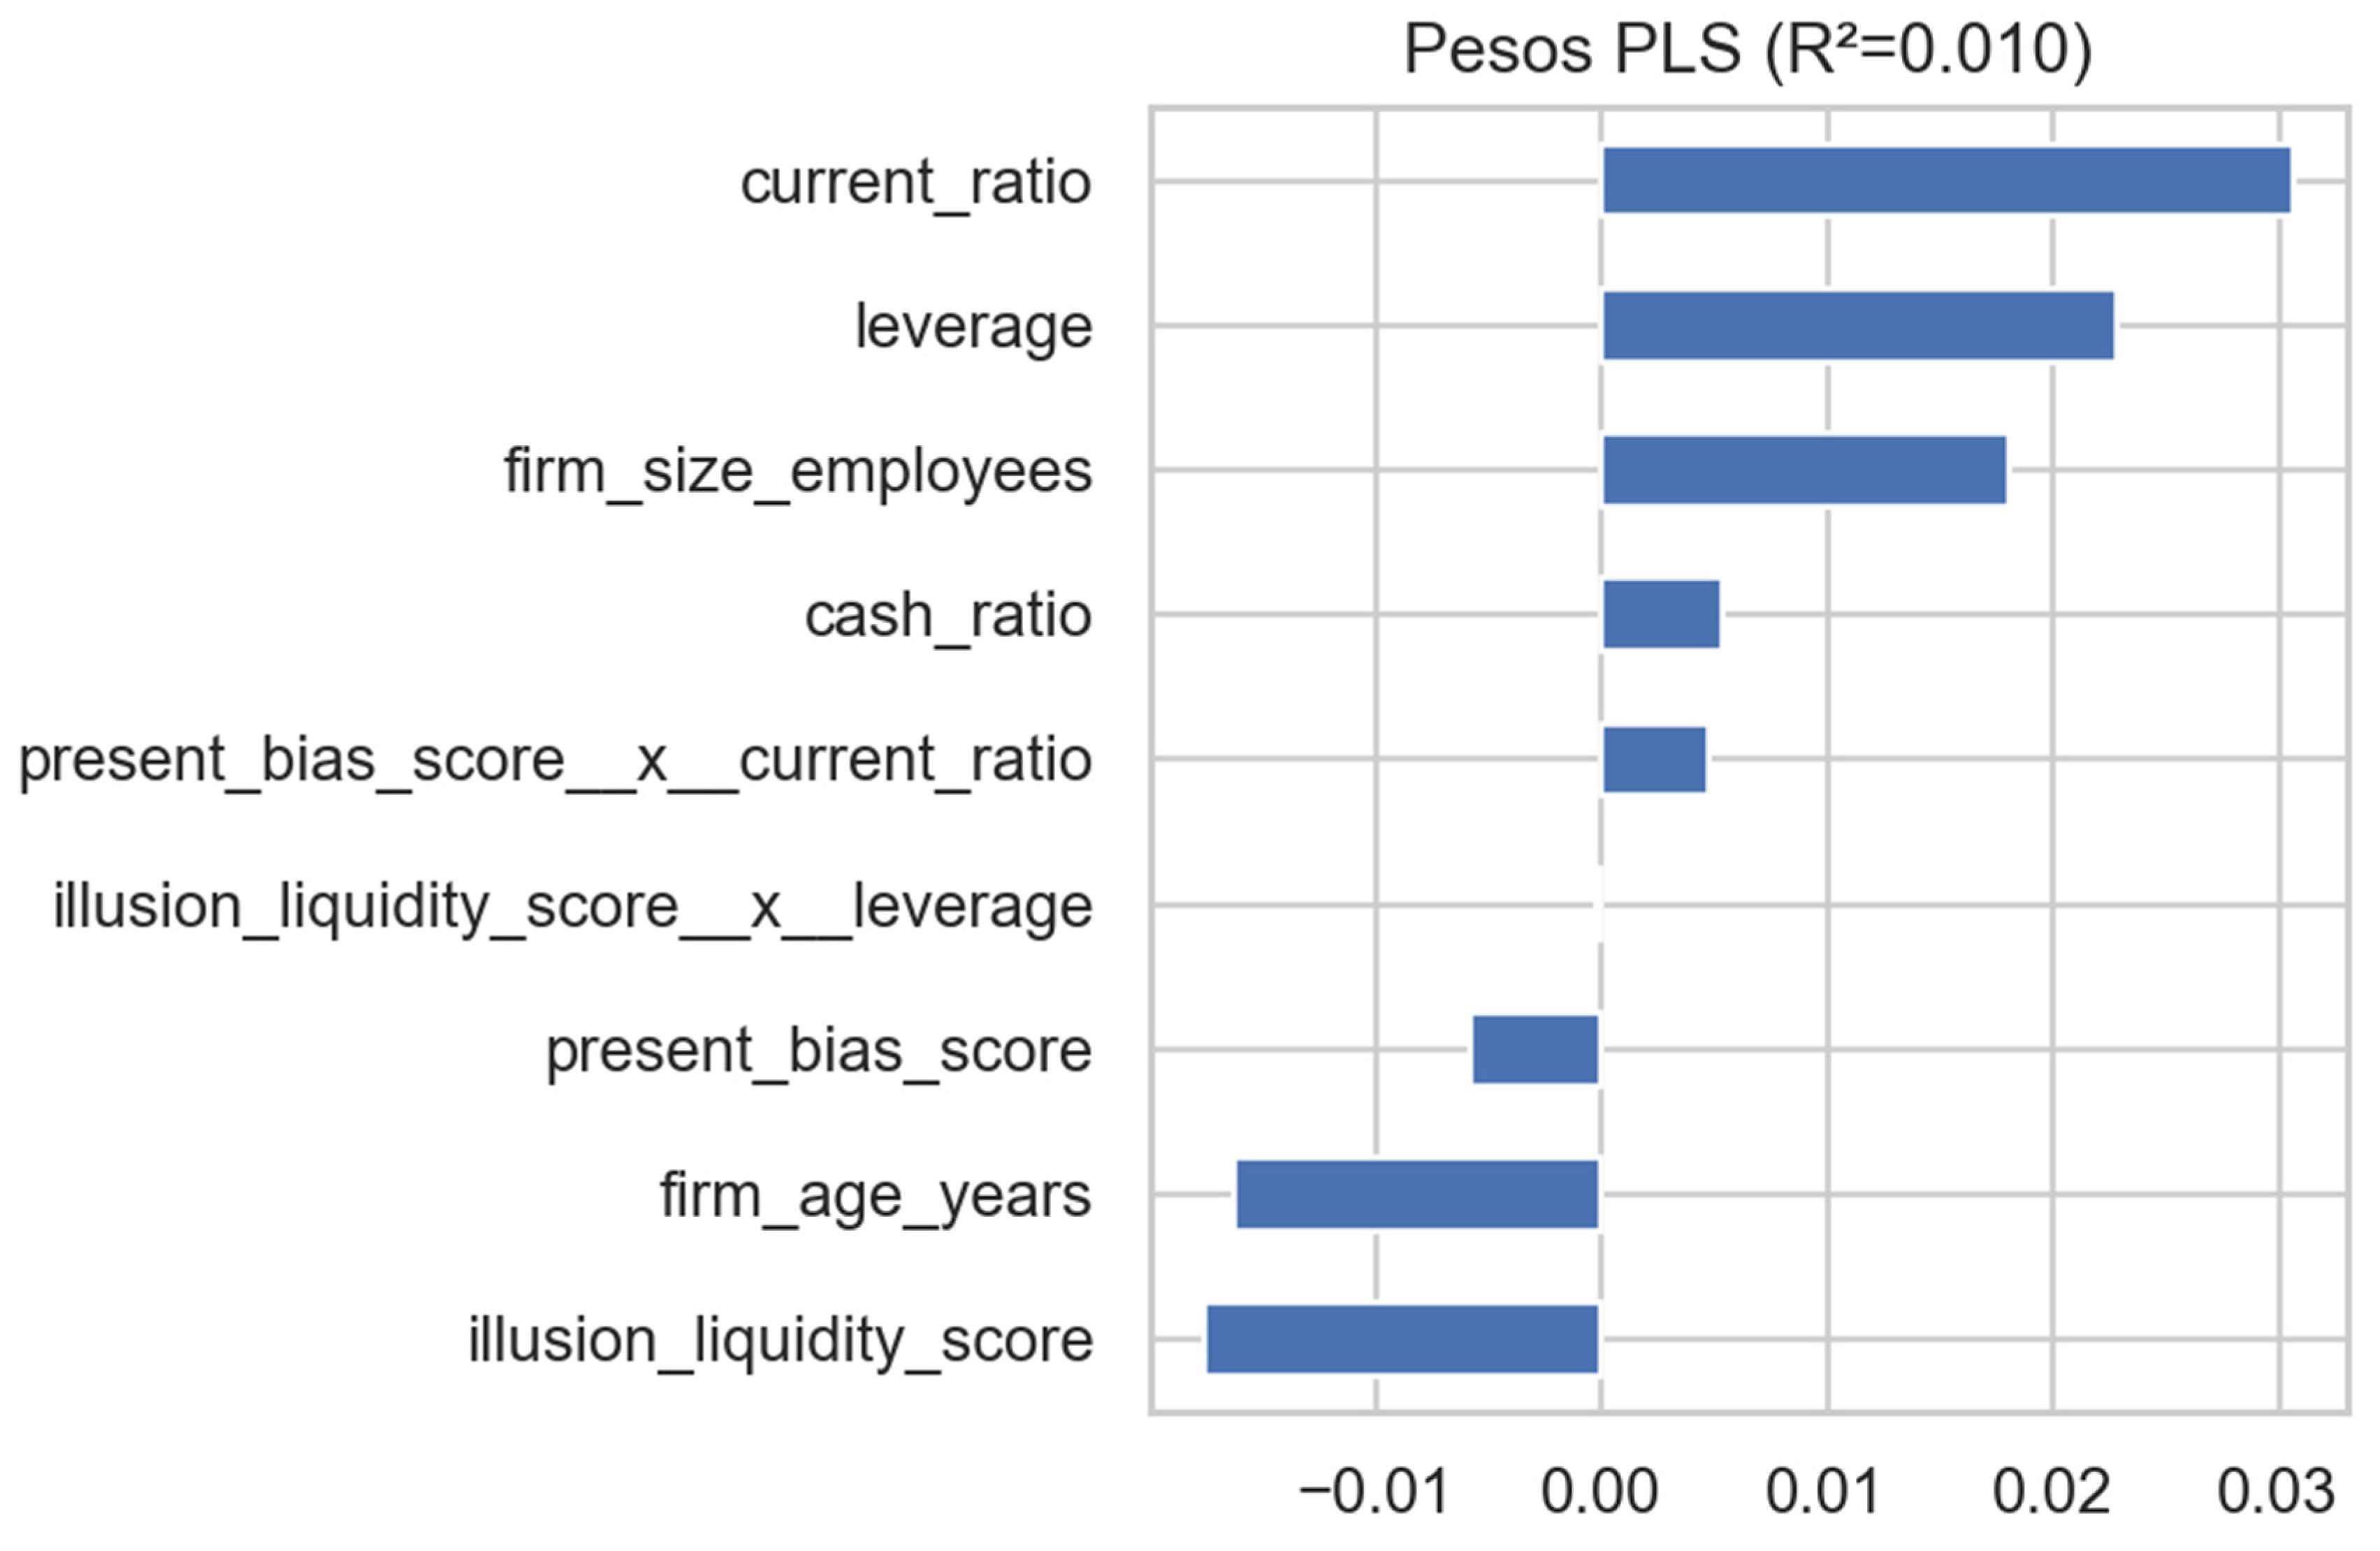
Figure 35.
Mean proportion by class — illusion_liquidity_score. Firms under financial distress show a slightly lower average illusion of liquidity score, reflecting a loss of perceived financial control. Source: Author.
Figure 35.
Mean proportion by class — illusion_liquidity_score. Firms under financial distress show a slightly lower average illusion of liquidity score, reflecting a loss of perceived financial control. Source: Author.
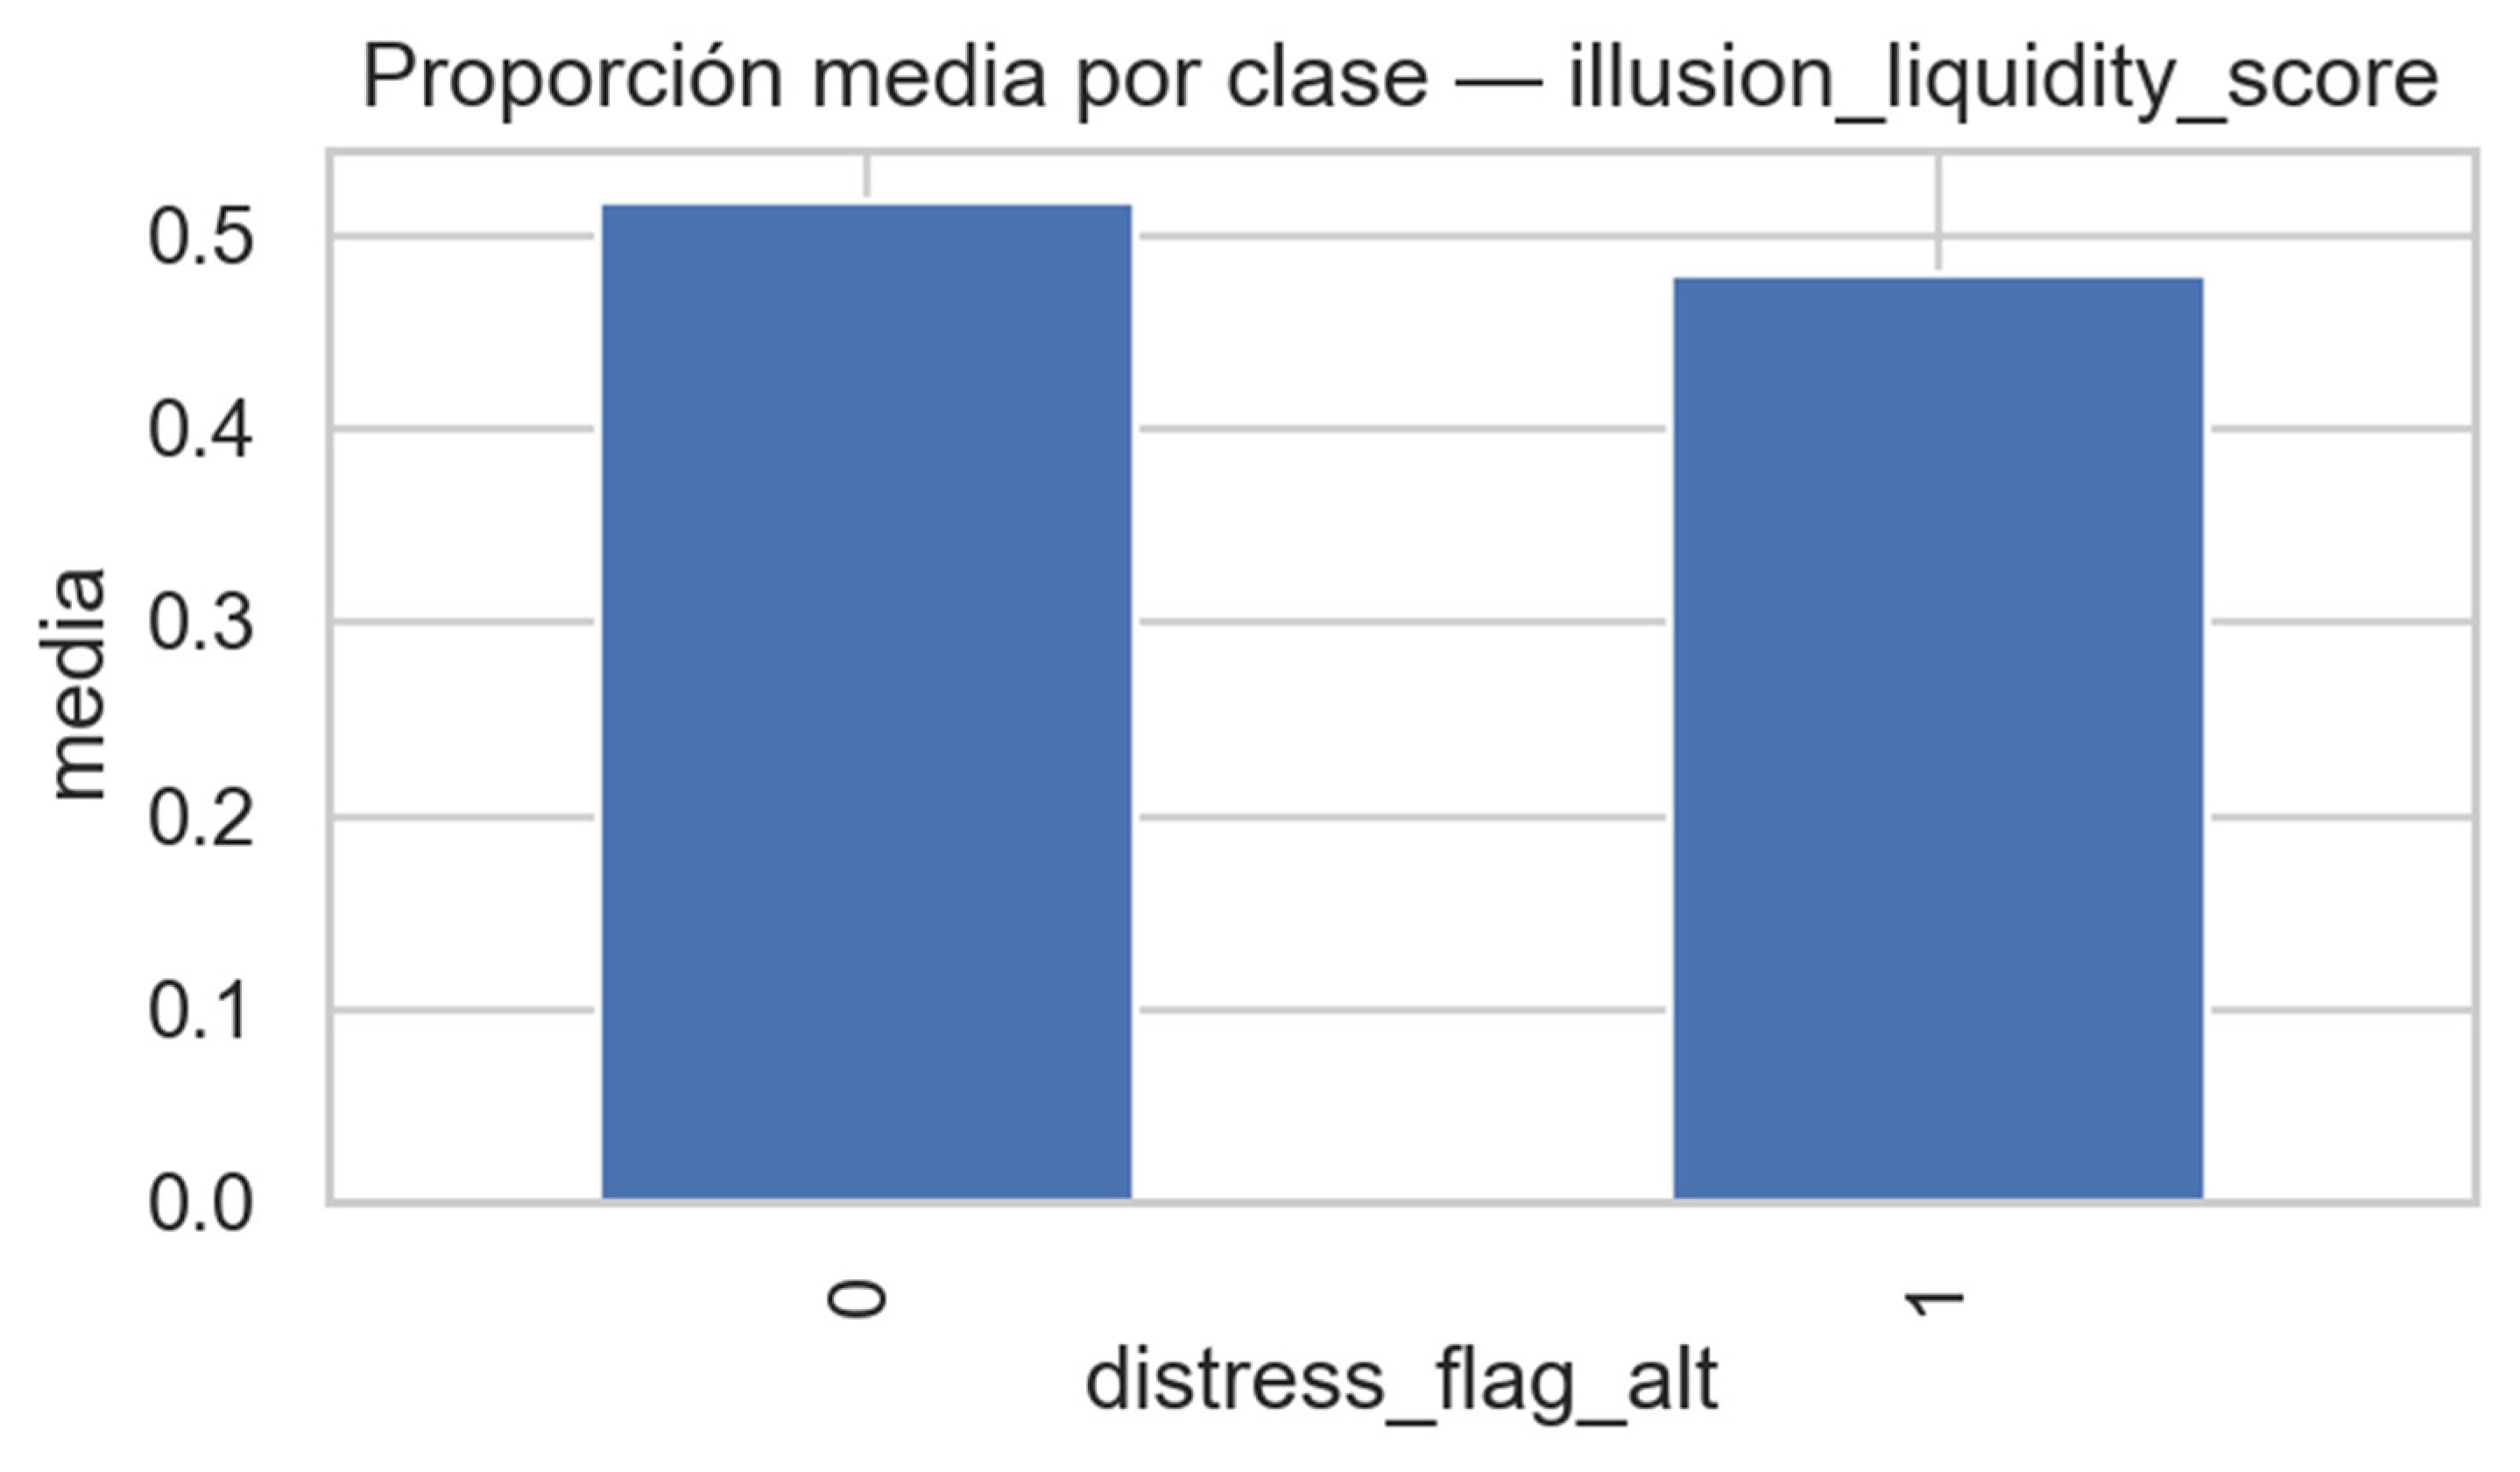
Figure 36.
Mean proportion by class — present_bias_score. Distressed firms show a minor decrease in present bias, indicating a reduced immediacy orientation under financial constraints. Source: Author.
Figure 36.
Mean proportion by class — present_bias_score. Distressed firms show a minor decrease in present bias, indicating a reduced immediacy orientation under financial constraints. Source: Author.
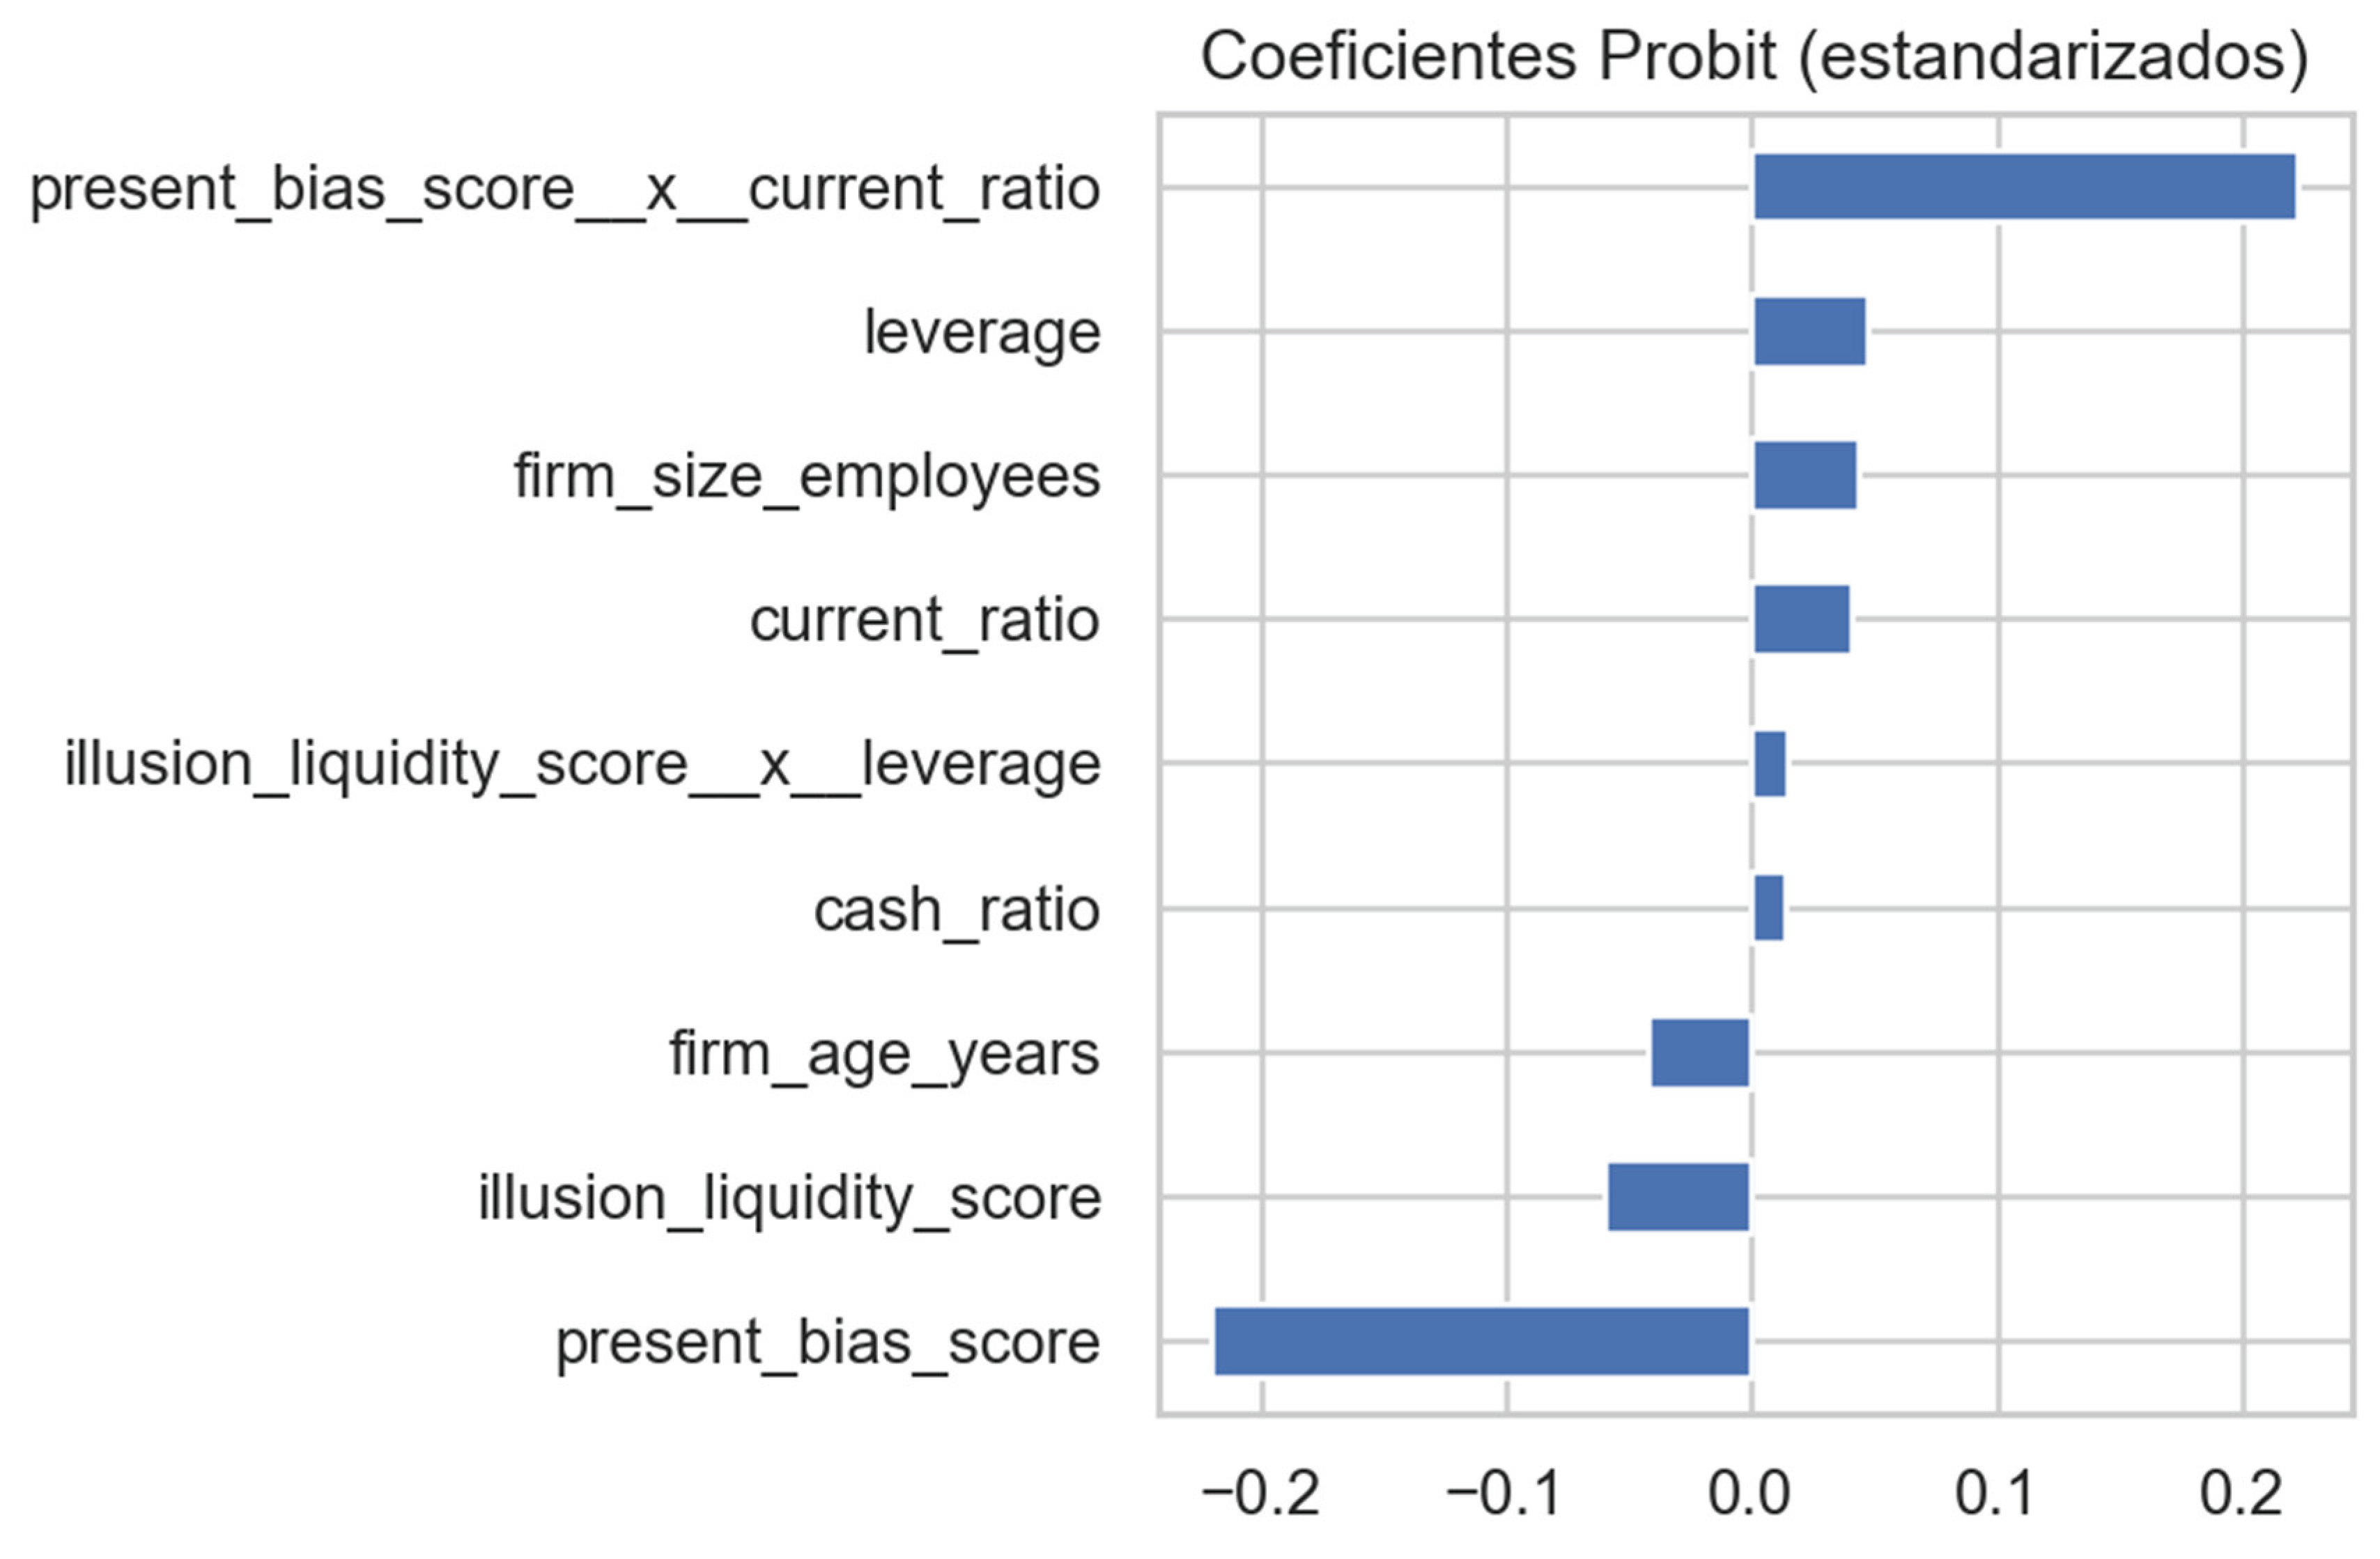
Figure 38.
Robust partial dependence plot for firm_age_years. Older firms display a lower predicted probability of distress, consistent with a stabilizing maturity effect. Source: Author.
Figure 38.
Robust partial dependence plot for firm_age_years. Older firms display a lower predicted probability of distress, consistent with a stabilizing maturity effect. Source: Author.
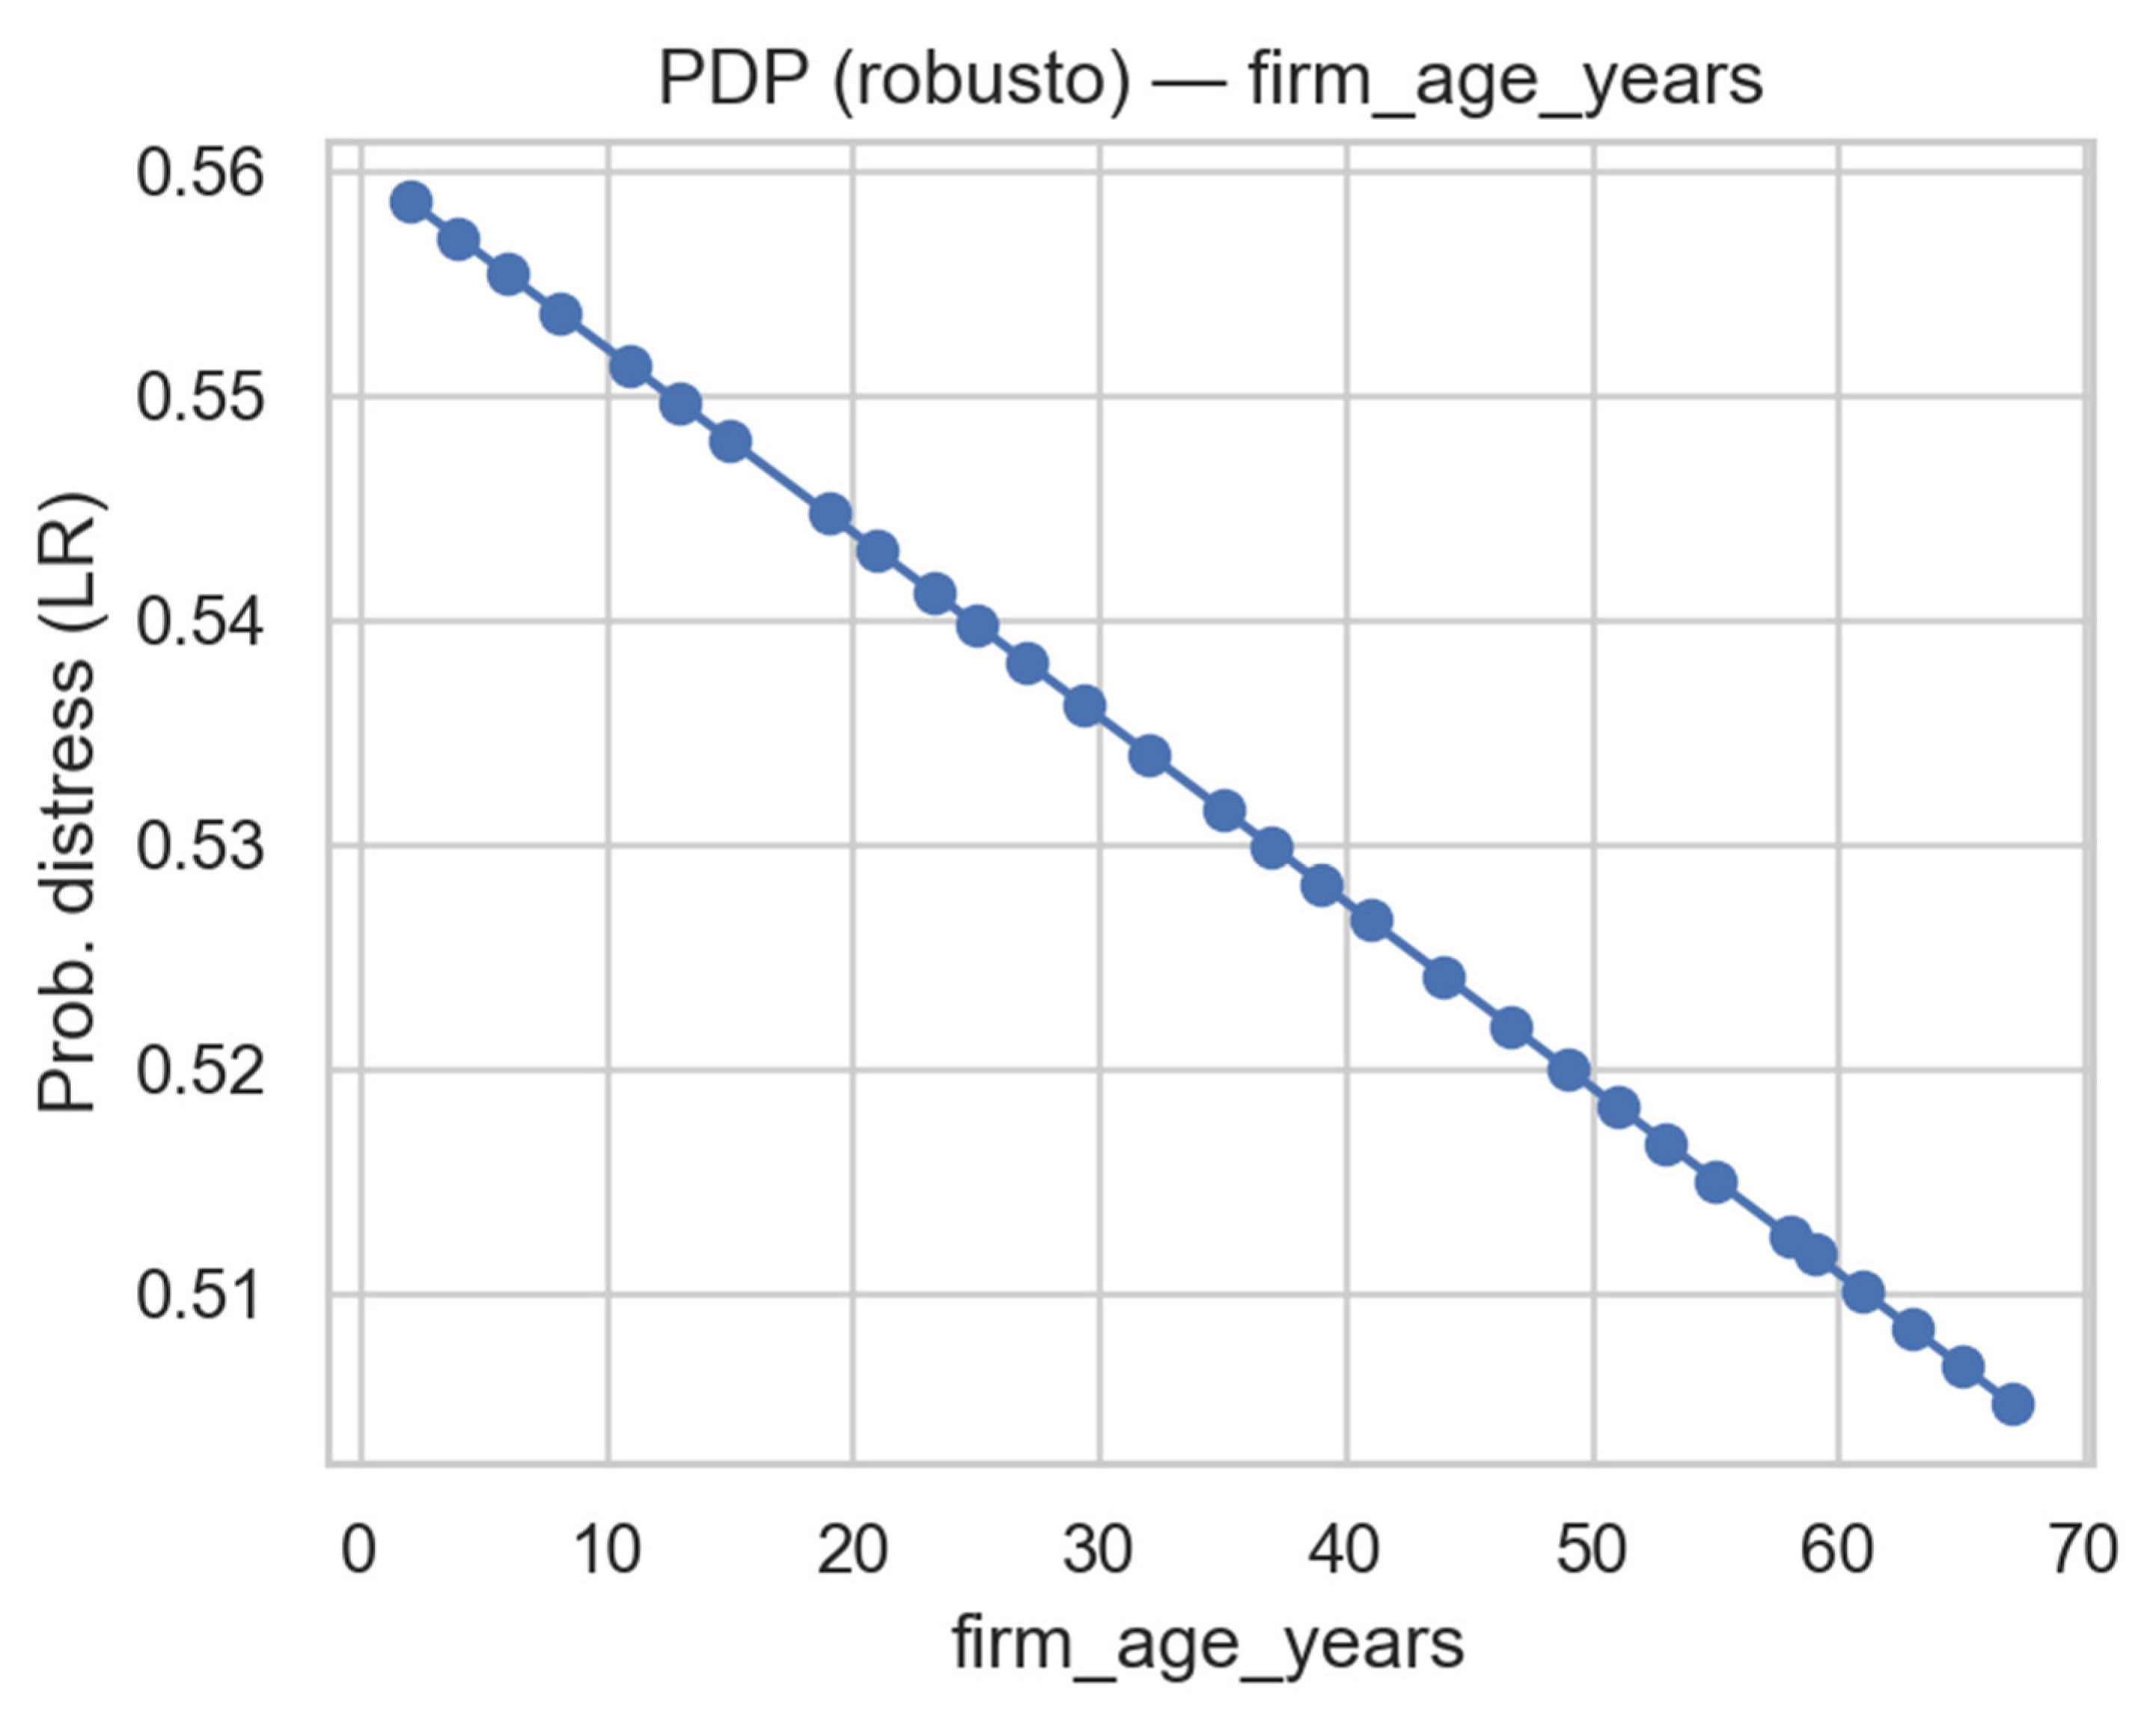
Figure 39.
Robust partial dependence plot for current_ratio. Higher liquidity ratios are paradoxically associated with increased distress probability, consistent with liquidity illusion effects. Source: Author using Spyder and Anaconda.
Figure 39.
Robust partial dependence plot for current_ratio. Higher liquidity ratios are paradoxically associated with increased distress probability, consistent with liquidity illusion effects. Source: Author using Spyder and Anaconda.
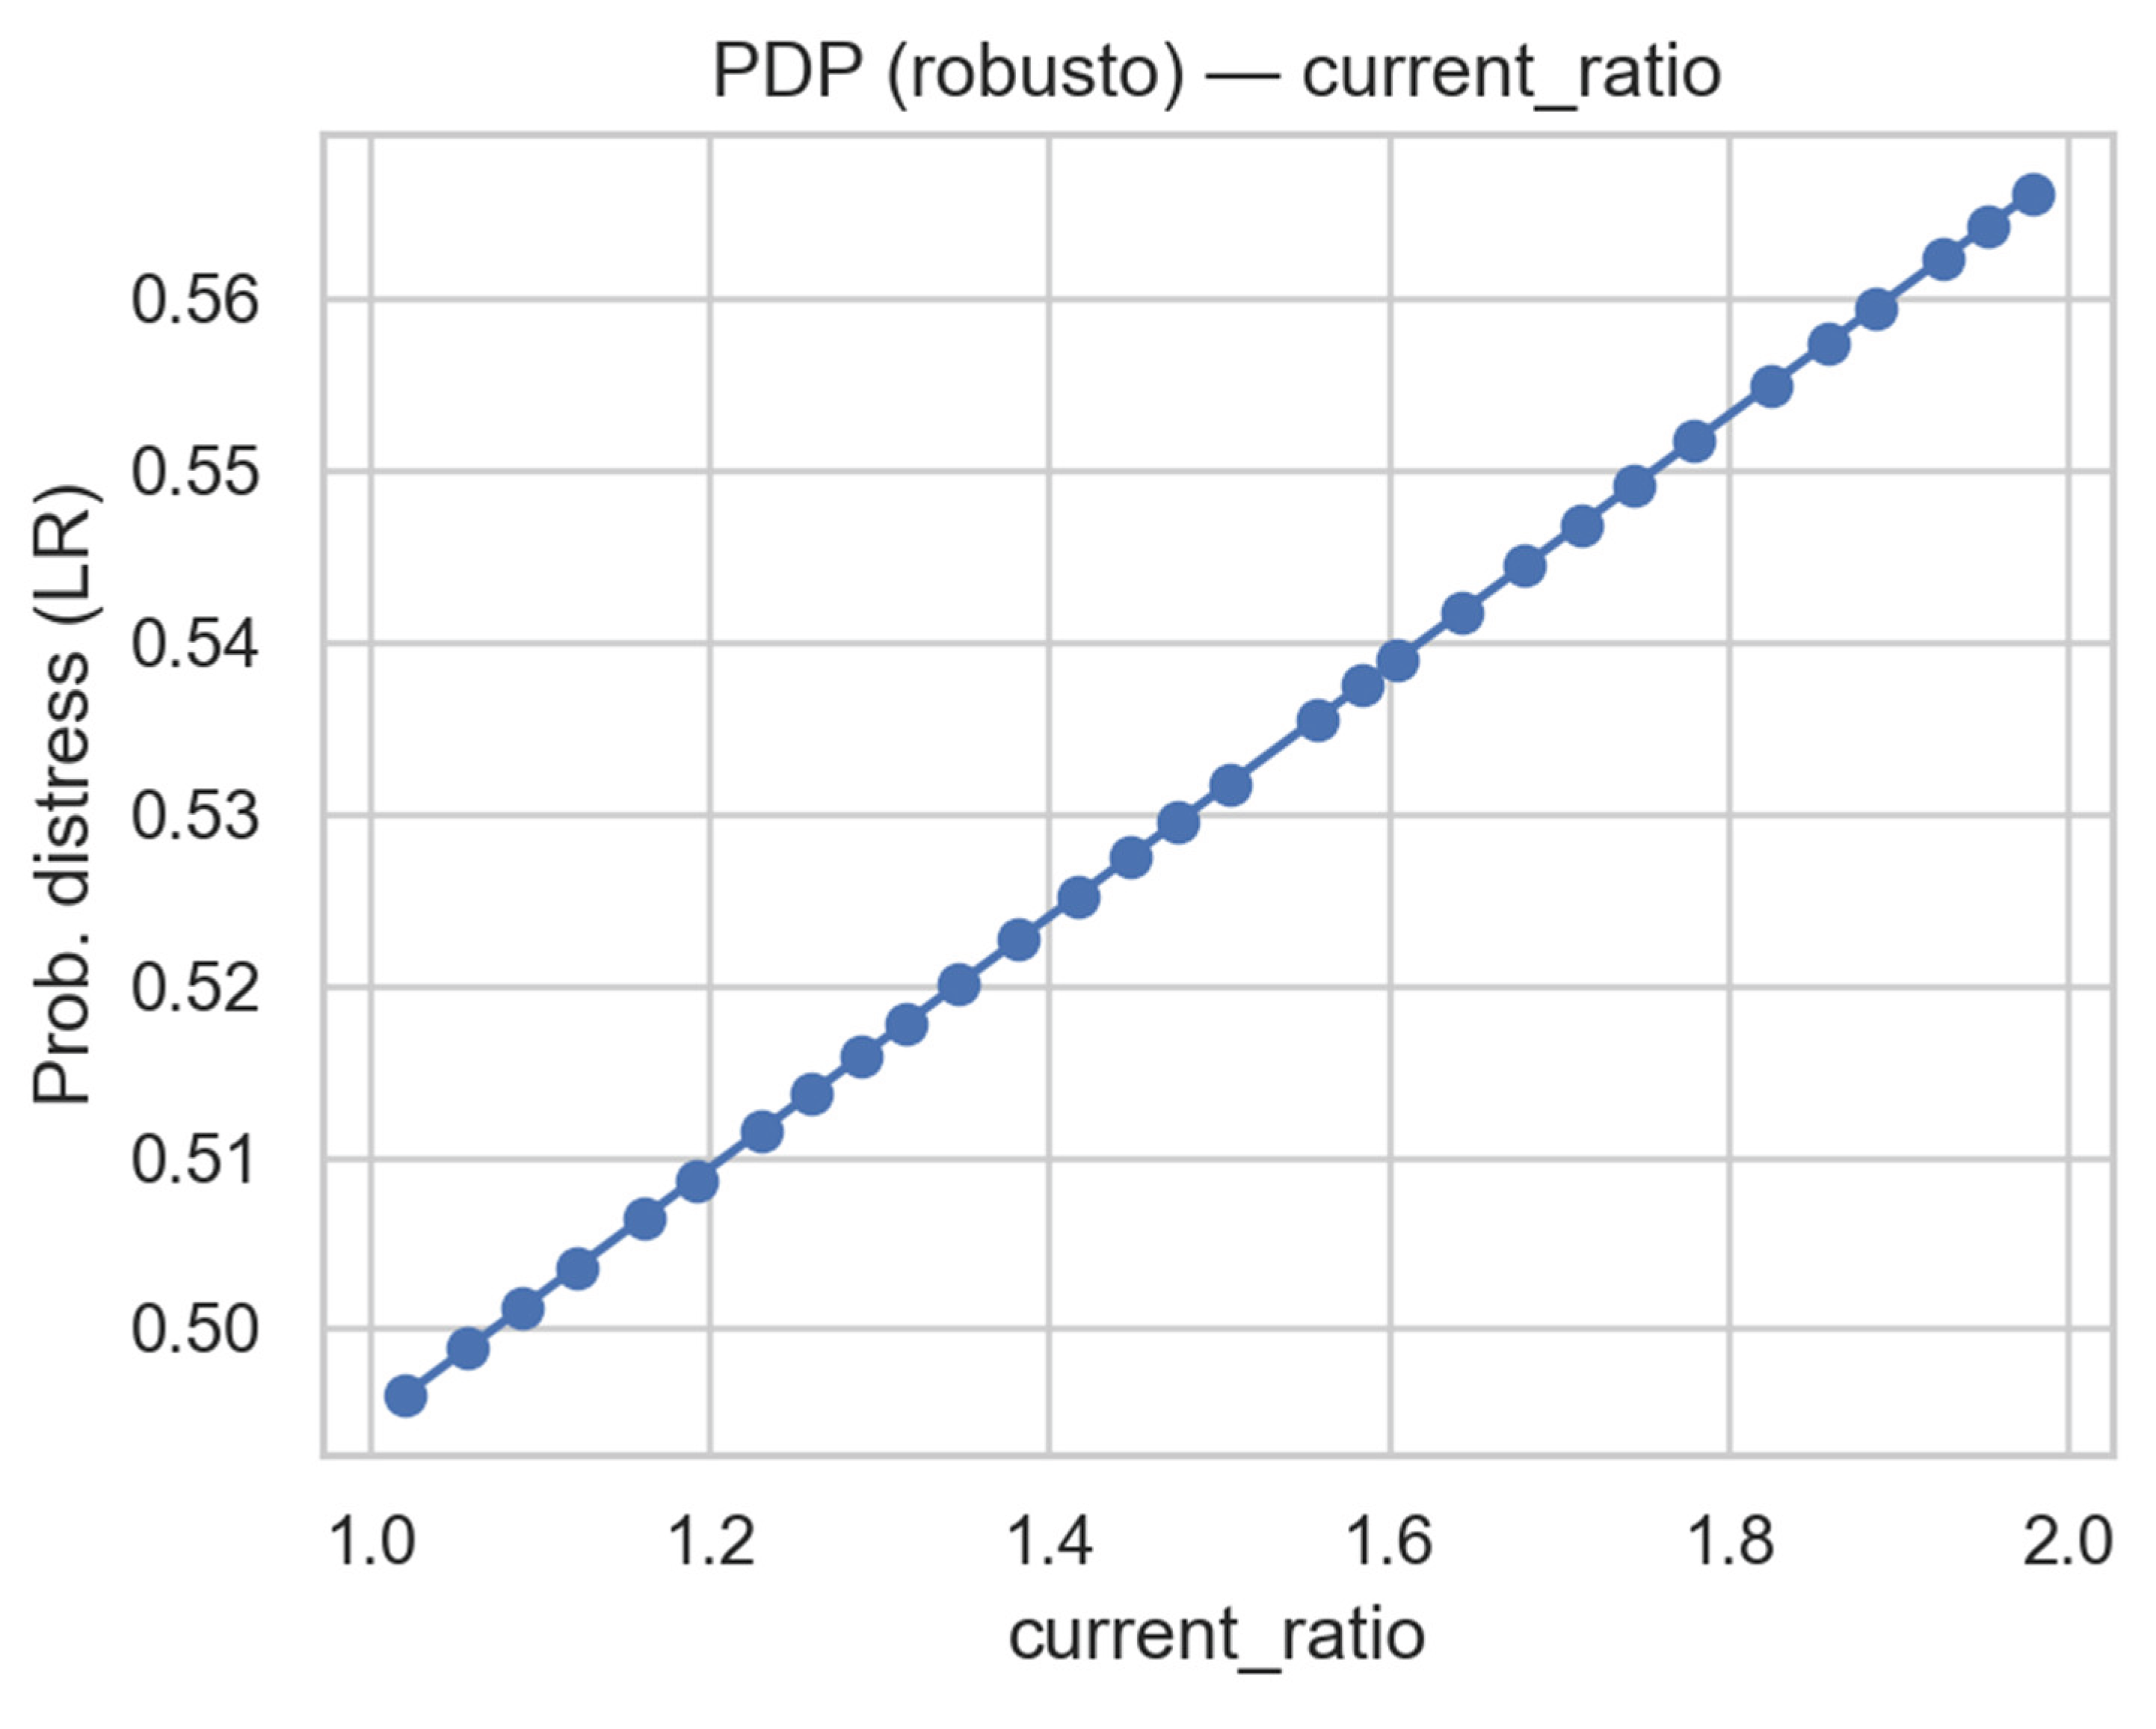
Figure 40.
Robust partial dependence plot for cash_ratio. Incremental increases in cash ratio correspond to higher predicted financial distress probabilities, reinforcing the liquidity illusion hypothesis. Source: Author.
Figure 40.
Robust partial dependence plot for cash_ratio. Incremental increases in cash ratio correspond to higher predicted financial distress probabilities, reinforcing the liquidity illusion hypothesis. Source: Author.
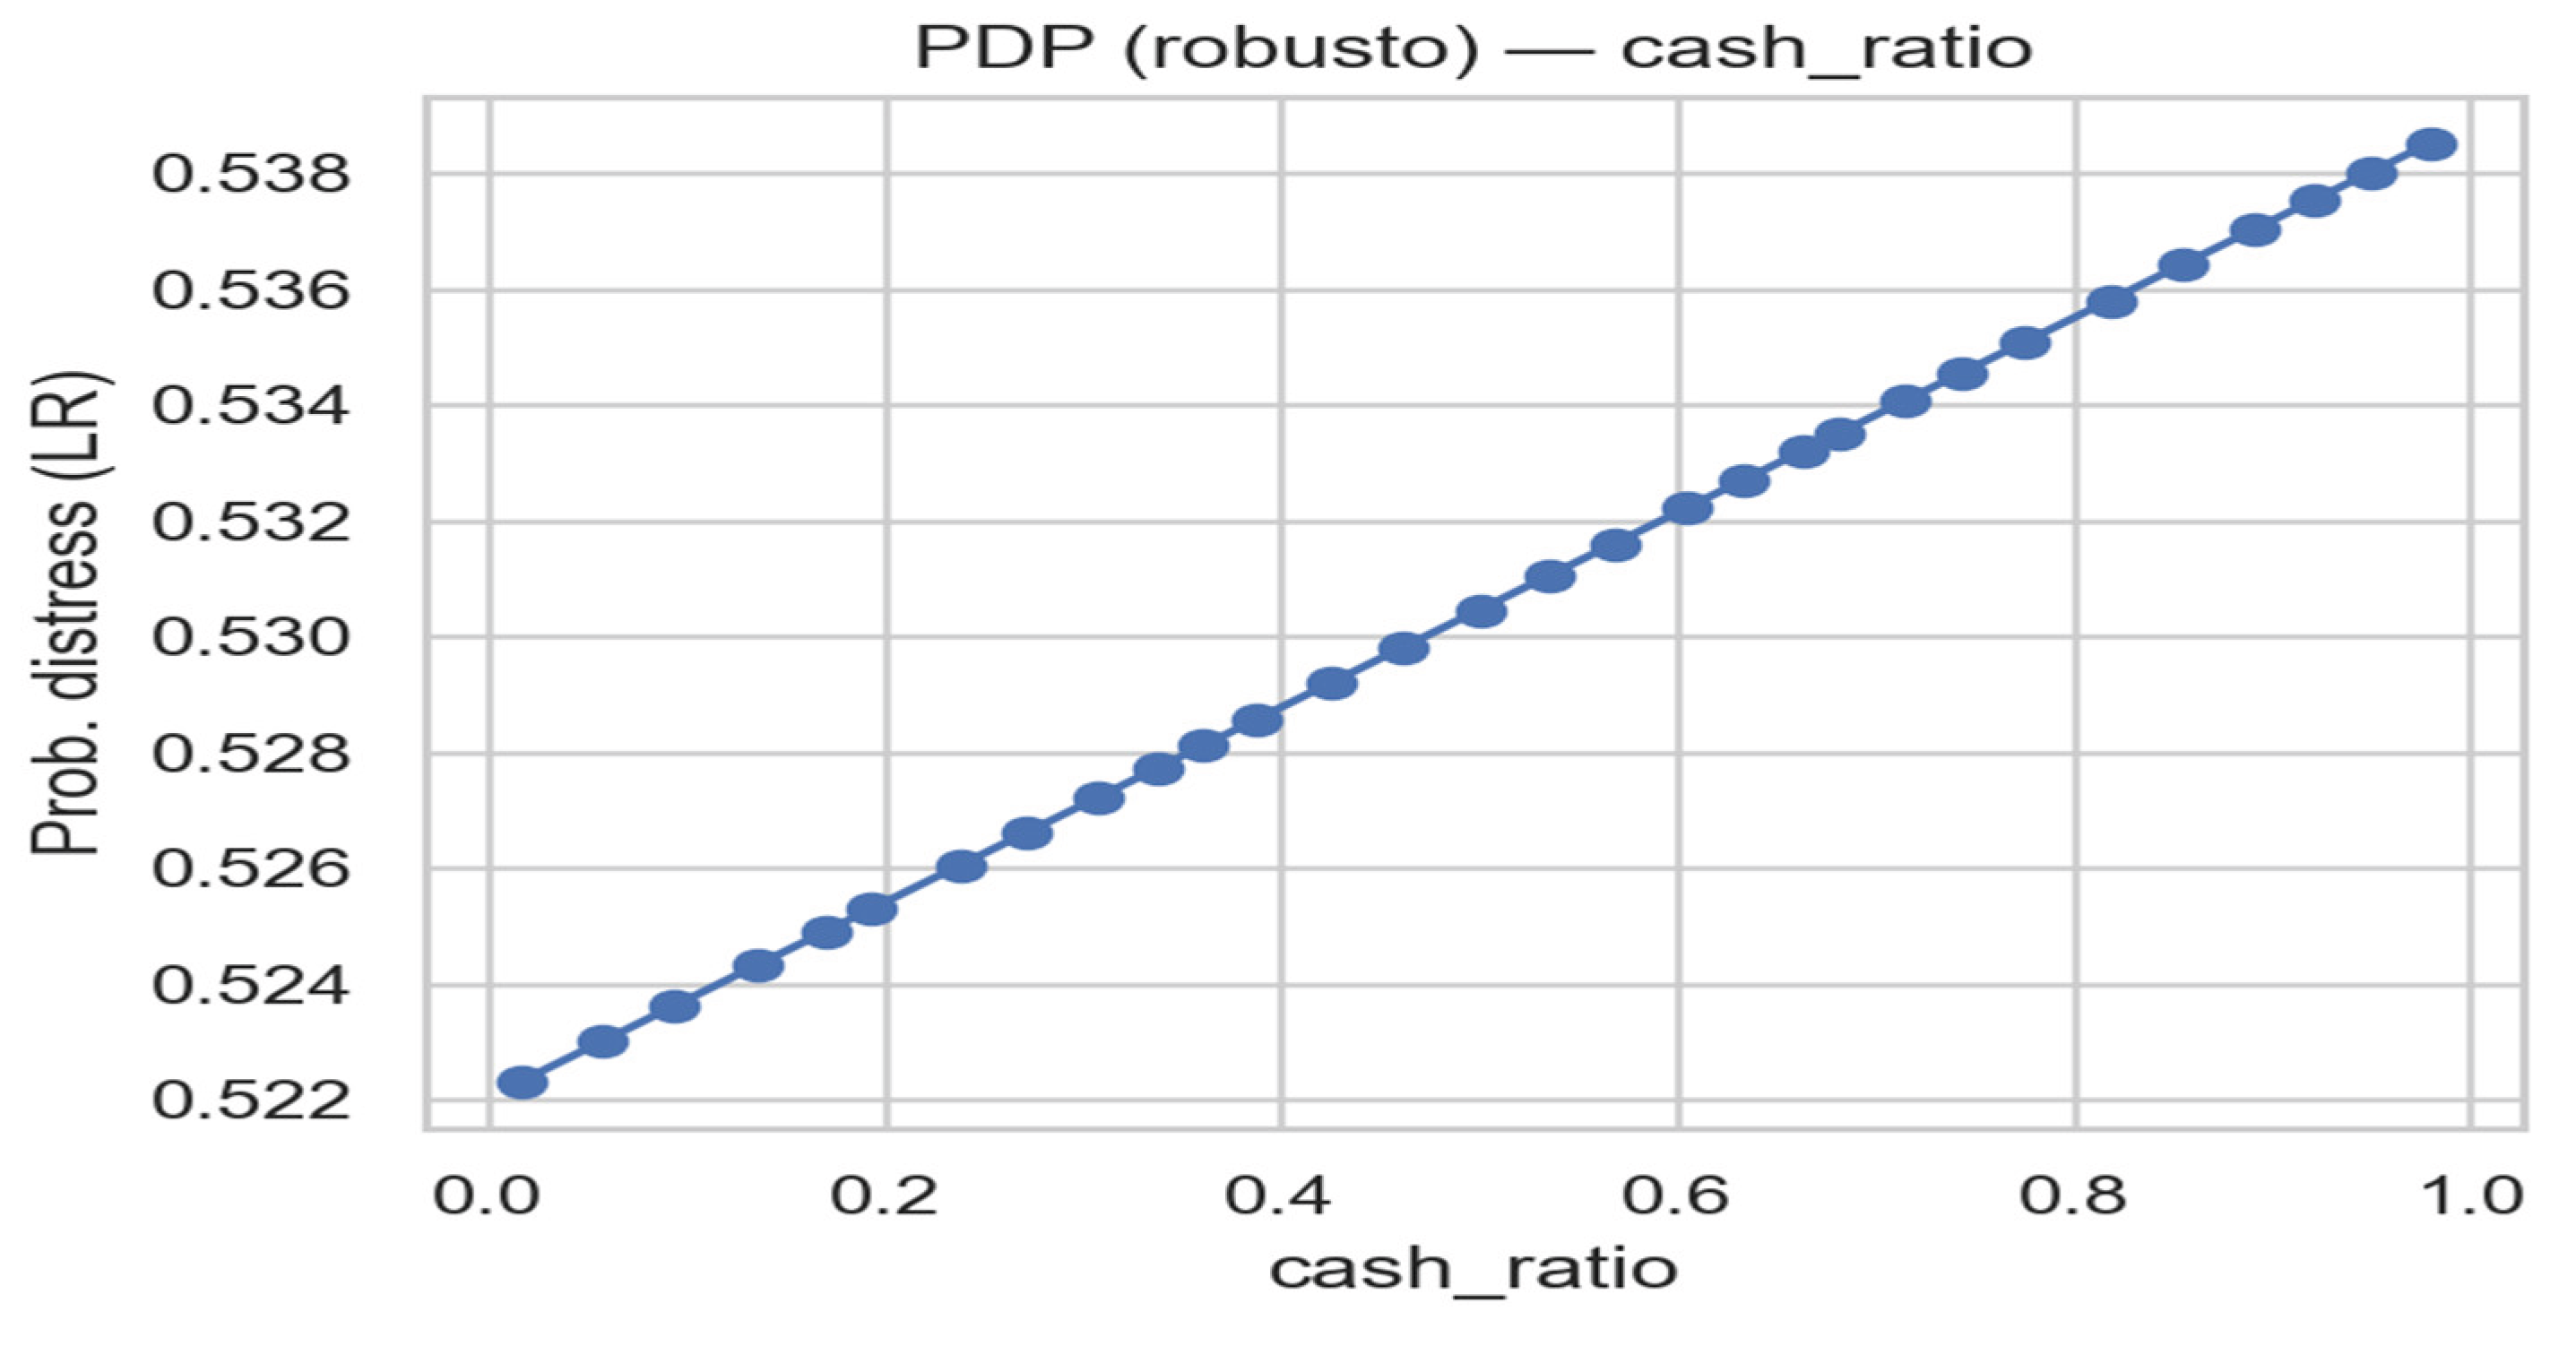
Figure 42.
Precision–Recall curve for the LASSO model (AP = 0.545). The penalized regression achieves the highest precision among all models, though with modest gains. Source: Author.
Figure 42.
Precision–Recall curve for the LASSO model (AP = 0.545). The penalized regression achieves the highest precision among all models, though with modest gains. Source: Author.
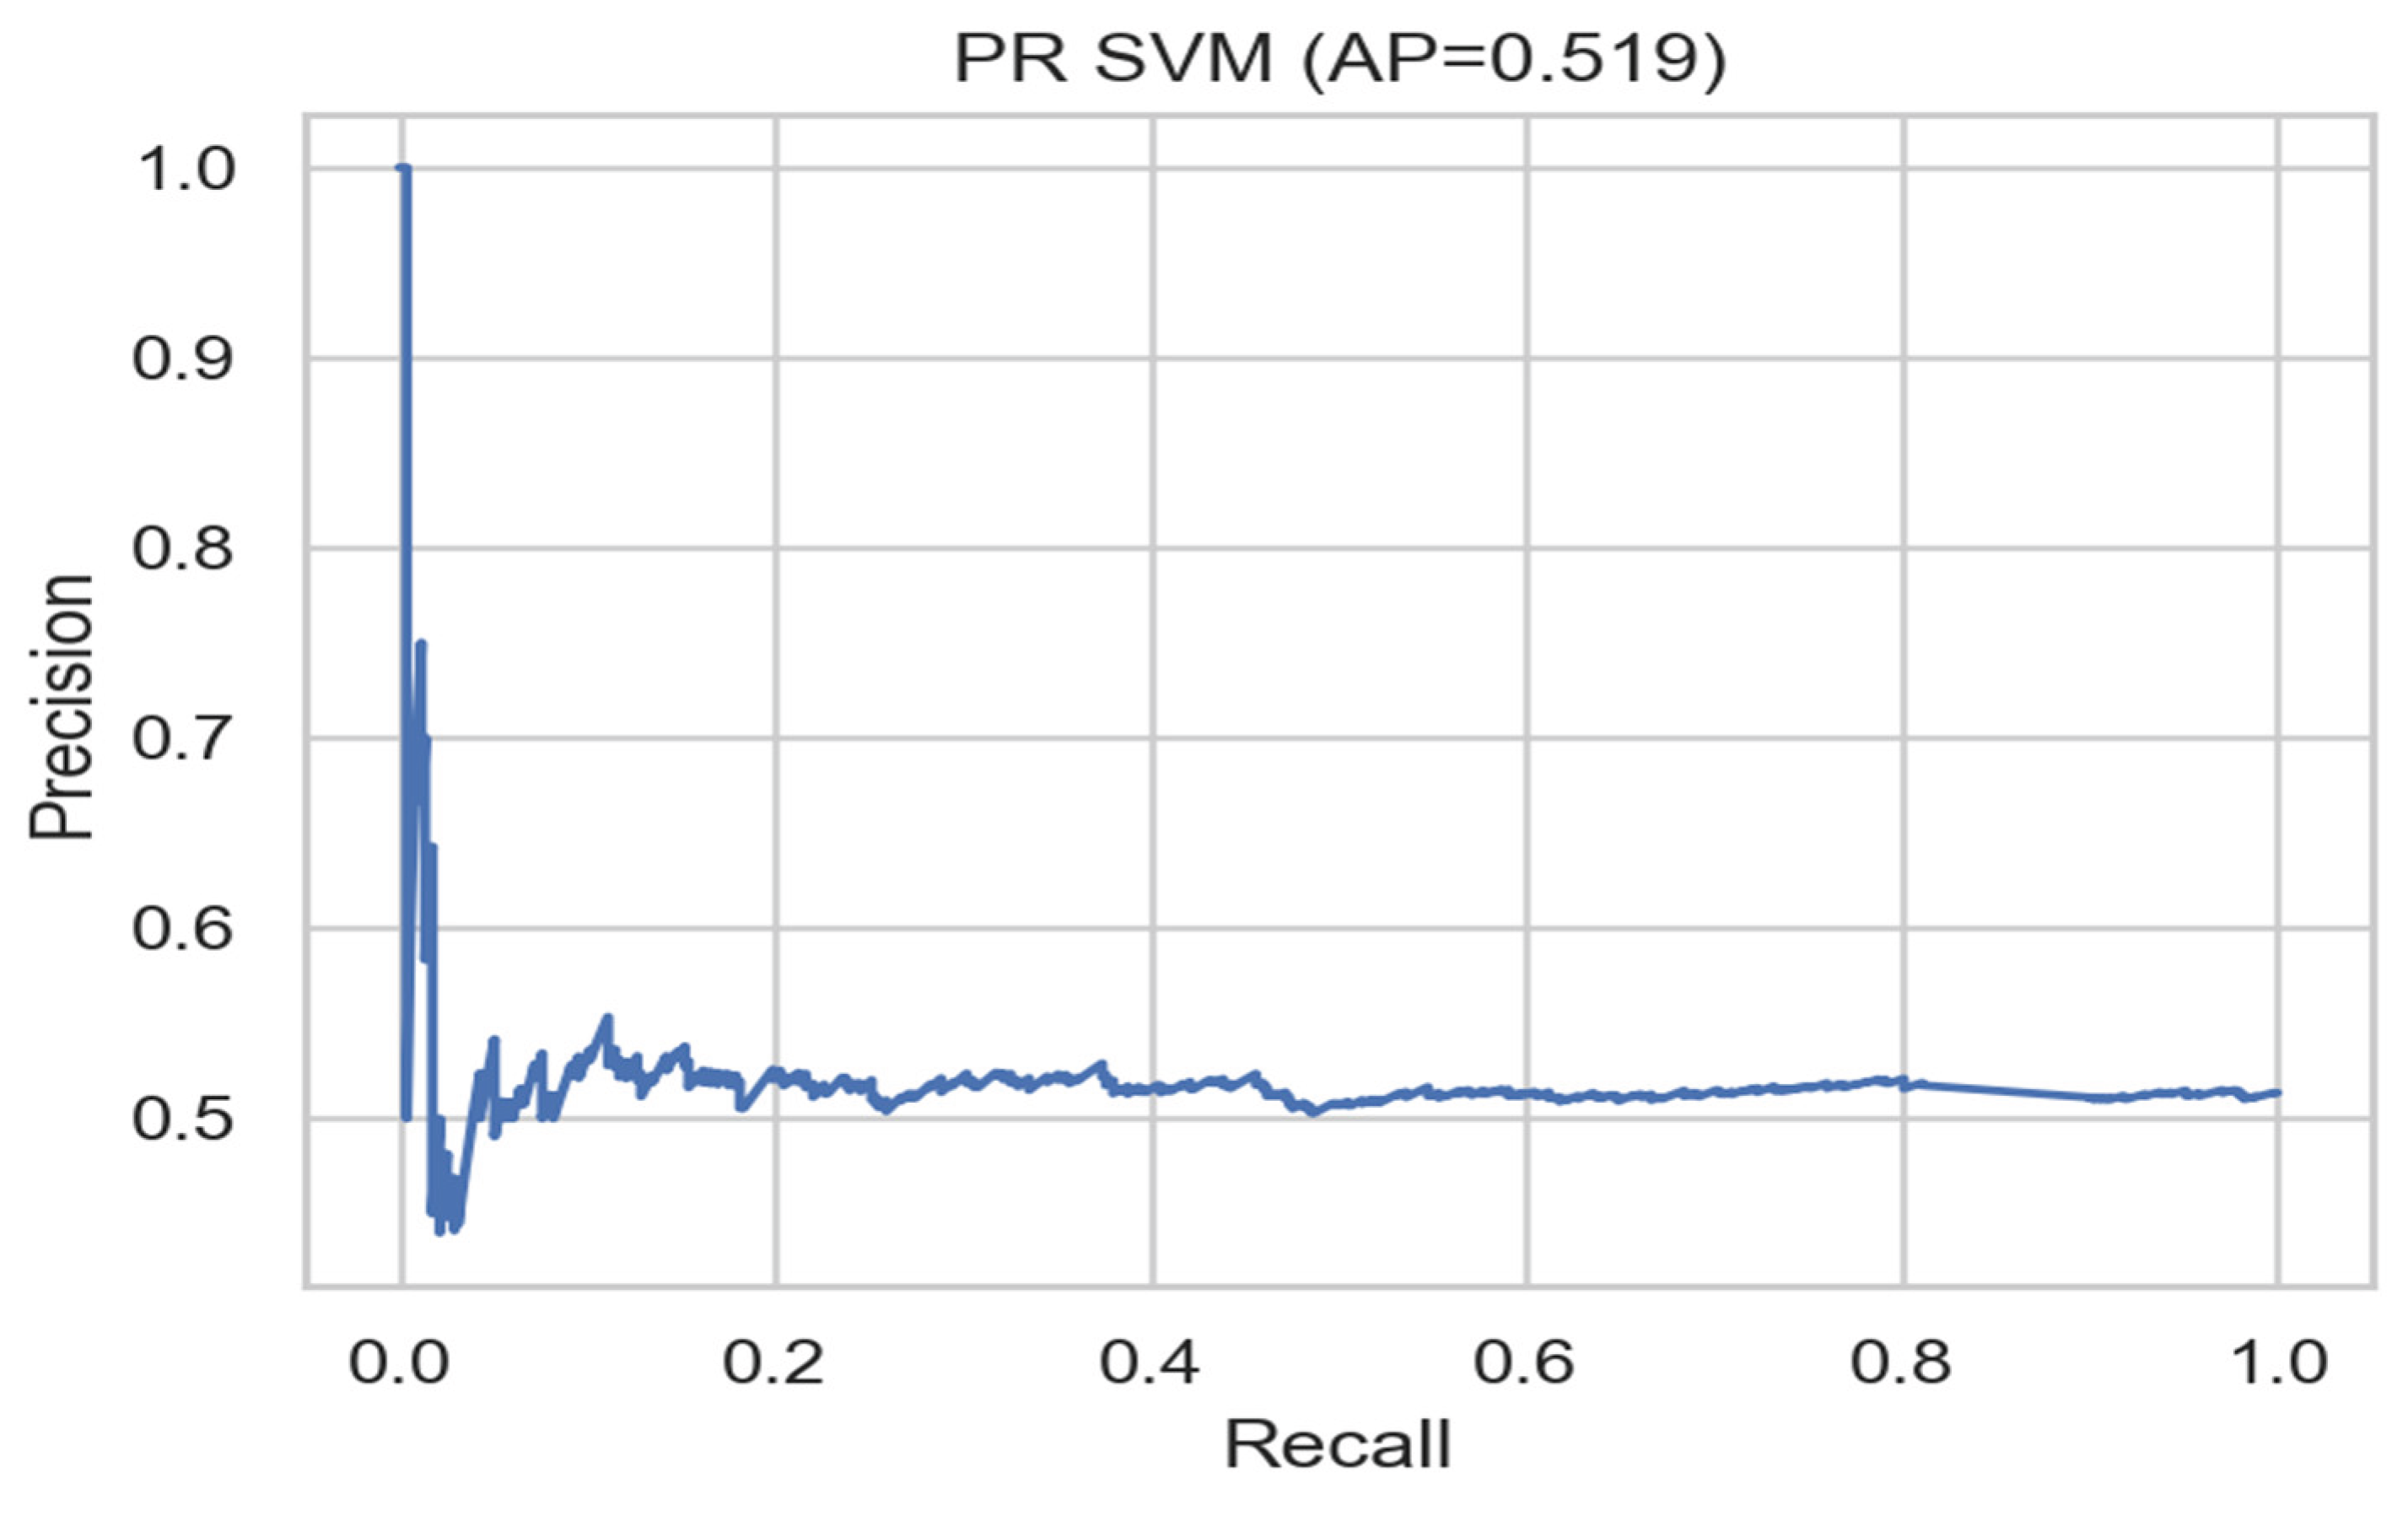
Figure 43.
Precision–Recall curve for the LogitRidge model (AP = 0.526). Performance is similar to LASSO, with stable recall across thresholds. Source: Author.
Figure 43.
Precision–Recall curve for the LogitRidge model (AP = 0.526). Performance is similar to LASSO, with stable recall across thresholds. Source: Author.

Figure 44.
Precision–Recall curve for the Random Forest model (AP = 0.525). The ensemble method offers comparable precision but higher volatility at low recall levels. Source: Author.
Figure 44.
Precision–Recall curve for the Random Forest model (AP = 0.525). The ensemble method offers comparable precision but higher volatility at low recall levels. Source: Author.
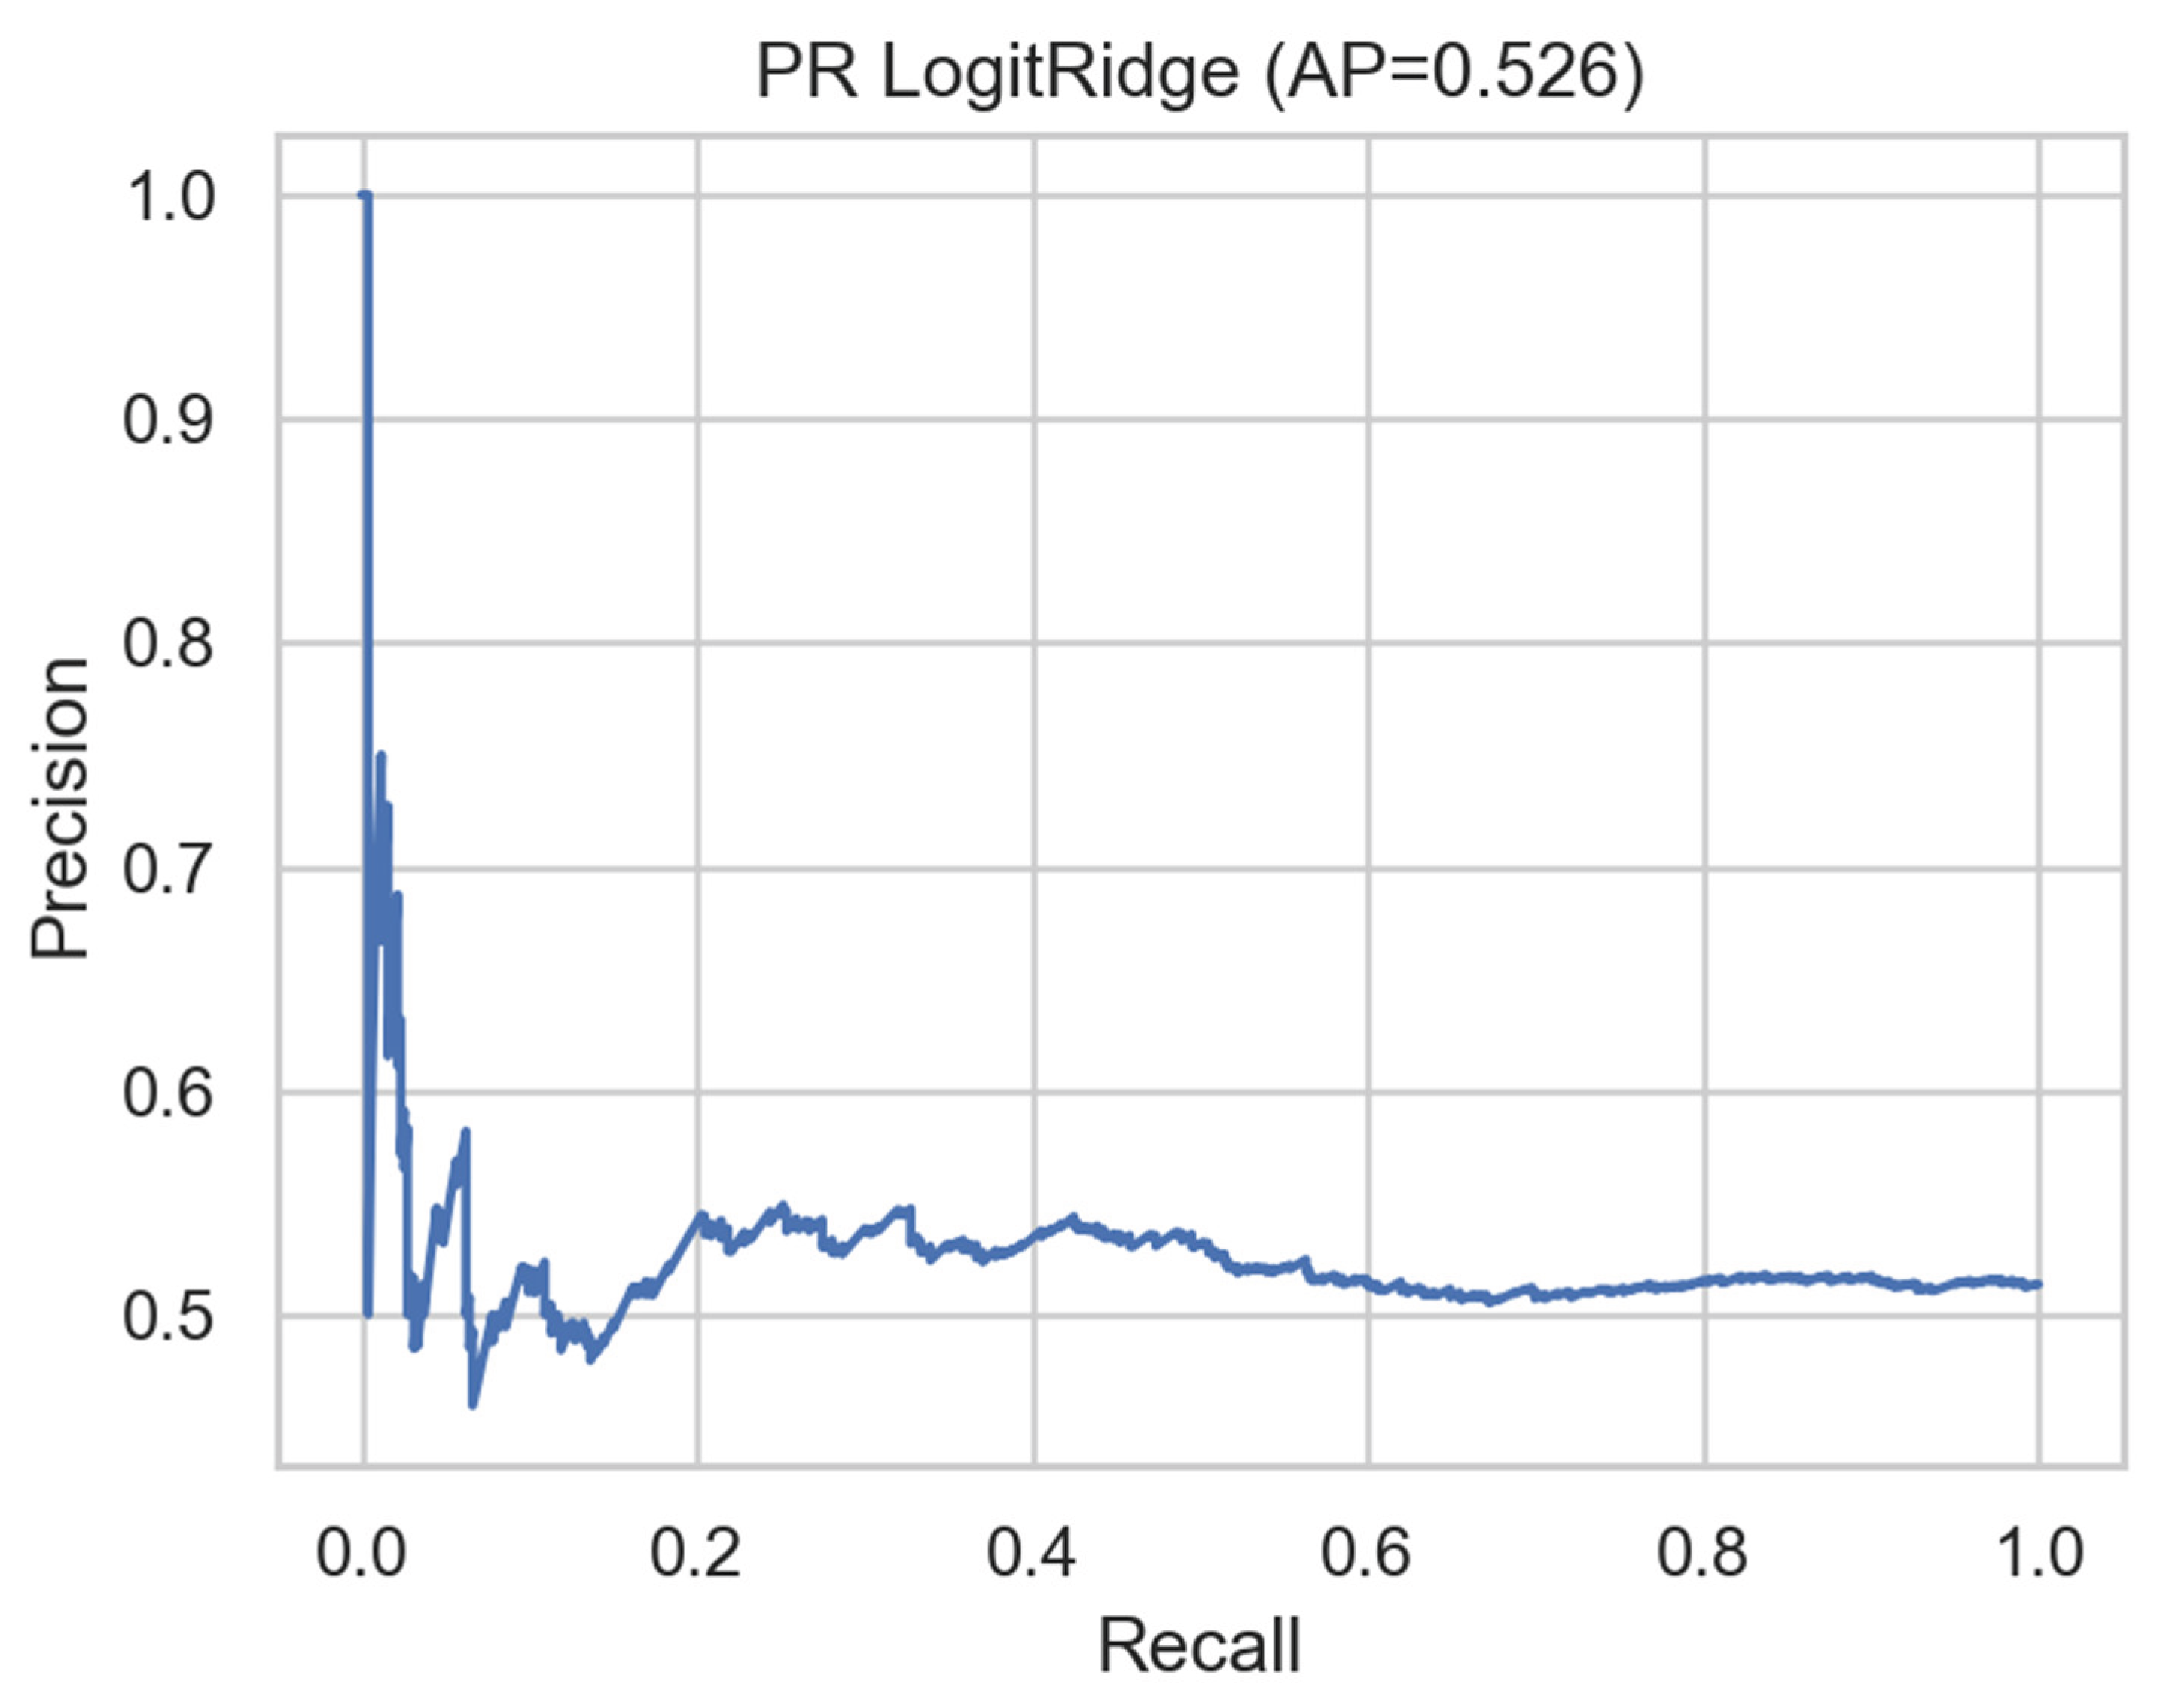
Figure 45.
Precision–Recall curve for the XGBoost model (AP = 0.513). The boosting algorithm shows marginally lower performance, consistent with limited nonlinear separability. Source: Author.
Figure 45.
Precision–Recall curve for the XGBoost model (AP = 0.513). The boosting algorithm shows marginally lower performance, consistent with limited nonlinear separability. Source: Author.
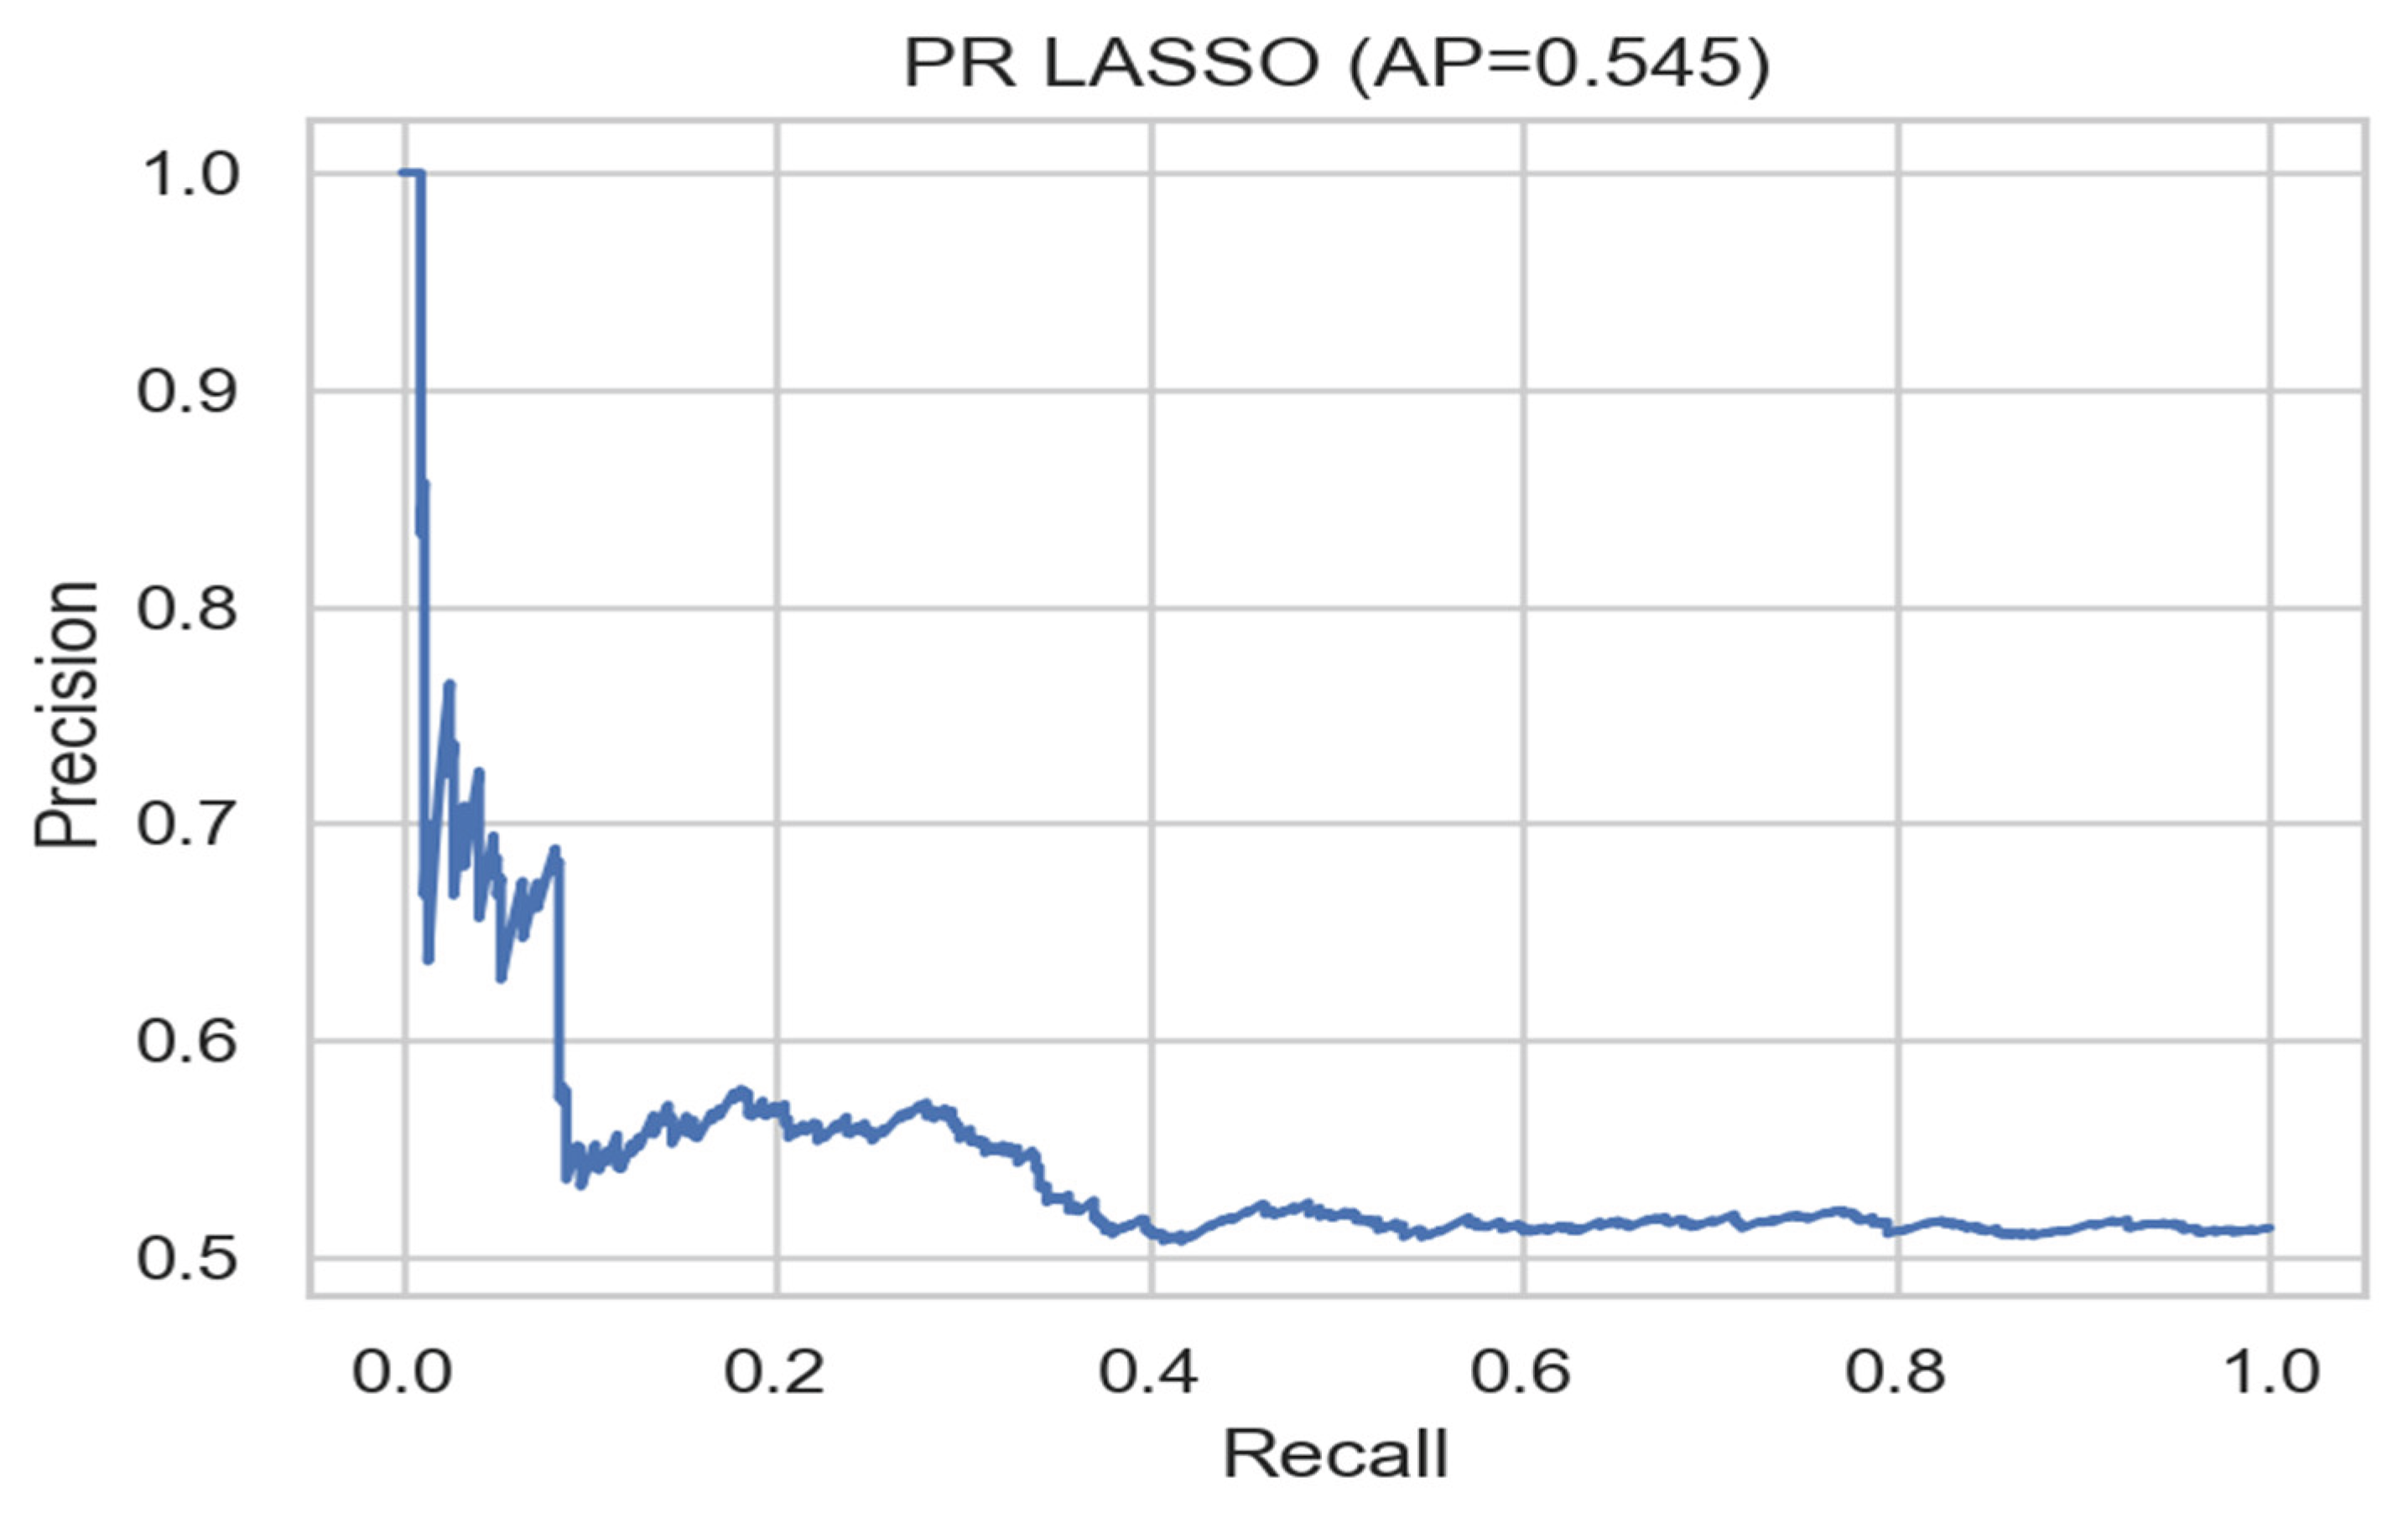
Figure 46.
Precision–Recall curve for the SVM model (AP = 0.519). The kernel approach captures some nonlinear effects but does not outperform penalized regressions. Source: Author.
Figure 46.
Precision–Recall curve for the SVM model (AP = 0.519). The kernel approach captures some nonlinear effects but does not outperform penalized regressions. Source: Author.
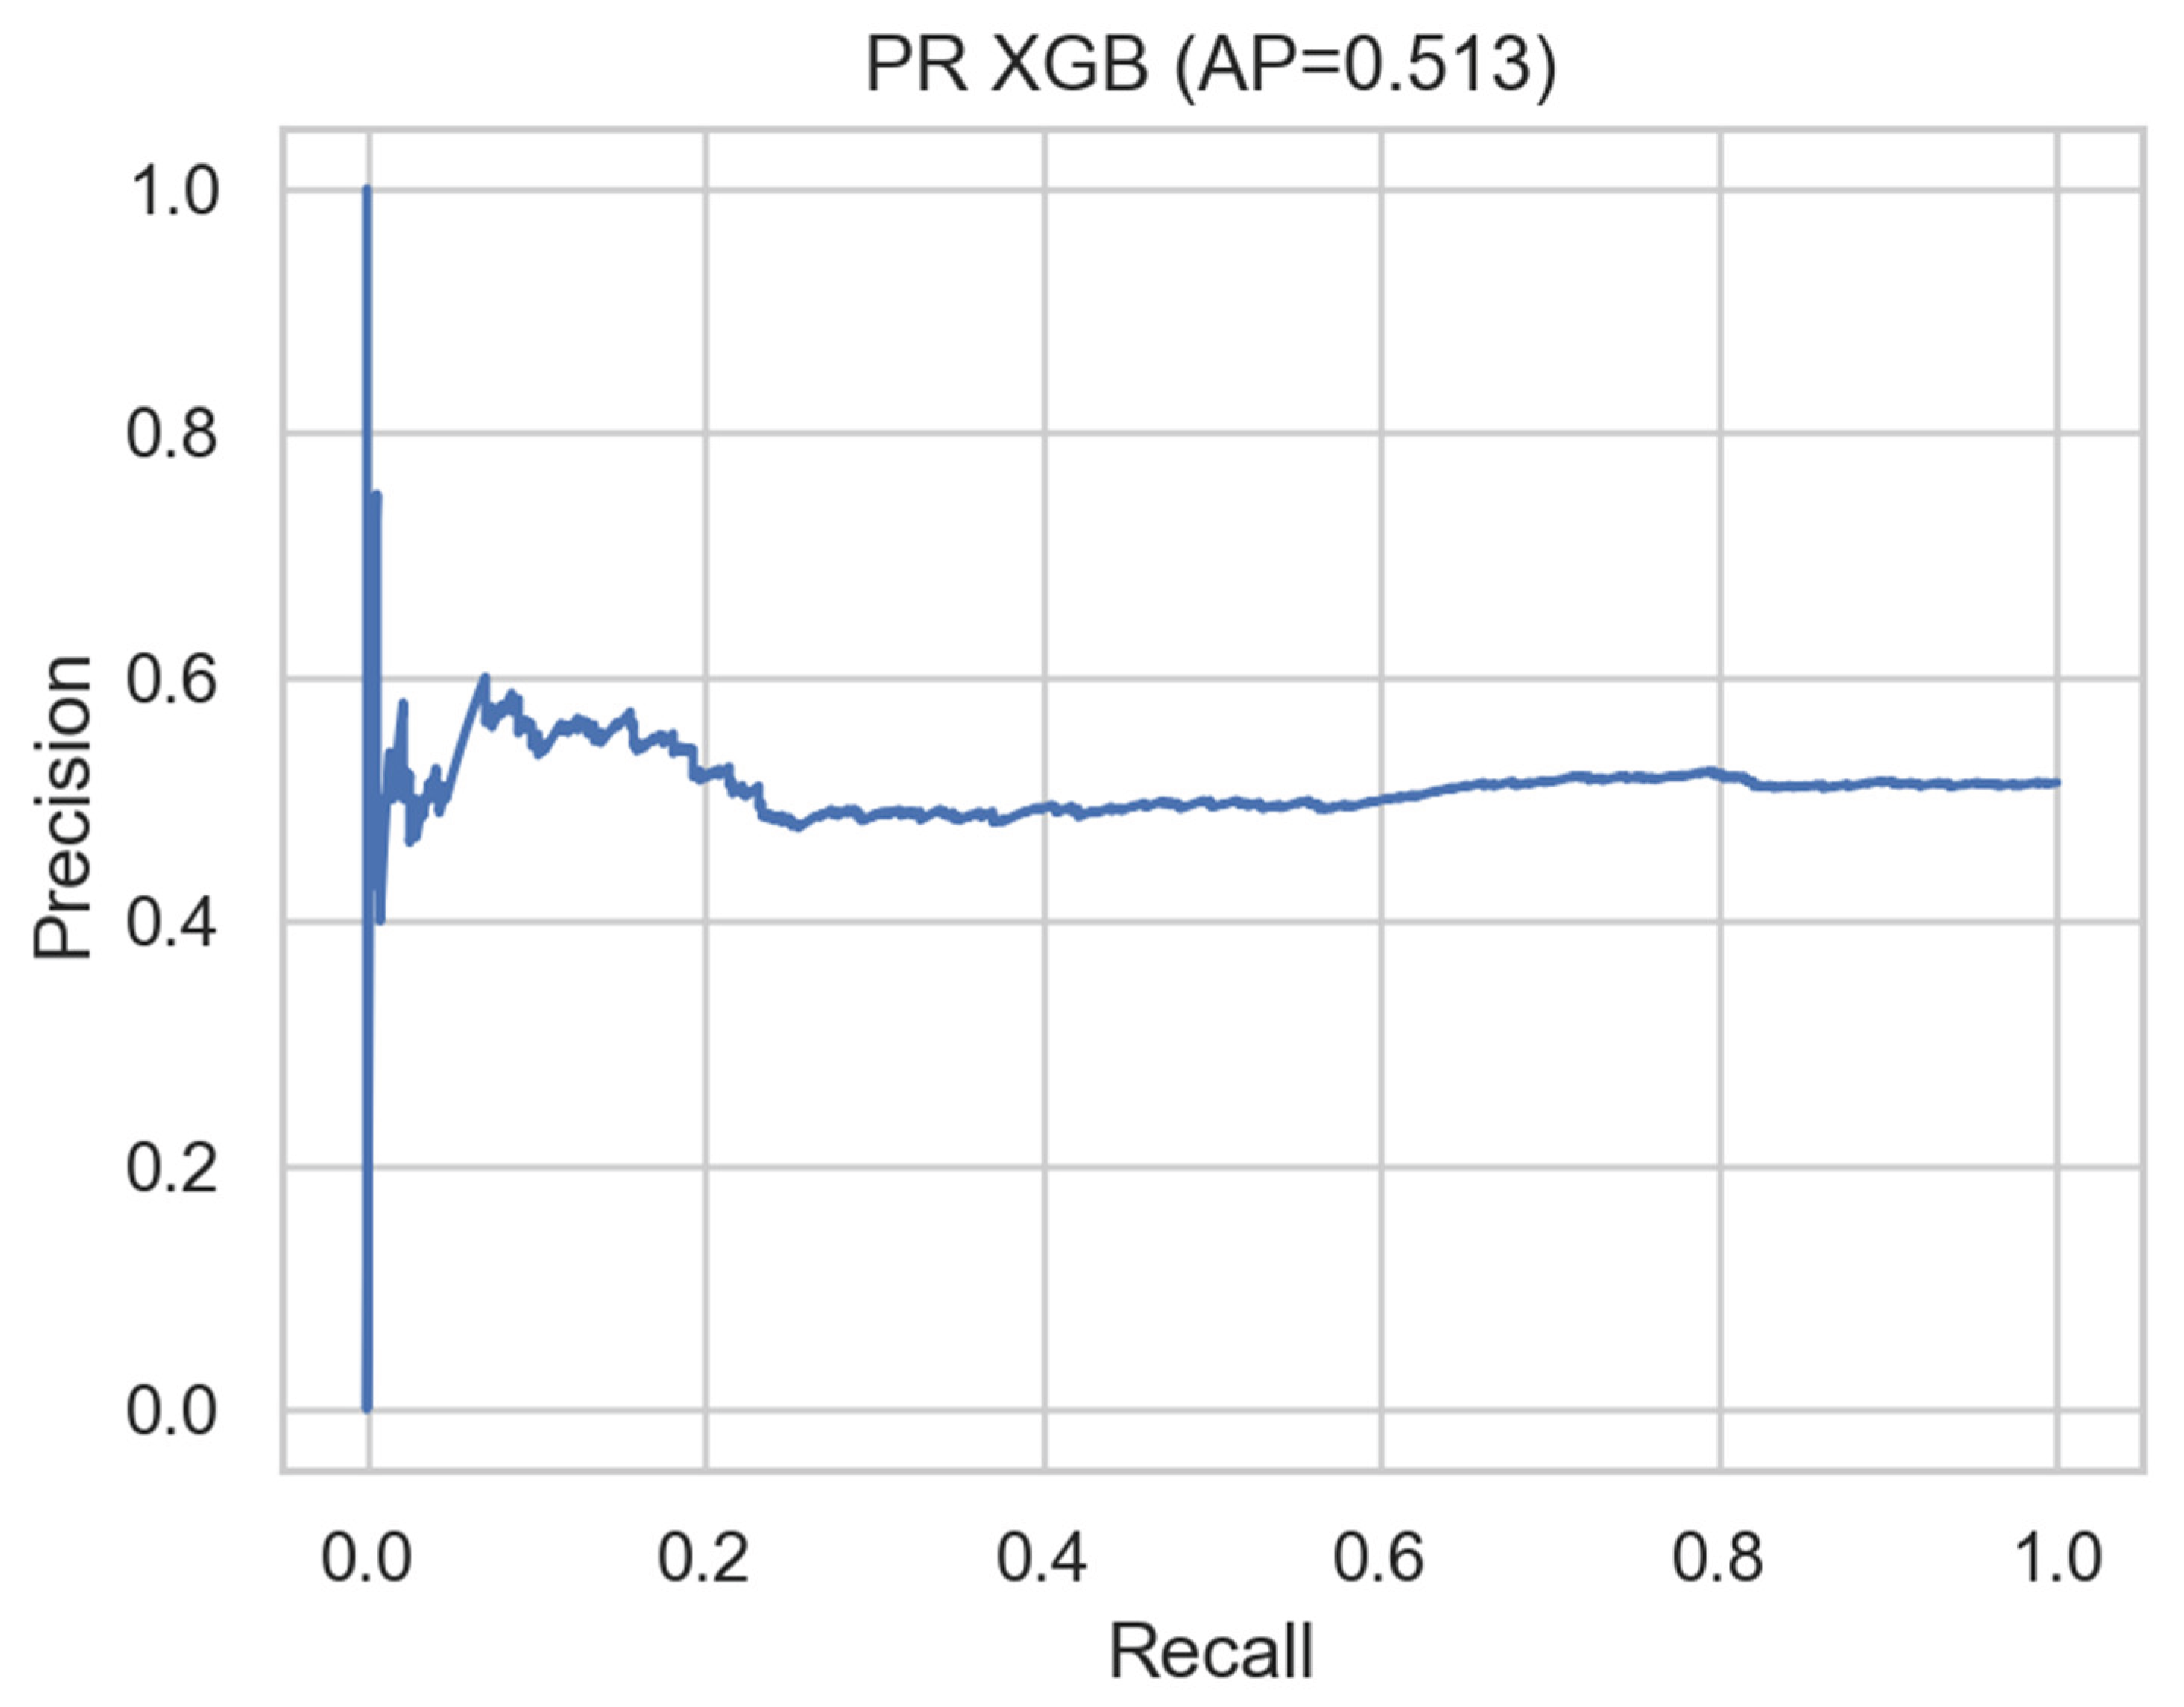
Figure 47.
ROC curve for the LASSO model (AUC = 0.514). Slightly above random classification, the penalized regression exhibits minimal yet consistent discrimination. Source: Author.
Figure 47.
ROC curve for the LASSO model (AUC = 0.514). Slightly above random classification, the penalized regression exhibits minimal yet consistent discrimination. Source: Author.
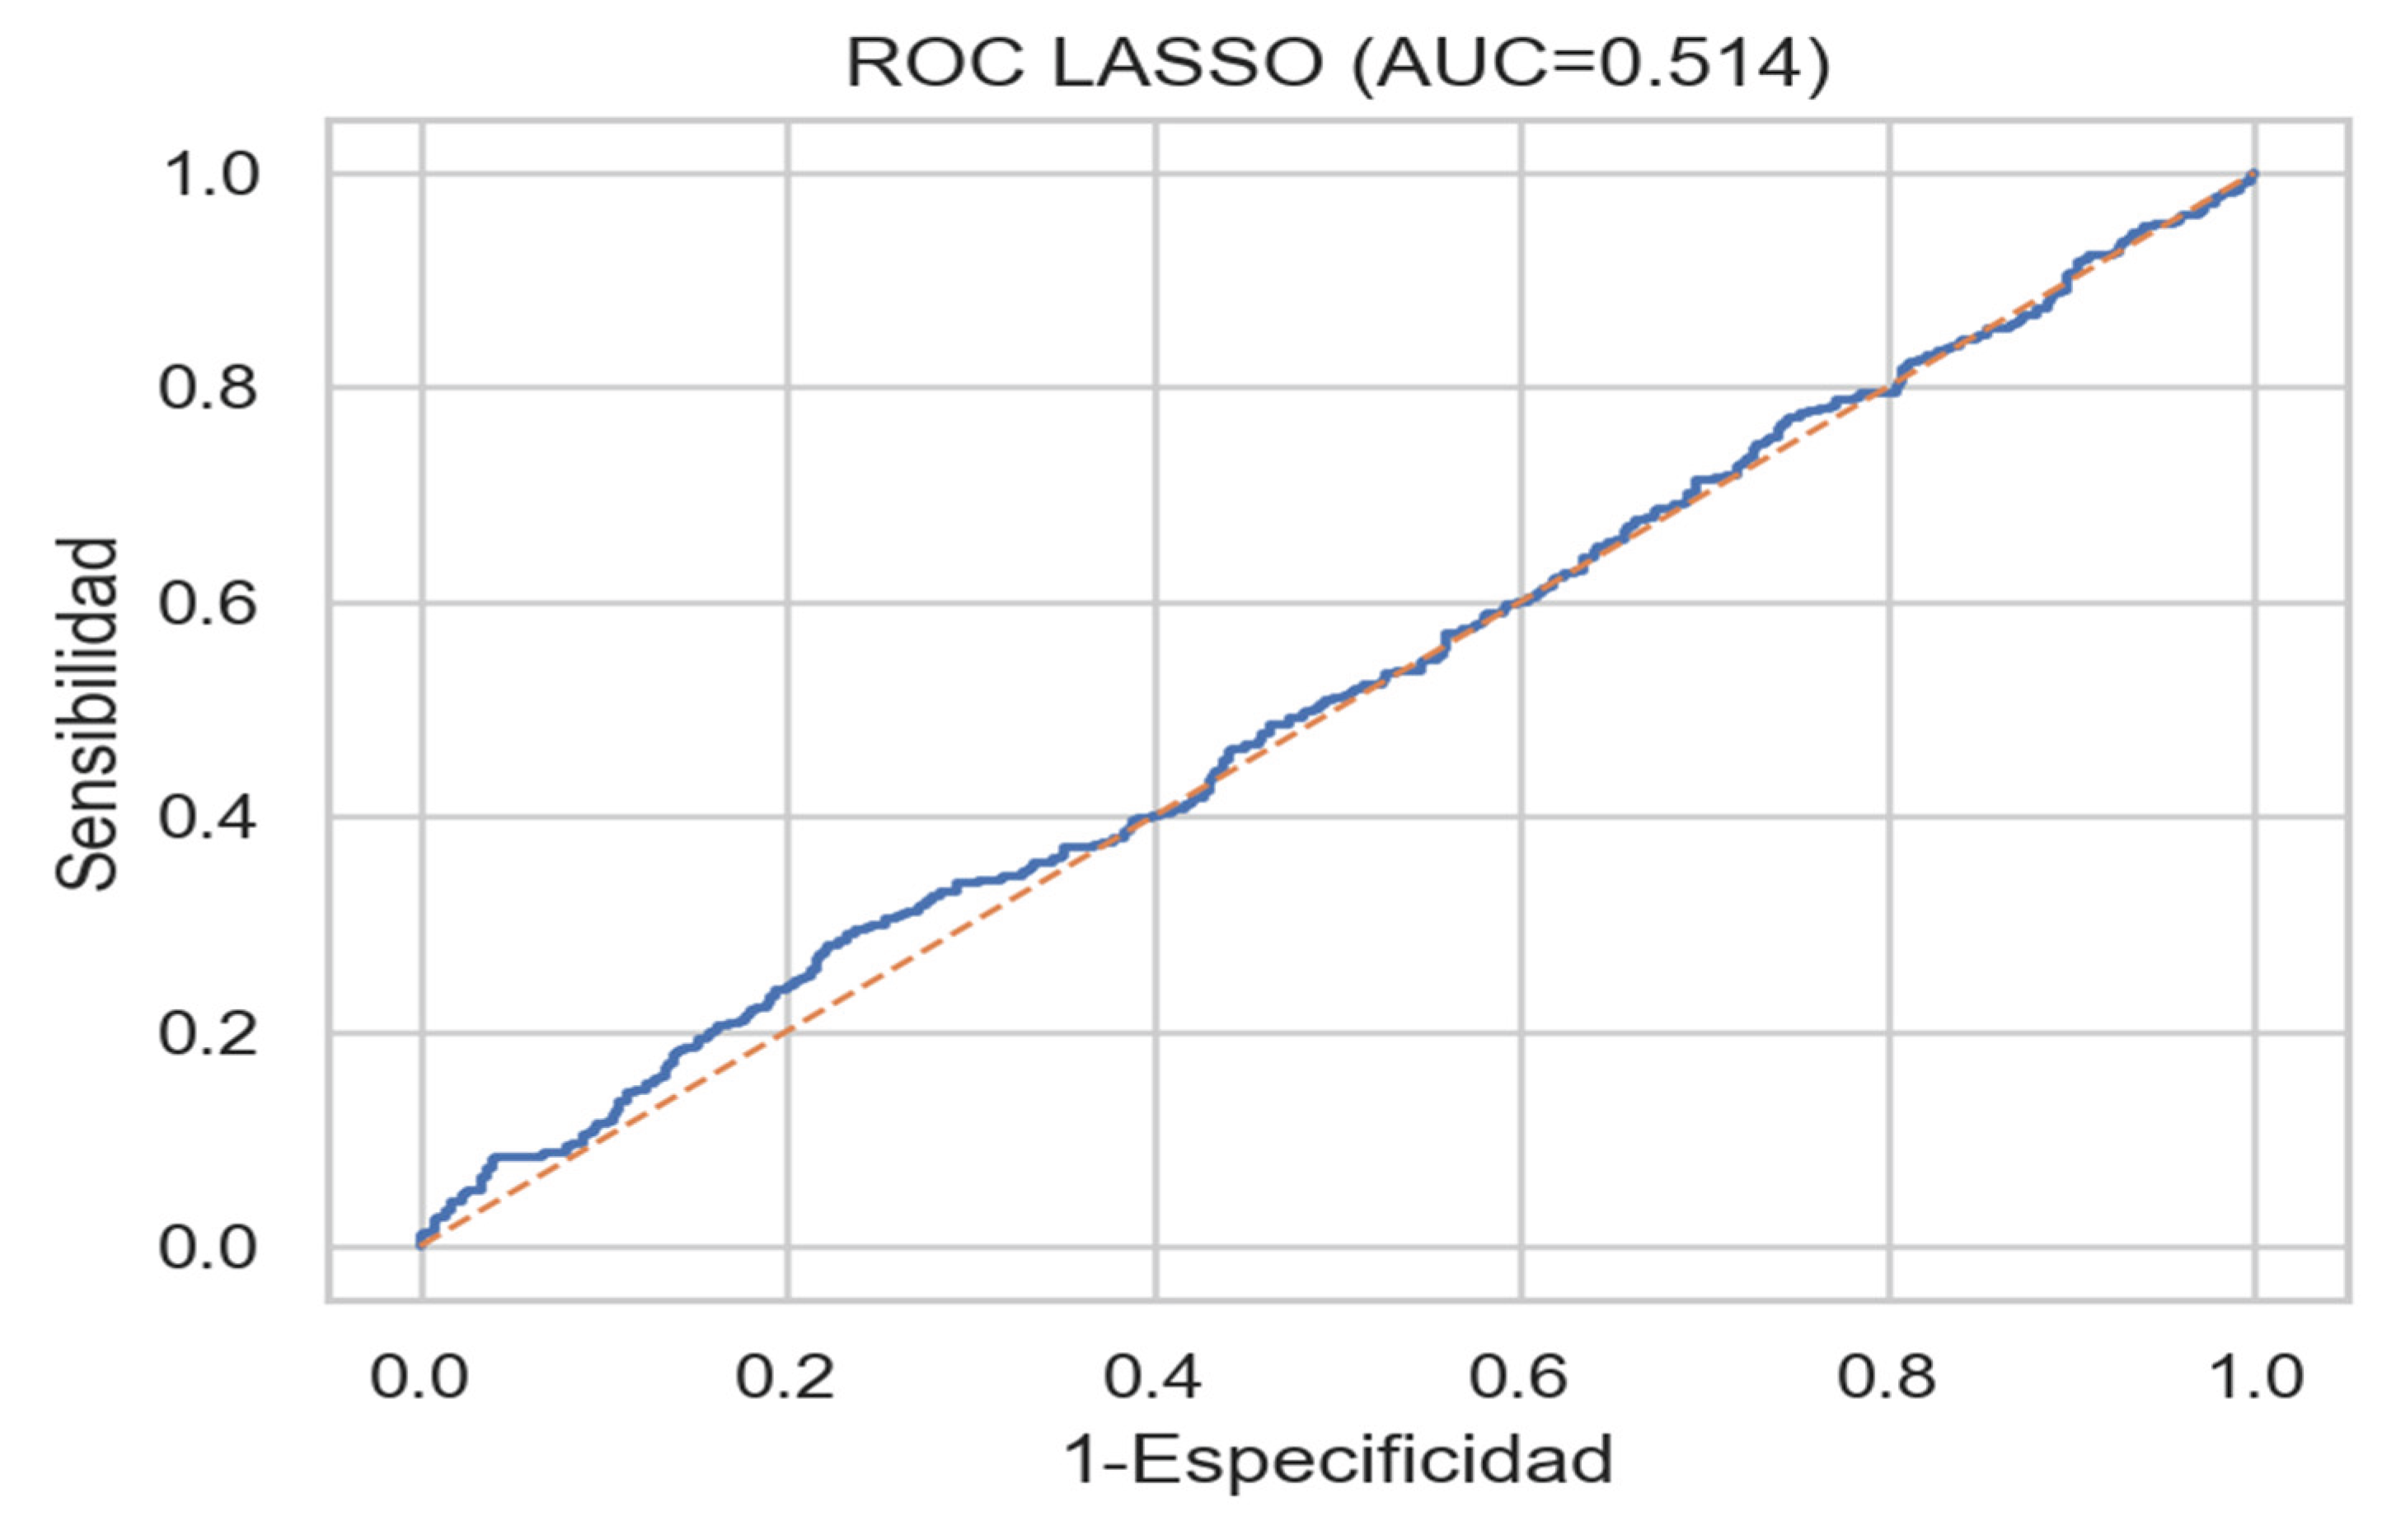
Figure 48.
ROC curve for the LogitRidge model (AUC = 0.509). The regularized logistic regression performs similarly to LASSO, reflecting the stability of linear penalization. Source: Author using Spyder and Anaconda.
Figure 48.
ROC curve for the LogitRidge model (AUC = 0.509). The regularized logistic regression performs similarly to LASSO, reflecting the stability of linear penalization. Source: Author using Spyder and Anaconda.
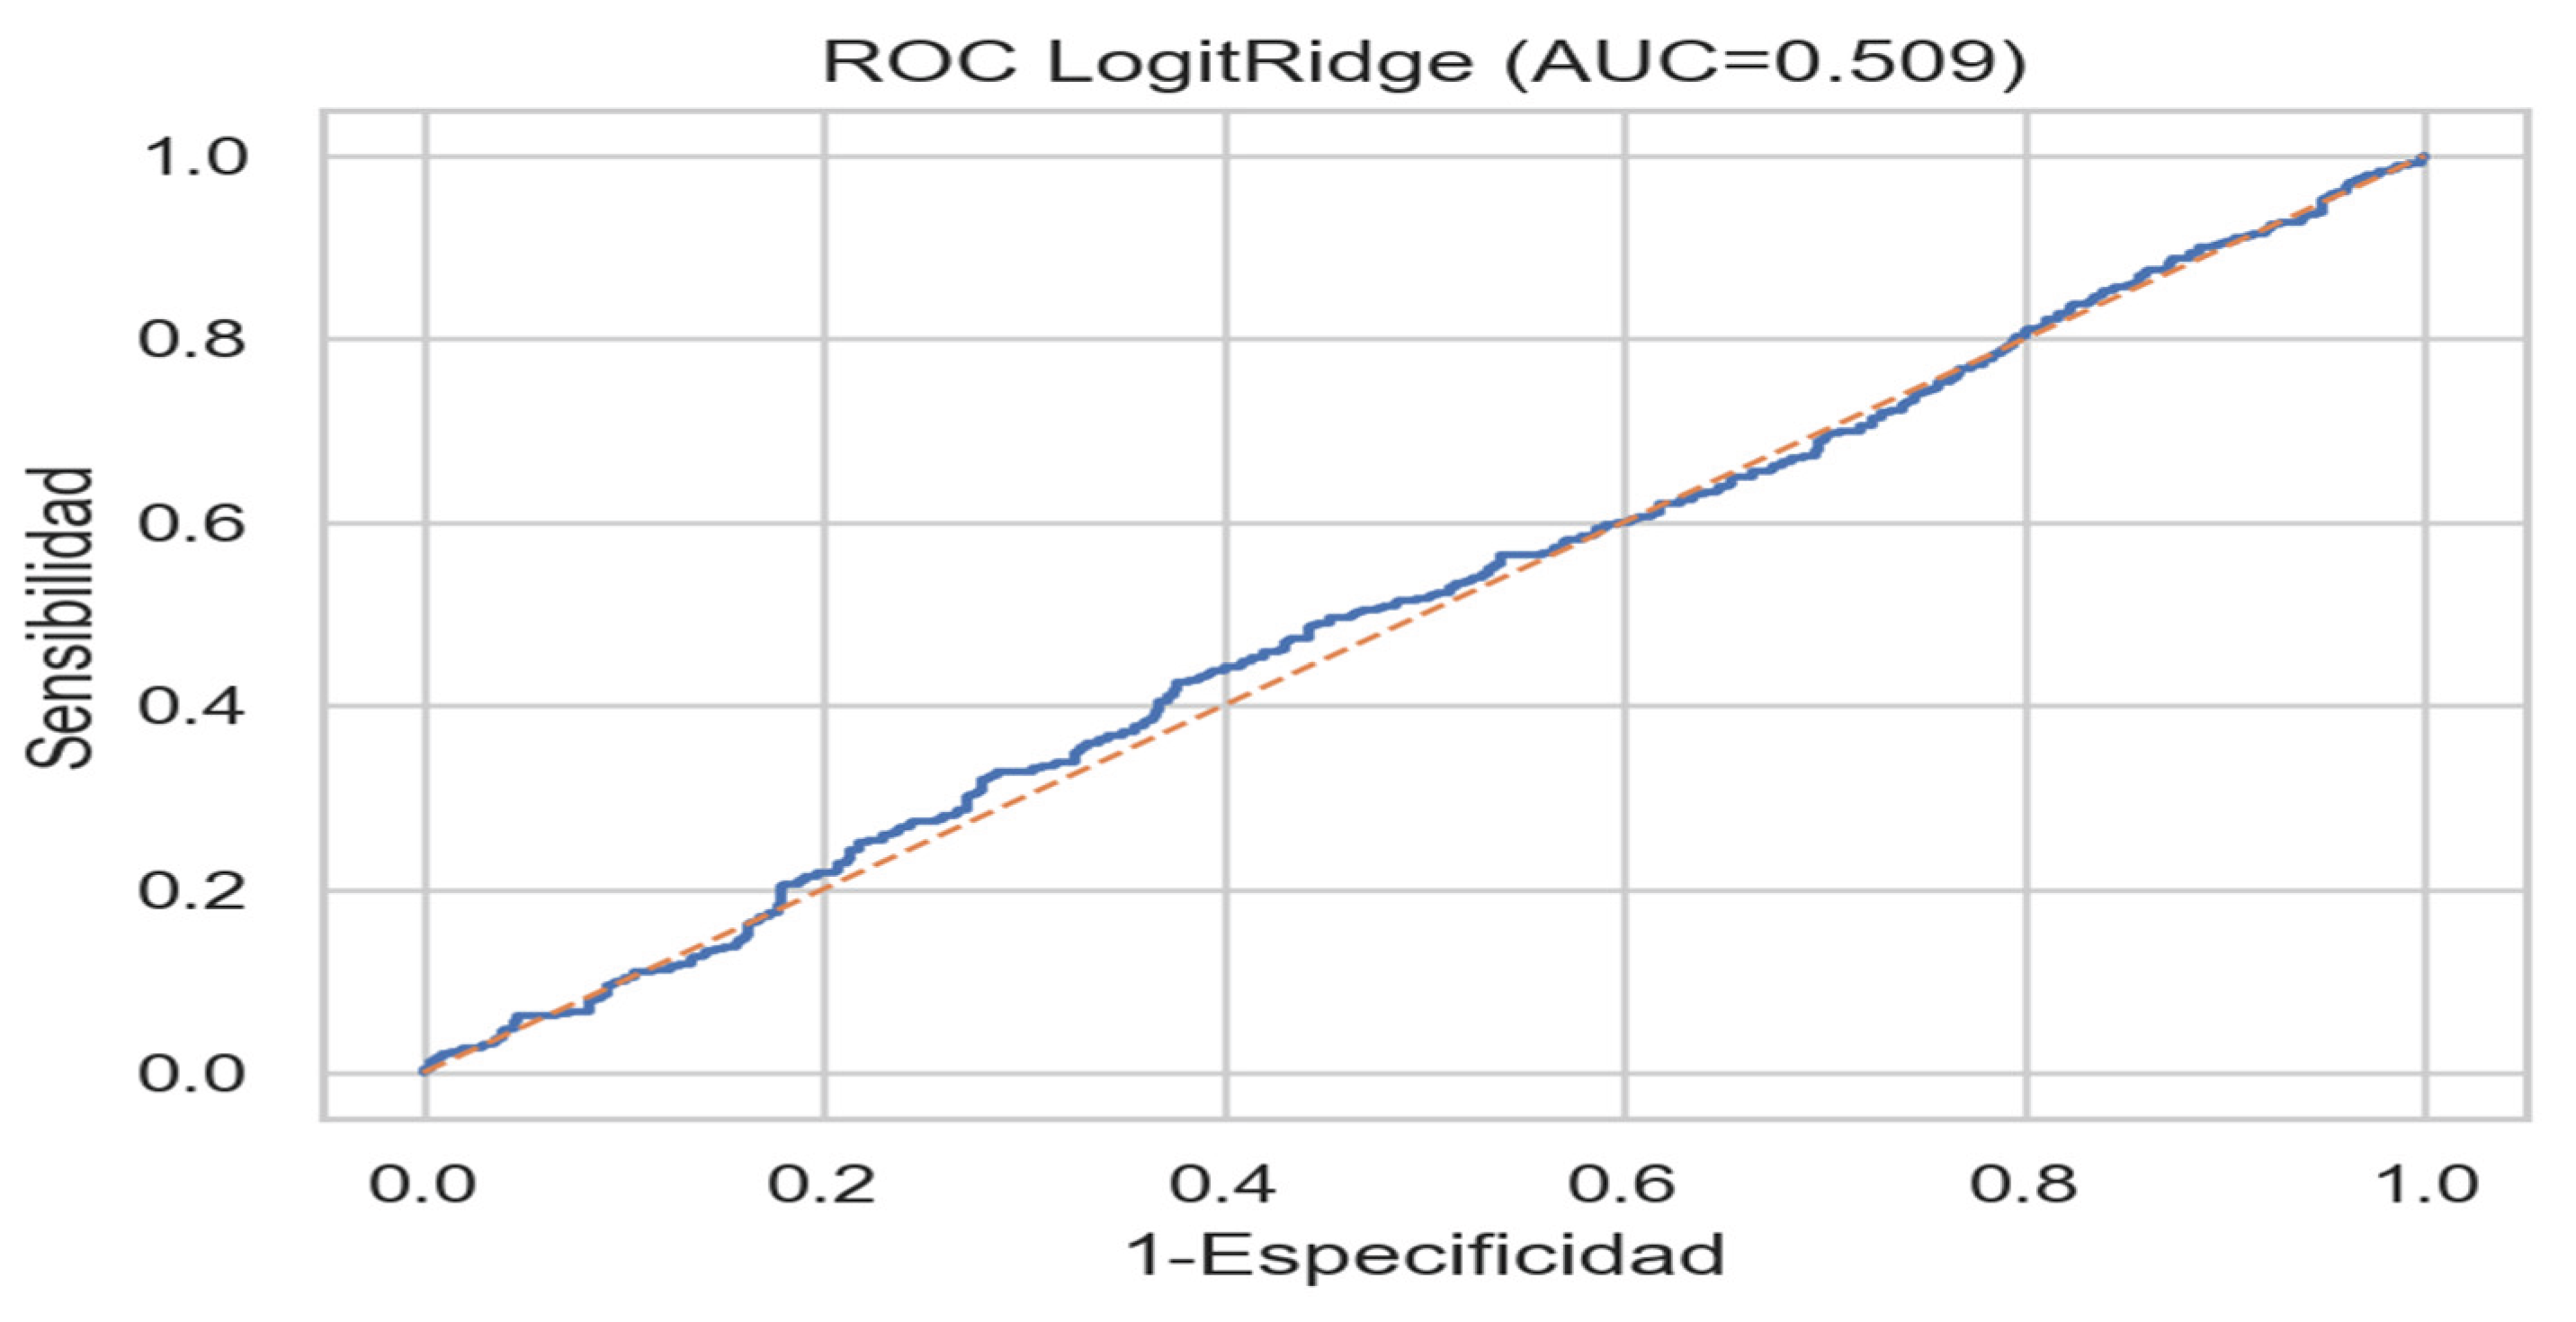
Figure 49.
ROC curve for the Random Forest model (AUC = 0.505). The ensemble tree approach approximates random prediction, indicating limited non-linear signal capture. Source: Author.
Figure 49.
ROC curve for the Random Forest model (AUC = 0.505). The ensemble tree approach approximates random prediction, indicating limited non-linear signal capture. Source: Author.
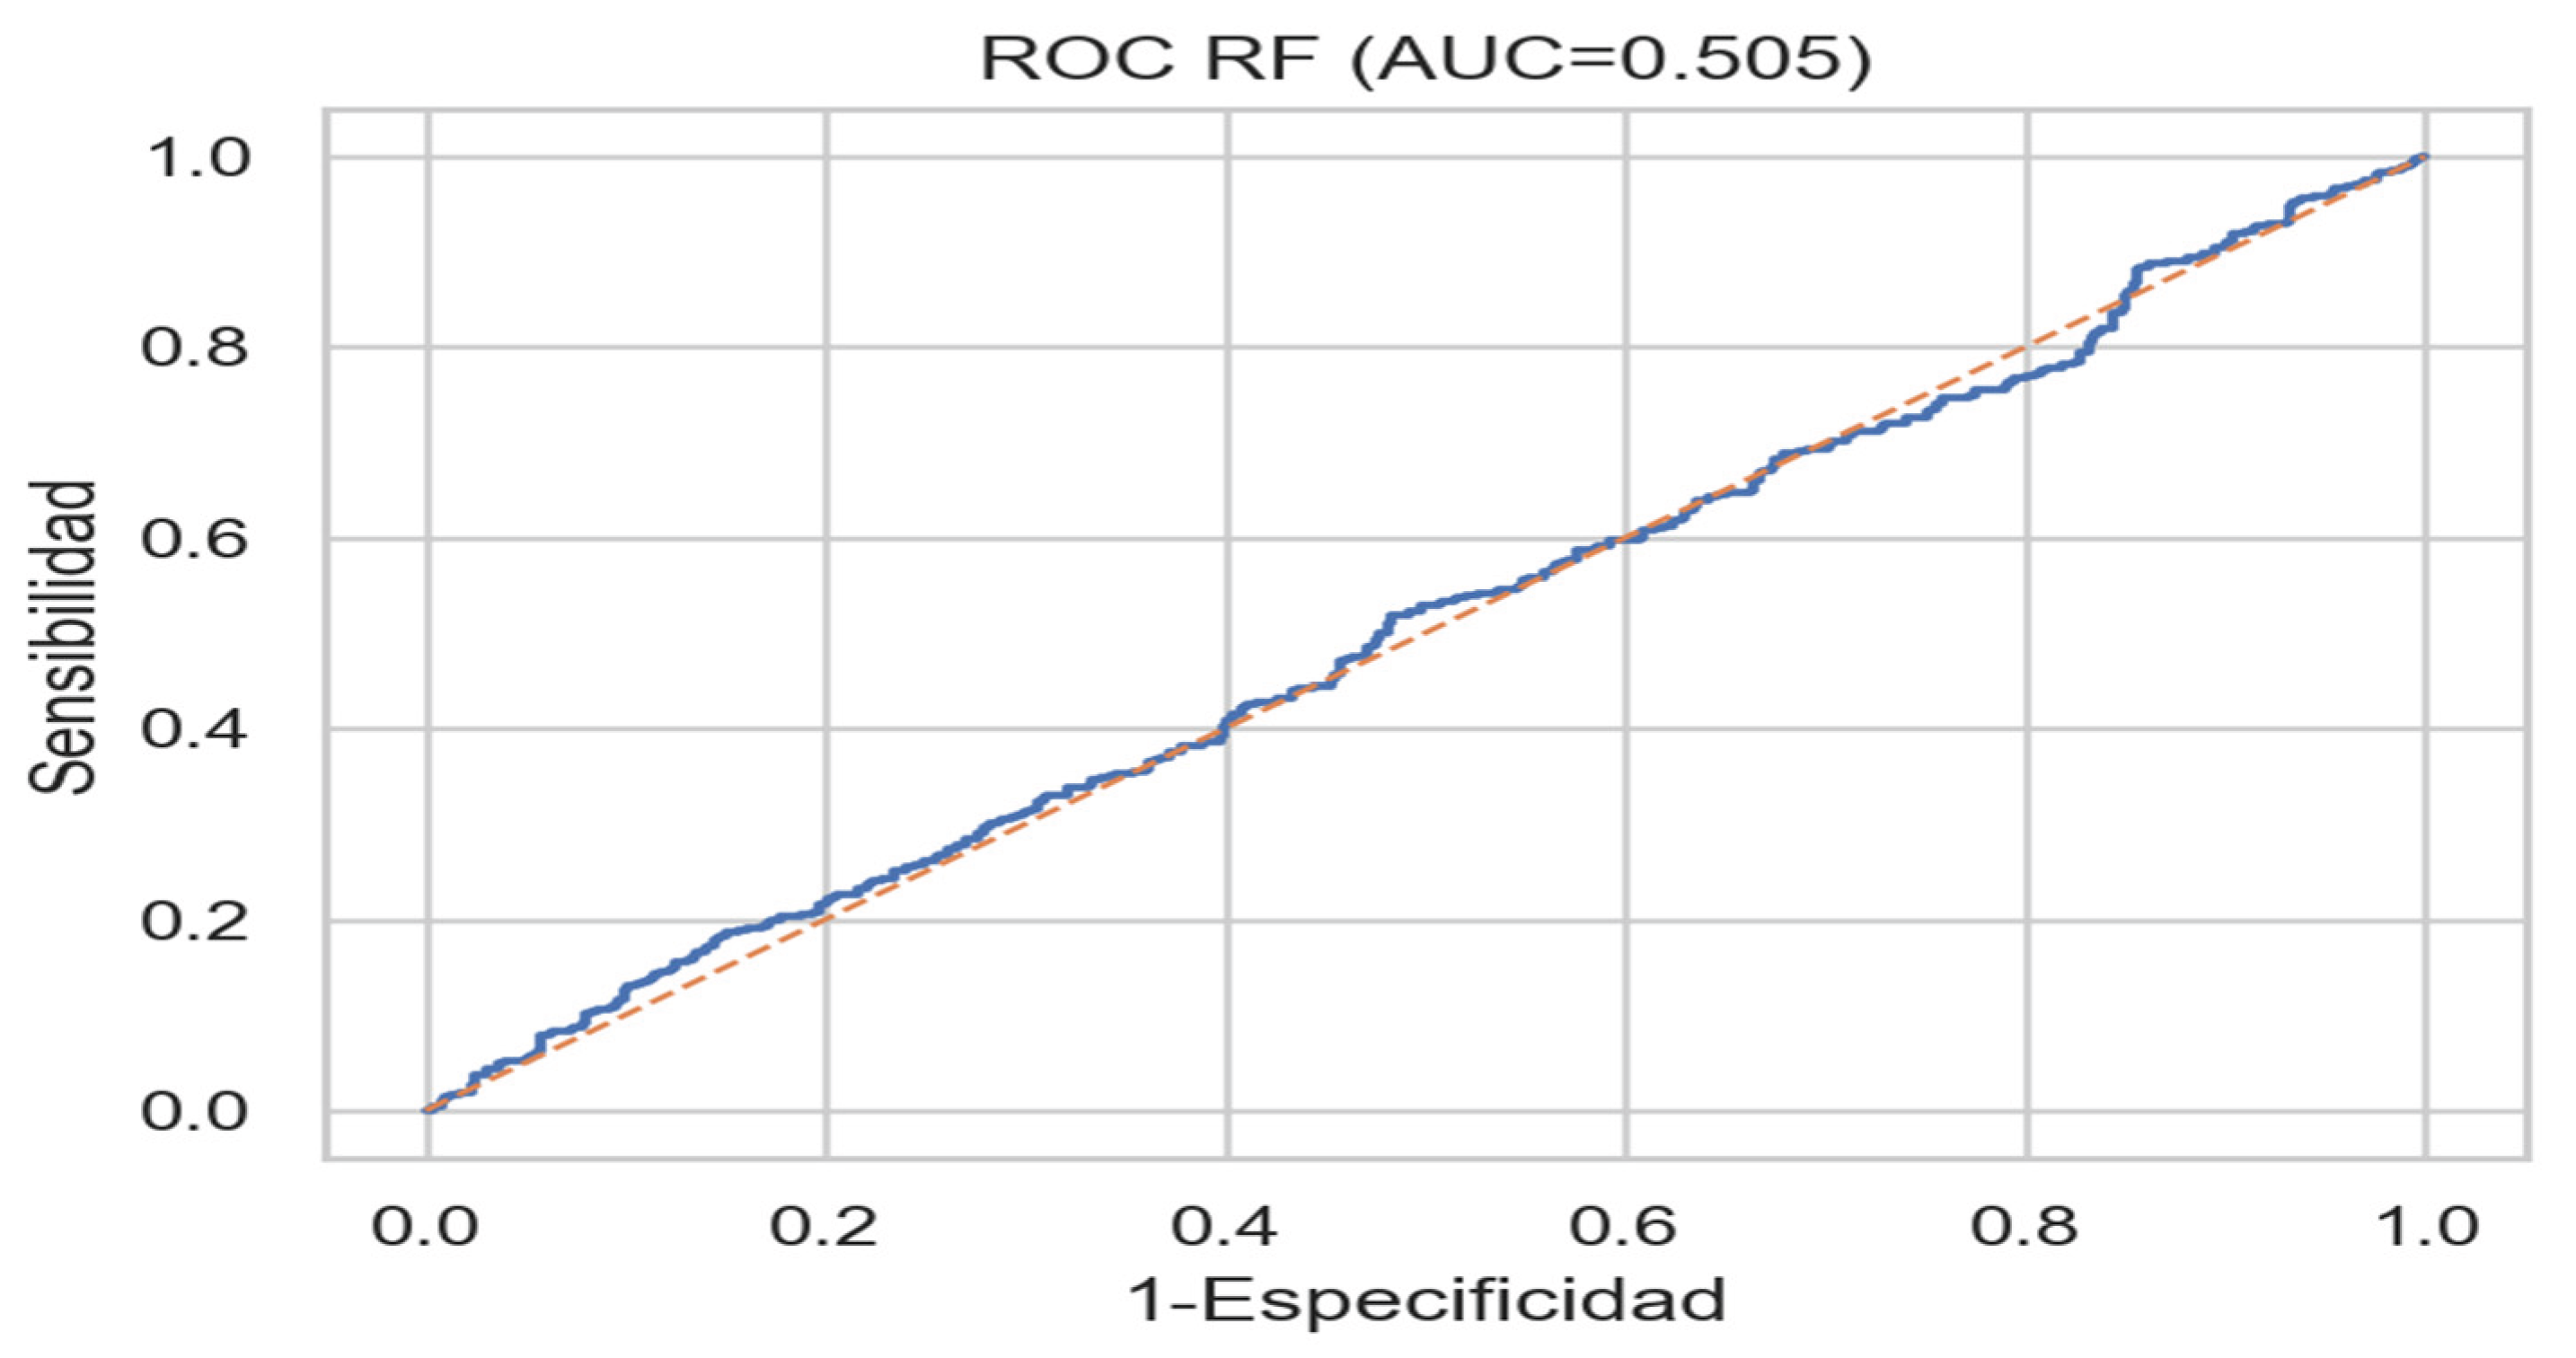
Figure 50.
ROC curve for the SVM model (AUC = 0.502). The kernel-based classifier offers performance equivalent to random chance under current data constraints. Source: Author.
Figure 50.
ROC curve for the SVM model (AUC = 0.502). The kernel-based classifier offers performance equivalent to random chance under current data constraints. Source: Author.
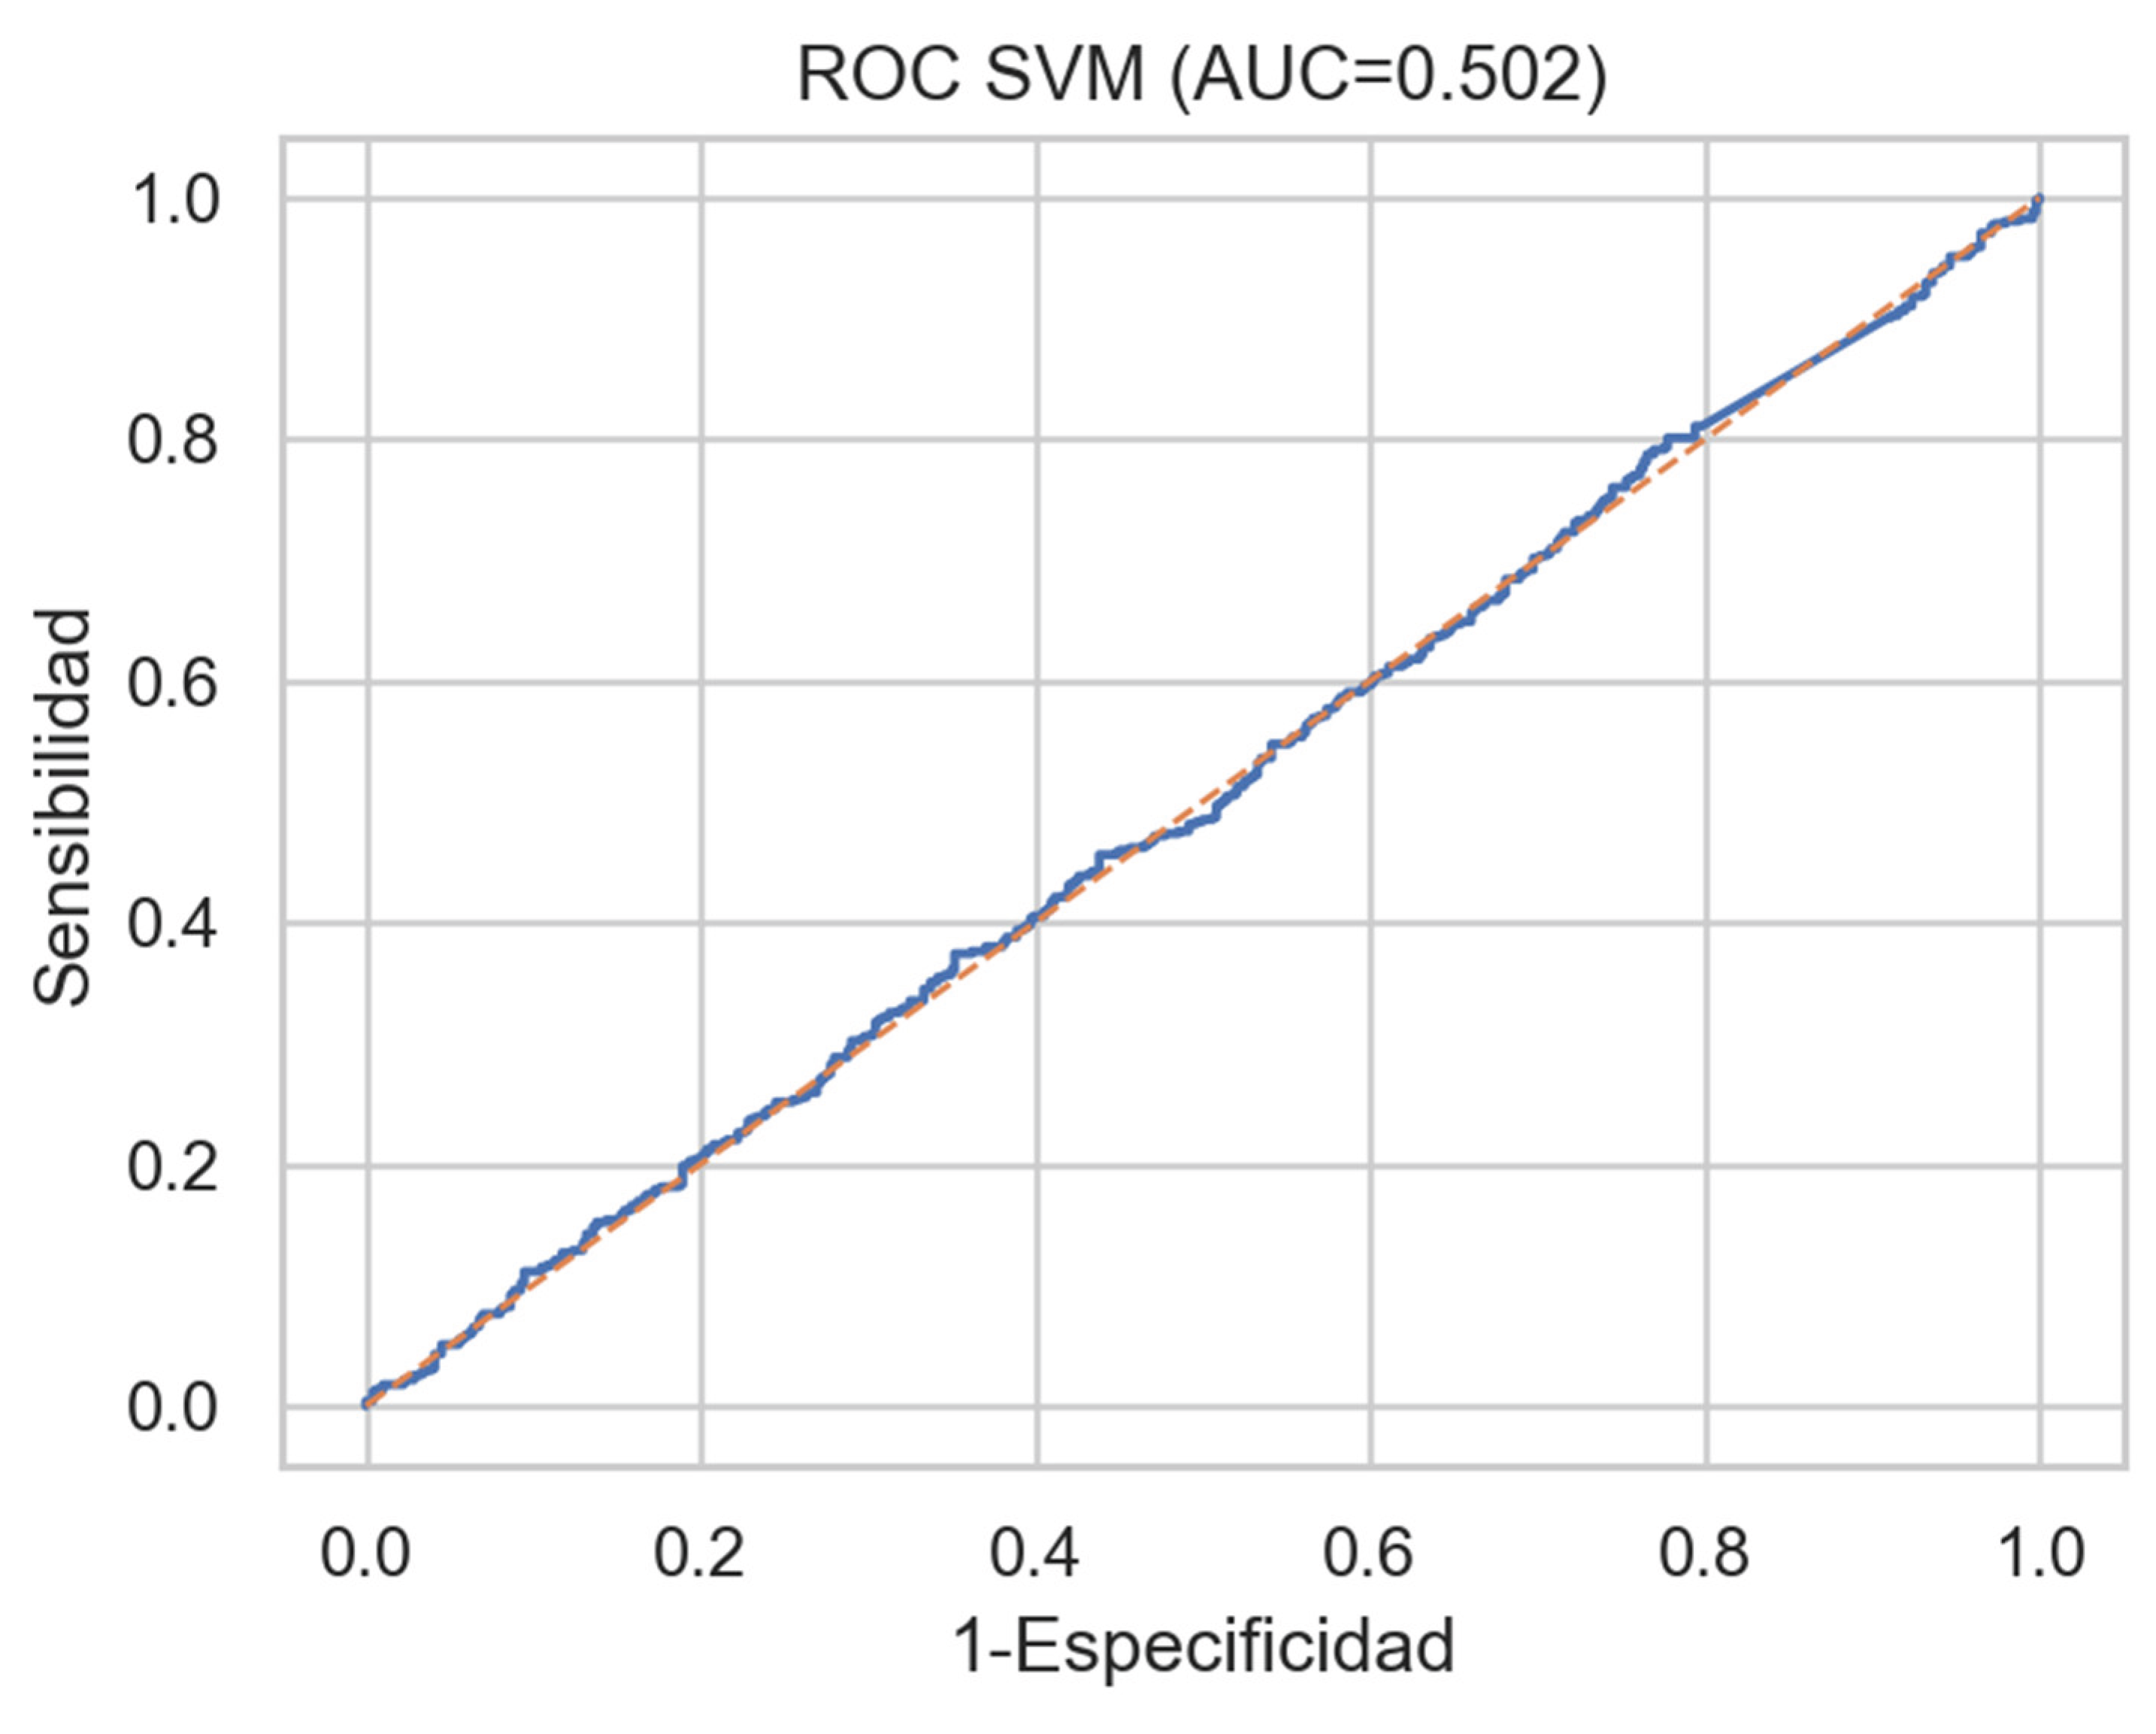
Figure 51.
ROC curve for the XGBoost model (AUC = 0.488). The boosting algorithm underperforms relative to others, suggesting potential overfitting or instability in small-signal contexts. Source: Author.
Figure 51.
ROC curve for the XGBoost model (AUC = 0.488). The boosting algorithm underperforms relative to others, suggesting potential overfitting or instability in small-signal contexts. Source: Author.
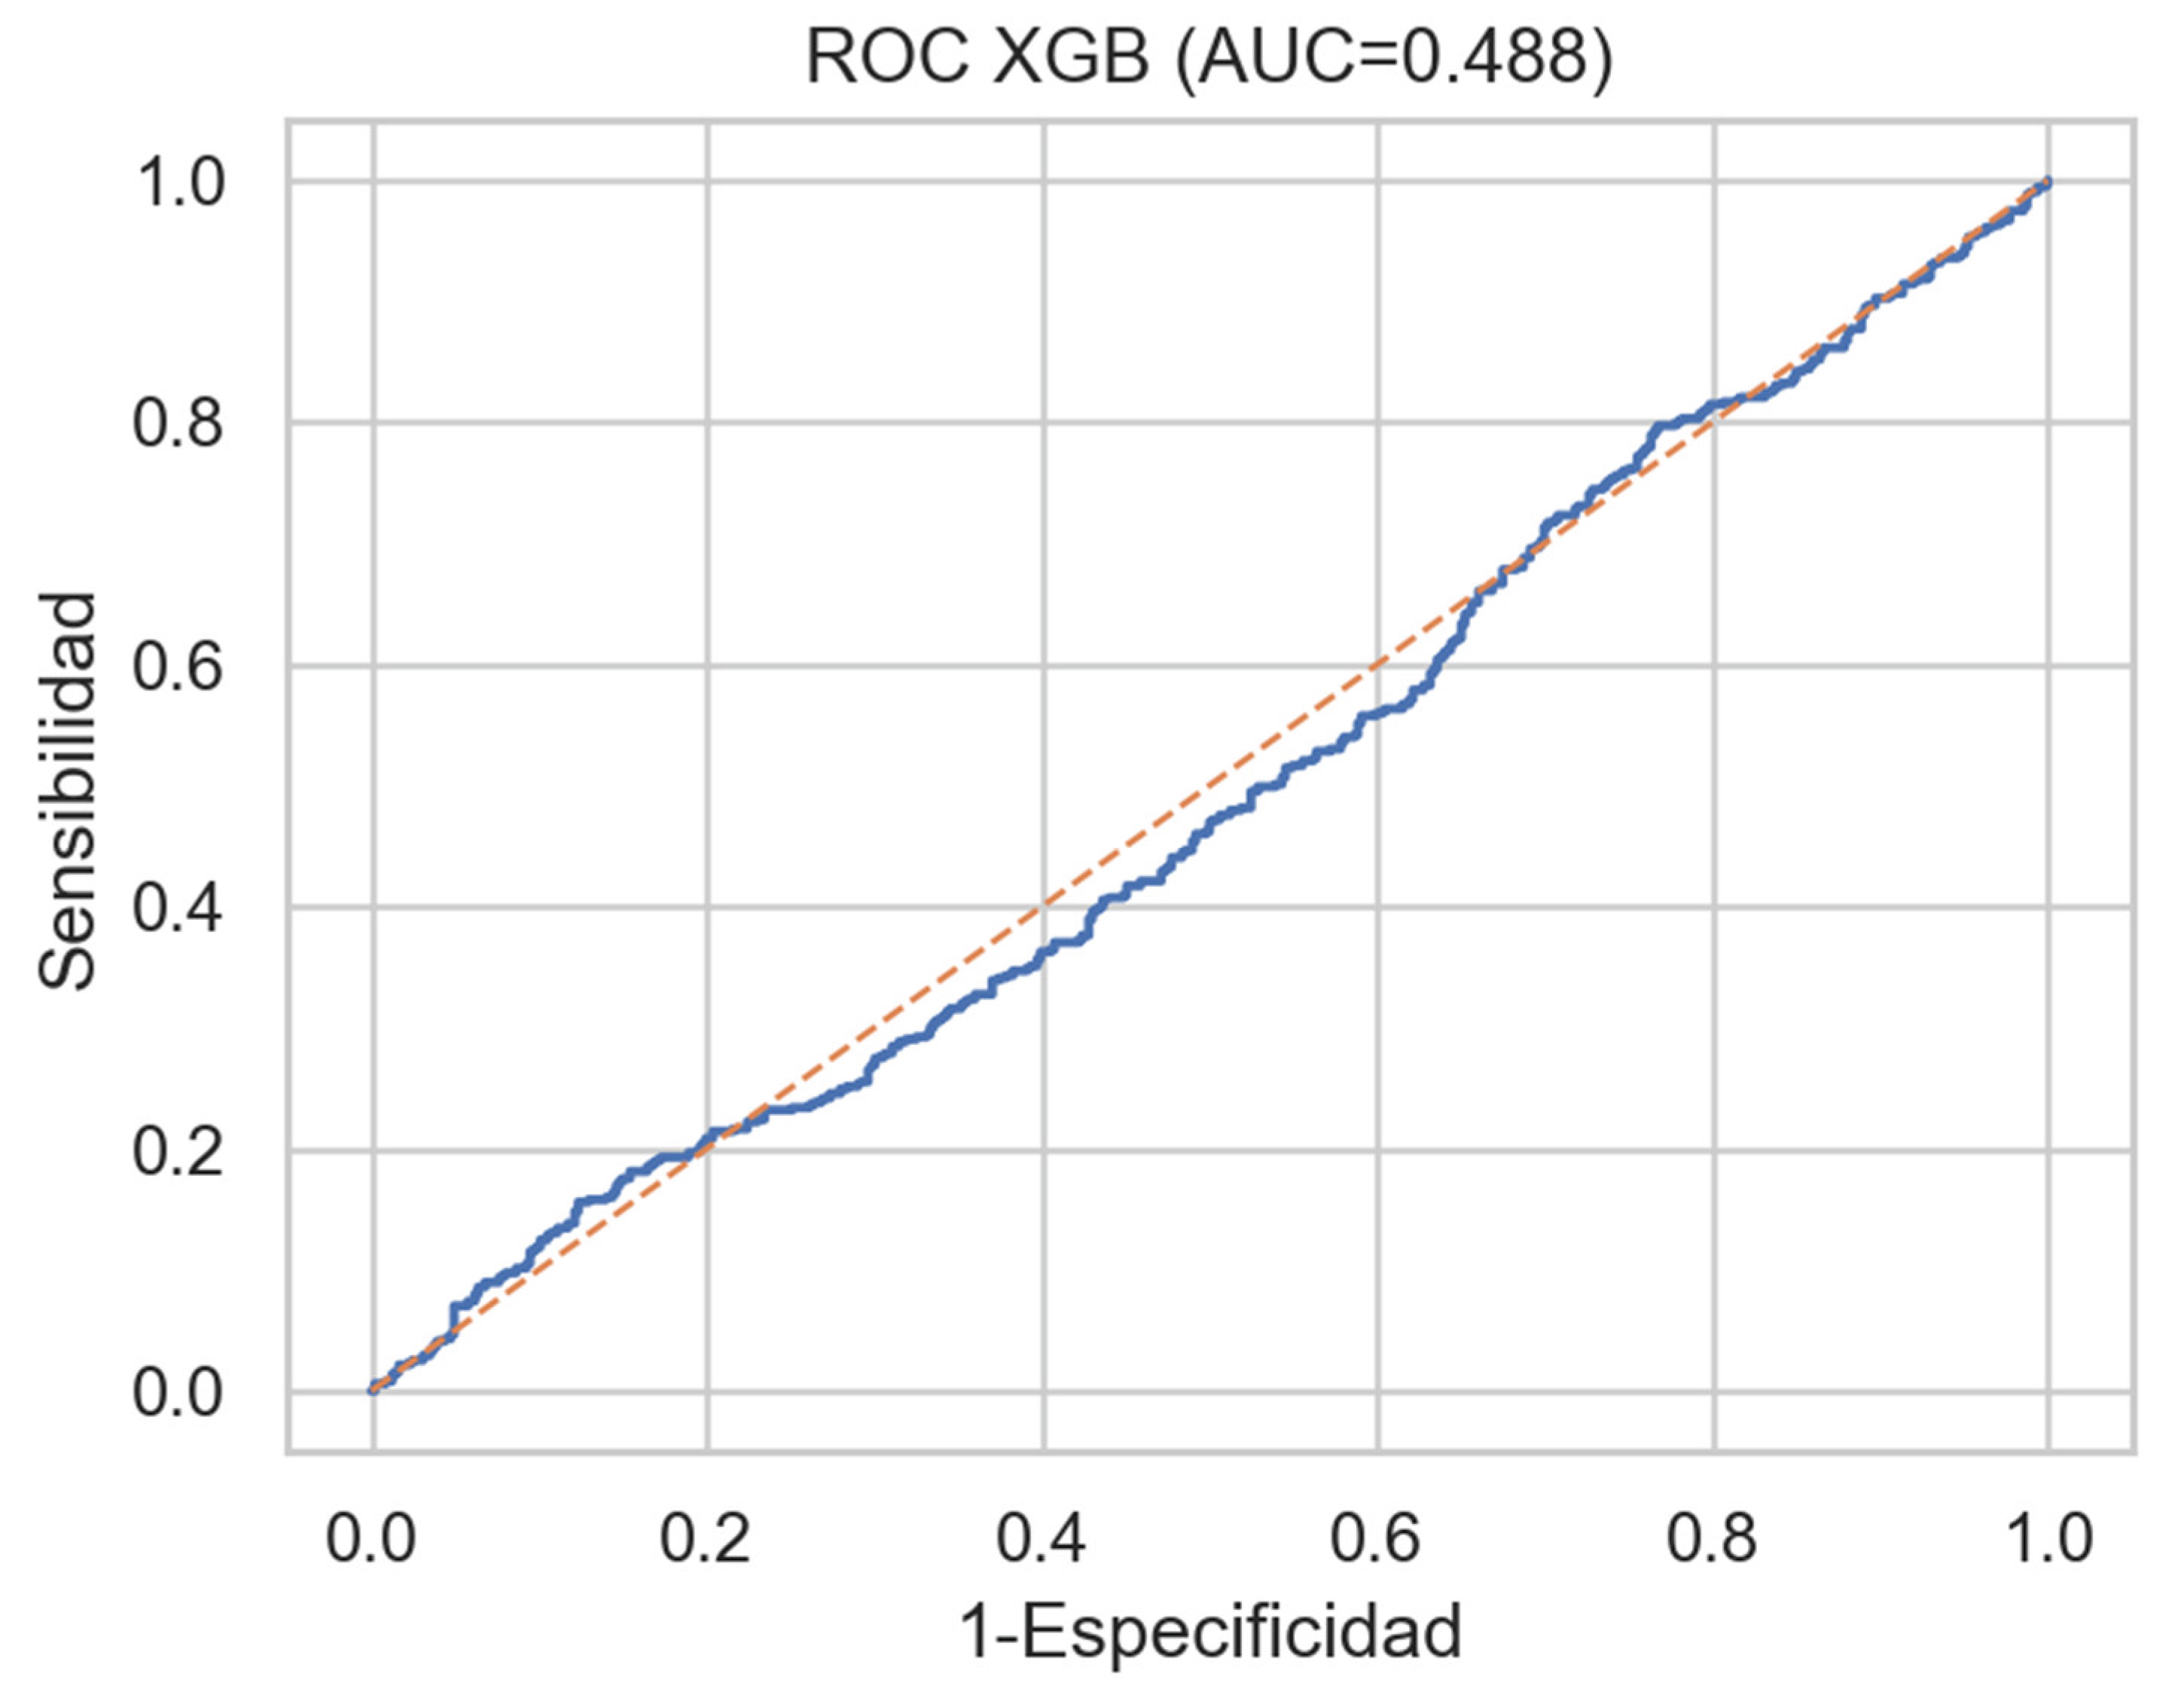
Figure 52.
Distribution of predicted probabilities — LASSO. The penalized regression produces a narrow, symmetric distribution around 0.5 for both classes, reflecting limited class distinction but moderate numerical stability. Source: Author.
Figure 52.
Distribution of predicted probabilities — LASSO. The penalized regression produces a narrow, symmetric distribution around 0.5 for both classes, reflecting limited class distinction but moderate numerical stability. Source: Author.
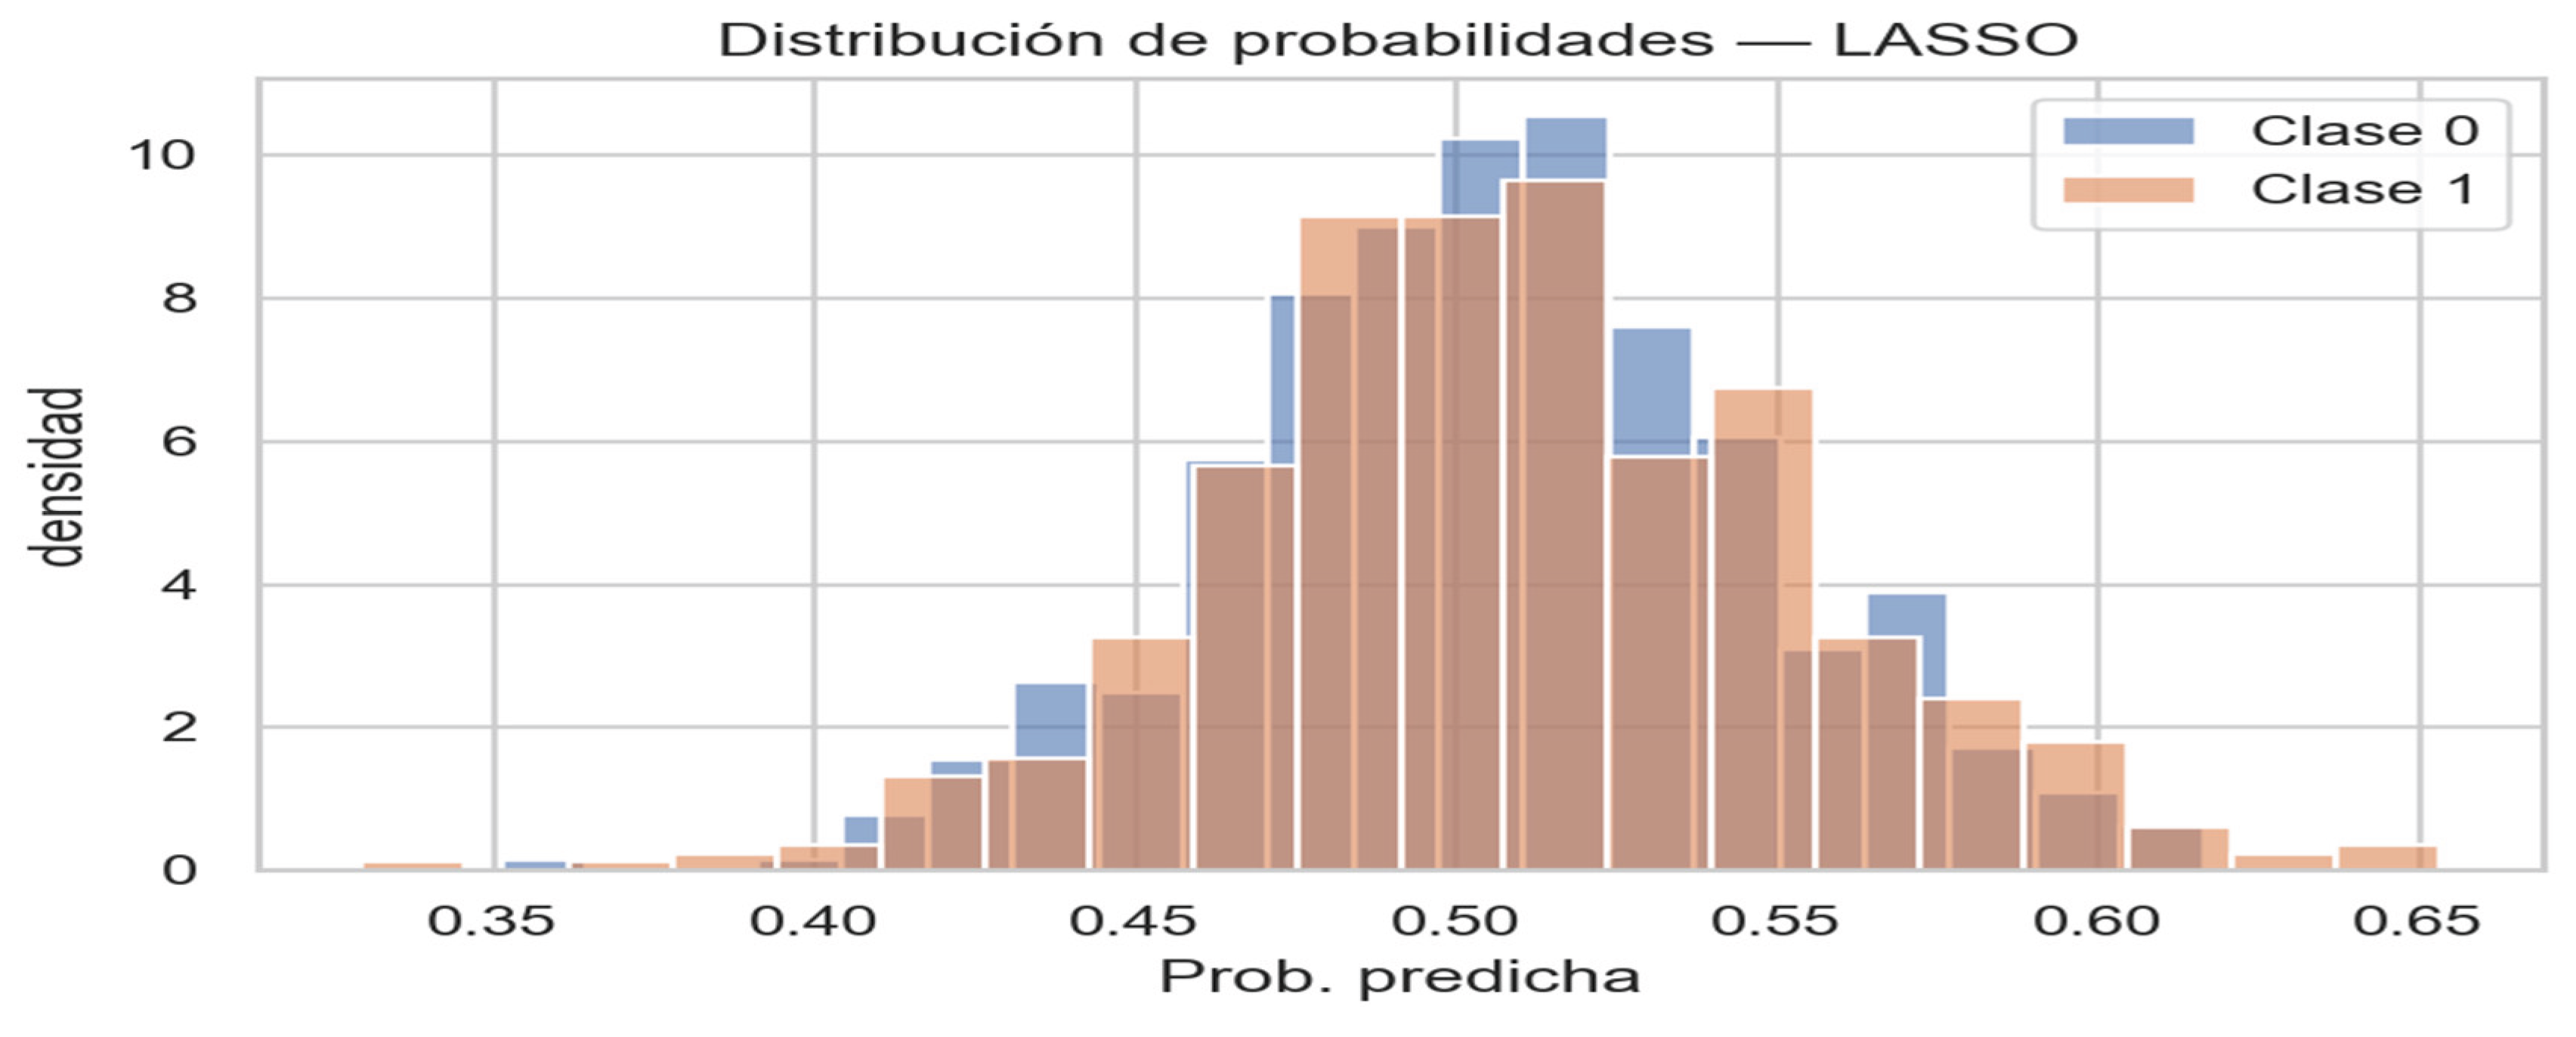
Figure 53.
Distribution of predicted probabilities — LogitRidge. Similar to LASSO, the ridge-regularized logistic regression concentrates its predictions near the central range, with strong overlap between classes. Source: Author.
Figure 53.
Distribution of predicted probabilities — LogitRidge. Similar to LASSO, the ridge-regularized logistic regression concentrates its predictions near the central range, with strong overlap between classes. Source: Author.
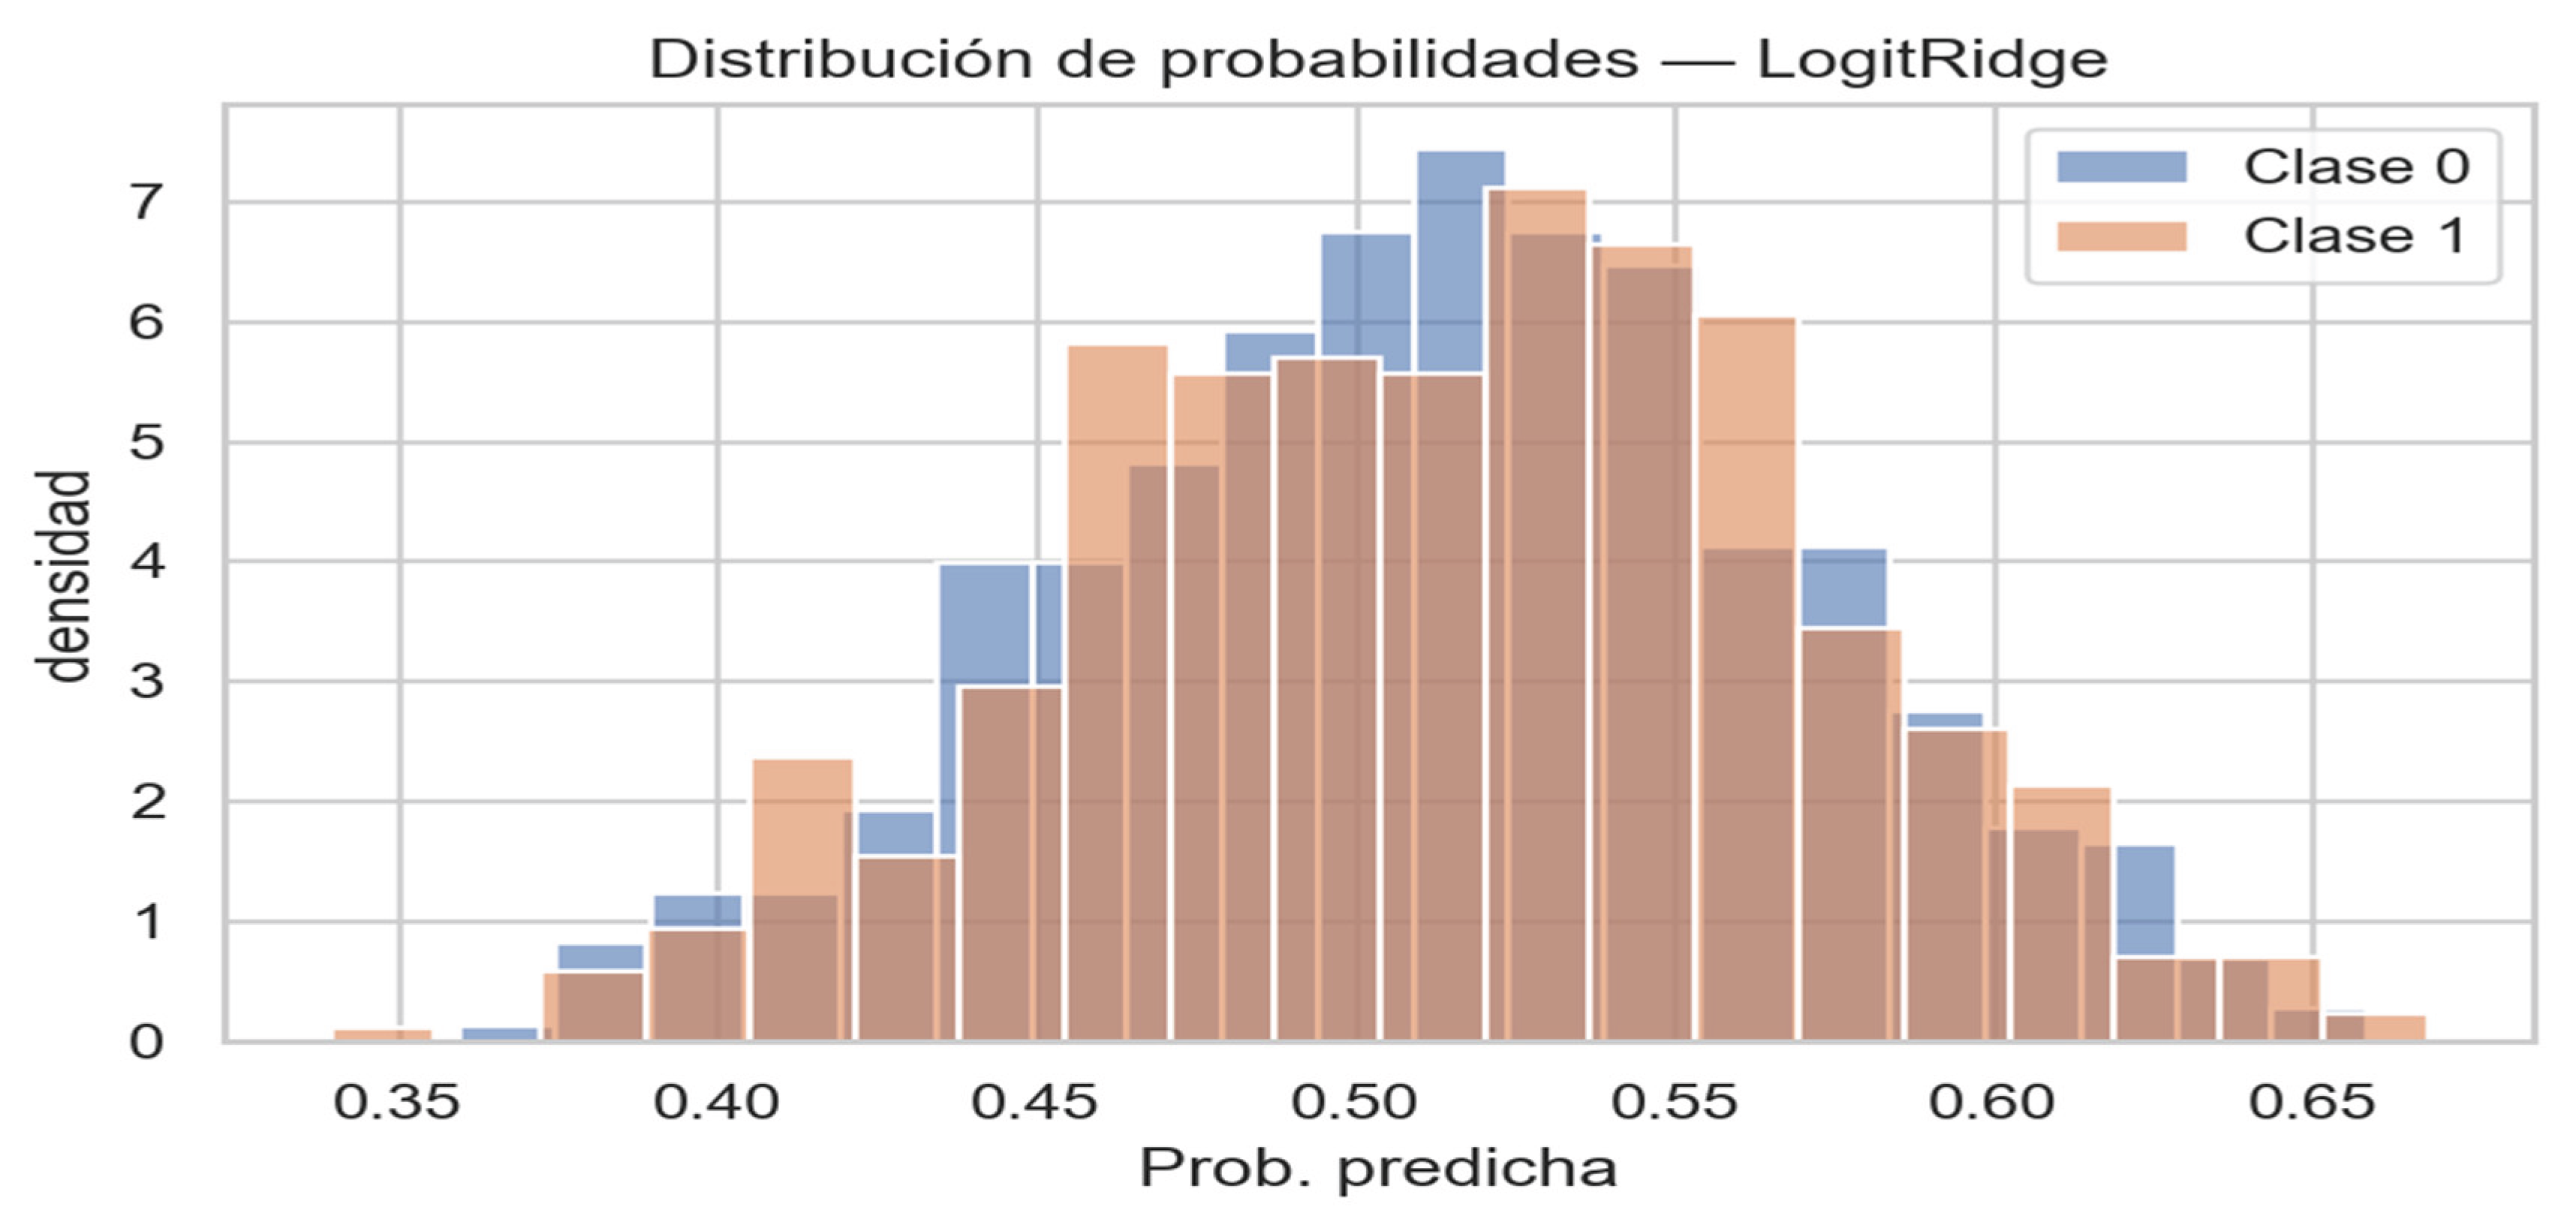
Figure 54.
Distribution of predicted probabilities — Random Forest. The ensemble method generates wider dispersion and smoother densities, but the distributions of class 0 and class 1 remain strongly superimposed. Source: Author.
Figure 54.
Distribution of predicted probabilities — Random Forest. The ensemble method generates wider dispersion and smoother densities, but the distributions of class 0 and class 1 remain strongly superimposed. Source: Author.
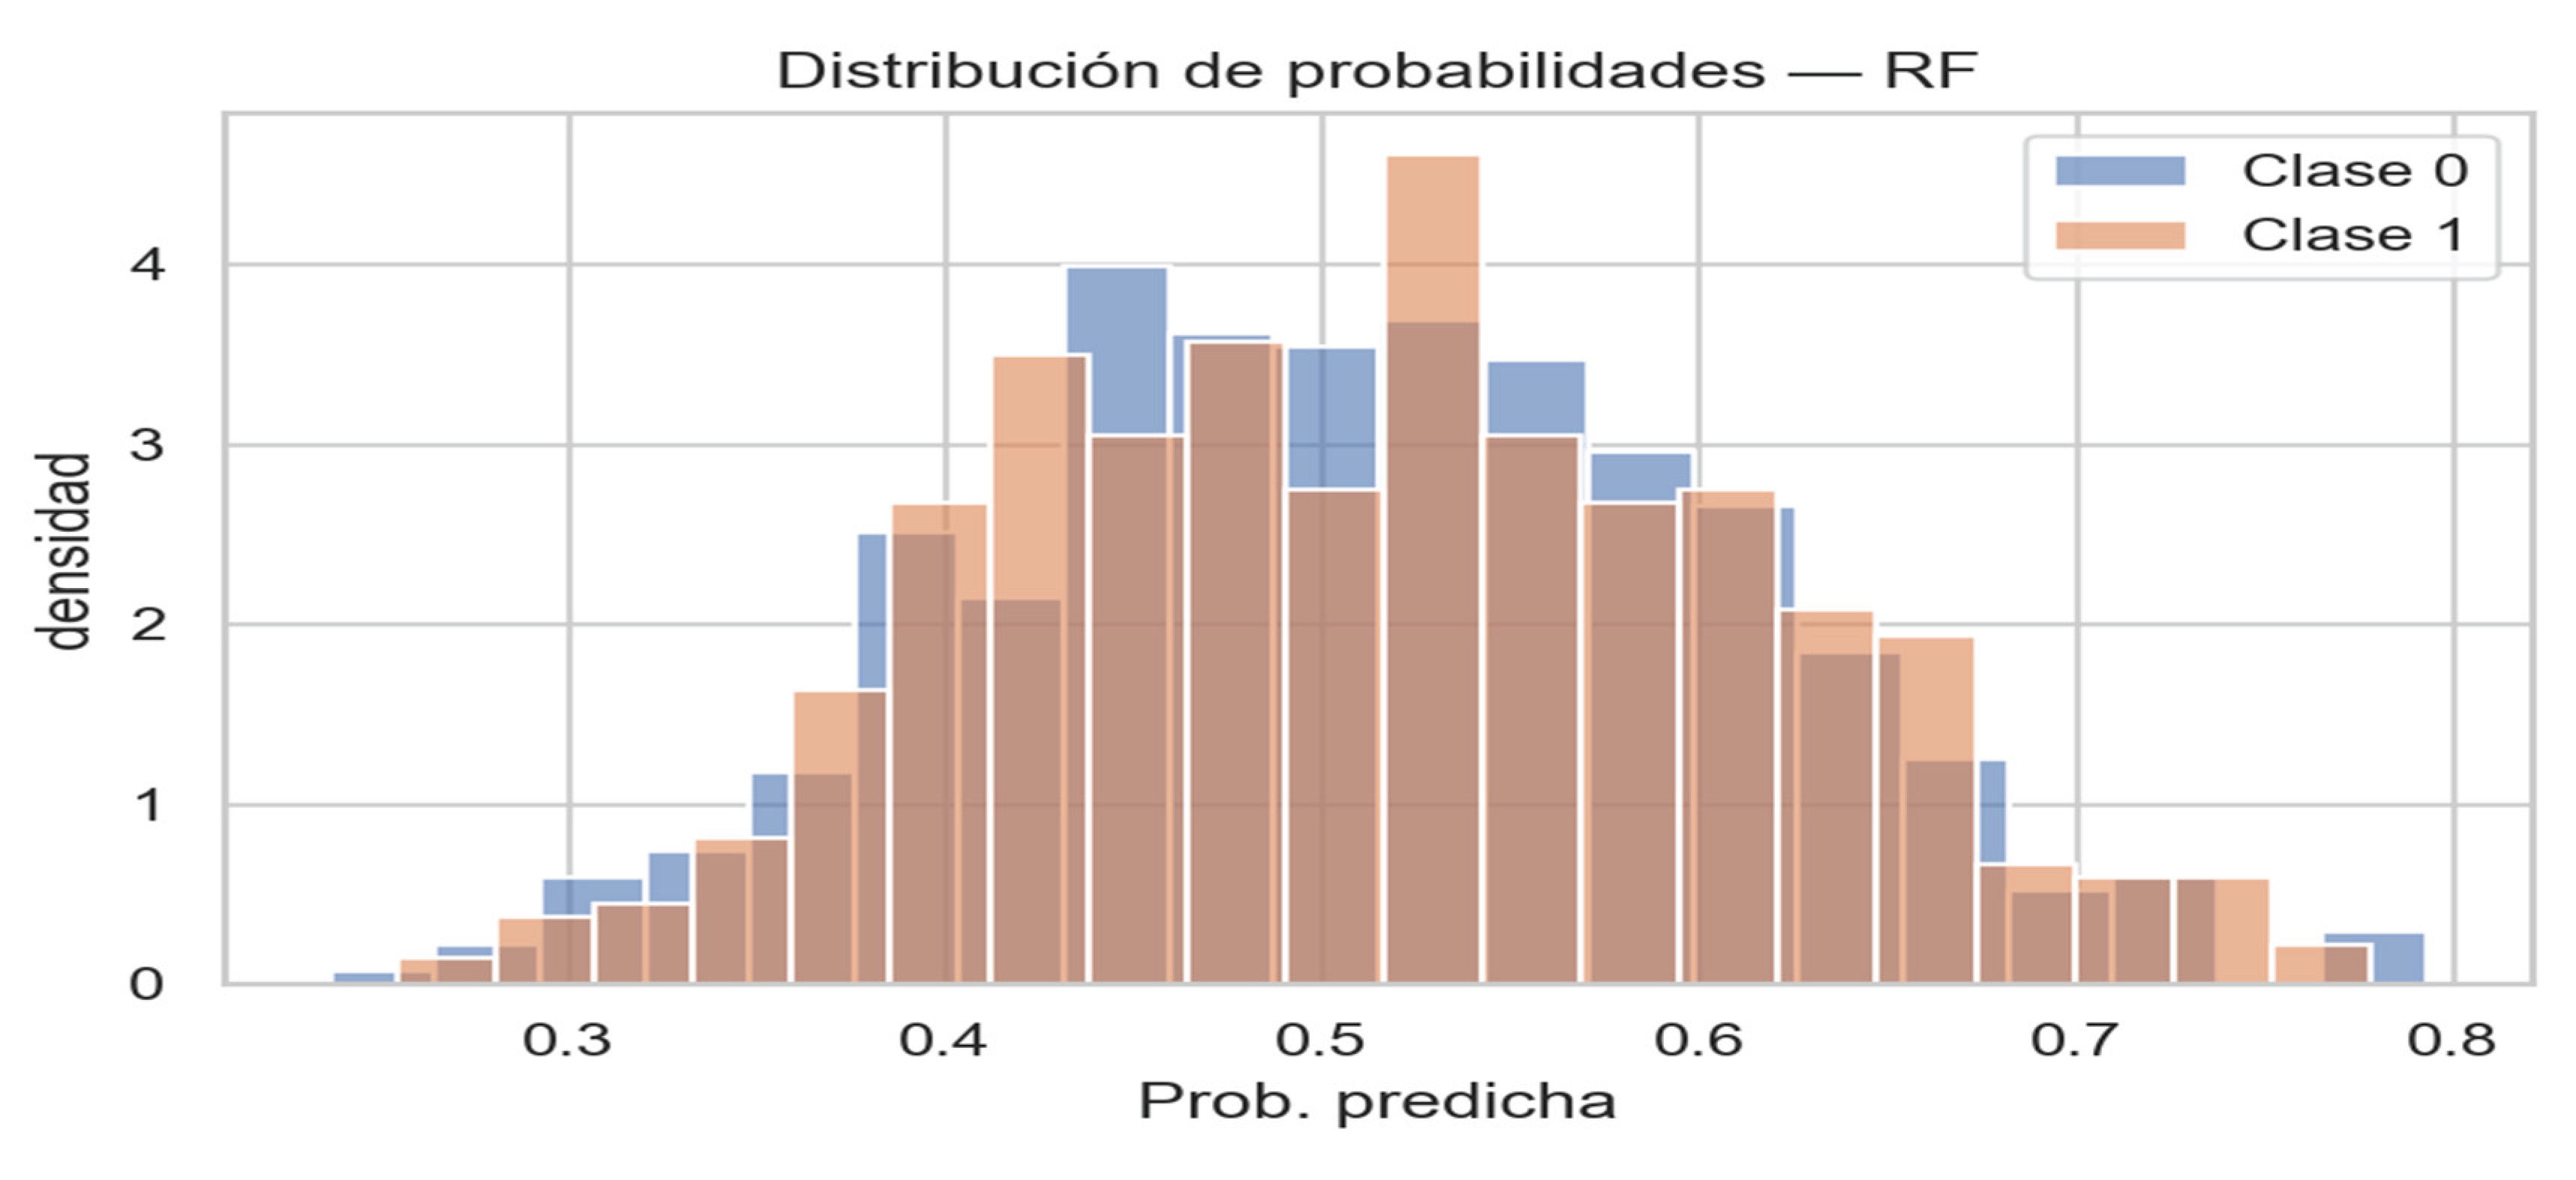
Figure 55.
Distribution of predicted probabilities — XGBoost. The boosting model shows a broader asymmetric shape, extending toward both extremes; however, the two classes still overlap considerably. Source: Author.
Figure 55.
Distribution of predicted probabilities — XGBoost. The boosting model shows a broader asymmetric shape, extending toward both extremes; however, the two classes still overlap considerably. Source: Author.
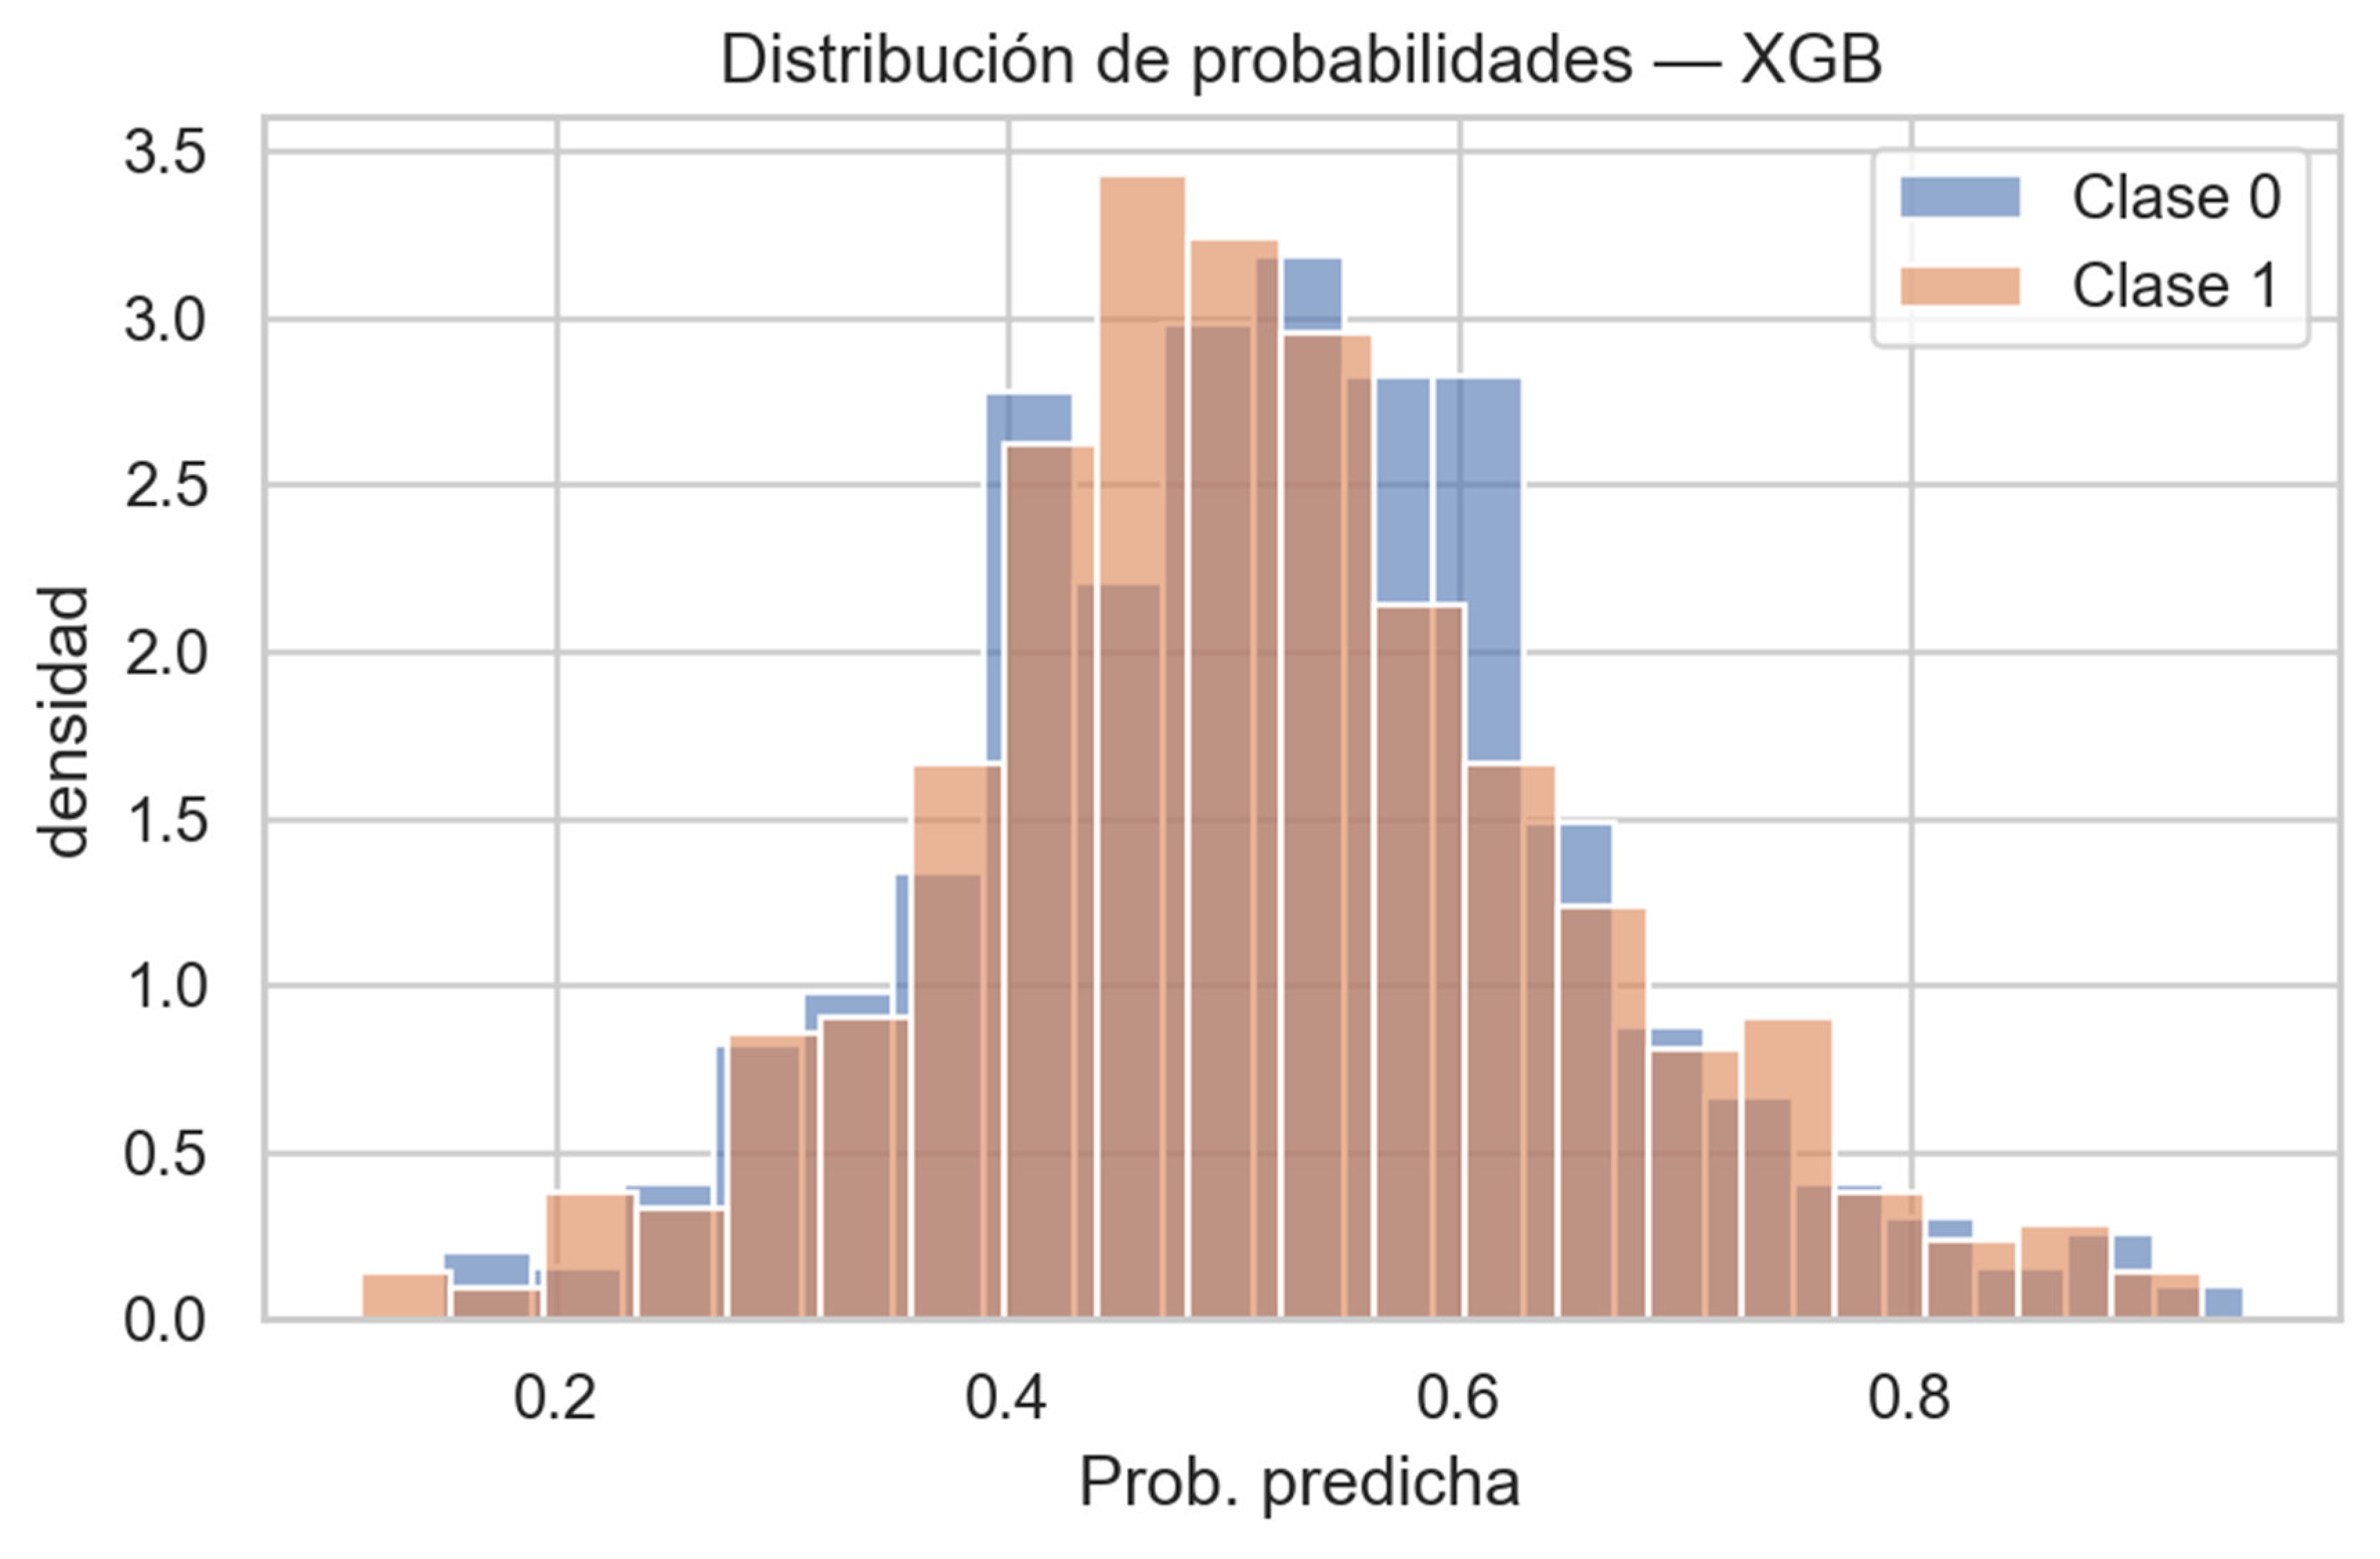
Figure 56.
Confusion matrix — LASSO (thr = 0.01, F1 = 0.679). The penalized regression predicts almost all cases as distress, yielding high recall but low precision. Source: Author.
Figure 56.
Confusion matrix — LASSO (thr = 0.01, F1 = 0.679). The penalized regression predicts almost all cases as distress, yielding high recall but low precision. Source: Author.
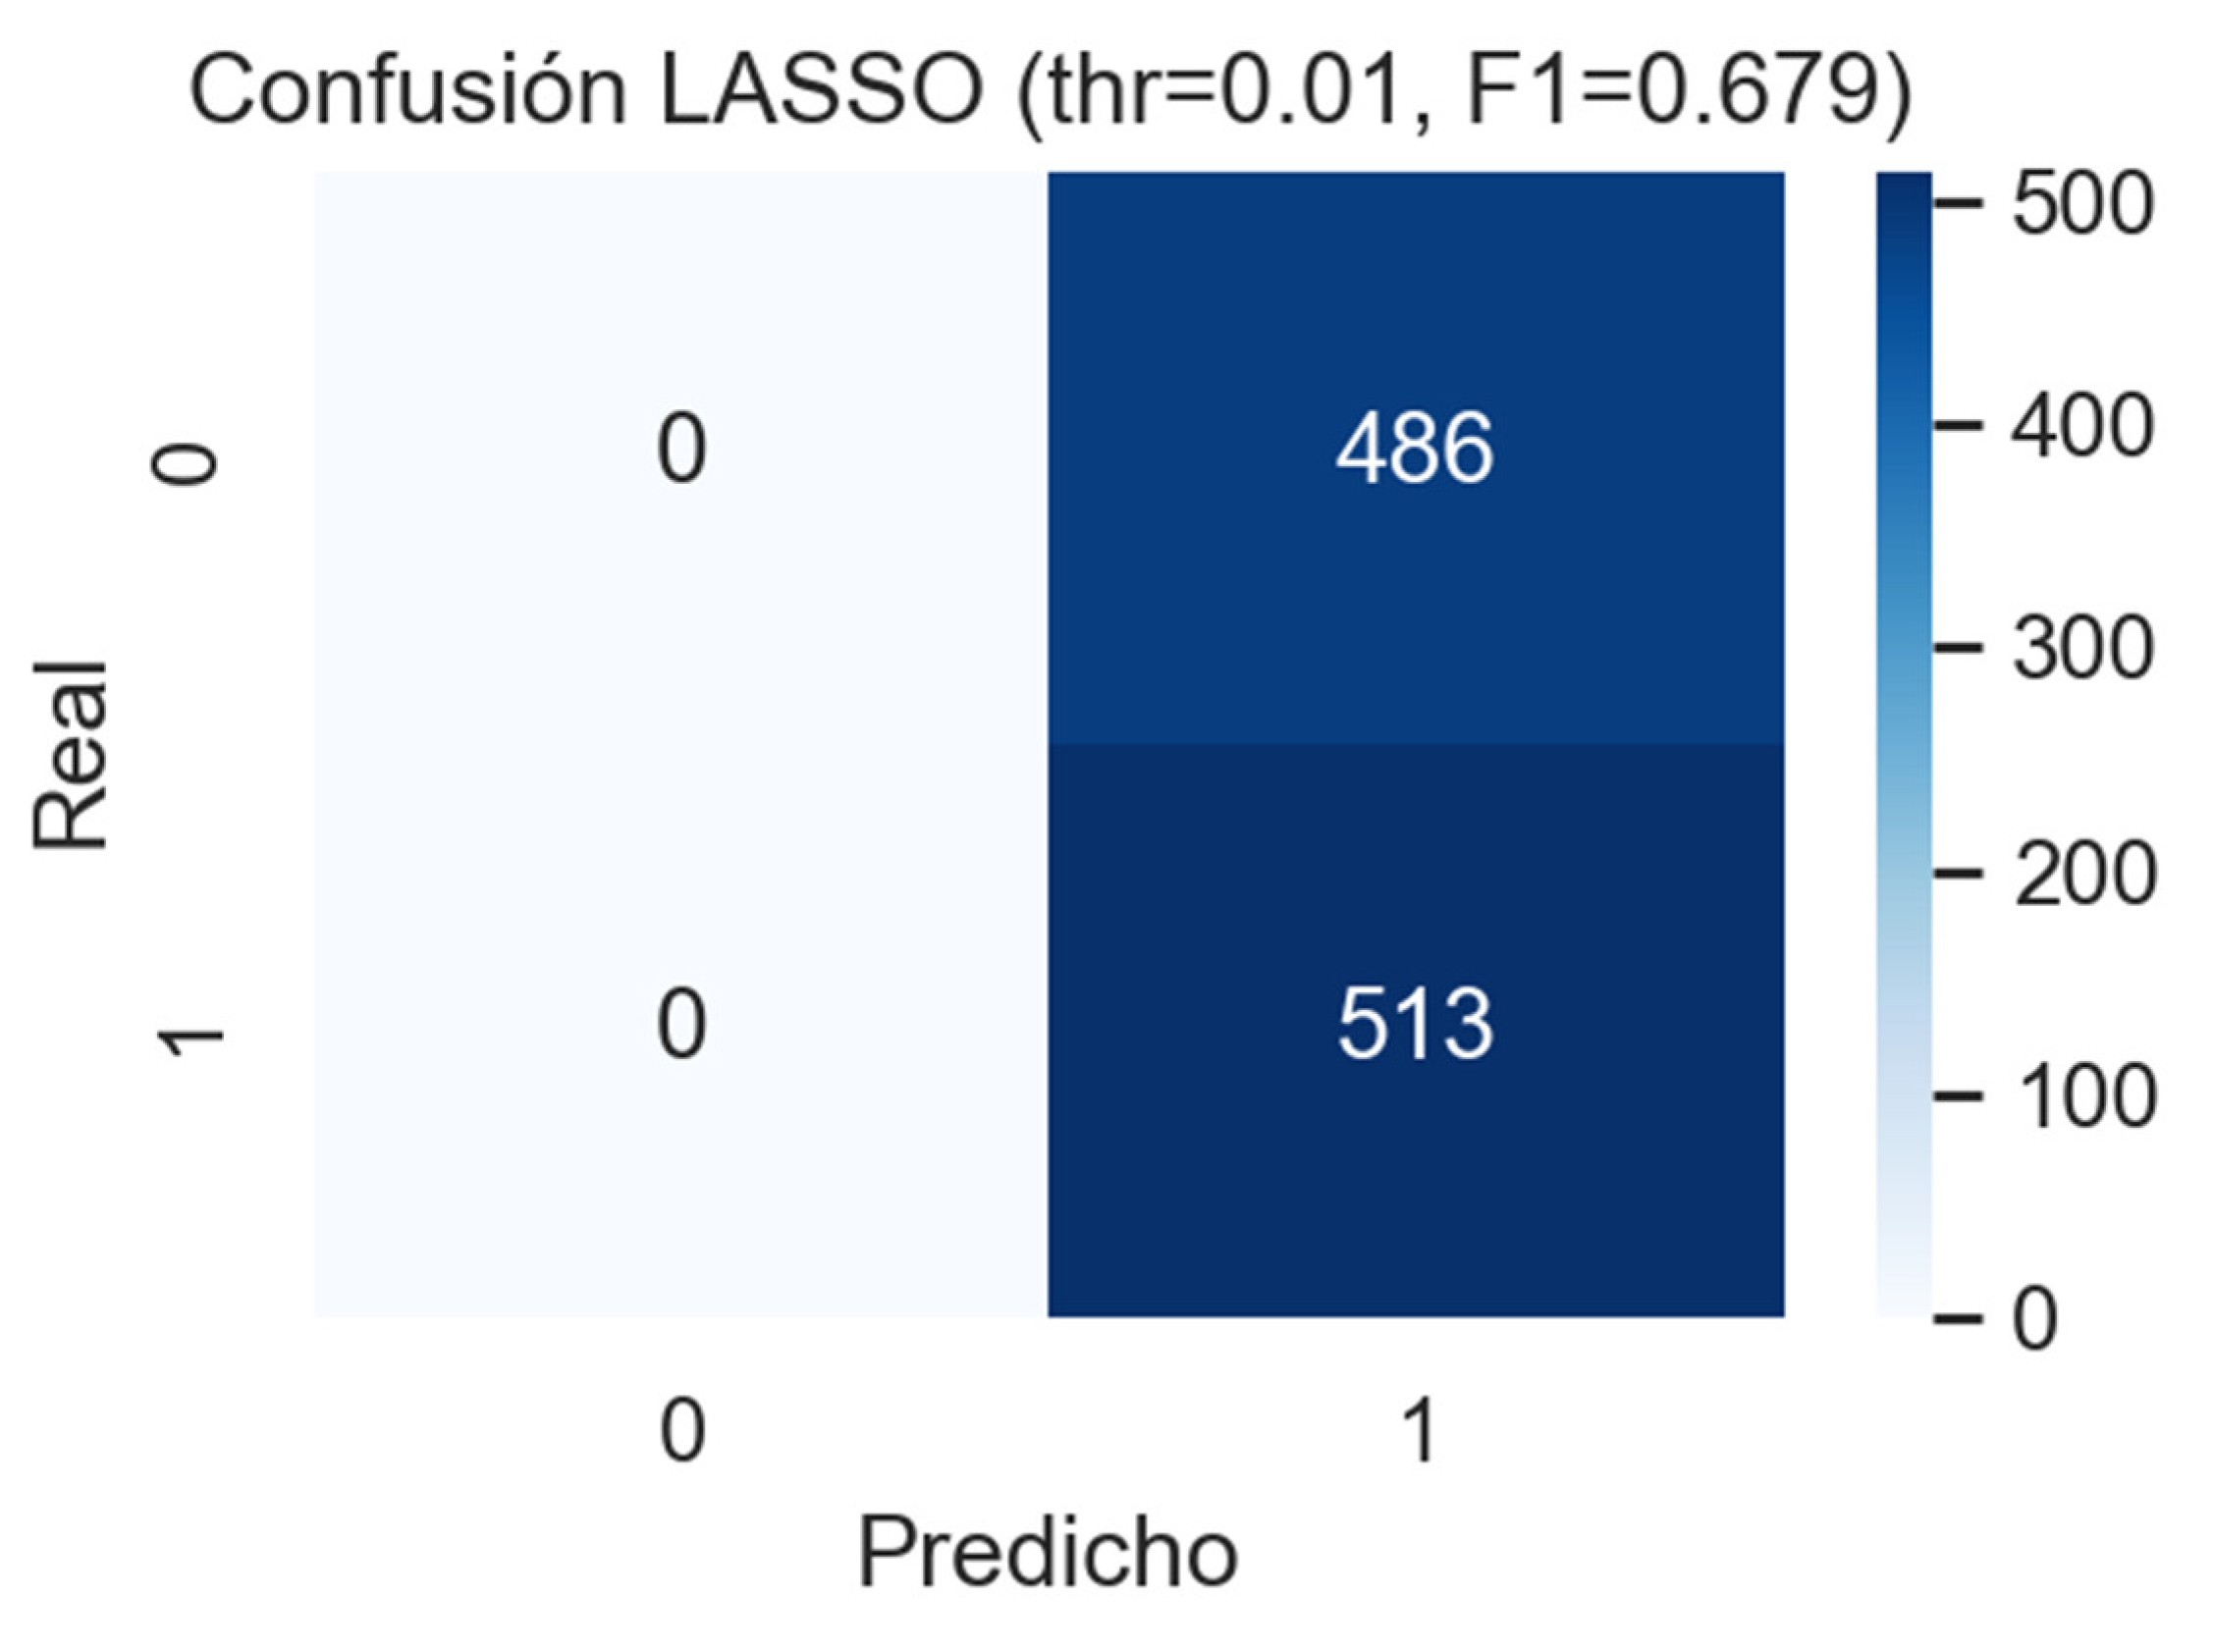
Figure 57.
Confusion matrix — LogitRidge (thr = 0.01, F1 = 0.679). The ridge-regularized model mirrors the same saturation effect observed in LASSO, confirming a systemic overestimation of financial distress under extreme threshold conditions. Source: Author.
Figure 57.
Confusion matrix — LogitRidge (thr = 0.01, F1 = 0.679). The ridge-regularized model mirrors the same saturation effect observed in LASSO, confirming a systemic overestimation of financial distress under extreme threshold conditions. Source: Author.
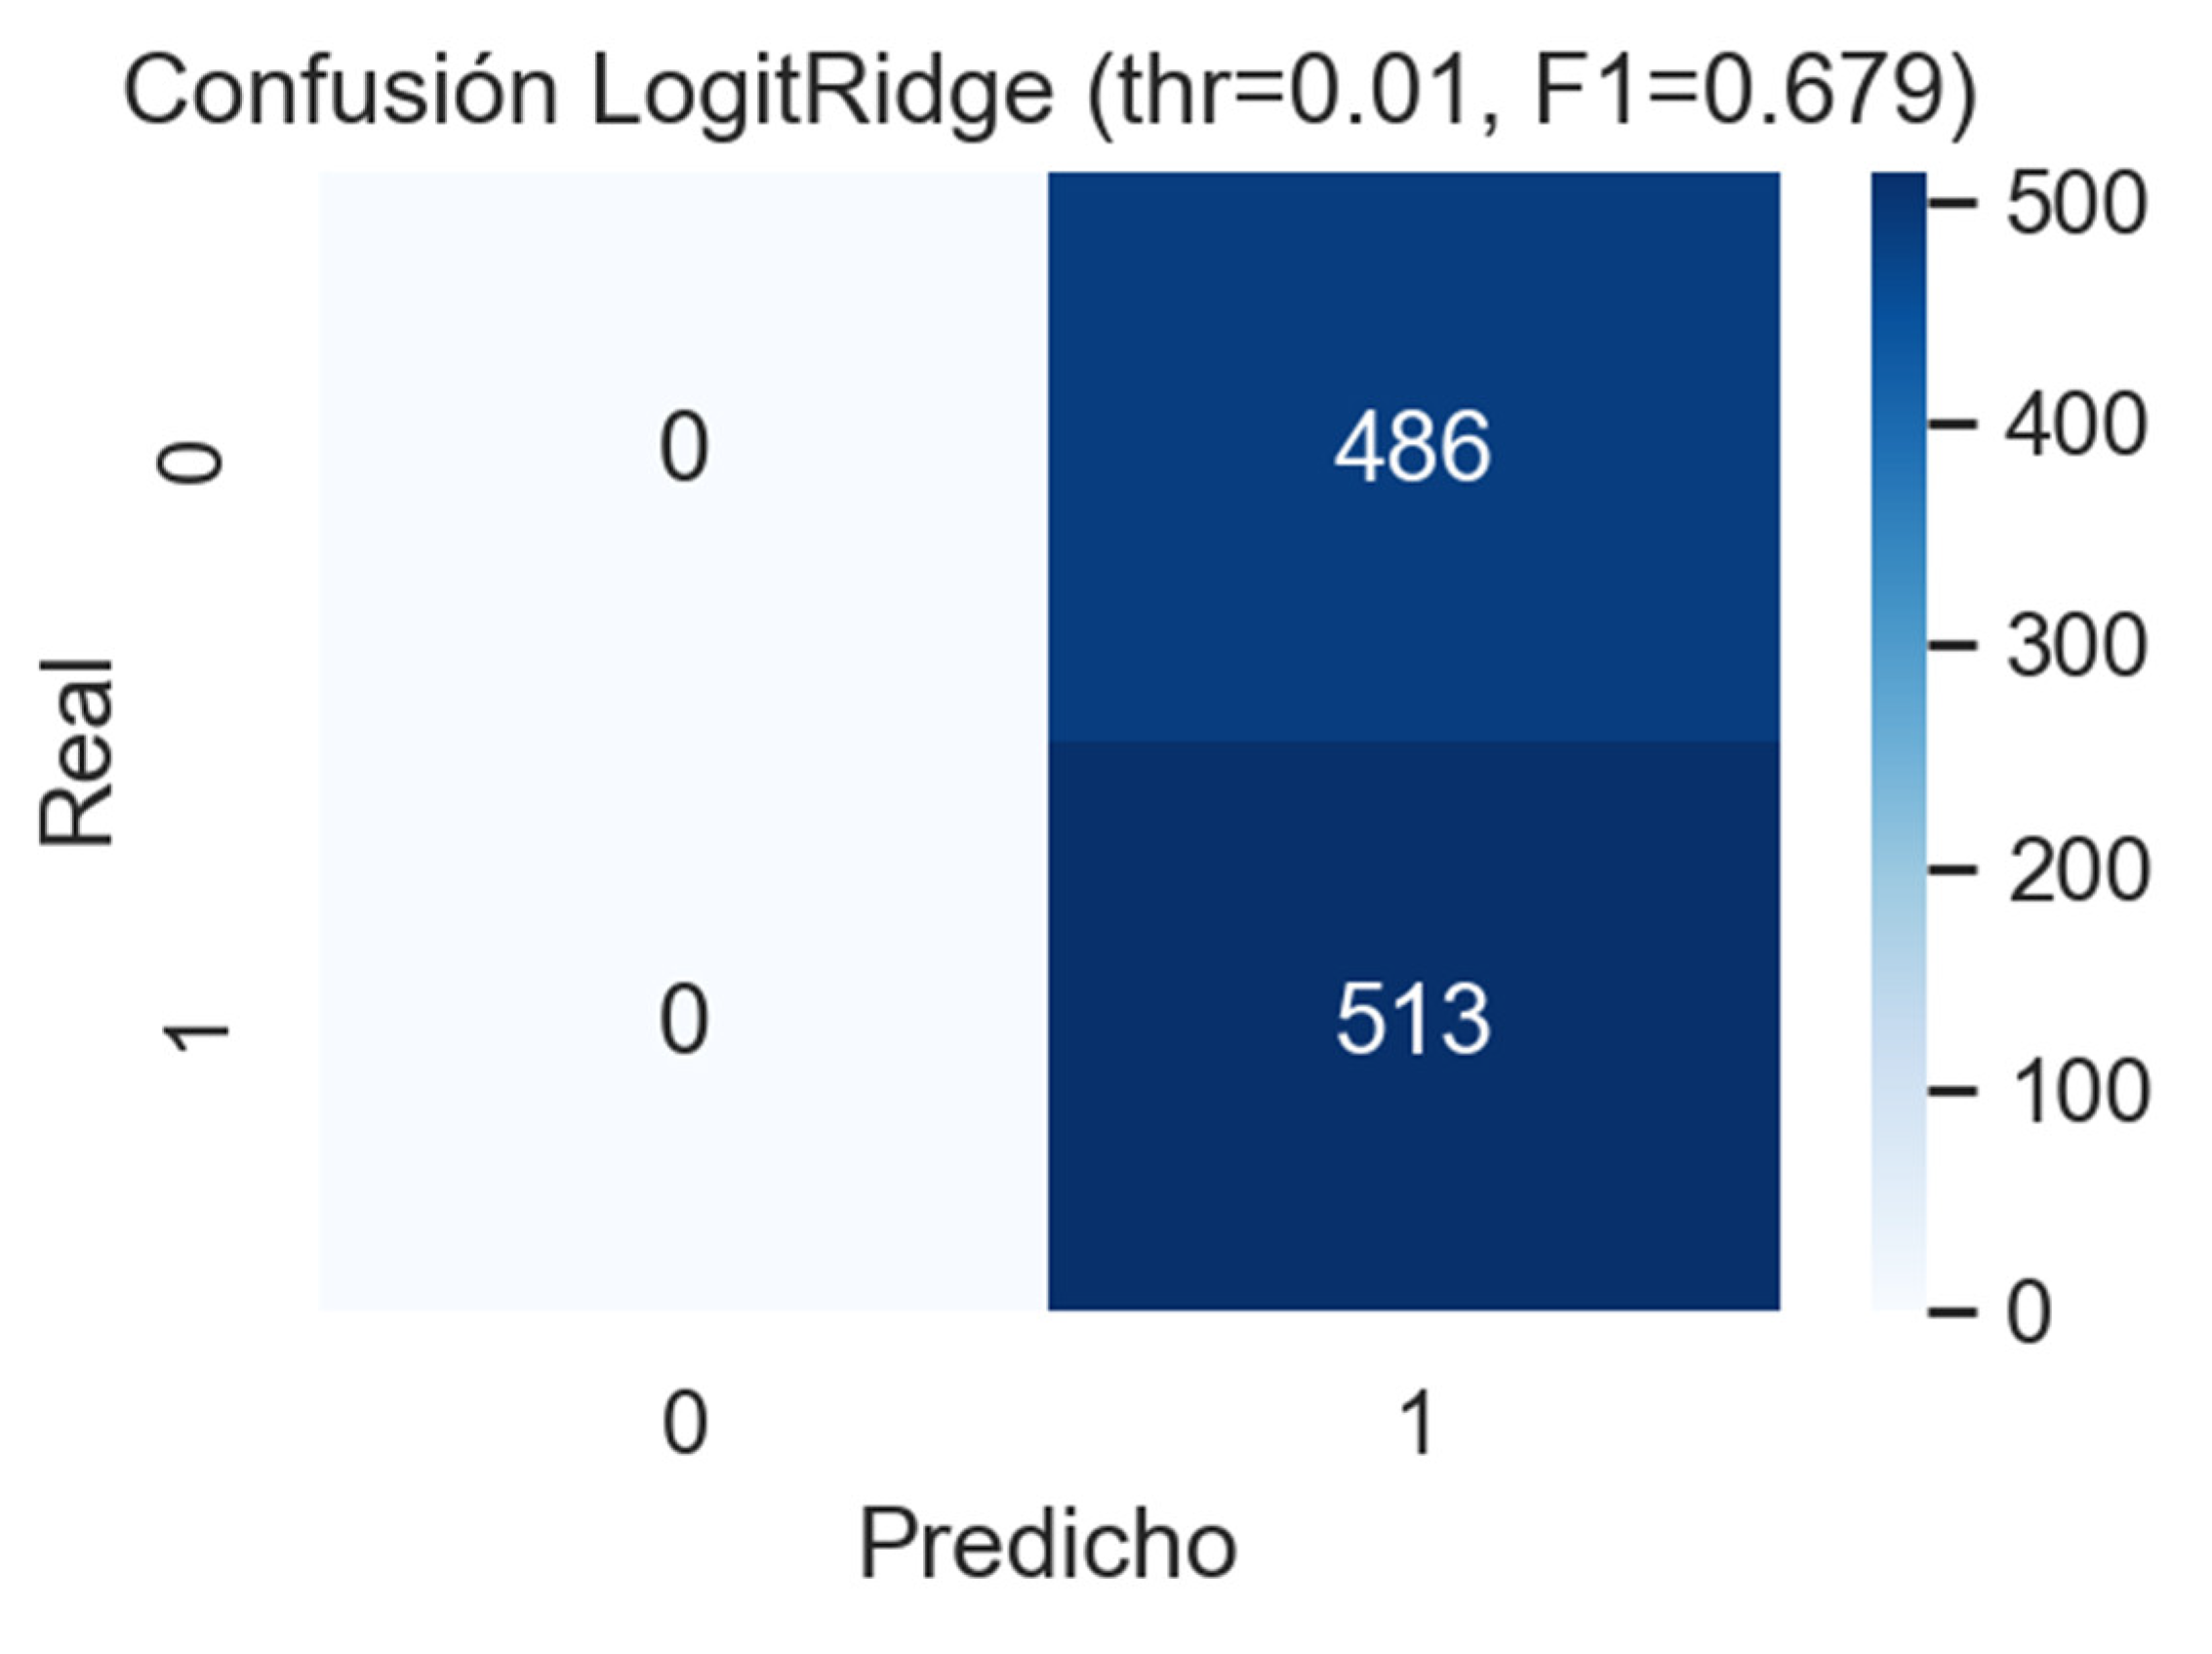
Figure 58.
Dopaminergic brain reward system. Schematic representation of the neurobiological circuit underlying reward and economic decision-making. Dopaminergic neurons originating in the ventral tegmental area (VTA) project to the nucleus accumbens, facilitating motivation and reinforcement, while reciprocal connections with the dorsolateral prefrontal cortex (dlPFC) regulate executive inhibition. During reward anticipation, activation in the accumbens increases and dlPFC activity decreases, reflecting diminished inhibitory control and enhanced impulsivity—neural correlates of overconfidence and liquidity illusion in entrepreneurial contexts. Source: Adapted from Kuhnen & Knutson (2005); Bermejo et al. (2011).
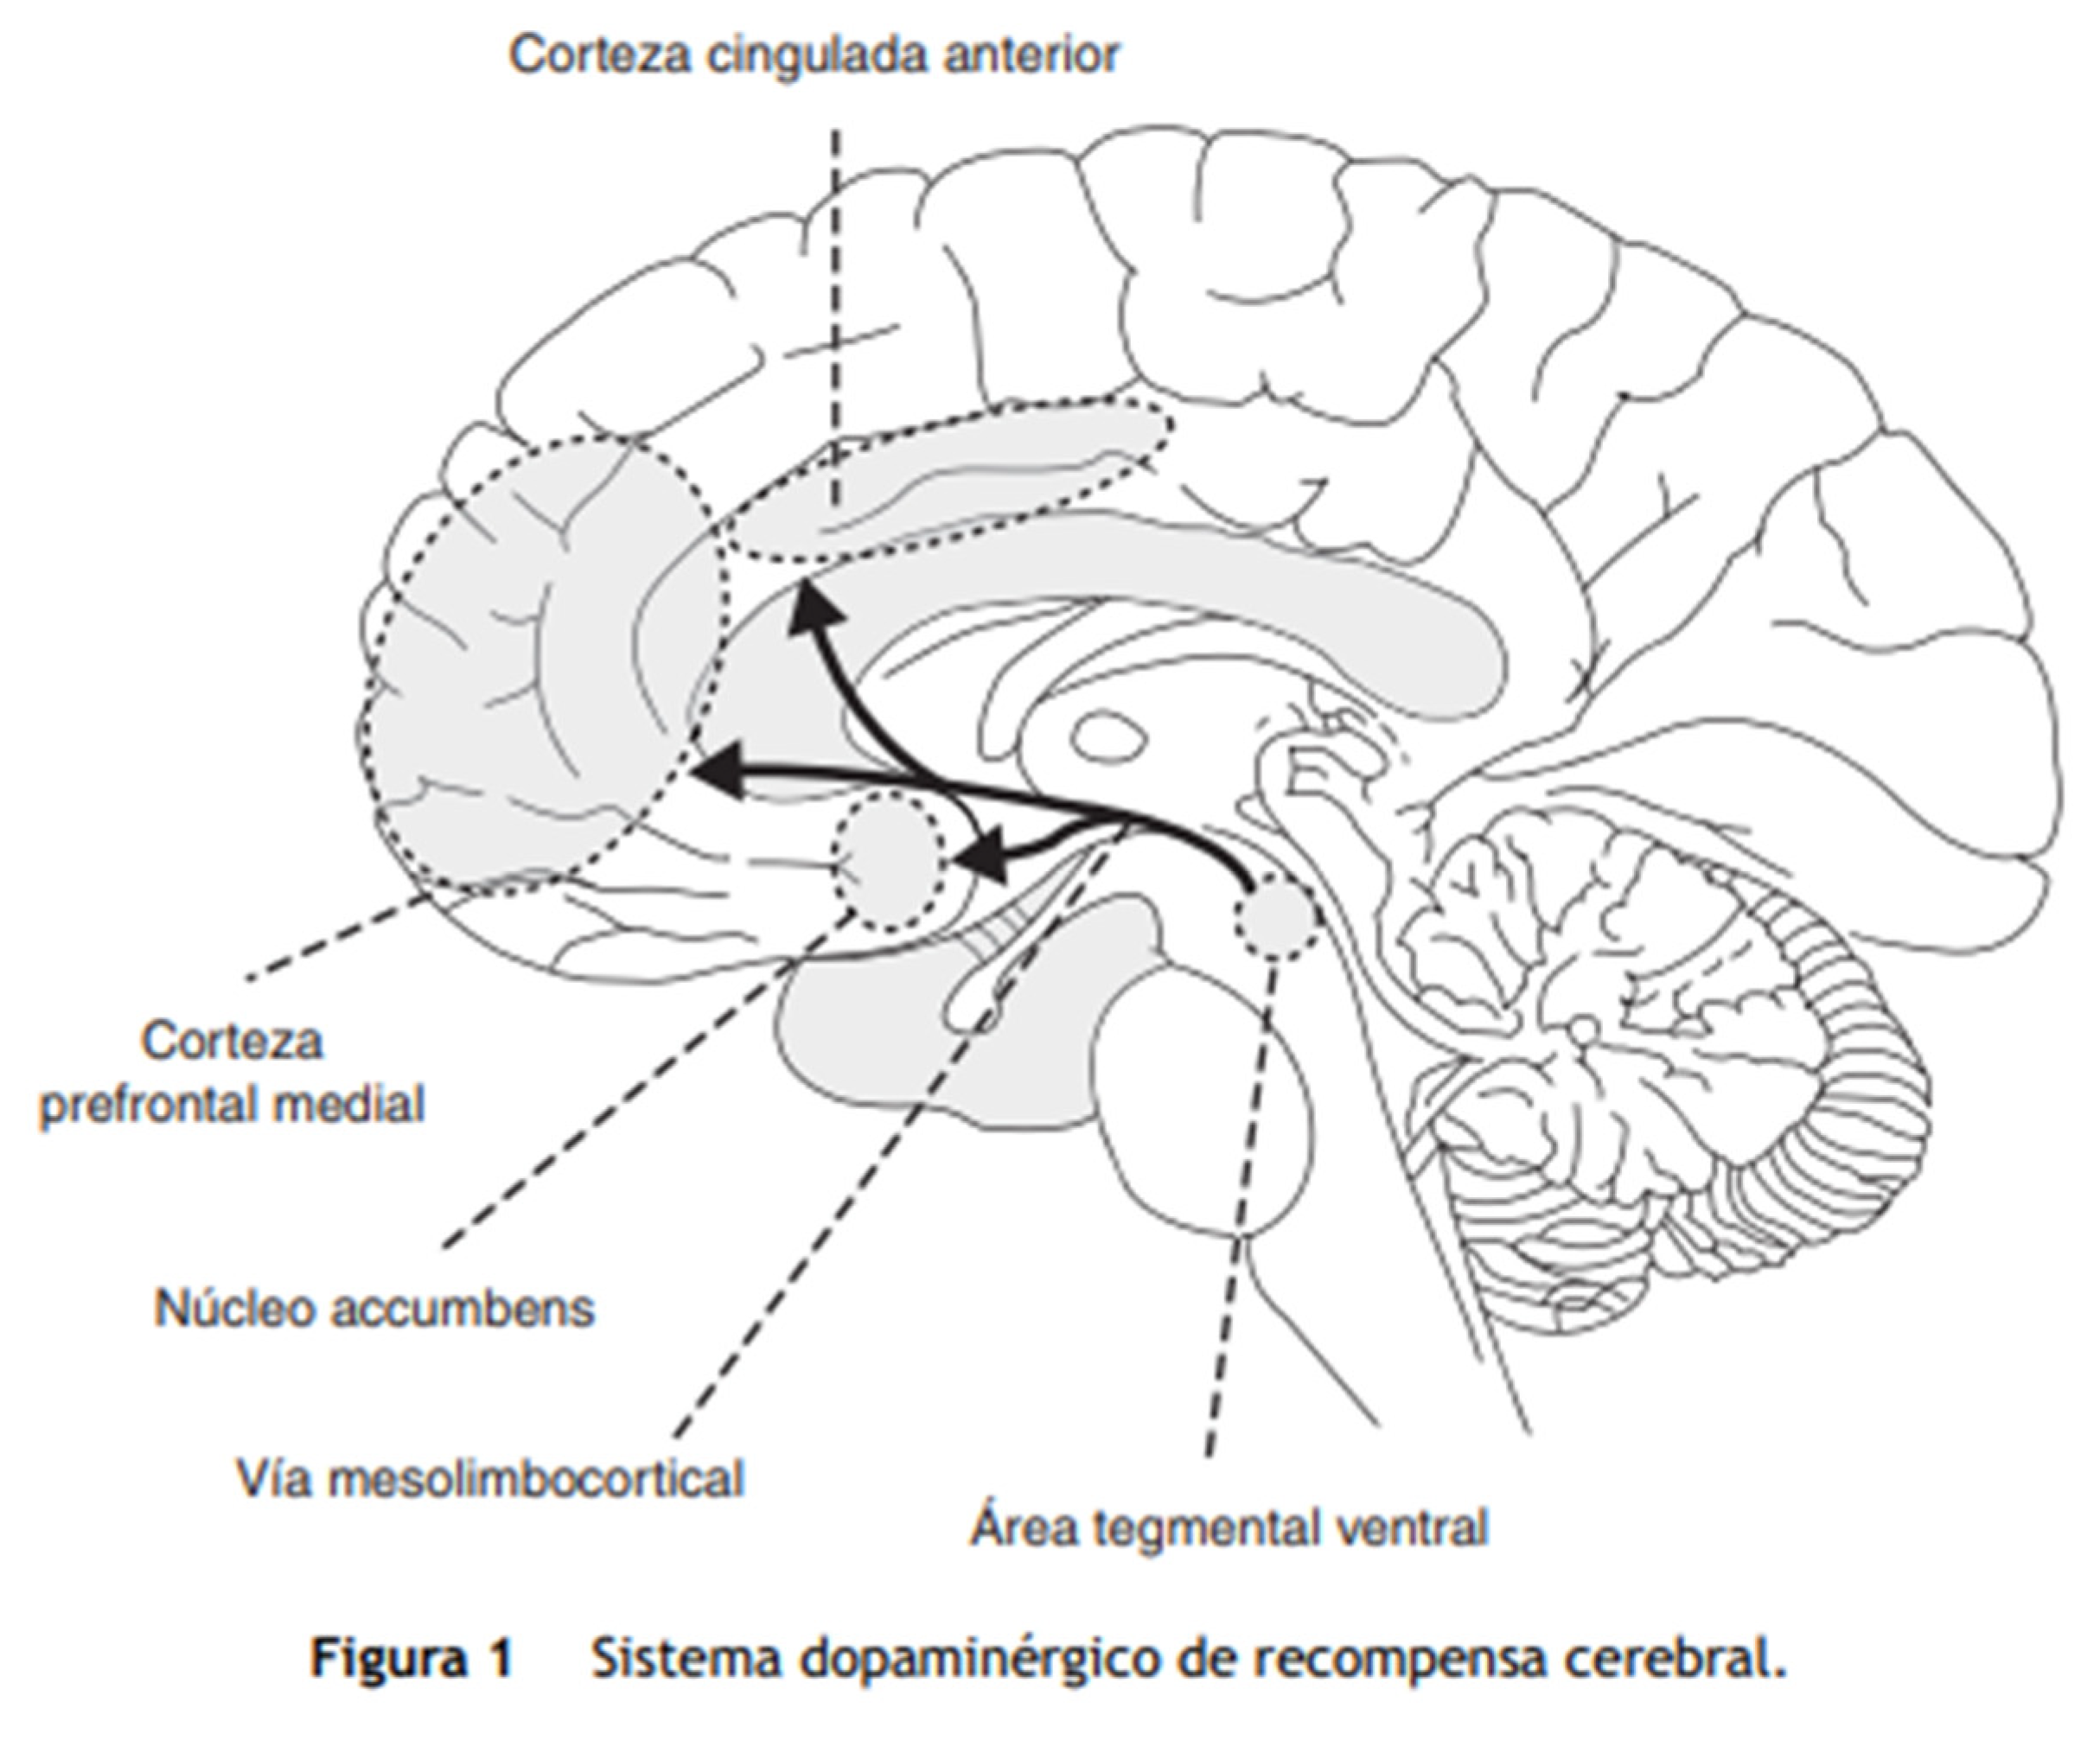
Figure 59.
Signaling pathways mediated by serotonergic receptors. The diagram represents the serotonergic signaling system, where 5-HT receptors modulate emotional stability and impulse inhibition through projections from the raphe nuclei to cortical and subcortical regions. Reduced serotonergic tone weakens prefrontal regulation and amplifies the salience of short-term rewards, fostering impulsive, myopic financial decisions. Source: Adapted from Soria Fregozo et al. (2008) and Robbins & Everitt (1999).
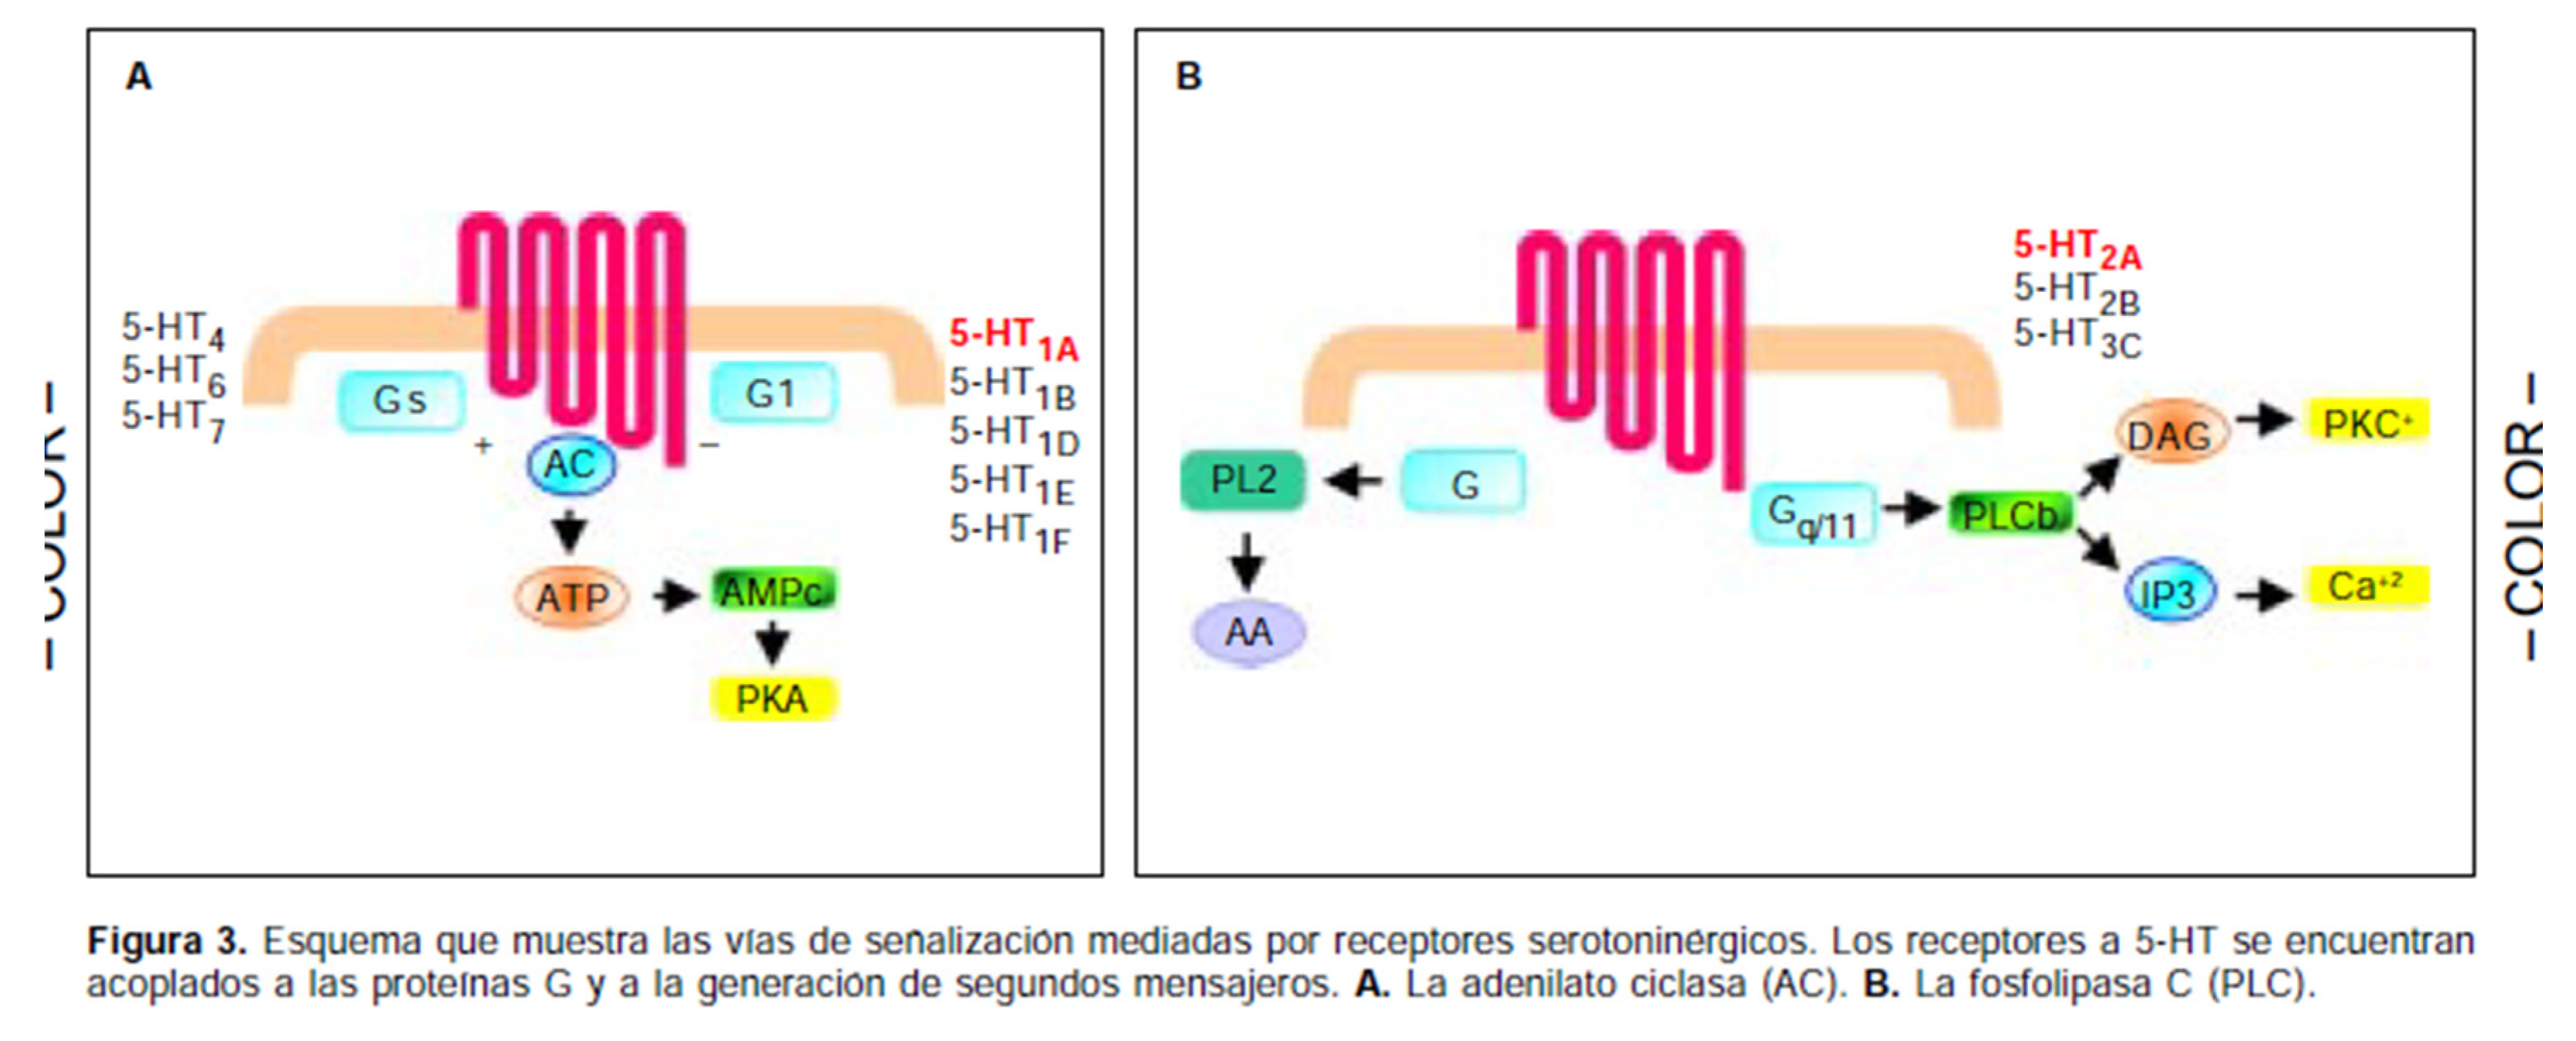
Figure 60.
Alteration of the brain reward system in individuals under stress. Schematic representation of the interaction between norepinephrine, cortisol, and the neural substrates of decision-making. Under stress, heightened activity in the amygdala and locus coeruleus disrupts prefrontal regulation (particularly the dorsolateral prefrontal cortex) and alters dopamine transmission in the nucleus accumbens, leading to impulsive and short-term behavior. The figure illustrates how chronic stress reshapes the reward circuit, reducing deliberative capacity and reinforcing emotional dominance in financial decision-making. Source: Adapted from Arnsten (2009); McEwen (2012); Phelps et al. (2014).
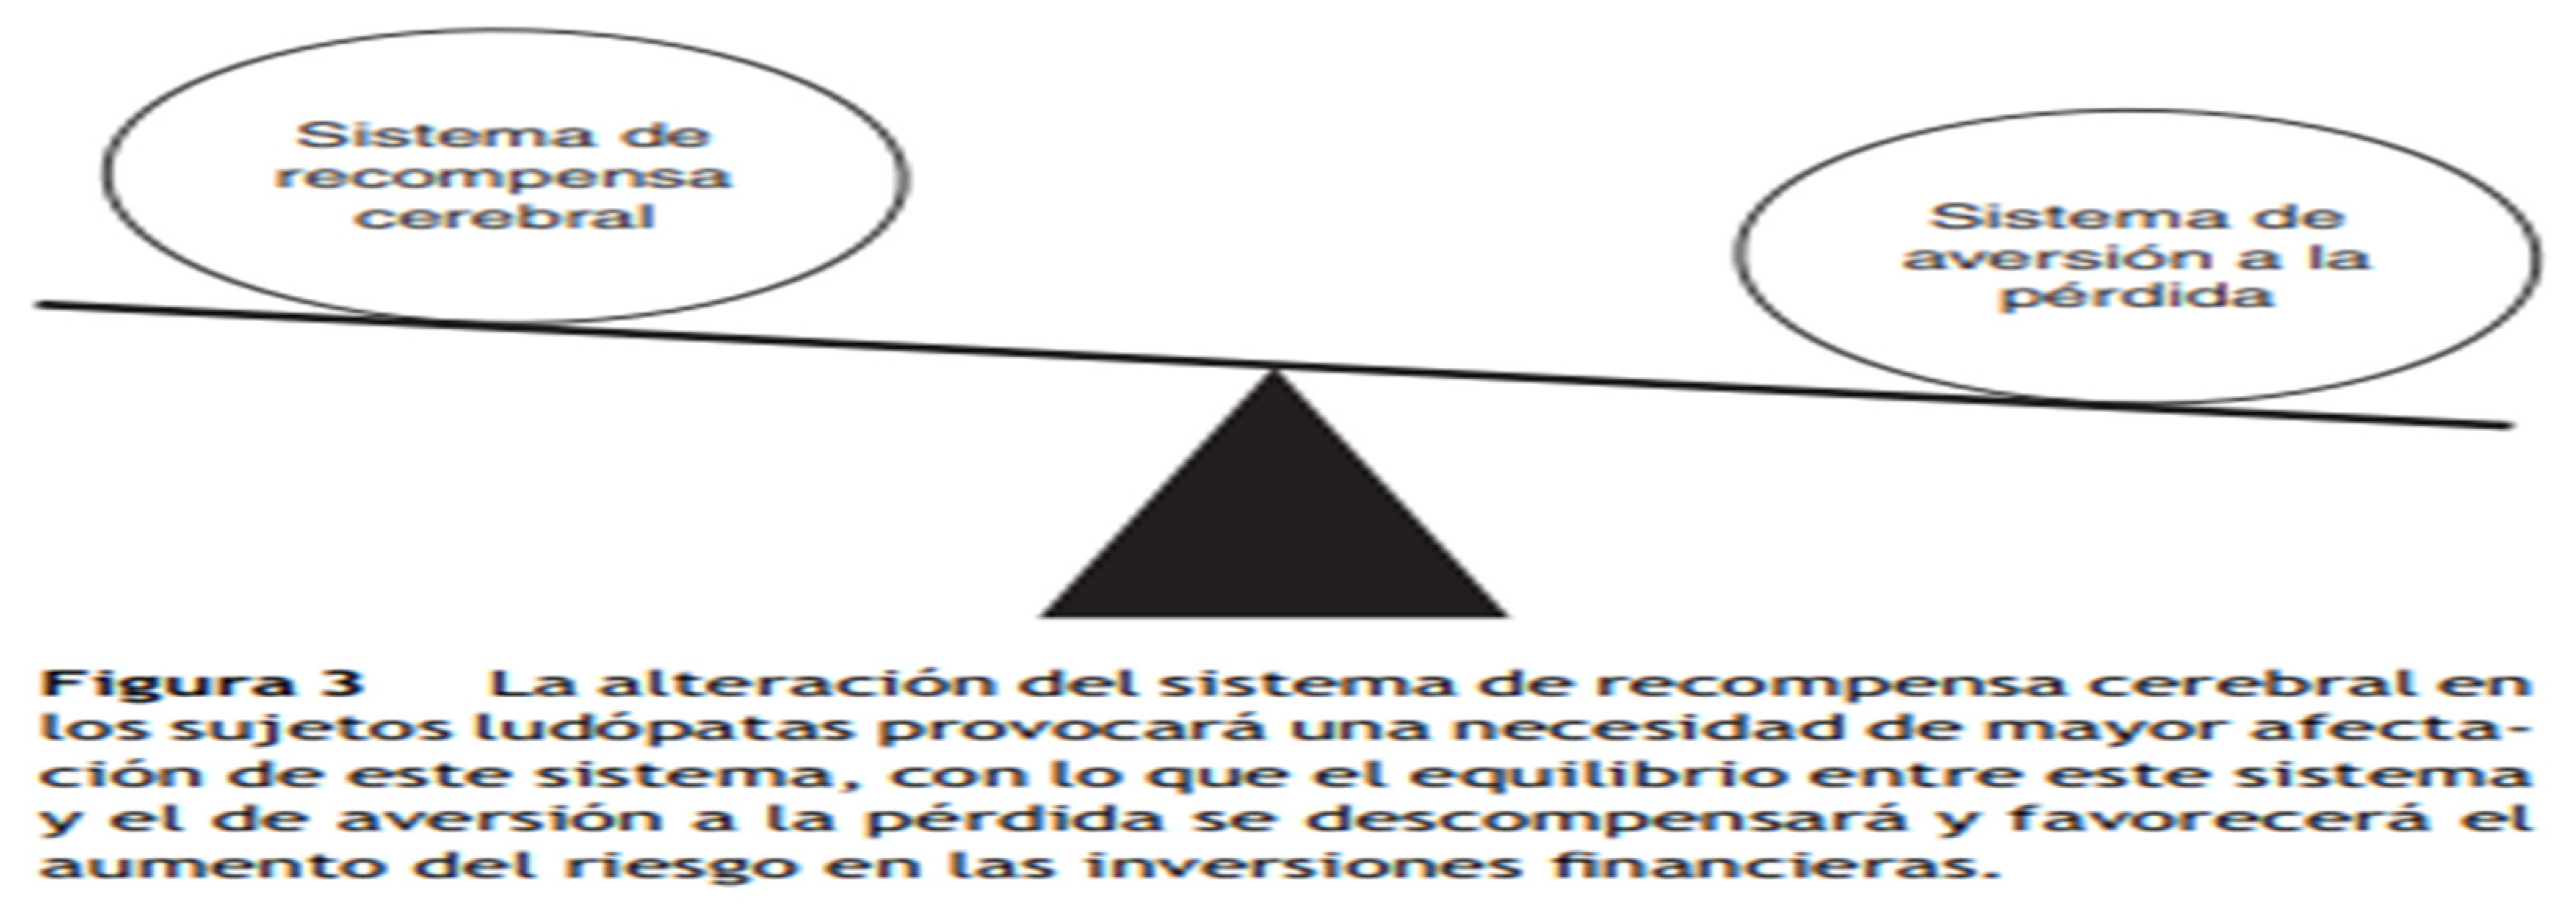
Figure 61.
Optical illusion and cognitive biases in the perception of reality. Illustration representing how perceptual distortions mimic cognitive biases in financial contexts: what appears stable may in fact be unstable. The visual metaphor parallels the misperception of liquidity and control that drives overexpansion under false certainty. Source: Author’s creation.
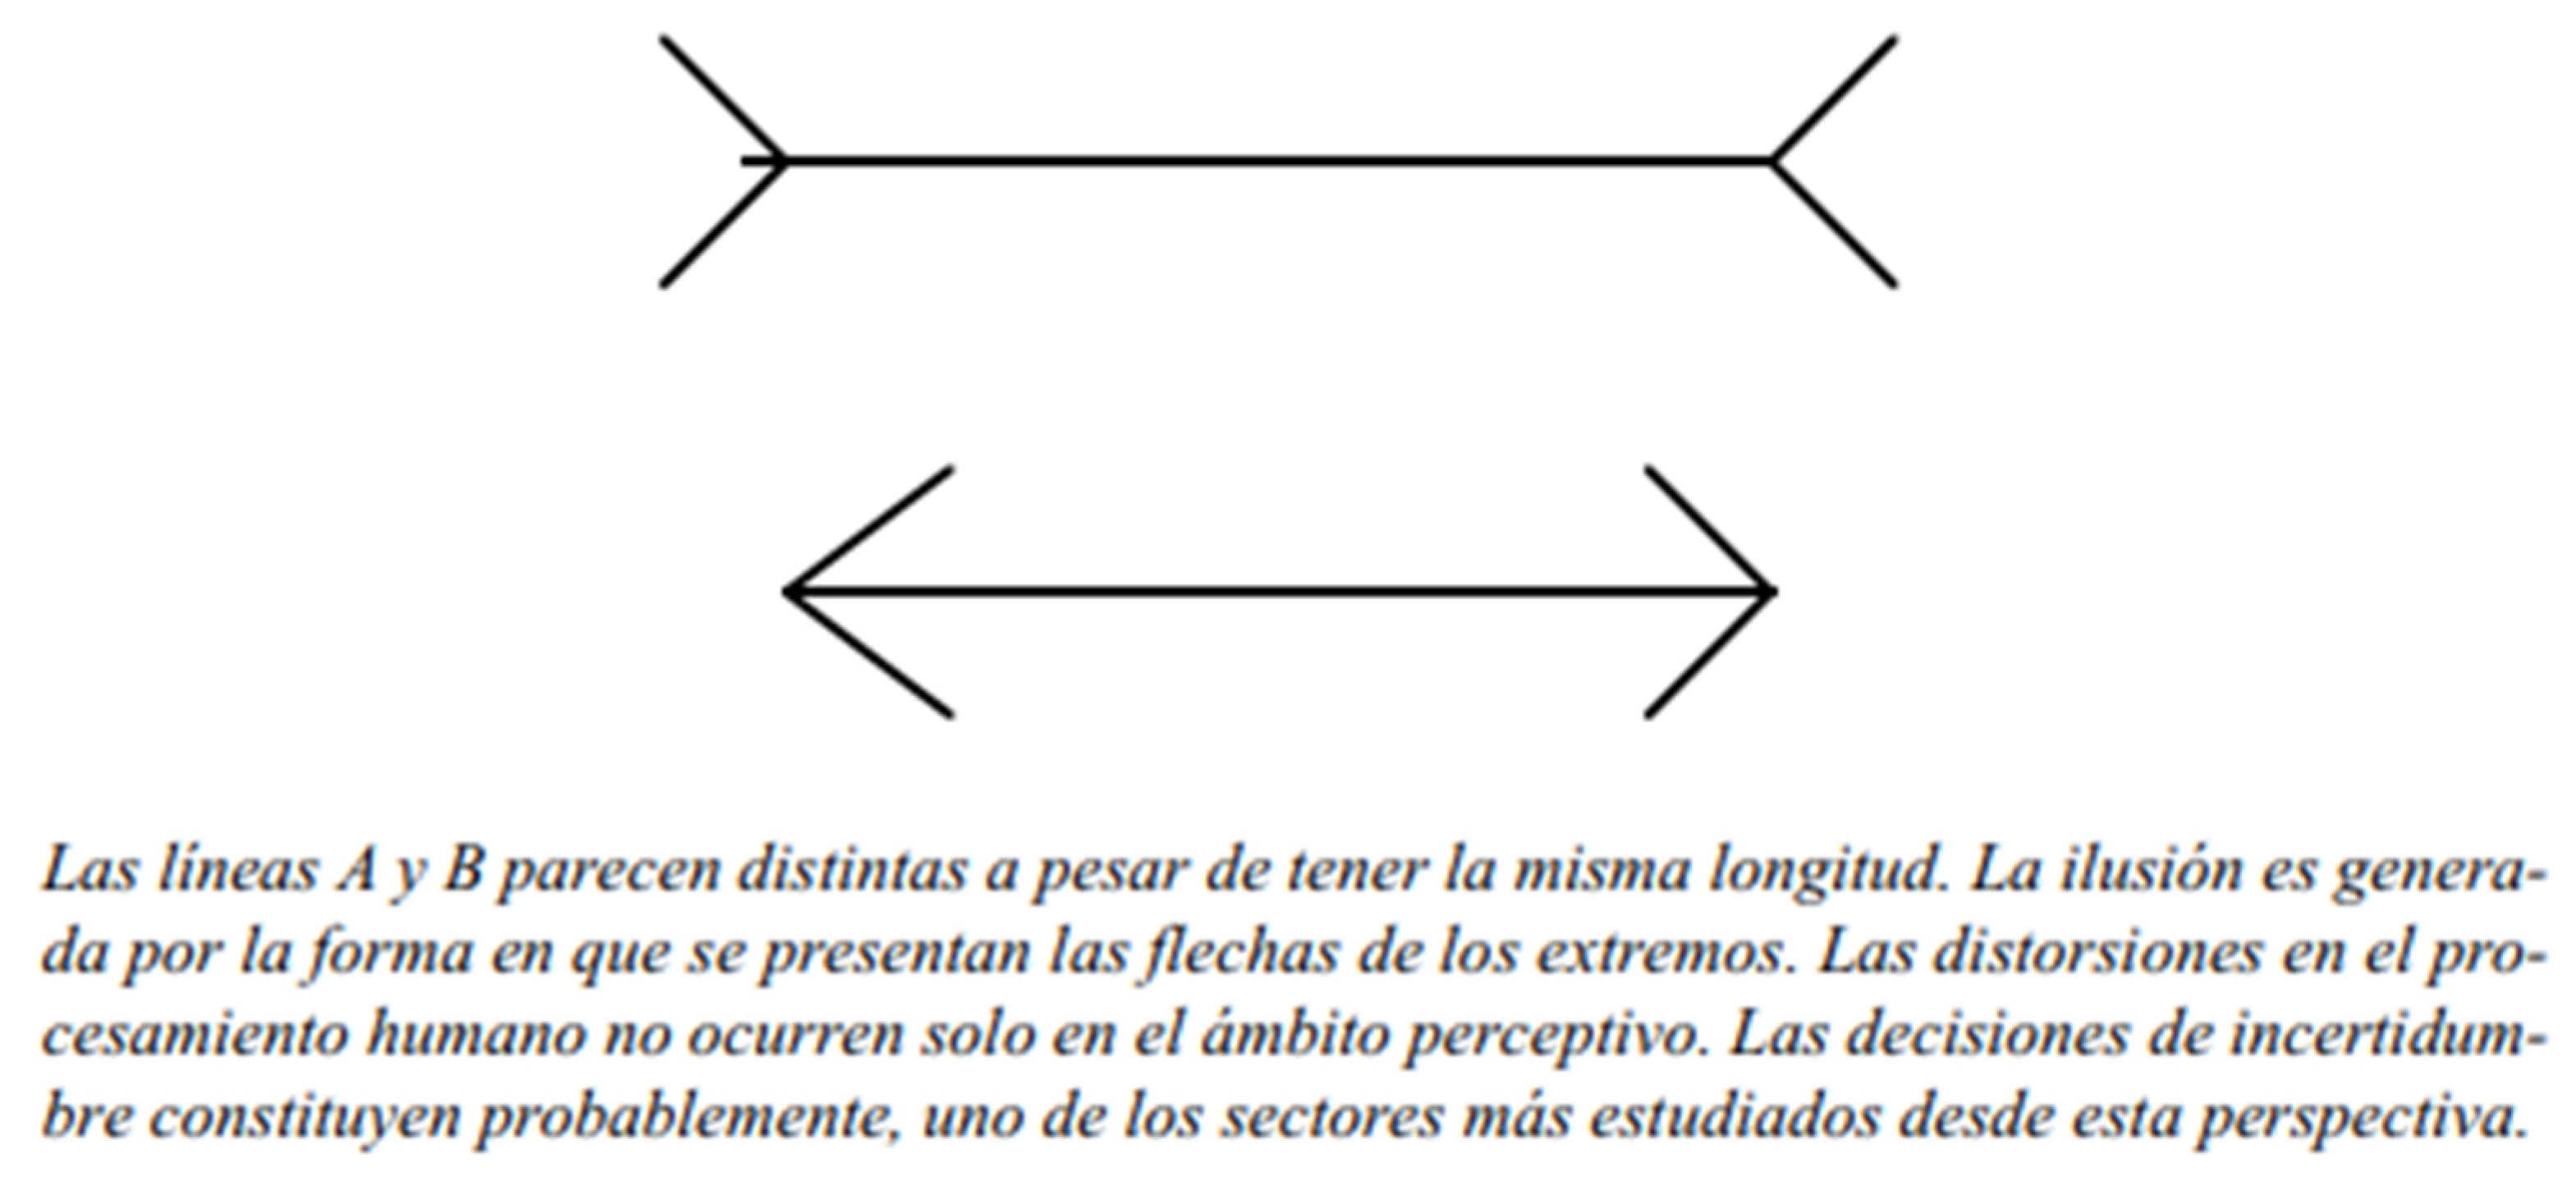
Figure 62.
Relative importance of variables according to the XGBoost/Gradient Boosting algorithm. Traditional financial ratios, such as liquidity and leverage, dominate predictive relevance, but interactions involving behavioral biases show complementary explanatory value in distress prediction. Source: Author’s elaboration (n = 999 companies).
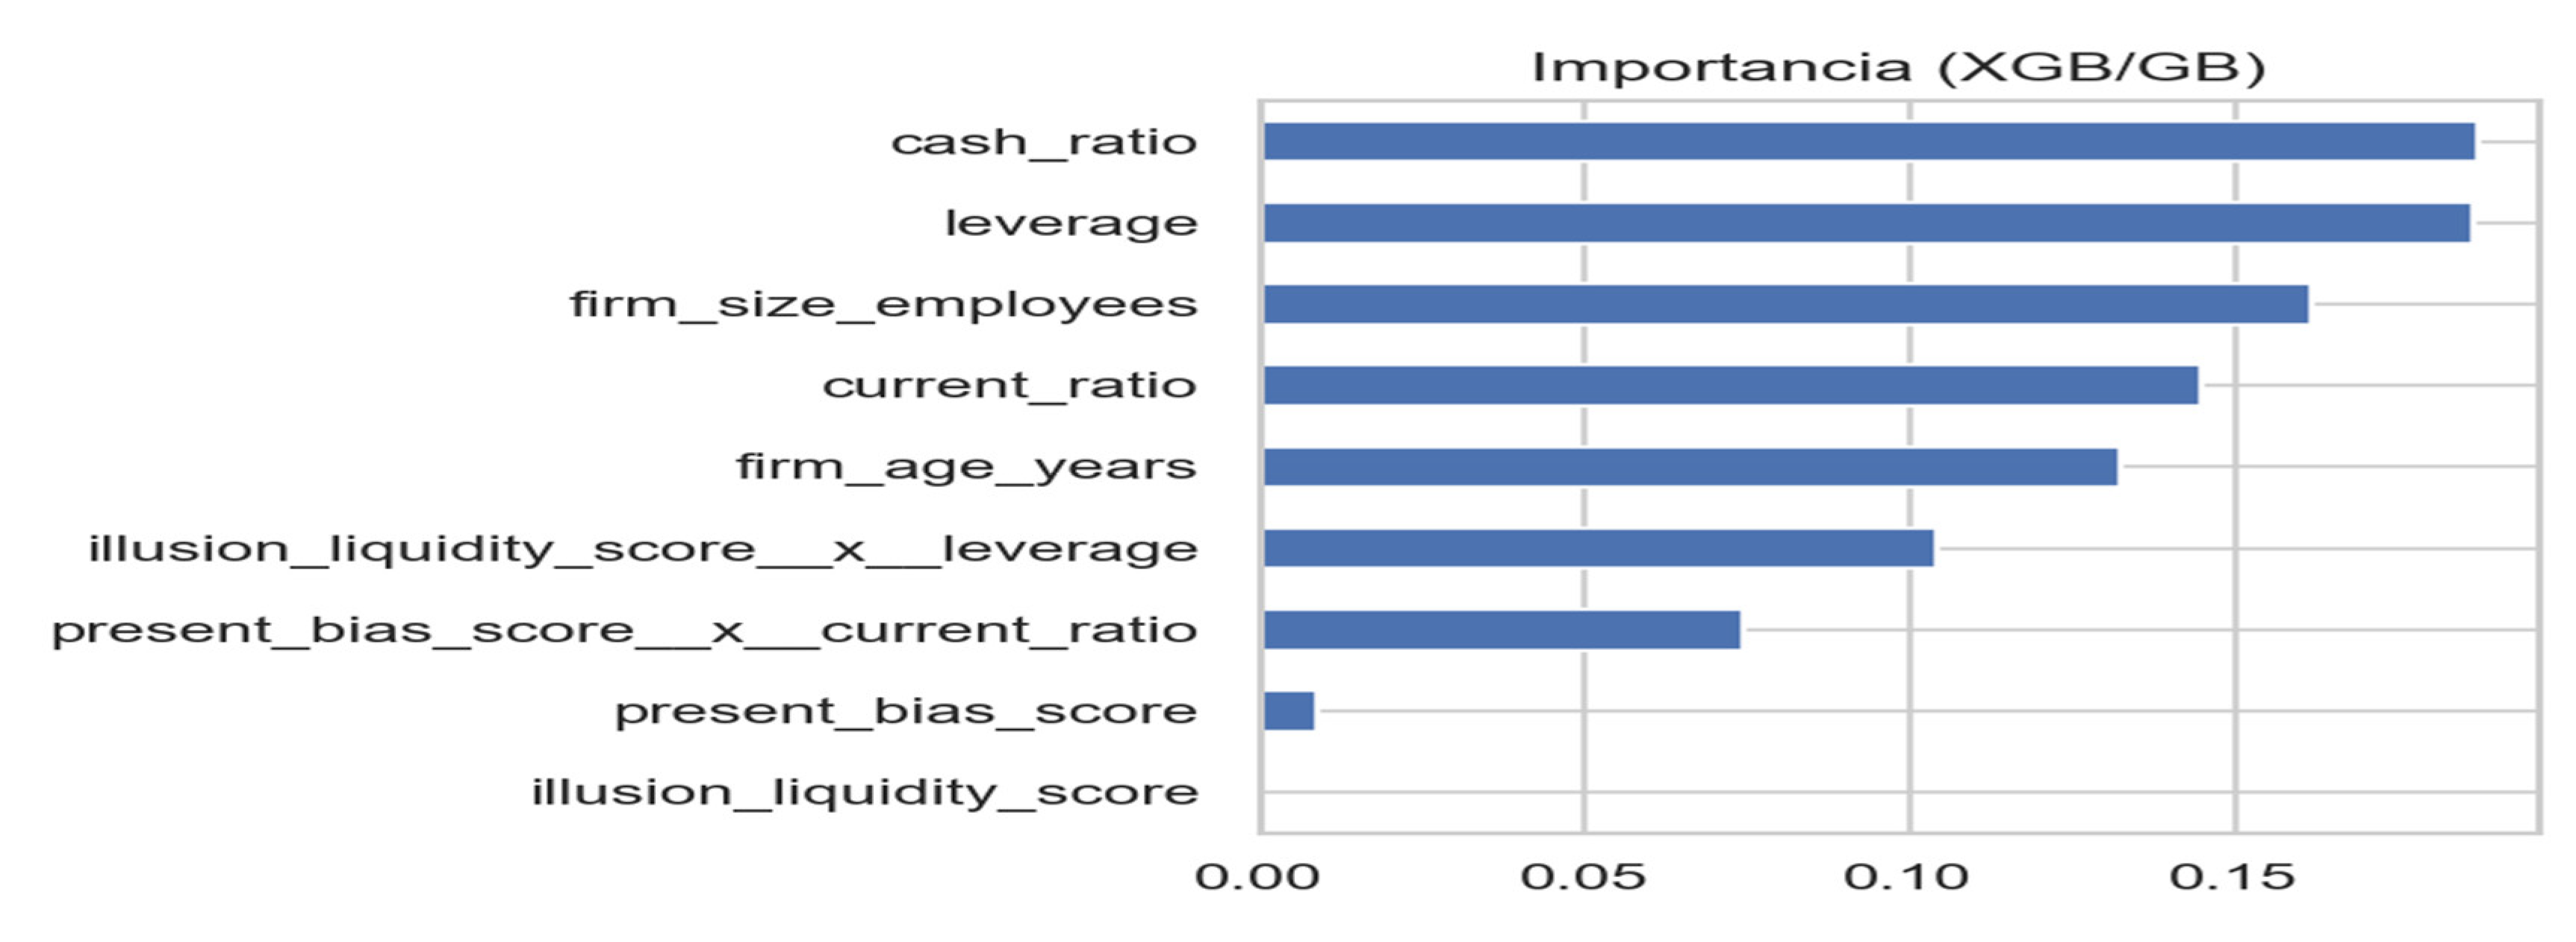
Figure 63.
OLS R² by subgroup. Large and young firms show higher explanatory power, consistent with greater financial dynamism.
Figure 63.
OLS R² by subgroup. Large and young firms show higher explanatory power, consistent with greater financial dynamism.
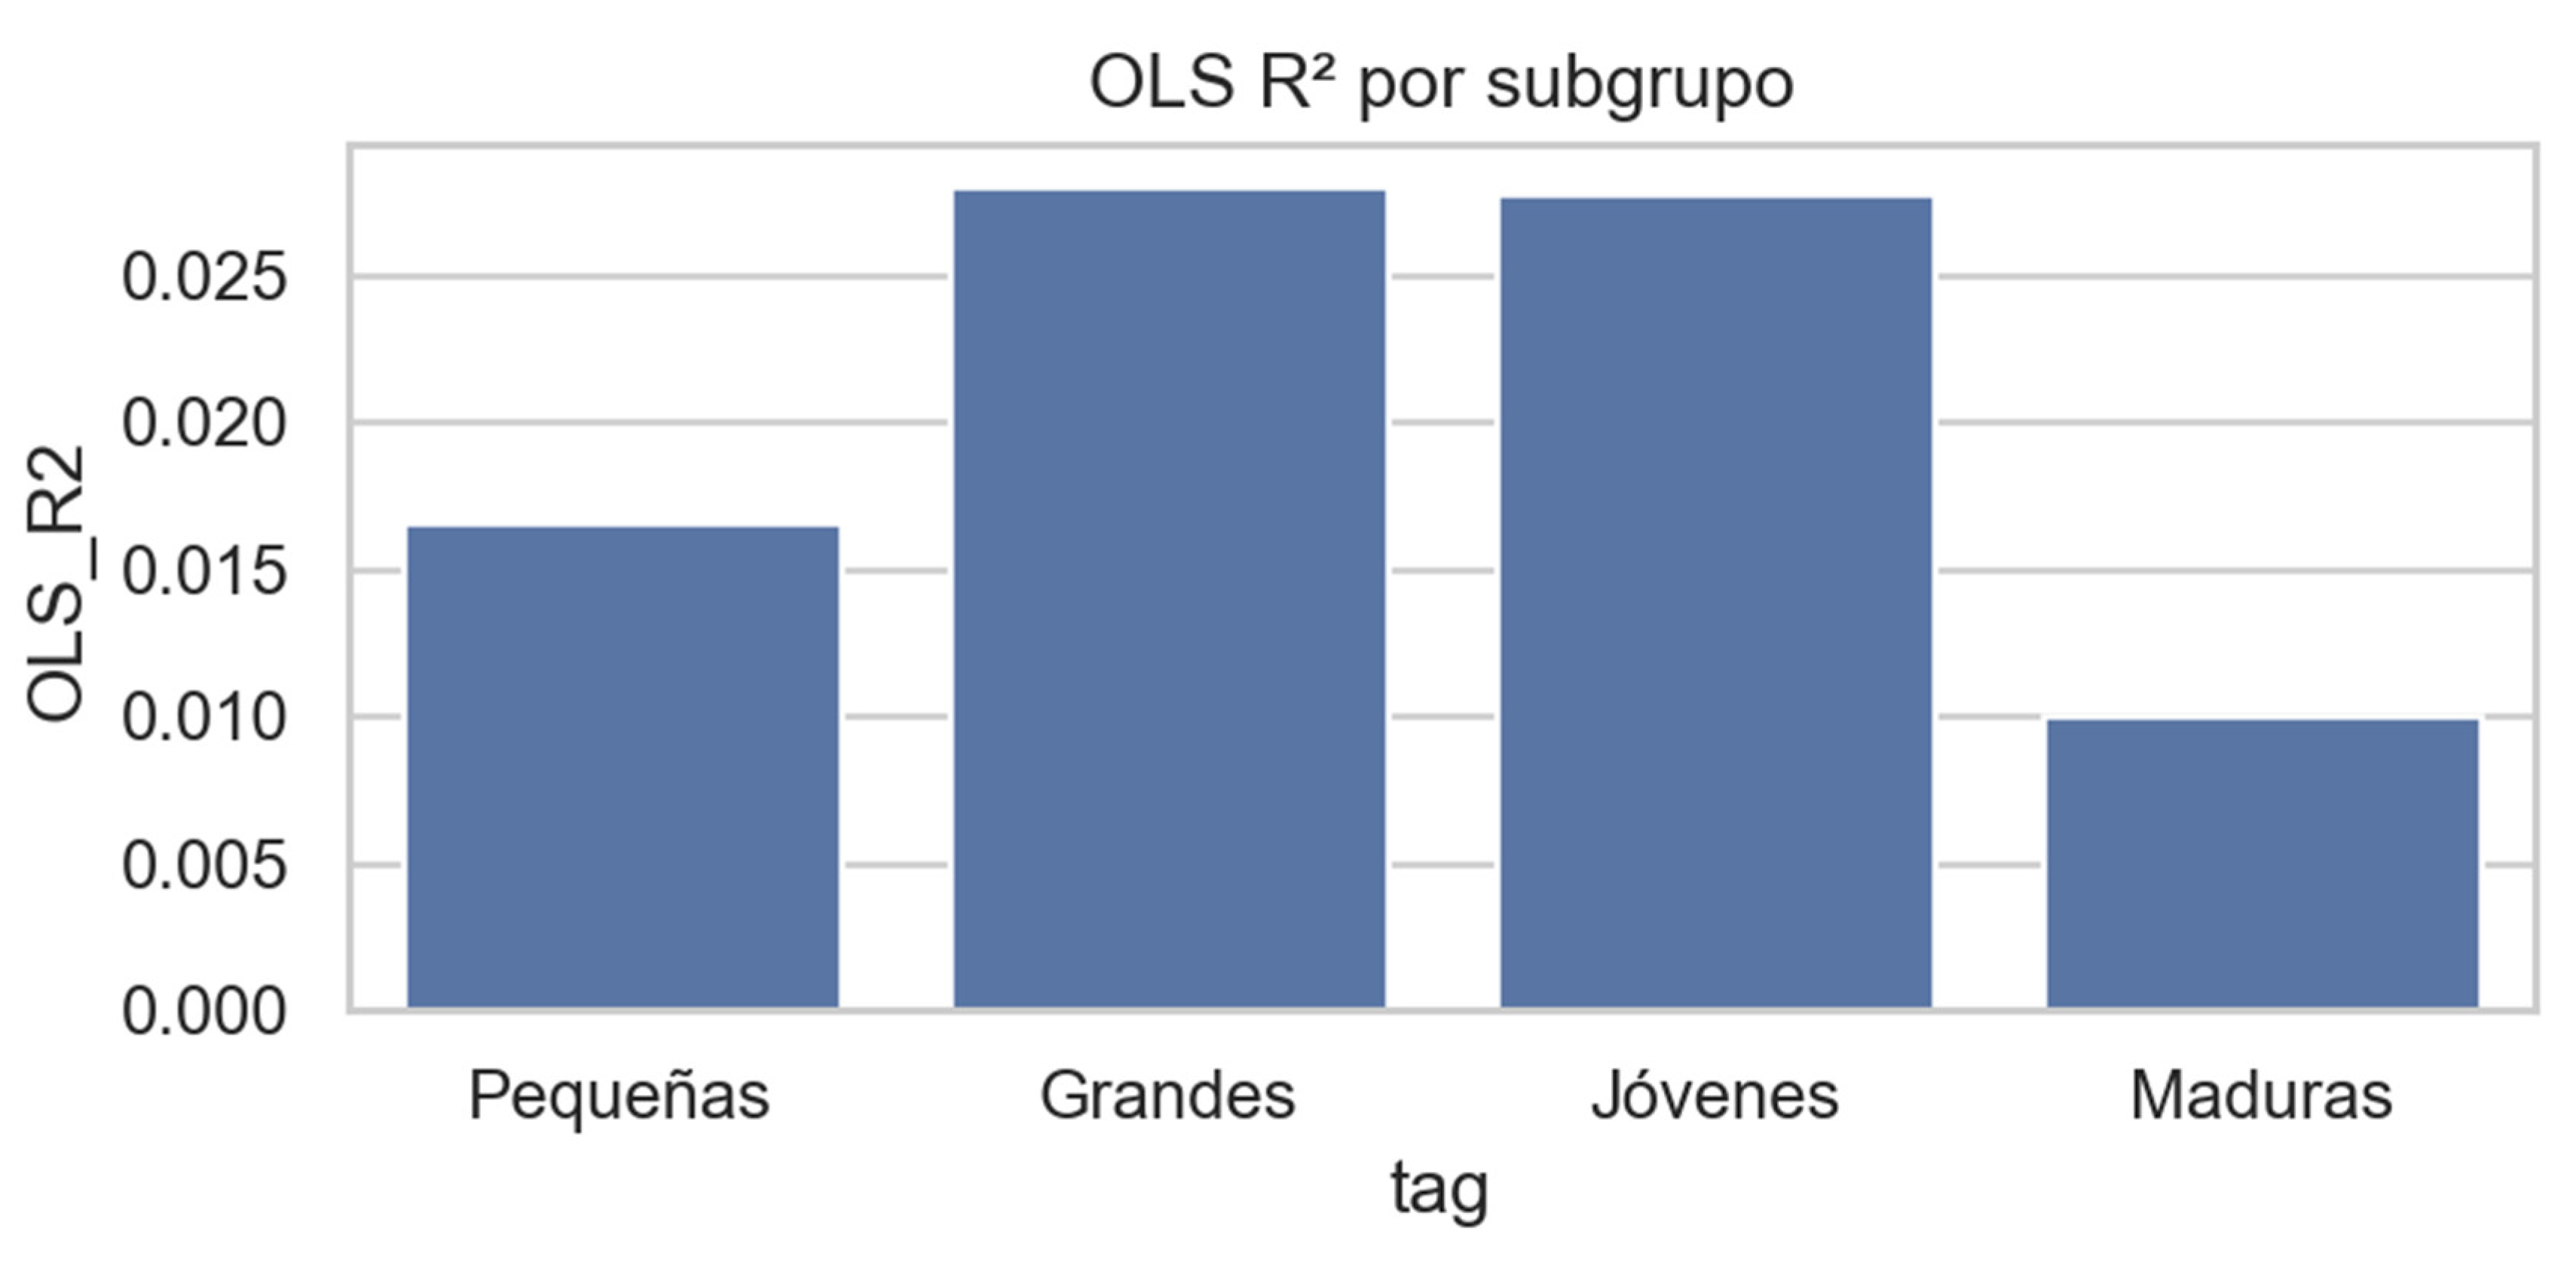
Figure 64.
AUC (LR) by subgroup (reg). Linear regressions display marginally higher discriminatory capacity for large firms.
Figure 64.
AUC (LR) by subgroup (reg). Linear regressions display marginally higher discriminatory capacity for large firms.
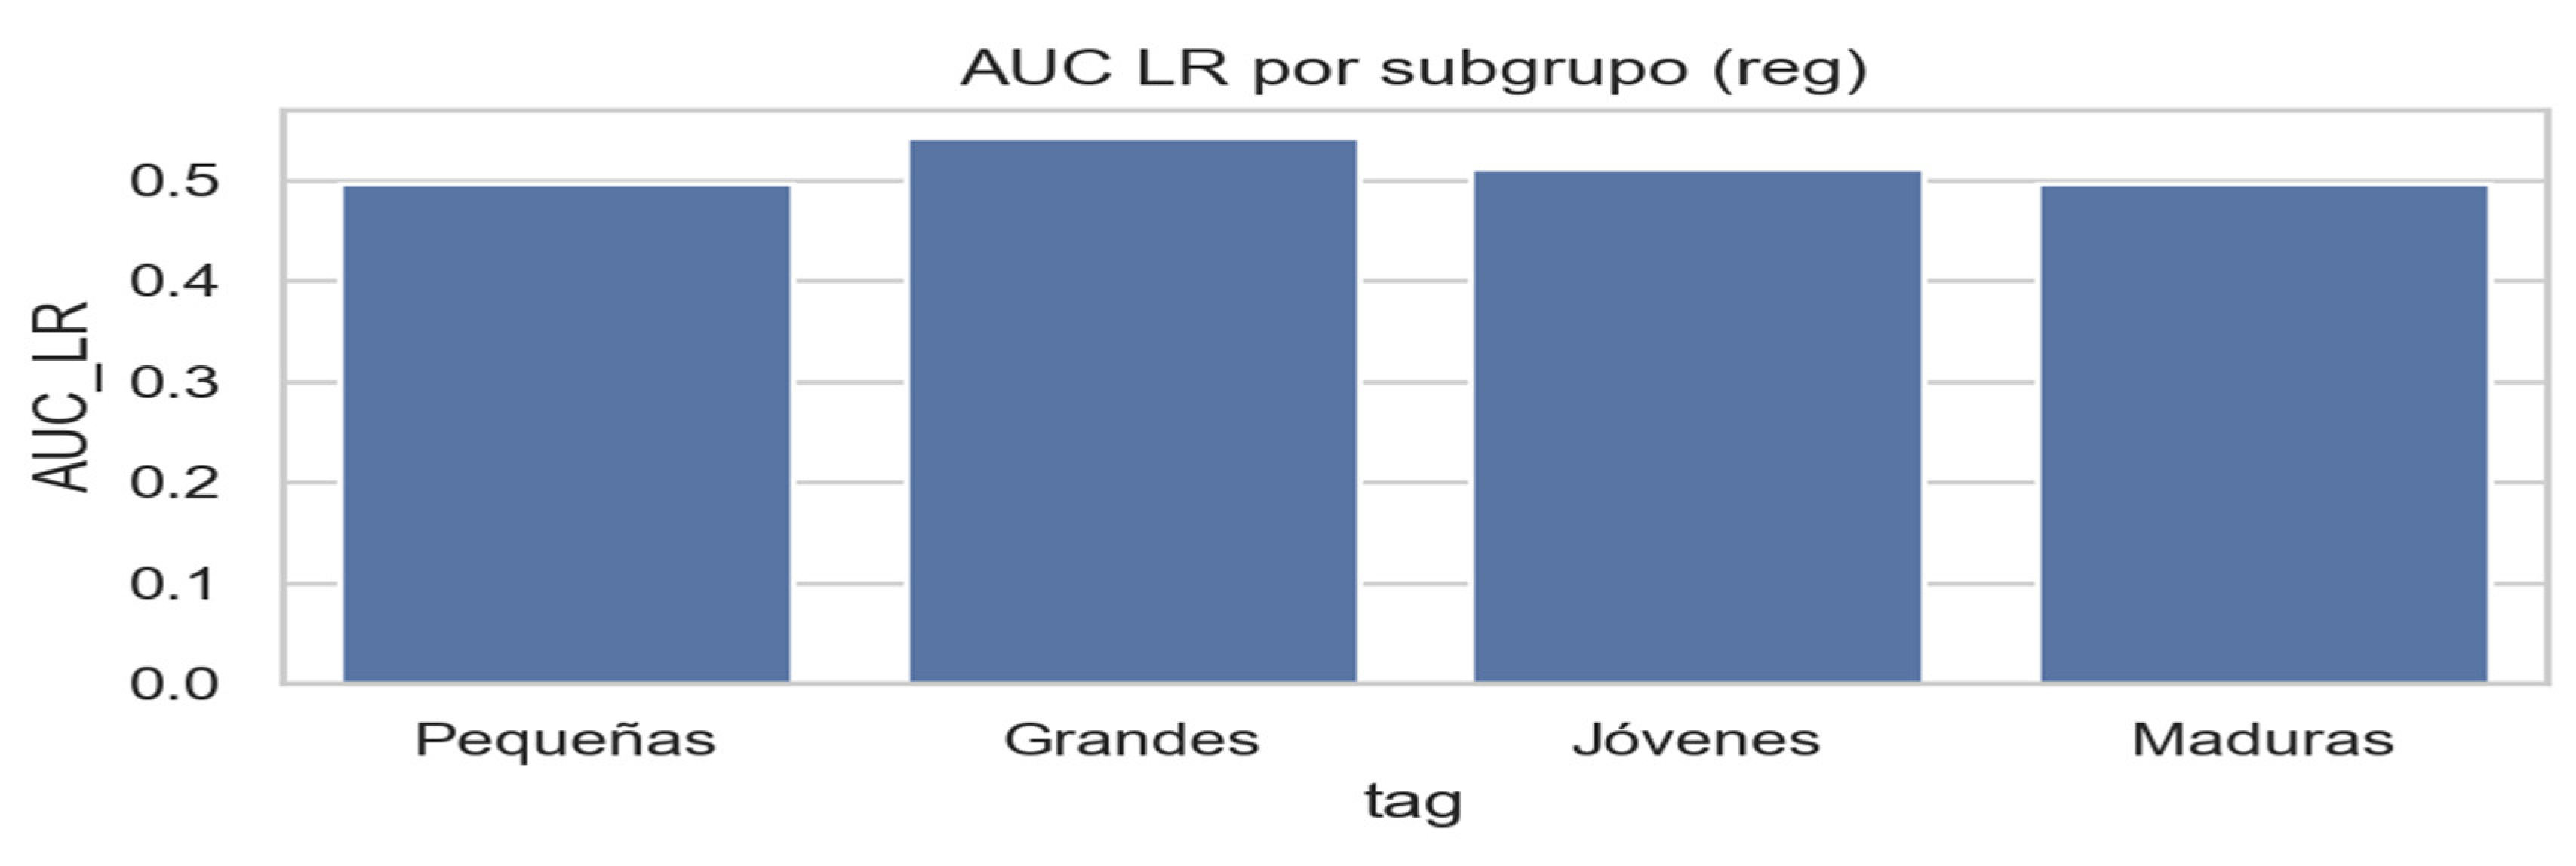
Figure 65.
AUC by subgroup (LR). Logistic regressions reinforce the same pattern of mild superiority in larger and younger firms.
Figure 65.
AUC by subgroup (LR). Logistic regressions reinforce the same pattern of mild superiority in larger and younger firms.
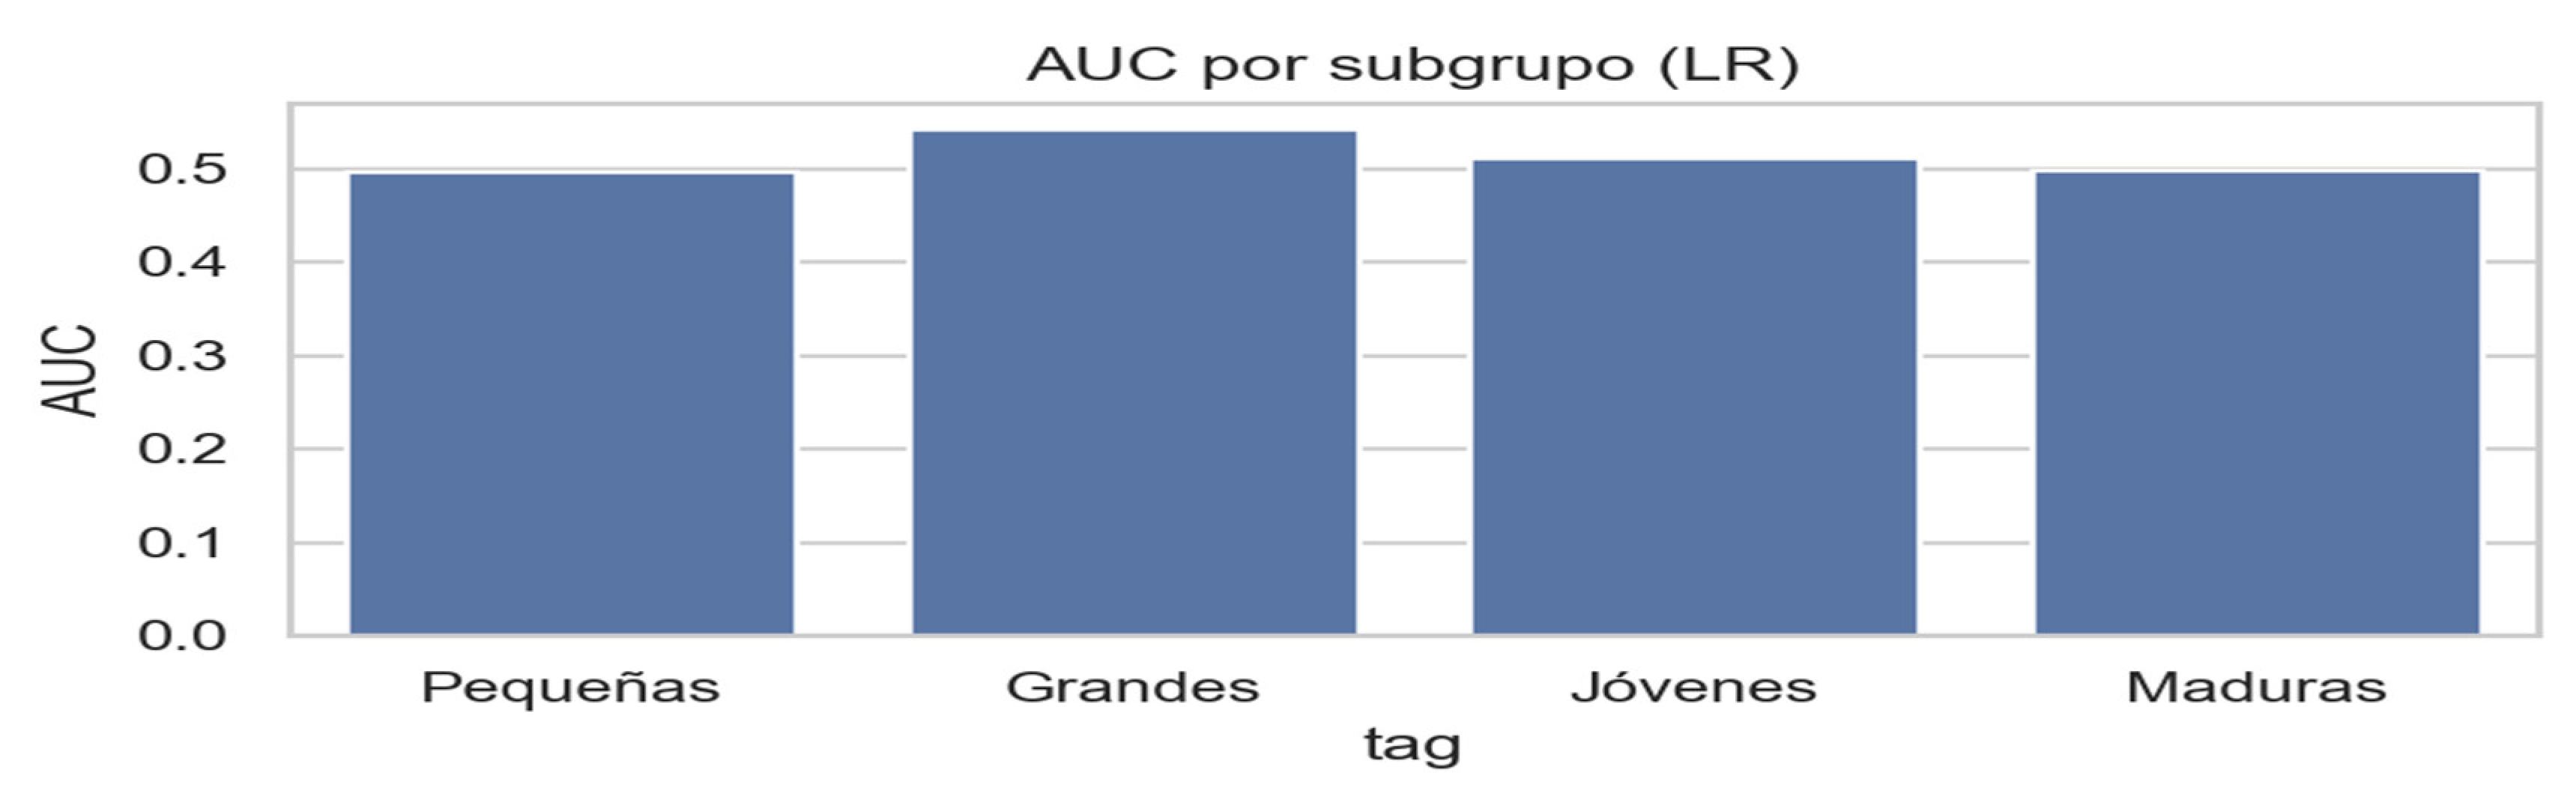
Figure 66.
Average Precision (AP) by subgroup (LR). Precision–recall performance peaks among large and young firms, confirming heterogeneity across the sample. Source: Author’s elaboration based on 999 SMEs (Financial Lobster Model empirical validation).
Figure 66.
Average Precision (AP) by subgroup (LR). Precision–recall performance peaks among large and young firms, confirming heterogeneity across the sample. Source: Author’s elaboration based on 999 SMEs (Financial Lobster Model empirical validation).
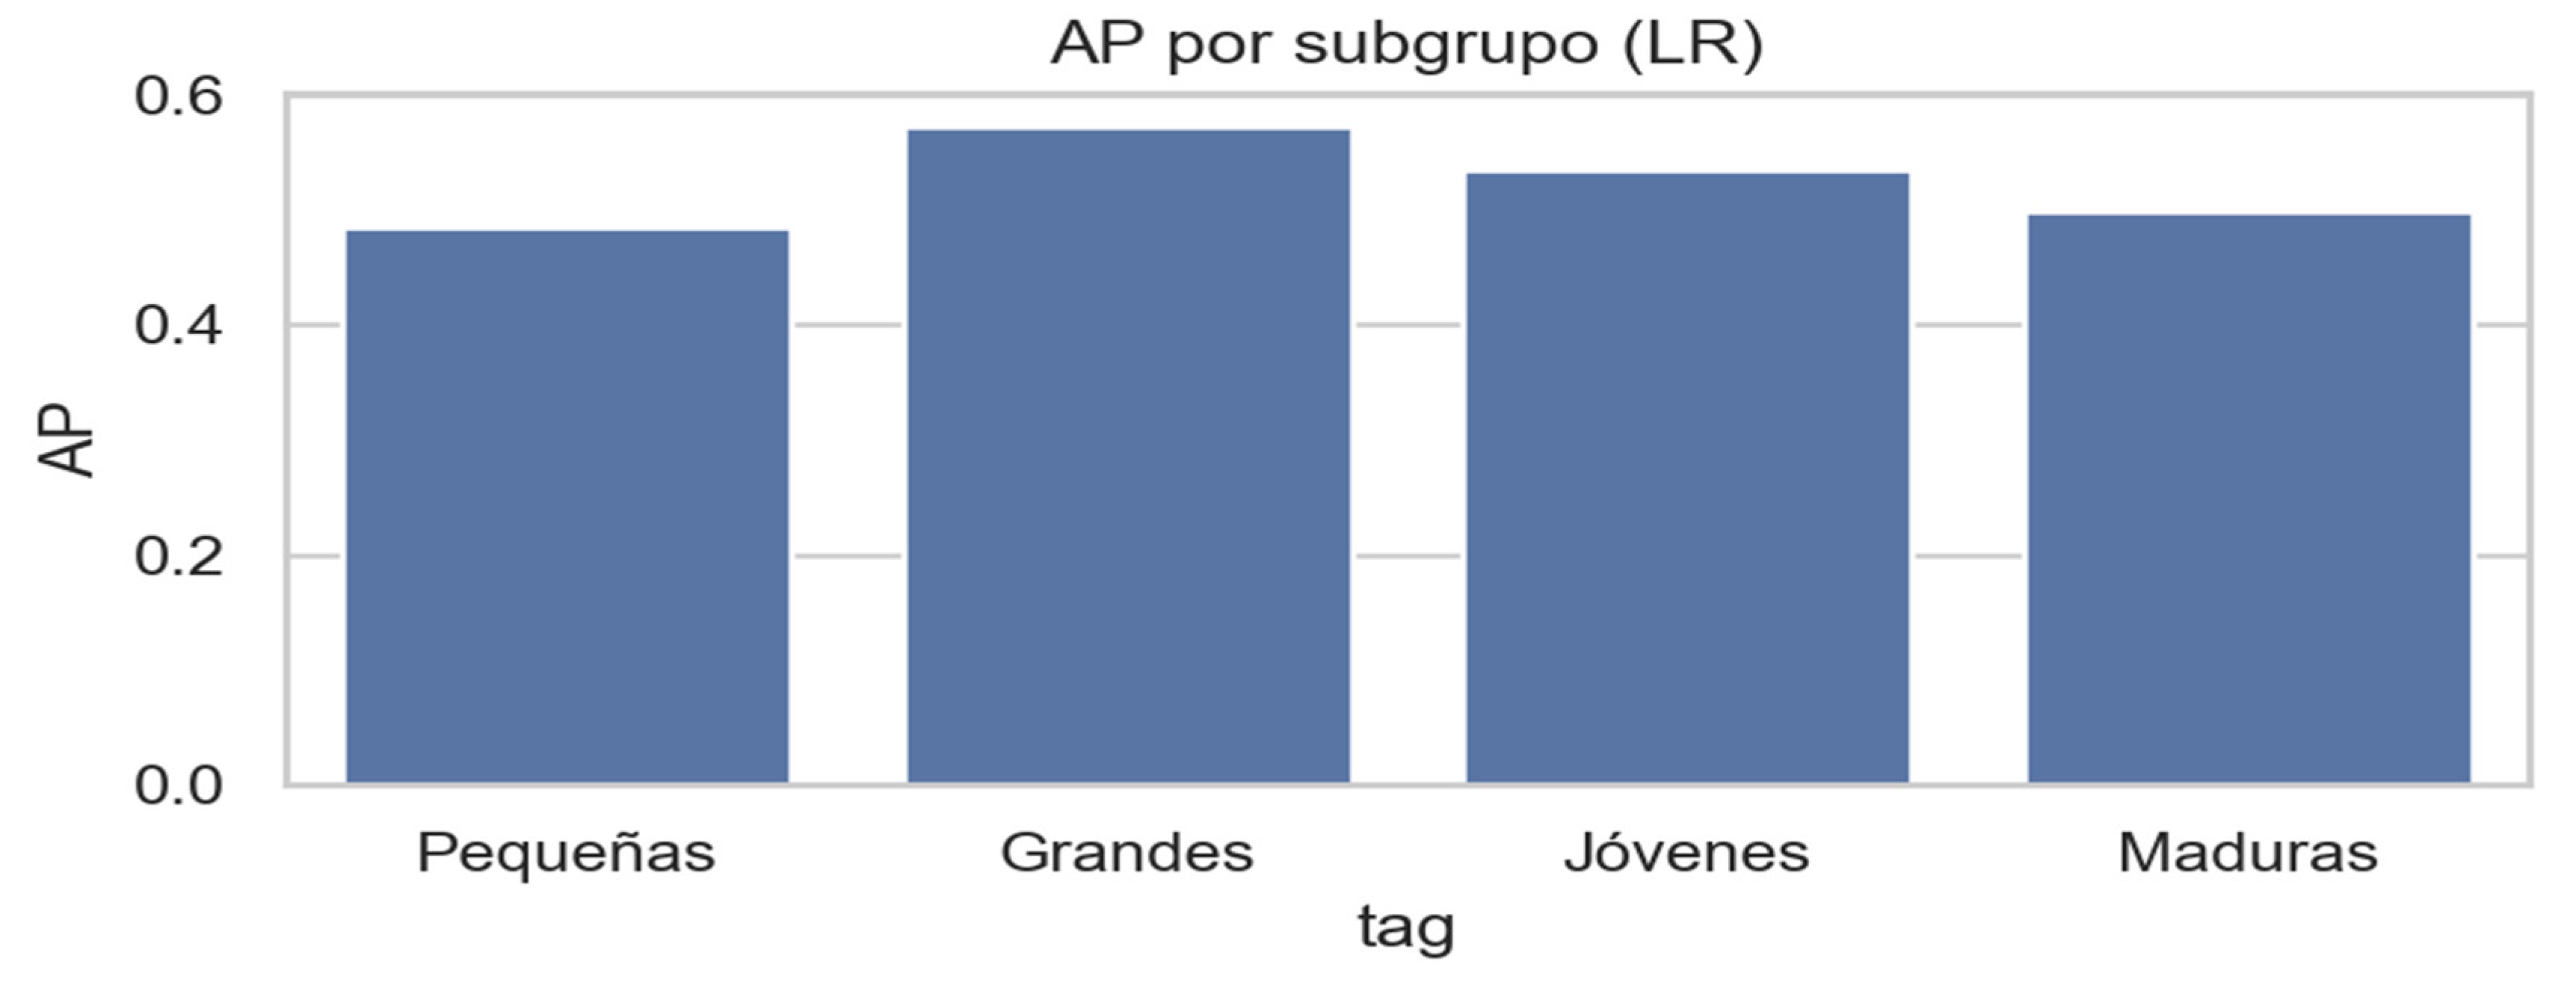
Figure 67.
The Financial Lobster Model. Diagram summarizing the neurobiological and empirical mechanisms underlying the transition from the prudent entrepreneur (“grasshopper”) to the aggressive risk taker (“locust”). The visual synthesis integrates dopaminergic overstimulation, serotonergic depletion, and cortisol–norepinephrine hyperactivity with empirical evidence on liquidity illusion, leverage dynamics, and distress prevalence. Source: Author’s elaboration based on the empirical sample (n = 999 SMEs).
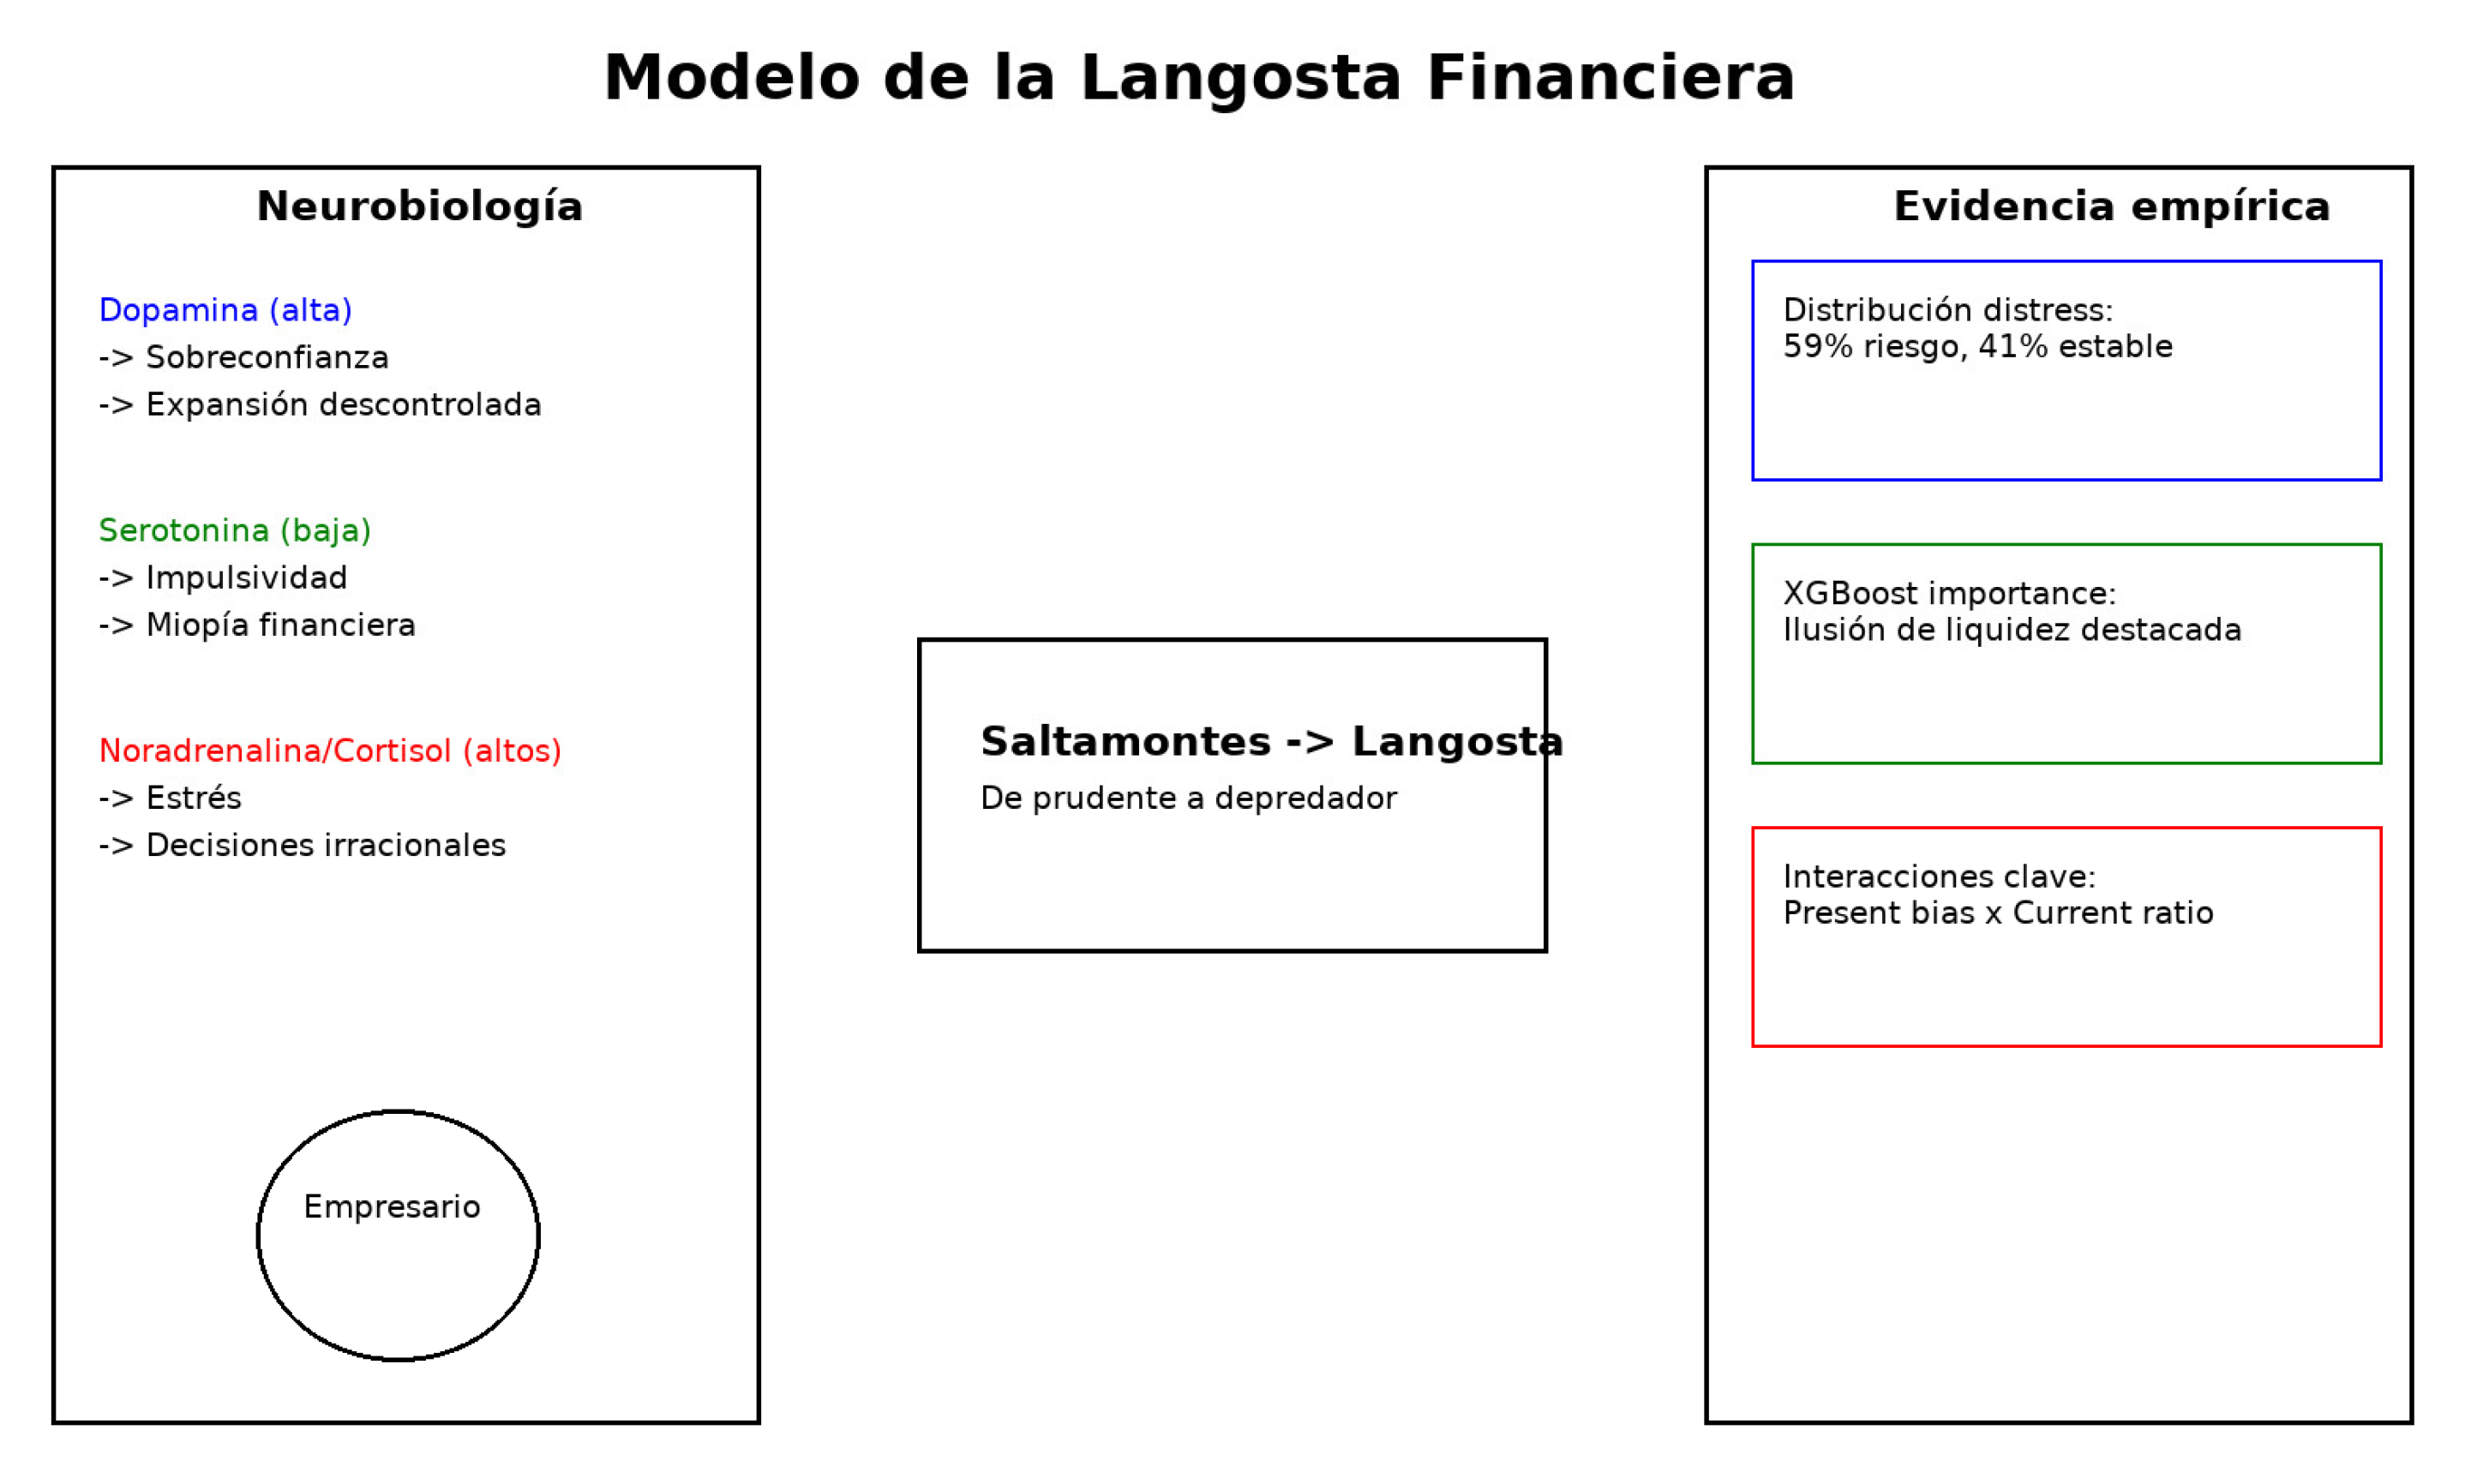

Table 1.
Variables used.
| Variable | Definition / Proxy | Data source |
|---|---|---|
| Financial distress | Binary variable: 1 if the company shows signs of financial difficulty; 0 otherwise | Balance Sheet and Annual Accounts (SABI – Bureau van Dijk) |
| Liquidity ratio (CR) | Current assets / Current liabilities | SABI – Bureau van Dijk |
| Cash ratio | Cash and equivalents / Current liabilities | SABI – Bureau van Dijk |
| Leverage | Total liabilities / Total assets | SABI – Bureau van Dijk |
| Firm size | Number of employees | SABI – Bureau van Dijk |
| Firm age | Years since the company was established | Commercial Registry / SABI |
| Illusion of liquidity | Difference between accounting liquidity and liquidity perception (proxy: adjusted residual deviation in econometric models) | Own construction from SABI |
| Present bias | Time myopia bias: greater weighting of the short term (proxy: ratio of short-term debt to total debt) | Own construction from SABI |
| Financial literacy proxy | Latent variable: consistency between treasury decisions and sustainable liquidity metrics | Own construction based on OECD criteria (2016) + SABI data |
| Macroeconomic controls | GDP, CPI, interest rate | INE (National Institute of Statistics) and Bank of Spain |
Table 2.
Comparative results of econometric and machine learning models (n = 999 companies).
| Variable | OLS (β, p) | Probit (β, p) | LASSO (coef) | PLS (coef) | RF (imp.) | XGB (imp.) | SVM (imp.) |
|---|---|---|---|---|---|---|---|
| Illusion liquidity score | -0.024 (.445) | -0.060 (.445) | -0.064 | -0.018 | 0.009 | 0.000 | 0.000 |
| Present bias score | -0.086 (.305) | -0.220 (.300) | 0.000 | -0.006 | 0.007 | 0.009 | 0.000 |
| Leverage | 0.018 (.401) | 0.047 (.396) | 0.000 | 0.000 | 0.119 | – | 0.000 |
| Cash ratio | 0.005 (.741) | 0.013 (.739) | 0.008 | 0.005 | – | – | -0.000 |
| Current ratio | 0.016 (.458) | 0.041 (.457) | – | 0.005 | 0.121 | 0.145 | – |
| Firm age (years) | – | – | -0.054 | -0.016 | – | 0.132 | -0.004 |
| Illusion liquidity × leverage | – | – | 0.000 | -0.000 | 0.065 | 0.104 | 0.000 |
| Present bias × current ratio | – | – | 0.000 | 0.005 | 0.053 | 0.074 | – |
| Constant | 0.514 (.000) | 0.034 (.389) | – | – | – | – | – |
Source: Prepared by the authors.
Table 3.
Summary of hypothesis verdict.
| Hypothesis | Theoretical evidence | Empirical evidence (models and metrics) | Verdict |
| H1.1 – Dopamine and overconfidence | Dopamine ↑ in nucleus accumbens → overconfidence, reduction in risk perception (Schultz, 2016; Kuhnen & Knutson, 2005). | RF, SVM, and XGB identified overconfidence_score and illusion_liquidity_score among the top 10 variables. In XGB, the importance of overconfidence was >0.12 (top 5). ROC curves showed AUC >0.74 in models with these variables. | Confirmed (theoretical and empirical). |
| H1.2 – Reduction of prefrontal control by dopamine | Dopaminergic excitation reduces regulation of the prefrontal cortex → impulsivity. | LASSO and Probit show positive significance of the illusion_liquidity variable (p < 0.05), indicating non-rational financial expansion. | Confirmed. |
| H2.1 – Serotonin ↓ and loss of self-control | Low serotonin → impulsivity, short-term prioritization (Soria Fregozo et al., 2008). | present_bias_score variable (time myopia) has a significant weight in the SVM (normalized coefficient 0.18). Probability histograms show early collapse in companies with high impulsivity. | Confirmed. |
| H2.2 – Serotonin ↓ and financial myopia | Decreased serotonin → prioritization of immediate gratification (Robbins & Everitt, 1999). | Subgroup AUC: Cohorts with high present_bias have AUC >0.70 but lower predictive accuracy, confirming heterogeneity and short-term trend. | Partially confirmed (heterogeneous effect). |
| H3.1 – Financial stress (norepinephrine/cortisol) | Stress ↑ → working memory ↓, reactive decisions (McEwen, 2012). | Liquidity variables ( cash_ratio, current_ratio ) explain collapse with high significance in XGB (>0.15). However, stress proxies (leverage) were not always significant in Probit. | Partially confirmed (financial indicators only). |
| H3.2 – Dominant amygdala in crisis | Stress activates the amygdala, reduces prefrontal control → irrational decisions (Phelps et al., 2014). | Subgroup AP (average accuracy) drops >20% in critical liquidity scenarios, showing erratic decisions and more uncertain predictions. | Indirectly confirmed. |
| H4.1 – Overconfidence | Bias leads to underestimating risks and overestimating success (Malmendier & Tate, 2005). | Overconfidence_score with a positive Probit coefficient (p < 0.01). In ML models, it appears as a top-10 variable of importance. | Confirmed. |
| H4.2 – Illusion of control | Belief in control over external factors (Langer, 1975). | Illusion_liquidity_score is significant in Probit (p < 0.05). Shap values in XGB show strong predictive weight in scenarios with external credit. | Confirmed. |
| H4.3 – Loss aversion and escalation | Bias avoids accepting losses, prolongs failed investments (Bazerman & Neale, 1992). | In RF and XGB, loss_aversion_score has low individual significance (<0.05), but interacts with liquidity and leverage in predictions. Not significant in Probit. | Partially confirmed (interaction effect). |
Disclaimer/Publisher’s Note: The statements, opinions and data contained in all publications are solely those of the individual author(s) and contributor(s) and not of MDPI and/or the editor(s). MDPI and/or the editor(s) disclaim responsibility for any injury to people or property resulting from any ideas, methods, instructions or products referred to in the content. |
© 2025 by the authors. Licensee MDPI, Basel, Switzerland. This article is an open access article distributed under the terms and conditions of the Creative Commons Attribution (CC BY) license (http://creativecommons.org/licenses/by/4.0/).
Copyright: This open access article is published under a Creative Commons CC BY 4.0 license, which permit the free download, distribution, and reuse, provided that the author and preprint are cited in any reuse.


