
Submitted:
26 November 2025
Posted:
26 November 2025
You are already at the latest version
Abstract
African catfish (Clarias gariepinus, AC) is one of the most widely farmed freshwater fish species in Central Europe. Processing operations generate up to 55% by-products (BPs), predominantly carcasses rich in proteins, lipids, and minerals. This study develops a comprehensive valorization process for ACBPs to recover gelatin, protein hydrolysate, fish oil, and pigments. The processing protocol comprised sequential washing, oil extraction, demineralization, and biotechnological treatment to cleave the collagen quaternary structure. A two-factor experimental design was employed to optimize the processing conditions. The factors included the extraction temperatures of the first (35–45 °C) and second fraction (50–60 °C). The integrated process yielded 18.2 ± 1.2% fish oil, 9.8 ± 2.1 % protein hydrolysate, 1.7 ± 0.7 % pigment extract, and 25.3–37.8 % gelatin. Optimal conditions (35 °C/60 °C) produced gelatin with gel strength of 168.8 ± 3.6 Bloom, dynamic viscosity of 2.48 ± 0.02 mPa·s, yield of 34.76 ± 1.95 %. Life cycle assessment (LCA) identified two primary environmental hotspots: water consumption and energy demand. This near-zero-waste biorefinery demonstrates the potential for comprehensive valorization of aquaculture BPs into multiple value-added bioproducts.
Keywords:
African catfish
; biotechnological treatment
; by-products
; gelatin
; hydrolysate
; oil
; pigment
; zero-waste
; life cycle assessment
; sustainability
1. Introduction
The global fish farming industry is experiencing rapid growth, with production projected to reach 205 million tons by 2032, representing a 10% increase from 2022 [1]. This expansion results in the generation of substantial BPs, which can account for 30% to 70% of the wet weight of processed fish, depending on the species. Efficient valorization of these BPs is essential to improve the sustainability and profitability of fish processing operations [2].
AC, a warm-water fish species, has emerged as a species of significant economic interest due to its rapid growth at high stocking densities, omnivorous feeding habits, adaptability, disease resistance, and the tastiness of its flesh [3,4]. Global production of AC has increased considerably, with Nigeria being the largest producer, reporting an annual output of approximately 1 million metric tons valued at around USD 2.6 billion [5]. Hungary leads in AC production in Europe, yielding over 5,100 tons per year [6]. The volume of BPs from AC varies depending on regional consumption habits and processing practices, reaching up to 55% of the total fish weight. Valorizing ACBPs is closely aligned with circular economy principles, which focus on reducing, reusing, recycling, and recovering materials to minimize waste and environmental impact. Implementing zero-waste technologies enables the extraction of valuable components from ACBPs, which are rich in protein (18.34–20.32 %), polyunsaturated fatty acids (PUFAs), minerals, and pigments [7,8,9].
Food production is responsible for about one-fourth of global greenhouse gas emissions, highlighting the urgent need to reduce emissions, water usage, and waste generation [10,11]. Adopting circular economy models and data-driven management in the seafood sector can significantly enhance efficiency and sustainability. Utilizing seafood waste in other industries and reintegrating these materials into production cycles helps create sustainable production loops. LCA is a critical tool for evaluating and managing resource use, emissions, and environmental impacts throughout the product life cycle [10,12]. LCA is well established for crops and livestock, but its application to fish-based products such as gelatin remains limited, partly due to the lack of comprehensive inventory data for novel or region-specific materials. Existing studies show that gelatin production using acid or alkali conditioning of collagen can significantly contribute to eutrophication-causing emissions, yet detailed LCA data are insufficient [13]. Early-stage LCA can provide valuable guidance for eco-efficient fish-processing practices and supports progress toward the United Nations Sustainable Development Goal 14 (Life Below Water) [10]. Innovations such as enzymatic hydrolysis provide greener alternatives to traditional gelatin extraction methods, reducing waste, processing time, freshwater utilization, and chemical use [14].
Enzymatic hydrolysis represents a sustainable method for converting collagen-rich waste into low-molecular-weight bioactive peptides [9]. Proteolytic enzymes, which hydrolyze peptide bonds, operate under mild conditions, reducing energy consumption and minimizing waste compared to traditional chemical methods, which often produce high-salt BPs that complicate disposal [10,11,15]. Enzymes selectively cleave peptide bonds, preserving amino acids essential for gelatin's gelling properties.
Proteases are primarily classified based on their source of origin. They may be derived from microorganisms, such as bacteria, fungi, and viruses (e.g., Protamex, Alcalase, Corolase), or obtained from plants (e.g., papain, bromelain) and animals (e.g., trypsin, pepsin) [16]. Microbial proteases are particularly advantageous due to their rapid production, minimal space requirements, and the potential for genetic modification to enhance enzyme characteristics [15]. Proteases can also be categorized based on their site of action their action site, with endopeptidases cleaving internal peptide bonds and exopeptidases acting at the ends of peptide chains [16].
Gelatin is a versatile, high-molecular-weight macromolecule composed of three polypeptide strands derived through partial hydrolysis of collagen, the main structural protein in white fibrous connective tissues. It is well-known for its excellent gelling, thickening, foaming, and stabilizing properties, which arise from its coil-helix transition. Traditionally, gelatin is sourced from porcine or bovine origins [17,18,19]. Fish gelatin is increasingly recognized as an alternative to bovine and porcine gelatin, driven by religious, ethical, and health considerations [20,21]. Notable differences exist between gelatins derived from cold-water and warm-water fish. Cold-water fish gelatin typically has lower hydroxyproline content, resulting in lower gel modulus (low gel strength), denaturation temperature, melting and gelling temperatures (below 8–10 °C), and thermal shrinkage, making it suitable for microencapsulation applications [18,21,22]. Warm-water fish gelatin, such as that obtained from AC, has favorable functional properties, including good gel strength, emulsifying capacity, film-forming abilities, reasonable thermal stability, higher melting point (25–27 °C), and high bioactivity, making it suitable for food, pharmaceutical, and biomedical applications [17,20,23]. However, it still faces challenges such as a higher degradation rate, lower thermal stability, reduced gel strength, and lower gelling and melting temperatures compared to mammalian gelatin (32–35 °C). These limitations are primarily due to its lower content of proline and hydroxyproline—amino acids essential for a more substantial gelling effect—while fish gelatins exhibit greater variability in their amino acid composition [21,23]. As a result, products made from warm-water fish gelatin generally require storage at low temperatures [21]. Despite its versatility and functional properties, the large-scale development of fish gelatin is constrained by weaker rheological properties, inconsistent raw material quality, stringent legislation, and issues related to odor and color [24,25].
Beyond gelatin, other valuable BPs can be recovered from AC. Fish oil derived from AC is rich in essential fatty acids (FAs), including oleic acid (18:1), omega-3 PUFAs such as eicosapentaenoic acid (EPA; C20:5(n-3)), docosahexaenoic acid (DHA; C22:6(n-3)), and α-linolenic acid (ALA; 18:3(n−3)), as well as omega-6 FA like linoleic acid (LA, 18:2(n−6)). The most abundant saturated fatty acids (SFAs) in AC oil are palmitic acids (PA, 16:0) and stearic acids (SA, 18:0) [26,27,28]. Additionally, fish oil is a good source of fat-soluble vitamins such as A and D [24]. Due to its rich composition, fish oil is valuable for nutraceutical, food, cosmetic, and bio-based industrial applications. Its bioactive compounds support cardiovascular and cognitive health, regulating blood pressure and preventing type II diabetes, alleviating the severity of photoaging, skin cancer, allergies, dermatitis, cutaneous wounds, acne, and melanogenesis [21,26,29,30].
AC bones, primarily composed of calcium phosphate, can be used for calcium supplements, organic fertilizers, and functional foods [31]. Apart from calcium, magnesium, and sodium, trace elements as manganese, zinc, iron, copper, iodine, and cobalt can also be found in AC [9]. Pigments in AC skin, although underexplored, hold potential as natural colorants. The pigmentation, FA, and mineral composition can vary based on diet, environment, and growth stage [9,32,33]. Furthermore, solid residues from gelatin extraction can be repurposed as animal feed or fish sauce, enhancing sustainability [25].
The primary objective of this study is to valorize underexplored ACBPs through integrated extraction of fish gelatin, hydrolysate, oil, and pigment using an innovative biotechnological approach that conditions purified collagen with microbial proteolytic enzymes. The study further examines the influence of selected technological parameters on the properties of the resulting gelatin fractions. Despite AC being a common species in aquaculture with significant processing waste volumes, no comprehensive valorization strategy has been previously applied to its BPs. To address this gap and reinforce sustainability principles, a zero-waste strategy is implemented and evaluated for the first time on this material through laboratory-scale LCA, demonstrating its alignment with circular bioeconomy principles and identifying process hotspots for potential improvement. The working hypothesis posits that the application of a comprehensive processing technology for ACBPs—consisting of purification, enzymatic conditioning of collagen, and hot water extraction—will produce gelatin with yield and qualitative parameters comparable to those of gelatins prepared from freshwater and cold-water fish species.
2. Results and Discussion
2.1. Mass Balance of the Process
The defatting process yielded 18.17 ± 1.24% fish oil, while the production of fish protein hydrolysate and pigment resulted in 9.83 ± 2.14% and 1.72 ± 0.65%, respectively. The total gelatin yield obtained through four sequential extractions ranged from 25.3% to 37.8% (see Table 1), indicating good overall recovery efficiency. However, the first extraction fraction was consistently over-hydrolyzed, which prevented solid gel formation and suggested an excessive breakdown of collagen chains. Subsequent fractions exhibited improved gelling characteristics, with the second fraction consistently achieving the most favorable balance between yield and gel strength. The complete mass balance of the process reached 95.48 ± 2.95%, confirming high efficiency, as less than 5% of the initial raw material was lost during processing.
Statistical analysis (Table 2) of gelatin fraction yields showed strong model fits but varying levels of factor significance. For the first fraction yield (Y₁), the model fit excellently (R² = 97.77%), with no significant influence from any factor, although the temperature of the first extraction showed the strongest effect (p = 0.097). For the second fraction yield (Y₂), the model demonstrated excellent explanatory power (R² = 99.89%), with a statistically significant effect of the temperature of the first extraction (p = 0.026) and a near-significant influence of the temperature of the second extraction (p = 0.055). For the third fraction yield (Y₃), the model fit remained strong (R² = 98.73%), though none of the factors achieved statistical significance, with the temperature of the first extraction showing the strongest effect (p = 0.083), followed by the temperature of the second extraction (p = 0.224). The fourth fraction yield (Y₄) exhibited similarly high explanatory power (R² = 99.20%), yet statistical significance remained elusive, with the temperature of the second extraction demonstrating the most pronounced effect (p = 0.093) and a smaller contribution from the first extraction temperature (p = 0.205). The high R² values across all fractions indicate that the models captured most of the variance, though the limited degrees of freedom restricted the ability to confirm statistical significance for individual factors. To visualize the influence of the factors on gelatin fraction yields, contour plots were prepared and are presented in Figure 1.
2.2. Life Cycle Assessment
The contribution analysis of individual processes involved in producing 1 kg of gelatin from catfish processing residues (Figure 2) reveals that the Pigment extraction and gelatin product drying processes dominate across all impact categories, consistently contributing more than 65% to each category. The Gelatin extraction process represents the second major contributor, accounting for approximately 30% across the impact categories. Since individual impact categories are expressed in different units and cannot be directly compared, normalization and weighting procedures were applied according to the Environmental Footprint (EF) 3.1 methodology. External normalization factors are expressed per capita per year based on global impact category values [34]. The normalized results were subsequently multiplied by weighting factors that reflect the relative socioeconomic importance of each impact category [35]. The normalized and weighted results for the reference scenario (Figure 3) display the percentage contribution of each impact category to the total environmental impact.
Analysis of the weighted results (Table 3) identifies three impact categories with the largest contributions to total environmental impacts: Freshwater eutrophication, Fossils, and Climate change, each exceeding 10% of the total impact. The distribution of these three significant categories across individual processes (Figure 4) reveals remarkably similar patterns for all processes, except for Hexane recycling. This process introduces hexane, an organic, non-polar solvent of fossil origin, used for fat extraction, which substantially increases the fossil resource consumption category for this specific process step. Examination of absolute weighted impact values (Table 4) confirms that the Pigment extraction and gelatin product drying process exhibits the highest values across all three significant impact categories. This is directly attributable to its substantial energy requirements, which represent the largest energy demand in the entire production cycle, primarily driven by the gelatin drying process.
Based on these initial findings, several hypotheses were formulated and tested through scenario simulations to analyze system sensitivity and identify potential improvement strategies. Given that Freshwater eutrophication, Fossils, and Climate change are heavily influenced by electricity production methods. The first alternative scenario replaced the Czech energy mix (approximately 50% fossil fuel-based) with the average European energy mix, which incorporates a significantly higher proportion of renewable energy sources. This scenario reflects the growing trend of companies adopting environmentally responsible practices, such as utilizing photovoltaic power plants. The second scenario focused on the efficiency of hexane recycling. In the reference scenario, 62% of hexane was recycled within the production cycle. To assess system sensitivity, two schemes were modeled: reducing the recycling rate by 20% to 42%, and increasing it by 20%. The higher recycling rate represents a realistic improvement under optimized recycling conditions. The third scenario examined the impact of water type. The reference scenario, which modeled anticipated industrial upscaling conditions, assumed tap water usage, requiring more than 2,000 L per kg of gelatin produced. Over half of this volume is consumed in the Washing and drying process. Despite this substantial consumption, the Water scarcity impact category contributes only approximately 2.7% to total environmental impacts (Table 3). Since semi-industrial tests utilized deionized water, this scenario evaluated the substitution of tap water with deionized water to determine its environmental significance.
The transition to a greener energy mix produces substantial environmental benefits (Table 5). The three significant impact categories show considerable reductions: Freshwater eutrophication decreases by 67.85%, Fossils by 30.2%, and Climate change by 50.19%. Given that energy flow represents a critical input throughout the production cycle and energy consumption reduction is not practically feasible, adopting renewable energy sources emerges as the most effective strategy for reducing the environmental footprint of gelatin production from ACBPs. In contrast, the product system exhibits minimal sensitivity to variations in the hexane recycling rate. A 20% change in either direction results in weighted impact category changes ranging from only 0.01% to 1.2% (Table 6). Specifically, Freshwater eutrophication, Fossils, and Climate change show changes of 0.01%, 0.47%, and 0.16%, respectively, indicating that hexane recycling optimization offers limited environmental improvement potential. Similarly, water type substitution yields negligible changes in environmental impact, with percentage variations ranging from 0.001% to 1.779% across impact categories (Table 7). This demonstrates that the volume of water consumption is far more environmentally significant than its quality. Consequently, industrial-scale implementation should prioritize water conservation strategies. Water evaporating during processes, particularly Pigment extraction and gelatin products drying processes, can be recovered through condensation systems. For the Washing and drying process, which accounts for the highest water consumption, filtration or concentration technologies should be implemented to enable substantial regeneration of washing water.
Following current industry practices for environmental policy communication [36], the carbon footprint was calculated for all modeled scenarios (Figure 5). Results show remarkable similarity across scenarios, with one notable exception: the scenario employing renewable energy sources demonstrates significantly lower carbon emissions. Total electricity demand reaches 545.77 kWh per kg gelatin, with the Pigment extraction and gelatin products drying process consuming approximately 50% and Gelatin extraction accounting for 23% of total energy usage. These findings underscore that the implementation of energy-efficient equipment, particularly the adoption of renewable energy, represents the most effective pathway for reducing environmental impact. Water consumption constitutes the second major environmental hotspot, with approximately 2000 L required per kg of gelatin produced [13,37]. Rather than modifying water treatment processes, consumption reduction strategies should be prioritized. Implementing water recycling systems for evaporated water from the Pigment extraction and gelatin products drying process, as well as conditioning processes, offers immediate improvement potential. Most critically, the Washing and drying process requires appropriate wastewater treatment infrastructure, as the effluent contains high concentrations of organic nutrients that significantly contribute to aquatic environment eutrophication.
2.3. Physicochemical Properties of Gelatins
The functional properties of the gelatin obtained from ACBPs are summarized in Table 8 (gel strength and dynamic viscosity) and in Table 9 (melting and gelling point).
2.3.1. Gel Strength and Dynamic Viscosity
Experiment 4 provided the highest overall yield; however, the resulting gel exhibited significantly lower gel strength (79.4 ± 3.1 Bloom). Conversely, the highest gel quality (168.8 ± 3.6 Bloom) was achieved in Experiment 2, which produced the third lowest yield, with a corresponding dynamic viscosity of 2.48 ± 0.02 mPa·s. Gel strength and dynamic viscosity measurements for Fractions 2, 3, and 4 (Table 8) revealed a strong positive linear relationship between these two rheological parameters. Pearson correlation analysis yielded coefficients of 0.955, 0.998, and 0.949 for the second, third, and fourth fractions, respectively, with all correlations being statistically significant (p < 0.05). Fractions that failed to form cohesive gels exhibited dynamic viscosities ranging from 0.72 ± 0.02 to 1.05 ± 0.05 mPa·s, whereas gel-forming fractions displayed substantially higher viscosities, ranging from 1.03 ± 0.03 to 3.62 ± 0.11 mPa·s.
When compared with published data, the present maximum gel strength of 168.8 ± 3.6 Bloom (viscosity 2.48 ± 0.02 mPa·s) is lower than the 234 ± 3 Bloom reported by Alfaro et al. (2014) for gelatin from AC skin obtained via acid–alkaline pretreatment [38], but falls within the medium Bloom range and matches their reported viscosity span of 2.05–2.85 mPa·s. Sanaei et al. (2013) found that AC bone gelatin yielded 230.25 Bloom and 4.64 mPa·s, while AC skin gelatin yielded 286.71 Bloom and 3.45 mPa·s using mixed acid and alkaline pretreatments — both higher than the best values recorded here [39]. See et al. (2013) reported that alkaline pretreatment with 0.01 N Ca(OH)₂ resulted in the lowest gel strength (136.6 ± 0.89 Bloom; viscosity 1.72 ± 0.13 mPa·s), whereas a combined 0.2 N NaOH and 0.05 M acetic acid treatment produced the highest values (265.6 ± 4.22 Bloom; 3.62 ± 0.01 mPa·s). Notably, the upper viscosity range achieved in the present study for Experiment 2 Fraction 4 (3.62 ± 0.11 mPa·s) matches the best outcome reported by See et al., although corresponding Bloom values were lower [17].

Table 8.
The gel strength and dynamic viscosity of the second, third, and fourth gelatin fractions under different experimental conditions.
Table 8.
The gel strength and dynamic viscosity of the second, third, and fourth gelatin fractions under different experimental conditions.
| Experiment | Gel strength [Bloom] | Dynamic viscosity [mPa·s] | ||||
|---|---|---|---|---|---|---|
| Fractions | ||||||
| 2. | 3. | 4. | 2. | 3. | 4. | |
| 1 (35/50°C) | 0 | 0 | 115.6 ± 10.1 | 1.05 ± 0.05 | 0.99 ± 0.02 | 2.24 ± 0.07 |
| 2 (35/60°C) | 168.8 ± 3.6 | 166.6 ± 12.9 | 167.8 ± 17.3 | 2.48 ± 0.02 | 3.44 ± 0.03 | 3.62 ± 0.11 |
| 3 (45/50°C) | 99.0 ± 2.6 | 118.2 ± 8.6 | 121.9 ± 11.9 | 1.71 ± 0.05 | 3.32 ± 0.02 | 3.23 ± 0.04 |
| 4 (45/60°C) | 79.4 ± 3.1 | 0 | 0 | 1.68 ± 0.01 | 0.76 ± 0.05 | 0.74 ± 0.02 |
| 5 (40/55°C) | 28.7 ± 1.2 | 1.6 ± 0.1 | 2.8 ± 0.3 | 1.65 ± 0.06 | 1.03 ± 0.03 | 1.05 ± 0.02 |
| Control (40/55°C) | 0 | 0 | 73.7 ± 1.4 | 0.84 ± 0.08 | 1.04 ± 0.03 | 1.71 ± 0.05 |
2.3.2. Melting and Gelling Point
The measured melting points of the gelatin fractions in this study ranged from 11.1 ± 0.2 °C to 28.3 ± 0.1 °C , while gelling points varied between 5.5 ± 0.2 °C and 16.4± 0.6 °C (Table 9). Several fractions, notably Fractions 4 and 5, exhibited melting temperatures above 25 °C, aligning closely with values reported for AC skin gelatin (25.7 °C) by Alfaro et al. (2014) [38]. In contrast, the control sample displayed a lower melting point (19.7 ± 3.5 °C) and gelling point (10.6 ± 1.0 °C), indicating that fractionation processes can modify gelatin’s thermal transition behavior.
When compared with literature values, the observed melting points fall within the range reported for warm-water fish gelatins (typically 20–29 °C) but remain lower than those of mammalian gelatins (32.2–32.6 °C) [40,41]. Species such as grass carp, common carp, and rohu exhibit melting points of 28.1–29.1 °C and gelling points of 17.9–20.5 °C [40,42],while cold-water fish like cod display considerably lower values (8–10 °C) [43]. The relatively high melting point in certain fractions (e.g., Fraction 4) suggests a higher imino acid content or more compact triple-helix regions, as the thermal stability of gelatin has been positively correlated with proline and hydroxyproline levels [44,45].
Gelling points in this study (5.5–16.4 °C) are lower than those of tilapia (≈ 18 °C) [42] and most warm-water species [46]. These results confirm that AC gelatin fractions follow the general trend of fish gelatins having lower gelling and melting points than mammalian counterparts, due to their lower imino acid content [47]. Variations between fractions likely arise from differences in molecular weight distribution and peptide composition caused by the fractionation or extraction conditions.
Overall, the thermal transition data indicate that fractionation can yield AC fish gelatin fractions with melting points approaching those of commercial gelatins, offering potential advantages for applications requiring higher thermal stability compared to typical fish gelatin.
Table 9.
The melting point and gelling point of the second, third, and fourth gelatin fractions under different experimental conditions.
Table 9.
The melting point and gelling point of the second, third, and fourth gelatin fractions under different experimental conditions.
| Experiment | Melting point [°C] | Gelling point [°C] | ||||
|---|---|---|---|---|---|---|
| Fraction | ||||||
| 2. | 3. | 4. | 2. | 3. | 4. | |
| 1 (35/50°C) | 0 | 0 | 25.0 ± 1.1 | 0 | 0 | 13.1 ± 0.7 |
| 2 (35/60°C) | 25.3 ± 0.3 | 28.3 ± 0.1 | 26.0 ± 0.2 | 13.1 ± 0.8 | 16.4 ± 0.6 | 14.3 ± 1.7 |
| 3 (45/50°C) | 23.2 ± 2.3 | 24.4 ± 0.5 | 25.6 ± 0.6 | 12.2 ± 0.1 | 12.2 ± 0.5 | 11.0 ± 0.6 |
| 4 (45/60°C) | 23.1 ± 2.2 | 0 | 0 | 12.9 ± 0.2 | 0 | 0 |
| 5 (40/55°C) | 22.3 ± 0.2 | 11.1 ± 0.2 | 11.3 ± 0.1 | 8.7 ± 1.1 | 5.5 ± 0.2 | 5.8 ± 0.3 |
| Control (40/55°C) | 0 | 0 | 19.7 ± 3.5 | 0 | 0 | 10.6 ± 1.0 |
2.4. Composition and Properties of the Fish Oil
2.4.1. Fatty Acid Composition
The FA composition (Table 10) analysis revealed a nutritionally balanced profile with SFAs comprising 30.85%, monounsaturated fatty acids (MUFAs) 40.52%, and PUFAs 28.65%, yielding an SFA:MUFA:PUFA ratio of approximately 11:14:10. Essential FAs that cannot be synthesized by the human body included LA (C18:2) at 14.60% and ALA (C18:3) at 2.02%, providing a total essential FA content of 16.62%. These health-promoting compounds offer significant protection against cardiac and vascular diseases while improving skin health [8,29]. These FA contents substantially exceeded values reported for farmed AC in previous studies, including 0.17% for farmed-raised to 11.65% for wild-raised specimens [48], 13.3% [49], 5.18% [50], and dietary-dependent variations ranging from 7.11% with coconut oil diet to 55.79% with sunflower oil diet [51], and extraction type dependent variation from 37.09% to 49.06% [27].
Conditionally essential long-chain PUFAs comprised arachidonic acid (0.67%), EPA (2.23%), and DHA (4.65%), with these bioactive compounds demonstrating therapeutic potential for treating rheumatoid arthritis, psoriasis, ulcerative colitis, asthma, Parkinson's disease, osteoporosis, diabetes mellitus, cardiovascular events, cancers, and depression, while providing crucial support for brain and retinal functions [29,52]. The arachidonic acid content aligned well with literature values of 0.6% [49], 0.1% [28], 1.77% from AC viscera [50], and dietary-dependent ranges of 0.01–0.67% [51] and 0.02-5.74% with higher yields achieved through the kiln smoking extraction method [27]. EPA content proved comparable to commonly used salmon oil levels (1.8–4.2%) [53] and significantly exceeded values reported by Habib &Sarkar (2016) (0.8%) and Effiong & Yaro (2020) (0.02–1.18%) [28,51]. DHA demonstrated relatively high content compared to AC oils reported by Eke-Ejiofor et Ansa (2018) (0.95–1.06%), Habib & Sarkar (2016) (2.48%), Osibona et al. (2009) (3.0%), Sathivel et al. (2003) (0.62%) and Effiong & Yaro (2020) (0.03–0.97%), though remaining lower than salmon oil DHA levels (10.8–12.8%) [27,28,49,50,51].
Among SFAs, PA dominated at 20.45%, corresponding well with literature reports of 22.0% [49], 13.92% from AC viscera [50], 20.0% [28], while significantly exceeding other reported values ranging from 1.37% [27] through 2.18% [48] and 6.63% [54] to 8.03%, while palm oil-fed specimens had an exceptionally high PA content, 23.4% [51]. SA content (6.65%) fell within the middle range of published literature values spanning from 0.1% [28], 0.26% [54], 0.62-0.99% [48], 0.84–7.78% [27], 4.24–8.28% [51], 8.1% [49], and 11.97% from AC viscera [50], with both PAs and SAs serving as precursors for oleic acid biosynthesis [55]. Oleic acid (29.08%), the dominant MUFA, exceeded the range (17.69–23.73%) typically reported for catfish oils [28,48] and provides documented beneficial effects on pancreatic and liver function [55]. Myristic acid appeared in relatively low proportion (2.28%) yet exceeded levels reported for farmed (0.15%) and wild AC (0.67%), contributing positively to cardiovascular health [48]. Additional nutritionally significant MUFAs included palmitoleic acid (4.19%), found in concentrations similar to previous reports by Habib & Sarkar (2016) (3.9%), Osibona et al. (2009) (3.6%) [28,49], and within ranges reported by Eke-Ejiofor et Ansa (2018) (2.29–10.5%) and Effiong & Yaro (2020) (0.4–7.47%) under different dietary conditions [27,51], though lower than Sathivel et al. (2003) (8.67%) [50]. This FA demonstrates particular importance given its established links to improved insulin sensitivity and reduced diabetes risk [56]. Gadoleic acid, a short-chain MUFA, showed comparable results (2.6%) to Osibona et al. (2009) (2.5%) [49] while substantially exceeding values reported by Habib & Sarkar (2016) (0.03%) and Effiong & Yaro (2020) (0.05–0.51%) [28,51].
Overall, the studied oil demonstrates a nutritionally advantageous profile characterized by elevated MUFA content, favorable PUFA composition, and comparatively high levels of health-promoting FAs including LA, oleic acid, EPA, and DHA. These comprehensive findings strongly suggest that ACBP oil could serve as a valuable raw material for nutraceutical and functional food applications, while simultaneously supporting sustainable valorization strategies within circular economy frameworks.
2.4.2. Peroxide Value
The peroxide value (PV) serves as a critical indicator of lipid oxidation and oil quality. Fresh edible oils typically exhibit PVs below 10 mEq O₂/kg, while rancid oils generally exceed 30 mEq O₂/kg; values above 100 mEq O₂/kg have been associated with food poisoning [57]. Gotoh and Wada (2006) emphasized that monitoring PV is essential for both food quality assurance and safety, as oxidation reactions produce compounds that adversely affect taste, shelf life, and freshness [58].
The PV of freshly prepared fish oil samples was significantly lower (8.44 ± 0.42) than that of the six-month-old samples, with the aged samples exhibiting approximately four times the value (37.88 ± 0.29). The aged fish oil was stored in a refrigerator (7 ± 1 °C). This difference underscores the sensitivity of fish oil to autooxidation, a process wherein oxygen reacts with unsaturated FAs to form primary oxidation products—peroxides.
Our findings align with previously reported values for AC oil. Ningrum et al. (2023) reported PVs of 5.15 ± 0.146 and 4.15 ± 0.114 mEq O₂/kg for AC head and flesh oils [59], respectively, while Adetuyi et al. (2013) obtained 16.60 ± 0.6 mEq O₂/kg from AC viscera oil [60]. The wide variation in reported PVs can be attributed to differences in extraction methods, as demonstrated by Sathivel et al. (2009), who found PV values ranging from 4.9 ± 0.46 to 36.12 ± 0.18 mEq O₂/kg depending on the extraction technique employed for AC viscera oil [61].
Storage conditions significantly influence PV development. Famurewa et al. (2017) monitored AC oil over six weeks under various temperature conditions: at room temperature, PV increased from 4.60 ± 0.2 to 7.37 ± 0.15 mEq O₂/kg; at 40 ± 4 °C, values ranged from 6.3 ± 0.3 to 7.55 ± 0.16 mEq O₂/kg; while at −6 °C, PV increased more substantially from 6.3 ± 0.3 to 16.02 ± 0.42 mEq O₂/kg [62]. Ming (2023) further confirmed the temperature dependency of PV in AC oil, demonstrating that elevated temperatures accelerate oil degradation [63]. These observations highlight the importance of maintaining appropriate storage conditions, including temperature control and light protection, to minimize oxidative deterioration and preserve oil quality.
2.5. Optimal Processing Conditions and Practical Implications
This study demonstrates the comprehensive valorization potential of ACBPs, addressing critical challenges in fish processing waste management and sustainable resource utilization. The significance of this work lies primarily in the application of a unique biotechnological approach for collagen conditioning using proteolytic enzymes, which disrupts the quaternary structure of collagen in a manner that enables subsequent extraction steps to produce high-quality gelatins. Unlike conventional methods that employ weak acid or alkaline solutions to disrupt collagen structure, this enzymatic approach is significantly more environmentally benign.
Gelatin extraction from ACBPs yields 25.3–37.8%, with specific fractions exhibiting gel strengths up to 168.8 ± 3.6 Bloom and thermal transition properties (melting points 15–26 °C, gelling points 6–14 °C) that approach several commercial gelatin specifications. These functional characteristics establish AC gelatin as a viable alternative to mammalian sources, particularly suited for applications requiring moderate gel strength and lower thermal stability thresholds.
The co-extracted fish oil presents significant nutritional value, with a balanced FA profile comprising 40.52% MUFAs and 28.65% PUFAs. Notably, the oil contains therapeutically relevant omega-3 FAs (EPA: 2.23%, DHA: 4.65%) and essential FAs (16.62%), making it suitable for nutraceutical and functional food applications. However, proper storage conditions are critical, as peroxide value measurements demonstrate that six-month refrigerated storage without light protection increases oxidation approximately fourfold (from 8.44 ± 0.42 to 37.88 ± 0.29 mEq O₂/kg), emphasizing the need for appropriate preservation strategies, including light protection and temperature control.
The LCA reveals that environmental optimization hinges primarily on energy management, with the Pigment extraction and gelatin drying process contributing over 65% to environmental impacts. Transitioning to renewable energy sources demonstrates substantial reductions in key impact categories: freshwater eutrophication (−67.85%), climate change (−50.19%), and fossil resource consumption (−30.2%). These findings provide actionable guidance for industrial implementation, indicating that the sustainable production of gelatin and oil from ACBPs is achievable through the adoption of renewable energy and water conservation strategies, thereby supporting circular economy principles in aquaculture processing industries.
To determine the optimal conditions for gelatin processing, both gelatin yield, an industrially important factor, and gel strength, which dictates product applicability, must be considered. Experiment 2 (35 °C first fraction, 60 °C second fraction) achieved the highest gel strength (168.8 ± 3.6 Bloom) while maintaining reasonable yield, whereas Experiment 4 (45 °C first fraction, 60 °C second fraction), despite providing superior overall yield, exhibited significantly reduced gel quality (79.4 ± 3.1 Bloom). The second gelatin fraction consistently demonstrated the most favorable balance between yield and functional properties across all experimental conditions, making it the preferred target for gelatin recovery from fish BPs.
2.6. Limitations of the Study and Future Perspectives
The primary limitation of the presented study concerns the management of waste maceration liquor generated after demineralization of ACBP skeletons. Adopting a zero-waste approach, we recommend processing the maceration liquor according to the procedure described in our previous publication [64], wherein precipitation with Ca(OH)₂ produces feed-grade dicalcium phosphate dihydrate (CaHPO₄·2H₂O) suitable for crop and agricultural production. Another limitation is related to the cost-effective solvent extraction method used for recovering fish oil. Although hexane extraction is economically viable, rigorous testing must be conducted to ensure that the extracted fish oil contains negligible hexane residues, thereby guaranteeing its safety for food, pharmaceutical, or nutraceutical applications. A further limitation involves identifying suitable applications for two BPs: the solid cake remaining after extraction of the fourth gelatin fraction, which contains undecomposed collagen residue, and the fish pigment extract.
Future research should prioritize detailed compositional characterization of both the solid cake and pigment extract as a critical prerequisite for identifying optimal valorization pathways. The conversion of solid cake into higher-value-added products presents several promising strategies. Enzymatic hydrolysis using proteolytic enzymes could produce collagen hydrolysates suitable for application as nutritional supplements or animal feed components. Alternatively, fermentation-based bioprocessing may yield food-grade additives with functional properties. Regarding the fish pigment extract, a systematic evaluation of its dyeing capacity, stability, and bioactivity is warranted to assess its potential applications across various industries. Beyond BP valorization, process optimization is essential for enhancing sustainability. The LCA identifies energy and water consumption as primary environmental hotspots requiring targeted mitigation strategies.
3. Conclusions
The presented comprehensive technology for processing unused ACBP skeletons is characterized by a high efficiency of collagen conversion into collagen products — gelatins and hydrolysates — with overall yields exceeding those typically achieved in the processing of BPs from marine and freshwater fish. The prepared gelatins exhibit excellent gelling and surface properties, as well as low residual mineral content, making them suitable for the development of high-value-added matrices, such as in pharmaceuticals (soft and hard capsules), the food industry, or cosmetics. Fish oil with a high content of essential FAs, along with collagen hydrolysate, can be primarily used in the production of nutritional food supplements.
The LCA confirms that gelatin production from ACBPs is both energy-intensive and water-intensive. The application of the Environmental Footprint methodology reveals two primary environmental hotspots: electricity consumption (545.77 kWh/kg of gelatin) and water consumption (approximately 2,000 L/kg of gelatin). Scenario analysis demonstrates that transitioning to renewable energy sources produces the most substantial environmental benefit, reducing the carbon footprint by up to 50% while significantly decreasing freshwater eutrophication and fossil resource depletion. Water conservation through recycling and advanced treatment technologies represents the second critical improvement opportunity, particularly for managing organic nutrient-rich wastewater from the Washing and drying process. These findings provide clear guidance for industrial-scale implementation of sustainable gelatin production from aquaculture processing residues.
4. Materials and Methods
4.1. African Catfish By-Products and Their Proximate Composition
Samples of ACBPs, consisting of skeletons with residual soft tissue and skin, were obtained from Tilapia s.r.o. (Radenín-Hroby, Czech Republic), a commercial recirculating aquaculture system (RAS) facility specializing in the production and processing of AC. The fish were reared in temperature-controlled tanks at approximately 26 °C and harvested at an average body weight of 1.2–1.3 kg and age of 10–12 months (matured fish). They were fed a commercial extruded diet (EFICO Alpha 717, BioMar, Denmark). ACBPs were collected immediately after manual filleting under hygienic conditions. The remaining skeletons with attached soft tissue were processed using a belt-type mechanical separator. The resulting material was stored at 4 °C and transported to the laboratory for further processing within 24 hours.
The ACBPs were subjected to initial compositional analysis: moisture content was determined gravimetrically [65], ash content was measured after incineration [66], lipid content was assessed via Soxhlet extraction [67], and protein content was calculated from nitrogen content determined by the Kjeldahl method [68]. The ACBPs used in this study contained 65.8 ± 1.5% moisture, 15.4 ± 1.2% protein, 10.0 ± 1.1% lipid, and 5.2 ± 1.7% ash.
The moisture content (65.8 ± 1.5%) and protein content (15.4 ± 1.2%) are lower than most values reported for AC muscle and skin in the literature by Abdel-Modby et al. (2021) 71.3 ± 0.15% and 19.03 ± 0.46%, Alfaro et al. (2014) 74.76% and 17.98%, Osibona et al. (2009) 74.3 ± 3.7% and 18.8 ± 1.9%, Adeyemi & Akande (2011) 77.2% and 17.12 ± 0.12%, Chukwu & Shaba (2009) 71.85 ± 0.07% and 19.51 ± 0.18%, and Shadieva et al. (2020) 76.27 ± 1.07% and 18.48 ± 0.91% [9,38,49,69,70,71].
The lipid content from this study (10.0 ± 1.1%) comparable to those reported by Abdel-Modby et al. (2021) 8.1 ± 0.09%, and Osibona et al. (2009) 9.3 ± 0.3% on dry matter [9,49], but much higher than the value reported by Alfaro et al. (2014) 6.65% and Adeyemi & Akande (2011) 3.39 ± 0.78% [38,69], but significantly lower than that reported by Chukwu & Shaba (2009) 14.28 ± 0.19% [70]. The ash content in this study (5.2 ± 1.7%) is notably higher than the values reported by Abdel-Modby et al. (2021) 1.05 ± 0.14%, Alfaro et al. (2014) 2.4%, Osibona et al. (2009) 1.2 ± 0.5%, Adeyemi and Akande (2011) 1.53 ± 0.12%, and Chukwu & Shaba (2009) 3.06 ± 0.04% [9,38,49,69,70], and below than Shadieva et al. (2020) 8.03 ± 0.88% on dry matter [71].
This difference likely reflects the inclusion of bone and connective tissues in the current BP stream, which reduces the overall water and protein content while elevating the ash content compared to AC skin and meat. Although the chemical composition of AC tissues is influenced by multiple factors, including diet formulation, rearing conditions, age, and fish size, it is particularly affected in RASs, where feeding regimes are precisely controlled. Under such conditions, the nutritional profile of BPs — such as lipid, FA, protein, and ash content — tends to closely reflect the characteristics of the diet and production intensity. For instance, Shadieva et al. (2020) reported that increasing the proportion of plant-based ingredients in the feed led to decreased protein and increased fat levels in fillets [71]. Similarly, Effiong & Yaro (2020) showed that the source of dietary lipids (e.g., plant vs. fish oil) significantly influenced the FA composition of muscle tissue [51]. In contrast, Chwastowska-Siwiecka et al. (2016) found that sex had no statistically significant effect on the proximate composition of the AC muscle [72].
4.2. Appliances and Chemicals
The chemicals used were NaCl, NaOH, HCl, petroleum ether, hexane, and ethanol; all chemicals were of analytical grade and purchased from Lach-Ner s.r.o. (Neratovice, Czech Republic). Protamex® endoprotease enzyme was obtained from Novozymes (Copenhagen, Denmark). The enzyme exhibits optimal activity at a pH range of 5.5–7.5 and temperatures between 35 and 60 °C. This enzyme meets the recommended purity specifications for food-grade enzymes established by the Joint FAO/WHO Expert Committee on Food Additives (JECFA) and the Food Chemicals Codex (FCC).
4.3. Experimental Design and Statistical Analysis
The experiments were designed using a factorial approach with two factors. Factor A corresponded to the extraction temperature of the first gelatin fraction (35 and 45 °C), while Factor B corresponded to the extraction temperature of the second fraction (50 and 60 °C). This design enables the identification of the most influential process factors and the determination of their optimal values. All analytical determinations were conducted in triplicate. Data are expressed as mean ± standard deviation, and results with p < 0.05 were considered significant. Data were statistically analyzed using Minitab 17 (Minitab, LLC, Pennsylvania, USA). The means were compared using an ANOVA test.
4.4. Methodology of the Raw Material Processing
Figure 6 illustrates the sequential processing steps for converting ACBP skeletons into gelatin, hydrolysate, oil, and pigments.
The bones were minced using a Braher P22/82 meat mincer (13 mm plate, double-sided knife; Braher, San Sebastian, Spain), vacuum-packed in 1 kg portions (Henkelman Vacuum Systems, CK ‘s-Hertogenbosch, The Netherlands), and initially frozen at −85 ± 1 °C for 12 hours. The material was then stored at −18 ± 1 °C until processing. Prior to processing, the frozen material was thawed in a refrigerator at 5.0 ± 1.0 °C for 24 hours.
The purification process involved successive treatments to remove non-collagenous proteins, fat, and minerals. The thawed material was rinsed with cold water, treated with 0.2 M NaCl (1:6 w/v) for 1.5 hours to eliminate globulins, followed by four consecutive 0.03 M NaOH treatments (1:6 w/v) for 45 minutes each with intermittent stirring and cold-water rinses. The purified material was spread thin and dried in a hot air oven (Memmert ULP 400, Memmert GmbH, Büchenbach, Germany) at 35 ± 1 °C for 24–36 hours.
The dried material was defatted using a 1:6 (w/v) hexane solvent mixture with agitation on a shaker (LT 43 shaker, Nedform Ltd., Valašské Meziříčí, Czech Republic) for 1.5–2 days at room temperature with two solvent changes. After drying, the defatted collagen was milled using an analytical mill (IKA A 10, IKA-Werke GmbH, Staufen, Germany) to produce particles of approximately 3 mm in size and stored in a sealed, dark container at 22 ± 1 °C. Solvent was removed by vacuum evaporation (Heidolph Laborota 4010 Digital, Heidolph Instruments GmbH & Co. KG, Schwabach, Germany), and oil yield was determined gravimetrically.
For demineralization, the defatted collagen was treated with 1.0% HCl (1:10 w/v) at 10 ± 1 °C for 48 hours, with acid replacement after 24 hours (LT 43 shaker, Nedform Ltd., Valašské Meziříčí, Czech Republic; Lovibond Thermostatically Controlled Cabinet, Tintometer GmbH, Dortmund, Germany). The material was rinsed thoroughly with cold water, dried thinly at 35 ± 1 °C for 24–36 hours (Memmert ULP 400, Memmert GmbH, Büchenbach, Germany), and milled to a particle size of approximately 2 mm (analytical mill IKA A 10, IKA-Werke GmbH, Staufen, Germany).
Enzyme conditioning was performed by mixing 60.0 g of dried, purified collagen with 600 ml of distilled water and 0.1% Protamex® (0.056 g, calculated based on 56.209 g dry matter content of the 60.000 g sample). The pH was adjusted to 6.0–7.0 using 20% NaOH and monitored manually throughout the process (WTW pH 526 pH meter, WTW GmbH, Oberbayern, Germany). The mixture was incubated at 10 ± 1 °C for 3 hours in a Lovibond Thermostatically Controlled Cabinet (Tintometer GmbH, Dortmund, Germany) and an LT 43 shaker (Nedform Ltd., Valašské Meziříčí, Czech Republic) with continuous shaking. After enzymatic treatment, the hydrolysate was separated by filtration through a triple-layer fine sieve and dried on metal trays at 70 ± 1 °C for 24 hours. The enzyme-treated raw material was subsequently rinsed thoroughly with clean water for 5 minutes to remove any residual enzyme before further processing.
The microbial protease-treated raw material was further processed through sequential gelatin extractions using hot water extraction at a ratio of 1:10 (w/v) with an IKA LABORTECHNIK RCT BASIC magnetic mixer and heating plate (Staufen, Germany). Starting at 35–45 ± 1 °C (first changing factor: A factor) for 20 minutes, then at 50–60 ± 1 °C (second changing factor, B factor) for 25 minutes, followed by 70 ± 1 °C for 20 minutes, and finally at 90 ± 1 °C for 30 minutes. For the first two extractions, rapid heating to 85 ± 1 °C for 4 minutes was applied after the extractions to inactivate the enzyme that remained after the conditioning step. Gelatin solutions were filtered, centrifuged for 5 minutes at 8000 rpm (Rotina 35 centrifuge, Hettich Zentrifugen, Tuttlingen, Germany) for pigment obtainment, dried stepwise (40 ± 1 °C for 20 hours), and ground to 1 mm.
4.5. Life Cycle Assessment of the Process
The environmental impact of fish gelatin production was assessed using LCA according to ISO 14040 and ISO 14044 standards [73,74]. A cradle-to-gate approach was adopted, with a functional unit of 1 kg of gelatin, encompassing both raw material processing and production stages (Figure 7). Fish processing waste from the farm was considered feedstock entering with zero environmental burden and no transport requirements. The system boundary ended at the factory gate, excluding packaging, distribution, and end-of-life stages; BPs (fats, minerals, pigments, collagen hydrolysates) were allocated physically based on mass ratios. Hexane defatting was modeled with a 62% recycling efficiency, using the Czech Republic's energy mix for electricity, and assuming tap water for water consumption. The Protamex enzyme input was excluded due to its negligible mass. Environmental impacts were calculated using Umberto 11 software (iPoint-systems) with ecoinvent 3.11 database and the Product Environmental Footprint (EF 3.1) method [75], assessing climate change, human health, ecosystem quality, and resource depletion. Foreground data were obtained from laboratory measurements simulating semi-commercial operation (February–May 2025), while background data for chemicals and electricity were sourced from ecoinvent 3.11 [76,77] using Czech, European, or global averages as appropriate (Table 11, Figure 8).
4.6. Properties of the Prepared Products
4.6.1. Fish Gelatin Properties
Gel strength and viscosity were determined according to the standard testing methods for edible gelatins [78]. Gel strength was measured using a Stevens LFRA Texture Analyzer (Leonard Farnell and Co ltd., Norfolk, England) on 6.67% gelatin gels matured at 10 ± 1 °C for 17–18 hours and then compressed by a 4 mm by 12.7 mm diameter flat-faced cylindrical Teflon plunger. Dynamic viscosity was determined by measuring the flow time at 60 ± 0.5°C using a Haake P5 Circulating Bath with a Thermo C10 Controller (Thermo Fisher Scientific, Waltham, USA) and a Ubbelohde viscometer.
Yield calculations were based on the percentage of gelatin obtained relative to the weight of the purified raw material. For each gelatin fraction, yield was calculated as the mass of gelatin produced divided by the initial mass of purified raw material and expressed as a percentage (equation 1). Yields for both the hydrolysate and pigment fractions were determined using the same method (equations 2 and 3). The yield of the residual solid fraction, referred to as the "solid cake," was also calculated based on the mass remaining after each gelatin extraction, relative to the starting raw material (equation 4). Total gelatin yield is calculated as the sum of individual gelatin yields (equation 5). The mass balance error (MBE) was determined by summing all individual yields and subtracting the total from 100% (equation 6). Any discrepancy in the MBE likely results from trace amounts of raw material or gelatin solution lost during processing equipment or container handling.
where is the yield of hydrolysate (%), is the yield of the gelatin fractions (%), is the yield of the first gelatin fraction (%), is the yield of the second gelatin fraction (%), is the yield of the third gelatin fraction (%), is the yield of the fourth gelatin fraction (%), is the yield of pigment (%), is the solid cake (solid residual after extraction) (%), is total gelatin yield (%), is the weight of the purified raw material (g), is the weight of the hydrolysate (g), is the weight of gelatins (g), is the weight of pigment (g), is the weight of the solid cake (g), and the MBE is the mass balance error.
The melting point was measured using the capillary tube method with 6.67% gelatin gels described by Chen et al. (2022) [79]. 2–4 mm diameter capillaries were filled with the prepared gelatin samples to a depth of 0.5–1 cm. Each capillary was marked to indicate gel height and stored in a refrigerator to solidify. For the melting point measurement, a heated water bath with magnetic stirring was set up. A capillary was positioned alongside a temperature probe inside a test tube submerged in distilled water. Heating was initiated at a rate of 1.5 °C/min, and the temperature at which the gel column began to rise was recorded as the melting point. Each sample was analyzed in triplicate.
Gelling point was measured with the same 6.67% gelatin gel samples described in the same article by Chen et al. (2022) [79]. A melted gelatin sample was poured into a 10 mm diameter glass test tube and allowed to cool while submerged in chilled water. The sample temperature was reduced at a rate of 3 °C/min by adding ice water. A temperature probe monitored the cooling process. 0.1 g of metal balls were dropped into the sample at 1 °C intervals. The temperature at which the ball no longer sank marked the gelling point.
4.6.2. Fish Oil Fatty Acid Profile
FA profiles were determined following ISO standards with minor modifications [80,81,82,83]. Samples (0.4 g of raw material) were subjected to saponification using a microwave mineralizer with 5 mL of 2.8% methanolic KOH solution. The heating program consisted of ramping to 90 °C over 5 minutes, followed by a 10-minute hold at 90 °C. The resulting mixture was methylated using 15 mL of methanolic acetyl chloride with a temperature program of a 5-minute ramp to 120 °C followed by a 6-minute hold. After cooling, the FAs were extracted with 10 mL of heptane and then salted out using a saturated sodium chloride solution. The organic layer was separated, filtered through 0.22 μm filters, and dried over anhydrous sodium sulfate. Fatty acid methyl esters (FAMEs) were analyzed using a Shimadzu GC-2030 gas chromatograph coupled with a GCMS-TQ8040 NX triple quadrupole mass spectrometer (Shimadzu, Kyoto, Japan). The system featured an ion source, high-performance collision cell (UFsweeper™), and patented electric field control technology (Nexis™ GC-2030) for precise mass resolution. Separation was carried out on an SPB®-PUFA capillary GC column (30 m × 0.25 mm × 0.20 μm) using helium as carrier gas at a linear velocity of 32.0 cm/s with a total flow rate of 41.4 mL/min. Sample injection was performed using an AOC-6000 Plus autosampler at an injection temperature of 220 °C. The column oven was initially held at 80 °C for 2 minutes, then ramped to 150 °C at a rate of 8 °C/min, followed by a ramp to 220 °C at a rate of 2 °C/min, and finally held for 39.25 minutes. Samples were contained in Shimadzu glass vials (2 mL, clear glass, 12 × 32 mm crimp neck, round bottom) equipped with magnetic caps (CHS-AL11-ST-C, 11 mm with a center hole) and white, transparent silicone/PTFE septa (thickness ~1.3 mm, silicone hardness 45° Shore A). Detection was performed with a detector gain of 0.95 kV, and the MS acquisition window was set from 4.05 to 84.99 minutes. Identification of detected components was performed by matching their mass spectra with reference spectra using the NIST20 library for similarity search.
4.6.3. Fish Oil Peroxide Value
The PV was determined by iodometric titration using a standardized 0.01 M sodium thiosulfate solution according to the ISO standard with minor modification [84]. The Na₂S₂O₃ solution was prepared by dissolving 0.625 g of Na₂S₂O₃·5H₂O in 250 mL of distilled water and standardized against a primary 0.01N potassium dichromate (K₂Cr₂O₇) solution using potassium iodide and hydrochloric acid. For the PV determination, 1.0–1.5 g of fat was accurately weighed into a 250 mL Erlenmeyer flask, dissolved in 25 mL of chloroform–acetic acid (1:1, v/v), and treated with 1 mL KI. After 5 minutes in the dark, 75 mL of distilled water and 2 mL of starch indicator were added, and the liberated iodine was titrated with the standardized Na₂S₂O₃ solution until the color disappeared. A blank was run in parallel, and the PV was calculated as shown in equation 7.
where M is the exact concentration of the prepared Na₂S₂O₃ solution, a is the volume of 0.01 M Na₂S₂O₃ required to titrate the sample (ml), b is the volume of 0.01 M Na₂S₂O₃ required to titrate the blank (ml), and n is the mass of oil added to the sample (g).
5. Patents
European Patent No. EP3707215. "Biotechnology-based production of food gelatine from poultry by-products." Granted June 25, 2025. Proprietor: Tomas Bata University in Zlín, Nám. T. G. Masaryka 5555, 76001 Zlín, Czech Republic. European Patent Office, Munich.
Author Contributions
“Conceptualization, O.B. and P.M.; methodology, O.B.; software, M.K.; validation, J.P., P.M. and O.B.; formal analysis, D.K.; investigation, O.B. and O.R.; resources, J.P.; data curation, M.K.; writing—original draft preparation, O.B. and P.M.; writing—review and editing, O.B. and P.M.; visualization, O.B.; supervision, P.M.; project administration, R.G.; funding acquisition, R.G. All authors have read and agreed to the published version of the manuscript.”
Funding
This research was funded by the Internal Grant Agency of the Faculty of Technology, Tomas Bata University in Zlín, ref. No. IGA/FT/2025/006 and the funding from the development process of the Centre of Polymer Systems, Tomas Bata University in Zlín, program DKRVO (RP/CPS/2024-28/002), supported by the Ministry of Education, Youth and Sports of the Czech Republic.
Data Availability Statement
The original contributions presented in the study are included in the article; further inquiries can be directed to the corresponding author.
Acknowledgments
The authors thank David Dohnal (Přerov, the Czech Republic) for editing the manuscript.
Conflicts of Interest
The authors declare no conflicts of interest. The funders had no role in the design of the study; in the collection, analyses, or interpretation of data; in the writing of the manuscript; or in the decision to publish the results.
Abbreviation
The following abbreviations are used in this manuscript:
| AC | African catfish |
| ALA | α-linolenic acid |
| BPs | By-products |
| DHA | Docosahexaenoic acid |
| EF | Environmental Footprint |
| EPA | Eicosapentaenoic acid |
| FA | Fatty acid |
| FAMEs | Fatty acid methyl esters |
| LA | Linoleic acid |
| LCA | Life cycle assessment |
| MBE | Mass balance error |
| MUFA | Monounsaturated fatty acid |
| PA | Palmitic acid |
| PUFA | Polyunsaturated fatty acid |
| PV | Peroxide value |
| RAS | Recirculating aquaculture system |
| SA | Stearic acid |
| SFA | Saturated fatty acid |
References
- The State of World Fisheries and Aquaculture 2024 | Blue Transformation in Action. Available online: https://openknowledge.fao.org/server/api/core/bitstreams/1273bc36-339b-43d2-8163-af4d805f2ad2/content/sofia/2024/fisheries-aquaculture-projections.html (accessed on 12 November 2025).
- The global growth of by-products | IFFO – The Marine Ingredients Organisation. Available online: https://www.iffo.com/global-growth-products (accessed on 12 November 2025).
- Sarker, M.Z.I.; Selamat, J.; Habib, A.S.M.A.; Ferdosh, S.; Akanda, M.J.H.; Jaffri, J.M. Optimization of supercritical CO2 Extraction of fish oil from viscera of African Catfish (Clarias gariepinus). Int. J. Mol. Sci. 2012, 13, 11312–11322. [Google Scholar] [CrossRef]
- Okomoda, V.T.; Tiamiyu, L.O.; Ricketts, A.O.; Oladimeji, S.A.; Agbara, A.; Ikhwanuddin, M.; Alabi, K.I.; Abol-Munafi, A.B. Hydrothermal processing of Clarias gariepinus (Burchell, 1822) filets: Insights on the nutritive value and organoleptic parameters. Vet. Sci. 2020, 7, 133. [Google Scholar] [CrossRef] [PubMed]
- The State of World Fisheries and Aquaculture 2022 — Towards Blue Transformation. Available online: https://openknowledge.fao.org/server/api/core/bitstreams/1b0c8294-8746-41a4-aea7-e87fd996a13f/content (accessed on 12 November 2025).
- Hungary: EU-funded research project to boost production of African catfish. Available online: https://eurofish.dk/news/hungary-eu-funded-research-project-to-boost-production-of-african-catfish/#:~:text=Hungary's%20annual%20production%20of%20African,the%20species%20in%20the%20EU (accessed on 12 November 2025).
- Peteri, A.; Moth-Poulsen, T.; Kovacs, E.; Toth, I.; Woynarovich, A. African catfish (Clarias gariepinus, Burchell 1822) production with special reference to temperate zones: A manual; FAO: Rome, Italy, 2015; 93p. [Google Scholar]
- Zeleke Tilinti, B., Birhanu Ayichiluhim, T., Mekonnen Tura, A., Duraisamy, R. Extraction and characterizations of omega 3-fatty acid from cat fish collected from Arba Minch Chamo Lake. Cogent Food & Agriculture 2023, 1, 9. [CrossRef]
- Abdel-Mobdy, H.E.; Abdel-Aal, H.A.; Souzan, S.L.; Nassar, A.G. Nutritional value of African catfish (Clarias gariepinus) meat. Asian J. Appl. Chem. Res. 2021, 8, 31–39. [Google Scholar] [CrossRef]
- Ruiz-Salmón, I.; Laso, J.; Margallo, M.; Villanueva-Rey, P.; Rodríguez, E.; Quinteiro, P.; Dias, A.C.; Almeida, C.; Nunes, M.L.; Marques, A.; Cortés, A.; Moreira, M.T.; Feijoo, G.; Loubet, P.; Sonnemann, G.; Morse, A.P.; Cooney, R.; Clifford, E.; Regueiro, L.; Méndez, D.; Anglada, C.; Noirot, C.; Rowan, N.; Vázquez-Rowe, I.; Aldaco, R. Life cycle assessment of fish and seafood processed products—A review of methodologies and new challenges. Sci. Total Environ. 2021, 761, 144094. [Google Scholar] [CrossRef] [PubMed]
- Poore, J.; Nemecek, T. Reducing food’s environmental impacts through producers and consumers. Science 2018, 360(6392), 987–992. [Google Scholar] [CrossRef]
- Wojdalski, J.; Krajnik, M.; Borowski, P.F.; Dróżdż, B.; Kupczyk, A. Energy and water efficiency in the gelatine production plant. AIMS Geosci. 2020, 6(4), 491–503. [Google Scholar] [CrossRef]
- Sampaio, A.P.C.; de Sá M. de Sousa Filho, M.; Castro, A.L.A.; et al. Life cycle assessment from early development stages: the case of gelatin extracted from tilapia residues. Int. J. Life Cycle Assess. 2017, 22(4), 767–783.
- Ma, Y.; Zeng, X.; Ma, X.; Yang, R.; Zhao, W. A simple and eco-friendly method of gelatin production from bone: One-step biocatalysis. J. Clean. Prod. 2018, 200, 1–8. [Google Scholar] [CrossRef]
- Noreen, S.; Siddiqa, A.; Fatima, R.; Anwar, F.; Adnan, M.; Raza, A. Protease production and purification from agro-industrial waste by utilizing Penicillium digitatum. Int. J. Appl. Biol. Forensics 2017, 1(4), 119–129. [Google Scholar]
- Rao, M.B.; Tanksale, A.M.; Ghatge, M.S.; Deshpande, V.V. Molecular and biotechnological aspects of microbial proteases. Microbiol. Mol. Biol. Rev. 1998, 62(3), 597–635. [Google Scholar] [CrossRef]
- See, S.F.; Ghassem, M.; Mamot, S.; Babji, A.S. Effect of different pretreatments on functional properties of African catfish (Clarias gariepinus) skin gelatin. J. Food Sci. Technol. 2013, 52(2), 753–762. [Google Scholar] [CrossRef]
- Usman, M.; Sahar, A.; Inam-Ur-Raheem, M.; Ur Rahman, U.; Sameen, A.; Aadil, R.M. Gelatin extraction from fish waste and potential applications in food sector. Int. J. Food Sci. Technol. 2021, 56(12), 1–10. [Google Scholar] [CrossRef]
- Ahmed, J.; Basu, S. Advances in Food Rheology and Its Applications – Development in Food Rheology, 2nd ed.; Elsevier: Amsterdam, The Netherlands, 2023; p. 591. Available online: https://app.knovel.com/hotlink/pdf/id:kt013G5UM5/advances-in-food-rheology/rheology-g-introduction (accessed on 10 November 2025).
- Joy, J.M.; Padmaprakashan, A.; Pradeep, A.; Paul, P.T.; Mannuthy, R.J.; Mathew, S. A review on fish skin-derived gelatin: Elucidating the gelatin peptides—preparation, bioactivity, mechanistic insights, and strategies for stability improvement. Foods 2024, 13, 2793. [Google Scholar] [CrossRef] [PubMed]
- Al-Nimry, S.; Abu Dayah, A.; Hasan, I.; Daghmash, R. Cosmetic, biomedical and pharmaceutical applications of fish gelatin/hydrolysates. Mar. Drugs 2021, 19, 145. [Google Scholar] [CrossRef]
- Sinthusamran, S.; Benjakul, S.; Kishimura, H. Characteristics and gel properties of gelatin from skin of seabass (Lates calcarifer) as influenced by extraction conditions. Food Chem. 2014, 152, 276–284. [Google Scholar] [CrossRef]
- Derkach, S.R.; Voron’ko, N.G.; Kuchina, Y.A.; Kolotova, D.S. Modified fish gelatin as an alternative to mammalian gelatin in modern food technologies. Polymers (Basel) 2020, 12(12), 3051. [Google Scholar] [CrossRef]
- Al Khawli, F.; Pateiro, M.; Domínguez, R.; Lorenzo, J.M.; Gullón, P.; Kousoulaki, K.; Ferrer, E.; Berrada, H.; Barba, F.J. Innovative green technologies of intensification for valorization of seafood and their by-products. Mar. Drugs 2019, 17(12), 689. [Google Scholar] [CrossRef] [PubMed]
- Mokrejš, P.; Gál, R.; Pavlačková, J.; Janáčová, D. Valorization of a by-product from the production of mechanically deboned chicken meat for preparation of gelatins. Molecules 2021, 26(2), 349. [Google Scholar] [CrossRef] [PubMed]
- Saibu, G.M.; Adeyemo, G.A.; Adu, O.B.; Avoseh, O.N.; Phillips, I.M.; Ayeni, T.O.; Nwatulegwu, B.I.; Anetekhai, M.A. Comparative analysis of physicochemical properties and fatty acid profiles of crude and purified oil from African catfish (Clarias gariepinus). J. Food Stability 2025, 8(1), 14–25. [Google Scholar]
- Eke-Ejiofor, J.; Ansa, E.J. Effect of extraction methods on the quality characteristics of catfish (Clarias gariepinus) oil. Am. J. Food Sci. Technol. 2018, 6(5), 199–203. [Google Scholar]
- Habib, A.S.M.A.; Sarkar, P. Extraction and identification of PUFA from African catfish (Clarias gariepinus) skin. Int. J. Fish. Aquat. Stud. 2016, 4(4), 312–314. [Google Scholar]
- Huang, T.-H.; Wang, P.-W.; Yang, S.-C.; Chou, W.-L.; Fang, J.-Y. Cosmetic and therapeutic applications of fish oil’s fatty acids on the skin. Mar. Drugs 2018, 16(8), 256. [Google Scholar] [CrossRef]
- Atmadja, T.; Kusharto, C.; Sinaga, T. Supplementation of catfish (Clarias gariepinus) oil enriched with omega-3 soft capsule improves oxidative stress and cognitive function in elderly. J. Nutr. Sci. Vitaminol. 2020, 66, S47–S50. [Google Scholar] [CrossRef] [PubMed]
- Jensen, M.B.; Jakobsen, J.; Jacobsen, C.; Sloth, J.J.; Ibarruri, J.; Bald, C.; Iñarra, B.; Bøknæs, N.; Sørensen, A.-D.M. Content and bioaccessibility of minerals and proteins in fish-bone containing side-streams from seafood industries. Mar. Drugs 2024, 22, 162. [Google Scholar] [CrossRef]
- FAO. The State of World Fisheries and Aquaculture 2004 . Available online: https://www.fao.org/4/t8389e/T8389E00.htm (accessed on 13 November 2025).
- Chapman, F.A.; Miles, R.D. How ornamental fish get their color: FA192. In EDIS 2018; 3; University of Florida Extension: Gainesville, FL, USA, 2018. [Google Scholar] [CrossRef]
- Sala, S.; Crenna, E.; Secchi, M.; Pant, R. Global Normalisation Factors for the Environmental Footprint and Life Cycle Assessment (JRC109878, EUR 28984 EN); Publications Office of the European Union: Luxembourg, 2017; ISBN 978-92-79-77213-9. Accessible online: https://publications.jrc.ec.europa.eu/repository/handle/JRC109878 (accessed on 15 September 2025). [CrossRef]
- Andreasi Bassi, S.; Biganzoli, F.; Ferrara, N.; Amadei, A.; Valente, A.; Sala, S.; Ardente, F. Updated Characterisation and Normalisation Factors for the Environmental Footprint 3.1 Method (EUR 31414 EN, JRC130796); Publications Office of the European Union: Luxembourg, 2023; ISBN 978-92-76-99069-7. Accessible online: https://publications.jrc.ec.europa.eu/repository/handle/JRC130796 (accessed on 15 September 2025). [CrossRef]
- Intergovernmental Panel on Climate Change (IPCC). Climate Change 2021: The Physical Science Basis. Contribution of Working Group I to the Sixth Assessment Report of the Intergovernmental Panel on Climate Change; Masson-Delmotte, V., Zhai, P., Pirani, A., Connors, S.L., Péan, C., Berger, S., Caud, N., Chen, Y., Goldfarb, L., Gomis, M.I., Huang, M., Leitzell, K., Lonnoy, E., Matthews, J.B.R., Maycock, T.K., Waterfield, T., Yelekçi, O., Yu, R., Zhou, B., Eds.; Cambridge University Press: Cambridge, United Kingdom and New York, NY, USA, 2021; 2391 pp. Accessible online: https://www.ipcc.ch/report/ar6/wg1/downloads/report/IPCC_AR6_WGI_FullReport.pdf (accessed on 30 September 2025). [CrossRef]
- Wojdalski, J.; Krajnik, M.; Borowski, P.; Dróżdż, B.; Kupczyk, A. Energy and water efficiency in the gelatine production plant. AIMS Geosciences 2020, 6(4), 491–503. [Google Scholar] [CrossRef]
- Alfaro, A.T.; Biluca, F.C.; Marquetti, C.; et al. African catfish (Clarias gariepinus) skin gelatine: Extraction optimization and physical–chemical properties. Food Res. Int. 2014, 65, 416–422. [Google Scholar] [CrossRef]
- Sanaei, A.V.; Mahmoodani, F.; See, S.F.; et al. Optimization of gelatin extraction and physico-chemical properties of catfish (Clarias gariepinus) bone gelatine. Int. Food Res. J. 2013, 20(1), 423. [Google Scholar]
- Muyonga, J.H.; Cole, C.G.B.; Duodu, K.G. Extraction and physico-chemical characterisation of Nile perch (Lates niloticus) skin and bone gelatin. Food Hydrocoll. 2004, 18(4), 581–592. [CrossRef]
- Jamilah, B.; Harvinder, K.G. Properties of gelatins from skins of fish – black tilapia (Oreochromis mossambicus) and Red tilapia (Oreochromis niloticus). Food Chem. 2002, 77(1), 81–84. [CrossRef]
- Gudmundsson, M. Rheological properties of fish gelatins. J. Food Sci. 2002, 67(6), 2172–2176. [Google Scholar] [CrossRef]
- Guðmundsson, M.; Hafsteinsson, H. Gelatin from cod skins as affected by chemical treatments. J. Food Sci. 1997, 62(1), 37–39. [Google Scholar] [CrossRef]
- Ledward, D.A. Gelation of gelatin. In Functional Properties of Food Macromolecules; Mitchell, F., Ledward, D.A., Eds.; Elsevier Applied Science: London, UK, 1986; pp. 171–201. [Google Scholar]
- Gómez-Guillén, M.C.; Dávila-Salvador, J.; García-Castells, E.; et al. Structural and physical properties of gelatin extracted from different marine species: a comparative study. Food Hydrocoll. 2002, 16(1), 25–34.
- Wu, J.; Xiao, J.; Zhu, M.; Yang, H.; Liu, J.; Liu, Y. Study of physicochemical and gelation properties of fish gelatin from different sources. Appl. Sci. 2023, 13(9), 5337. [CrossRef]
- Gilsenan, P.M.; Ross-Murphy, S.B. Rheological characterisation of gelatins from mammalian and marine sources. Food Hydrocoll. 2000, 14(2), 191–195. [CrossRef]
- Ibhadon, S.; Abdulsalami, M.S.; Emere, M.C.; Yilwa, V. Comparative study of proximate, fatty and amino acids composition of wild and farm-raised African catfish (Clarias gariepinus) in Kaduna, Nigeria. Pak. J. Nutr. 2015, 14(1), 56–61. [CrossRef]
- Osibona, A.O.; Kusemiju, K.; Akande, G.R. Proximate composition and fatty acids profile of the African catfish Clarias gariepinus. Acta SATECH J. Life & Phys. Sci. 2009, 3, 85–89. [Google Scholar]
- Sathivel, S.; Prinyawiwatkul, W.; King, J.M.; Grimm, C.C.; Lloyd, S. Oil production from catfish viscera. J. Am. Oil Chem. Soc. 2003, 80(4), 377–382. [CrossRef]
- Effiong, M.U.; Yaro, C.A. Fatty acid composition of fillets of African catfish (Clarias gariepinus) fed with various oil-based diets. Aquac. Stud. 2020, 20(1), 29–35. [CrossRef]
- Horrocks, L.A.; Yeo, Y.K. Health benefits of docosahexaenoic acid (DHA). Pharmacol. Res. 1999, 40(3), 211–225. [Google Scholar] [CrossRef]
- Santigosa, E.; Olsen, R.E.; Madaro, A.; Søfteland, L.; Carr, I. The impact of varying EPA:DHA ratio on Atlantic salmon health and welfare. Aquaculture 2023, 576, 739868. [Google Scholar] [CrossRef]
- Morounke, S.G.; Adesegun, G.G.; Benedict, A.O.; Nudewhenu, O.O.; Mercy, P.I.; Oluwatimileyin, A.T.; Ihuoma, B.I.; Agenuma, M.A. Comparative analysis of physicochemical properties and fatty acid profiles of crude and purified oil from African catfish (Clarias gariepinus). J. Food. Stab. 2025, 8(1), 14–25. [Google Scholar]
- Piccinin, E.; Cariello, M.; De Santis, S.; Ducheix, S.; Sabbà, C.; Ntambi, J.M.; Moschetta, A. Role of oleic acid in the gut-liver axis: from diet to the regulation of its synthesis via Stearoyl-CoA Desaturase 1 (SCD1). Nutrients 2019, 11(10), 2283. [CrossRef]
- Hu, W.; Fitzgerald, M.; Topp, B.; Alam, M.; O’Hare, T.J. A review of biological functions, health benefits, and possible de novo biosynthetic pathway of palmitoleic acid in macadamia nuts. J. Funct. Foods 2019, 62, 103520. [Google Scholar] [CrossRef]
- Gilbraith, W.E.; Carter, J.C.; Adams, K.; Sota-Uba, I.; Lavine, B.K.; Booksh, K.S.; Ottaway, J.M. Classification and peroxide value prediction of naturally aged edible oils using Raman and Infrared Spectral Analysis. Appl. Spectrosc. Pract. 2025, 3(2), 1–21. [Google Scholar] [CrossRef]
- Gotoh, N.; Wada, S. The importance of peroxide value in assessing food quality and food safety. J. Am. Oil Chem. Soc. 2006, 83(5), 473–474. [Google Scholar] [CrossRef]
- Ningrum, K.P.; Rohman, A.; Martien, R. Physicochemical characterization and fatty acid profiles of catfish oil (Clarias gariepinus). J. Food Pharm. Sci. 2023, 11(2), 860–866. [Google Scholar] [CrossRef]
- Adetuyi, O.O.; Aladekoye, G.; Akinbobola, A.P. Comparative study of proximate composition of oil extracted from African Catfish (Clarias gariepinus) viscera and red palm oil. In Proceedings of the Fisheries Society of Nigeria Annual Conference, Lagos, Nigeria, 2013.
- Sathivel, S.; Yin, H.; Prinyawiwatkul, W.; King, J.M. Comparisons of chemical and physical properties of catfish oils prepared from different extracting processes. J. Food Sci. 2009, 74(2), E70–E76. [CrossRef]
- Famurewa, J.A.V.; Akise, O.G.; Ogunbodede, T. Effect of storage methods on the nutritional qualities of African Catfish Clarias gariepinus (Burchell, 1822). Afr. J. Food Sci. 2017, 11(7), 223–233. [Google Scholar]
- Ming, C.S. Catfish Oil: The present and future references on past study. J. Fisheries Livest. Prod. 2023, 11, 417. [Google Scholar]
- Gál, R.; Mokrejš, P.; Pavlačková, J.; Janáčová, D. Cyprinus carpio skeleton byproduct as a source of collagen for gelatin preparation. Int. J. Mol. Sci. 2022, 23, 3164. [Google Scholar] [CrossRef] [PubMed]
- EN ISO 8534:2017. Animal and Vegetable Fats and Oils – Determination of Water Content – Karl Fischer Method (Pyridine Free); ISO: Brussels, Belgium, 2017.
- ISO 6884:2008. Animal and Vegetable Fats and Oils – Determination of Ash; ISO: Brussels, Belgium, 2008.
- ISO 1443:1973. Meat and Meat Products – Determination of Total Fat Content; ISO: Geneva, Switzerland, 1973.
- ISO 5983-1:2005. Animal Feeding Stuffs – Determination of Nitrogen Content and Calculation of Crude Protein Content – Part 1: Kjeldahl Method; ISO: Geneva, Switzerland, 2005.
- Adeyemi, R.S.; Akande, G.R. Thermophysical properties of farmed African freshwater Catfish (Clarias gariepinus) fillet for process design and optimization. Niger. Food J. 2011, 29(1), 34–42. [Google Scholar]
- Chukwu, O.; Shaba, I.M. Effects of drying methods on proximate compositions of catfish (Clarias gariepinus). World J. Agric. Sci. 2009, 5(1), 114–116. [Google Scholar]
- Shadieva, L.A.; Romanova, E.M.; Lyubomirova, V.N.; et al. Effect of feed composition on the nutritional value of meat of African catfish. BIO Web Conf. 2020, 27, 00134. [Google Scholar] [CrossRef]
- Chwastowska-Siwiecka, I.; Kondratowicz, J.; Kordalski, K.; et al. Quality of meat and selected welfare indicators of African catfish (Clarias gariepinus) depending on gender. Ital. J. Food Sci. 2016, 28(2), 391–401. [Google Scholar]
- ISO 14040:2006. Environmental Management – Life Cycle Assessment – Principles and Framework; ISO: Geneva, Switzerland, 2006.
- ISO 14044:2006. Environmental Management – Life Cycle Assessment – Requirements and Guidelines; ISO: Geneva, Switzerland, 2006.
- EUROPEAN COMMISSION. Commission Recommendation (EU) 2021/2279 of 15 December 2021 on the Use of the Environmental Footprint Methods to Measure and Communicate the Life Cycle Environmental Performance of Products and Organisations. Available online: https://eur-lex.europa.eu/eli/reco/2021/2279/2021-12-30 (accessed on 15 September 2025).
- Weidema, B.P.; Bauer, C.; Hischier, R.; Mutel, C.; Nemecek, T.; Reinhard, J.; Vadenbo, C.O.; Wernet, G. Overview and Methodology. Data Quality Guideline for the Ecoinvent Database Version 3; Ecoinvent Report 1(v3); The Ecoinvent Centre: St. Gallen, Switzerland, 2013. [Google Scholar]
- Wernet, G.; Bauer, C.; Steubing, B.; Reinhard, J.; Moreno-Ruiz, E.; Weidema, B. The Ecoinvent Database Version 3 (Part I): Overview and Methodology. Int. J. Life Cycle Assess. 2016, 21, 1218–1230. [Google Scholar] [CrossRef]
- Official Procedure of the Gelatin Manufacturers Institute of America, Inc. Standard Testing Methods for Edible Gelatin . Available online: http://www.gelatin-gmia.com/images/GMIA_Official_Methods_of_Gelatin_Revised_2013.pdf (accessed on 20 July 2021).
- Chen, T.; Xie, Y.; Huang, Y.; Zhang, S.; Liu, J.; Chen, W.; Wei, T. Physicochemical properties of gelatin produced from Nile Tilapia (Oreochromis niloticus) skin pretreated by chemical- and fermentation-methods. Int. Food Res. J. 2022, 29, 123–131. [Google Scholar]
- ISO 12966-1:2014; Animal and Vegetable Fats and Oils — Gas Chromatography of Fatty Acid Methyl Esters — Part 1: Guidelines on Modern Gas Chromatography of Fatty Acid Methyl Esters. ISO: Geneva, Switzerland, 2014.
- ISO 12966-2:2017; Animal and Vegetable Fats and Oils — Gas Chromatography of Fatty Acid Methyl Esters — Part 2: Preparation of Methyl Esters of Fatty Acids. ISO: Geneva, Switzerland, 2017.
- ISO 12966-4:2015; Animal and Vegetable Fats and Oils — Gas Chromatography of Fatty Acid Methyl Esters — Part 4: Determination by Capillary Gas Chromatography. ISO: Geneva, Switzerland, 2015.
- ISO 12966-3:2016; Animal and Vegetable Fats and Oils — Gas Chromatography of Fatty Acid Methyl Esters — Part 3: Preparation of Methyl Esters Using Sodium Methoxide. ISO: Geneva, Switzerland, 2016.
- ISO 3960:2017; Animal and Vegetable Fats and Oils – Determination of Peroxide Value – Iodometric (Visual) Endpoint Determination. ISO: Geneva, Switzerland, 2017.
Figure 1.
The influence of the temperature of the first and the second extraction on gelatin yields: (A) the yield of the first gelatin fraction; (B) the yield of the second gelatin fraction; (C) the yield of the third gelatin fraction; (D) the yield of the fourth gelatin fraction.
Figure 1.
The influence of the temperature of the first and the second extraction on gelatin yields: (A) the yield of the first gelatin fraction; (B) the yield of the second gelatin fraction; (C) the yield of the third gelatin fraction; (D) the yield of the fourth gelatin fraction.
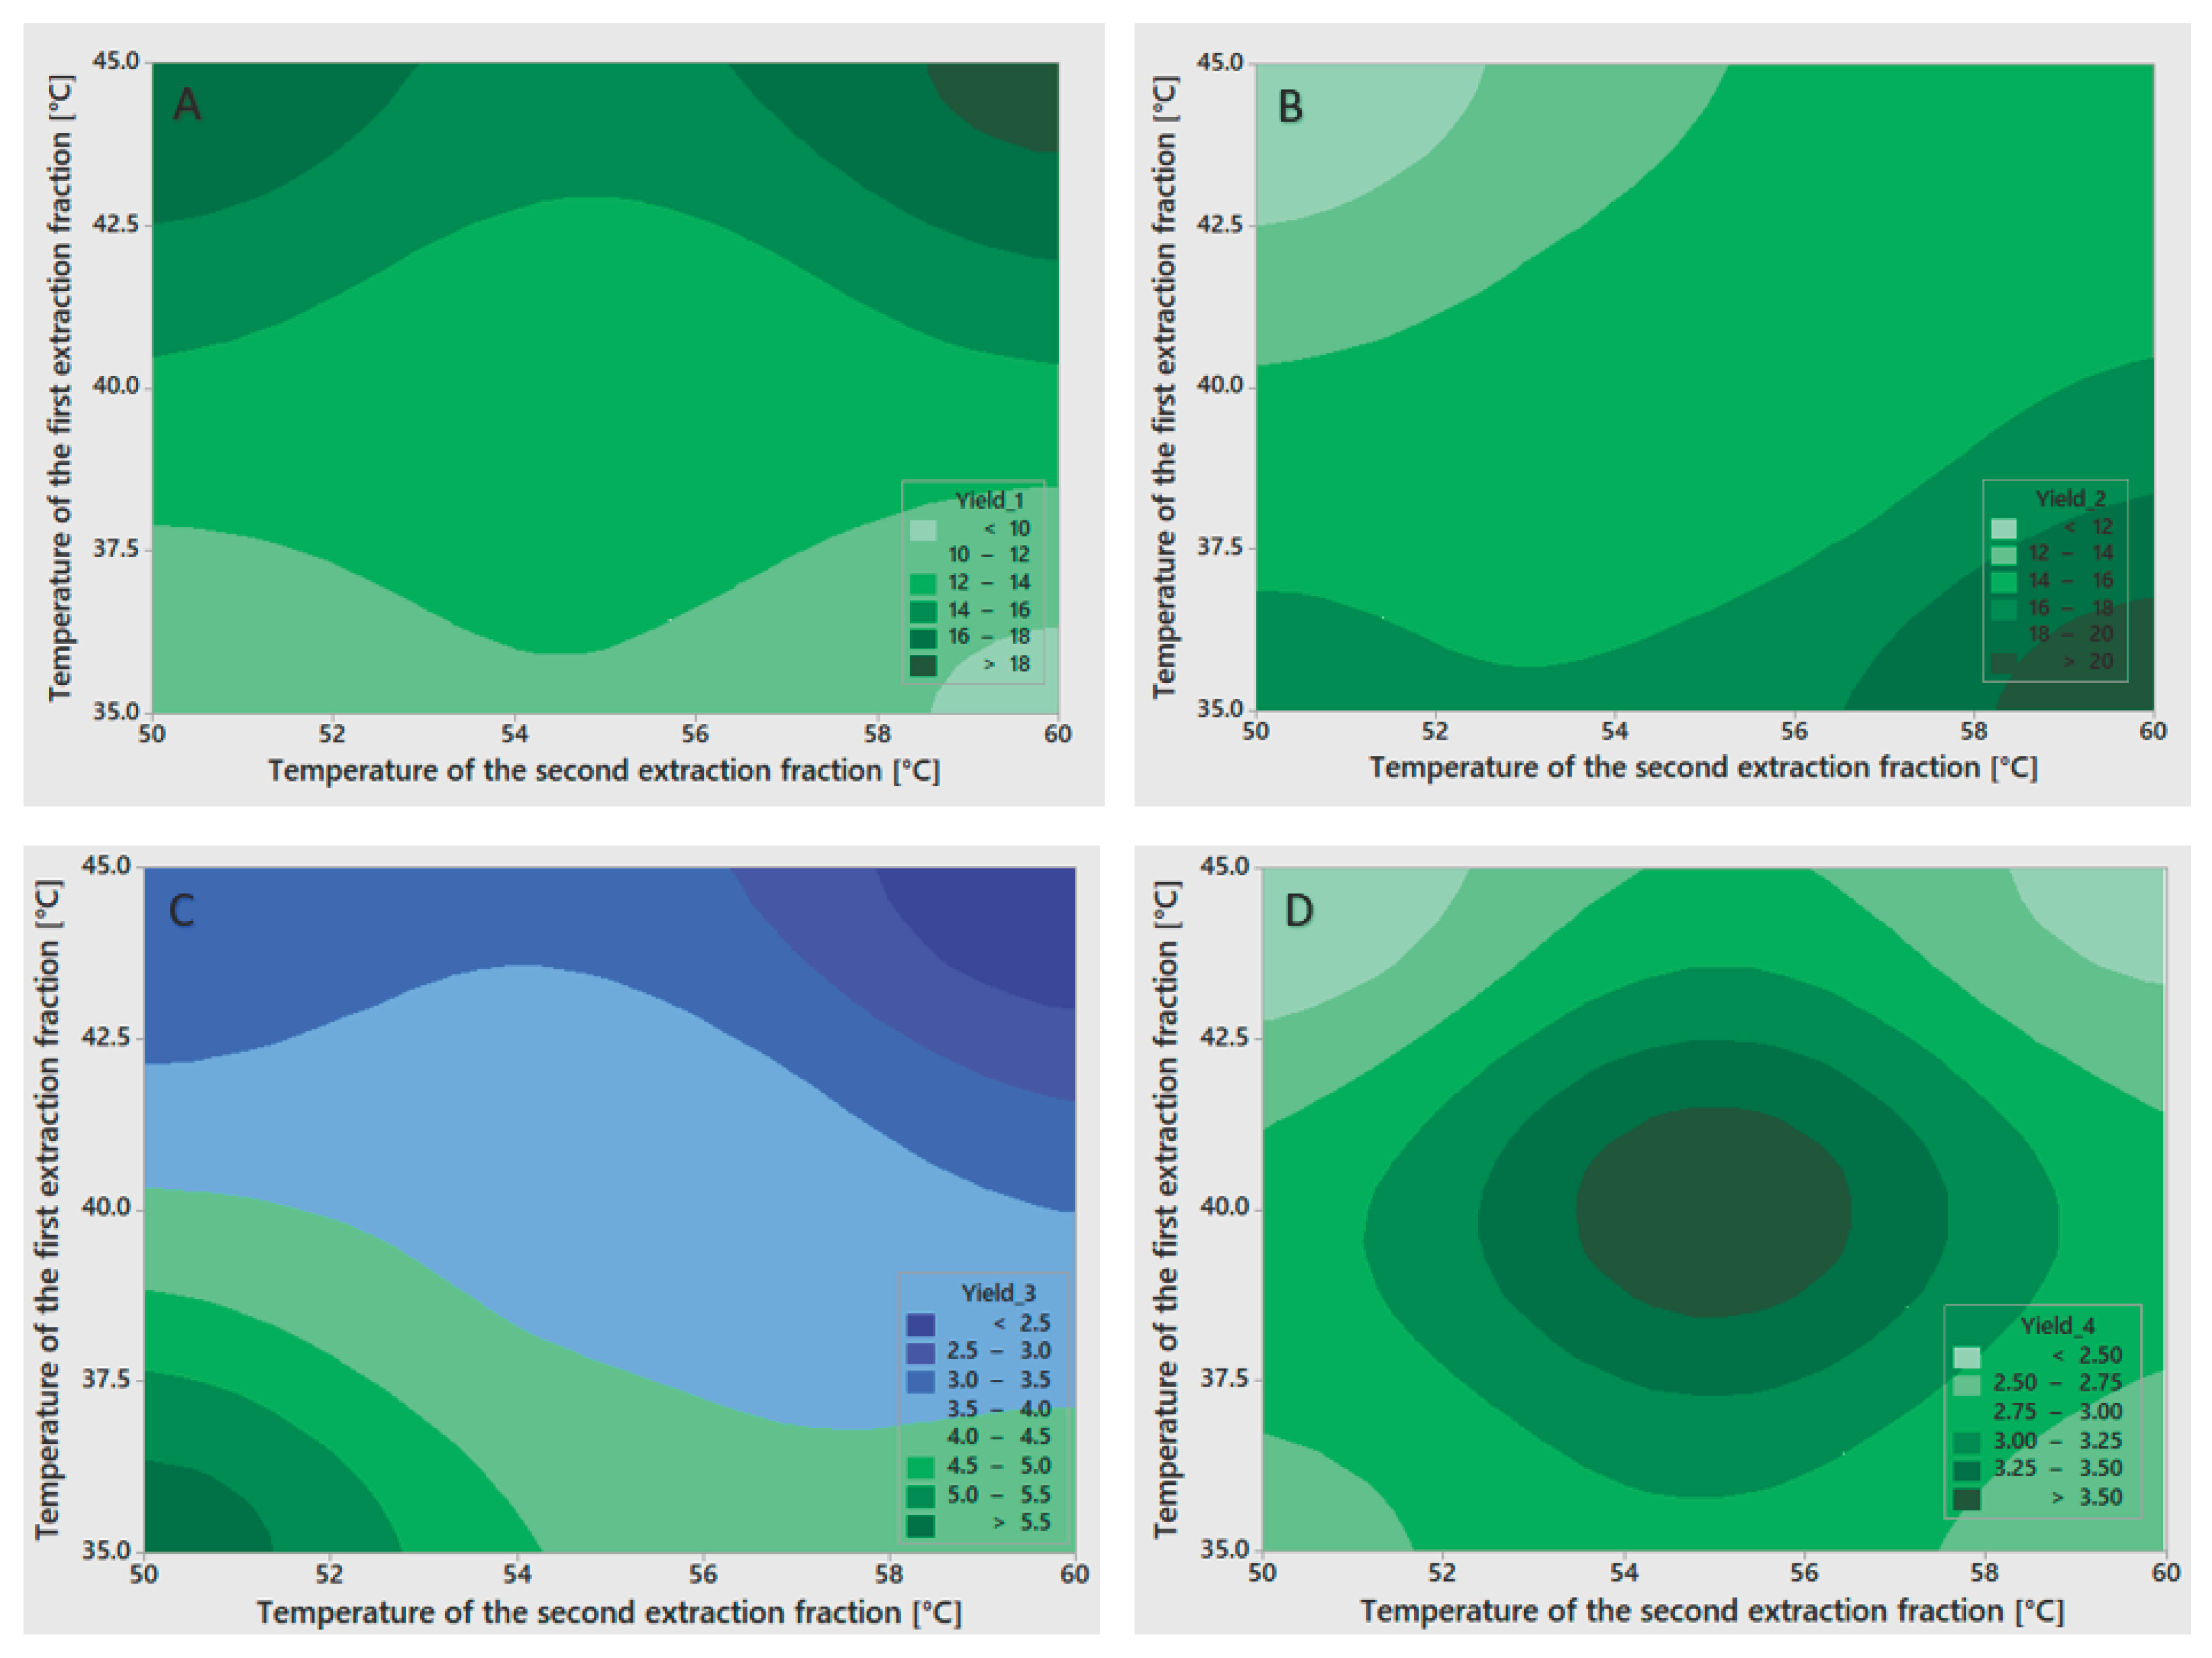
Figure 2.
Percentage contribution of individual processes to environmental impacts by impact category.
Figure 2.
Percentage contribution of individual processes to environmental impacts by impact category.
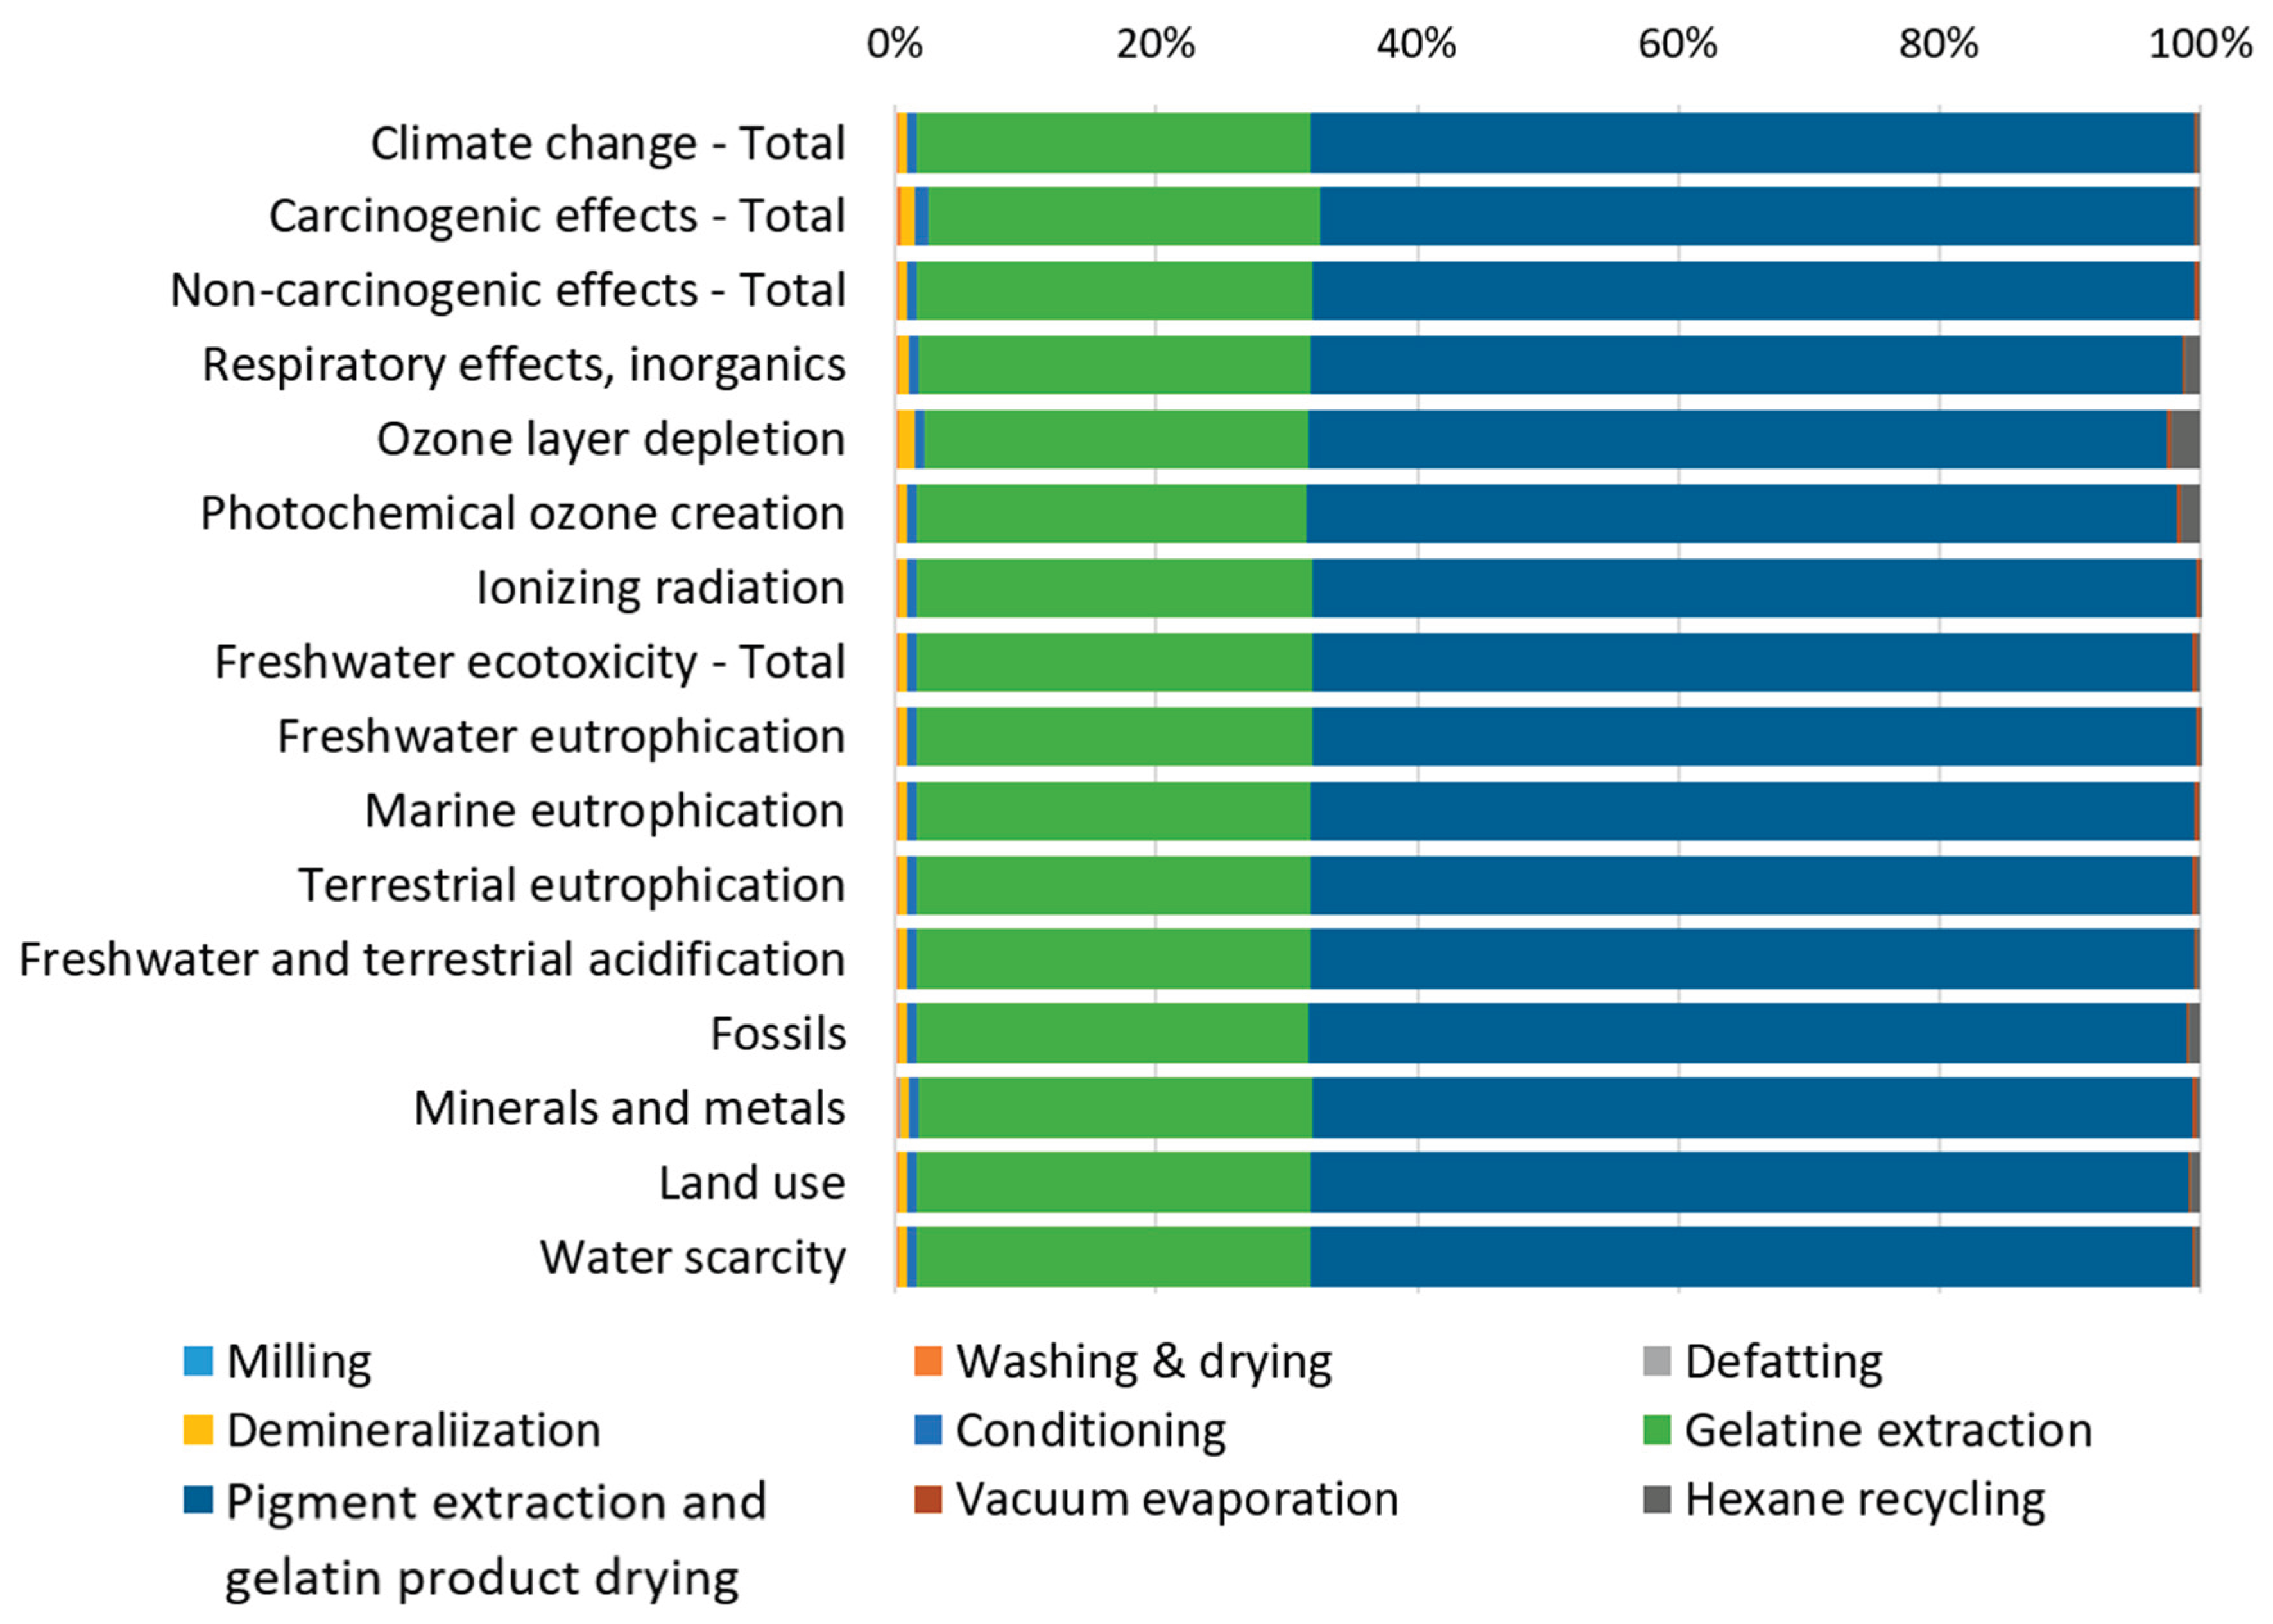
Figure 3.
Percentage contribution of individual impact categories to normalized (A) and weighted (B) results.
Figure 3.
Percentage contribution of individual impact categories to normalized (A) and weighted (B) results.
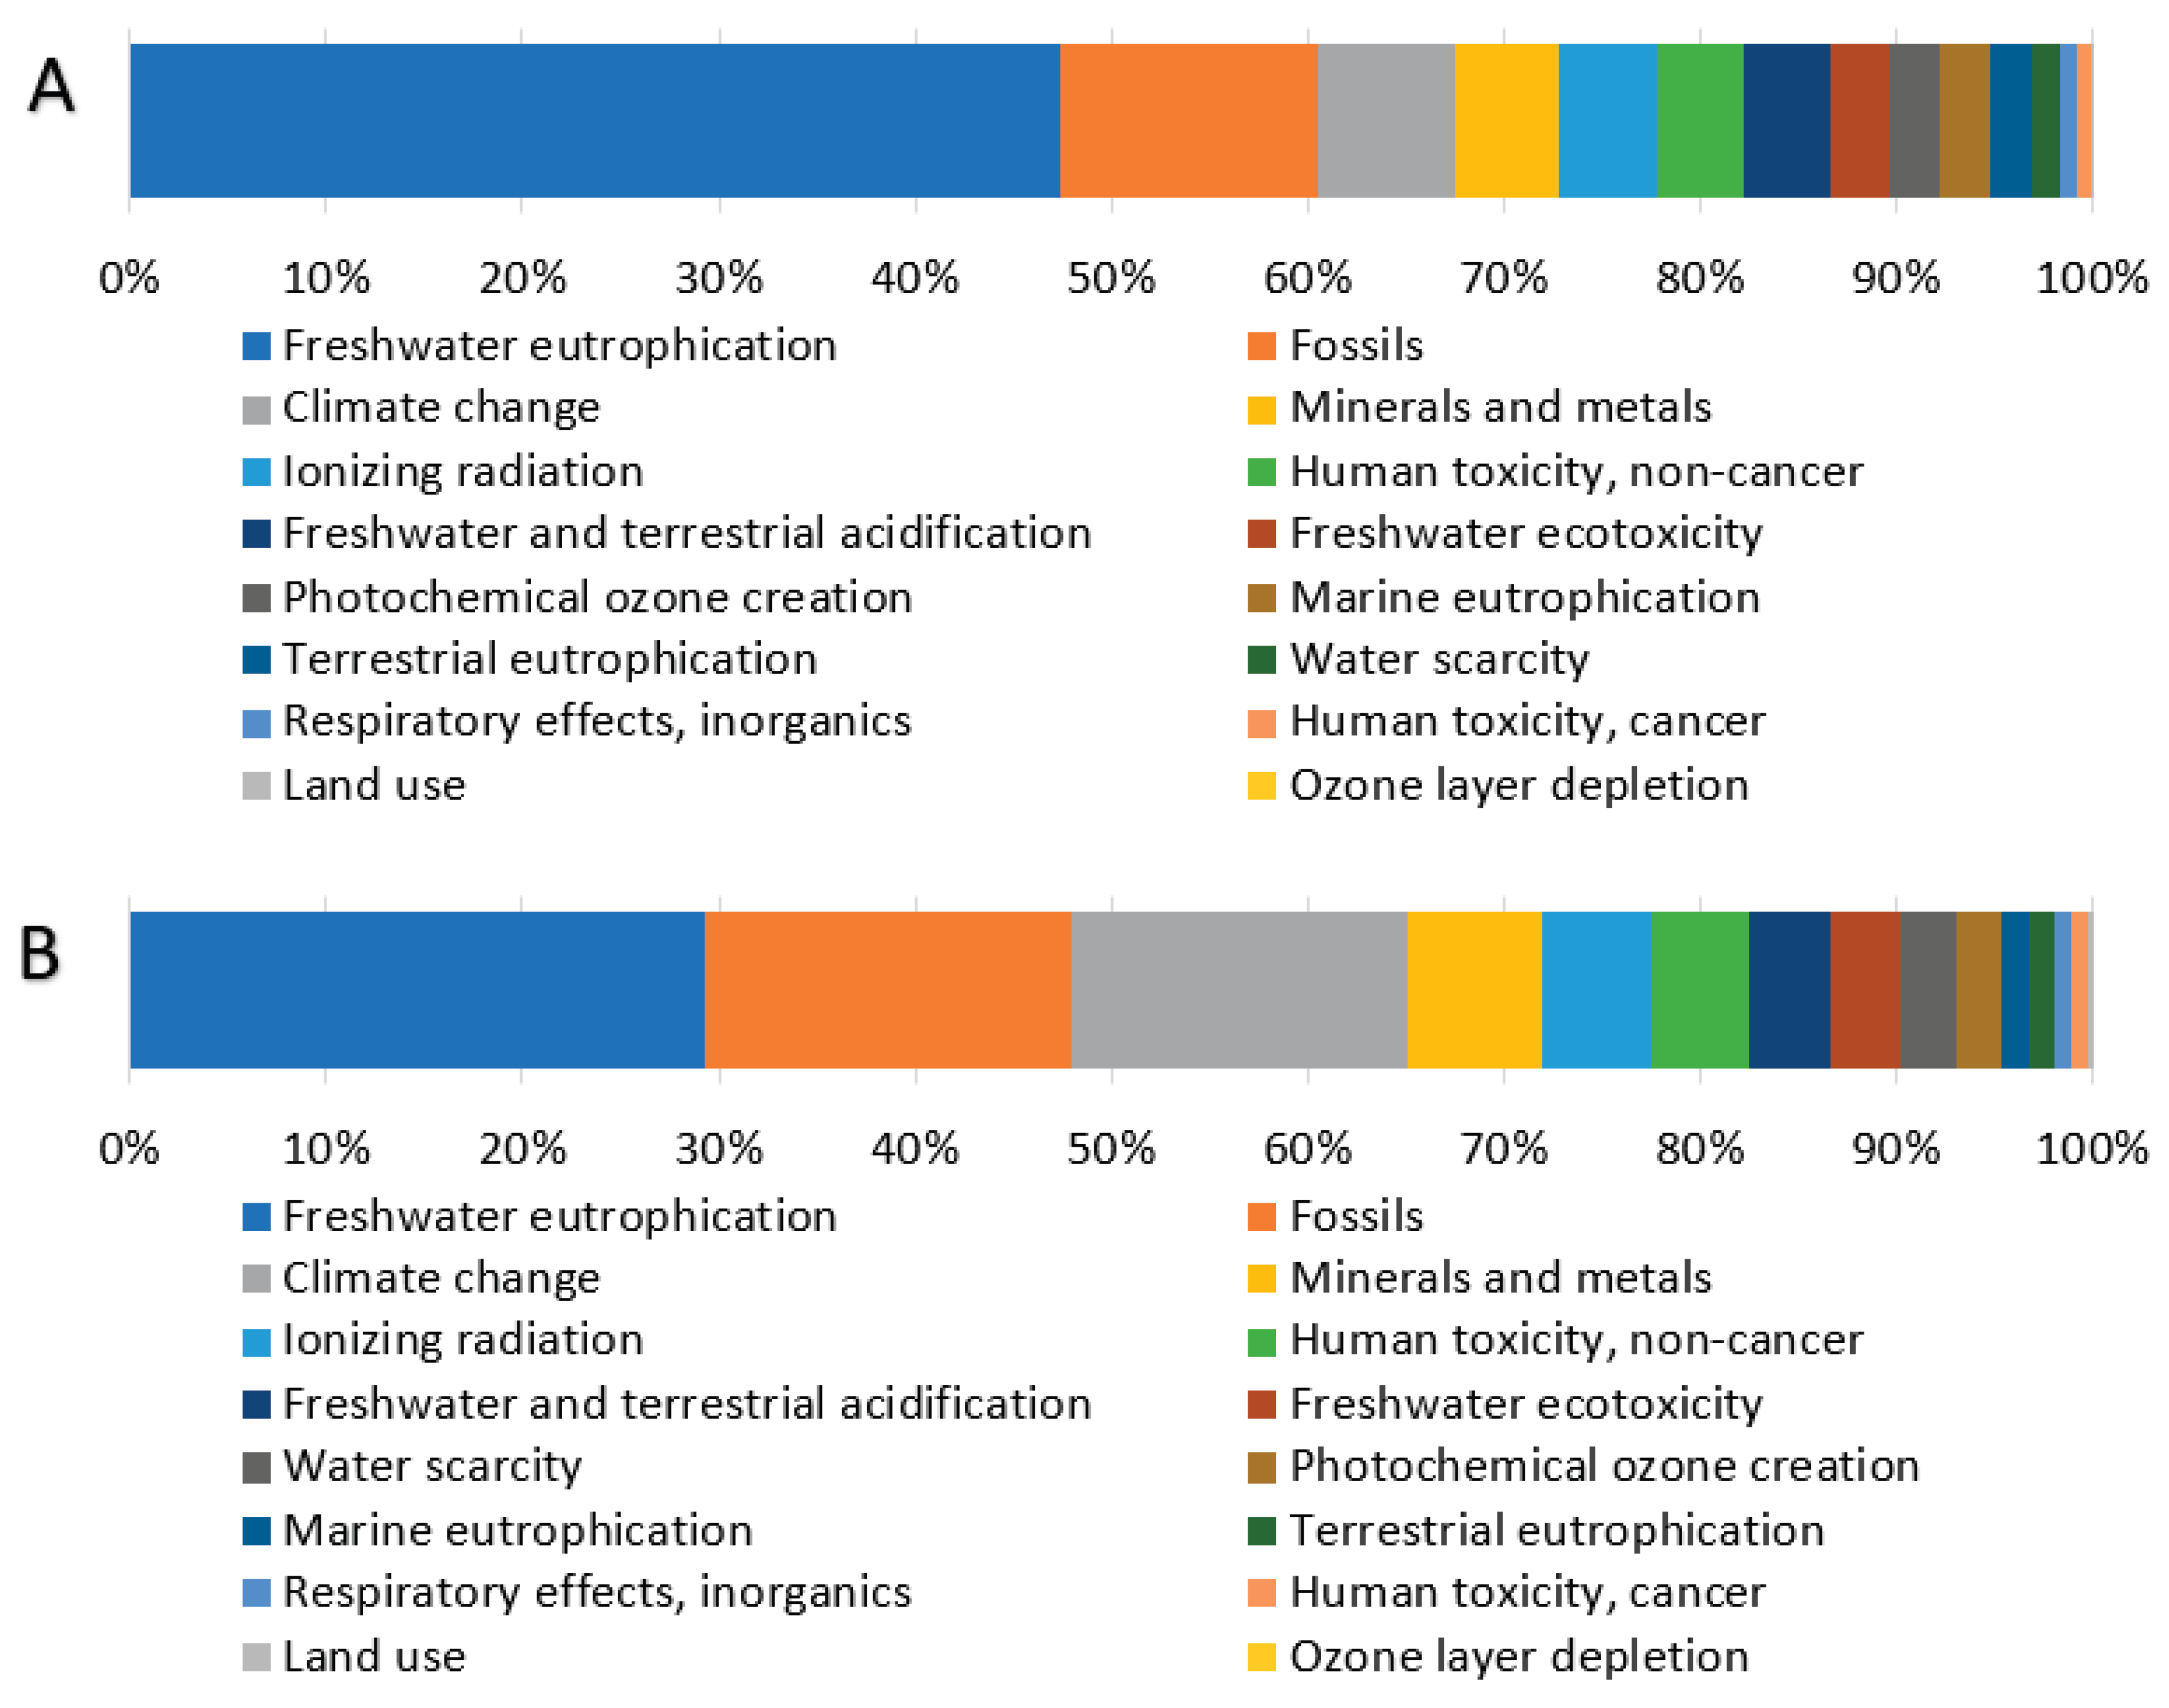
Figure 4.
Percentage contributions of the gelatin individual production processes to three significant impact categories (weighted results).
Figure 4.
Percentage contributions of the gelatin individual production processes to three significant impact categories (weighted results).
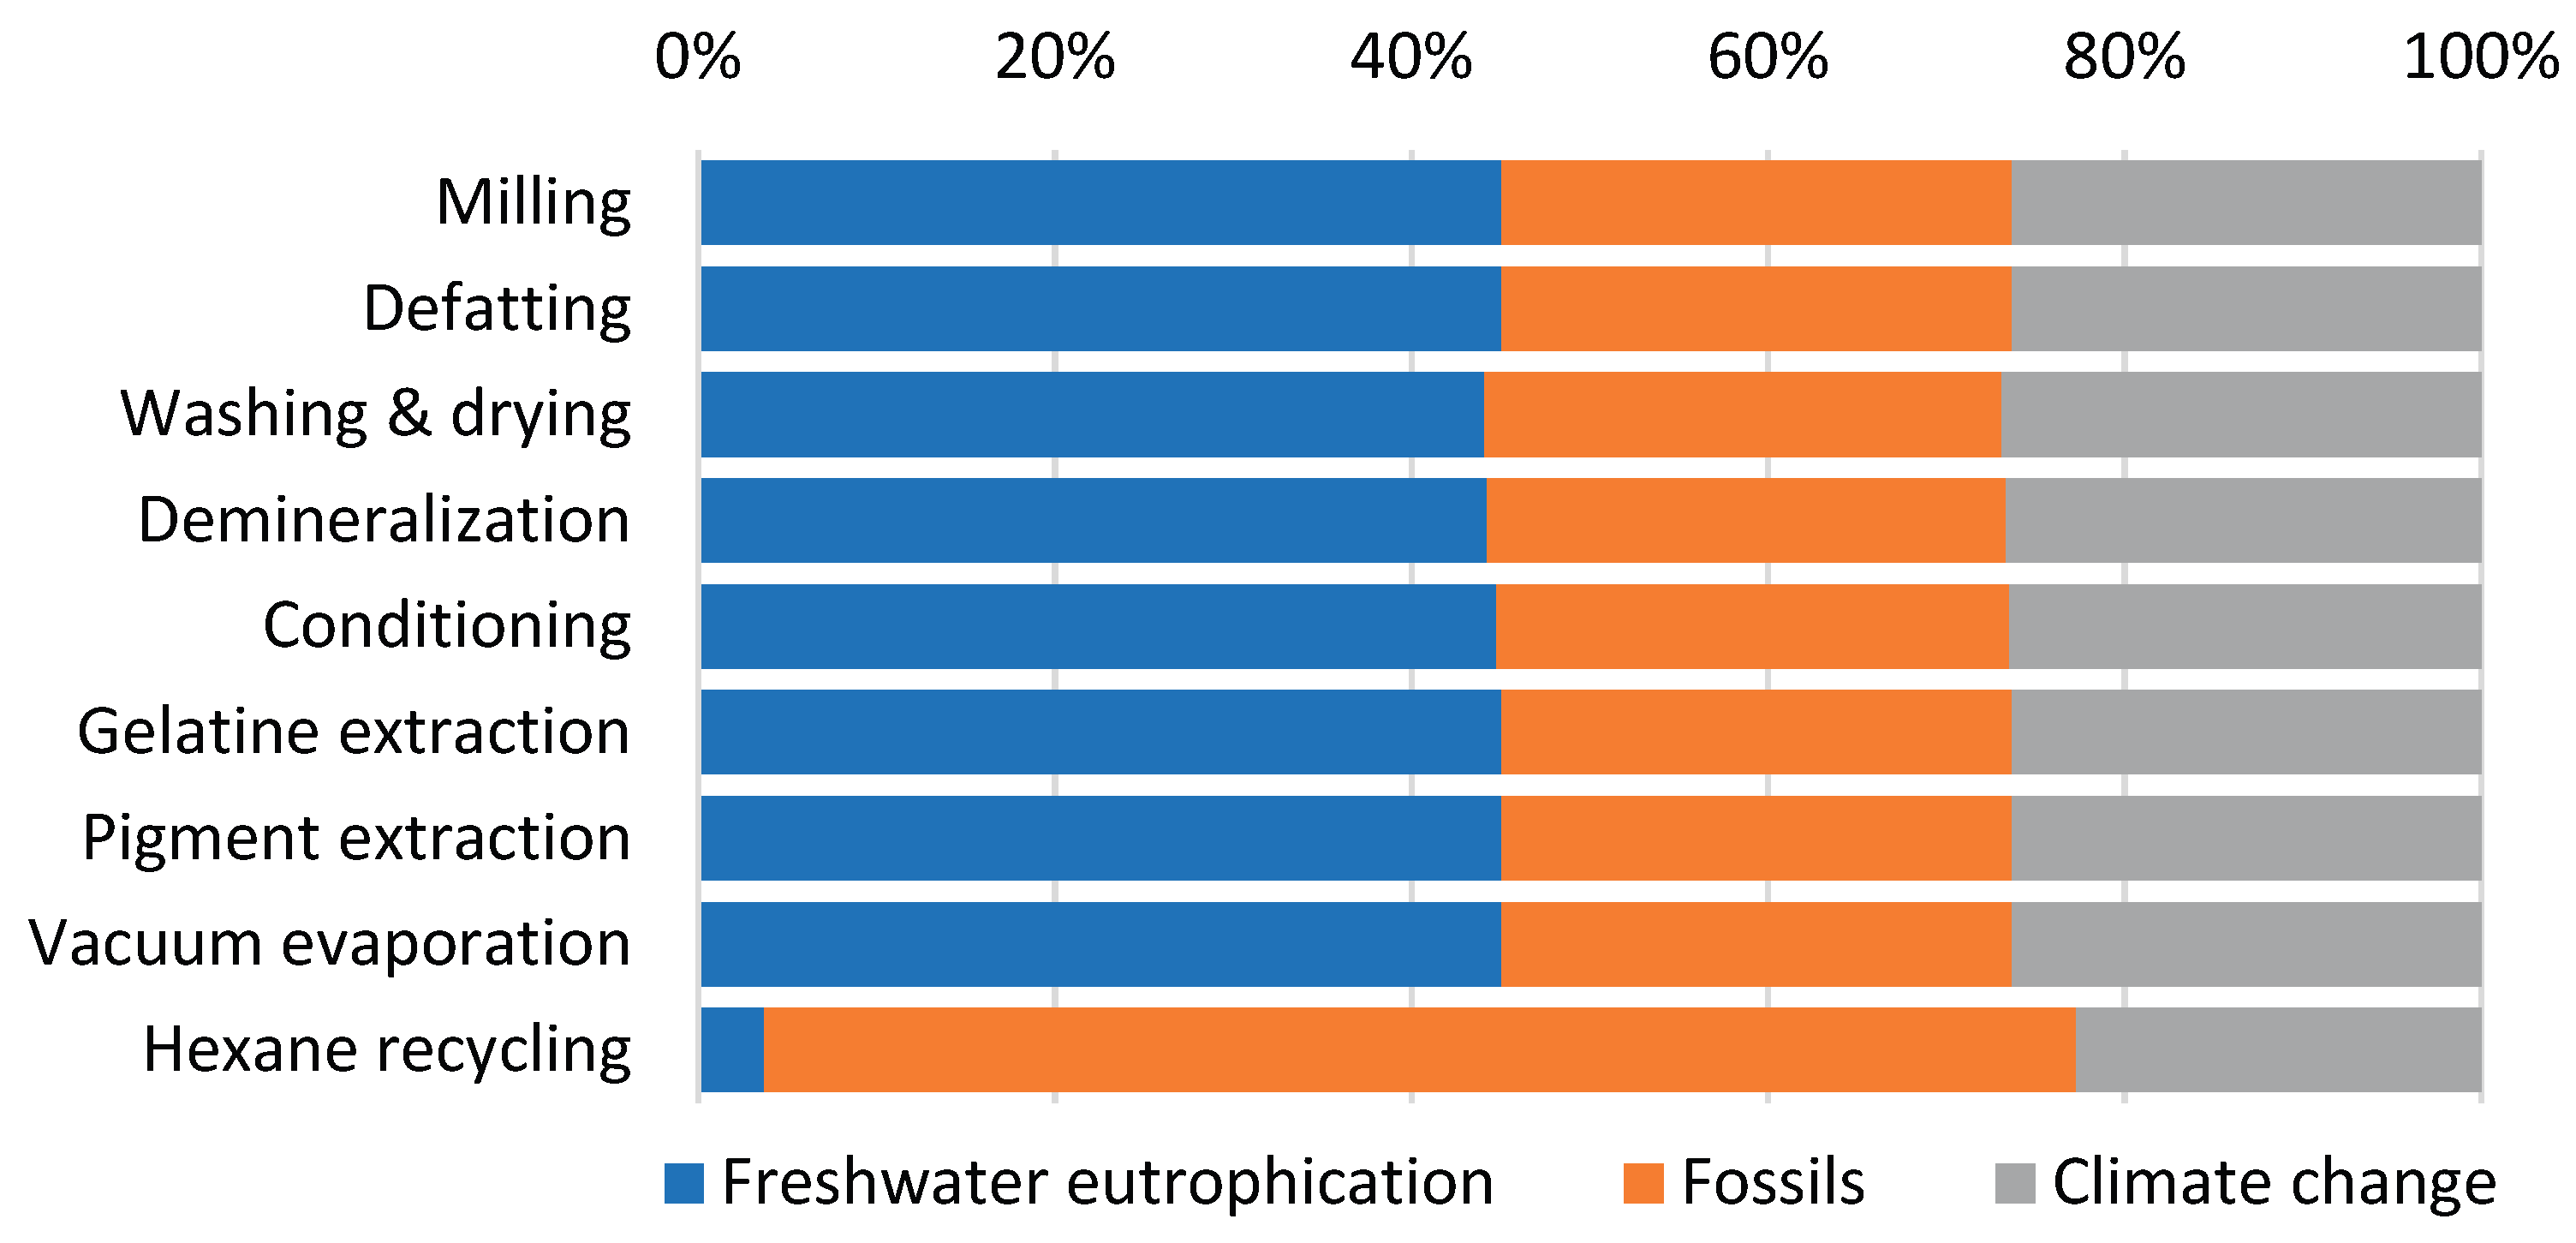
Figure 5.
Comparison of the total values of the carbon footprint of individual scenarios.
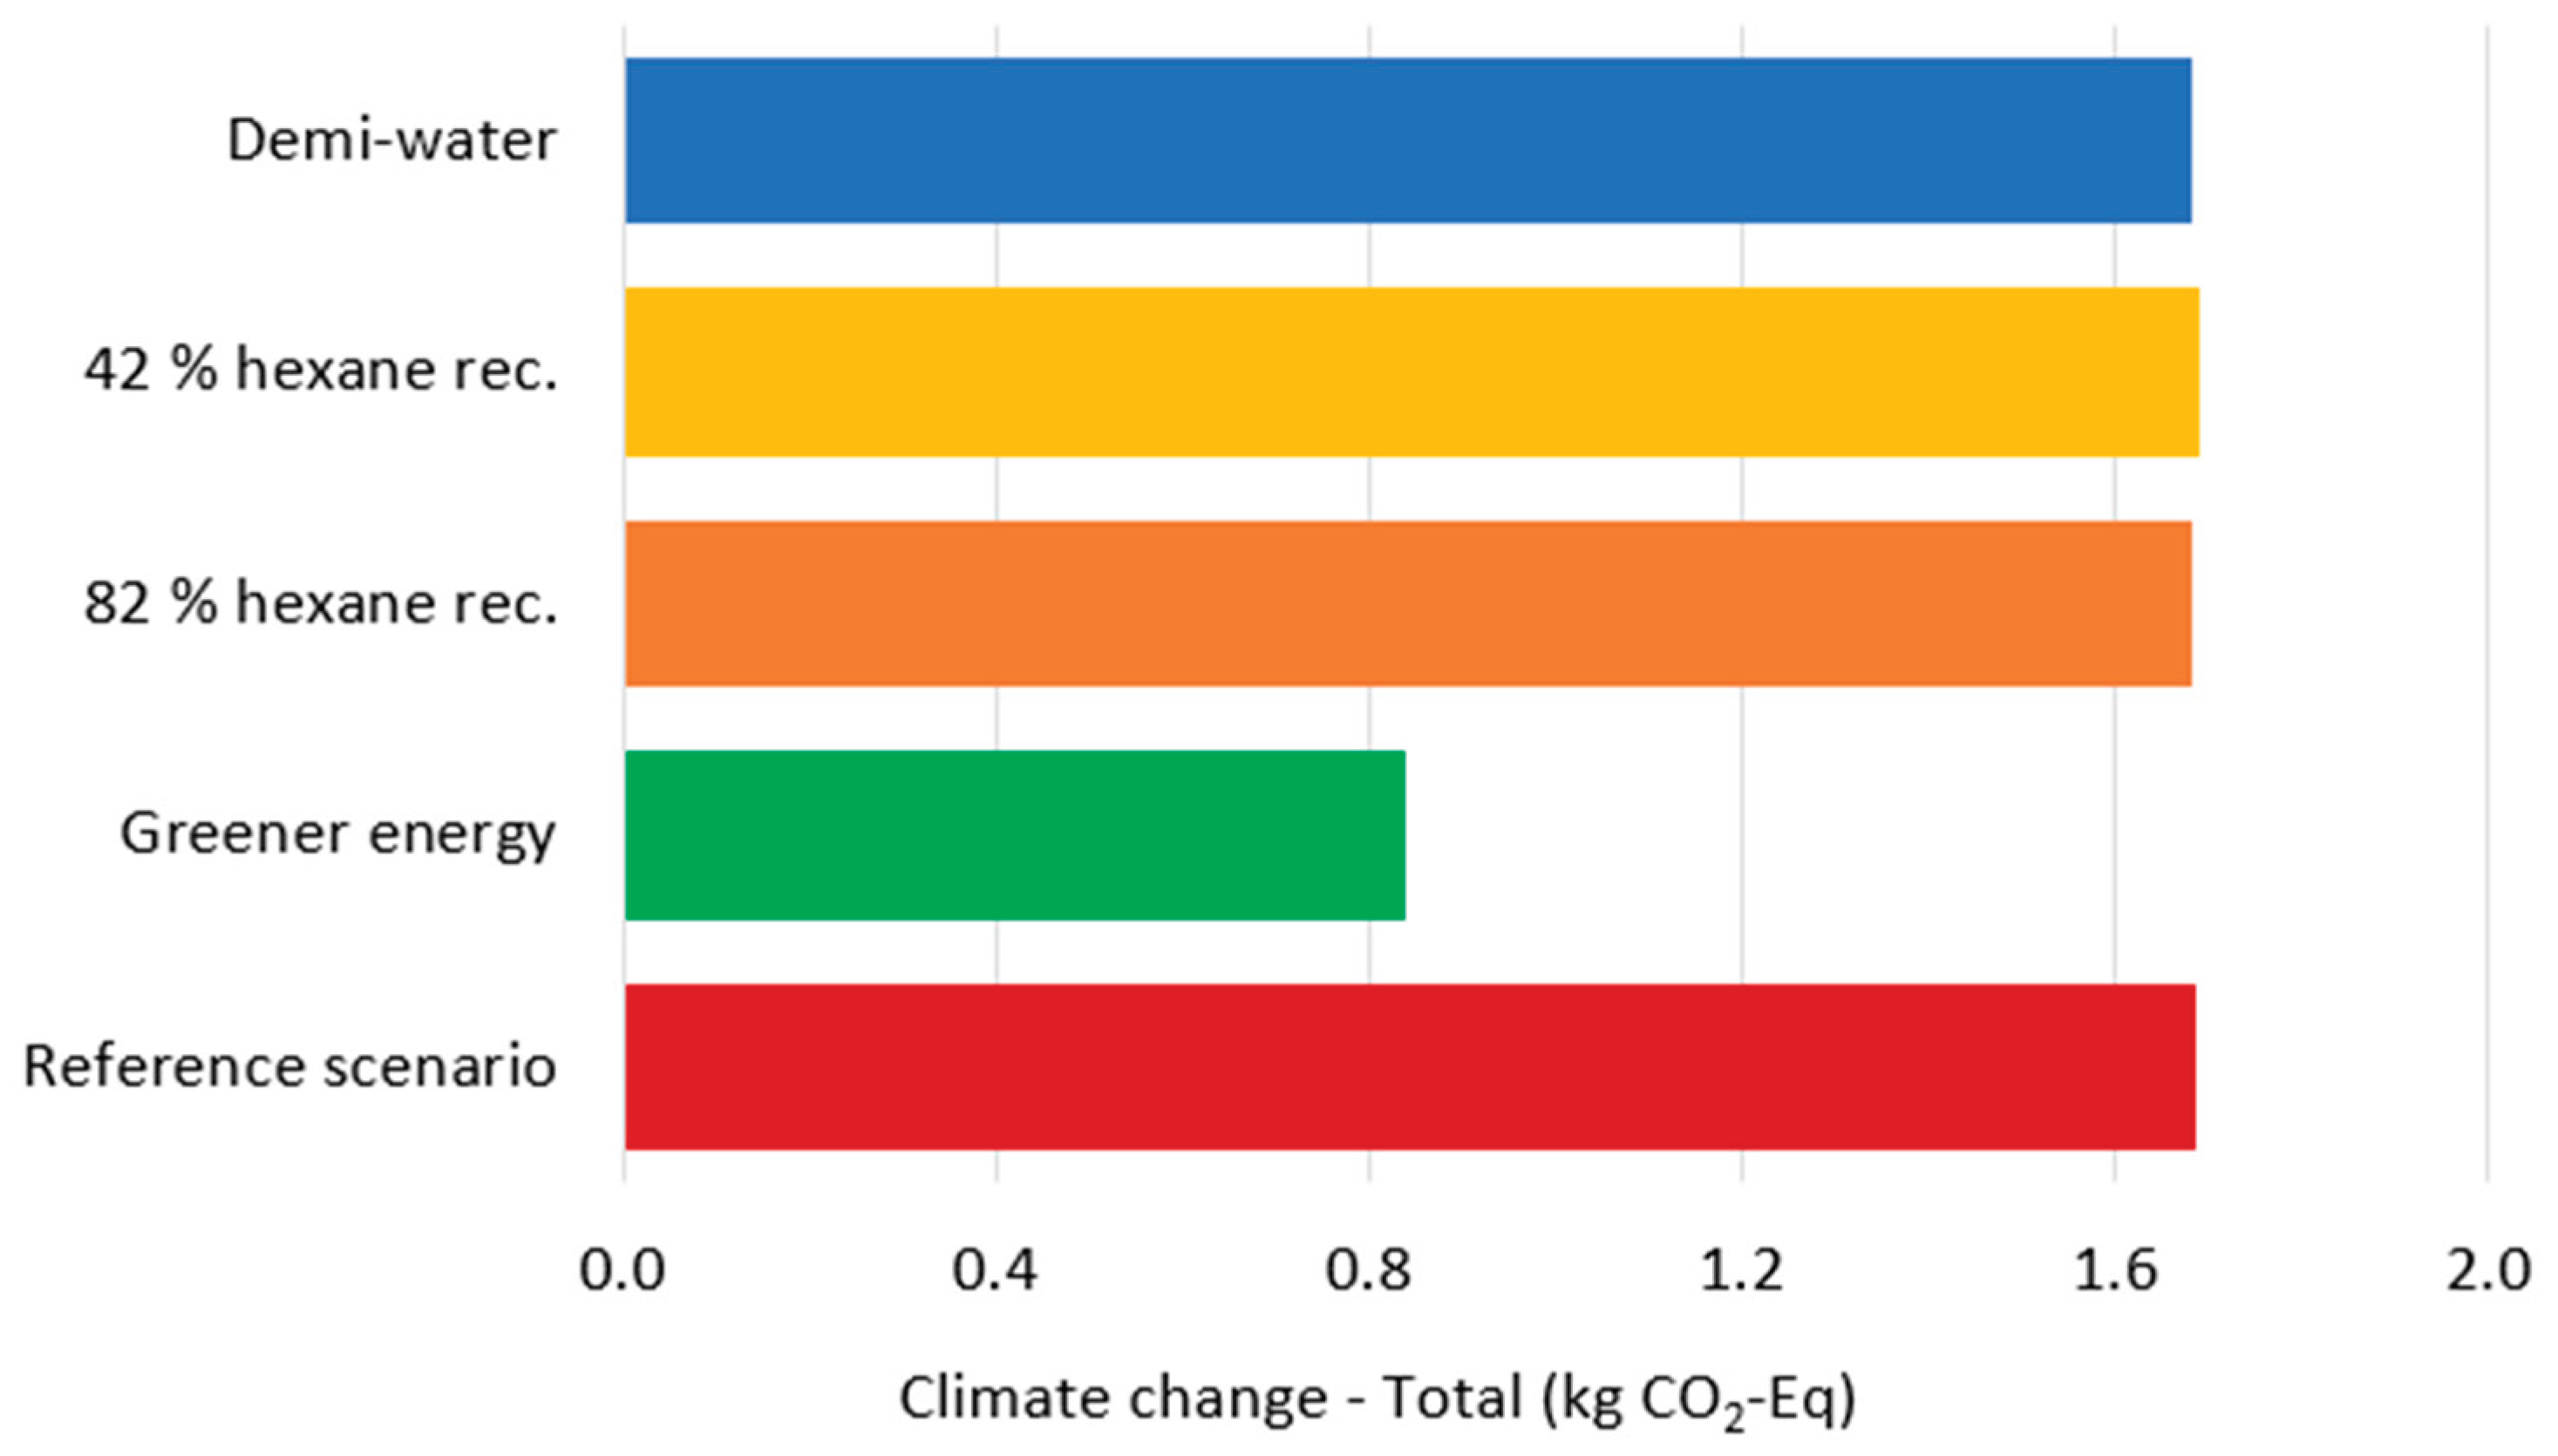
Figure 6.
Flow chart of the integrated processing of ACBP skeletons into gelatin, hydrolysate, oil, and pigments.
Figure 6.
Flow chart of the integrated processing of ACBP skeletons into gelatin, hydrolysate, oil, and pigments.
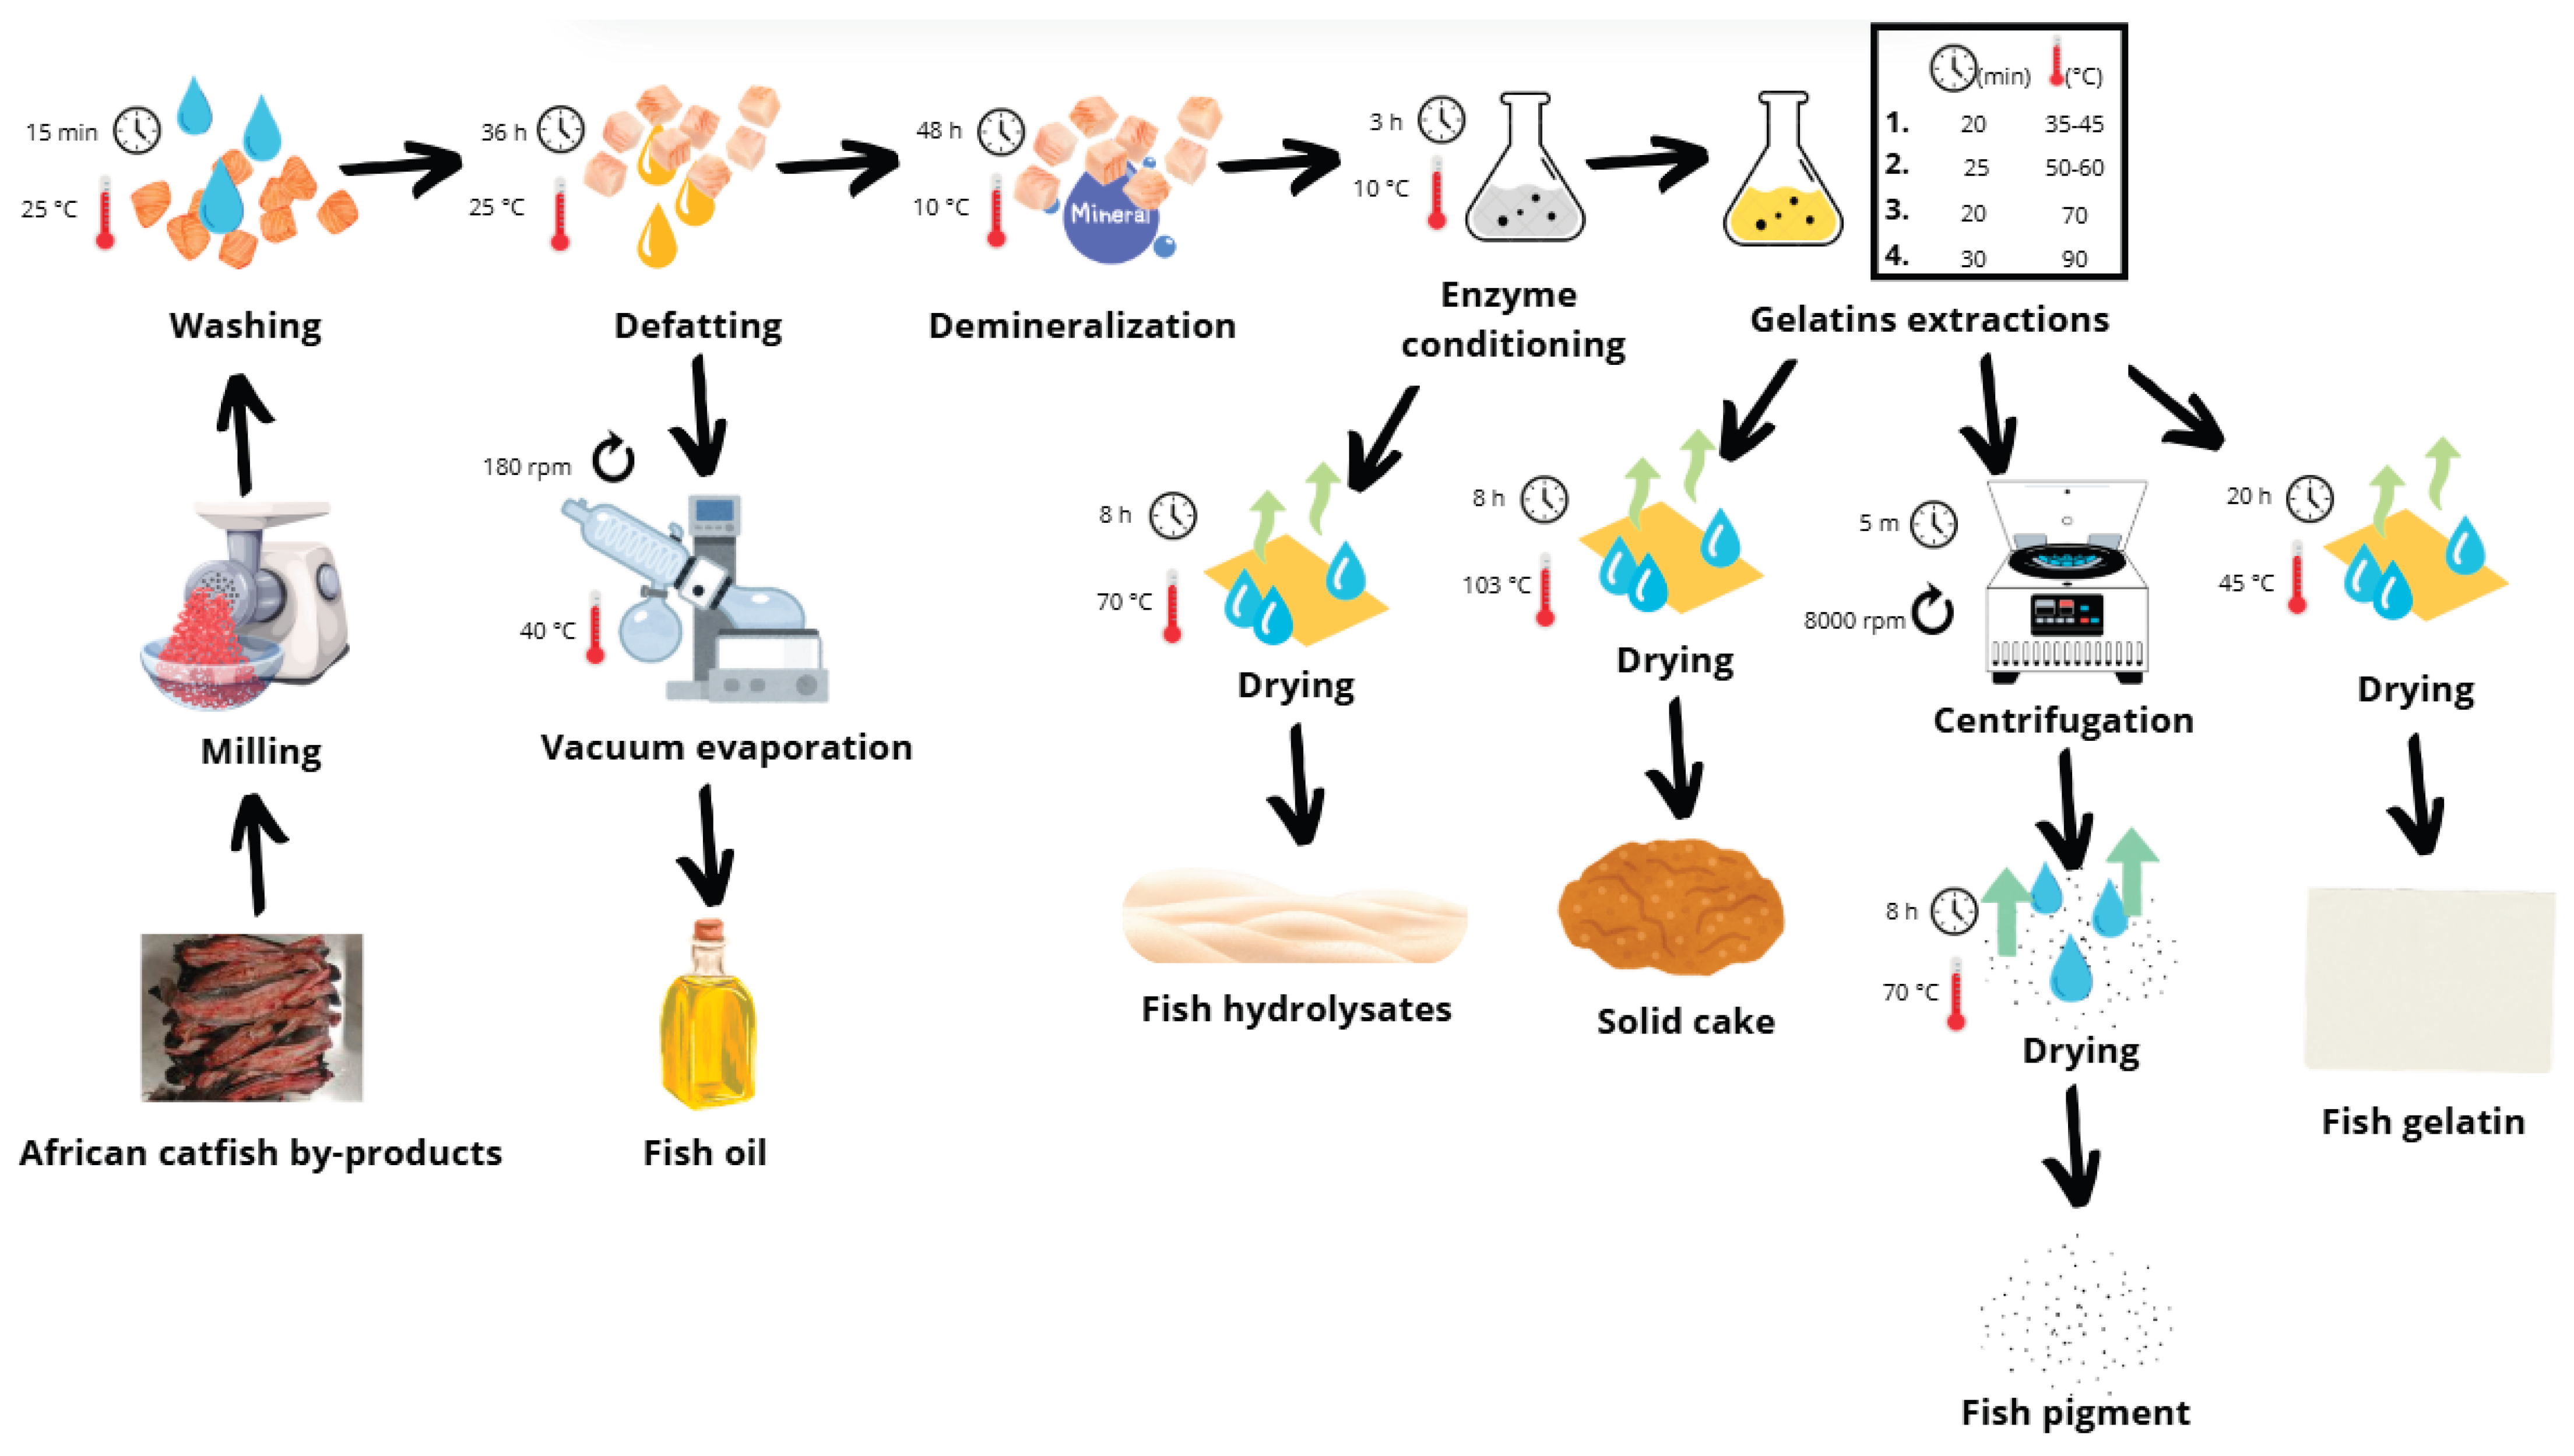
Figure 7.
The LCA system boundaries.
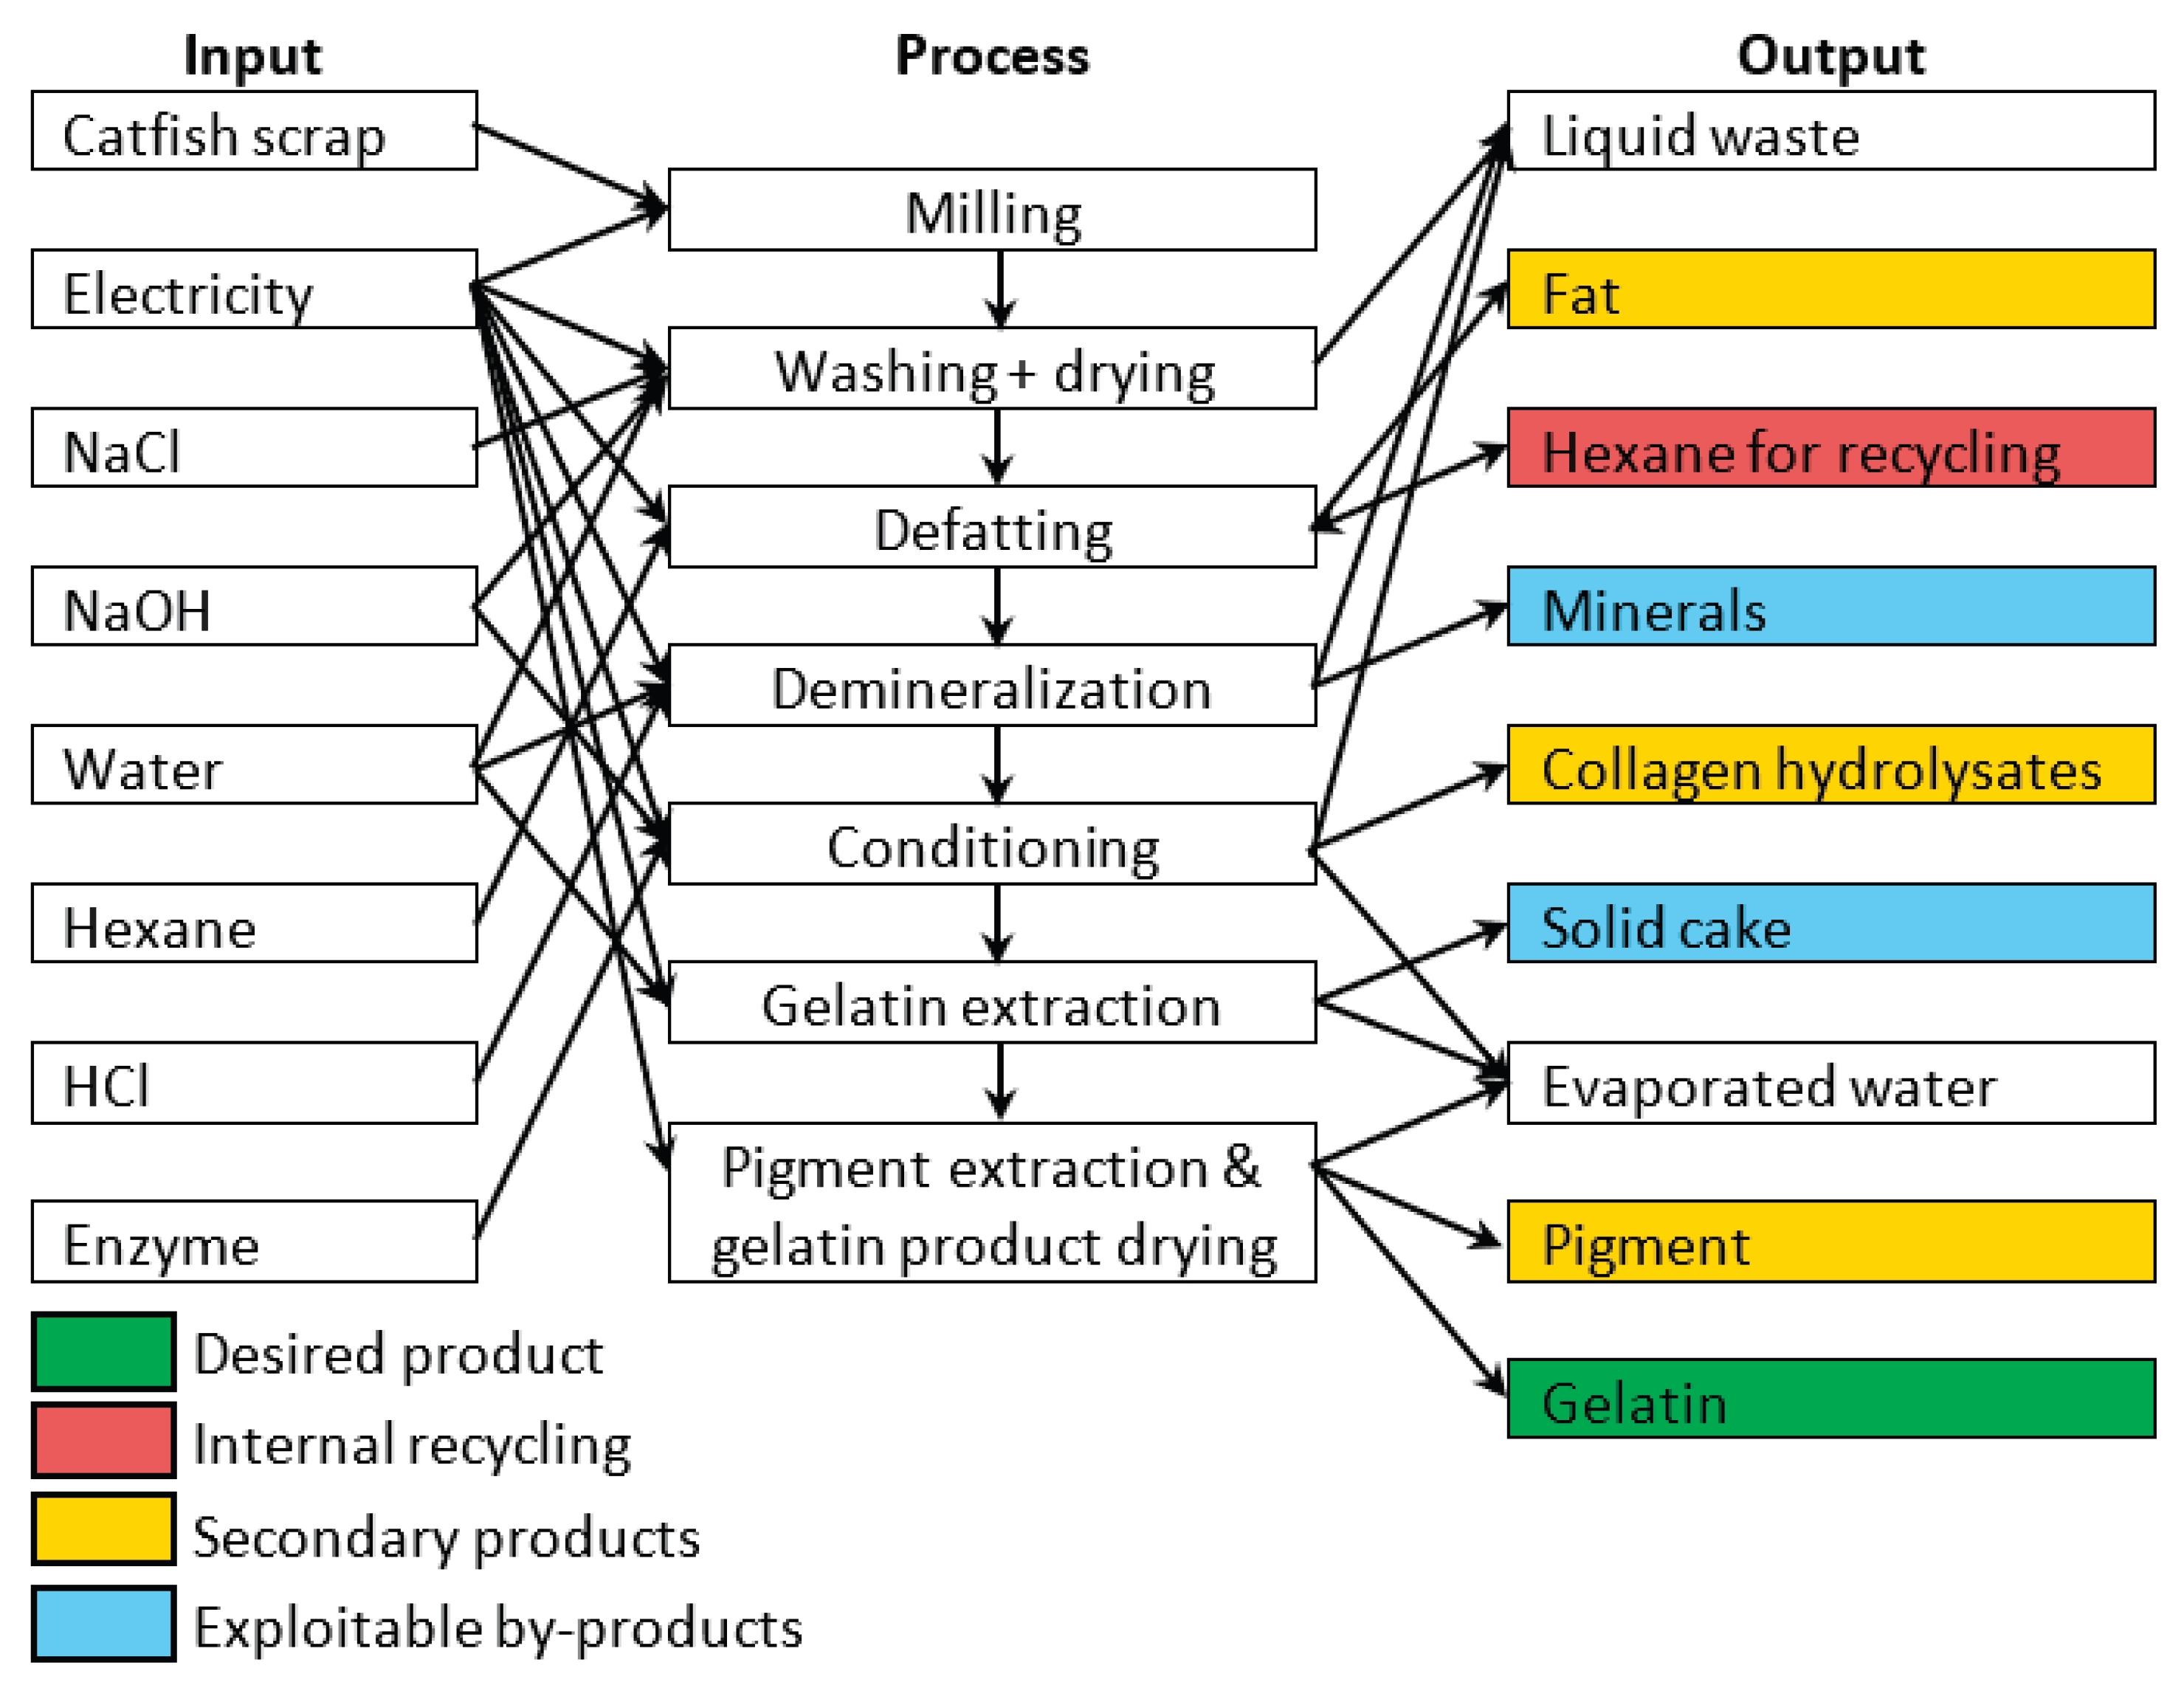
Figure 8.
Model of product system containing internal recycling of hexane, Sakey diagram of material and energy flows.
Figure 8.
Model of product system containing internal recycling of hexane, Sakey diagram of material and energy flows.
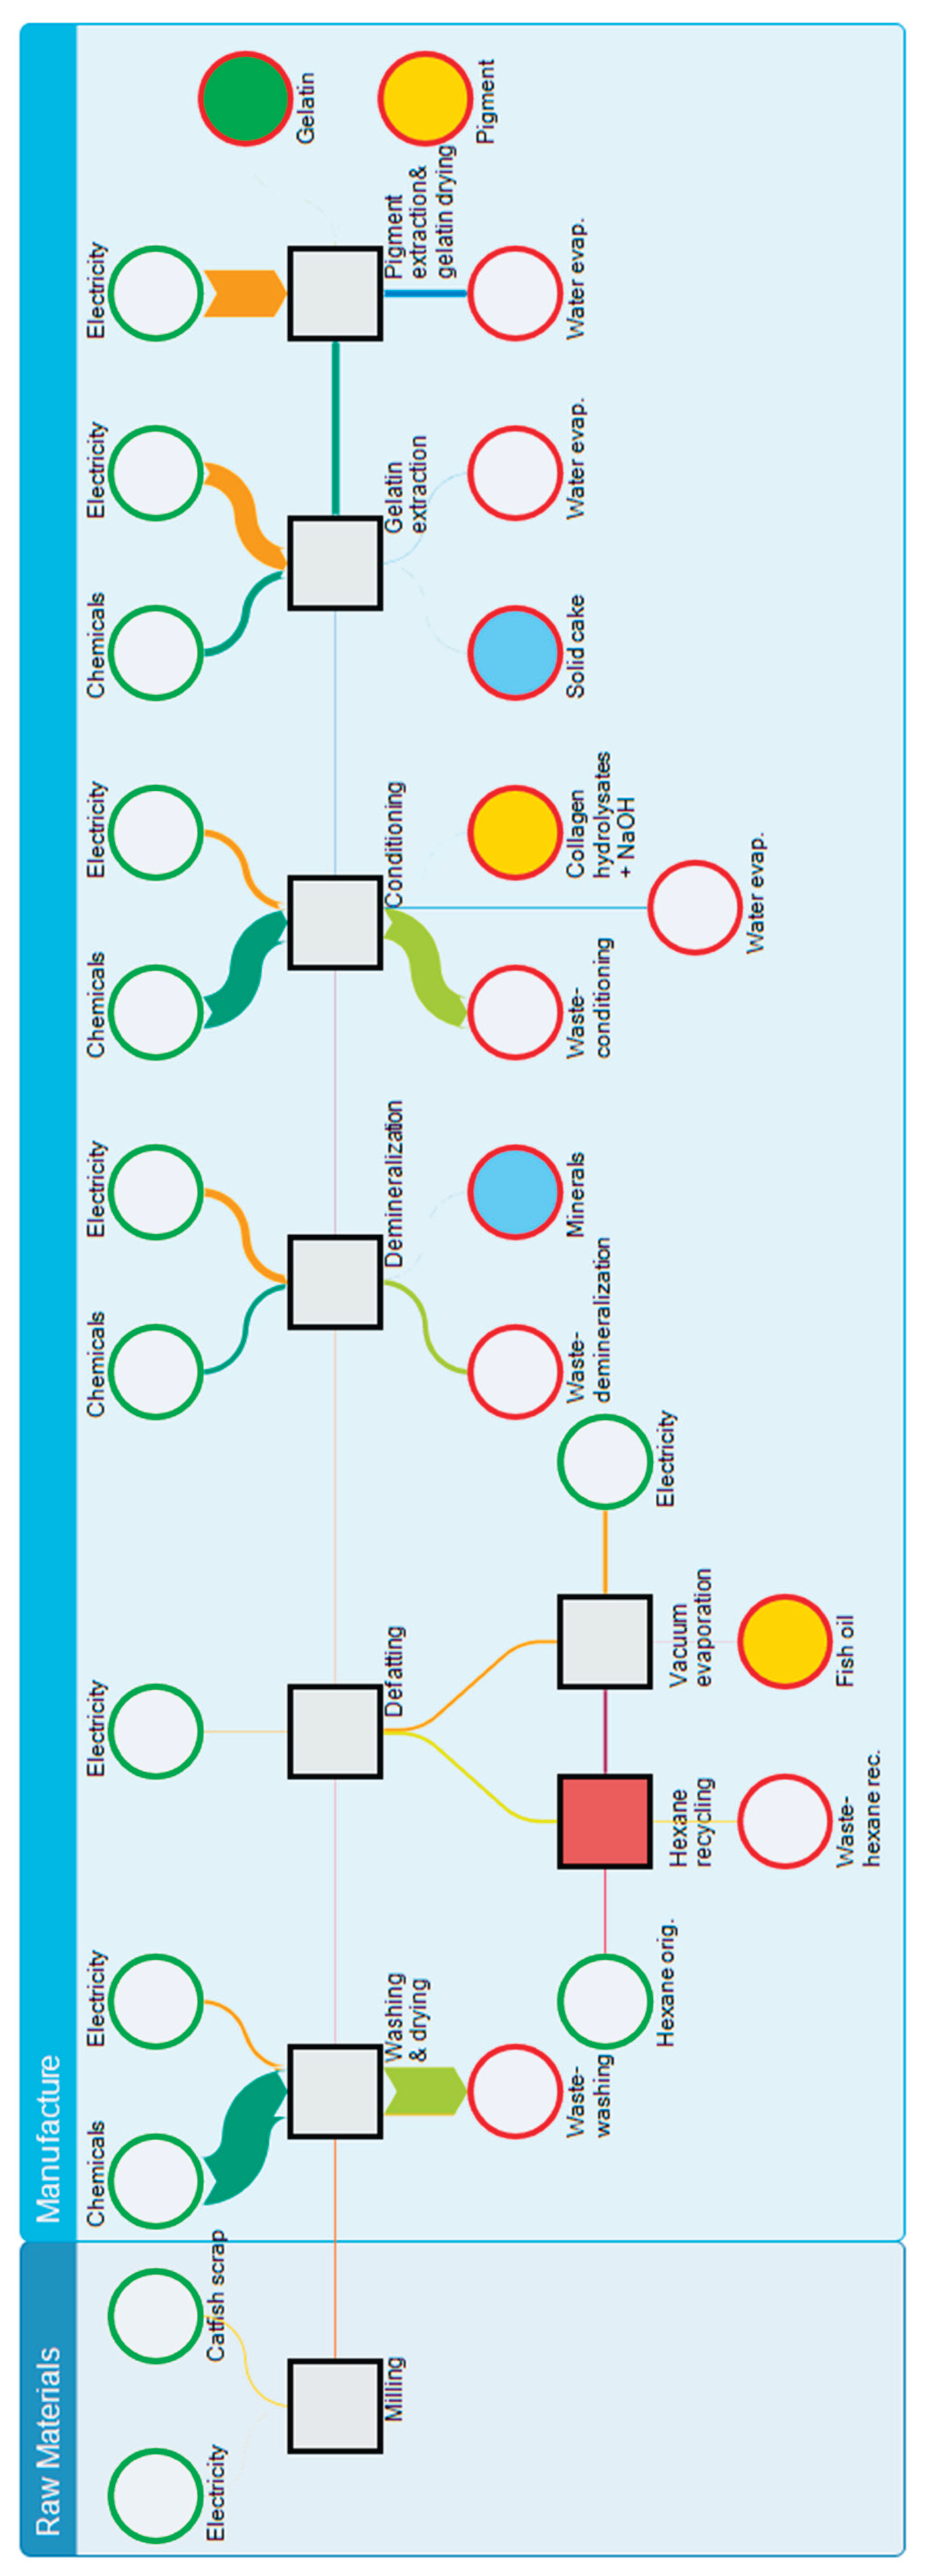
Table 1.
Gelatin yield for each fraction and total yield under different experimental conditions. The control experiment was conducted without enzyme addition during the conditioning step.
Table 1.
Gelatin yield for each fraction and total yield under different experimental conditions. The control experiment was conducted without enzyme addition during the conditioning step.
| Experiment | Factors | Yield of gelatin [%] | |||||
|---|---|---|---|---|---|---|---|
| Temperature of the first extraction [°C] | Temperature of the second extraction [°C] | Fractions | Σ YG | ||||
| YG1 | YG2 | YG3 | YG4 | ||||
| 1 | 35 | 50 | 10.80 ± 0.90 | 16.34 ± 0.92 | 5.72 ± 2.56 | 2.68 ± 0.01 | 35.55 ± 2.57 |
| 2 | 35 | 60 | 9.64 ± 1.06 | 20.95 ± 0.74 | 4.10 ± 0.69 | 2.57 ± 0.44 | 34.76 ± 1.95 |
| 3 | 45 | 50 | 17.35 ± 1.43 | 10.52 ± 0.19 | 3.07 ± 0.42 | 2.28 ± 0.29 | 33.22 ± 2.34 |
| 4 | 45 | 60 | 18.58 ± 0.25 | 14.69 ± 2.50 | 2.12 ± 0.66 | 2.39 ± 0.50 | 37.79 ± 2.41 |
| 5 | 40 | 55 | 12.40 ± 0.73 | 14.46 ± 1.17 | 3.93 ± 0.44 | 3.72 ± 0.29 | 34.50 ± 0.99 |
| Control | 40 | 55 | 6.16 ± 0. 47 | 7.15 ± 0.57 | 6.16 ± 0.50 | 5.82 ± 0.14 | 25.29 ± 0.71 |
Table 2.
Analysis of variance of the experimental design for gelatin yields.
| Degree of Freedom | Sum of Squares | Mean Squares | F-value | p-value | ||||
|---|---|---|---|---|---|---|---|---|
| Response: 1st gelatin fraction yield; R2 = 97.77% | ||||||||
| Regression | 3 | 63.152 | 21.051 | 14.62 | 0.189 | |||
| Factor A (Temp. of 1st fraction) | 1 | 60.84 | 60.84 | 42.25 | 0.097 | |||
| Factor B (Temp. of 2nd fraction) | 2 | 2.312 | 1.156 | 0.8 | 0.62 | |||
| Error | 1 | 1.44 | 1.44 | |||||
| Total | 4 | 64.592 | 64.592 | |||||
| Response: 2nd gelatin fraction yield; R2 = 99.89% | ||||||||
| Regression | 3 | 57.4175 | 19.1392 | 306.23 | 0.042 | |||
| Factor A (Temp. of 1st fraction) | 1 | 36.6025 | 36.6025 | 585.64 | 0.026* | |||
| Factor B (Temp. of 2nd fraction) | 2 | 20.815 | 10.4075 | 166.52 | 0.055 | |||
| Error | 1 | 0.0625 | 0.0625 | |||||
| Total | 4 | 57.48 | ||||||
| Response: 3rd gelatin fraction yield; R2 = 98.73% | ||||||||
| Regression | 3 | 6.998 | 2.33267 | 25.92 | 0.143 | |||
| Factor A (Temp. of 1st fraction) | 1 | 5.29 | 5.29 | 58.78 | 0.083 | |||
| Factor B (Temp. of 2nd fraction) | 2 | 1.708 | 0.854 | 9.49 | 0.224 | |||
| Error | 1 | 0.09 | 0.09 | |||||
| Total | 4 | 7.088 | ||||||
| Response: 4th gelatin fraction yield; R2 = 99.20% | ||||||||
| Regression | 3 | 1.242 | 0.414 | 41.4 | 0.114 | |||
| Factor A (Temp. of 1st fraction) | 1 | 0.09 | 0.09 | 9.0 | 0.205 | |||
| Factor B (Temp. of 2nd fraction) | 2 | 1.152 | 0.576 | 57.6 | 0.093 | |||
| Error | 1 | 0.01 | 0.01 | |||||
| Total | 4 | 1.252 | ||||||
* – statistically significant factor.
Table 3.
Weighted results of the gelatin production cycle impacts assessment according to EF 3.1.
| Impact category | Quantity [points] |
Contribution [%] |
|---|---|---|
| Freshwater eutrophication | 4.91E-03 | 29.212 |
| Fossils | 3.15E-03 | 18.725 |
| Climate change | 2.87E-03 | 17.106 |
| Minerals and metals | 1.17E-03 | 6.960 |
| Ionizing radiation | 9.24E-04 | 5.497 |
| Human toxicity, non-cancer | 8.40E-04 | 5.000 |
| Freshwater and terrestrial acidification | 6.99E-04 | 4.158 |
| Freshwater ecotoxicity | 5.99E-04 | 3.567 |
| Water scarcity | 4.67E-04 | 2.781 |
| Photochemical ozone creation | 3.95E-04 | 2.350 |
| Marine eutrophication | 2.43E-04 | 1.445 |
| Terrestrial eutrophication | 2.01E-04 | 1.197 |
| Respiratory effects, inorganics | 1.61E-04 | 0.955 |
| Human toxicity, cancer | 1.42E-04 | 0.846 |
| Land use | 3.22E-05 | 0.192 |
| Ozone layer depletion | 1.41E-06 | 0.008 |
Table 4.
Contributions of the gelatin individual production processes to three significant impact categories (weighted results).
Table 4.
Contributions of the gelatin individual production processes to three significant impact categories (weighted results).
| Process | Freshwater eutrophication | Fossils | Climate change |
|---|---|---|---|
| Pigment extraction and gelatin product drying | 3.33E-03 | 2.12E-03 | 1.94E-03 |
| Gelatin extraction | 1.49E-03 | 9.47E-04 | 8.70E-04 |
| Conditioning | 3.70E-05 | 2.38E-05 | 2.18E-05 |
| Demineralization | 2.70E-05 | 1.78E-05 | 1.63E-05 |
| Washing & drying | 1.01E-05 | 6.67E-06 | 6.18E-06 |
| Defatting | 1.86E-06 | 1.18E-06 | 1.08E-06 |
| Milling | 2.21E-07 | 1.40E-07 | 1.29E-07 |
| Hexane recycling | 1.40E-06 | 2.78E-05 | 8.59E-06 |
| Vacuum evaporation | 1.17E-05 | 7.46E-06 | 6.85E-06 |
Table 5.
Weighted results of impact categories for the reference scenario and the scenario using a greener energy mix.
Table 5.
Weighted results of impact categories for the reference scenario and the scenario using a greener energy mix.
| Impact category | Reference scenario [points] |
Greener energy [points] |
Percentage change [%] |
|---|---|---|---|
| Freshwater eutrophication | 4.91E-03 | 1.58E-03 | 67.85 |
| Fossils | 3.15E-03 | 2.20E-03 | 30.20 |
| Climate change | 2.87E-03 | 1.43E-03 | 50.19 |
| Minerals and metals | 1.17E-03 | 1.19E-03 | −1.48 |
| Ionizing radiation | 9.24E-04 | 7.23E-04 | 21.73 |
| Human toxicity, non-cancer | 8.40E-04 | 6.17E-04 | 26.59 |
| Freshwater and terrestrial acidification | 6.99E-04 | 4.27E-04 | 38.96 |
| Freshwater ecotoxicity | 5.99E-04 | 2.97E-04 | 50.43 |
| Water scarcity | 4.67E-04 | 4.53E-04 | 3.16 |
| Photochemical ozone creation | 3.95E-04 | 2.57E-04 | 34.93 |
| Marine eutrophication | 2.43E-04 | 1.16E-04 | 52.33 |
| Terrestrial eutrophication | 2.01E-04 | 1.13E-04 | 43.76 |
| Respiratory effects, inorganics | 1.61E-04 | 1.59E-04 | 0.89 |
| Human toxicity, cancer | 1.42E-04 | 9.93E-05 | 30.16 |
| Land use | 3.22E-05 | 4.15E-05 | −28.85 |
| Ozone layer depletion | 1.41E-06 | 1.68E-06 | −19.73 |
Table 6.
Weighted results of impact categories for the reference scenario and the scenarios of higher and lower hexane recycling ratios.
Table 6.
Weighted results of impact categories for the reference scenario and the scenarios of higher and lower hexane recycling ratios.
| Impact category | Ref. scenario [point] |
82 % hexane rec. [point] | Change [%] | 42 % hexane rec. [point] | Change [%] |
|---|---|---|---|---|---|
| Freshwater eutrophication | 4.91E-03 | 4.91E-03 | 0.01 | 4.91E-03 | −0.01 |
| Fossils | 3.15E-03 | 3.13E-03 | 0.47 | 3.16E-03 | −0.47 |
| Climate change | 2.87E-03 | 2.87E-03 | 0.16 | 2.88E-03 | −0.16 |
| Minerals and metals | 1.17E-03 | 1.17E-03 | 0.18 | 1.17E-03 | −0.18 |
| Ionizing radiation | 9.24E-04 | 9.24E-04 | 0.01 | 9.24E-04 | −0.01 |
| Human toxicity, non-cancer | 8.40E-04 | 8.39E-04 | 0.13 | 8.41E-04 | −0.13 |
| Freshwater and terrestrial acidification | 6.99E-04 | 6.98E-04 | 0.15 | 7.00E-04 | −0.15 |
| Freshwater ecotoxicity | 5.99E-04 | 5.98E-04 | 0.18 | 6.01E-04 | −0.18 |
| Water scarcity | 4.67E-04 | 4.66E-04 | 0.22 | 4.68E-04 | −0.22 |
| Photochemical ozone creation | 3.95E-04 | 3.92E-04 | 0.80 | 3.98E-04 | −0.80 |
| Marine eutrophication | 2.43E-04 | 2.43E-04 | 0.13 | 2.43E-04 | −0.13 |
| Terrestrial eutrophication | 2.01E-04 | 2.01E-04 | 0.18 | 2.01E-04 | −0.18 |
| Respiratory effects, inorganics | 1.61E-04 | 1.60E-04 | 0.62 | 1.61E-04 | −0.62 |
| Human toxicity, cancer | 1.42E-04 | 1.42E-04 | 0.15 | 1.42E-04 | −0.15 |
| Land use | 3.22E-05 | 3.21E-05 | 0.38 | 3.23E-05 | −0.38 |
| Ozone layer depletion | 1.41E-06 | 1.39E-06 | 1.20 | 1.42E-06 | −1.20 |
Table 7.
Weighted results of impact categories for the reference scenario and the scenarios of usage of demineralized water instead of tap water.
Table 7.
Weighted results of impact categories for the reference scenario and the scenarios of usage of demineralized water instead of tap water.
| Impact category | Ref. scenario [point] |
Demineralized water [point] |
Change [%] |
|---|---|---|---|
| Freshwater eutrophication | 4.91E-03 | 4.91E-03 | 0.001 |
| Fossils | 3.15E-03 | 3.15E-03 | 0.001 |
| Climate change | 2.87E-03 | 2.88E-03 | −0.009 |
| Minerals and metals | 1.17E-03 | 1.17E-03 | −0.102 |
| Ionizing radiation | 9.24E-04 | 9.24E-04 | 0.014 |
| Human toxicity, non-cancer | 8.40E-04 | 8.39E-04 | 0.095 |
| Freshwater and terrestrial acidification | 6.99E-04 | 6.99E-04 | −0.054 |
| Freshwater ecotoxicity | 5.99E-04 | 6.08E-04 | −1.431 |
| Water scarcity | 4.67E-04 | 4.68E-04 | −0.215 |
| Photochemical ozone creation | 3.95E-04 | 3.95E-04 | −0.015 |
| Marine eutrophication | 2.43E-04 | 2.43E-04 | −0.003 |
| Terrestrial eutrophication | 2.01E-04 | 2.01E-04 | −0.005 |
| Respiratory effects, inorganics | 1.61E-04 | 1.61E-04 | −0.142 |
| Human toxicity, cancer | 1.42E-04 | 1.43E-04 | −0.222 |
| Land use | 3.22E-05 | 3.22E-05 | −0.028 |
| Ozone layer depletion | 1.41E-06 | 1.43E-06 | −1.799 |
Table 10.
The fatty acid composition of ACBP oil.
| Fatty acid name | Shorthand | Relative percentage [%] |
|---|---|---|
| Myristic acid | C14:0 | 2.28 ± 0.02 |
| Palmitic acid | C16:0 | 20.45 ± 0.09 |
| Palmitoleic acid | C16:1n-7 | 4.19 ± 0.02 |
| Stearic acid | C18:0 | 6.64 ± 0.05 |
| Oleic acid | C18:1n-9 | 29.08 ± 0.12 |
| Vaccenic acid | C18:1n-5 | 3.05 ± 0.03 |
| Linoleic acid | C18:2n-6 | 14.60 ± 0.10 |
| α-Linolenic acid | C18:3n-3 | 2.02 ± 0.06 |
| Gadoleic acid | C20:1n-9 | 2.60 ± 0.02 |
| Arachidonic acid | C20:4n-6 | 0.67 ± 0.03 |
| Eicosapentaenoic acid | C20:5n-3 | 2.23 ± 0.06 |
| Docosapentaenoic acid | C22:5n-3 | 0.89 ± 0.03 |
| Docosahexaenoic acid | C22:6n-3 | 4.65 ± 0.07 |
| ΣSFA | 30.85 ± 0.04 | |
| ΣMUFA | 40.52 ± 0.07 | |
| ΣPUFA | 28.65 ± 0.06 |
Table 11.
Inventory of the product system divided into processes.
| Input | Quantity | Output | Quantity | ||
|---|---|---|---|---|---|
| Milling | |||||
| Catfish scrap | 33.130 | kg | Milled catfish scrap | 33.130 | kg |
| Electricity | 0.497 | kWh | |||
| Washing | |||||
| Electricity | 22.065 | kWh | Washing output | 6.096 | kg |
| Milled catfish scrap | 33.130 | kg | Solid waste | 26.835 | kg |
| Sodium hydroxide | 0.239 | kg | Waste NaCl | 2.324 | kg |
| Sodium chloride | 2.324 | kg | Waste NaOH | 0.239 | kg |
| Tap water | 1074.411 | kg | Waste water | 1074.411 | kg |
| Defatting | |||||
| Electricity | 4.174 | kWh | Defatting output | 4.950 | kg |
| Hexane mix | 71.611 | kg | Fat and hexane | 72.757 | kg |
| Washing output | 6.096 | kg | |||
| Demineralization | |||||
| Defatting output | 4.950 | kg | Demineralization output | 2.935 | kg |
| Electricity | 48.403 | kWh | Minerals | 2.015 | kg |
| Hydrochloric acid | 2.932 | kg | Waste HCl | 2.932 | kg |
| Tap water | 107.839 | kg | Waste water | 107.839 | kg |
| Conditioning | |||||
| Demineralization output | 2.935 | kg | Collagen hydrolysates | 0.288 | kg |
| Electricity | 39.600 | kWh | Conditioning output | 2.665 | kg |
| Sodium hydroxide | 0.409 | kg | Evaporated water | 30.327 | kg |
| Tap water | 719.000 | kg | Solid NaOH | 0.082 | kg |
| Waste water | 689.000 | kg | |||
| Gelatin extraction | |||||
| Conditioning output | 2.665 | kg | Evaporated water | 6.000 | kg |
| Electricity | 128.900 | kWh | Gelatin and pigment | 161.123 | kg |
| Tap water | 166.000 | kg | Solid cake | 1.542 | kg |
| Pigment extraction and gelatin product drying | |||||
| Electricity | 275.300 | kWh | Evaporated water | 160.000 | kg |
| Gelatin and pigment | 161.123 | kg | Gelatin | 1.000 | kg |
| Pigment | 0.123 | kg | |||
| Internal recycling of hexane | |||||
| Vacuum evaporation | |||||
| Electricity | 26.835 | kWh | Fish oil | 1.146 | kg |
| Fat and hexane | 72.757 | kg | Hexane after evaporation | 71.611 | kg |
| Hexane recycling | |||||
| Hexane | 27.212 | kg | Hexane mix | 71.611 | kg |
| Hexane after evaporation | 71.611 | kg | Hexane waste | 27.212 | kg |
Disclaimer/Publisher’s Note: The statements, opinions and data contained in all publications are solely those of the individual author(s) and contributor(s) and not of MDPI and/or the editor(s). MDPI and/or the editor(s) disclaim responsibility for any injury to people or property resulting from any ideas, methods, instructions or products referred to in the content. |
© 2025 by the authors. Licensee MDPI, Basel, Switzerland. This article is an open access article distributed under the terms and conditions of the Creative Commons Attribution (CC BY) license (http://creativecommons.org/licenses/by/4.0/).
Copyright: This open access article is published under a Creative Commons CC BY 4.0 license, which permit the free download, distribution, and reuse, provided that the author and preprint are cited in any reuse.


