Preprint
Article

This version is not peer-reviewed.

Influence of Processing and Mix Design Factors on the Water Demand and Strength of Concrete with Recycled Concrete Fines

Submitted:

25 November 2025

Posted:

27 November 2025

You are already at the latest version

Abstract

The paper investigates the impact of processing and mix design factors that determine the effectiveness of adding crushed and sieved concrete rubble (hereafter – recycled concrete fines, RCF) into cement-based concrete. The set of factors includes the dosage and specific surface area of RCF, cement content, superplasticizer dosage, temperature of thermal treatment of RCF, and dosage of accelerating admixture. The compressive strength of the concrete from which the rubble was obtained was preliminarily established based on its correlation with mass loss during crushing. XRD, SEM, and EDS tests were used to determine the chemical and mineralogical composition of RCF and the morphology of the particles. There were specific surface areas of RCF, pozzolanic activity, and correlations with fineness and thermal treatment temperature. Using the experimental design, experiments were carried out by varying six factors: RCF specific surface area, RCF content, thermal treatment temperature of RCF, cement content, superplasticizer dosage, and hardening accelerator (Na₂SiF₆) content in concrete containing RCF. Statistical processing of the experimental data provided adequate polynomial regression models for the water demand of the fresh concrete and the compressive strength of hardened concrete at 7 and 28 days. Analysis of the models made it possible to quantitatively assess the influence of the studied factors on the output parameters and rank them by their degree of influence. The greatest increase in water demand was attributed to cement content, especially above 400 kg/m³, and to RCF content. It was established that the addition of a superplasticizer allows for compensating additional water demand and the reduction of compressive strength caused by increased RCF dosage. The influence of different RCF activation methods on compressive strength was ambiguous. Increasing the specific surface area up to a specific surface area of 250 m²/kg of RCF improved strength, but further grinding caused strength reduction due to increased water demand. The positive effect of the superplasticizer on RCF-modified concrete strength was enhanced by the introduction of a chemical activator (hardening accelerator) and thermal treatment of RCF. The obtained models of water demand and compressive strength of concrete with RCF can, under certain conditions, be applied for the optimisation of mix design. The paper proposes a method of mix design and provides an example of calculation.

Keywords: 
;  ;  ;  ;  ;  

1. Introduction

In today’s construction industry, enhancing both the economic and environmental performance of concrete has become a critical priority. The production of Portland cement, as is well known [1], requires significant energy consumption and is accompanied by a large carbon footprint, which negatively affects the environment. Reduction of cement consumption can be achieved by a set of technological measures, the most common of which is the partial replacement of PC with mineral additives that can be considered active fillers of concrete. The range of mineral additives used in the production of both cement and concrete is quite wide, with granulated blast-furnace slags and fly ash being the most demanded. By 2050, it is expected that blast-furnace slags and fly ash will be able to meet only 20% of the global demand for cement production; therefore, expanding the range of active mineral additives is a pressing issue [2,3] .
Among the materials that require recycling are construction and demolition wastes (CDW), disaster and war conflict debris rubble the volume of which is constantly increasing in the world. According Waste Framework Directive, EU generates 700 mln. t of CDW annually [4]. It is prognosed that China will generate 224.08 billion tonnes (Bt) of CDW from 2000 to 2100, mostly gravel (34.15%), sand (30.08%), and brick/tile (14.37%)[5]. The composition of CDW and especially debris is diverse, but it usually contains predominantly cement-based concrete and brick demolition debris (up to 80%). In Ukraine, the intensive increase in the volume of war debris is caused by the destruction of buildings and structures as a result of military actions. According to official data, there were more than 600 thousand tons of debris in Ukraine by June 2024. However, this number can be significantly underestimated [6].
A significant number of studies on the use of recycled concrete have already been conducted [7,8,9]. One of the directions of such studies is the use of the recycled concrete fines (RCF) as an active mineral additive in concrete [10].
The effect of active mineral additives on the properties of cement-based concrete is determined by a complex of chemical and physicochemical processes that occur during their structure formation and hardening [11]. Due to the pozzolanic activity of additives, hydration products are synthesized in the cement matrix, which makes it possible to reduce cement consumption without a significant change in the basic properties. It has been experimentally established [12,13,14,15,16] that recycled concrete fines have a certain pozzolanic activity, which depends on their composition and specific surface area. The chemical activity of concrete fines is also complemented by its ability to hydrate unreacted cement particles, which depends on the cement content in the original concrete, as well as on the curing time and conditions.
Having a high specific surface area, concrete fines also affect physicochemical processes at the interfacial transition zone (ITZ). According to the nucleation theory (Gibbs–Volmer theory) [17], they can serve as crystallization centers and promote the formation of crystal nuclei of new hydration products. Based on the Gibbs–Volmer theoretical calculations, thermal treatment and decreasing particle size enhance the crystallization behavior of cement systems containing dispersed fillers. The formation of the concrete structure is also significantly influenced by so-called ‘constrained conditions’ [18], which are characterized by a sharp increase in the solid phase when introducing active fillers and by the transformation of part of the water into a film state.
An important parameter affecting the properties of concretes is the strength of the interfacial transition zone between the binder and aggregates. In the study [11], it was shown that reducing the intergranular distances in mortars on quartz sand from 210 to 30 nm makes it possible to increase the hardness of the cement pastes binding the aggregate grains by 1.5–2 times. Ensuring the optimal thickness of the interfacial layer when introducing concrete and other fillers requires a sufficiently high fineness of grinding and establishing the optimal content. Strong adhesion contacts in the cement–filler system can be explained by the higher surface energy of the fillers than that of the cement. This conclusion is based on the thermodynamic concept of adhesion, according to which the surface energy of the adhesive should be higher than that of the substrate [18]. The increase in surface energy of concrete powders is achieved by breaking intermolecular bonds in their structure during grinding. This process leads to surface amorphization, an increase in the isobaric potential of powders, and consequently, to higher chemical reactivity.
A significant positive effect is noted when active fillers are introduced together with surface-active additives [19]. A necessary condition for the effectiveness of surfactants is their ability to undergo chemisorption interaction with the surface of filler particles. It is known that for mineral fillers of acidic nature, cation-active surfactants are the most effective, while for basic fillers, anion-active ones. Considering that concrete fines predominantly have alkaline reaction and can be considered basic by composition, anion-active surfactants are more effective for them. These include traditional naphthalene- and melamine-formaldehyde-based superplasticizers, as well as the latest generation of superplasticizers — polyacrylate and polycarboxylate types.
According to several studies [20,21,22], sodium silicofluoride facilitates the complex alkaline–fluoride activation of mineral additives, thereby increasing their reactivity. Therefore, it was used for the activation of recycled concrete fines.
According to the reference data, the recycled concrete fines exhibit the following peculiarities, as described in Table 1.
The current study aimed to investigate the influence of a set of processing and mix design factors and their interactions on the effectiveness of applying recycled concrete fines (RCF) into heavyweight concrete in terms of water demand and compressive strength, and, based on the obtained experimental models, to propose a calculation method for the concrete mix design.

2. Materials and Methods of Research

2.1. Materials

The following materials were used for concrete mixing:
Portland cement CEM I 42.5 of the following chemical composition (%): SiO₂ – 22.47, Al₂O₃ – 5.26, Fe₂O₃ – 4.07, CaO – 66.18, MgO – 0.64, SO₃ – 0.46, MnO – 0.29;
Silica sand with a fineness modulus 2.1 and 1.9% of silt and dusty particles;
Granite crushed stone with a particle size 5-20 mm;
Superplasticizer of polyacrylate type (SP);
Sodium silicofluoride (Na₂SiF₆) was applied as a chemical activator;
Recycled concrete fines (RCF) produced in the lab with a particle size less than 1 mm.
They were obtained by crushing in a jaw crusher and sieving the demolition waste of concrete structures in the Kyiv region (Ukraine).

2.2. Methods of Testing

For determining the strength of original concrete used for recycled concrete fines, the Ukrainian standard for testing [33].
XRD and SEM analyses were applied for chemical composition and morphology determination of hardened concrete. The mineralogical composition of the waste was determined using the Aeris Cement diffractometer.
To visualize the microstructure of the concrete and observe the effect of recycled concrete ultrafine on the characteristics of the cement paste and ITZ, an SEM test was performed.
The Phenom Pro desktop SEM for characterisation and Quorum 150T S for preparing the samples where used (Figure 1).
The pozzolanic activity of recycled concrete fines (RCF) was evaluated by measuring the calcium oxide (CaO) uptake from a saturated calcium hydroxide solution in accordance with the Frattini method (ISO 863:2008; EN 196-5:2011). The specific surface area of the RCF was determined by the Blaine air permeability method (EN 196-6:2019). The pH of the RCF suspension was measured using a pH-meter (model OPR-3569) following ASTM E70-19.
Figure 2. Manufacturing the recycled concrete fines in the lab: crushing the concrete rubble in a jaw crusher; sieving and milling in the ball mill (mechanical activation).
Preprints 186795 g002
The concrete proportioning was conducted using the calculation-experimental method of absolute volumes (ACI Concrete Mix Design), considering the accepted conditions of the experimental plan, ensuring their workability class S3. The compressive strength of the concrete was determined according to EN 12390.

2.3. Design of Experiments

The experiments had been conducted according to a 6-factor plan (Table 2).
The experiments were carried out using the methodology of mathematical experimental design with a three-level, six-factor Box–Behnken B6 plan [34,35], resulting in the derivation of mathematical models of water demand and compressive strength of concrete.
The influence of six factors on the water demand and compressive strength of concrete was investigated (Table 2). The experimental design conditions and matrix with experimental data are presented in Table 3 and Table 4. The matrix included 54 points, in each of which the arithmetic mean values of water demand (based on two tests) and compressive strength (based on three tests of 100×100×100 mm cubes) were recorded.

3. Results and Discussion

3.1. Characterization of Recycled Concrete Fines

Crushability. Using the correlation between the strength and the mass loss after compression tests of the waste in a cylinder according to (Figure 3), the compressive strength of the original concrete from which the waste was obtained was preliminarily estimated.
As it can be seen from Figure 3 the initial strength of the recycled concrete corresponds to strength class C20/25.
The chemical and mineralogical composition of the concrete waste (Table 4) reveals that it was produced on Portland cement, using quartz sand as fine aggregate and granite (or a similar igneous rock) as coarse aggregate. This conclusion is supported by the presence of unreacted clinker minerals in the waste, as well as quartz, feldspars, and orthoclase. The amount of clinker minerals indicates the presence of a small portion of unhydrated cement. However, the rather old age of the original concrete is evidenced by the carbonation of calcium hydroxide. It is also confirmed by the relatively low pH value of the suspension of the concrete fines, which increases with the increase of dispersion (Table 3).
The initial specific surface area of the fine fraction of crushed concrete, obtained by crushing the concrete in a jaw crusher, was 130 m²/kg (sample #1). By grinding in a laboratory ball mill, it was increased to 250 (sample #2) and 370 m²/kg (sample #3) (Figure 2). For the obtained RCF, in addition to pH, pozzolanic activity was measured (Table 4). As seen from the table, increasing the dispersion of the waste as well as its thermal treatment, along with the increase in pH, leads to higher pozzolanic activity of the concrete fines.

3.2. Planning of Experiments and Concrete Test Results

The planning matrix and experimental data are shown in Table 5.
As a result of statistical analysis of the experimental data, adequate regression equations were obtained with a confidence probability of 0.95 for the water demand of the concrete mixture with a slump of 10–12 cm and the compressive strength at ages of 7, and 28 days. The statistical analysis included the following components: a full ANOVA table and a lack-of-fit test. The resulting statistical characteristics are presented in Appendix A. Statistical analysis of the results and construction of graphical dependencies were carried out using the ’Statistica 14.0’ software package [36]. The analysis of the obtained equations shows that all studied factors affect the water demand and compressive strength of concrete with RCF addition, and their influence can be quantitatively evaluated and ranked (Table 6).
Water demand
W (l/m³) = 188.2 +4.1ˑX1 +16.5ˑX2 +2.8ˑX3 -27.9ˑX4 +10 ˑX5 -2ˑX6 +3ˑX1² +10.3ˑX2² +2.3ˑX3² -8ˑX4² +5.8ˑX5² -1.7ˑX6² +2ˑX1ˑX2 +0.25ˑX1ˑX3 - X1ˑX4 +3ˑX1ˑX6 -3ˑX2ˑX4 +3ˑX2ˑX5 - X2ˑX6 -0.75ˑX3ˑX4 +3ˑX3ˑX6 -5ˑX4ˑX5
Compressive strength
fcm7(MPa) = 40.9−1.4ˑX1+9.504ˑX2+1.4ˑX3+11.0ˑX4−4.6ˑX5+1.125ˑX6−0.56ˑX12−0.6ˑX22−0.65ˑX32−0.35ˑX42−0.23ˑX52−0.15ˑX62−0.33ˑX1X2+0.81ˑX1ˑX3+0.75ˑX1ˑX4+0.46ˑX1ˑX5−0.15ˑX1ˑX6+0.05ˑX2X3−0.025ˑX2ˑX4+0.37ˑX2ˑX5 −0.3ˑX3ˑX4+0.08ˑX3X5+0.61ˑX3ˑX6+1.37ˑX4ˑX5+0.8ˑX4ˑX6
fcm28(MPa) = 53.1 +0.14ˑX1 +12.1ˑX2 +2.75ˑX3 +13.6ˑX4 -5.2ˑX5 +2.26ˑX6 -2.25ˑX12 -2.7ˑX22 -1.46ˑX32 -0.69ˑX42 -2.18ˑX52 +1.04ˑX62 -1.15ˑX1ˑX2 +2.58ˑX1ˑX3 +2.18ˑX1ˑX4 +1.3ˑX1ˑX5 -0.3ˑX1ˑX6 +0.1ˑX2ˑX3 - 0.05ˑX2ˑX4 +0.4ˑX2ˑX5 -0.74ˑX3ˑX4 +0.1ˑX3ˑX5 -0.06ˑX3ˑX6 +1.8ˑX4ˑX5 -0.54ˑX4ˑX6
Recycled concrete fines dosage if its interaction with other factors is not considered, increases water demand due to its porosity and the presence of amorphized cement hydration products (Figure 6 a, b).
The factors responsible for RCF activation (specific surface area, Figure 4a; thermal treatment temperature; dosage of chemical activator Na₂SiF₆) also affect water demand, although their impact is comparatively less pronounced (Figure 7). An increase in factor X₂ (cement consumption) causes the maximum rise in water demand of the fresh concrete within the studied range. The presence of a significant quadratic effect of this factor indicates that the highest increase in water demand is observed at cement consumption levels above 400 kg/m³ (Figure 7b, Figure 5a). It confirms the well-known rule of constant water demand of concrete mixtures [26].
The maximum reduction in water demand is caused by factor X₄ (superplasticizer SP dosage) (Figure 8a, b). The higher the SP content is, the less water is required to achieve the normal consistency. This factor is characterized by the most significant negative interactions in the model (X₄×X₁, X₄×X₂, X₄×X₃, X₄×X₅): SP effectively compensates the increased water demand caused by other factors (Figure 8a). The increasing of RCF specific surface area (Ssp, X₁) also increases water demand by 2–5 l/m³, since fine particles require more water for wetting and dispersion in the cement matrix. When combined with high cement content, the increase in water demand reaches 10–15 l/m³. The thermal treatment temperature of RCF (X₃) leads to a relatively small increase in water demand, which may be due to surface activation and the formation of more hydrophilic and reactive phases (2–10 l/m³) (Figure 8b). Factor X₆ (Na₂SiF₆ content) causes a slight decrease in water demand within the studied range due to a certain plasticizing effect (5–15 l/m³).
An important feature of this model is the presence of significant factor interaction coefficients, the consideration of which makes it possible to draw several important conclusions. For example, the interaction of the amount of RCF and superplasticizer clearly shows that increasing SP dosage almost completely neutralizes the additional water demand caused by an increase in RCF content (Figure 8a): the increase in water demand of 25–35 l/m³ is reduced to 5–10 l/m³ or less. The interactions of SP with RCF specific surface area (Ssp) and RCF thermal treatment temperature (T) are negative in terms of their influence on W: under the action of SP, the negative effects of increased dispersion or thermal treatment are significantly weakened (Figure 8b). Thus, to minimize water demand at high RCF content, especially at elevated cement consumption, the key solution is to increase the SP dosage (reducing water demand by about 50±10 l/m³).
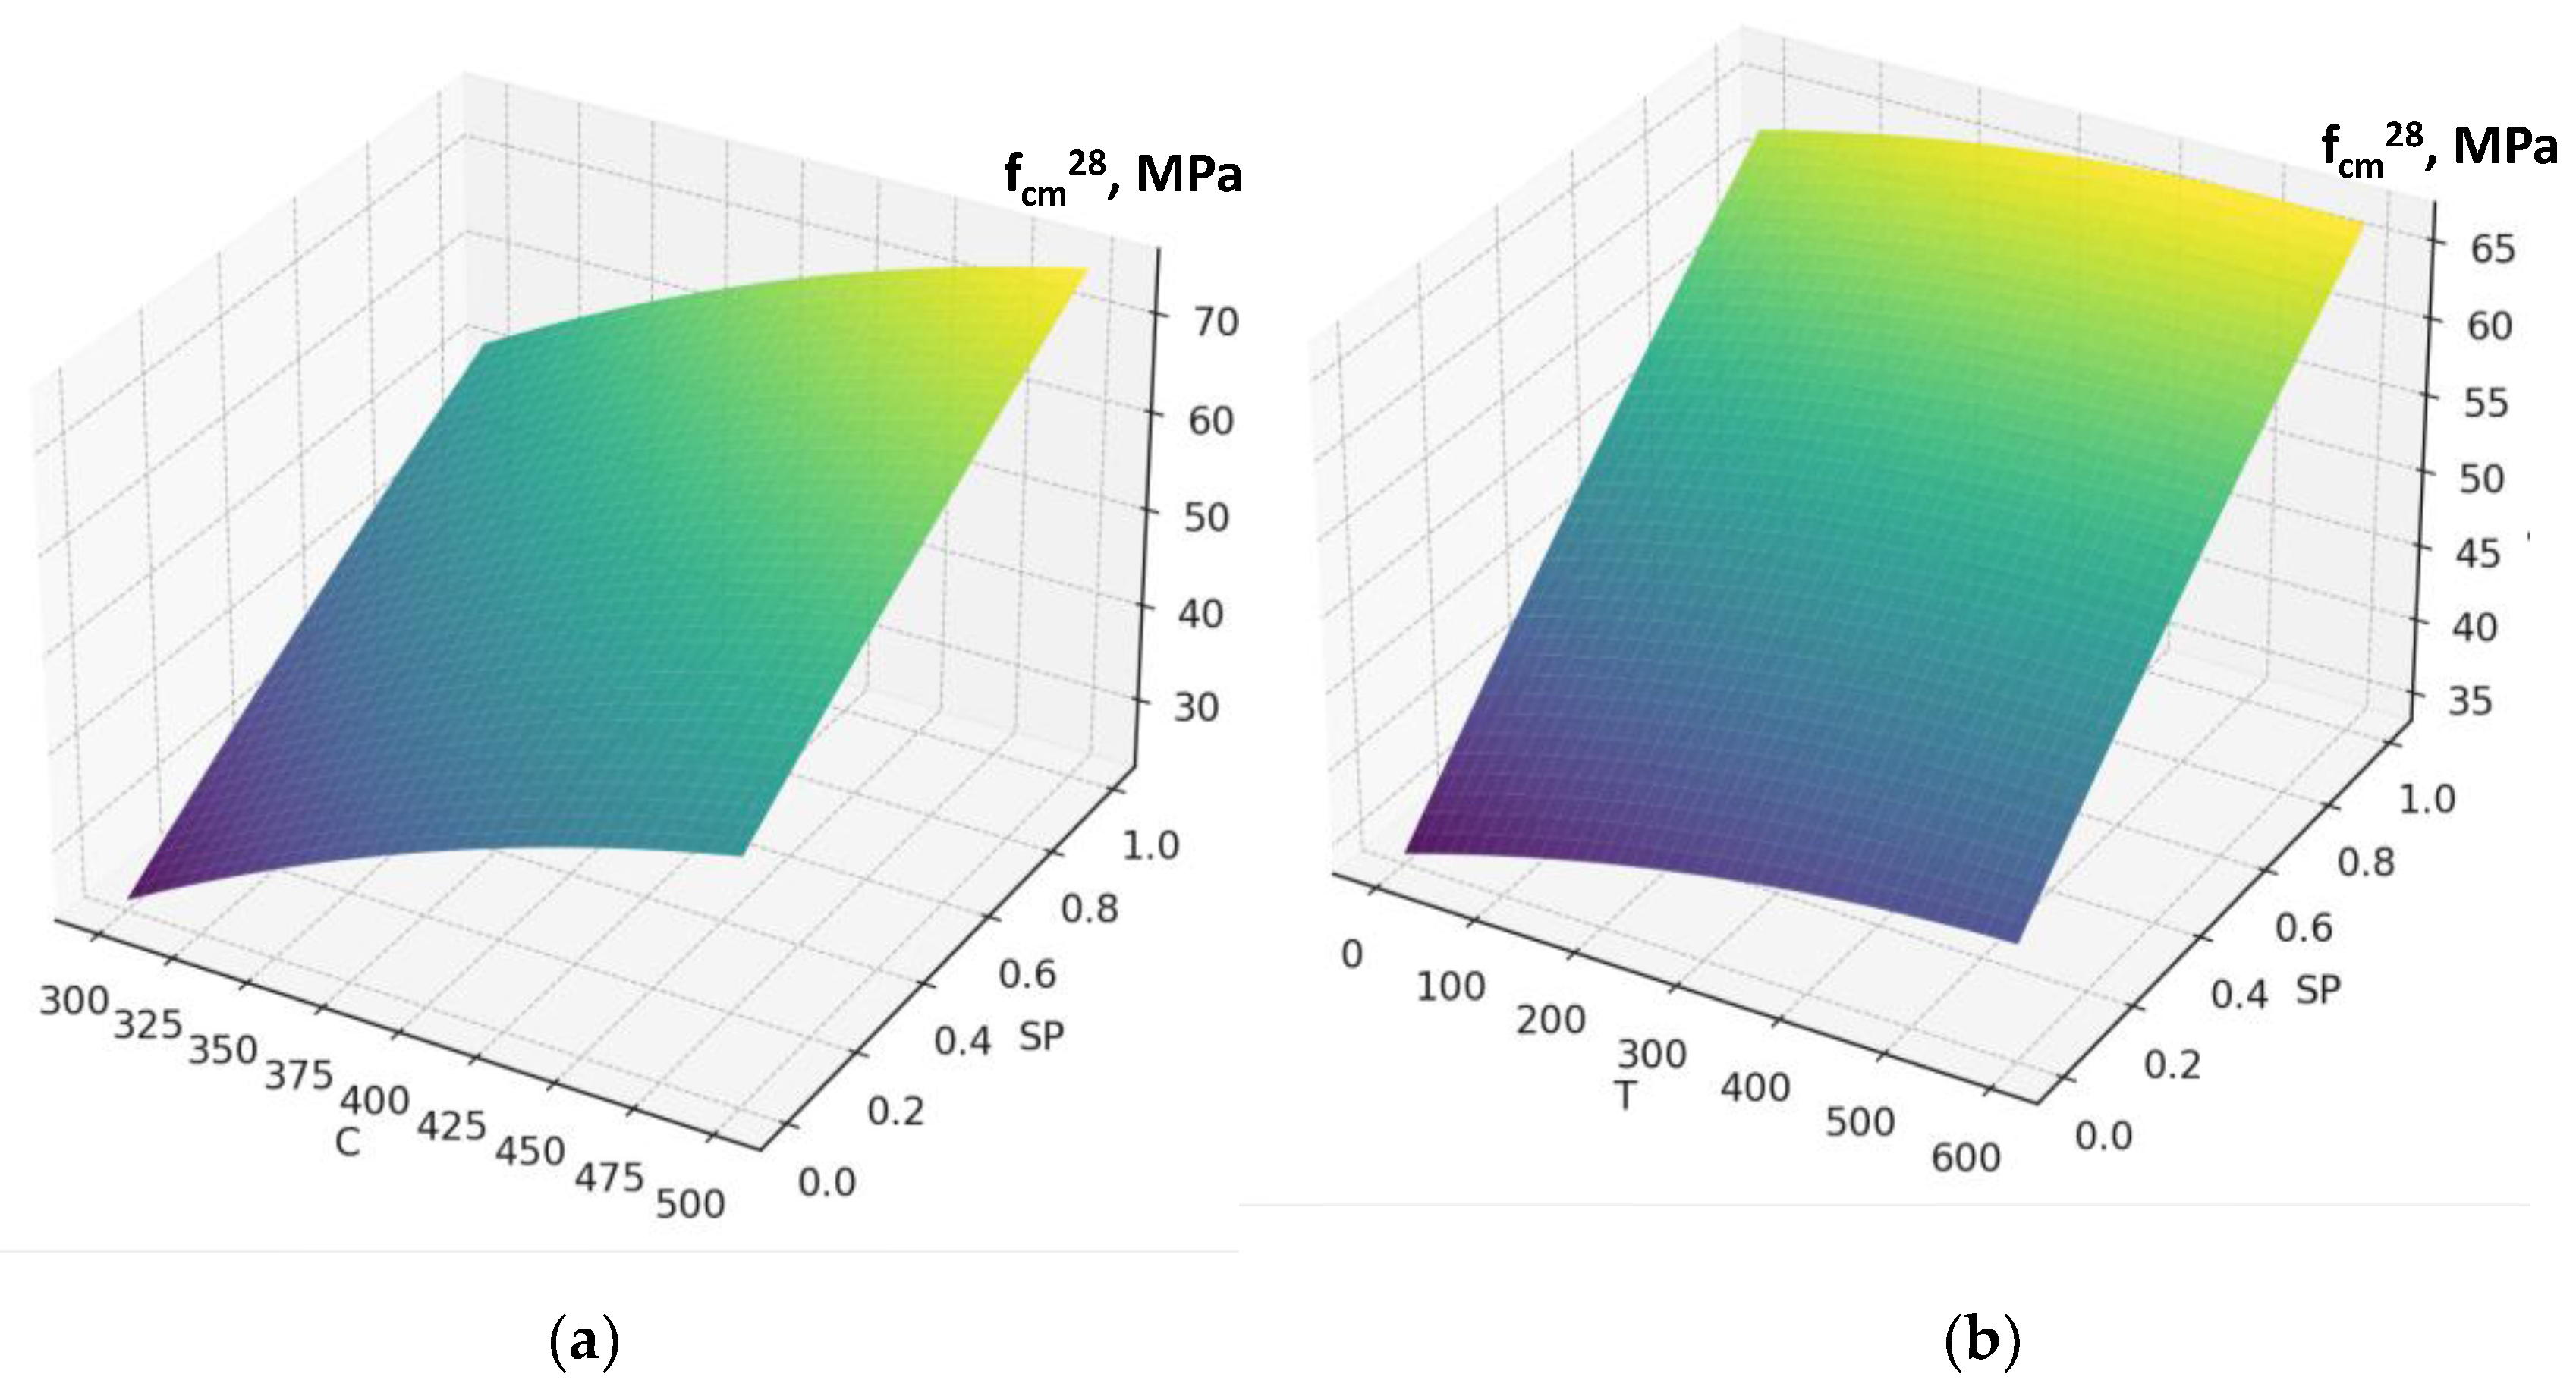
The compressive strength model with six factors (2) showed a high level of adequacy (R² ≈ 0.991, average error ≈ 1.8 MPa). This allows not only qualitative but also quantitative evaluation of the influence of individual parameters. According to the model (equation), the compressive strength of concrete at 28 days varies within a fairly wide range of 20–70 MPa, which is caused by significant variations in the w/c ratio (from 0.35 to 0.68) (Figure 9, Figure 10, Figure 11, Figure 12, Figure 13 and Figure 14).
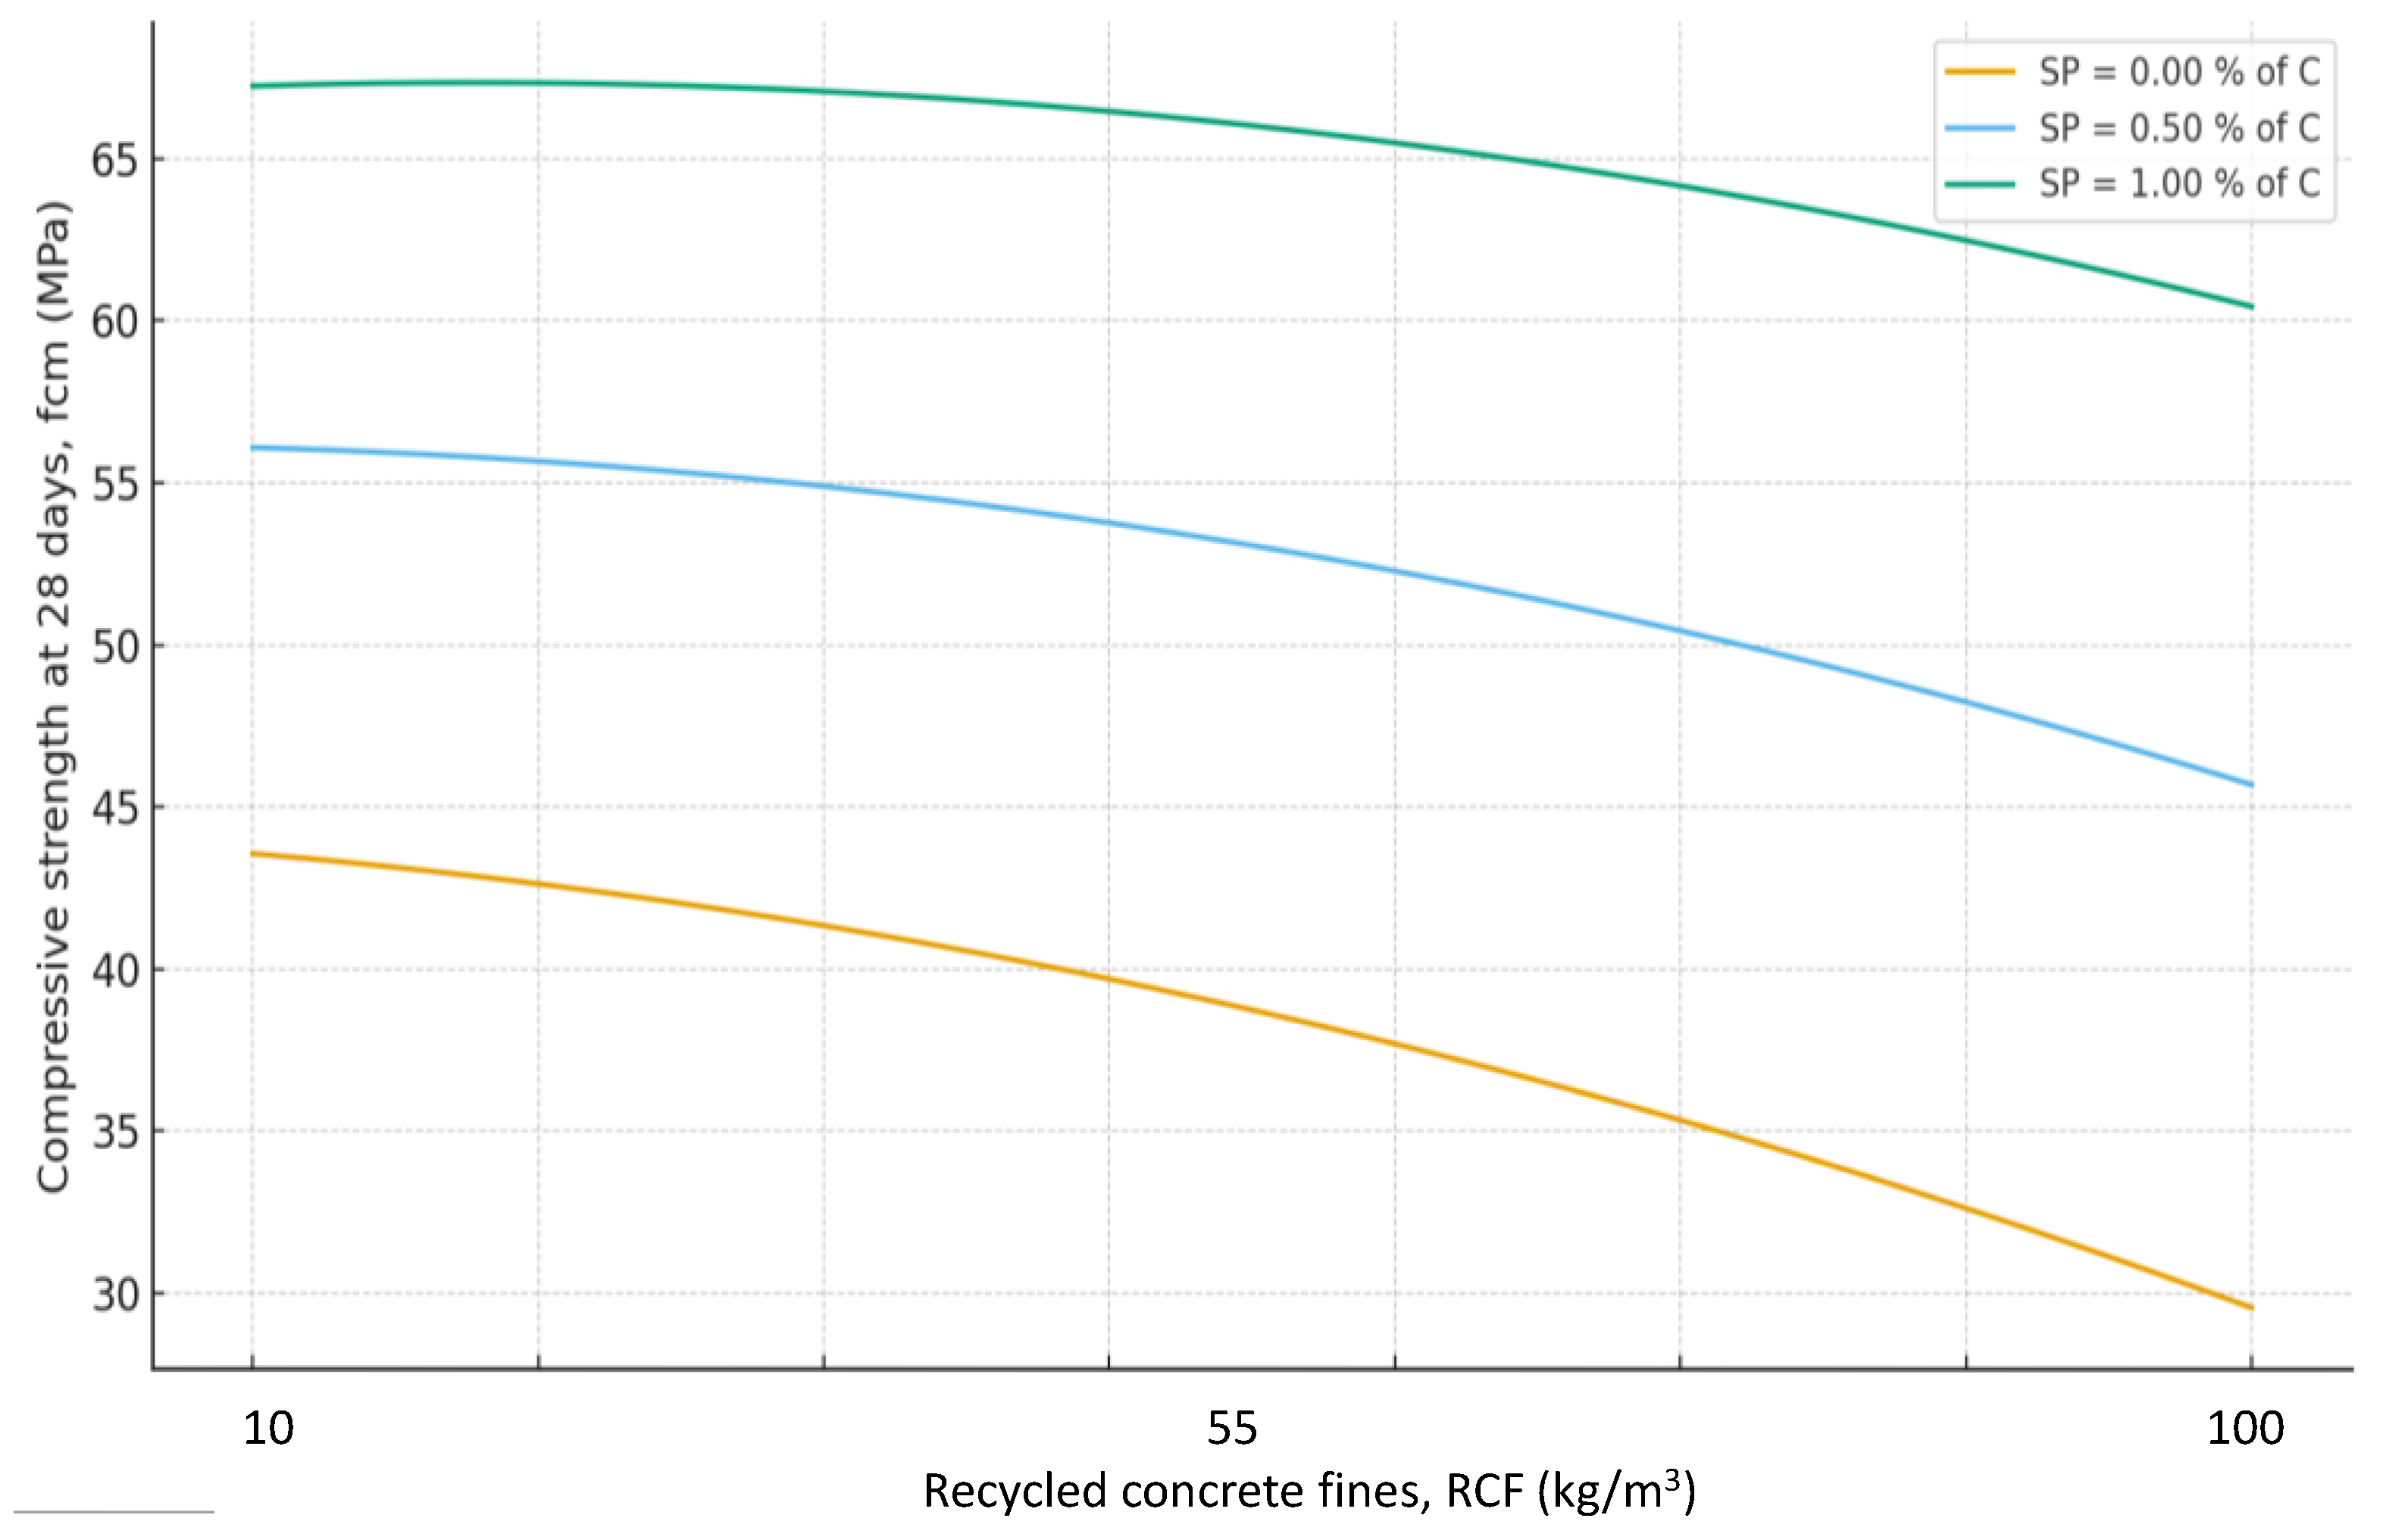
As expected, the greatest influence on strength belongs to factors X₂ and X₄ (cement content and SP). An increase in cement consumption and, accordingly, the cement-to-water ratio from the minimum to maximum level results in a strength gain of about 24 MPa (42–45% relative to the average), while an equivalent increase in superplasticizer dosage provides about 27 MPa (50–55%). At the same time, an increase in the RCF dosageis negative: rising from the minimum to the maximum level reduces strength by approximately 8–10 MPa (16–18%) (
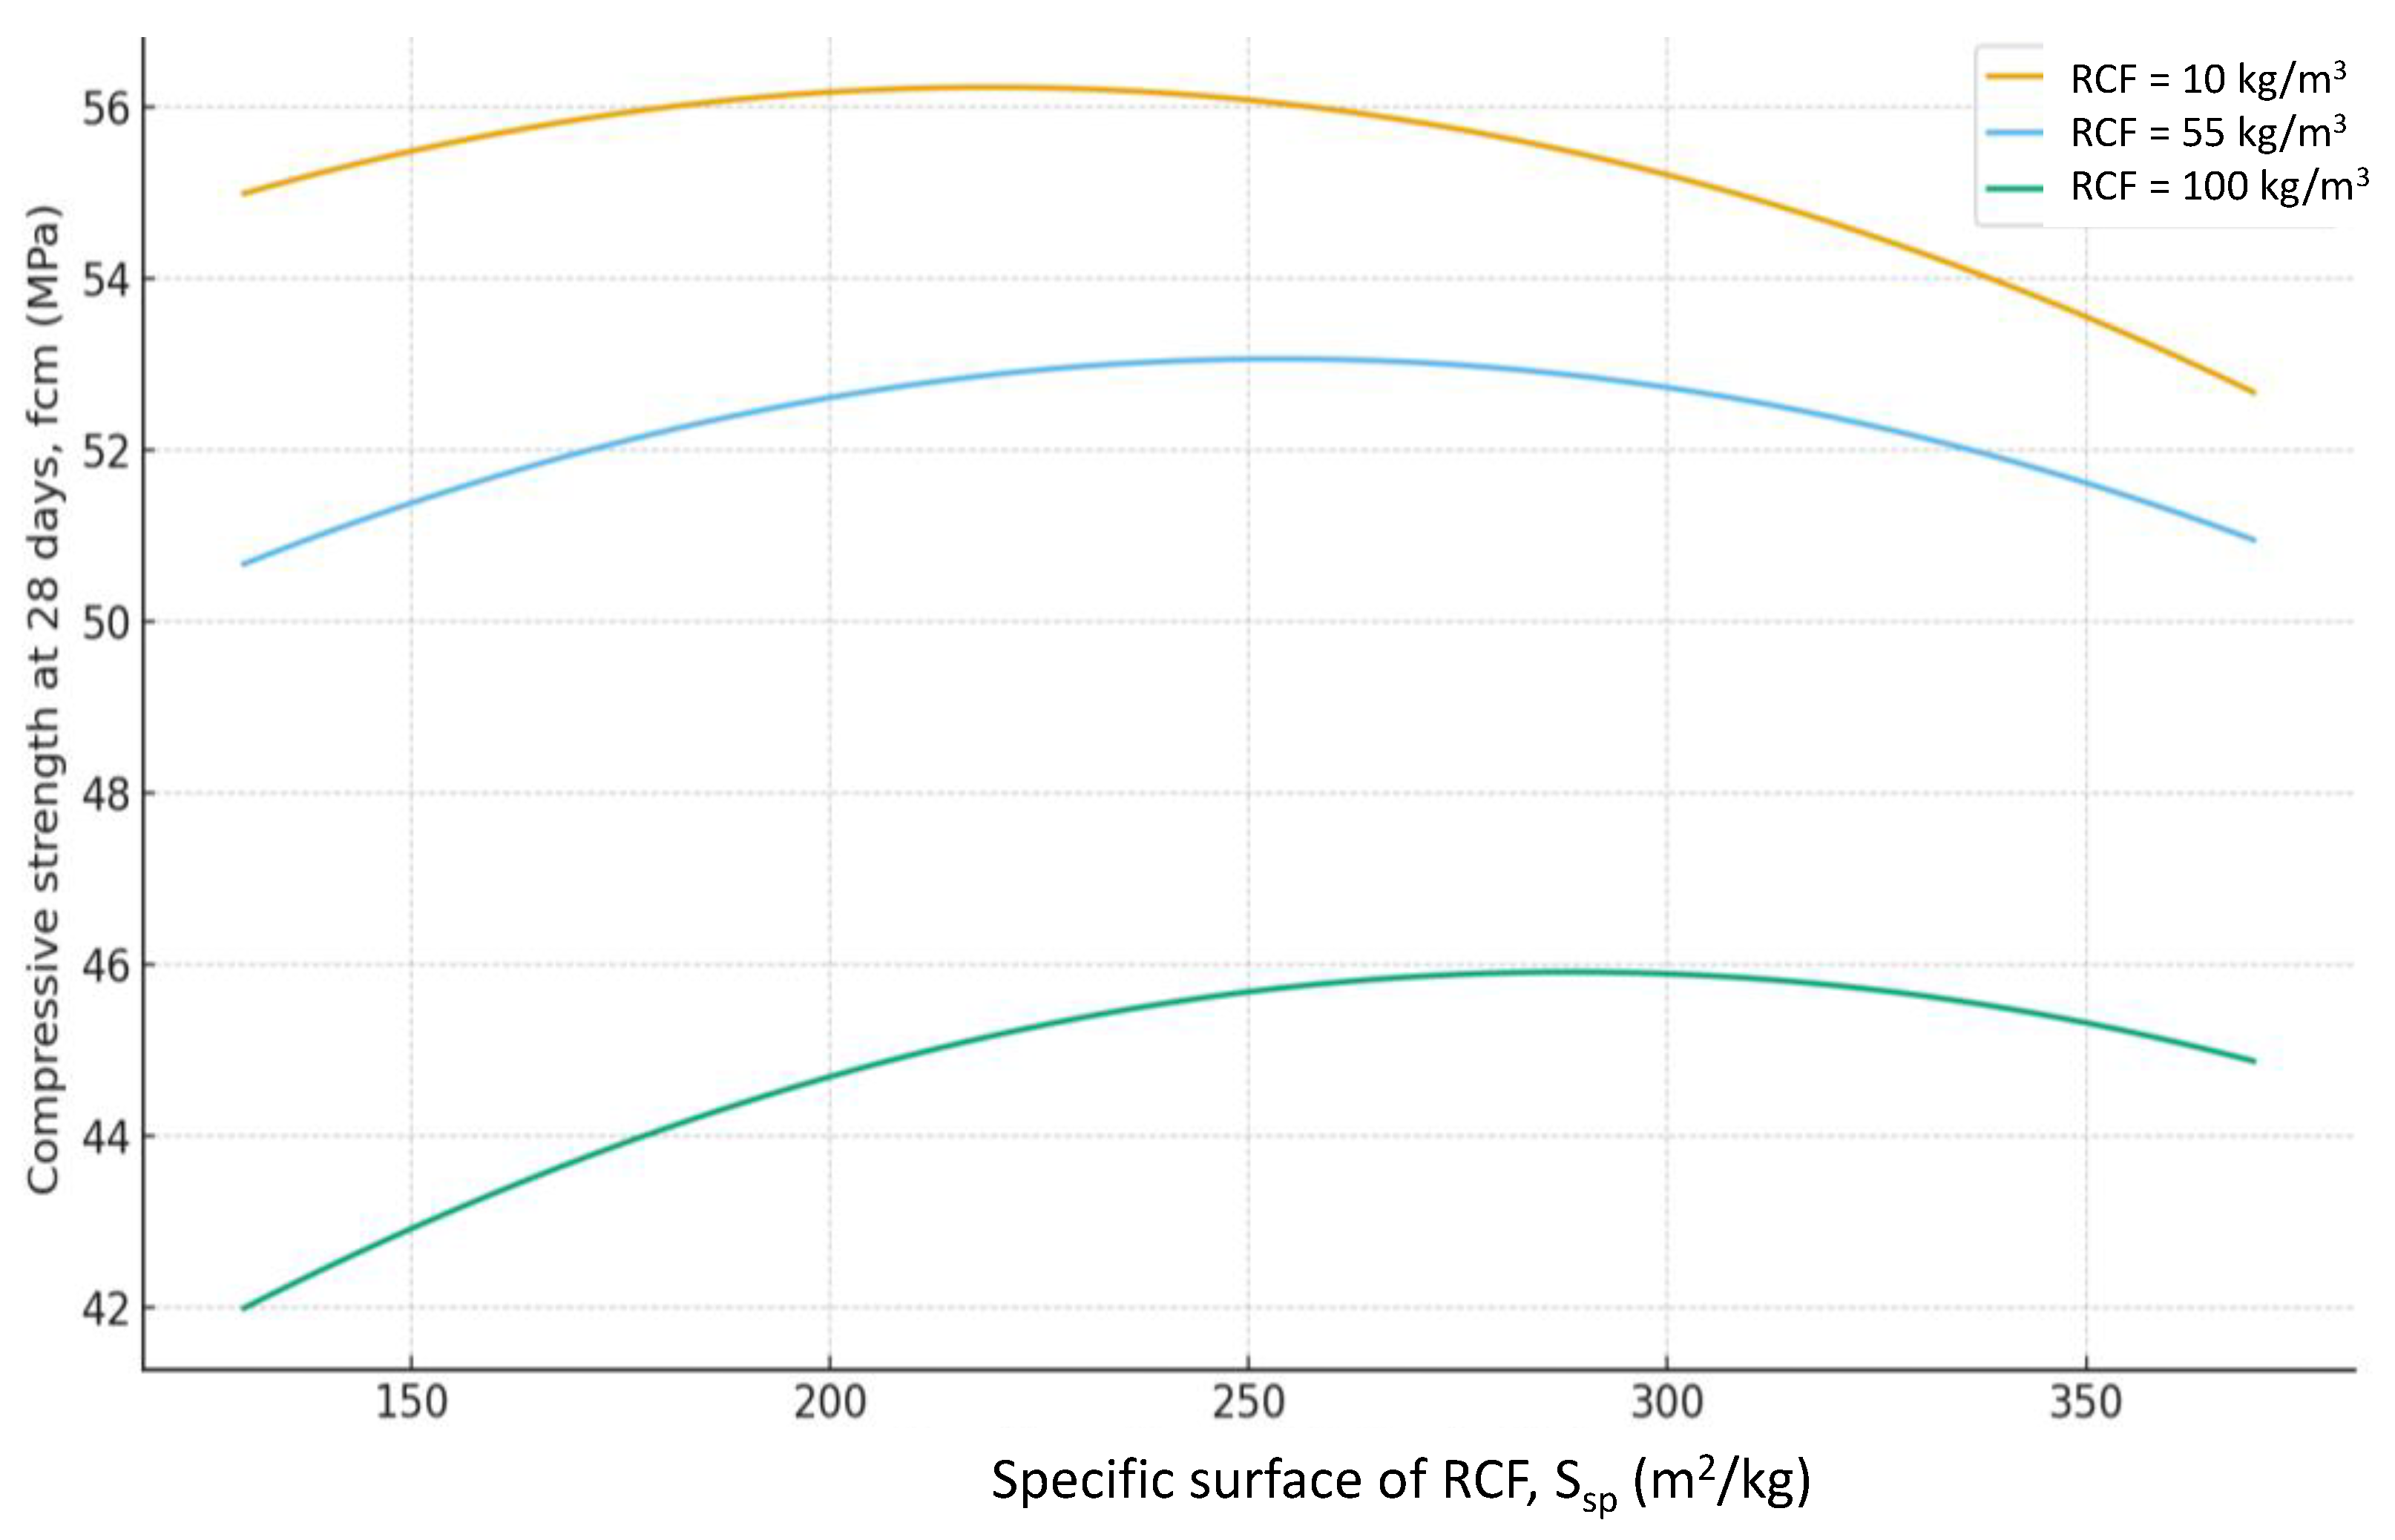
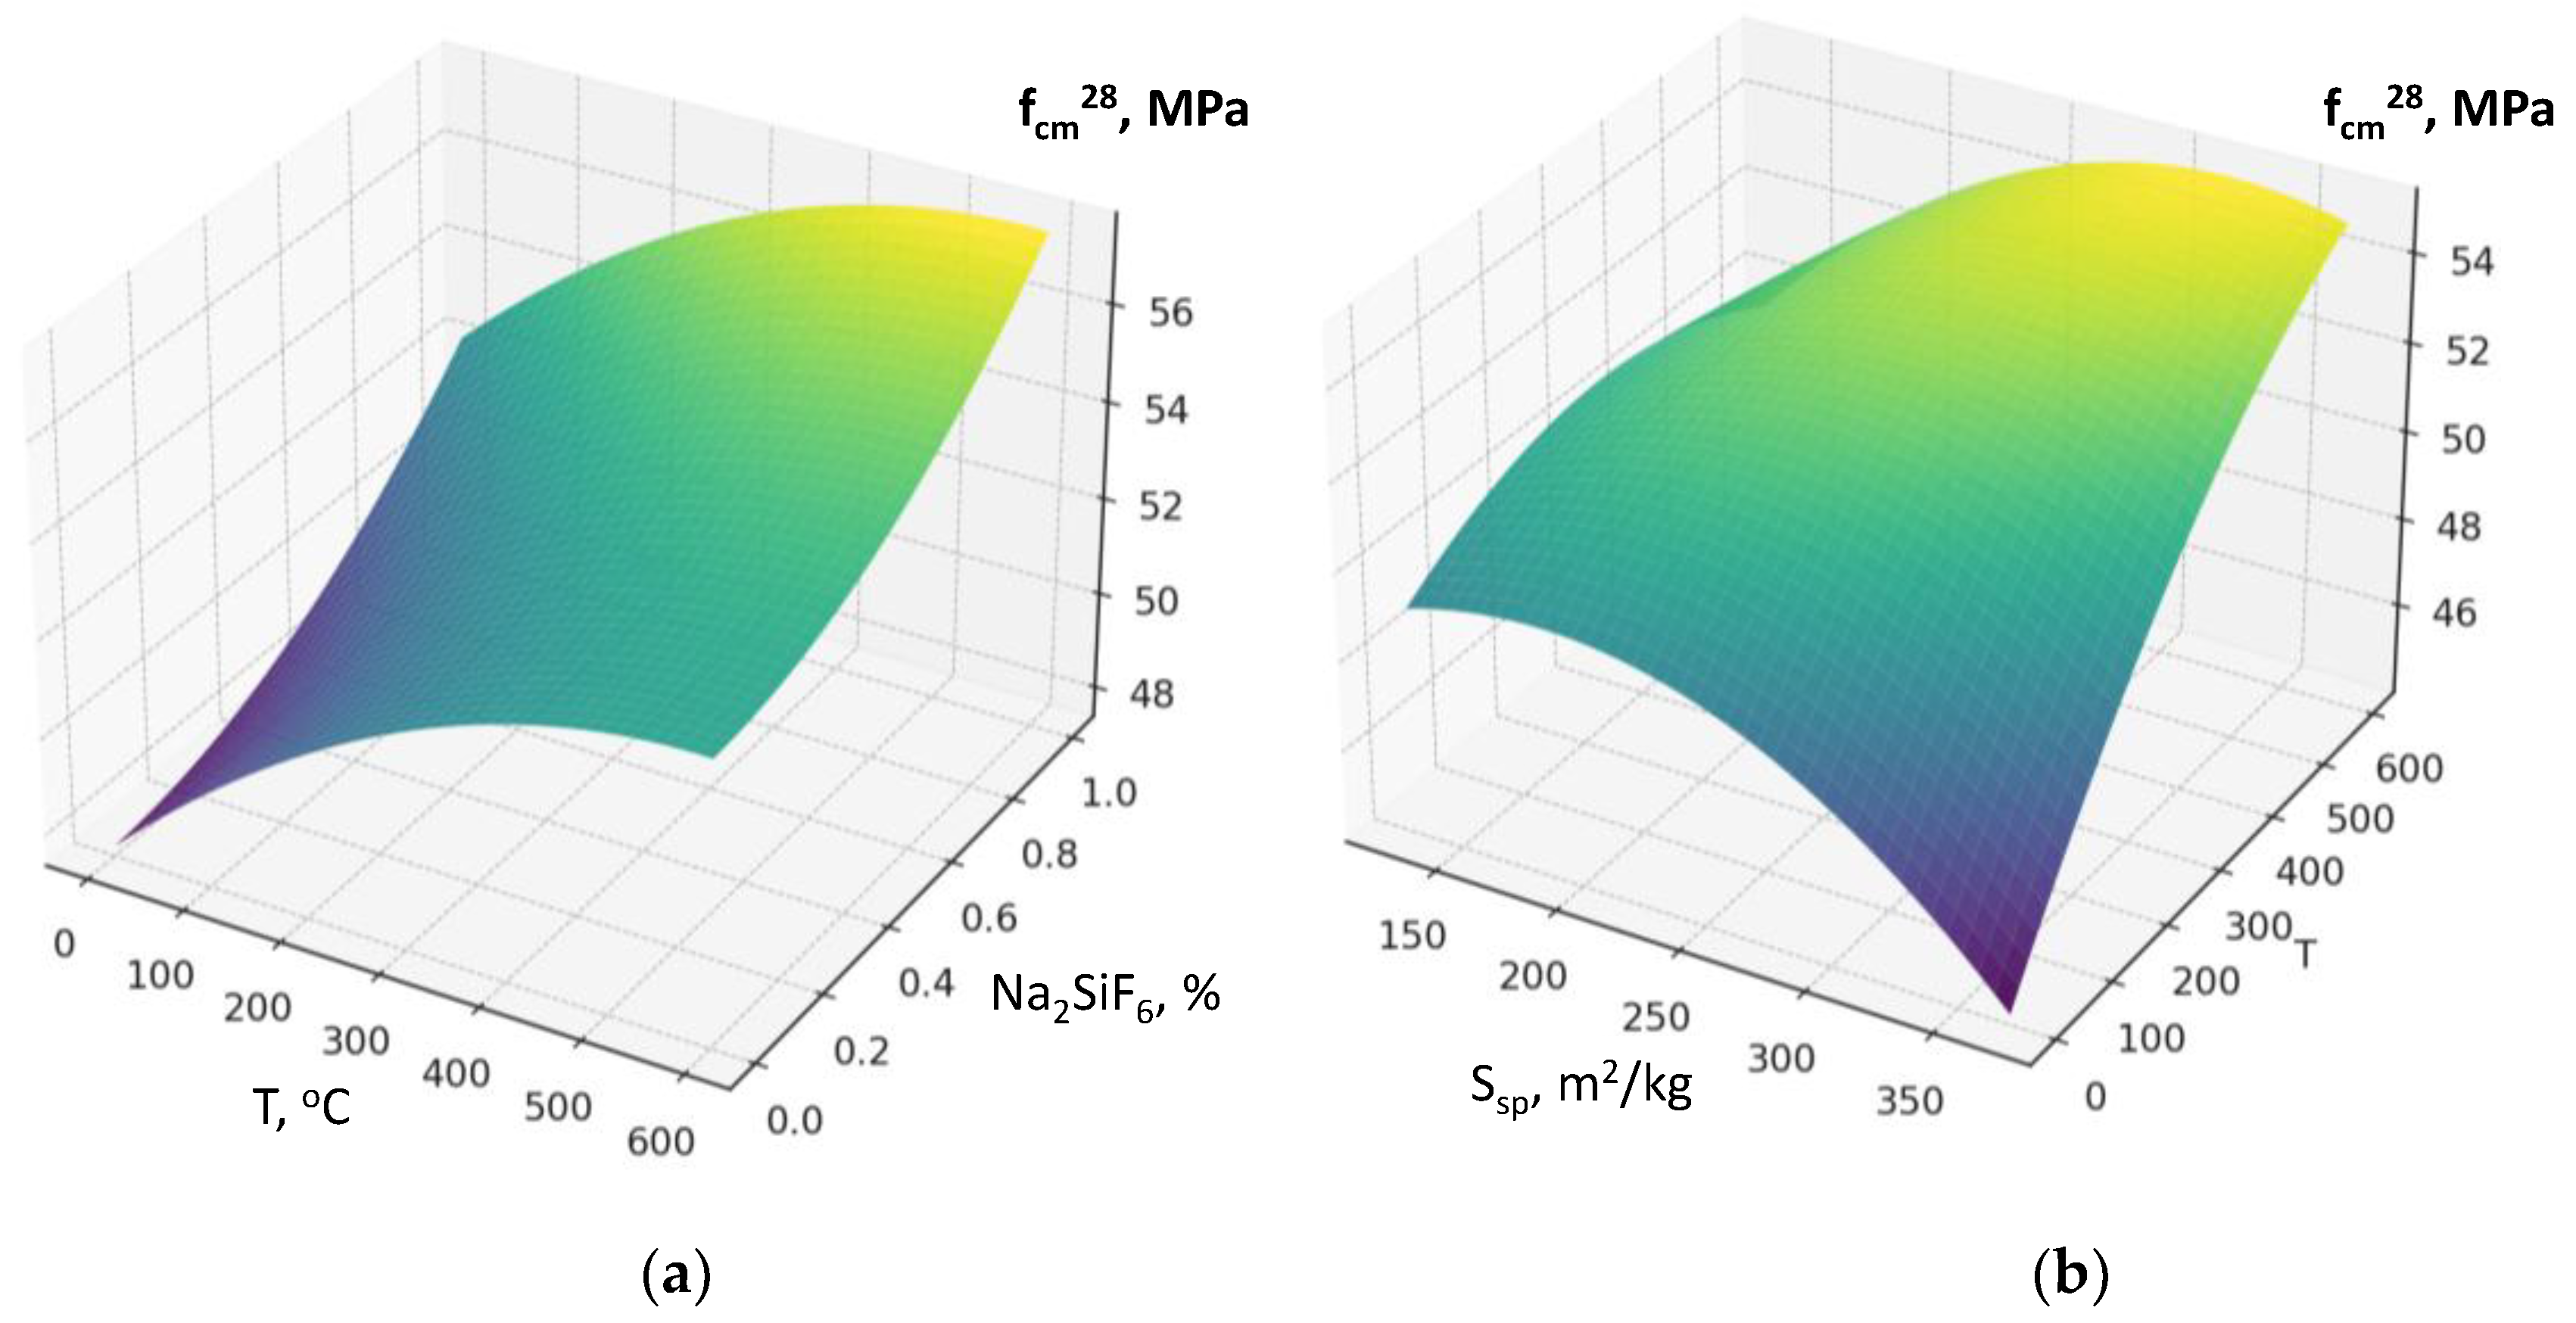
Figure 7). The effect of different RCF activation methods on concrete strength is mixed. Increasing thermal activation temperature causes a noticeable effect: the difference between low (non-thermally activated RCF) and high T is about 9%. Activation by Na₂SiF₆ within the studied range produces a strength gain of about 7%. Increasing the specific surface area of RCF by grinding in a ball mill (Ssp) shows an ambiguous effect, producing the greatest strength increase near the mid-level of variation (250 m²/kg); further fineness increase reduces strength due to higher water demand (Figure 10).
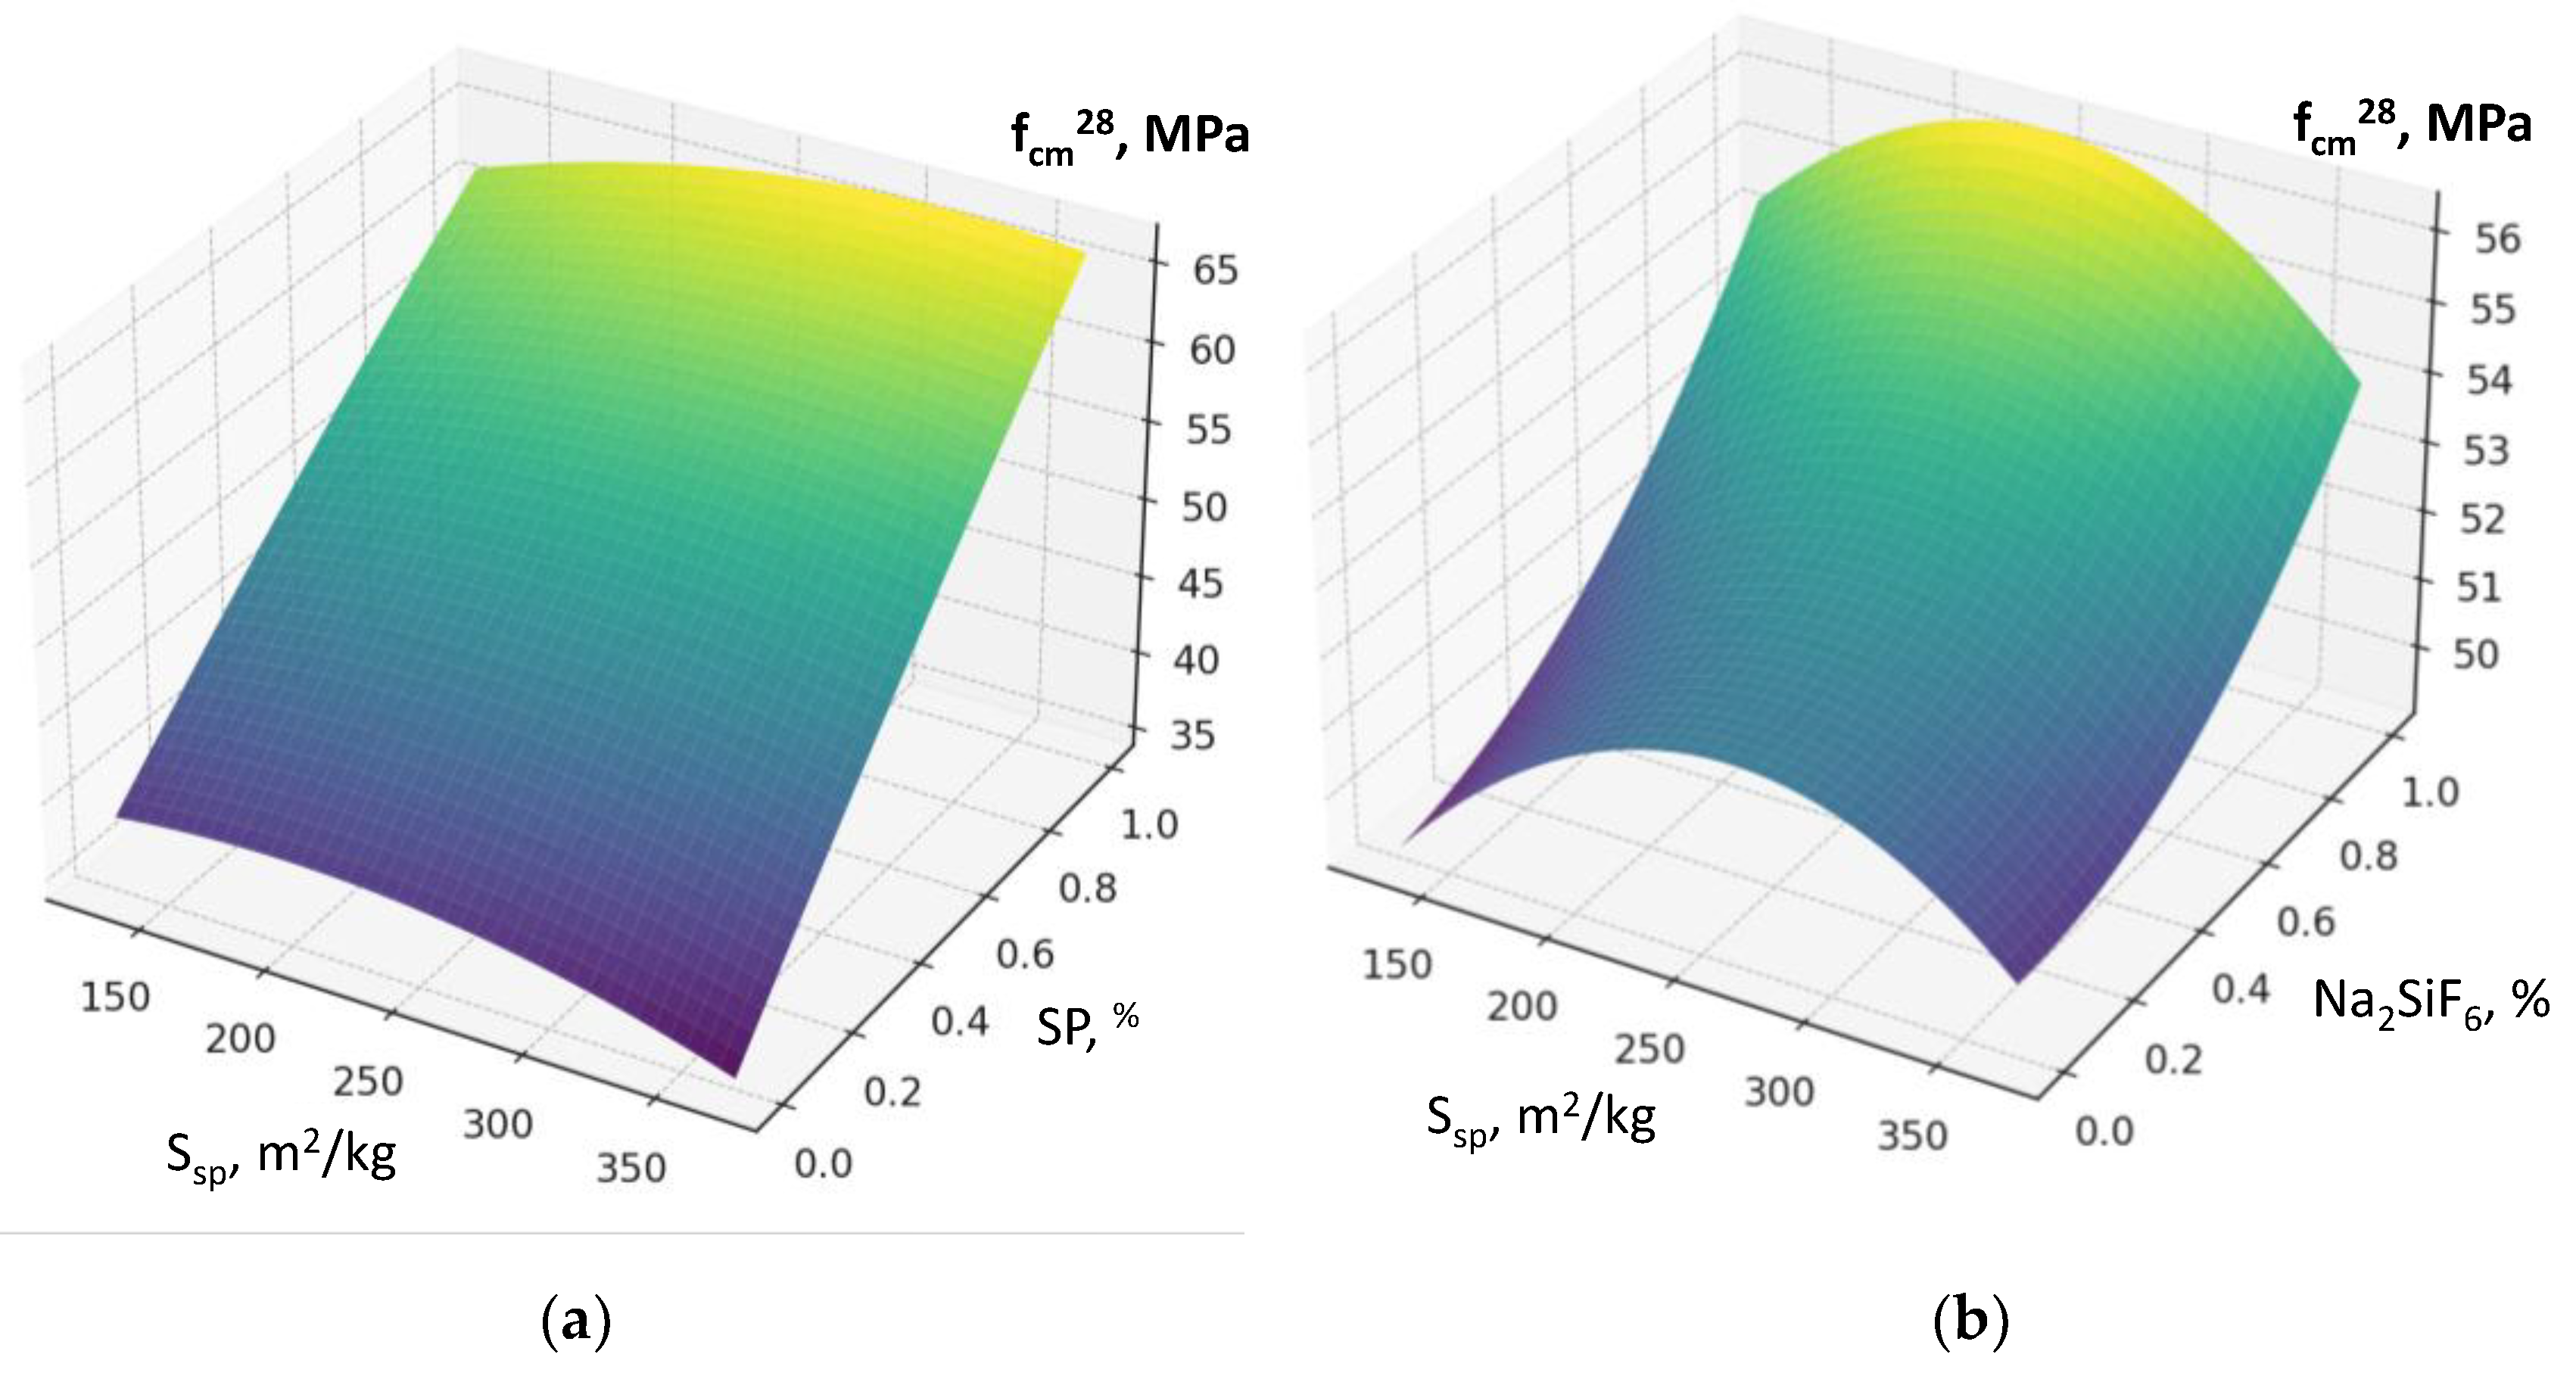
Interactions between factors confirm that the maximum efficiency of using the RCF as a mineral additive is achieved through combined effects. The most important is the interaction between RCF and SP (X₅ and X₄) (Figure 8): if SP is not used, increasing RCF content reduces strength on average by 10–12 MPa, but with sufficient SP dosage (up to 1%) the losses decrease to 3–5 MPa, i.e., they are almost fully compensated. The interaction between Ssp and SP is also positive: with SP present, the effect of mechanical activation of RCF nearly doubles (Figure 11a). The combination of mechanical and thermal activation (factors X₁ and X₃) (Figure 10b) allows an additional strength gain of up to 4 MPa compared with the simple sum of their effects. Other interactions (e.g., C×SP or T×Na₂SiF₆) are less significant (within 1–2 MPa) (Figure 11 and Figure 12).
Thus, the dispersed fraction of recycled concrete in the form of concrete powder generally reduces strength by 15–20%, but this effect is significantly offset by the use of SP and additional activation. Key interactions (Ssp×T, Ssp×SP, SP×RCF) demonstrate that the mechanochemical activation of RCF provides maximum effect only when combined with thermal treatment and plasticization.
The above-described tendencies in factor influence on 28-day strength are generally preserved at earlier curing ages (3 and 7 days), although the negative effect of RCF addition is comparatively stronger.
The obtained models of strength and water demand of concretes with dispersed fractions of recycled concrete allow the prediction of concrete properties and the determination of mix composition for a given target strength.
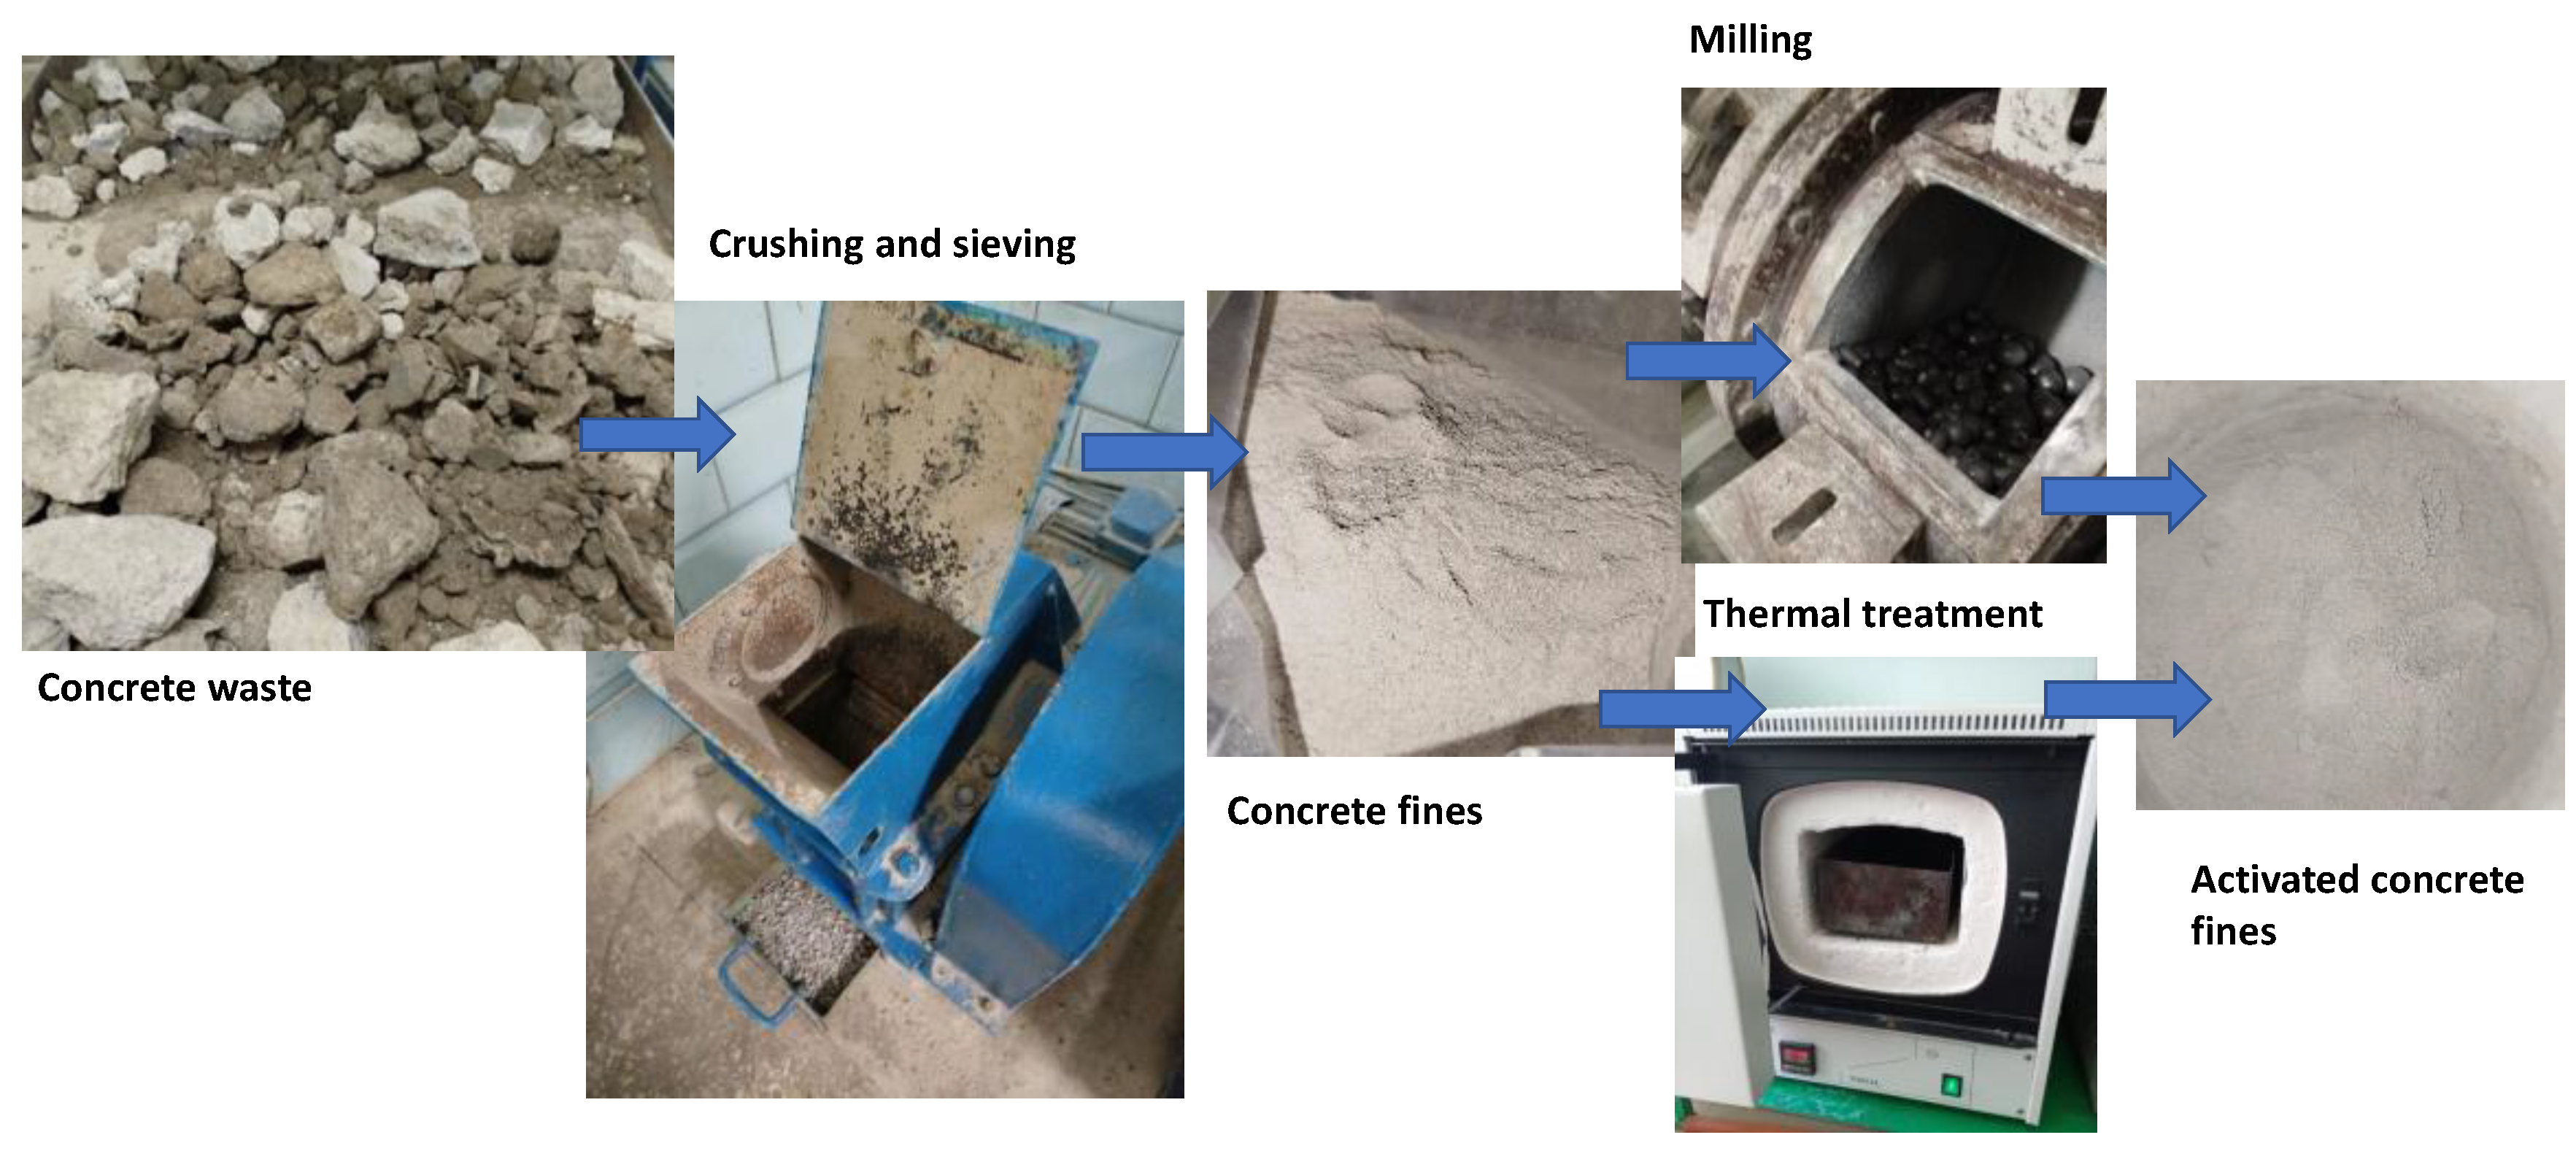
There had been taken and analysed SEM images of concrete for the 5 samples:
  • Control,
  • 20% recycled concrete fines;
  • 20% recycled concrete fines+ Na2SiF6 (chemical activation).
  • 20% recycled concrete fines (ground/nonground = 50/50);
  • 20% recycled concrete fines (ground + thermally treated)
The key idea is to determine the effect of recycled concrete fines (RCF) on microstructure, chemistry, reactivity, mechanical performance, and ways mechanical and thermal treatment modifies these effects compared to a control concrete.
It was supposed that RCF reduces Ca/Si in the paste at increasing C and slightly reduces early strength vs control but improves late-age strength due to filler/pozzolanic effects (nucleation effect).
Chemical activation with Na₂SiF₆ is supposed to increase reactive Si/Al availability (higher amorphous content), accelerating pozzolanic reactions and improving strength and CH consumption relative to untreated RCF.
Mechanical grinding was expected to increase surface area and early reactivity, but does not change bulk chemistry; the 50/50 mix yields a heterogeneous microstructure and intermediate performance.
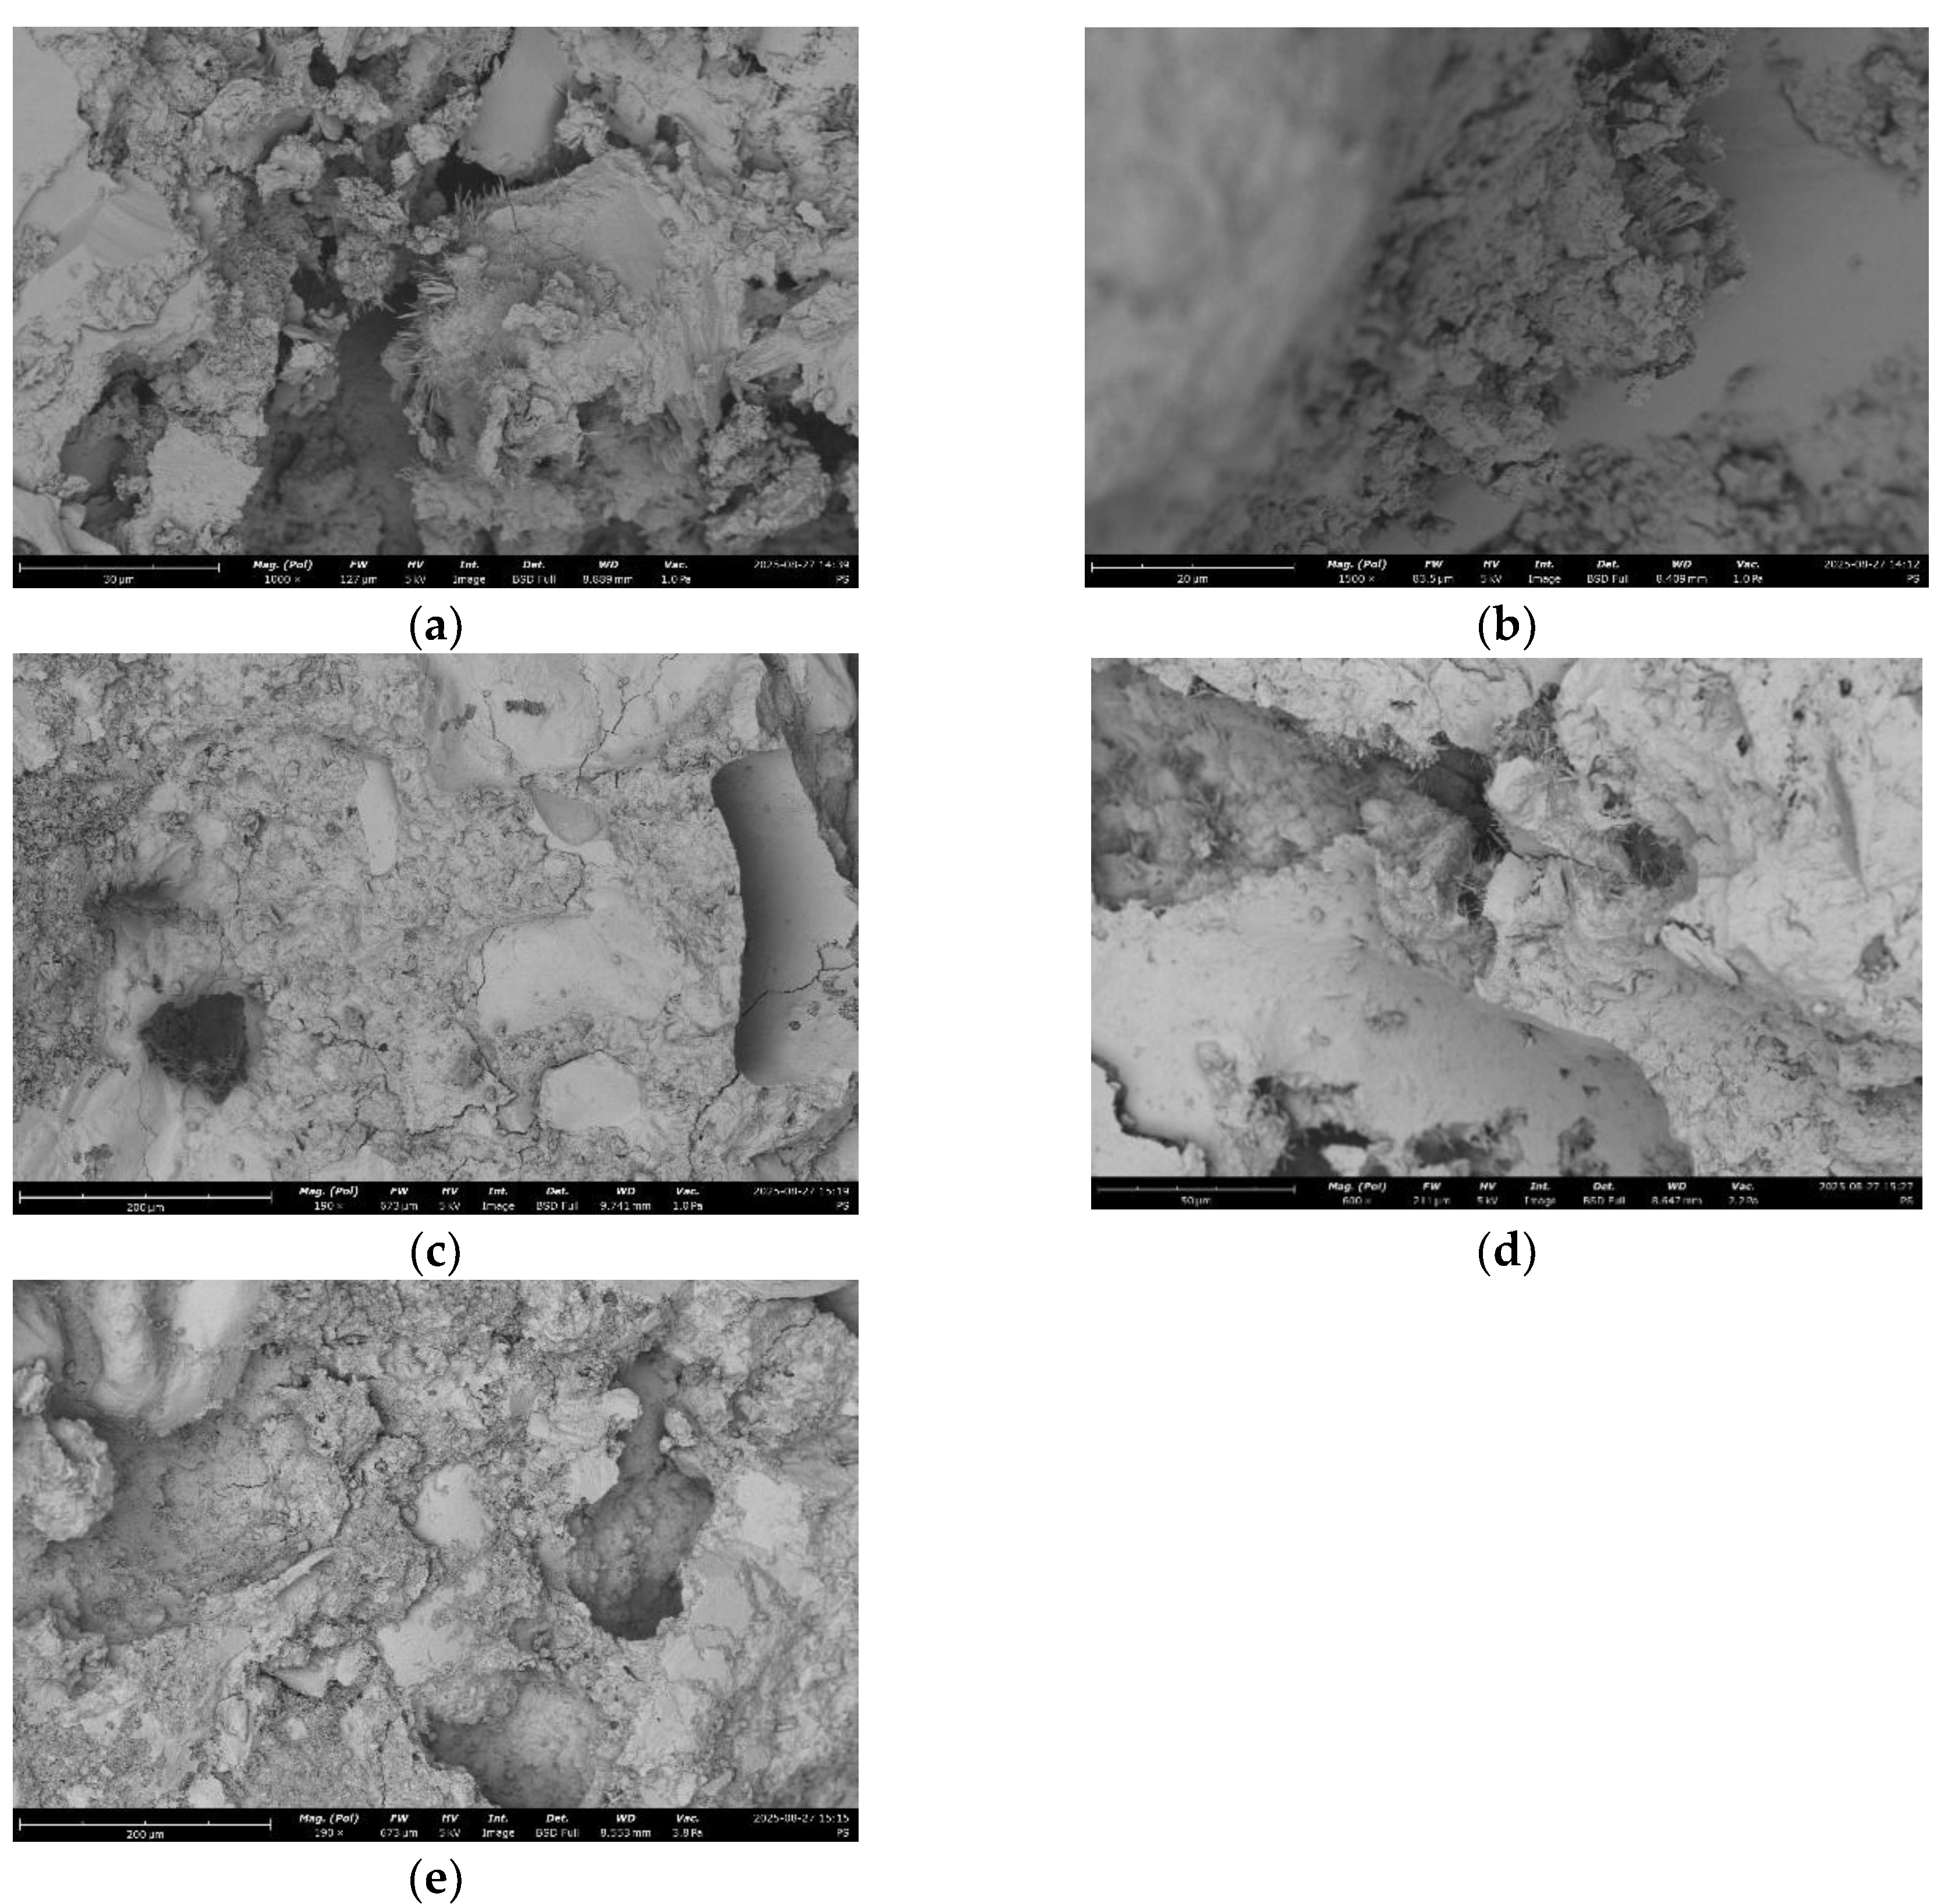
Figure 15. SEM micrograph of concrete microstructure:a) 1; b) 2; c) 3;d) 4; e) 5. (according to Table 4).
Preprints 186795 g013
As it can be seen at micrographs RCF improves the continuity between aggregate and paste phases. Concrete fines serve mainly as fine filler, improving particle packing.
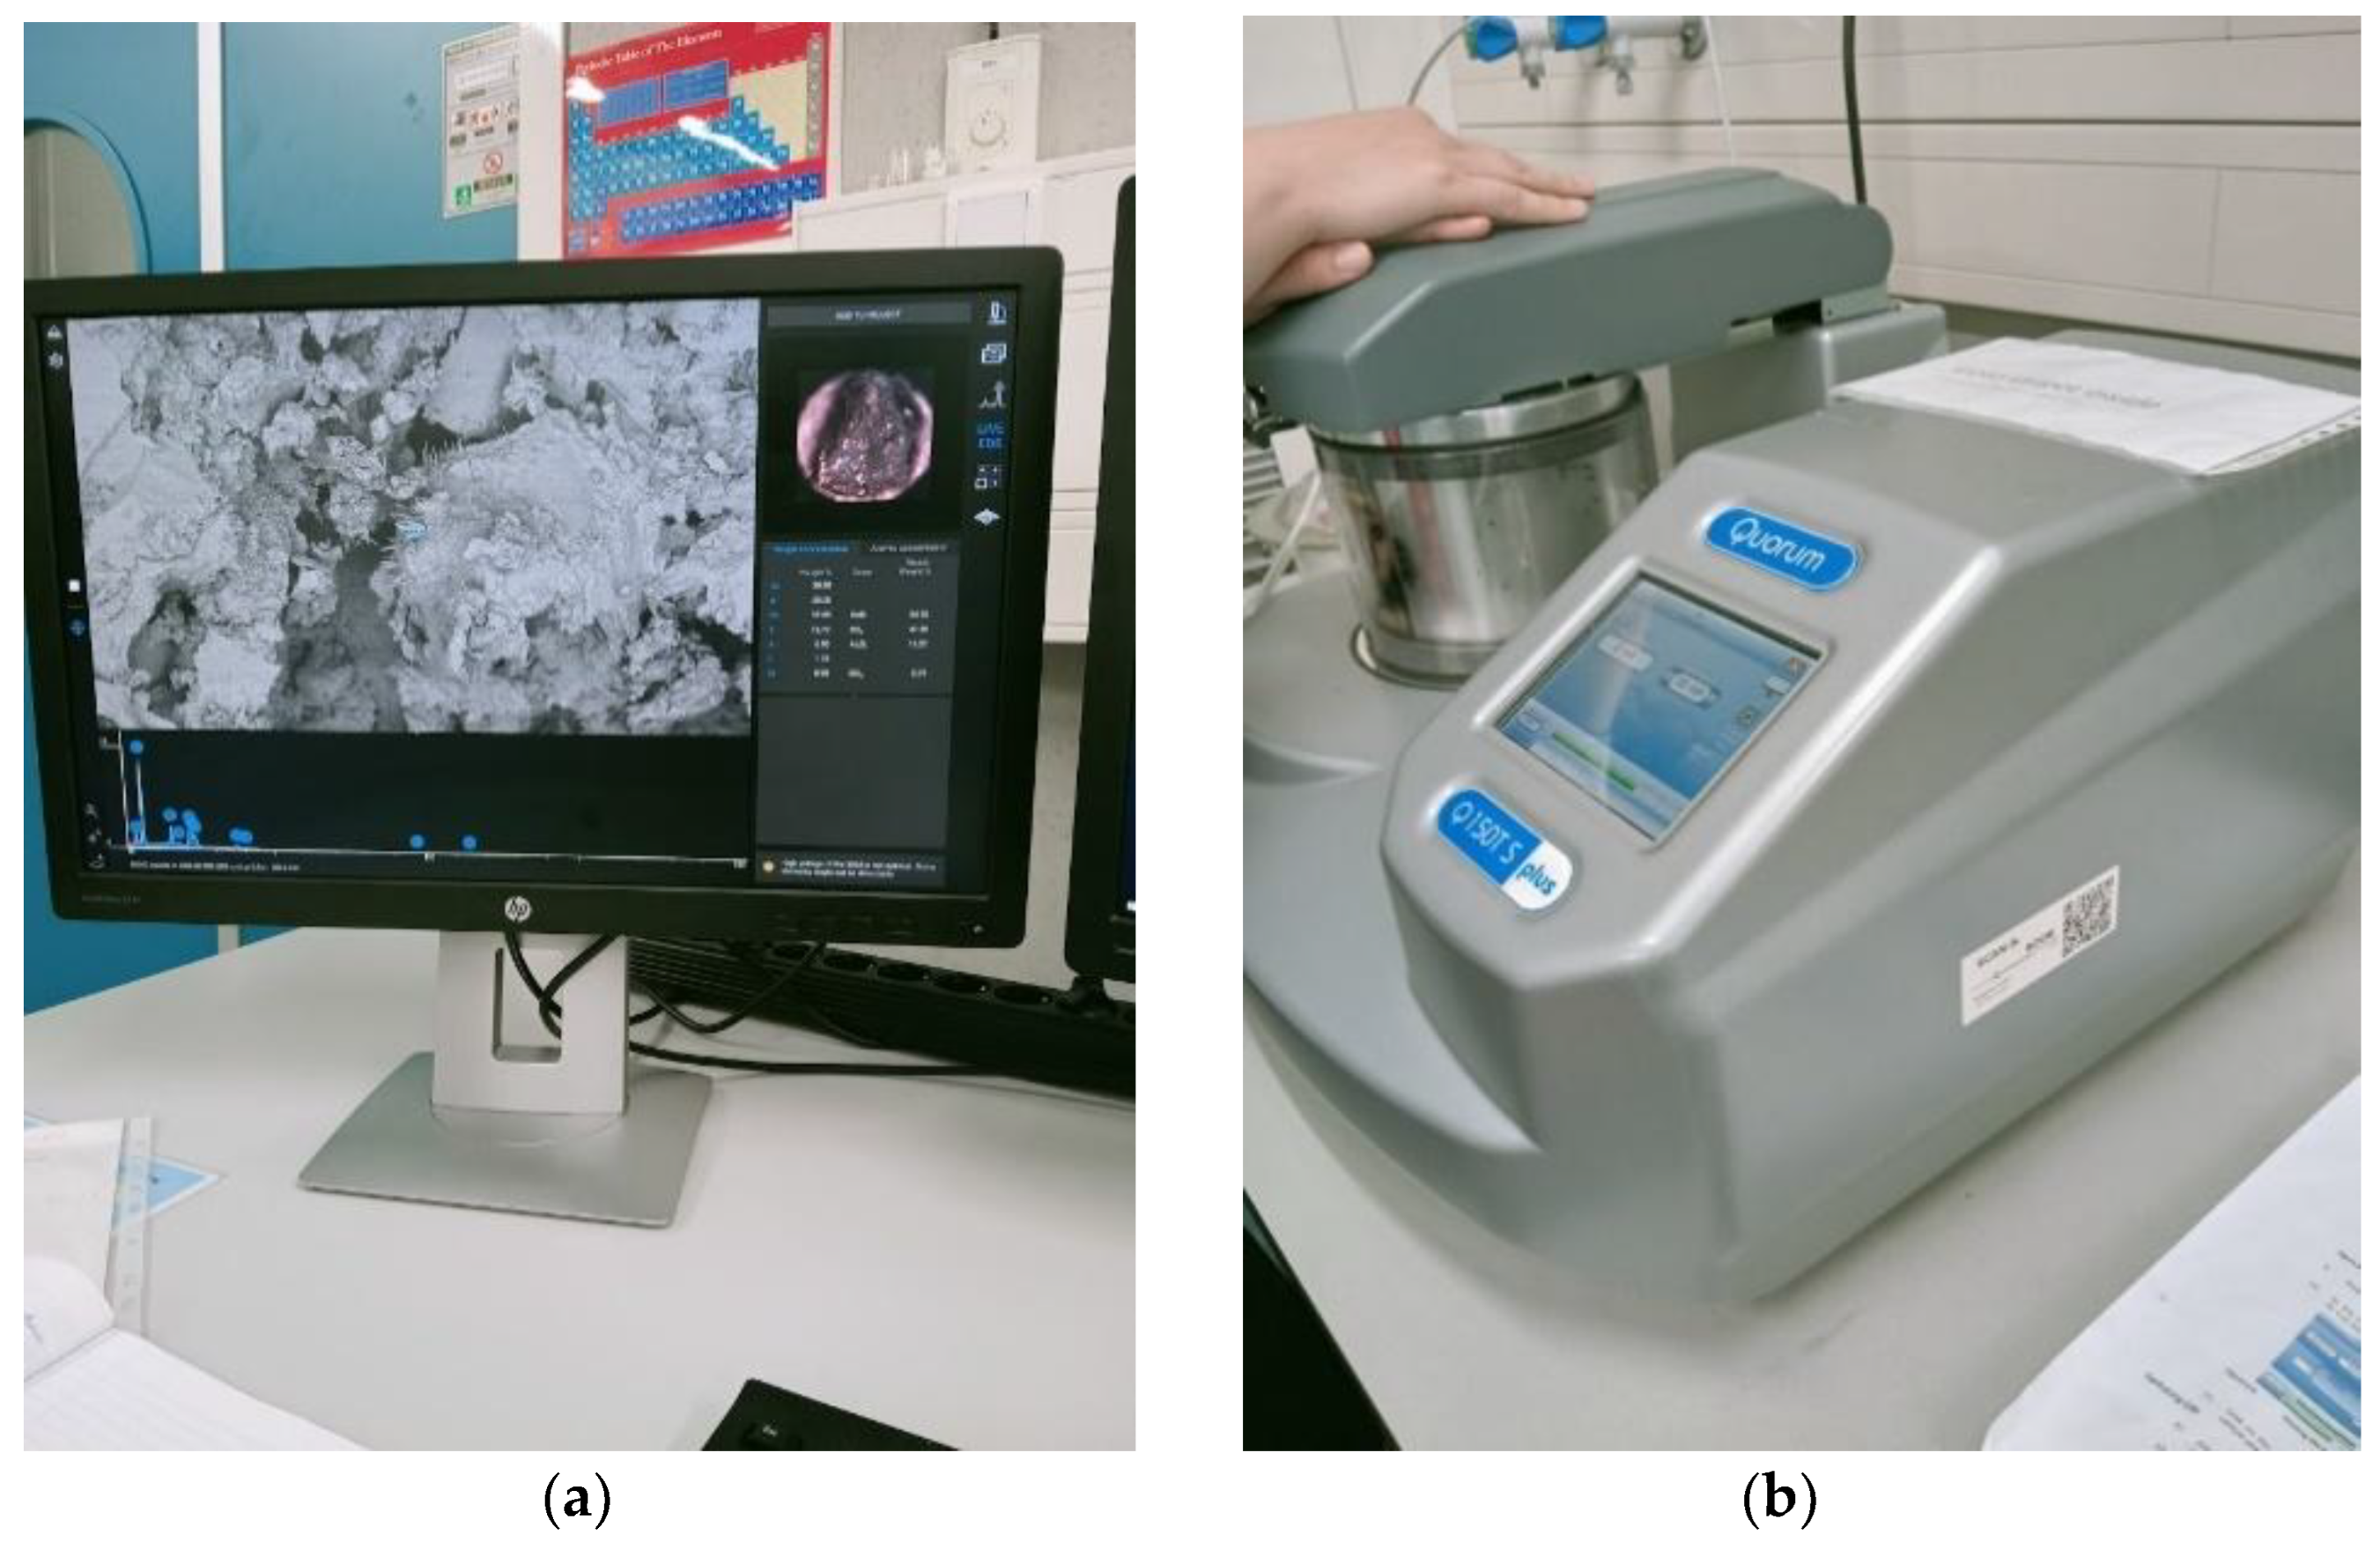
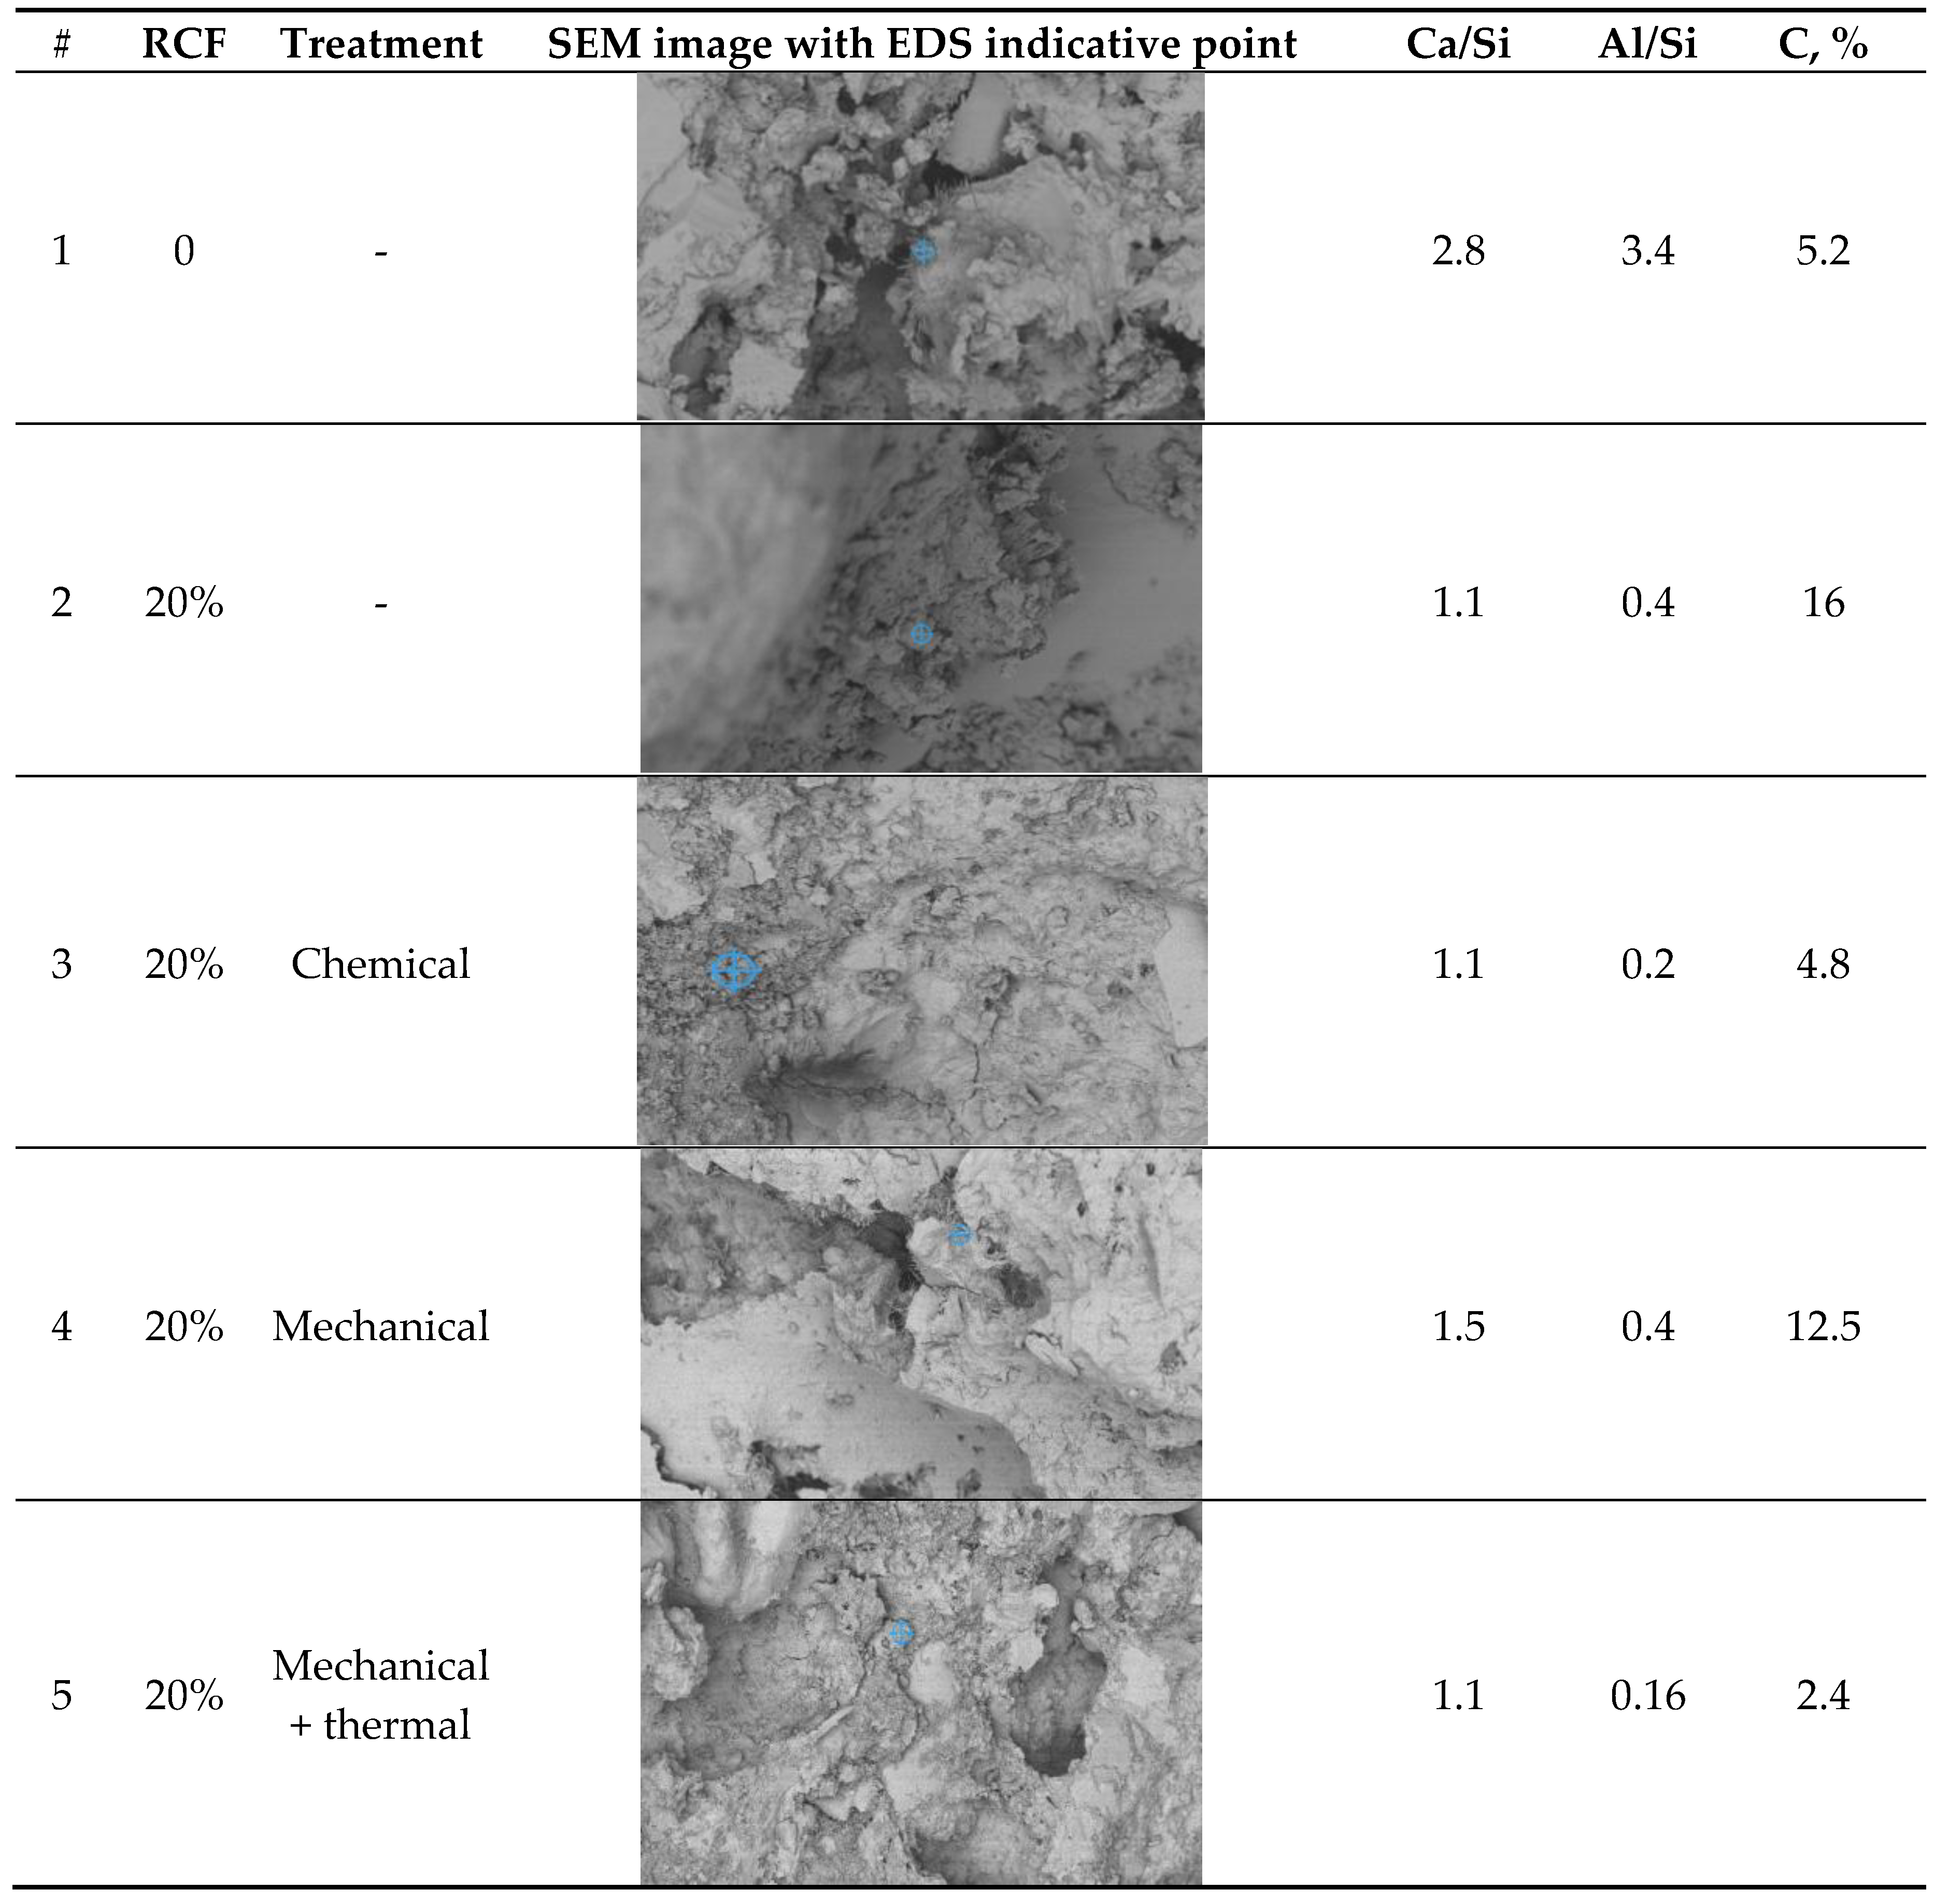
The SEM-EDS analysis presented in Table 7 reveals distinct microstructural and compositional differences between the control concrete and those modified with recycled concrete fines (RCF), with or without additional treatment. The key outcomes reflect the influence of RCF on the calcium-silicate-hydrate (C–S–H) chemistry, degree of carbonation, and presence of other hydration or filler phases.
As it can be seen from Table 7, for control concrete Ca/Si ratio is the highest among all the samples tested as there is higher portlandite content (CH) from full cement hydration. There is also a low level of carbonation since the matrix is denser, with lower open porosity (especially if well cured), and less CO₂ can diffuse inside.
The control concrete sample exhibits the highest Ca/Si ratio (≈ 2.8) and Al/Si (≈ 3.4) among all samples, suggesting the dominance of portlandite (Ca(OH)₂) and potentially aluminate-rich phases (e.g., AFm/AFt or hydrogarnet). These values are much higher than those typical of C–S–H gel (Ca/Si ≈ 1.2–1.8), implying limited pozzolanic activity and a fully hydrated cement system.
The low carbon content (5.2%) indicates minimal carbonation, consistent with a dense, well-cured microstructure with limited CO₂ ingress. The microstructure is likely dominated by unreacted clinker phases, portlandite, and conventional C–S–H, with minimal influence from recycled or supplementary materials.
The inclusion of 20% RCF for sample 2 leads to a substantial drop in Ca/Si (≈ 1.1) and Al/Si (≈ 0.4), which may reflect the formation of a low-Ca C–S–H or C–A–S–H phase. The high carbon content (16%) strongly suggests the presence of pre-carbonated fines from the RCF or increased carbonation.
Sample 3 with chemically activated RCF with Na₂SiF₆ results in a similar Ca/Si (≈ 1.1) as untreated RCF, but with lower Al/Si (≈ 0.2) and a reduced carbon content (4.8%). The activator appears to enhance silica dissolution, leading to the formation of Si-rich C–A–S–H gels with improved density and reduced carbonation. This aligns with expectations from chemically assisted pozzolanic systems, where lower Ca/Si ratios are associated with more durable C–S–H structures. The reduced carbon content supports the conclusion that chemical treatment helps densify the microstructure and limits CO₂ penetration.
Sample 4 presents a moderate Ca/Si ratio (≈ 1.5), with relatively high Al/Si (≈ 0.4) and elevated carbon (12.5%). The values suggest a heterogeneous matrix, likely due to the mixed presence of ground and unground RCF particles.
For sample 5 thermal treatment can lead to decomposing portlandite and partial dehydration C–S–H, leading to a more silica-rich surface, lowering the Ca/Si ratio compared to the mechanically treated sample. Al-compounds dehydroxylate/ decompoe reducing Al/Si. Carbonates decompositng leads to the reduction of C.
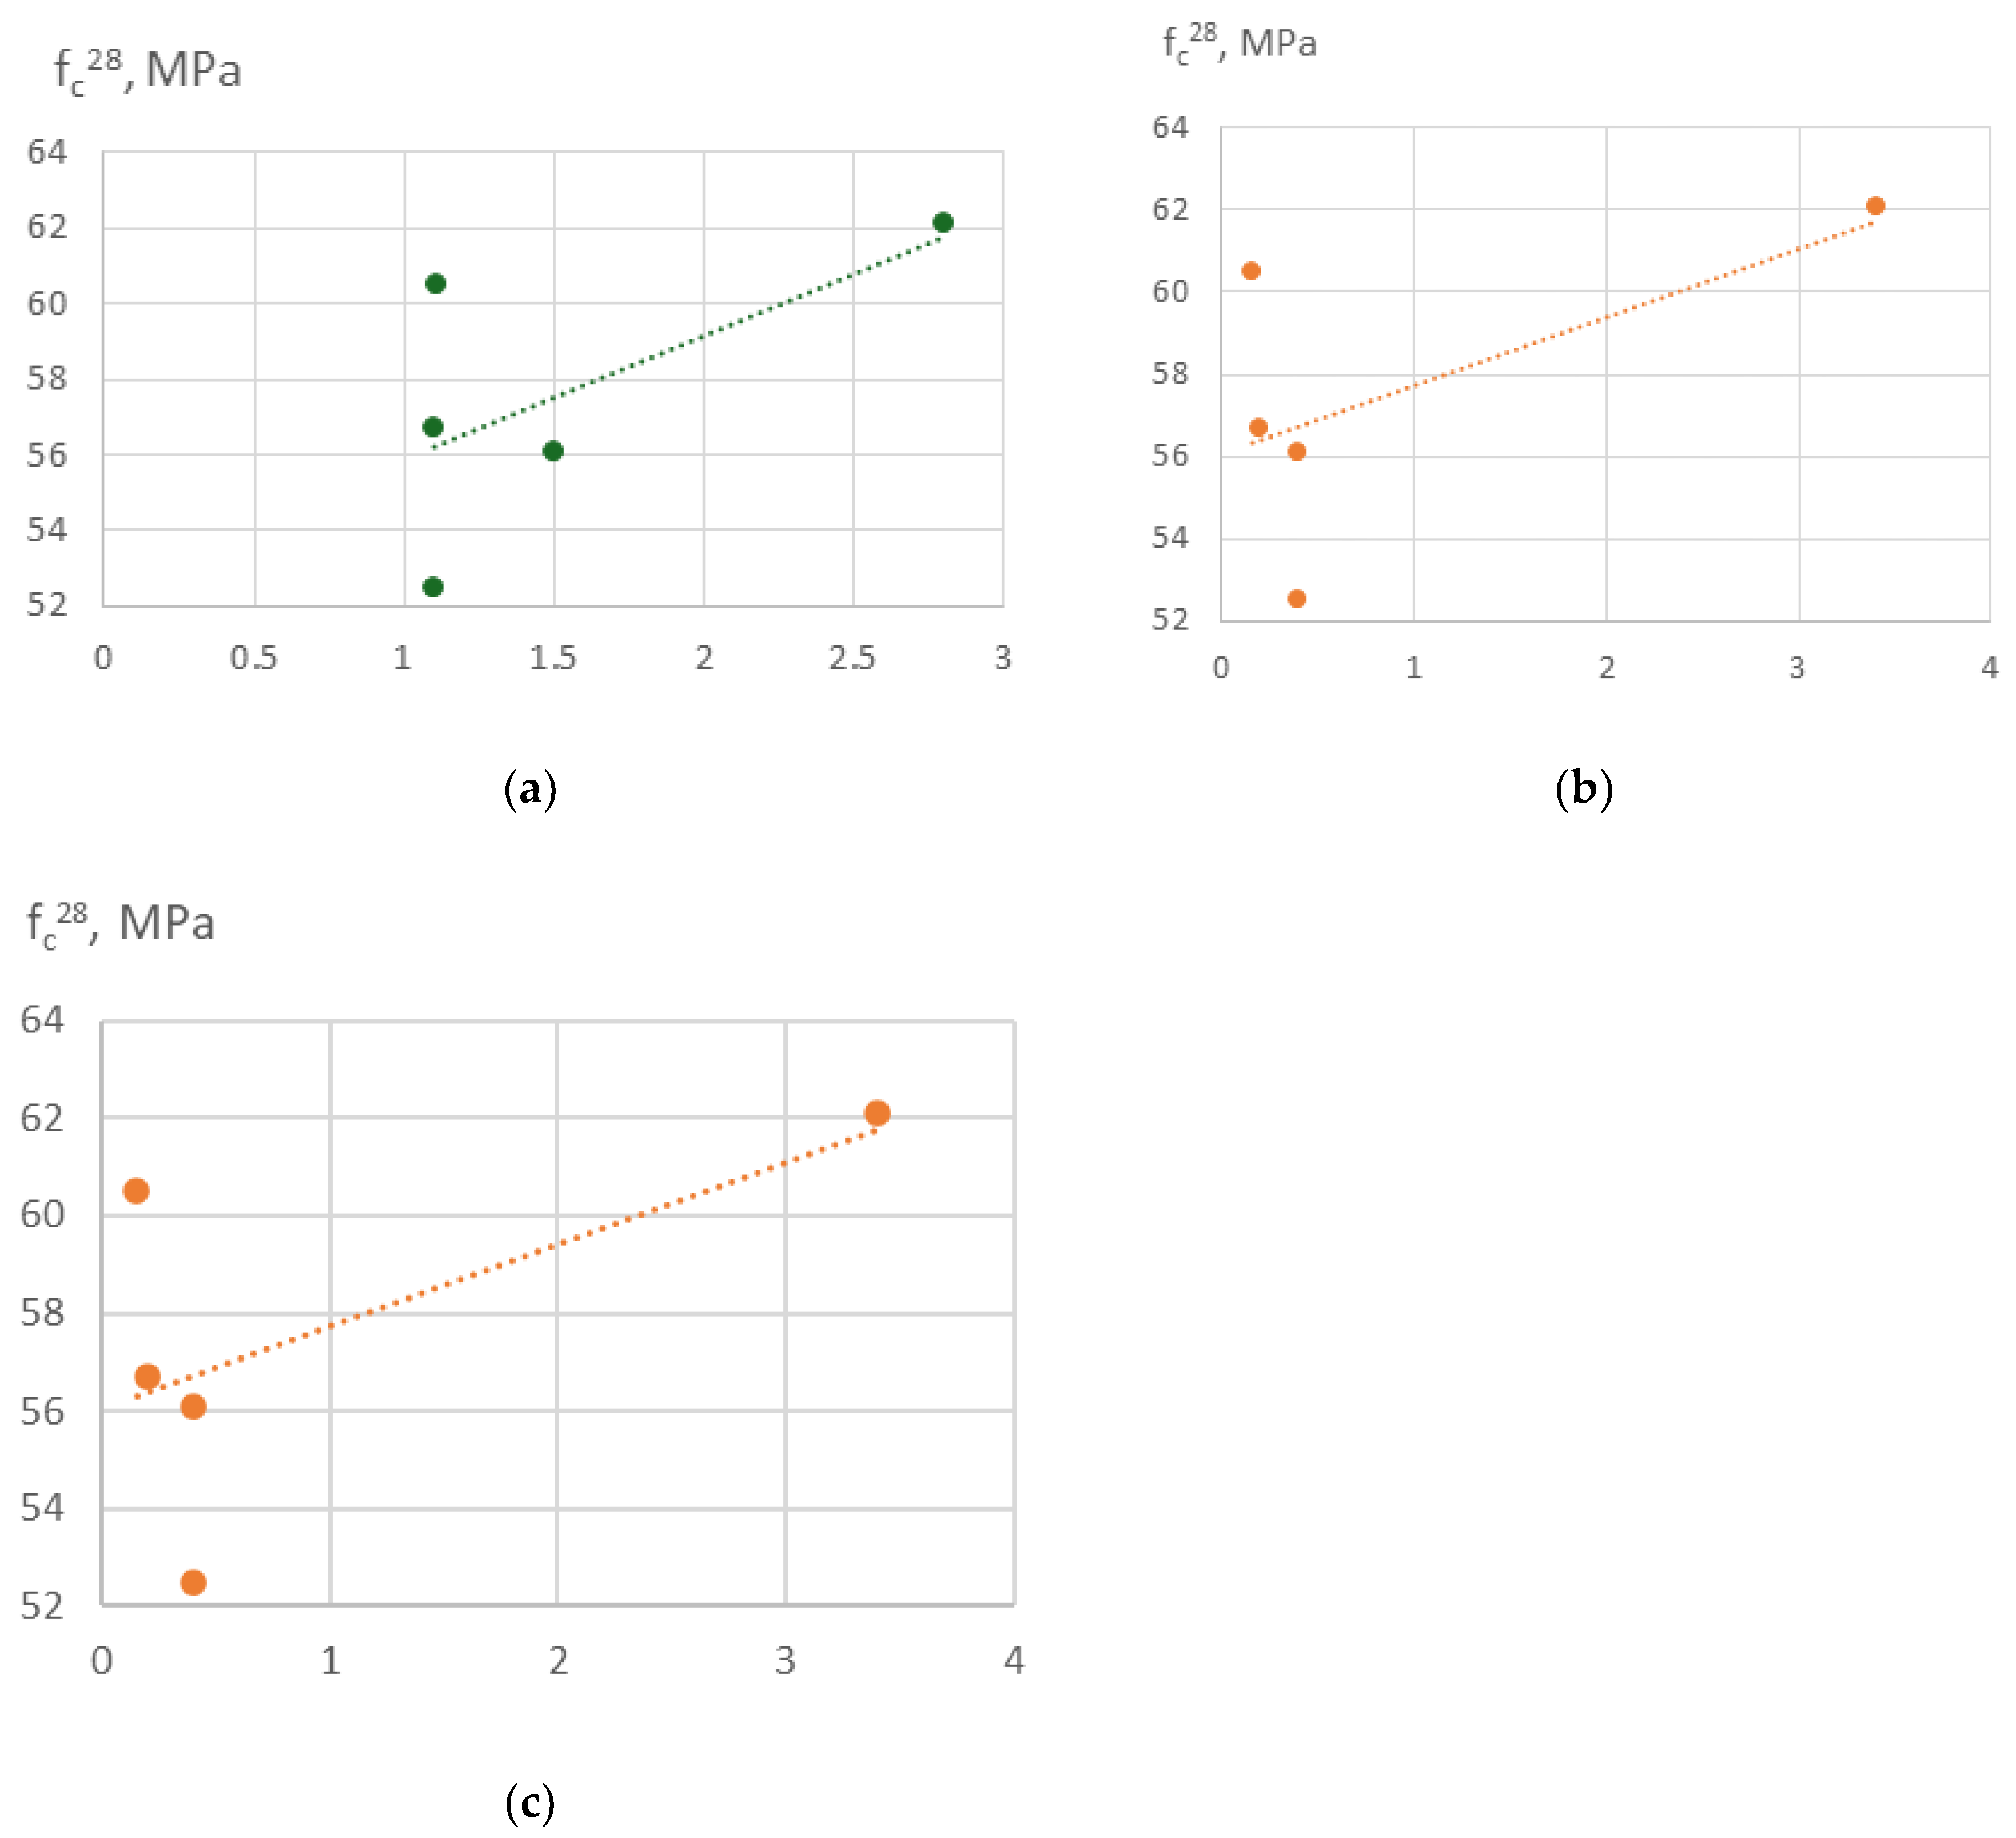
Based on this increasing strength at growing Ca/Si (Figure 16a) may be explained by grrwing amount alcium reacting with silicates from recycled fines, denser microstructure due to calcium-rich C-S-H fills voids between recycled fines and aggregates more effectivel and improved bonding between recycled fines and the new paste.
Increasing Al/Si (Figure 16b) in concrete enhances compressive strength because aluminum substitutes into C-S-H to form cross-linked C-A-S-H, densifying the microstructure and improving bonding between matrix and aggregates/fines. Essentially, Al acts like a “cross-linker” in the cement gel network.
Increased carbon content (Figure 16c) leads to reduction of reactivity of the RCF, increased porocity anI iterferes with hydration. It leads to formation weaker microstructure and lower compressive strength.

4. Case study of Concrete Proportioning

The method of concrete proportioning with recycled crushed concrete fines (RCF) as a mineral additive consists of the following steps:
  • For a given 28-day compressive strength, and for a specified amount of RCF chosen based on the required RCF content the regression Equation (3) is used to determine the required dosage of superplasticizer and activation parameters (specific surface area, thermal treatment temperature, and chemical activator dosage) from the standpoint of minimum cost. This task can be solved using multicriteria optimization with local refinement, implemented in available software (MS Excel Solver, Matlab, etc.).
  • For the parameters obtained from Equation (3), the water demand is necessary to achieve a concrete slump class S3 determined by substituting the obtained values into Equation (1).
  • Considering the accepted cement, water, and RCF dosages, the consumption of aggregates is calculated from the equation of absolute volumes:
    A = 1 C ρ c C F ρ C F W ρ a
  • Finally, the dosages of SP and Na₂SiF₆ are determined:
    S P c = C × S P / 100
    ( N a 2 S i F 6 ) c = C F × N a 2 S i F 6 100
Prerequisites
Mix design of concrete with the addition of recycled concrete fines (RCF) as a mineral additive, and determining the necessary activation parameters of RCF while minimizing cement consumption without increasing the overall cost of concrete. The target class of concrete is C25/30, with slump class S3 (slump 10…15 cm). RCF content is set at100 kg/m³. The real densities of the components are cement – 3100 kg/m³, RCF – 2700 kg/m³, aggregates – 2650 kg/m³.
For the cost calculations, the following data are used:
Portland cement: 120 €/t
RCF: 10 €/t
SP: 2.0 €/kg
Na₂SiF₆ 1.5 €/kg
RCF (thermal activation): 2.5 €/50 kg
RCF (mechanical activation): 0.50 €/50 kg
Steps:
For a compressive strength of 39.1 MPa, corresponding to concrete class C25/30 with RCF content of 100 kg/m³, Equation (3) gives a minimum cost of 43.6 €/m³ when the following parameters are applied: SP content – 0.88% (of cement mass), specific surface area – 252 m²/kg, Na₂SiF₆ dosage – 0.9% (of RCF mass), and no thermal treatment required. The solution was obtained using multicriteria optimization with local refinement in MS Excel “Solver.” Cement consumption – 302 kg/m³.
For the parameters established in step 1, the water demand necessary to achieve a slump of 10–15 cm, determined from Equation (1), is:
W = 164 l/m³.
Considering cement, water, and RCF dosages, the aggregate content (A) is calculated using the absolute volume equation:
A = 1 302 3100 100 2700 164 2650 = 1859   k g / m 3 .
Considering that the proportion of sand in the aggregate mixture is r = 0.32 (by volume), we determine the consumption of sand (S) and crushed stone (CS):
S = A ρ a r ρ s = 1859 2650 0.32 2650 = 599   k g / m 3 ;
C S = A ρ a ( 1 r ) ρ c s = 1859 2650 0.68 2650 = 1264   k g / m 3 .
where ρa, ρs, ρcs - the real density of the aggregate mixture, sand, and crushed stone, respectively
The SP and Na₂SiF₆ dosages are then determined.
S P c = 302 × 0,88 100 = 2,65   k g / m 3
( N a 2 S i F 6 ) c = 80 × 0,9 100 = 0,72   k g / m 3
Table 8. Results of concrete mix design according to the proposed method for different strength classes.
fc28 (MPa) RCF (kg/m3) C (kg/m3) SP (% of C) W (l/m3) w/c Ssp (m2/kg) T (°C) Na2SiF6 (% of RCF) Cost (EUR/m3)
50 100 304.5 0.99 160 0.53 336 330 0.91 47.26
75 301.9 0.95 156 0.52 331 230 0.77 44.86
50 301.2 0.93 148 0.49 207 54 0.99 42.93
25 300.0 0.82 163 0.54 292 245 0.84 41.82
0 318.5 1.00 162 0.51 130 0 0.00 44.58
60 100 377.2 0.99 162 0.43 321 284 0.92 57.05
75 351.0 0.97 159 0.45 343 427 0.87 52.92
50 328.1 0.95 157 0.48 313 524 0.99 48.55
25 316.9 0.97 160 0.50 334 576 0.99 45.79
0 384.4 1.00 161 0.42 130 0 0.00 53.8
Thus, the calculated nominal composition of the concrete mixture is as follows:
С=302 kg/m3, W=164 l/m3, S=599 kg/m3, CS=1264 kg/m3 RCF = 100 kg/m3, SP=2.65 kg/m3, Na2SiF6=0.72 kg/m3

5. Conclusions

  • By applying a set of mechanical, chemical, thermal and physico-chemical combined activation methods, the quality parameters of concrete rubble and recycled concrete fines (RCF) derived from it were determined, including the strength of the original concrete, chemical and phase composition, specific surface area, and pozzolanic activity.
  • The pozzolanic activity of RCF increases with increasing specific surface area of the particles.
  • Using the methodology of experimental design, six-factor experimental-statistical models were obtained for the water demand and compressive strength of concrete, taking into account cement consumption, RCF content and fineness, superplasticizer dosage, accelerator content (sodium silicofluoride), and RF thermal treatment temperature.
  • Analysis of the models allowed quantitative evaluation of the influence of the studied factors, ranking them by their effect on water demand and strength, and identifying significant interaction effects. The SEM-EDS results provide evidence that the use of RCF, particularly with chemical treatment, can significantly alter the hydration chemistry and microstructure of concrete. The formation of low-Ca, Al-rich C–A–S–H phases improves durability potential, while chemical activation helps suppress carbonation and refine the matrix. Conversely, untreated or mechanically treated RCF introduces greater heterogeneity. These findings support the use of the combined activation methods as a more effective strategy for the application of RCFC in cement and concrete.
  • It was established that the increase in water demand and reduction in compressive strength caused by RCF addition can be mitigated by using a polyacrylate superplasticizer and by RCF activation through thermal treatment combined with sodium silicofluoride. At a cement consumption of 300 kg/m³, RCF can be added up to 25%; at 400 kg/m³, up to 20%; and at 500 kg/m³, up to 15%, providing comparable values of compressive strength.
  • Based on analysis of the models for water demand and compressive strength, and using appropriate software, a method of optimal concrete proportioning with the addition of the recycled concrete has been proposed.

Author Contributions

Conceptualization, L.D. and V.Z.; methodology, L.D., V.Z. and N.L.; software, V.R. and N.L.; validation, L.D. and V.Z.; formal analysis, V.Z. and N.L.; investigation, V.Z., V.R. and N.L.; resources, L.D. and V.Z.; data curation, V.R. and N.L.; writing—original draft preparation, L.D., V.Z. and N.L.; writing—review and editing, L.D., V.Z. and N.L.; visualization, V.R. and N.L.; supervision, L.D. and V.Z.; project administration, V.Z.; funding acquisition, L.D., V.Z. and N.L.

Funding

This research was funded by Innovate UK, grant number 10097027 “S3 – Safe, Sustainable, and Swift Reconstruction of Ukraine”.

Institutional Review Board Statement

Not applicable.

Informed Consent Statement

Not applicable.

Data Availability Statement

The original contributions presented in this study are included in the article. Further inquiries can be directed to the corresponding author.

Acknowledgments

The authors have reviewed and edited the output and take full responsibility for the content of this publication

Conflicts of Interest

The authors declare no conflicts of interest.

Appendix A. Statistical Indicators of the Experimental–Statistical Models

Appendix A.1. Waterdemand (W, Equation (1))

Table A1. Full ANOVA table (Equation (1)).
Source Sum of Squares (SS) df F-Value p-value
X1 400.1667 1.0 752.1205 0.0
X2 6534.0 1.0 12280.7711 0.0
X3 192.6667 1.0 362.1205 0.0
X4 18704.1667 1.0 35154.8193 0.0
X5 2400.0 1.0 4510.8434 0.0
X6 96.0 1.0 180.4337 0.0
I(X1 ** 2) 94.2937 1.0 177.2266 0.0
I(X2 ** 2) 1086.5079 1.0 2042.1113 0.0
I(X3 ** 2) 53.3651 1.0 100.3006 0.0
I(X4 ** 2) 653.7222 1.0 1228.6827 0.0
I(X5 ** 2) 343.3651 1.0 645.3609 0.0
I(X6 ** 2) 30.5079 1.0 57.3402 0.0
X1:X2 32.0 1.0 60.1446 0.0
X1:X3 0.5 1.0 0.9398 0.3413
X1:X4 16.0 1.0 30.0723 0.0
X1:X5 0.0 1.0 0.0 1.0
X1:X6 72.0 1.0 135.3253 0.0
X2:X3 0.0 1.0 0.0 1.0
X2:X4 72.0 1.0 135.3253 0.0
X2:X5 144.0 1.0 270.6506 0.0
X2:X6 8.0 1.0 15.0361 0.0006
X3:X4 4.5 1.0 8.4578 0.0073
X3:X5 0.0 1.0 0.0 1.0
X3:X6 144.0 1.0 270.6506 0.0
X4:X5 200.0 1.0 375.9036 0.0
X4:X6 0.0 1.0 0.0 1.0
X5:X6 0.0 1.0 0.0 1.0
Residual 13.8333 26.0
Statistical indicators:
R² = 0.9996, Adjusted R² = 0.9991.
Lack-of-fit: F = 0.0186, p-value ≈ 1.0 (model adequate)

Appendix A.2. Compressive strength at 7 days (Equation (2))

Table A2. Full ANOVA table (fcm7, Equation (2)).
Source Sum of Squares (SS) df F-Value p-value
X1 47.320 1.0 964.177 4.426e-22
X2 2167.90 1.0 44172.077 1.566e-43
X3 47.039 1.0 958.464 4.772e-22
X4 2910.603 1.0 59305.036 3.406e-45
X5 507.839 1.0 10347.499 2.39e-35
X6 100.860 1.0 2055.073 2.816e-26
I(X1 ** 2) 47.545 1.0 968.768 4.167e-22
I(X2 ** 2) 35.680 1.0 727.001 1.561e-20
I(X3 ** 2) 13.900 1.0 283.223 1.694e-15
I(X4 ** 2) 0.057 1.0 1.178 0.287
I(X5 ** 2) 59.245 1.0 1207.161 2.546e-23
I(X6 ** 2) 5.221 1.0 106.392 1.107e-10
X1:X2 0.061 1.0 1.248 0.274
X1:X3 30.420 1.0 619.823 1.152e-19
X1:X4 72.675 1.0 1480.802 1.878e-24
X1:X5 7.605 1.0 154.955 1.851e-12
X1:X6 0.320 1.0 6.520 0.0168
X2:X3 0.044 1.0 0.916 0.347
X2:X4 6.661 1.0 135.726 8.052e-12
X2:X5 1.322 1.0 26.946 2.031e-05
X2:X6 1.037e-29 1.0 2.113e-28 1.0
X3:X4 1.620 1.0 33.008 4.76e-06
X3:X5 0.0449 1.0 0.916 0.347
X3:X6 6.0024 1.0 122.304 2.503e-11
X4:X5 15.124 1.0 308.179 6.158e-16
X4:X6 5.12 1.0 104.322 1.362e-10
X5:X6 5.404e-29 1.0 1.101e-27 1.0
Residual 1.276 26.0
Statistical indicators:
R² = 0.9998, Adjusted R² = 0.9996.
No signs of significant lack-of-fit were detected, p-value ≈ 1.0 (model adequate)

Appendix A.3. Compressive strength at 28 days (Equation (3))

Table A3. Full ANOVA table (fcm28, Equation (3)).
Source Sum of Squares (SS) df F-Value p-value
X1 49.15 1.0 1080.84 0.0000
X2 2288.68 1.0 47592.64 0.0000
X3 51.30 1.0 1039.82 0.0000
X4 2935.07 1.0 70898.75 0.0000
X5 596.69 1.0 10382.20 0.0000
X6 107.08 1.0 2414.85 0.0000
I(X1 ** 2) 55.08 1.0 1082.12 0.0000
I(X2 ** 2) 36.53 1.0 747.75 0.0000
I(X3 ** 2) 14.89 1.0 290.59 0.0000
I(X4 ** 2) 0.06 1.0 1.40 0.2880
I(X5 ** 2) 68.33 1.0 1261.56 0.0000
I(X6 ** 2) 6.16 1.0 122.37 0.0000
X1:X2 0.07 1.0 1.28 0.3001
X1:X3 35.48 1.0 699.87 0.0000
X1:X4 84.34 1.0 1762.08 0.0000
X1:X5 9.01 1.0 171.78 0.0000
X1:X6 0.35 1.0 7.46 0.0169
X2:X3 0.05 1.0 0.98 0.3692
X2:X4 7.26 1.0 149.41 0.0000
X2:X5 1.33 1.0 31.13 0.0000
X2:X6 0.00 1.0 0.00 1.0643
X3:X4 1.90 1.0 36.76 0.0000
X3:X5 0.04 1.0 1.09 0.3978
X3:X6 7.16 1.0 126.00 0.0000
X4:X5 15.78 1.0 317.99 0.0000
X4:X6 5.92 1.0 120.34 0.0000
X5:X6 0.00 1.0 0.00 1.0000
Residual 1.47 26.0
Statistical indicators:
R² = 0.9908, Adjusted R² = 0.9812.
No signs of significant lack-of-fit were detected, p-value ≈ 1.0 (model adequate)

References

  1. Locher, F.W. Cement—Principles of Production and Use; Verlag Bau + Technik GmbH: Düsseldorf, Germany, 2006; p. 536.
  2. Carriço, A.; Bogas, J.A.; Guedes, M. Thermoactivated cementitious materials—A review. Constr. Build. Mater. 2020, 250, 118873.
  3. Yang, J.; Guo, Y.; Tam, V.W.; Tan, J.; Shen, A.; Zhang, C.; Zhang, J. Feasibility of recycled aggregates modified with a compound method involving sodium silicate and silane as permeable concrete aggregates. Constr. Build. Mater. 2022, 361. [CrossRef]
  4. European Commission. Waste Framework Directive. Available online: https://ec.europa.eu/environment/topics/waste-and-recycling/waste-framework-directive_en#ecl-inpage-769 (accessed on 7 December 2021).
  5. An, R.; Guo, Y. Estimating construction and demolition waste in the building sector in China: Towards the end of the century. Waste Manag. 2024, 190, 285–295. [CrossRef]
  6. Communities Can Assess the Debris Amount by the Unified Method. 10 July 2024. Available online: https://ustcoalition.com.ua/en/gromady-zmozhut-rahuvaty-kilkist-vidhodiv-vid-rujnuvan-za-unifikovanym-metodom (accessed on 25 October 2025).
  7. Kaptan, K.; Cunha, S.; Aguiar, J. A Review of the Utilization of Recycled Powder from Concrete Waste as a Cement Partial Replacement in Cement-Based Materials: Fundamental Properties and Activation Methods. Appl. Sci. 2024, 14, 9775. [CrossRef]
  8. Yao, Y.; Hong, B. Evolution of recycled concrete research: a data-driven scientometric review. Low-Carbon Mater. Green Constr. 2024, 2, 1–30. [CrossRef]
  9. Tam, V.W.Y.; Soomro, M.; Evangelista, A.C.J. A review of recycled aggregate in concrete applications (2000–2017). Constr. Build. Mater. 2018, 172, 272–292. [CrossRef]
  10. Li, J.; Deng, X.; Lu, Z.; Li, X.; Hou, L.; Jiang, J.; Yang, F.; Zhang, J.; He, K. Recycled concrete fines as a supplementary cementitious material: Mechanical performances, hydration, and microstructures in cementitious systems. Case Stud. Constr. Mater. 2024, 21. [CrossRef]
  11. Dvorkin, L.I.; Solomatov, V.I.; Vyrovoy, V.N.; Chudnovsky, S.M. Cement Concretes with Mineral Fillers; Budivelnyk: Kyiv, Ukraine, 1991; p. 136.
  12. Kaya, Y.; Aytekin, B.; Kaya, T.; Mardani, A. Investigation of pozzolanic activity of recycled concrete powder: Effect of cement fineness, grain size distribution and water/cement ratio. Mater. Today: Proc. 2023. [CrossRef]
  13. Horsakulthai, V. Effect of recycled concrete powder on strength, electrical resistivity, and water absorption of self-compacting mortars. Case Stud. Constr. Mater. 2021, 15. [CrossRef]
  14. Wang, C.-Q.; Cheng, L.-X.; Ying, Y.; Yang, F.-H. Utilization of all components of waste concrete: Recycled aggregate strengthening, recycled fine powder activity, composite recycled concrete and life cycle assessment. J. Build. Eng. 2023, 82. [CrossRef]
  15. Wang, C.; Yu, Q.; Zhan, B.; Gao, P.; Guo, B.; Chu, Y.; Chen, Y.; Bian, P. Activity quantification and assessment of recycled concrete powder based on the contributions of the dilution effect, physical effect and chemical effect. J. Clean. Prod. 2024, 442. [CrossRef]
  16. Donatello, S.; Tyrer, M.; Cheeseman, C. Comparison of test methods to assess pozzolanic activity. Cem. Concr. Compos. 2010, 32, 121–127. [CrossRef]
  17. Volmer, M. Kinetics of Phase Formation (Kinetik Der Phasenbildung); Central Air Documents: Berlin, Germany, 1966; p. 219.
  18. Svatovskaya, L.B.; Sychev, M.M. Activated Cement Hardening; Stroiizdat: Leningrad, USSR, 1983; p. 160.
  19. Rosenholm, J.B.; Peiponen, K.-E.; Gornov, E. Materials cohesion and interaction forces. Adv. Colloid Interface Sci. 2008, 141, 48–65. [CrossRef]
  20. Zhang, Y.; Sun, X. Synergistic effects of nano-silica and fly ash on the mechanical properties and durability of internal-cured concrete incorporating artificial shale ceramsite. J. Build. Eng. 2023, 66. [CrossRef]
  21. Dvorkin, L.; Zhitkovsky, V.; Tracz, T.; Sitarz, M.; Mróz, K. Mechanical–Chemical Activation of Cement-Ash Binders to Improve the Properties of Heat-Resistant Mortars. Materials 2024, 17, 5760. [CrossRef]
  22. Wang, J.; Wu, Z.; Li, C.; Pan, Y.; Wang, J.; Qiu, J.; Ren, S.; Xu, H. Synergistic effect of sodium metasilicate and sodium fluorosilicate in an accelerator on cement hydration. Adv. Cem. Res. 2025, 37, 534–545. [CrossRef]
  23. Tabrizi, Z.; Rodriguez, C.; Barbera, E.; da Silva, W.R.L.; Bezzo, F. Wet Carbonation of Industrial Recycled Concrete Fines: Experimental Study and Reaction Kinetic Modeling. Ind. Eng. Chem. Res. 2025, 64, 21412–21425. [CrossRef]
  24. Likes, L.; Markandeya, A.; Haider, M.; Bollinger, D.; McCloy, J.S.; Nassiri, S. Recycled concrete and brick powders as supplements to Portland cement for more sustainable concrete. J. Clean. Prod. 2022, 364. [CrossRef]
  25. Ouyang, X.; Wang, L.; Xu, S.; Ma, Y.; Ye, G. Surface characterization of carbonated recycled concrete fines and its effect on the rheology, hydration and strength development of cement paste. Cem. Concr. Compos. 2020, 114. [CrossRef]
  26. Memon, S.A.; Bekzhanova, Z.; Murzakarimova, A. A Review of Improvement of Interfacial Transition Zone and Adherent Mortar in Recycled Concrete Aggregate. Buildings 2022, 12, 1600. [CrossRef]
  27. Alaud, S.; van Zijl, G.P.A.G. Combined action of mechanical pre-cracks and ASR strain in concrete. J. Adv. Concr. Technol. 2017, 15(4), 151–164.
  28. Li, J.; Deng, X.; Lu, Z.; Li, X.; Hou, L.; Jiang, J.; Yang, F.; Zhang, J.; He, K. Recycled concrete fines as a supplementary cementitious material: Mechanical performances, hydration, and microstructures in cementitious systems. Case Stud. Constr. Mater. 2024, 21. [CrossRef]
  29. Teune, I.; Schollbach, K.; Florea, M.; Brouwers, H. Carbonation of hydrated cement: The impact of carbonation conditions on CO2 sequestration, phase formation, and reactivity. J. Build. Eng. 2023, 79. [CrossRef]
  30. De Brabandere, L.; Grigorjev, V.; Heede, P.V.D.; Nachtergaele, H.; Degezelle, K.; De Belie, N. Using Fines from Recycled High-Quality Concrete as a Substitute for Cement. Sustainability 2025, 17, 1506. [CrossRef]
  31. Yang, F.; Ma, Y.; Li, L.; Liu, S.; Hai, R.; Zhu, Z. Early-Age Behaviour of Portland Cement Incorporating Ultrafine Recycled Powder: Insights into Hydration, Setting, and Chemical Shrinkage. Materials 2024, 17, 5551. [CrossRef]
  32. Shin, S.; Kim, G.; Kim, J.; Kim, H.; Park, S. Assessment of the Applicability of Waste Concrete Fine Powder as a Raw Material for Cement Clinker. Recycling 2025, 10, 17. [CrossRef]
  33. DSTU B V.2.7-71-98. Crushed Stone and Gravel from Dense Rocks and Industrial Waste for Construction Works (in Ukrainian).
  34. Box, G.E.P.; Hunter, J.S.; Hunter, W.G. Statistics for Experimenters: Design, Discovery, and Innovation, 2nd ed.; Wiley: Hoboken, NJ, USA, 2005; p. 655.
  35. Dvorkin, L.; Dvorkin, O.; Ribakov, Y. Mathematical Experiments Planning in Concrete Technology; Nova Science Publishers: New York, NY, USA, 2012; p. 172.
  36. TIBCO Statistica 14.0 Installation Guide. Available online: https://docs.tibco.com/pub/stat/14.0.0/doc/pdf/TIB_stat_14.0_installation.pdf (accessed on 5 October 2025).
Figure 1. Phenom Pro desktop SEM (a) and Quorum 150T (b).
Preprints 186795 g001
Figure 3. Dependence of the strength of the recycled concrete on its crushability.
Preprints 186795 g003
Figure 6. Response surfaces of water demand (W) of the concrete mixture as a function of RCF content and its specific surface area (Ssp) (a) and cement consumption (C) (b).
Preprints 186795 g004
Figure 7. Response surfaces of water demand as a function of cement consumption (C) (a), specific surface area of RCF Ssp, and its thermal treatment temperature (T) (b).
Preprints 186795 g005
Figure 8. Response surfaces of water demand as a function of superplasticizer (SP) dosage, RCF content (a), and RCF thermal treatment temperature (b).
Preprints 186795 g006
Figure 9. Effect of cement consumption (C) at different levels of recycled concrete fines content on compressive strength of concrete at 28 days. Other factors are fixed at their mid-levels (Table 3).
Preprints 186795 g007
Figure 10. Effect of RCF content and SP dosage on compressive strength of concrete at 28 days. Other factors are fixed at their mid-levels (Table 3).
Preprints 186795 g008
Figure 11. Effect of cement consumption (C) at different levels of recycled concrete fines content on compressive strength of concrete at 28 days. Other factors are fixed at their mid-levels (Table 3).
Preprints 186795 g009
Figure 12. Response surfaces of compressive strength (fcm28) depending on RCF activation parameters: (a) thermal treatment temperature (T) and chemical activator dosage (Na₂SiF₆); (b) specific surface area (Ssp).
Preprints 186795 g010
Figure 13. Response surfaces of compressive strength (fcm28) depending on: (a) Ssp and SP; (b) SP and Na₂SiF₆.
Preprints 186795 g011
Figure 14. Response surfaces of compressive strength (fcm28) depending on: (a) cement consumption (C) and SP dosage; (b) RCF thermal treatment temperature (T).
Preprints 186795 g012
Figure 16. Corelation between compressive strength of concrete samples at the age of 28 days and Ca/Si ratio (a), Al/Si (b) and C,% (c).
Preprints 186795 g014
Table 1. Characteristics of recycled concrete fines (RCF) and their influence on concrete properties.
Category Feature Description References
Particle morphology of RCFs Irregular, angular particle shape RCF after mechanical treatment (crushing and milling) exhibits a rough surface [23]
High surface area of particles Increasing the specific surface area, more of reactive sites that can promote pozzolanic and nucleation activity [24]
Heterogeneous composition Particles may contain unhydrated cement grains, calcium hydroxide (portlandite), and C–S–H, calcium carbonate [25]
Matrix Densification Changes in ITZ density More compact microstructure and a denser ITZ in the concrete with RCF compared to a conventional one [26,27]
Pore refinement Ultrafines may fill microvoids and capillary pores, reducing the overall porosity of the cement matrix [27]
Reaction products Secondary hydration products Secondary calcium silicate hydrate (C–S–H), portlandite (CH), ettringite (AFt), and AFm phases. [28]
c Mainly CaCO₃ formed from aged concrete [29]
Unhydrated cement clinker phases C₃S, C₂S, C₃A, C₄AF – small but potentially reactive fraction [7]
Inert materials SiO2, Al2O3, Fe2O3 [30]
ITZ Improvement Enhanced bonding ITZ in RCF containing concrete generally shows fewer voids and microcracks compared to control [26,27]
Nucleation effect Ultrafines act as nucleation sites for hydration products, improving the continuity between aggregate and paste phases [31]
Weakness of the waste Localized defects Microcracks or weakly bonded zones, particularly at high replacement ratios, where excess fines can disrupt hydration balance [30]
Inert phases Ultrafine fractions may include inert or carbonated particles (e.g., CaCO₃), which do not contribute to reactivity and can limit performance gains [30,32]
Table 2. Experimental design conditions.
Factors Variation levels Variation interval
Natural Coded -1 0 +1
Recycled concrete fines specific surface area (Ssp, m2/kg) Х1 130 250 370 120
Cement consumption (C, kg/m3) Х2 300 400 500 100
Temperature of thermal treatment of recycled concrete fines, (T, °C), Х3 0 300 600 300
Dosage of superplasticizer (as % of cement mass), SP Х4 0 0.5 1 0.5
Recycled concrete fines consumption (RCF, kg/m3) Х5 10 55 100 45
Dosage of Na2SiF6 (as % of RCF mass), Na2SiF6 Х6 0 0.5 1 0.5
Table 3. Chemical and mineralogical composition of recycled concrete fines.
Chemical composition, % CaO SiO₂ Al₂O₃ Fe₂O₃ MgO
13.2 75.5 6.28 3.56 0.61
Mineralogical composition, % Quartz Feldspars Calcite C₃S C₂S Hydrated cement products
43.3 15.5 10.9 0.86 2.09 28.3
Table 4. Specific surface area and pozzolanic activity of RCF.
Thermal treatment Specific surface area of concrete fines, m²/kg pH Pozzolanic activity of concrete fines, mg/g
Untreated 130 8.1 40.5
250 9.2 52.3
370 10.3 70.4
Heat-treated 600 °C 130 8.3 42.2
250 9.5 60.1
370 11.7 78.8
Table 5. Box–Behnken B6 planning matrix and experimental data.
No. Coded factors W Compressive strength (MPa)
Х1 Х2 Х3 Х4 Х5 Х6
W/C fcm7 fcm28
1 -1 -1 0 -1 0 0 199 0.66 21.0 25.2
2 +1 -1 0 -1 0 0 205 0.68 13.7 20.5
3 -1 +1 0 -1 0 0 234 0.47 38.0 47.6
4 +1 +1 0 -1 0 0 248 0.50 31.1 43.3
5 -1 -1 0 +1 0 0 151 0.50 36.9 46.2
6 +1 -1 0 +1 0 0 153 0.51 38.2 52.7
7 -1 +1 0 +1 0 0 174 0.35 57.6 73.4
8 +1 +1 0 +1 0 0 184 0.37 59.2 70.3
9 0 -1 -1 0 -1 0 180 0.60 29.6 36.8
10 0 +1 -1 0 -1 0 207 0.41 47.9 60.8
11 0 -1 +1 0 -1 0 186 0.62 32.1 42.8
12 0 +1 +1 0 -1 0 213 0.43 50.7 67.2
13 0 -1 -1 0 +1 0 194 0.65 19.7 25.4
14 0 +1 -1 0 +1 0 233 0.47 39.1 51.0
15 0 -1 +1 0 +1 0 200 0.67 22.5 31.8
16 0 +1 +1 0 +1 0 239 0.48 42.2 57.8
17 0 0 -1 -1 0 -1 210 0.53 27.9 34.9
18 0 0 +1 -1 0 -1 211 0.53 28.6 38.9
19 0 0 -1 +1 0 -1 156 0.39 47.5 61.1
20 0 0 +1 +1 0 -1 154 0.39 49.9 67.5
21 0 0 -1 -1 0 +1 200 0.50 29.2 37.5
22 0 0 +1 -1 0 +1 213 0.53 32.3 43.9
23 0 0 -1 +1 0 +1 146 0.37 51.9 66.9
24 0 0 +1 +1 0 +1 156 0.39 56.9 65.0
25 -1 0 0 -1 -1 0 197 0.49 35.9 44.0
26 +1 0 0 -1 -1 0 207 0.52 26.9 36.9
27 -1 0 0 +1 -1 0 153 0.38 50.9 63.8
28 +1 0 0 +1 -1 0 159 0.40 50.4 67.9
29 -1 0 0 -1 +1 0 227 0.57 22.0 27.4
30 +1 0 0 -1 +1 0 237 0.59 16.9 25.5
31 -1 0 0 +1 +1 0 163 0.41 42.5 54.4
32 +1 0 0 +1 +1 0 169 0.42 45.9 63.7
33 0 -1 0 0 -1 -1 180 0.60 30.7 39.6
34 0 +1 0 0 -1 -1 209 0.42 49.1 63.8
35 0 -1 0 0 +1 -1 194 0.65 20.9 28.4
36 0 +1 0 0 +1 -1 235 0.47 40.5 54.2
37 0 -1 0 0 -1 +1 178 0.59 34.8 45.0
38 0 +1 0 0 -1 +1 203 0.41 53.2 69.2
39 0 -1 0 0 +1 +1 192 0.64 25.0 33.8
40 0 +1 0 0 +1 +1 229 0.46 44.6 59.6
41 -1 0 -1 0 0 -1 193 0.48 38.6 46.8
42 +1 0 -1 0 0 -1 195 0.49 32.3 43.4
43 -1 0 +1 0 0 -1 192 0.48 36.3 46.8
44 +1 0 +1 0 0 -1 195 0.49 37.8 53.7
45 -1 0 -1 0 0 +1 177 0.44 41.9 51.6
46 +1 0 -1 0 0 +1 191 0.48 34.8 47.0
47 -1 0 +1 0 0 +1 188 0.47 42.0 54.1
48 +1 0 +1 0 0 +1 203 0.51 42.7 59.8
49 0 0 0 0 0 0 186 0.47 40.6 53.4
50 0 0 0 0 0 0 188 0.47 41.3 52.4
51 0 0 0 0 0 0 187 0.47 40.9 53.7
52 0 0 0 0 0 0 190 0.48 41.0 52.9
53 0 0 0 0 0 0 190 0.48 41.5 53.6
54 0 0 0 0 0 0 188 0.47 40.1 52.4
*In all experimental concrete mixes, the sand fraction in the aggregate mixture was kept constant and amounted to 0.32 (by volume).
Table 6. Results of factor ranking in Equations (1)–(3).
Output parameter Factors that increase the parameter Factors that decrease the parameter
Water demand, l/m³ X₂ > X₅ > X₁ > X₃ X₄ > X₆
Compressive strength
(7, 28 days)
X₄ > X₂ > X₆ > X₃ X₅ > X₁
Table 7. Key outcomes of SEM and EDS tests of concrete.
Preprints 186795 g015
Disclaimer/Publisher’s Note: The statements, opinions and data contained in all publications are solely those of the individual author(s) and contributor(s) and not of MDPI and/or the editor(s). MDPI and/or the editor(s) disclaim responsibility for any injury to people or property resulting from any ideas, methods, instructions or products referred to in the content.
Copyright: This open access article is published under a Creative Commons CC BY 4.0 license, which permit the free download, distribution, and reuse, provided that the author and preprint are cited in any reuse.
Prerpints.org logo

Preprints.org is a free preprint server supported by MDPI in Basel, Switzerland.

Subscribe

Disclaimer

Terms of Use

Privacy Policy

Privacy Settings

© 2025 MDPI (Basel, Switzerland) unless otherwise stated