Submitted:
25 November 2025
Posted:
26 November 2025
You are already at the latest version
Abstract
As stablecoins become increasingly prevalent in financial crimes, their usage for illicit activities has reached a scale of \$51.3 billion. Detecting phishing activities within stablecoin transactions has emerged as a critical challenge in blockchain security. Currently, existing detection methods predominantly target mainstream cryptocurrencies like Ethereum and lack specialized models tailored to the unique transaction patterns of stablecoin networks. This paper introduces a deep learning framework, BERTSC, based on multimodal fusion. The model integrates three core modules graph convolutional networks (GCNs), BERT semantic encoders, and soft prompt encoders to identify malicious accounts. The GCN constructs directed multi-graph representations of account interactions, incorporating multi-dimensional edge features; the BERT encoder transforms discrete transaction attributes into semantically rich continuous vector representations; the soft prompt encoder maps account interaction features into learnable prompt vectors. An innovative three-way gated dynamic fusion mechanism optimally combines the information from these sources. The fused features are then classified to predict phishing account labels, facilitating the detection of phishing scams in stablecoin transaction datasets. Experimental results on large-scale stablecoin datasets demonstrate that BERTSC outperforms baseline models, achieving improvements of 4.96\%, 3.60\%, and 4.23\% in Precision, Recall, and F1-score, respectively. Ablation studies validate the effectiveness of each module and confirm the necessity and superiority of the three-way gating fusion mechanism. This research offers a novel technical approach for phishing detection within blockchain stablecoin ecosystems.
Keywords:
stablecoins
; phishing detection
; graph neural networks
; BERT
; multimodal fusion
; soft prompt encoders
1. Introduction
In recent years, blockchain technology has become increasingly sophisticated, exerting profound influence across various sectors, particularly within the financial industry [1]. Nevertheless, as the scope of blockchain applications expands, there has been a concomitant rise in related fraudulent activities, posing significant societal risks [2]. While blockchain’s distributed ledger and transparent nature enhance security and operational efficiency in financial transactions, these same features have been exploited by malicious actors as channels for illegal conduct [3]. Stablecoins, a class of cryptocurrencies designed to maintain price stability, aim to address the excessive volatility observed in traditional cryptocurrencies such as Bitcoin, thereby facilitating their use as reliable mediums of exchange and stores of value for everyday transactions [4]. However, due to their low volatility, stablecoins have increasingly been leveraged by illicit entities for activities such as phishing and scams, surpassing Bitcoin as the preferred asset for criminal operations, accounting for approximately 63% of all illicit transactions by 2024. The scale of illegal activities involving stablecoins, including phishing scams, is estimated at US$51.3 billion, with their intrinsic stability making them suitable for cross-border illegal fund transfers [5]. Consequently, despite the substantial growth potential of stablecoins, their development raises pressing social and regulatory challenges. Addressing these issues is essential to ensuring their secure and sustainable evolution within the financial ecosystem [6].In blockchain-based systems, the primary phishing attack process, as depicted in Figure 1, involves the attacker deceiving victims by directly sending malicious addresses designed to lure them into compromised transactions.
Currently, numerous studies employ Graph Neural Networks (GNNs) [7] and graph representation learning techniques [8] to detect cryptocurrency-based phishing attacks, such as those targeting Ethereum [9]. GNNs capture the global transaction topology through graph structures but are limited in their ability to encode interaction features between accounts, such as low-value frequent transactions within short timeframes or fixed transaction patterns. While graph representation learning provides an intuitive and straightforward approach, it often fails to model the temporal sequencing of transactions across accounts. Blockchain transactions are inherently complex, with multiple records connecting accounts, and existing methods typically aggregate directed multigraph transaction information into simplified, unidirectional representations through feature fusion to facilitate computation. However, this approach compromises critical features like transaction priority and temporal order, which are essential for effective de-anonymization of accounts.
In high-volatility cryptocurrency transaction networks such as Ethereum and Bitcoin, mainstream anomaly detection paradigms predominantly rely on traditional volatility features, including abrupt changes in transaction amounts, surges in transaction frequency, asset flow path characteristics such as onion-like mixing, and anomalies indicative of economic behaviors like mass selling. These features are directly observable on-chain through metrics such as transaction amounts, timestamps, sequencing, and the structure of transaction relationship networks. Within volatile assets like Ethereum and stablecoins, large single transfers, extreme high-frequency operations, multi-hop rapid accumulation or distribution pathways, and aggressive economic activities often coincide with significant market price disturbances and on-chain behavioral deviations, enabling detection via conventional "mutation-price fluctuation" models.However, the price anchoring mechanisms inherent to stablecoins substantially diminish the efficacy of these traditional volatility features within their network environments [10]. Large-scale fund transfers or short-term high-frequency interactions in stablecoins no longer trigger substantial price movements, rendering corresponding behaviors highly covert within transaction networks. Furthermore, although coin-mixing processes persist in stablecoin transactions, the absence of price-driven structural variations and significant arbitrage opportunities limits the effectiveness of traditional economic anomaly features dependent on price volatility, market panic, and arbitrage potential in this context. Therefore, direct adaptation of anomaly detection models based on Bitcoin and Ethereum to stablecoin datasets is infeasible.Detection strategies tailored for stablecoin networks should diminish reliance on price volatility cues and sensitive behavioral signals, instead emphasizing the modeling of behavioral anomalies manifested through non-price-based transaction amount mutations, short-term high-frequency patterns, and multi-hop pathways within transaction structures and temporal sequences. This approach aims to enhance the identification of covert anomalies within stablecoin networks by capturing complex behavioral deviations beyond traditional price-dependent indicators.
To address the aforementioned issues, this study proposes a deep learning framework based on tri-modal fusion for phishing detection in stablecoin transaction data, designated as BERTSC. The model employs a graph convolutional network to capture the global structural graph features, extracting transaction structural information from the blockchain. A pre-trained BERT model transforms transactional semantic information within the network to identify dynamic behavioral patterns and long-term dependencies in account transaction sequences. To further integrate numerical prior knowledge with semantic features, a soft prompt encoder mechanism is adopted, mapping numerical interaction features of accounts through a multilayer perceptron into learnable prompt vectors. This enables the model to adaptively modulate the relative importance weights of structural and semantic information based on specific account interaction patterns. The output features from each module are dynamically fused via a three-way gating mechanism, culminating in a comprehensive feature representation. Finally, a classification module projects these features into a binary decision space, distinguishing normal nodes from phishing nodes.The contributions of this paper are as follows:
- Stablecoin anomaly phishing detection framework with multi-edge heterogeneous graph: This work introduces a directed multi-edge heterogeneous graph of global account interactions that integrates multi-dimensional edge attributes—such as transaction amounts, temporal differences, and GasPrice—directly into Graph Convolutional Network inputs, augmented by a soft prompt encoder that adaptively maps numerical interaction priors into semantically enriched learnable vectors for enhanced multimodal fusion.
- Adaptive three-way gating for multi-source information integration: A novel dynamic gating mechanism is proposed, employing adaptive weighting to synergistically fuse graph topology, semantic embeddings, and numerical priors, enabling context-dependent modulation of feature importance and thereby elevating representational expressiveness and interpretability in blockchain fraud analysis.
- Extensive real-world dataset construction and empirical validation: A large-scale stablecoin transaction dataset is curated, encompassing over 2.5 million nodes, 13 million directed edges with rich attributes, and 1,766 phishing instances; rigorous evaluations demonstrate the BERTSC model’s superiority, achieving a 4.96% precision uplift over state-of-the-art baselines, underscoring its robustness in detecting phishing scams within decentralized financial ecosystems.
2. Related Work
With the rapid development of blockchain technology, the detection of fraudulent activities within blockchain networks has emerged as a global challenge. In recent years, researchers have developed various detection methodologies to address these issues, ensuring the security of blockchain transactions [11]. Prior studies primarily employed graph-based representation learning techniques, which can be categorized into three types: random walk strategies based on DeepWalk [12], graph neural network approaches, and fraud detection methods leveraging time-series data.
2.1. Multi-Semantic Perception Approaches Based on DeepWalk
The core idea of DeepWalk is to serialize nodes in a graph into sequences akin to corpus data and employ the Skip-gram model from natural language processing for unsupervised representation learning. Building upon this, Trans2Vec [13] introduces a semantic-aware traversal strategy and sampling bias within the random walk framework, biasing walks toward the semantic and temporal significance of transactional relationships, thereby addressing DeepWalk’s insensitivity to heterogeneous relationships and edge attributes. Inspired by Trans2Vec, Nguyen et al. [14] proposed Hui2Vec, which integrates unary and high-efficiency itemsets to learn transaction embeddings, thereby enhancing representation capabilities for utility-sensitive data. Similarly, Nguyen et al. [15] developed a federated learning approach that incorporates Trans2Vec within a distributed privacy-preserving environment to facilitate transaction embedding learning. Chen et al. [16] designed a network embedding model based on Trans2Vec to develop a phishing account detection system for the Ethereum blockchain, leveraging transaction embeddings to identify anomalous patterns and improve security accuracy. To overcome limitations in capturing higher-order global structural patterns and diffusion dynamics, Benedek et al. [17] proposed Dif2Vec, which generates more comprehensive subgraph contexts around nodes and extracts sequences from diffusion subgraphs for representation learning. Additionally, Ahmed et al. [18] introduced Role2Vec, which constructs attribute-aware random walks to generate contextually similar but spatially distant nodes, enhancing cross-region generalization and interpretability. However, these methods struggle to effectively characterize the semantic attributes and temporal intensities of transactional edges and exhibit insensitivity to cross-modal numerical priors, limiting their ability to integrate semantic information of transaction sequences with account interaction features comprehensively.
2.2. Approaches Based on Graph Neural Networks
GNNs propagate information via message passing through graph convolution operations, effectively capturing both direct and indirect relationships within transaction networks. This enables the modeling of complex interaction patterns among accounts. Shen and Jie [19], utilizing graph convolutional networks, inferred distinct account identities from transaction data, categorizing accounts into legitimate, phishing, and scripted accounts. Building upon this, Huang et al. [20]developed a phishing detection framework based on GNNs, which constructs enhanced interaction graphs to enrich node contextual information, thereby effectively identifying anomalous behaviors associated with fraudulent accounts. Zhou [21] proposed a hierarchical graph attention encoder that integrates global node features with subgraph information to improve phishing detection accuracy. Chen et al. [22] introduced a phishing fraud detection approach leveraging data augmentation techniques combined with a hybrid GNN architecture, designed to capture complex patterns within transaction graphs and address class imbalance issues, thereby enhancing detection precision. However, GNN-based methods currently lack the capacity to model semantic information within transaction sequences, limiting their understanding of the contextual meaning of transaction contents and overlooking the temporal frequency of transactions.
2.3. Fraud Detection Approaches Based on Time Series Analysis
Time series methodologies leverage analysis of the temporal characteristics and frequency patterns of transaction data to identify anomalous behavioral sequences indicative of phishing accounts. Blockchain transaction records inherently encompass extensive time series information, with primary features such as timestamps and transaction frequencies; processing these records through temporal analysis facilitates the detection of potential small-scale, high-frequency fraudulent activities. Farrugia [23] proposed integrating the XGBoost model with time series features, emphasizing their importance in machine learning frameworks for identifying illicit accounts by extracting salient temporal characteristics. Hu et al. [24] introduced a Long Short-Term Memory (LSTM)-based temporal sequence model that enhances the security and accuracy of smart contract risk assessment by analyzing the temporal attributes of transaction data. For computational efficiency, Li et al. [25] developed the Temporal Tripartite Aggregated Graph Neural Network (TTAGNN), which employs LSTM to fuse multiple directed edges and builds node embeddings atop Graph Attention Networks (GAT) [26] . However, time series-based approaches often neglect global graph structural information, limiting their capacity to capture complex inter-account interactions and the semantic content of transactions.
Compared to these models, the proposed BERTSC model exhibits notable advantages. It explicitly incorporates multi-dimensional edge features through a weighted adjacency matrix, significantly enhancing the contribution of edge semantics to node representations. Additionally, the model employs a gating mechanism for adaptive fusion, integrating transaction semantics, graph topology, and numerical prior information thus outperforming existing methods in the detection of complex transaction patterns and anomalous fund flows. Consequently, BERTSC maintains sensitivity to diverse temporal behaviors such as short-term high-frequency, microtransactional, and large-scale abrupt activities, while effectively combining global graph structures and stablecoin interaction features to achieve more robust and interpretable identification of phishing accounts.
3. Methods
We introduce a dynamic multimodal fusion approach tailored for blockchain stablecoin scenarios. The method employs a stablecoin phishing node detection mechanism, effectively identifying on-chain phishing addresses. The three modules in the system are: Graph convolutional network based on a directed transaction graph structure;BERT encoder leveraging transaction semantic information;Numerical prior soft prompt encoder based on account interaction features.The features extracted from each module are integrated through a tri-channel gated dynamic fusion mechanism and subsequently utilized for final phishing address detection. The overall framework is illustrated in Figure 2.
Graph convolutional network based on a directed transaction graph structure:We construct a weighted adjacency matrix by modeling accounts as nodes and transactions as directed edges within a directed multigraph. Multi-dimensional edge features, including timestamp differences, transaction amounts, GasPrice, and interaction frequencies, are integrated to capture temporal and transactional heterogeneity. Message passing is performed over this adjacency matrix using a vocabulary-level graph convolutional network. Multiple adjacency matrices undergo weighted aggregation to model both direct and indirect transactional relationships, thereby enabling the extraction of more precise higher-order graph structural features.
BERT encoder leveraging transaction semantic information:We convert transaction sequence data, including timestamps, transaction amounts, contract addresses, GasPrice, and other relevant features, using a pretrained BERT model to capture semantic representations. This process employs joint embeddings of word, positional, and type embeddings to encode temporal dependencies within the transaction sequences. By utilizing a 12-layer Transformer encoder, we further extract deep semantic features, facilitating nuanced understanding and contextual modeling of transaction behavioral patterns. This approach establishes a robust and versatile feature foundation for downstream analytical tasks.
Numerical prior soft prompt encoder based on account interaction features:We introduce a soft prompt encoding mechanism that maps account interaction numerical features into learnable prompt vectors via an MLP encoder. An average pooling operation generates a summarized prompt vector, thus enabling an end-to-end learning process that maps numeric prior information into the semantic space. This provides a crucial numeric feature basis for multimodal feature representation.
3.1. Data Acquisition and Preprocessing
Firstly, We extracted account addresses identified as phishing nodes involved in stablecoin trading from Dune Analytics. Subsequently, all transaction records associated with these addresses were obtained from Etherscan, spanning from the account creation to the present. During the processing of stablecoin transaction data, each record encompassed multiple transaction features, including BlockNumber, TimeStamp, Hash, FromAddress, ToAddress, Amount, and GasPrice. These features collectively detail the block in which the transaction occurred, information about both parties involved, and the gas price willingness to facilitate the transaction. Through data cleaning and preprocessing, the most informative edge and node features were extracted from the complex feature set, with specific features summarized in Table 1.
After excluding isolated nodes and duplicate transactions within the trading network, we obtained a dataset of stablecoin phishing node addresses and their transaction data spanning from 2017 to 2025. Following data cleaning and preprocessing, a large-scale stablecoin transaction network was constructed, comprising 2,529,625 nodes, 13,071,630 edges, and 1,766 identified phishing nodes. As detailed in Table 2, this dataset encompasses transaction records of major stablecoins such as USDT, USDC, and DAI over an eight-year period.
Based on preprocessed data, we construct a multi-layer directed graph centered on stablecoin transactions. Selected nodes and their transactional interactions are visualized, as shown in Figure 3. In this visualization, blue nodes represent legitimate participants within the transaction network, while red nodes indicate malicious phishing accounts. The orange box highlights the large transfer patterns characteristic of phishing nodes, whereas the red box delineates the pattern of small, frequent, high-frequency interactions within a short period. Compared to legitimate nodes, phishing accounts exhibit more pronounced transaction interaction features.
In terms of data preprocessing, this paper adopts the data processing methodology proposed by Sheng et al. [27]. To construct transaction records based on account addresses, we developed a dictionary named Address, where each unique address serves as a key and associated transaction information as its value, with specific features detailed in Table 3. This dictionary aggregates all transaction records for a unique address into a single entry. Initially, we reorganize the data based on sender and receiver addresses. Since each transaction involves both a sender and a receiver, after identifying a unique address, if it appears as the sender in a transaction record, we set a variable Send = 1 and log the relevant amount, timestamp, and gas price into the dictionary. Conversely, if the address acts as the receiver, we set Send = 0 and similarly record the pertinent transaction data. This process yields the Address dictionary, enabling swift retrieval of any account’s transaction history. This step not only streamlines complex transaction data query methods but also lays the groundwork for subsequent semantic information extraction.
3.2. Graph Convolutional Network Feature Extraction
3.2.1. Graph Data Generation Based on Adjacency Matrices
Given the inherent complexity of transaction records within trading networks, effectively extracting inter-node transaction features presents a significant challenge. To address this, we propose a method that constructs adjacency matrices between account nodes and incorporates transaction weights to capture global trading characteristics. When processing each transaction record for an account, we first sort transactions by timestamp. This allows us to calculate the time difference between successive transactions, reflecting the actual sequence of account activity and the flow of funds within specific timeframes. By enhancing temporal aggregation features, we can effectively identify anomalous behavior within these accounts.
Based on the preprocessed transaction data, we constructed a directed multigraph , where V represents the set of account address nodes and E represents the set of transaction edges. Each node in the graph represents a unique account address, and each directed edge signifies a transaction record from account to account . To quantify the degree of frequent transactions within a short period, we introduce the concept of n-gram time difference [28]. The n-gram time difference is defined as the measure of an account’s transaction frequency by calculating the time difference between a transaction and its preceding n-1 transactions. In this study, we compute 2-gram to 5-gram time differences, as represented by the following formula:
Where represents the timestamp of the i-th transaction for an account, and represents the timestamp of the -th transaction for that account. If the number of transactions for an account is limited, this time difference is set to 0.
We constructed an zero matrix A, where n is the total number of unique account addresses in the transaction network. The elements within this adjacency matrix represent the connection weights between corresponding addresses. For instance, signifies the transaction weight between account i and account j across all transactions. The initial state of the adjacency matrix is as follows:
In a directed graph, each transaction record includes a sender address and a receiver address. By traversing all transaction records within the directed graph, we construct a dictionary, ‘Index’, to map unique addresses to their corresponding indices. The keys of this dictionary are account addresses, and their values are their respective indices. We then map these account addresses to the indices of an empty adjacency matrix, as shown in the following formula:
Where denotes the sender’s address, denotes the sender’s index, denotes the recipient’s address, and denotes the recipient’s index.
We employ a multi-dimensional weighted calculation strategy, integrating four dimensions—timestamp differences, transaction amounts, gas prices, and stablecoin interaction characteristics to construct the connection weights of the adjacency matrix. For each element within the adjacency matrix, its weight is calculated using the following fusion formula:
Where denotes the weighted fusion of transaction amount and gas price within transaction records, represents the n-gram time difference feature, and signifies the stablecoin account interaction feature. captures characteristics of high-value transactions; captures characteristics of frequent transactions within short timeframes; captures the proportion of transaction frequency between two distinct node categories.
Regarding the transaction execution time of phishing nodes, abnormal nodes usually set a high Gasprice to accelerate fund transfer. Therefore, when constructing matrix weights, a weighted calculation is performed on the transaction amount and Gasprice of the two types of nodes, with the formula as follows:
Where a denotes the transaction amount for a given transaction, g denotes the Gas price for that transaction, and respectively represent the logarithmically normalised transaction amount and Gas price, and denotes the node type weighting. If the transaction originates from a fishing node to another fishing node, is 2; if the transaction originates from a normal node to another fishing node, is 1.5. If the transaction is sent from a normal node to another normal node, is 1.
Some phishing nodes seek to evade suspension due to large transactions, employ frequent transactions within short timeframes to raise funds or transfer capital. In such scenarios, the n-gram time difference characteristic becomes particularly crucial. The formula for is as follows:
Here, denotes the timestamp difference of the n-gram, represents the weighting coefficient of the n-gram, and signifies the maximum value among all 5-gram differences.
Within on-chain transaction networks, phishing nodes typically exhibit transaction input counts several times greater than their output counts, whereas normal nodes maintain nearly equal input and output counts due to their long-term transactional characteristics. To capture the interaction patterns of these two node types throughout their lifecycle, this paper defines a node’s input-to-output value ratio and input-to-output frequency ratio. These metrics are ultimately weighted and fused to form the account interaction feature , calculated as follows:
Where and denote the ratio of incoming to outgoing amounts for the destination node and the ratio of incoming to outgoing amounts for the source node in a transaction record; and denote the ratio of incoming to outgoing occurrences for the destination node and the ratio of incoming to outgoing occurrences for the source node in a transaction record. The function is a non-linear compression function. The weights ultimately populated into the adjacency matrix are:
Where denotes the set of all transactions between accounts and . Consequently, the adjacency matrix elements reflect the transaction amounts and Gas price weights between two accounts, the overall transaction frequency, and the characteristics of interactions between different account types.The resulting adjacency matrix will serve as input to the graph convolutional network module, enabling the model to capture structural relationships within the directed graph.
3.2.2. Graph-Based Representation Module
Within the GCN module, the adjacency matrix undergoes feature extraction through multiple convolutional layers, as illustrated in Figure 4. The formula for the convolutional operation in each layer is:
where denotes the feature matrix for the i-th feature, represents the adjacency matrix with self-loops added, X denotes the degree matrix of the adjacency matrix, denotes the weight matrix for the i-th layer, and denotes a non-linear activation function.In graph convolution operations, features are fused with the original graph structural features through linear transformations, whilst feature representations from multiple adjacency matrices are integrated via weighted aggregation strategies. To prevent overfitting, Dropout regularisation (Dropout=0.2) is incorporated during feature transformation. Dimension mapping is ultimately performed through a fully connected layer, yielding a final output feature as a three-dimensional tensor, as expressed by the following formula:
where denotes the transposed sum-of-adjacency matrix, while represents the matrix after feature transformation. This framework encodes graph structural information into low-dimensional feature representations, providing a robust feature foundation for subsequent classification learning tasks.
3.3. BERT Semantic Information Module
The second branch in Figure 2 comprises a BERT encoder based on transaction semantic information. This module is responsible for converting discrete transaction attributes into continuous vector representations rich in semantic content. By leveraging the powerful semantic understanding capabilities of the pre-trained BERT model, it captures dynamic behavioural patterns and long-term dependencies within transaction sequences. As the raw data within the transaction network contains non-essential information such as timestamps, sender addresses, and recipient addresses, this paper removes these fields to simplify the data structure for textual analysis. As the BERT model also benefits from training on sequences in arbitrary order, this paper reorders the transaction lists for each unique account address. This operation disrupts the temporal sequence of transactions, enabling the model to focus more on transactional content features and thereby mitigate potential noise interference. Phishing nodes often conceal malicious activity by disguising multiple transactions. To ensure effective phishing detection, this paper assigns the tag=1 label to addresses confirmed as phishing nodes, recording this tag in the first transaction entry of each address’s transaction list. This annotation method helps the model learn account risk features more accurately, thereby enhancing overall detection performance.
When generating input text data for the BERT model, this paper converts each account’s transaction records into single-line descriptive texts. Each transaction’s label, transaction amount, gas price, and n-gram time difference are combined and summarised into concise textual representations. The resulting concise text dataset is partitioned into training, validation, and test sets in an 8:1:1 ratio. Specific features are detailed in Table 4:
To ensure data conforms to the format required by the semantic representation model, we first read the generated training and validation set files and randomly shuffle the data order. This prevents the model from becoming dependent on specific data sequences and overlooking textual content. Similarly, we perform random shuffling on the test set. To generate the input corpus and supervision signals required for subsequent model training, we merge the shuffled training, validation, and test sets into a single data file. From this, we extract two key features: the transaction text description corpus and account labels. The transaction text description corpus captures the account’s transactional behaviour, while the account labels distinguish whether the account is involved in illicit phishing activities. During tokenisation, all characters in tokens are converted to lowercase and undergo Unicode normalisation. Subsequently, the WordPiece tokeniser from the BERT model is employed to convert upstream text chat tokens into a single source of subword tokens. This ensures token consistency and reduces excessive lexical redundancy. To provide input for text processing model embeddings, the tokenised sequences are converted into token IDs for subsequent training. Finally, we align the segmented sentences with the annotated data to serve as the supervision signal for the supervised learning process.
The input to the BERT module comprises the processed transaction information text data. Following data cleansing and WordPiece segmentation, this data is converted into a token sequence, generating token IDs, position IDs, and token type IDs. These are subsequently processed through the BERT model’s word embeddings, position embeddings, and token type embeddings respectively, as per the following formula:
This module ultimately outputs a three-dimensional feature tensor. The framework simplifies stablecoin transaction information on the blockchain into a list of transaction details headed by node addresses, thereby acquiring valid local features on independent nodes.
3.4. Soft Prompt Encoder Based on Account Interaction Features
We employ a GCN model to capture transaction correlation information across the entire directed graph and a BERT model to process node-level semantic information. However, it overlooks the proportion of interactions entering and exiting during the lifecycle of different account nodes, as well as the role characteristics of accounts within the stablecoin trading network. To address this limitation, this paper introduces a soft-prompt encoder mechanism. This maps numerical a priori information about account interactions into learnable prompt vectors via a multi-layer perceptron, achieving deep integration of numerical and semantic feature.
3.4.1. Account Interaction Feature Extraction
Within stablecoin transaction networks, distinct interaction patterns emerge across different account nodes. Legitimate accounts, characterised by long-term stable transaction behaviour, typically exhibit a deposit-to-withdrawal ratio approaching 1:1. Conversely, phishing accounts, operating to raise and transfer funds, often record deposit frequencies several times higher than withdrawals, with ratios reaching 3:1 or even higher. To capture these critical account interaction characteristics, this paper designs a 13-dimensional numerical feature vector, as detailed in Table 5.
3.4.2. Soft-Prompt Encoder Design
The core concept of the soft prompt encoder is to transform numerical prior information into prompt vectors that align with the dimensions of BERT semantic embeddings. The soft prompt encoder designed in this paper adopts a two-layer fully connected neural network architecture, implemented as follows:
where denotes the input 13-dimensional account interaction feature vector, represents the hidden layer dimension of the first layer (typically set to of the BERT hidden size), is the number of prompt vectors, and is the hidden dimension of the BERT model. The first layer employs the ReLU activation function for nonlinear transformation. The second layer maps the features into a concatenated form of prompt vectors.
The output of the soft prompt encoder is , where each prompt vector () has the same dimension as the BERT word embeddings. These prompt vectors are aggregated via mean pooling to generate the prompt summary vector:
where represents the prompt summary vector, which is subsequently utilized in the dynamic gated fusion process. Soft prompt encoders automatically learn optimal mappings from numerical features to semantic spaces through end-to-end training. This enables the model to dynamically adjust the importance weights of different information sources based on an account’s specific interaction patterns, effectively resolving the technical challenge of deeply integrating numerical and textual features that plagues traditional methods.
3.5. Three-Way Gate Control Mechanism
3.5.1. Gate-Controlled Network Design
The gated network employs a two-layer fully connected neural network architecture, with inputs comprising concatenated embeddings from three sources and outputs consisting of three weight distribution channels. The specific implementation is as follows:
Among these, represent the concatenated embedding vectors, denotes the raw output of the gated network, and denote the weight matrices of the two fully connected layers respectively, while and denote the corresponding bias vectors.We employs Diffsoftmax to support smooth switching between soft and hard gating, defined as follows:
Where, denotes one-hot encoding, which converts category indices into one-hot vectors, while performs maximum indexing, returning the index position of the maximum value within the array. denotes the raw output of the gated network, where is the temperature parameter controlling the smoothness of the Softmax output. Smaller values yield steeper distributions. The Hard parameter determines whether hard gating is employed; hard gating retains only the information source with the highest weight, whereas soft gating preserves the weighted combination of all information sources.
3.5.2. Feature Fusion
Based on gated weights, the three-channel feature fusion process is as follows:
Where denote learnable parameters representing the fusion ratios for the base embeddings, while denote the gating weights for the corresponding three feature streams, satisfying .
3.6. Classification Module
The node classification module employs a classical fully connected neural network architecture comprising pooling layers, Dropout regularisation layers, and a linear classifier. This module receives the output feature vector from the three-channel gate fusion, undergoes non-linear transformation and dimensionality mapping, and ultimately outputs the probability distribution for each account category. The forward propagation process of the node classification module is as follows:
Where denotes the weight matrix of the pooling layer, represents the bias vector of the pooling layer, serves as the activation function, and is employed for regularisation. The final output is obtained through a linear classifier:
Where denotes the weight matrix of the classifier, whilst represents the bias vector of the classifier, with a dimension of 2 During the inference phase, the node classification module outputs the raw logits vector Z. To convert this into a probability distribution, the Softmax function must be applied, with the final category prediction determined via argmax:
Where denotes the predicted category label. The argmax operation locates the category index corresponding to the element with the highest numerical value within the probability distribution, which is then adopted as the final prediction result.
4. Experimental Evaluation
4.1. Experimental Techniques and Evaluation Metrics
To effectively train the BERTSC model and address the class imbalance issue in stablecoin phishing detection, We employ a weighted cross-entropy loss function [29] for the classification task, formulated as follows:
Where N denotes the batch size, represents the true label, and signifies the predicted probability. Based on this, this paper employs the AdamW optimiser for optimisation. This optimiser combines Adam’s adaptive learning rate with L2 regularisation achieved through weight decay. The AdamW formula is as follows:
Where and denote the first-order gradient moment and second-order gradient moment respectively, while is a small constant introduced to prevent division by zero.To evaluate the model’s accuracy, We employ precision, recall, and F1 score to validate its predictive performance. The metrics are defined as follows:
TP denotes the number of samples correctly predicted as landslides, while TN denotes the number of samples correctly predicted as non-landslides. FP denotes the number of samples incorrectly predicted as landslides, and FN denotes the number of samples incorrectly predicted as non-landslides.
Our experimental environment is based on the Ubuntu operating system, utilising Python version 3.10.18. The development framework relies on CUDA 11.8 and PyTorch 1.12.1. The model training server is equipped with two NVIDIA GeForce RTX 4090 graphics cards, providing 48GB of graphics memory. Throughout the experiments, all models employed stochastic gradient descent (ADAMW) as the optimiser. The training parameters were set as follows: 40 epochs, a batch size of 16, and a dropout rate of 0.2.
4.2. Comparative Analysis
In this paper, we selected graph embedding methods based on random walks for comparison with graph neural network models and mainstream baseline models from recent years.
- Graph embedding methods based on random walks include DeepWalk [12], Trans2Vec [13], Dif2Vec [17], and Role2Vec [18]: DeepWalk generates node sequences through random walks on graphs, utilising skip-gram models to learn low-dimensional node representations, and stands as a classic approach in graph embedding; Trans2Vec makes walks more inclined to follow the semantic and temporal weights of transaction relationships. Dif2Vec extracts sequences from subgraphs for representation learning; Role2Vec enables nodes with similar functions to obtain proximate representations.;
- Graph neural network-based methods include GCN [7], GAT [26], and GSAGE [30]: GCN employs graph convolution operations for message propagation, updating node representations by aggregating neighbouring node information. GAT introduces an attention mechanism to compute weights between nodes, enabling adaptive learning of neighbouring node importance. GSAGE adopts a sampling and aggregation strategy, capable of processing large-scale graph data while supporting inductive learning.;
- Mainstream baseline models include BERT4ETH [31] and ETH-GBERT [27]: BERT4ETH applies the BERT model to Ethereum transaction data, learning semantic representations of transaction sequences through a pre-trained language model. ETH-GBERT combines a hybrid model of graph neural networks and BERT, enhancing BERT’s semantic understanding capabilities through graph structural information..
In the comparative experiments, all baseline models were evaluated according to their original configurations as specified in their respective papers, ensuring a level playing field for performance comparisons. Our evaluations focused on key metrics such as precision, recall, and F1 scores, with detailed performance results presented in Table 6.
The proposed BERTSC model achieves state-of-the-art performance on the stablecoin phishing detection task, attaining a Precision of 89.90% and a Recall of 89.47%, with an F1 score of 89.59%. Compared to the best baseline model ETH-GBERT, it demonstrates improvements of 4.96% (89.90% vs 84.94%) in Recall at 89.47%, and an F1 score of 89.59%. Compared to the best baseline model ETH-GBERT, it achieves improvements of 4.96% (89.90% vs 84.94%), 3.60% (89.47% vs 85.87%), and 4.23% (89.59% vs 85.36%) respectively.
The graph embedding method based on random walks achieved 62.35% Precision, 51.22% Recall, and an F1 score of 52.96%. While these approaches capture graph structural information, they fail to effectively integrate the semantic information within transaction sequences. Furthermore, the lack of modelling for account transaction characteristics prevents the capture of fund flow patterns associated with phishing accounts.
Graph neural network-based methods achieved 46.76% Precision, 56.23% Recall, and 43.57% F1 score. Whilst these approaches possess advantages in capturing graph structural information, they lack the capacity to model the semantic information within transaction sequences and are unable to comprehend the semantic meaning of transaction content.
BERT4ETH and ETH-GBERT demonstrated relatively strong performance in stablecoin phishing detection tasks, achieving accuracy scores of 78.58% and 84.94% respectively, with F1 scores of 77.04% and 85.36%. However, limitations remain. Whilst BERT4ETH can extract semantic information from transaction sequences, it lacks modelling of graph structural information and thus fails to capture global transaction relationships between accounts. ETH-GBERT, though combining graph neural networks with BERT, exhibits shortcomings in integrating numerical prior information and consequently cannot effectively utilise account interaction features.
4.3. Ablation Study
To validate the effectiveness of each component within the BERTSC model, we designed two ablation experiments to assess the contribution of different modules to the model’s performance. By progressively removing key components from the model, we were able to quantify the impact of each module on the final detection performance, thereby verifying the rationality and necessity of the proposed approach.
we evaluated the independent contributions of the three core modules within the BERTSC model. As shown in Table 7, we separately tested the combinations of BERT’s semantic module with the soft-prompt encoder (BERT&SOFT), the graph convolutional network with the soft-prompt encoder (GCN&SOFT), and the graph convolutional network with BERT’s semantic module (GCN&BERT). Experimental results indicate that the BERT&SOFT combination achieved 86.10%, 86.13%, and 86.11% in Precision, Recall, and F1-Score respectively, demonstrating the effectiveness of integrating semantic information with numerical prior knowledge. The GCN&SOFT combination exhibited relatively lower performance, achieving Precision, Recall, and F1-Score of 81.34%, 72.63%, and 73.41% respectively, indicating that relying solely on graph structural information and numerical features struggles to fully capture complex phishing behaviours. The GCN&BERT combination performed better, achieving metrics of 84.94%, 85.87%, and 85.36%, yet still fell short of the full BERTSC model’s 89.90%, 89.47%, and 89.59%. This result fully demonstrates the necessity of the three-gate fusion mechanism, as single or dual-module combinations cannot achieve optimal detection performance.
We further validated the efficacy of the adjacency matrix weighting strategy and interaction feature encoder. As shown in Table 8, using ETH-GBERT as the baseline model, we progressively incorporated the adjacency matrix weighting mechanism (Only Weight) and the interaction feature encoder (IF&W). Experimental results demonstrate that incorporating the adjacency matrix weighting mechanism alone elevates model performance from 85.36% to 87.19%, validating the effectiveness of integrating multi-dimensional edge features such as timestamp differences, transaction amounts, and GasPrice. Further introduction of the account interaction feature encoder significantly boosts model performance to 89.59%, representing a 4.23% improvement over the baseline model. This outcome validates the pivotal role of soft-prompt encoders in integrating numerical prior information. By mapping account interaction features into learnable prompt vectors, the model gains enhanced capability to discern fundamental differences in transaction patterns between phishing accounts and legitimate accounts.
5. Conclusion
With the rapid growth of blockchain and cryptocurrency markets, stablecoins—due to their price stability—have become the preferred tool for financial criminals, facilitating US$51.3 billion in illicit activities, particularly cross-border fund transfers [5]. Their low volatility and wide applicability significantly reduce operational risks and enable seamless illegal transactions. This paper proposes BERTSC, a tri-modal deep learning framework tailored for stablecoin phishing detection. It integrates graph convolutional networks, BERT semantic encoders, and soft-prompt encoders, with a dynamic gated fusion mechanism to adaptively combine structural, semantic, and numerical features. Experiments on large-scale stablecoin datasets show that BERTSC outperforms benchmarks, enabling robust phishing detection in stablecoin networks.
Author Contributions
Conceptualization, Weixin Xie,Qihao Chen and Zhide Chen; methodology, Weixin Xie,Qihao Chen and Kexin Zhu; formal analysis, Weixin Xie; data curation, Weixin Xie,Qihao Chen; writing—original draft preparation, Weixin Xie; writing—review and editing, Weixin Xie,Qihao Chen,Zhide Chen, Kexin Zhu and Chen Feng; visualization, Weixin Xie; supervision, Zhide Chen, Kexin Zhu, and Chen Feng; project administration, Zhide Chen. All authors have read and agreed to the published version of the manuscript.
Funding
This research received no external funding.
Institutional Review Board Statement
Not applicable.
Informed Consent Statement
Not applicable.
Data Availability Statement
Databases and source codes are available at: https://github.com/UnluckyXwX/BERTSC.
Conflicts of Interest
The authors declare no conflicts of interest.
References
- Pal, A.; Tiwari, C.K.; Behl, A. Blockchain technology in financial services: A comprehensive review of the literature. J. Glob. Oper. Strateg. Sourc. 2021, 14, 61–80. [Google Scholar] [CrossRef]
- Bhowmik, M.; Chandana, T.S.S.; Rudra, B. Comparative study of machine learning algorithms for fraud detection in blockchain. In Proceedings of the 2021 5th International Conference on Computing Methodologies and Communication (ICCMC), Erode, India, 8–10 April 2021; pp. 539–541. [Google Scholar]
- Wenhua, Z.; Qamar, F.; Abdali, T.-A.N.; Hassan, R.; Jafri, S.T.A.; Nguyen, Q.N. Blockchain technology: Security issues, healthcare applications, challenges and future trends. Electronics 2023, 12, 546. [Google Scholar] [CrossRef]
- Mita, M.; Ito, K.; Ohsawa, S.; Tanaka, H. What is stablecoin?: A survey on price stabilization mechanisms for decentralized payment systems. In Proceedings of the 2019 8th International Congress on Advanced Applied Informatics (IIAI-AAI), Toyama, Japan, 7–11 July 2019; pp. 60–66.
- Aldasoro, I.; Frost, J.; Lim, S.H.; Perez-Cruz, F.; Shin, H.S. An approach to anti-money laundering compliance for cryptoassets. Bank for International Settlements, Tech. Rep. 2025. [Google Scholar]
- Givargizov, I. UNSTABLE FINANCIAL AND ECONOMIC FACTORS IN THE WORLD AND THEIR INFLUENCE ON THE DEVELOPMENT OF BLOCKCHAIN TECHNOLOGIES. Int. Humanit. Univ. Her. Econ. Manag. 2023. [CrossRef]
- Kipf, T.N. Semi-supervised classification with graph convolutional networks. arXiv 2016, arXiv:1609.02907. [Google Scholar] [PubMed]
- Béres, F.; Seres, I.A.; Benczúr, A.A.; Quintyne-Collins, M. Blockchain is watching you: Profiling and deanonymizing ethereum users. In Proceedings of the 2021 IEEE International Conference on Decentralized Applications and Infrastructures (DAPPS), Online, 23–26 August 2021; pp. 69–78. [Google Scholar]
- Ancelotti, A.; Liason, C. Review of blockchain application with graph neural networks, graph convolutional networks and convolutional neural networks. arXiv 2024, arXiv:2410.00875. [Google Scholar] [CrossRef]
- Mahrous, A.; Caprolu, M.; Di Pietro, R. Stablecoins: Fundamentals, Emerging Issues, and Open Challenges. arXiv 2025, arXiv:2507.13883. [Google Scholar] [CrossRef]
- Osterrieder, J.; Chan, S.; Chu, J.; Zhang, Y.; Misheva, B.H.; Mare, C. Enhancing security in blockchain networks: Anomalies, frauds, and advanced detection techniques. arXiv 2024, arXiv:2402.11231. [Google Scholar] [CrossRef]
- Perozzi, B.; Al-Rfou, R.; Skiena, S. Deepwalk: Online learning of social representations. In Proceedings of the 20th ACM SIGKDD International Conference on Knowledge Discovery and Data Mining, New York, NY, USA, 24–27 August 2014; pp. 701–710. [Google Scholar]
- Wu, J.; Yuan, Q.; Lin, D.; You, W.; Chen, W.; Chen, C.; Zheng, Z. Who are the phishers? Phishing scam detection on ethereum via network embedding. IEEE Trans. Syst. Man Cybern. Syst. 2020, 52, 1156–1166. [Google Scholar] [CrossRef]
- Belghith, K.; Fournier-Viger, P.; Jawadi, J. Hui2Vec: Learning transaction embedding through high utility itemsets. In Proceedings of the International Conference on Big Data Analytics, Hyderabad, India, 19–22 December 2022; pp. 211–224. [Google Scholar]
- Ahmed, U.; Srivastava, G.; Lin, J.C.-W. A federated learning approach to frequent itemset mining in cyber-physical systems. J. Netw. Syst. Manag. 2021, 29, 42. [Google Scholar] [CrossRef]
- Luo, J.; Qin, J.; Wang, R.; Li, L. A phishing account detection model via network embedding for Ethereum. IEEE Trans. Circuits Syst. II Express Briefs 2023, 71, 622–626. [Google Scholar] [CrossRef]
- Rozemberczki, B.; Sarkar, R. Fast sequence-based embedding with diffusion graphs. In Proceedings of the International Workshop on Complex Networks, Santiago de Compostela, Spain, 11–13 December 2018; pp. 99–107. [Google Scholar]
- Ahmed, N.K.; Rossi, R.; Lee, J.B.; Willke, T.L.; Zhou, R.; Kong, X.; Eldardiry, H. Learning role-based graph embeddings. arXiv 2018, arXiv:1802.02896. [Google Scholar] [CrossRef]
- Shen, J.; Zhou, J.; Xie, Y.; Yu, S.; Xuan, Q. Identity inference on blockchain using graph neural network. In Proceedings of the International Conference on Blockchain and Trustworthy Systems, Guangzhou, China, 8–10 December 2021; pp. 3–17. [Google Scholar]
- Huang, H.; Zhang, X.; Wang, J.; Gao, C.; Li, X.; Zhu, R.; Ma, Q. PEAE-GNN: Phishing detection on Ethereum via augmentation ego-graph based on graph neural network. IEEE Trans. Comput. Soc. Syst. 2024, 11, 4326–4339. [Google Scholar] [CrossRef]
- Zhou, J.; Hu, C.; Chi, J.; Wu, J.; Shen, M.; Xuan, Q. Behavior-aware account de-anonymization on Ethereum interaction graph. IEEE Trans. Inf. Forensics Secur. 2022, 17, 3433–3448. [Google Scholar] [CrossRef]
- Chen, Z.; Liu, S.-Z.; Huang, J.; Xiu, Y.-H.; Zhang, H.; Long, H.-X. Ethereum phishing scam detection based on data augmentation method and hybrid graph neural network model. Sensors 2024, 24, 4022. [Google Scholar] [CrossRef] [PubMed]
- Farrugia, S.; Ellul, J.; Azzopardi, G. Detection of illicit accounts over the Ethereum blockchain. Expert Syst. Appl. 2020, 150, 113318. [Google Scholar] [CrossRef]
- Hu, T.; Liu, X.; Chen, T.; Zhang, X.; Huang, X.; Niu, W.; Lu, J.; Zhou, K.; Liu, Y. Transaction-based classification and detection approach for Ethereum smart contract. Inf. Process. Manag. 2021, 58, 102462. [Google Scholar] [CrossRef]
- Li, S.; Gou, G.; Liu, C.; Hou, C.; Li, Z.; Xiong, G. TTAGN: Temporal transaction aggregation graph network for ethereum phishing scams detection. In Proceedings of the ACM Web Conference 2022, Virtual Event, 25–29 April 2022; pp. 661–669. [Google Scholar]
- Veličković, P.; Cucurull, G.; Casanova, A.; Romero, A.; Lio, P.; Bengio, Y. Graph attention networks. arXiv arXiv:1710.10903, 2017. [PubMed]
- Sheng, Z.; Song, L.; Wang, Y. Dynamic Feature Fusion: Combining Global Graph Structures and Local Semantics for Blockchain Phishing Detection. IEEE Trans. Netw. Serv. Manag. 2025, in press. [Google Scholar] [CrossRef]
- Pan, B.; Stakhanova, N.; Zhu, Z. Ethershield: Time-interval analysis for detection of malicious behavior on ethereum. ACM Trans. Internet Technol. 2024, 21, 1–30. [Google Scholar] [CrossRef]
- LeCun, Y.; Bengio, Y.; Hinton, G. Deep learning. Nature 2015, 521, 436–444. [Google Scholar] [CrossRef] [PubMed]
- Hamilton, W.; Ying, Z.; Leskovec, J. Inductive representation learning on large graphs. In Advances in Neural Information Processing Systems 30; Guyon, I., Luxburg, U.V., Bengio, S., Wallach, H., Fergus, R., Vishwanathan, S., Garnett, R., Eds.; Curran Associates, Inc.: Red Hook, NY, USA, 2017. [Google Scholar]
- Hu, S.; Zhang, Z.; Luo, B.; Lu, B.; He, S.; Liu, L. Bert4eth: A pre-trained transformer for ethereum fraud detection. In Proceedings of the ACM Web Conference 2023, Austin, TX, USA, 30 April–4 May 2023; pp. 2189–2197. [Google Scholar]
Figure 1.
Typical process of a stablecoin phishing scam via direct transfer of malicious addresses.
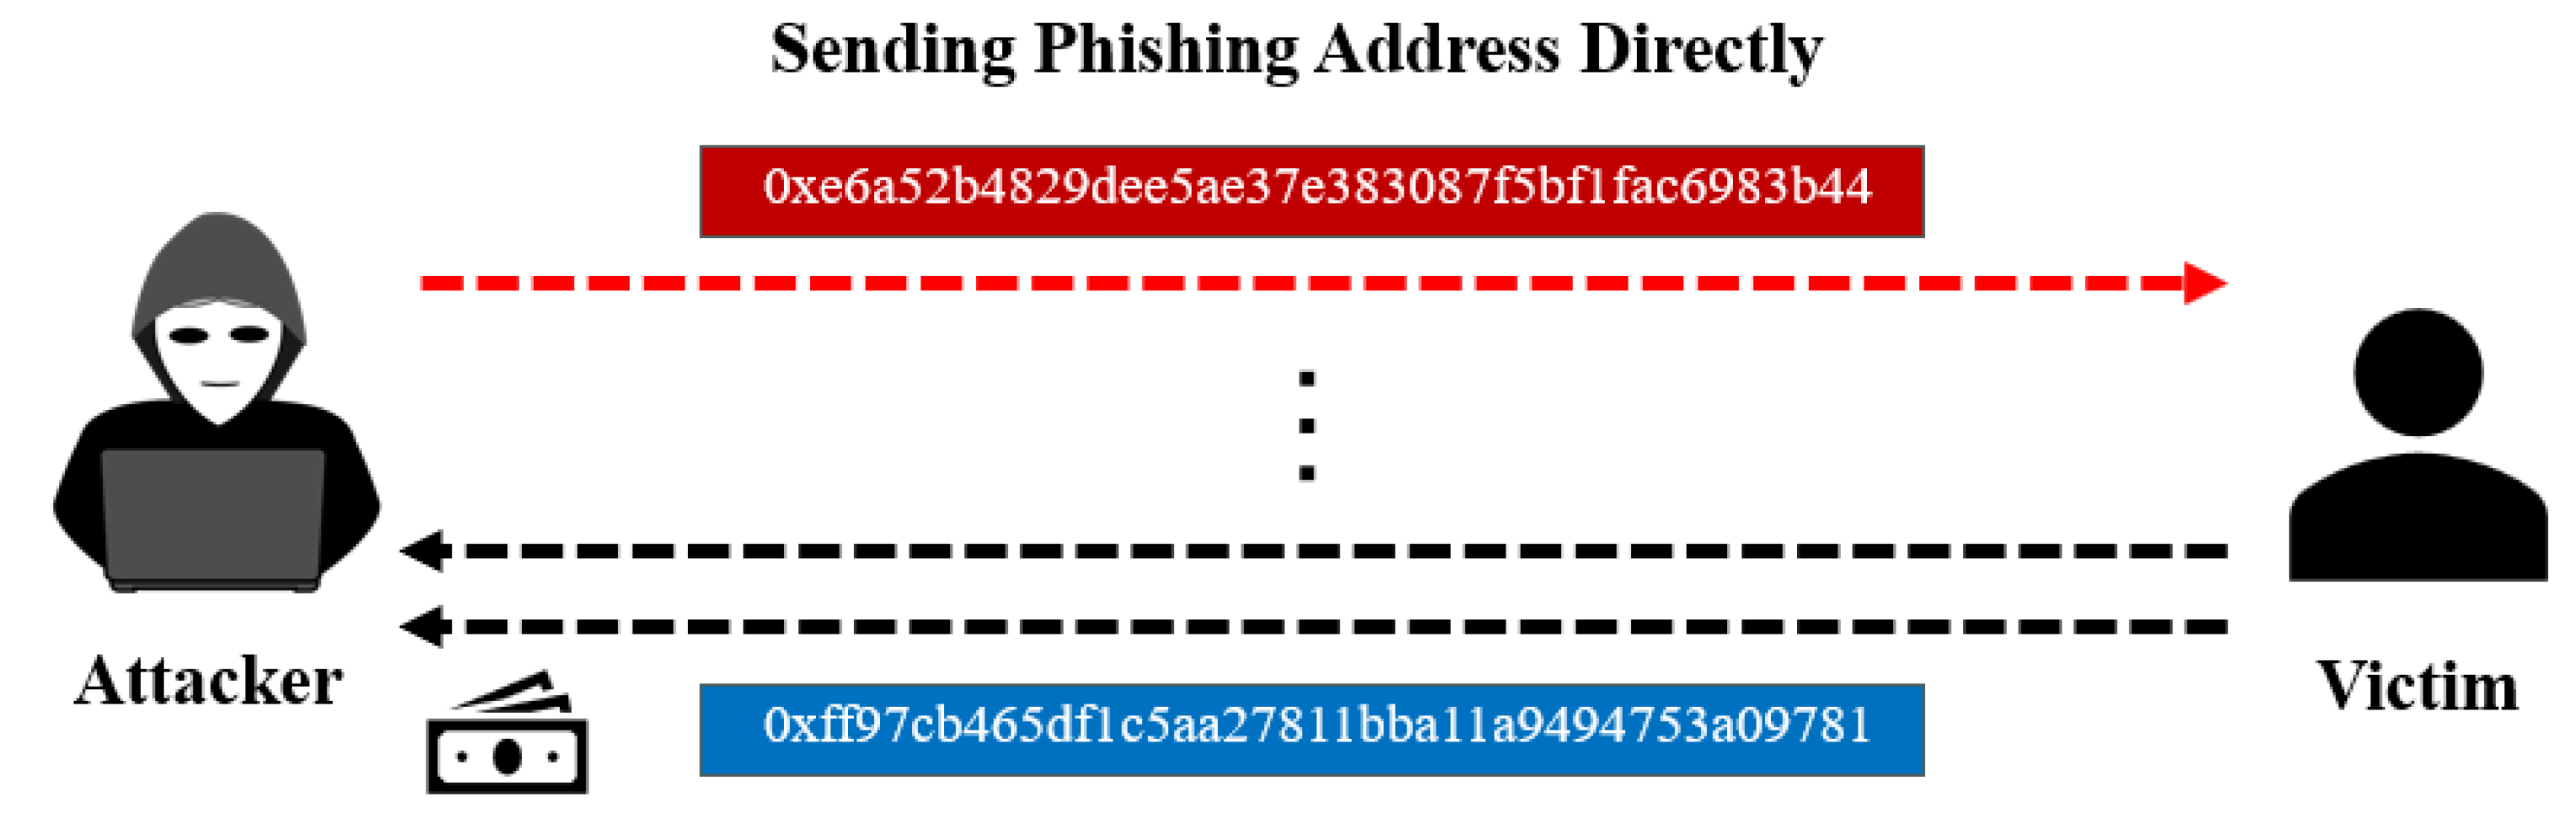
Figure 2.
Overall architecture of the proposed BERTSC framework. The model takes a heterogeneous transaction graph with multi-dimensional edge features as input, employs a soft prompt encoder to inject numerical priors, and utilizes a dynamic three-way gating mechanism to adaptively fuse graph structural, semantic, and numerical information for stablecoin phishing detection.
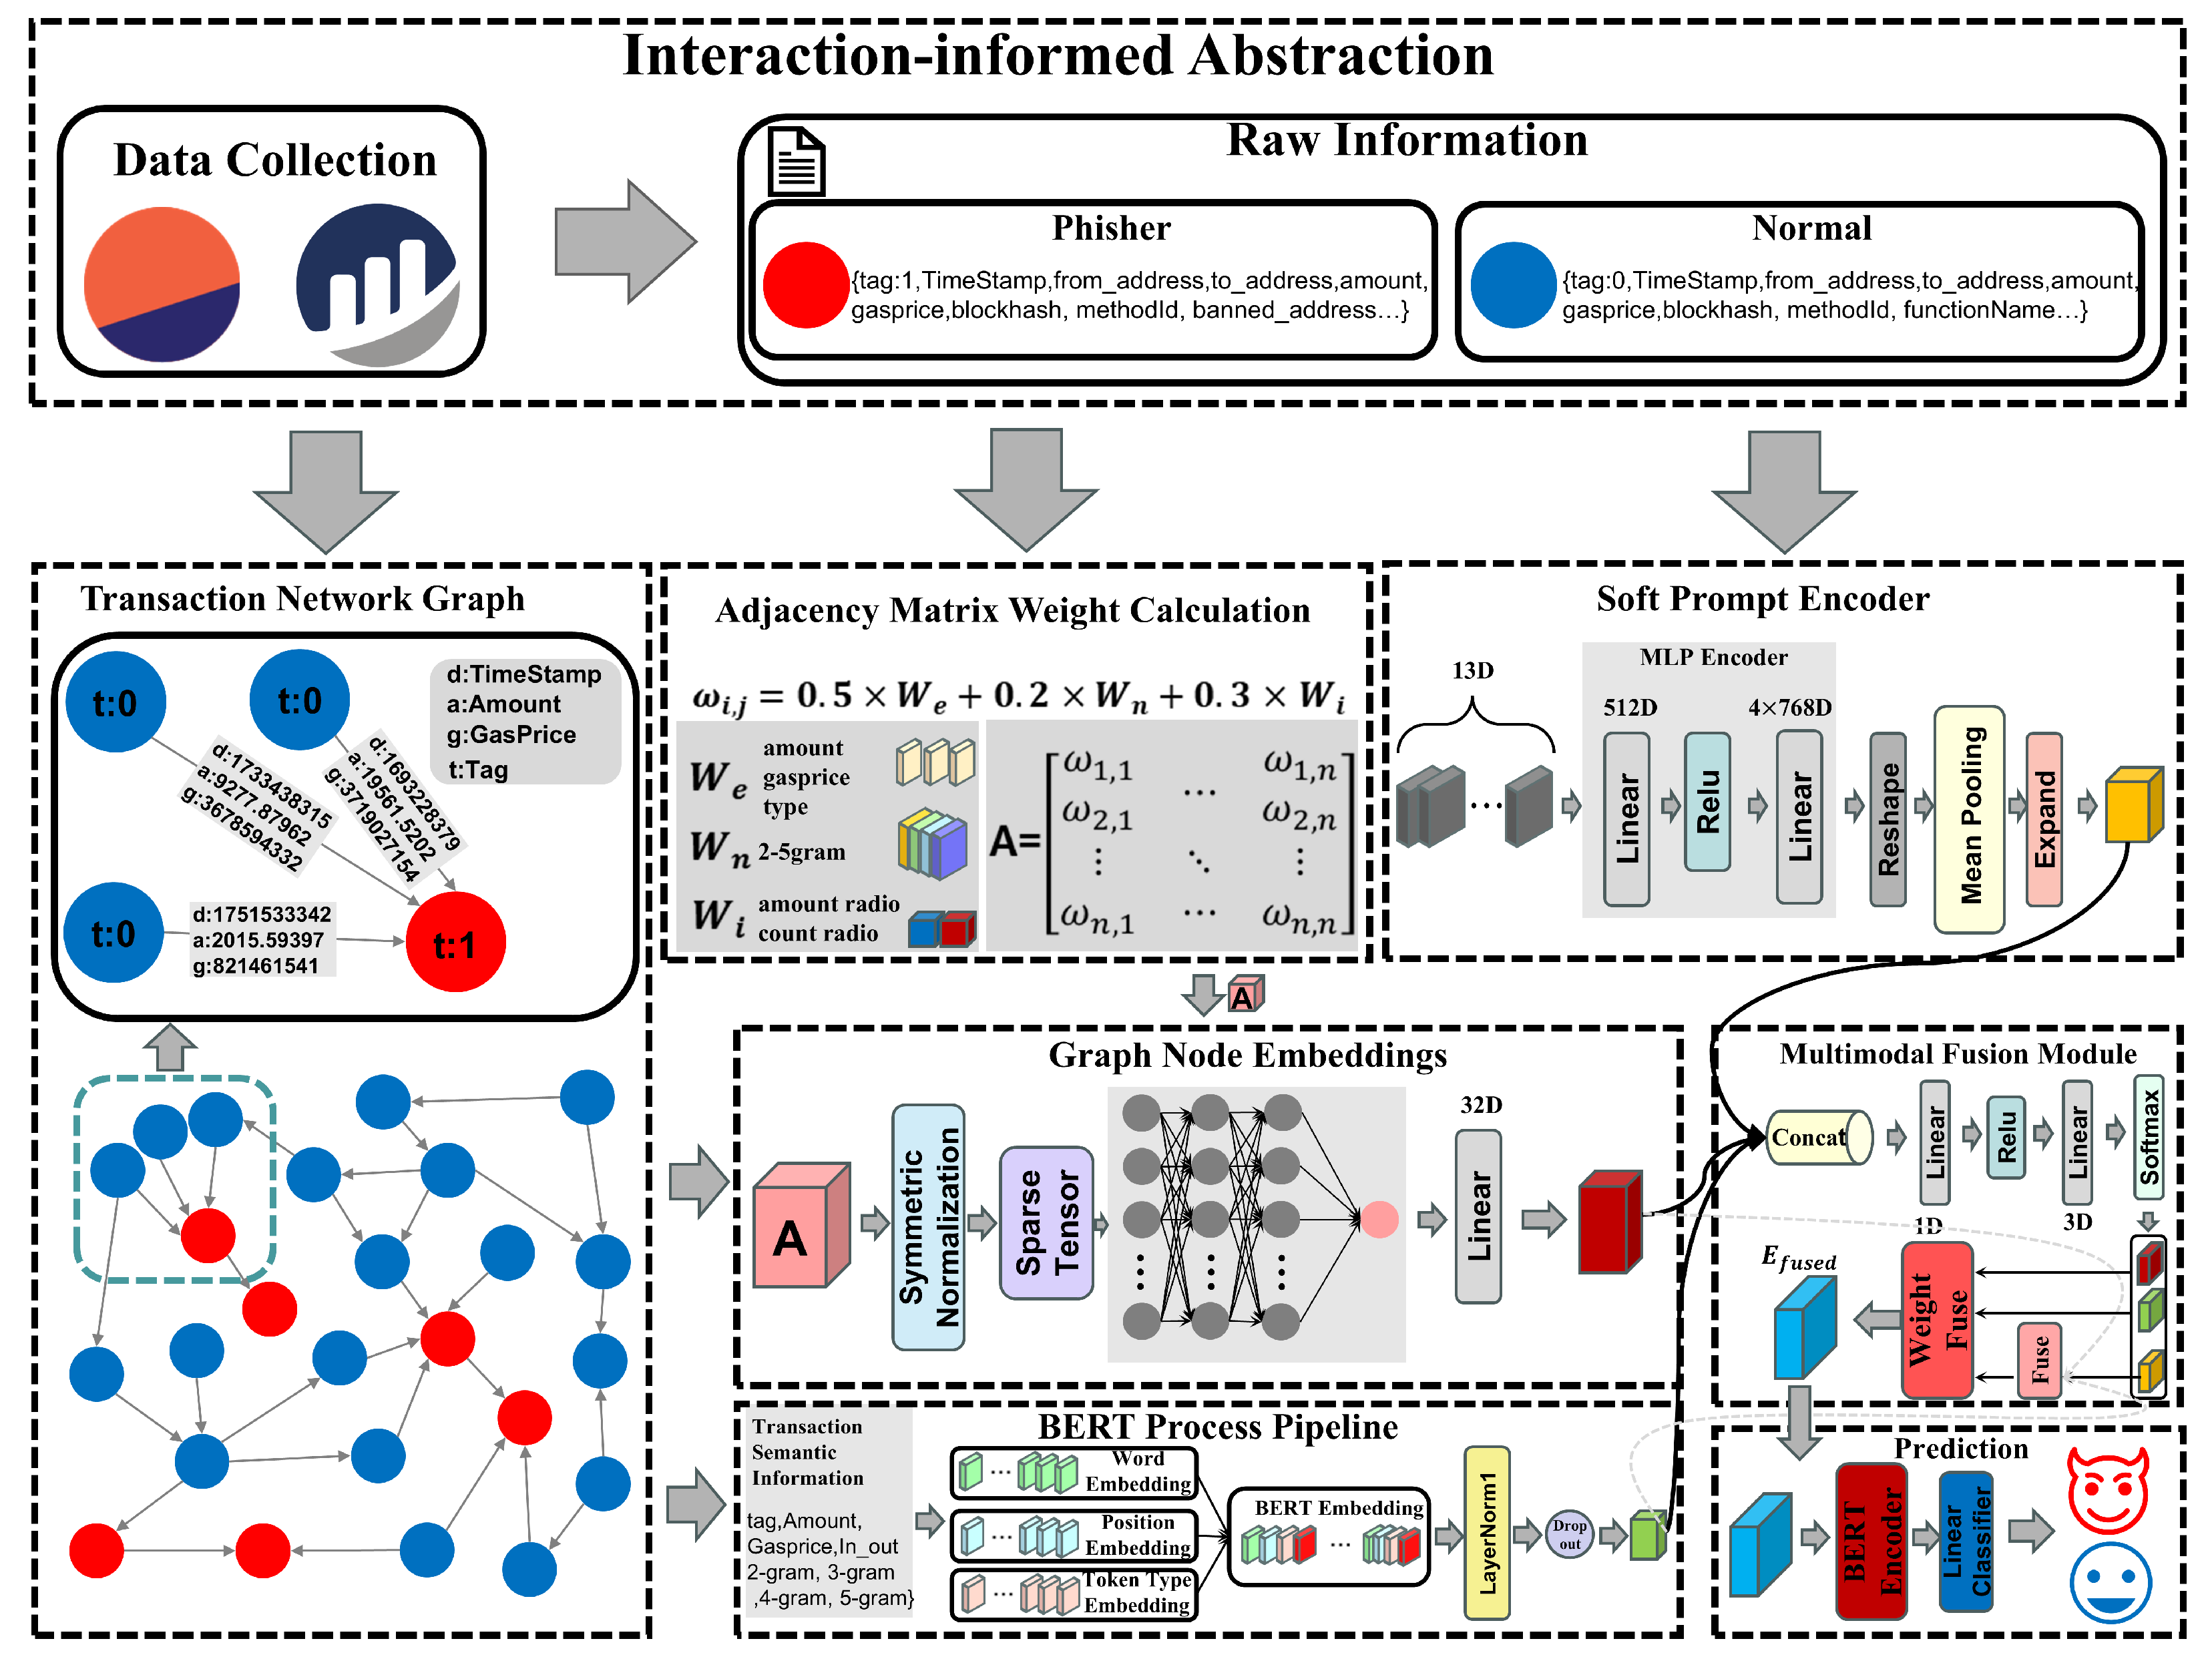
Figure 3.
Visualization of the constructed directed transaction graph. Phishing nodes are marked in red, benign nodes in blue, and directed edges represent stablecoin transfers on Ethereum, with edge thickness proportional to transaction amount.
Figure 3.
Visualization of the constructed directed transaction graph. Phishing nodes are marked in red, benign nodes in blue, and directed edges represent stablecoin transfers on Ethereum, with edge thickness proportional to transaction amount.
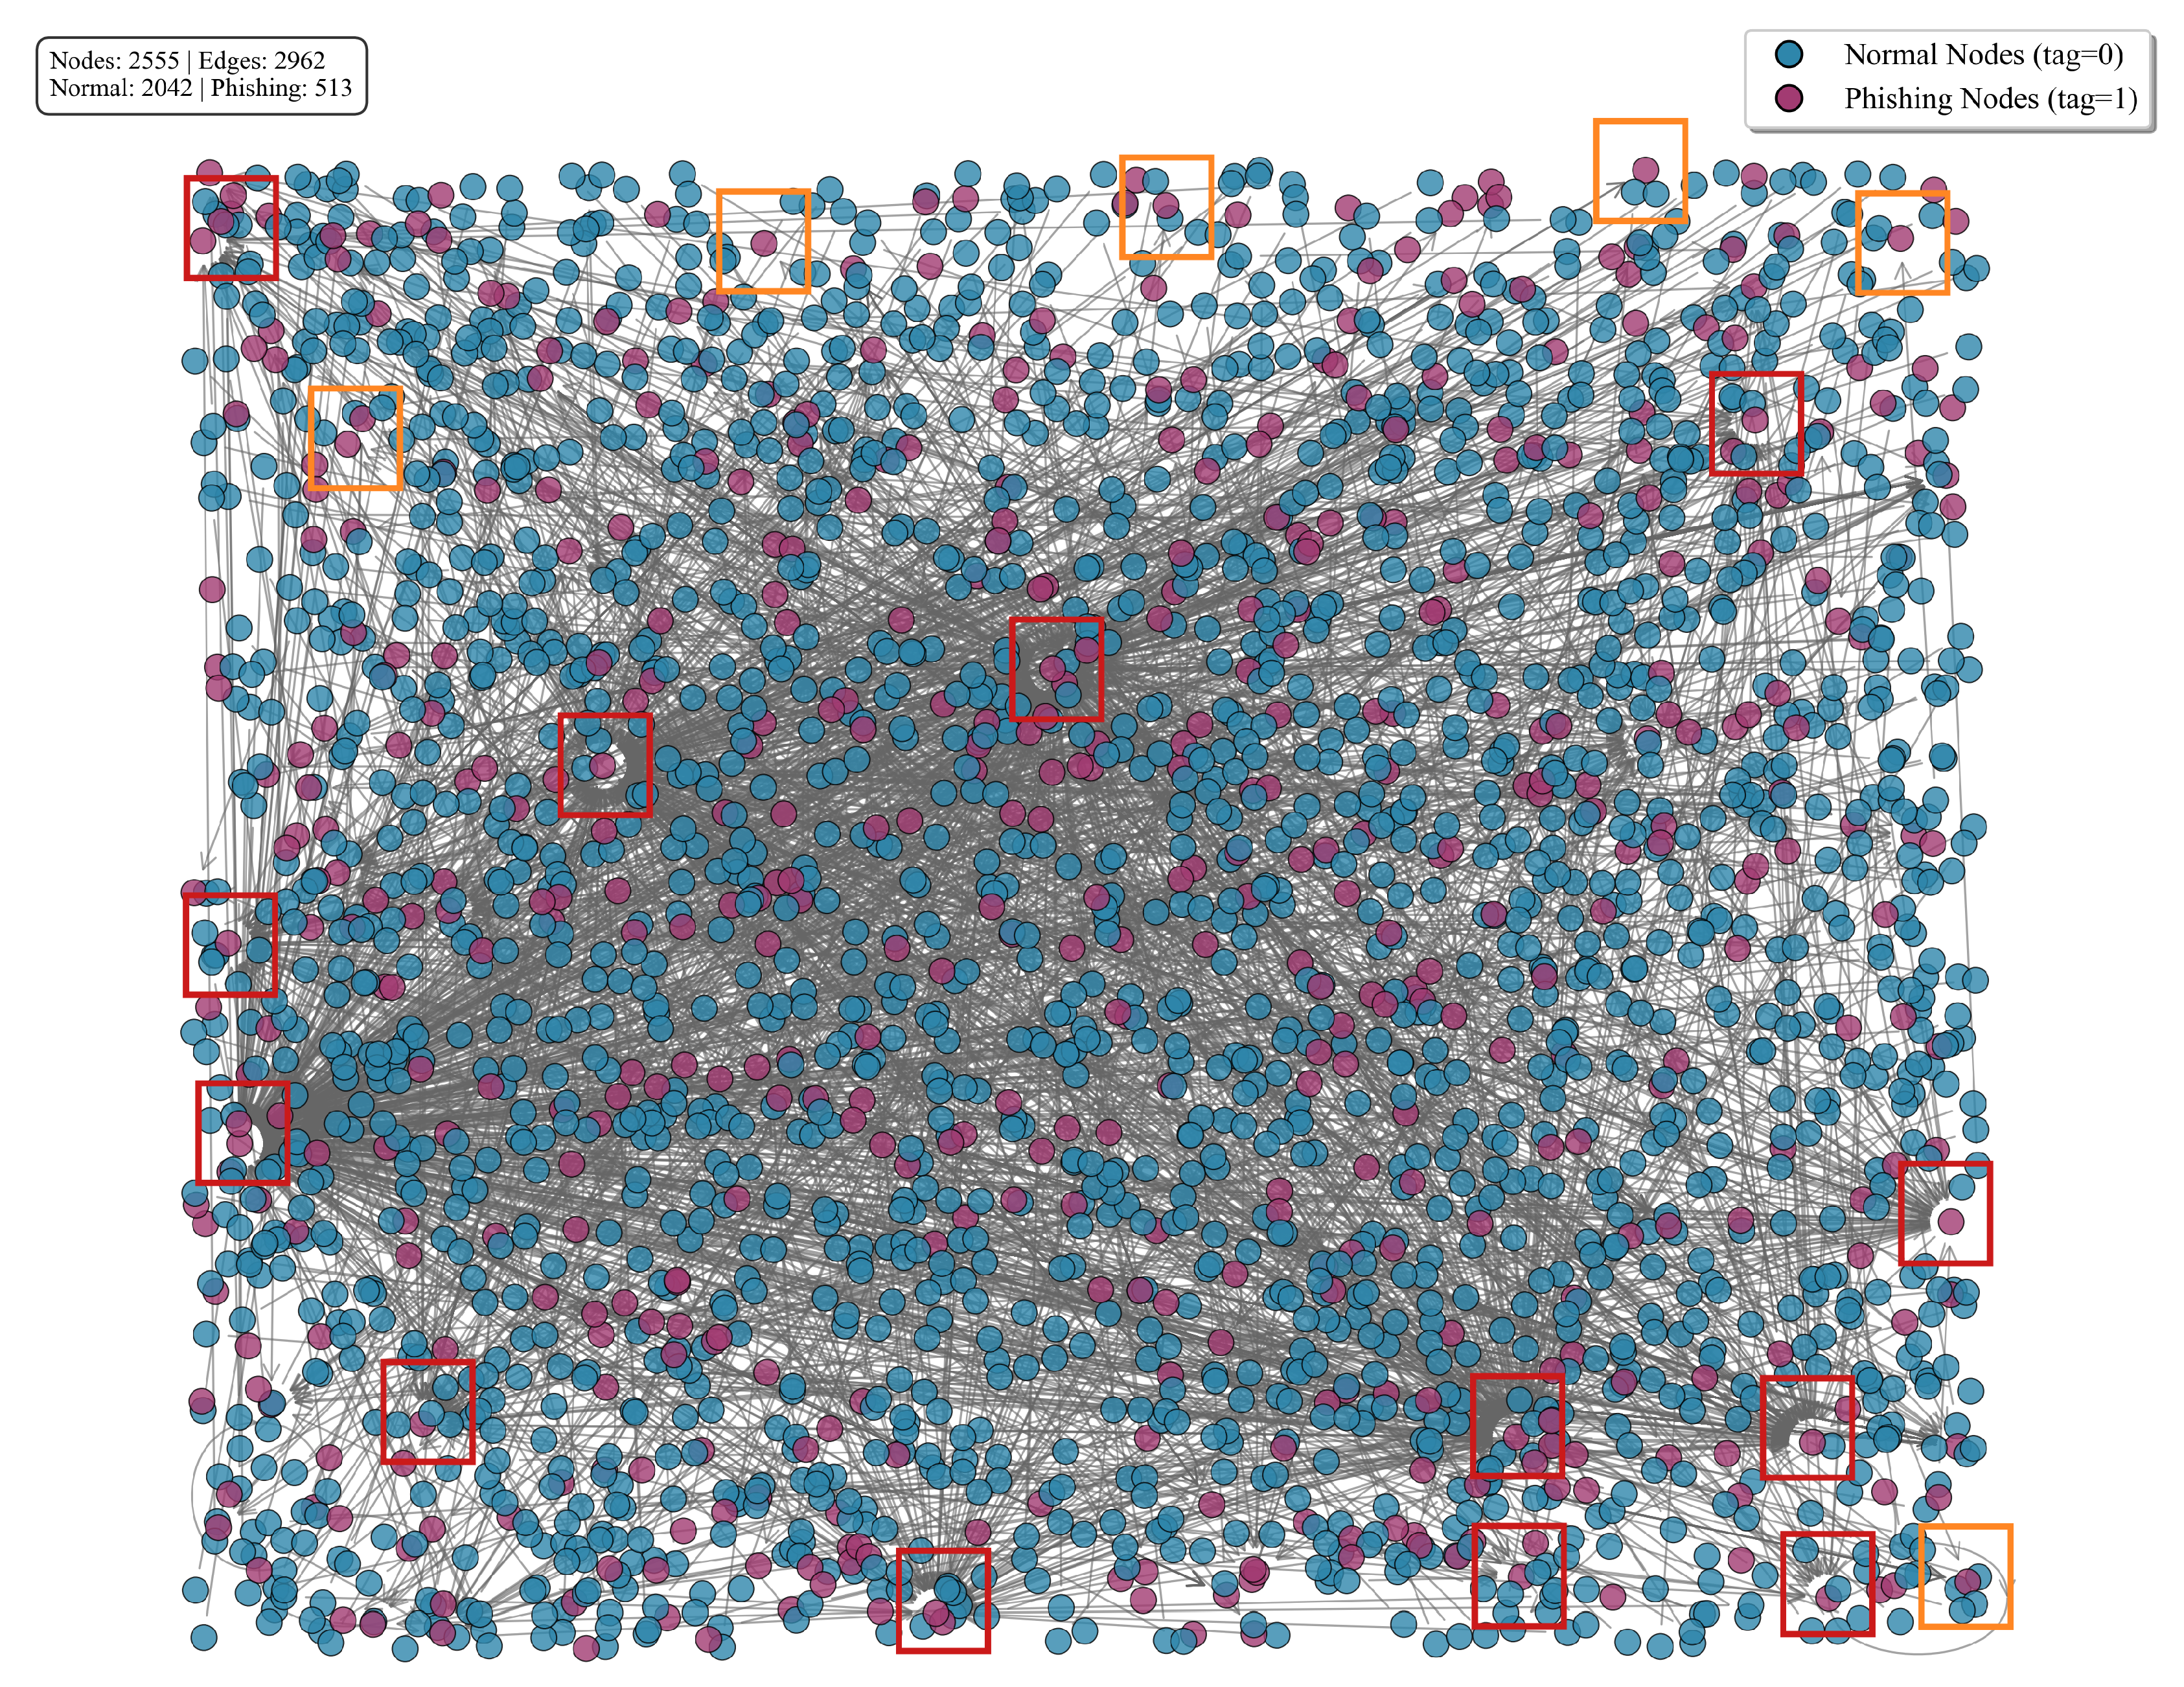
Figure 4.
Framework Diagram of Graph Convolutional Networks
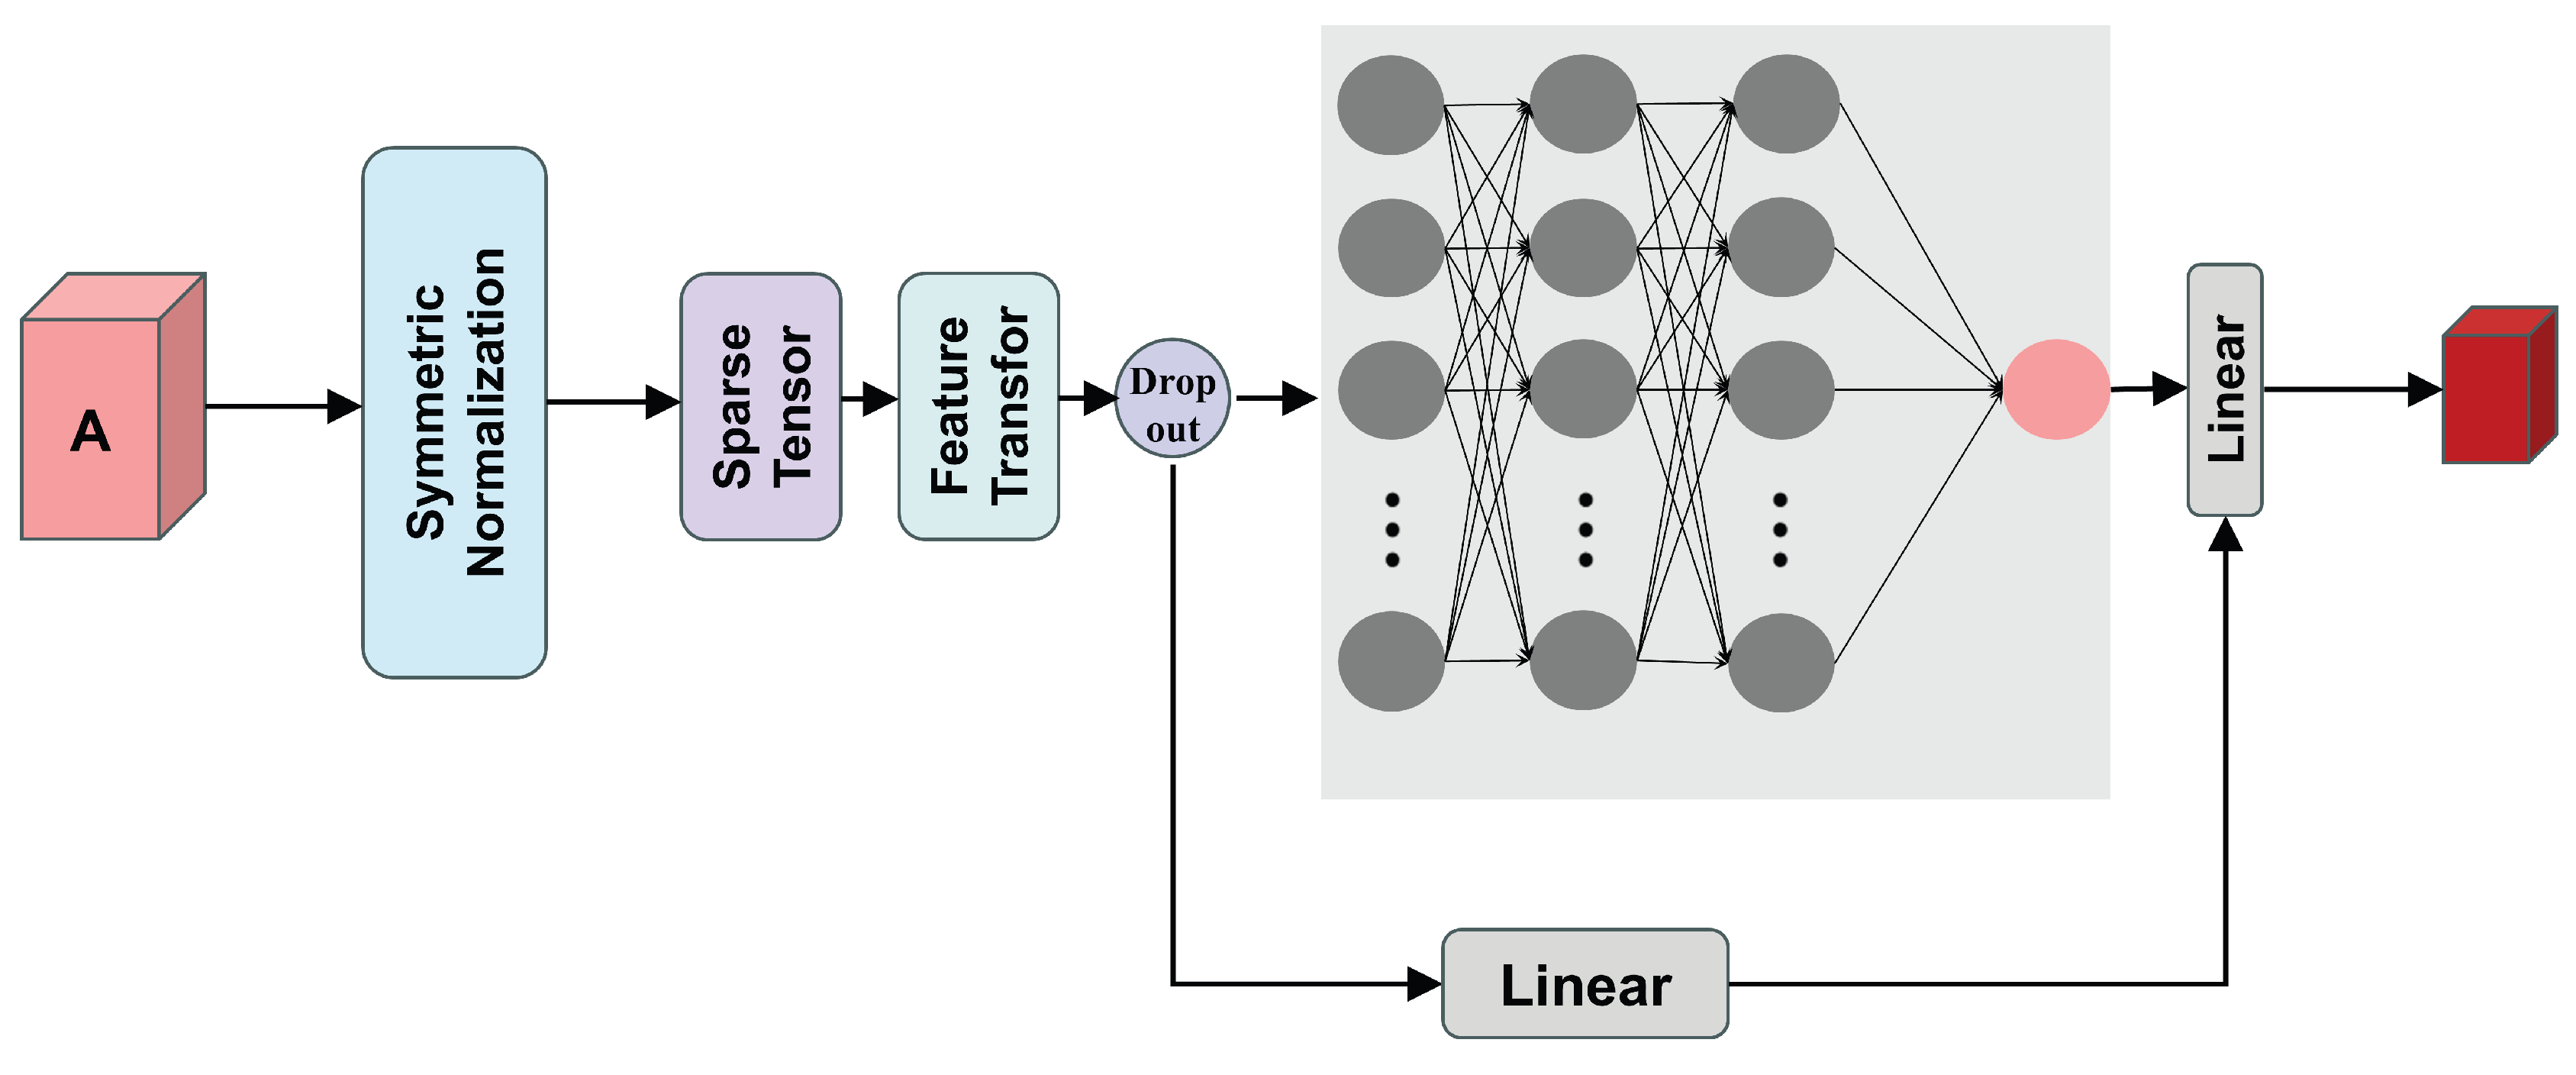

Table 1.
Node and edge features used in the stablecoin transaction graph.
| Type | Features |
|---|---|
| Node | Tag (phishing label or benign label) |
| Edge | Timestamp difference (time interval between consecutive transactions) |
| Amount (transferred stablecoin value in USD equivalent) | |
| GasPrice (transaction fee rate in Gwei) |
Table Note: Node labels are obtained from publicly available phishing address datasets and official reports. Edge features are directly extracted from real stablecoin (USDT/USDC/DAI) transaction records on the Ethereum blockchain, reflecting temporal dynamics, economic scale, and cost characteristics of interactions.
Table 2.
Statistical attributes of the constructed stablecoin phishing dataset.
| Attribute | Value |
|---|---|
| Time span | 2017–2025 |
| Number of nodes | 2,529,625 |
| Number of directed edges | 13,071,630 |
| Phishing nodes | 1,766 |
| Benign nodes | 2,527,859 |
Table Note: The dataset consists of real on-chain USDT, USDC, and DAI transactions on Ethereum collected from January 2017 to June 2025. Phishing addresses are aggregated and cross-verified from Etherscan labels, CryptoScamDB, PhishTank, and official security reports.
Table 3.
Features used for address dictionary construction and transaction preprocessing.
| Processing Type | Description |
|---|---|
| Address Dictionary Construction | Unique address to integer ID mapping |
| Transaction direction encoding (send = 1, receive = 0) | |
| Aggregation of historical transaction records per address | |
| Transaction-Level Features | Timestamp difference between transactions (seconds) |
| Transaction amount (in USD equivalent) | |
| GasPrice (in Gwei) | |
| Block number of the transaction |
Table Note: The address dictionary maps raw Ethereum addresses to consecutive integers to enable efficient graph construction. All transaction records are preprocessed to extract directed edges and multi-dimensional features for input to the heterogeneous graph.
Table 4.
Feature description.
| Parameter | Example Value |
|---|---|
| tag | 0 |
| Amount | 1000 |
| Send | 1 |
| 2-gram | 5.3s |
| 3-gram | 10.25s |
| 4-gram | 20.13s |
| 5-gram | 60s |
Table Note: Example values of the features extracted and used in the experiments.
Table 5.
13-Dimensional account interaction features.
| Feature | Description |
|---|---|
| in_out_amount_ratio | Reflecting the account fund flows |
| out_in_amount_ratio | |
| in_out_count_ratio | Transaction frequency patterns |
| out_in_count_ratio | |
| avg_in_gasprice | Reflecting the transaction priority |
| avg_out_gasprice | |
| log_in_amount | Logarithmically transformed features |
| log_out_amount | |
| log_ratio_amount | |
| counterpart_diversity | Measuring the breadth of an account’s interactions with different addresses |
| is_high_in_out_ratio | Marking anomalous patterns of fund flows |
| is_sink_node | Determine whether the account is a sink (hub) node |
| is_source_node | Determine whether the account is a source node |
Table Note: These 13-dimensional statistical features are extracted from historical transaction sequences of each Ethereum address to characterize its behavioral patterns in stablecoin transfers.
Table 6.
Performance comparison of different methods on the stablecoin phishing detection dataset.
| Method | Precision (%) | Recall (%) | F1-Score (%) |
|---|---|---|---|
| DeepWalk | 30.07 | 46.63 | 36.56 |
| Trans2Vec | 49.17 | 52.36 | 49.58 |
| Dif2Vec | 51.84 | 67.10 | 53.02 |
| Role2Vec | 62.35 | 51.22 | 52.96 |
| GCN | 43.70 | 51.72 | 46.23 |
| GAT | 46.76 | 56.23 | 43.57 |
| GSAGE | 35.06 | 42.39 | 38.38 |
| BERT4ETH | 78.58 | 75.67 | 77.04 |
| ETH-GBERT | 84.94 | 85.87 | 85.36 |
| BERTSC (ours) | 89.90 | 89.47 | 89.59 |
Table 7.
Ablation study on key modules of BERTSC.
| Method | Precision (%) | Recall (%) | F1-Score (%) |
|---|---|---|---|
| BERT&SOFT | 86.10 | 86.13 | 86.11 |
| GCN&SOFT | 81.34 | 72.63 | 73.41 |
| GCN&BERT | 84.94 | 85.87 | 85.36 |
| BERTSC (ours) | 89.90 | 89.47 | 89.59 |
Table 8.
Effectiveness of adjacency matrix weighting and interaction features.
| Method | Precision (%) | Recall (%) | F1-Score (%) |
|---|---|---|---|
| Baseline | 84.94 | 85.87 | 85.36 |
| Only Weight | 86.75 | 87.72 | 87.19 |
| IF&W | 89.90 | 89.47 | 89.59 |
Table Note: “IF&W” means Interaction Feature & Weight, which combines the interaction characteristics of different node accounts within the transaction network with the weights of the adjacency matrix.
Disclaimer/Publisher’s Note: The statements, opinions and data contained in all publications are solely those of the individual author(s) and contributor(s) and not of MDPI and/or the editor(s). MDPI and/or the editor(s) disclaim responsibility for any injury to people or property resulting from any ideas, methods, instructions or products referred to in the content. |
© 2025 by the authors. Licensee MDPI, Basel, Switzerland. This article is an open access article distributed under the terms and conditions of the Creative Commons Attribution (CC BY) license (http://creativecommons.org/licenses/by/4.0/).
Copyright: This open access article is published under a Creative Commons CC BY 4.0 license, which permit the free download, distribution, and reuse, provided that the author and preprint are cited in any reuse.


