Submitted:
25 November 2025
Posted:
25 November 2025
You are already at the latest version
Abstract
This paper presents an explainable multimodal vision–language framework for the primary classification of skin diseases. Using compact vision–language models (VLMs)—Gemma 3 4B and Qwen 2.5 VL 7B—the system integrates synthetic skin tumor and lesion images with natural-language disease descriptions, grounding its predictions in lay-accessible dermatologic concepts to improve interpretability. Low-rank adaptation (LoRA) fine-tuning on the AI-Hub synthetic skin-tumor dataset demonstrates the feasibility of deploying such models in resource-constrained environments. Model performance is evaluated using quantitative metrics, including accuracy, precision, recall, and F1-score, and a DBSCAN-centroid-based semantic confidence-scoring method is introduced to estimate cluster similarities in the image-embedding space. The experimental results show that lightweight multimodal VLMs can achieve stable and accurate performance on primary skin disease classification, indicating their potential as explainable, AI-assisted tools for dermatologic decision support.
Keywords:
artificial intelligence
; confidence scoring
; dermatology
; multimodal learning
; skin cancer
; skin lesions
; vision-language models (VLMs)
1. Introduction
Early diagnosis of skin tumors is a critical task that strongly influences the prognosis of the patient. According to SEER Training data from the U.S. National Cancer Institute, the 5-year relative survival rate of malignant melanoma, one of the representative cutaneous malignancies, varies significantly by stage, as summarized in Table 1. When tumor cells are confined to the epidermis (Stage 0), the 5-year survival rate reaches 100% with early detection. Even when the lesion is limited to the dermis (Stages I-II), the 5-year survival rate with early detection remains as high as 97.6%. However, once tumor cells extend beyond the dermis and metastasize to regional lymph nodes (Stage III or greater), the 5-year survival rate drops dramatically to 60.3%.
Although skin tumors are located on the body surface and can in principle be evaluated visually, they are often small and morphologically similar to benign melanocytic nevi, commonly perceived as simple “moles,” making early detection difficult. In response to this challenge, numerous studies have applied convolutional neural networks (CNNs) to automatically detect and classify skin lesions [1,2]. More recently, the Transformer architecture [3] and vision–language models (VLMs) built upon it [4] have begun to be explored in medical imaging, and several medical domain–specific multimodal models such as MedGemma [5] and LLaVA-Med [6] have been proposed.
However, unlike conventional CNN-based classifiers that provide intuitive confidence scores via softmax-based probability outputs, VLMs typically rely on embedding representations, which makes it difficult to quantify the reliability of their responses in a clear and interpretable way. To address this limitation, the present study proposes an alternative approach that computes a confidence score for each sample by applying DBSCAN-based clustering [7] in the image-embedding space and then incorporates this score into the model training process so that the model can explicitly take response reliability into account. Building on this idea, we leverage lightweight VLMs (Gemma 3 4B and Qwen 2.5 VL 7B) for primary classification of skin tumors and introduce a DBSCAN-based semantic confidence-scoring method. The goal is to complement existing VLMs by providing explainable diagnostic evidence and ultimately to explore their potential use in clinical referral workflows.
2. Theoretical Background
Before the advent of Transformer-based architectures and vision-language models (VLMs), most artificial intelligence research on skin-tumor diagnosis focused on convolutional neural network (CNN)-based computer vision models [8]. By mitigating the vanishing-gradient problem and introducing residual learning, deep CNNs could be trained stably at scale and quickly became dominant across many vision tasks [9]. Representative examples include AlexNet and the ResNet family, which achieved major breakthroughs in the ImageNet Large Scale Visual Recognition Challenge by effectively extracting local patterns and learning hierarchical feature maps, thereby delivering state-of-the-art performance in image classification [8,9,10]. In medical imaging, pretraining on large-scale datasets such as ImageNet followed by transfer learning has also been applied to skin-lesion classification, achieving performance comparable to board-certified dermatologists [1,2].
The introduction of the Transformer architecture provided a framework for large models to understand natural language and generate fluent text responses [3]. By leveraging self-attention to capture global interactions across all input tokens, the Vision Transformer (ViT) extended this idea to computer vision, enabling effective image representation learning without convolution by treating image patches as tokens [11].
Subsequent advances in multimodal architectures such as CLIP established a foundation for jointly processing images and text within a single model [4]. Approaches like CLIP and SigLIP align visual and textual inputs into a shared embedding space using large-scale image-text pairs, directly linking visual content to natural language descriptions [4,12]. This development goes beyond pure image classification: it enables models to generate textual explanations and answer natural-language questions grounded in visual cues. Building on these capabilities, recent work on visual instruction tuning has further evolved VLMs into systems that can “explain in language what they understand visually,” marking a key turning point toward interactive, instruction-following vision–language assistants [13].
3. Related Work
Early work on AI-assisted diagnosis of skin lesions focused on improving classification performance on real clinical images using convolutional neural networks (CNNs). A ResNet-50–based Inception-v3 model trained on 129,450 clinical images achieved dermatologist-level performance with an AUC of 0.96 for skin-cancer classification [1]. Follow-up studies in public datasets such as the ISIC Archive also reported that deep-learning models could outperform the majority board-certified dermatologists: one study showed that a CNN outperformed 136 of 157 dermatologists in a head-to-head melanoma classification task [2].
In a prospective clinical study using the ModelDerm algorithm, AI assistance significantly improved the diagnostic accuracy of non-dermatology residents for lesions suspected of skin neoplasms [14]. Although this work did not use synthetic images, it used a Faster R-CNN–based lesion-detection module to automatically crop regions of interest from real-world clinical photographs, demonstrating that AI systems can play a practical supporting role in clinical workflows. However, obtaining sufficiently large and balanced clinical datasets remains challenging, especially for rare skin conditions, and data imbalance has been repeatedly identified as a major limitation.
To alleviate these issues, several studies have explored the use of synthetic images. A StyleGAN-based approach generated dermoscopic skin-lesion images and augmented the training set for a DenseNet201 classifier; this resulted in an approximate 3.6% improvement in balanced accuracy and showed that synthetic data can mitigate class imbalance and enhance performance on rare categories [16]. More recently, Derm-T2IM fine-tuned a Stable Diffusion model in a few-shot manner to synthesize skin-lesion images from textual prompts, and incorporating these synthetic images into ViT- and CNN-based training pipelines improved model generalization and robustness [15].
With the rapid progress of Transformer-based architectures, multimodal vision–language models (VLMs) have also begun to be applied to medical imaging. LLaVA-Med combines a CLIP-style vision encoder with a LLaMA-based language model and is trained on PubMed image–text pairs as well as GPT-4–generated question–answer data, thereby enabling medical visual question answering and explanatory captioning capabilities [6]. Similarly, MedGemma integrates a Gemma-3 backbone with a SigLIP vision encoder and is trained on more than 30 million medical image–text pairs to enhance domain-specific semantic alignment and explainability [5]. These multimodal VLMs go beyond pure visual classification and are evolving into diagnostic support frameworks that integrate linguistic justification with visual assessment.
4. Methodology
4.1. Dataset
In this study, we used the synthetic skin-tumor image dataset released on the AI-Hub platform. The dataset consists of skin-lesion images that were synthetically generated based on real clinical photographs and corresponding pathologic labels. In total, the dataset contains 15 diagnostic categories (e.g., benign tumors, malignant tumors), with 12,000 images in the training set and 1,500 images in the test set, for a total of 13,500 images. Each sample is accompanied by structured metadata in JSON format, including the lesion label and a brief textual description.
Figure 1 illustrates an example synthetic image of malignant melanoma from the dataset. As summarized in Table 2, the metadata schema includes a unique identifier for each case, high-level diagnostic information (e.g., diagnosis name and description), and additional fields describing the image-generation parameters, photographic properties, and lesion bounding box. This structured representation allows the dataset to be used not only for pure image classification but also for multimodal training in which image content is aligned with textual clinical information.
4.2. Dataset Preprocessing (1) Generation of Disease Descriptions
However, the description field in Table 2 provides only a brief general remark about the disease and lacks information describing the pathological features visible in the image. To address this limitation, publicly available medical information on each disease was summarized, and based on this summary, detailed disease descriptions specific to each image were generated using the OpenAI GPT-4o model.

Table 3.
Prompt for generating disease descriptions.
| Korean Original Prompt | English-Translated Prompt |
|---|---|
|
너는 피부 병변을 진단하는 전문 AI이다. 다음은 네가 진단할 수 있는 피부 병변 목록이며, 각 병변의 임상적 특징은 아래와 같다. 환자에게 나타난 병변의 이미지와 설명을 바탕으로 가장 적합한 질병을 하나 선택하여 진단하라.
아래 진단 기준을 참조하여 이미지에서 어떤 특징이 해당 질병의 특징에 해당하는지 설명하라. 각 질병의 특징은 다음과 같다: ... (중략)... 악성흑색종 - 색상특징: 비균일한 검정, 갈색, 붉은색 혼합 - 비대칭성: 모양이 비대칭이며 경계가 불규칙함 - 병변변화: 빠르게 크기 증가 및 색 변화 가능 - 전이가능성: 림프절 및 전신으로 빠르게 전이 - 생존율: 조기 발견 시 생존율 높지만, 진행 시 예후 불량 ...(중략)... <label>질병명</label> <summary>질환설명</summary> |
You are an AI system specialized in diagnosing dermatological lesions. The following list presents the skin conditions that you are capable of identifying, along with their corresponding clinical characteristics. Based on the patient’s lesion image and the accompanying description, select the single most appropriate diagnosis. Refer to the diagnostic criteria below and explain which features observed in the image correspond to the characteristic findings of the selected disease. The key features of each condition are as follows: ... (omitted) ... Malignant Melanoma - Color Characteristics: Uneven mixture of black, brown, and red tones - Asymmetry: Asymmetrical shape with irregular borders - Lesion Evolution: Rapid increase in lesion size and possible changes in pigmentation - Metastatic Potential: Rapid metastasis to lymph nodes and distant organs - Survival Rate: High survival rate when detected early; poor prognosis in advanced stages ...(omitted)... <label>Disease Name</label> <summary>Disease Description</summary> |
In addition, a one-shot example was provided below to serve as a reference for generating disease descriptions.
Table 4.
One-shot example for generating disease descriptions
| Korean Original Example | English-Translated Example |
|---|---|
| 예시: <label>지루각화증</label> <summary> 이미지에서는 피부 표면에 갈색으로 보이며, 표면이 거칠게 융기된 병변이 관찰됩니다. 이 병변은 피부에 덧붙은 듯한 모양을 가지며, 크기가 천천히 증가할 수 있지만 대체로 양성이며 건강에 큰 문제를 일으키지 않습니다. </summary> |
Example: <label>Seborrheic Keratosis</label> <summary> In the image, a brown-colored lesion with a rough, elevated surface is observed. The lesion appears as though it is stuck onto the skin and may gradually increase in size; however, it is generally benign and does not typically pose significant health concerns. </summary> |
The disease descriptions generated through this process take the form shown in Table 5 below.
4.3. Dataset Preprocessing (2) Confidence Score
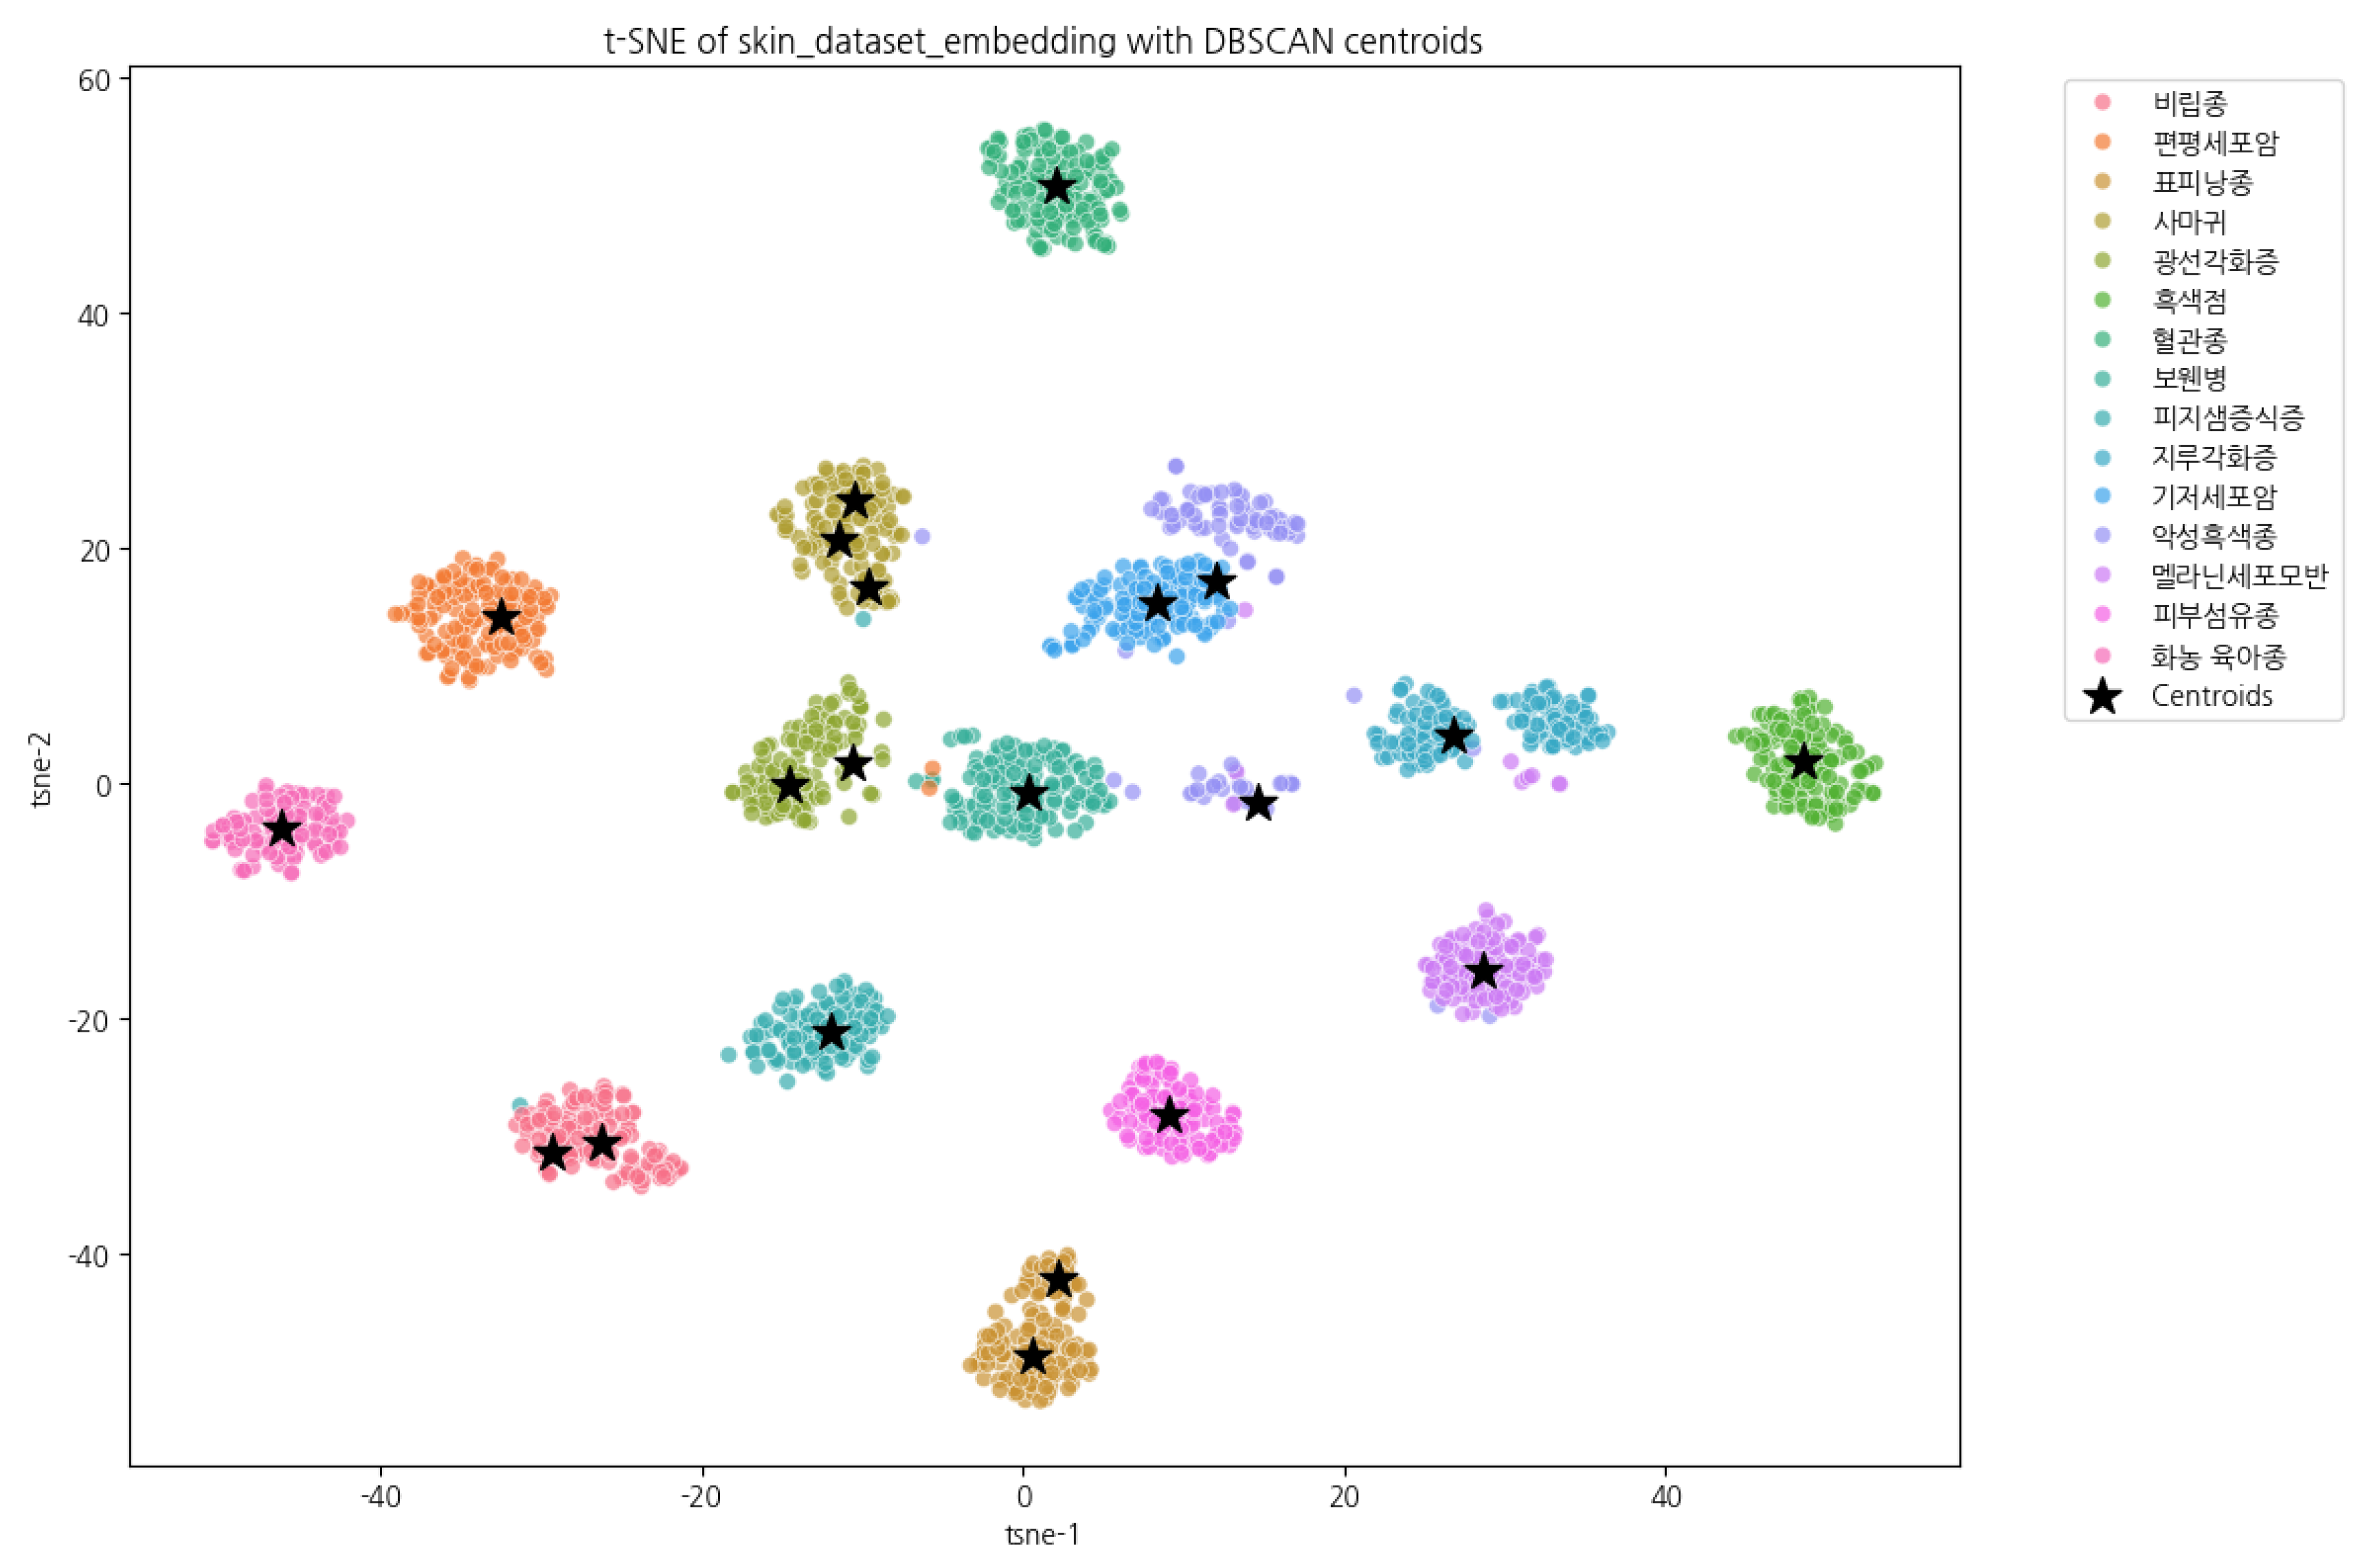
Transformer-based VLMs generate responses through a next-token prediction mechanism, and therefore do not expose an interpretable confidence score, unlike the softmax output of traditional classifiers [3,17]. To address this limitation, the present study converts input images into embedding vectors using the SigLIP encoder of MedGemma [5,12]. DBSCAN (Density-Based Spatial Clustering of Applications with Noise) is then applied to the set of training embeddings to identify density-based clusters and compute the centroid of each cluster [7]. Subsequently, the cosine similarity between each image embedding and the cluster centroids is calculated.
For example, when comparing the embedding of an image labeled as a melanocytic nevus with the centroids of all clusters, the top five most similar clusters can be obtained, as illustrated in Table 6.
Figure 2.
Centroids of each cluster (T-SNE).
To transform the cosine similarity value into a probability-like measure, we apply a softmax function with a temperature parameter T [17,18]. Specifically, for each class k, it is defined as
In this context, T serves as a parameter that controls the scale of the distribution. When T is small, the distribution becomes sharper (high confidence), increasing the probability of highly similar items. Conversely, when T is large, the distribution becomes flatter (soft distribution), reducing differences among lower-ranked items. In this study, was selected to emphasize highly similar clusters while preventing excessive concentration of the distribution.
The processed score values were then inserted into the XML file as attribute values. To enable the model to interpret numerical values more easily, the scores were converted into percentages. The final output format is shown below Table 7.
5. Experimental Design
5.1. Training Models, Groups, and Hyperparameters
The training models, experimental groups, and hyperparameters are presented below Table 8.
The distinctions among Groups A, B, C, and D are summarized in Table 9 below.
Groups A and B perform gradient updates only on the output tokens, encouraging the model to focus on predicting the correct label. In contrast, Groups C and D include both input and output tokens in the training objective, allowing optimization of the prompt structure and contextual information as well. This design enables comparative analysis of whether output-oriented training leads to more stable classification performance by concentrating on discriminative signals, or whether joint input–output training provides advantages through enhanced contextual utilization.
Table 10.
Configuration for training only on output tokens (Qwen.)
| trainer = SFTTrainer( model = model, tokenizer = tokenizer, data_collator = UnslothVisionDataCollator( model, tokenizer, train_on_responses_only = True, max_seq_length = 4096, instruction_part = "<|im_start|>user\n", response_part = "<|im_start|>assistant\n", ), ... (omitted)... |
5.2. Dataset Splitting
For Groups A and C, the original output format was not used as-is. Instead, to encourage the model to focus more effectively on the classification task, the dataset was randomly shuffled, divided into three equal subsets, and then processed as follows.
The primary motivation for splitting the dataset arises from the fact that, as the system prompt length increases, the structural tokens contained within the input prompt also become part of the optimization target during fine-tuning. In such cases, the model may substantially reduce training loss by merely reproducing the formatting pattern—regardless of actual classification performance—which can interfere with effective learning of the target labels [19].
This issue is particularly pronounced when the output follows a structured XML schema, where the model tends to prioritize accurate generation of structural tokens, thereby diluting the discriminative classification signal. To mitigate this phenomenon, the entire dataset was divided into four groups: A, B, C, and D. Groups A and B were configured to update gradients only on output tokens, whereas Groups C and D preserved the default setting, training on both input and output tokens.
5.3. Experimental Environment
This study was conducted using the Unsloth library with a QLoRA (Quantized Low-Rank Adaptation)–based fine-tuning approach. QLoRA applies 4-bit quantization to large language models (LLMs), enabling substantial reductions in memory consumption while preserving model performance, thereby improving fine-tuning efficiency [20].
The training environment consisted of eight pod instances deployed on the RunPod.io platform. Each pod was equipped with a single NVIDIA RTX A5000 GPU (24 GB VRAM), which was used to perform fine-tuning and evaluation.
The primary hyperparameters used in the experiments are summarized in the following Table 13.
6. Experiments and Results
6.1. Training and Evaluation Results
The comparative classification performance of the two models (Qwen2.5 VL 7B and Gemma3 4B) under different group-specific training configurations is summarized in Table 14. Overall, both models demonstrated high accuracy (Acc > 0.94) and stable classification performance. Notably, the Gemma3 4B model exhibited relatively superior F1-scores in Groups A and C, where simplified output formats (Table 11 and Table 12) were introduced to encourage the model to focus more directly on the classification task.
Model evaluation was conducted using the test set of the AI Hub synthetic skin tumor image dataset, which—consistent with the training set—consists of 15 diagnostic categories. Training was performed for a total of 3000 steps, and evaluation loss was logged every 50 steps.
As shown in Figure 3, the eval/loss values exhibit different patterns between Groups A/B and Groups C/D. In the case of Groups A and B, which update gradients only on response tokens, the eval loss was consistently higher than that of Groups C and D, regardless of the model used.
After completing 3000 training steps, the resulting training loss and eval loss for each configuration are summarized in the following Table 15.
Although both models showed higher loss values in Group B compared to Group A, and in Group D compared to Group C, the differences were relatively minor. This tendency appears to stem from the characteristics of long-form outputs structured in XML format. Even when conveying the same semantic meaning, variations in surface expression can lead the model to predict different tokens, which are then counted as errors—resulting in higher loss under response formats with strict structural constraints. In contrast, Groups A and C contain datasets in which short, single-answer responses are sufficient, which likely contributed to their relatively lower loss values.
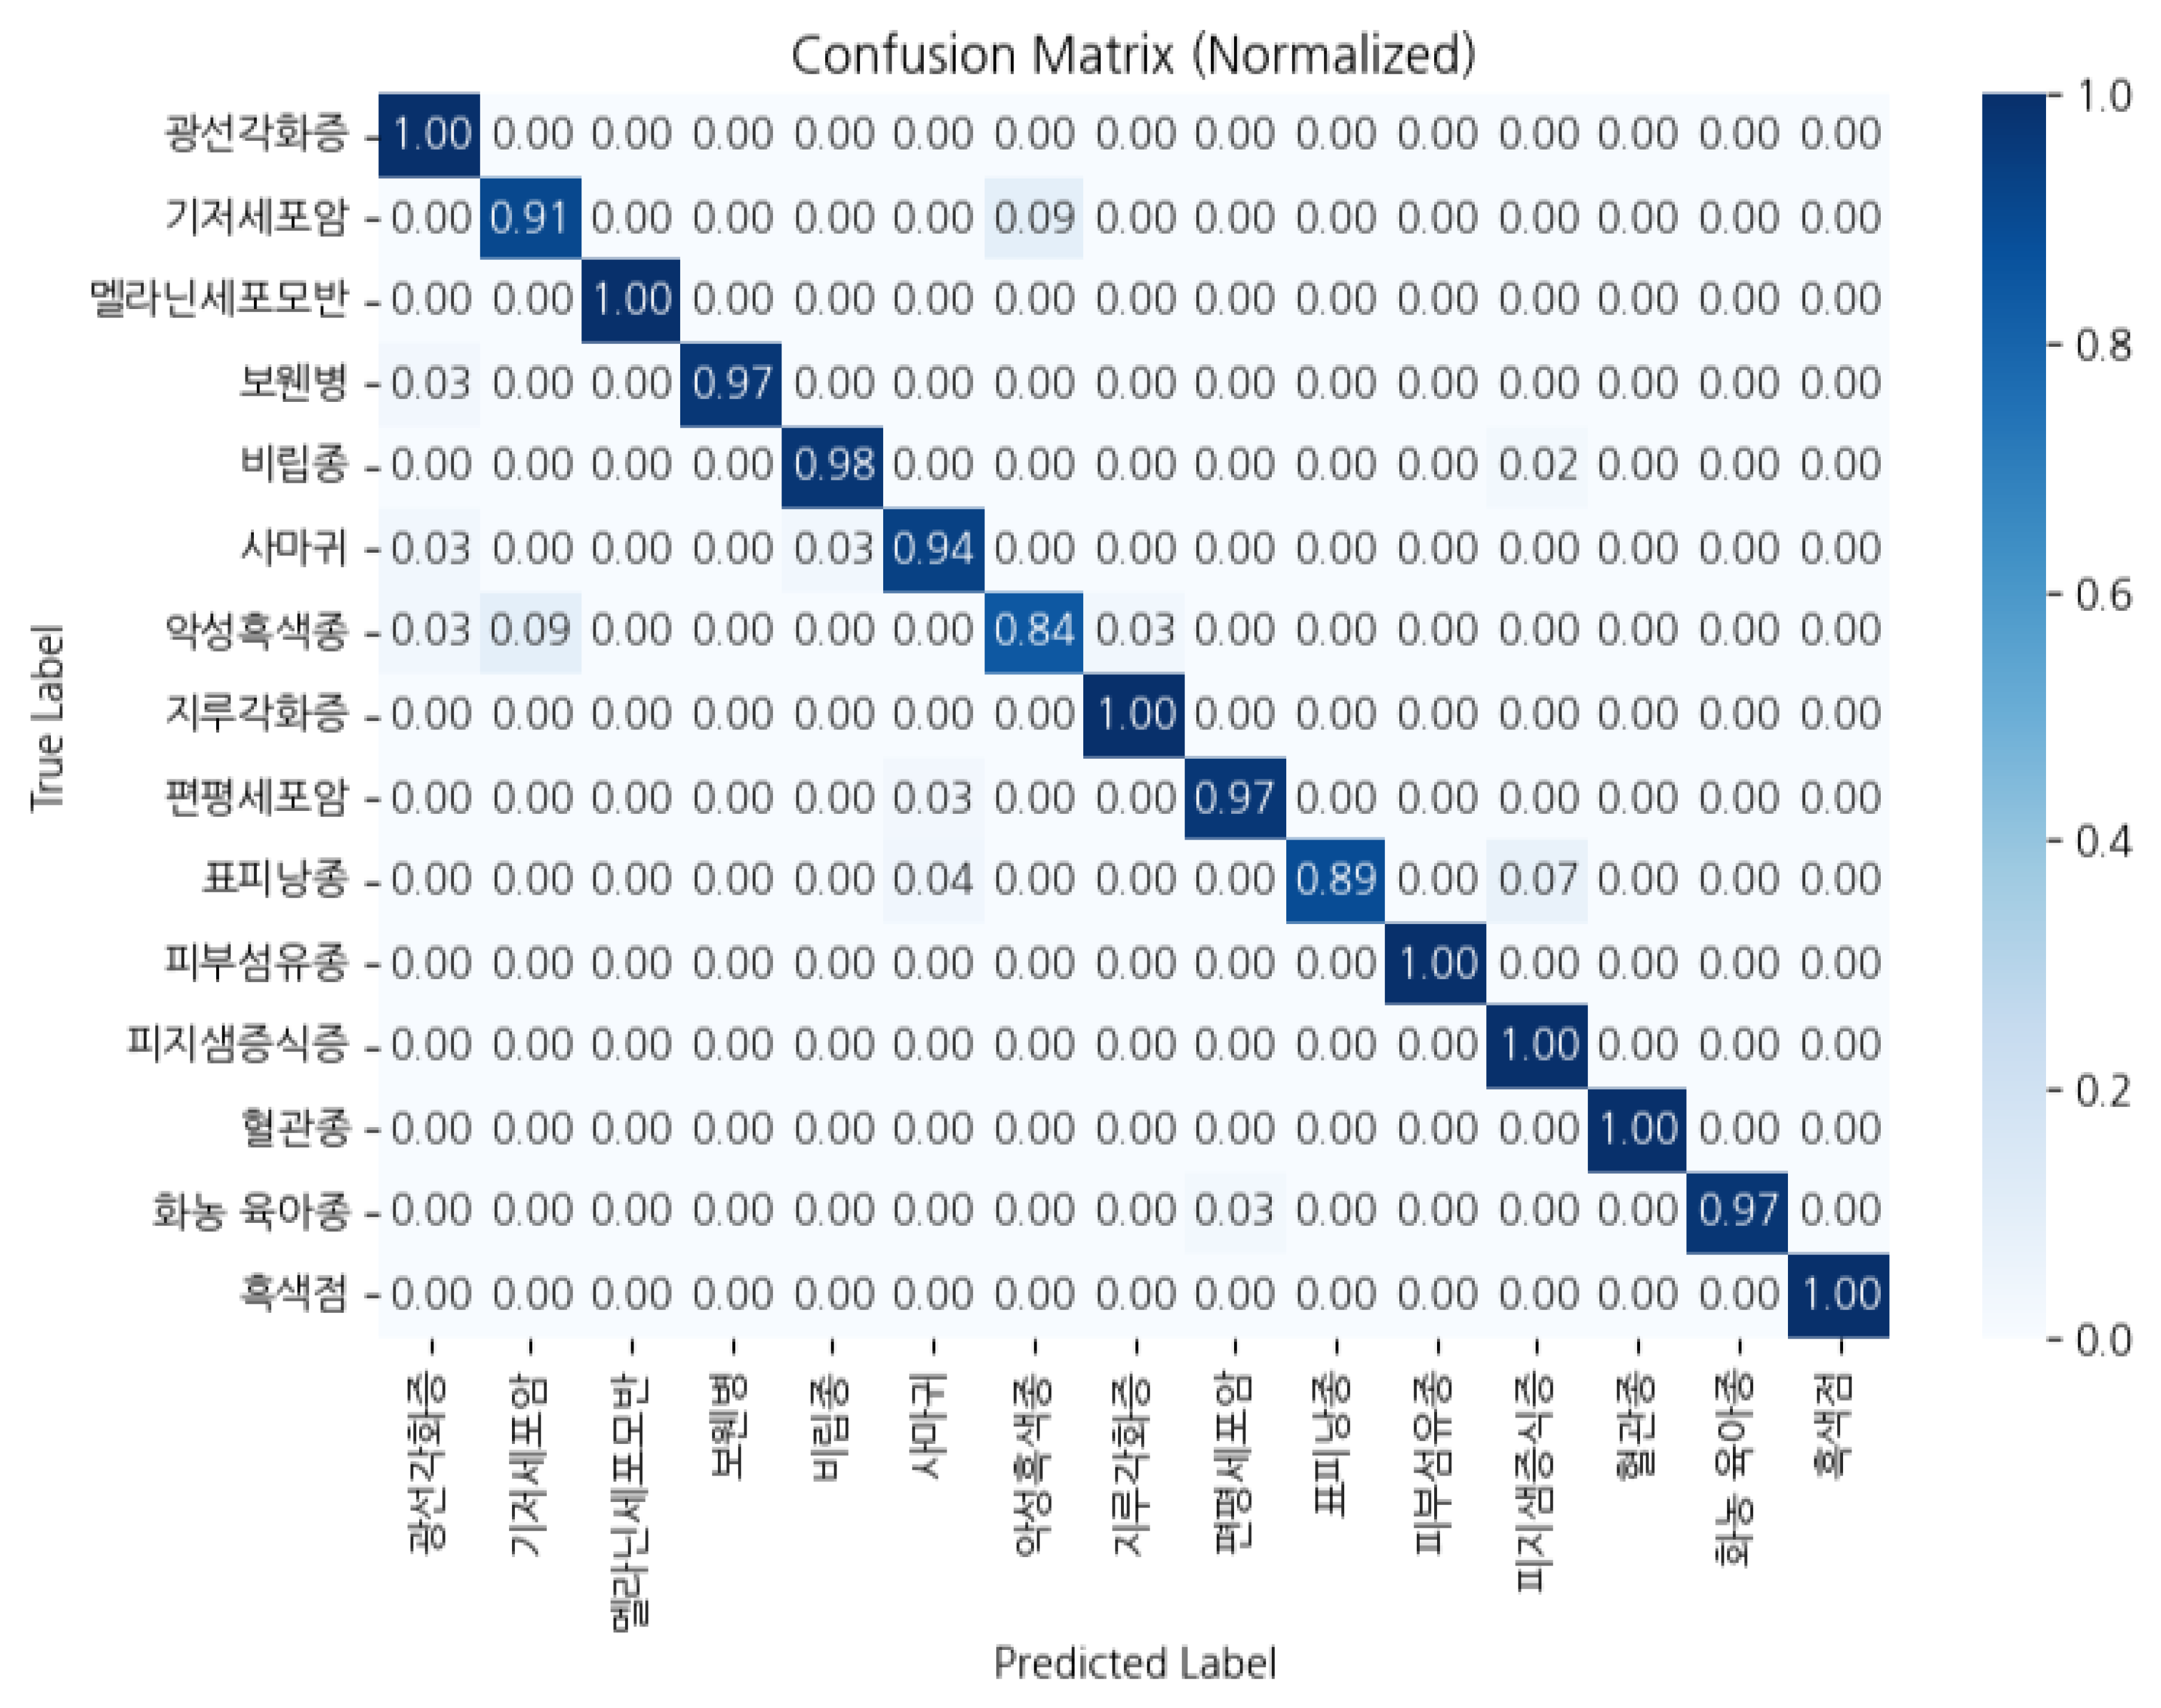
Figure 4.
Confusion Matrix of Group A Qwen 2.5 VL 7B.
7. Conclusions
In this study, we demonstrated that a multimodal vision–language model (VLM) can visually interpret dermatologic images and perform both classification and explanatory reasoning simultaneously. The proposed model was fine-tuned using LoRA on a synthetic skin-lesion dataset, achieving stable performance even under resource-constrained conditions. It achieved strong results across major evaluation metrics—including accuracy, precision, recall, and F1-score—indicating that a lightweight multimodal model can serve as a viable foundation for primary skin disease classification and explainable artificial intelligence (XAI) systems.
8. Limitations
Due to constraints of the publicly available synthetic dataset, this study was limited to classification across 15 skin disease categories. Moreover, all images consisted of close-up lesion photography, which does not fully capture variations in lighting, angle, and resolution encountered in real clinical environments. The absence of normal skin images further limited the model’s ability to generalize. Additionally, because the proposed confidence score is derived from relative probability, improvements are needed before it can be considered clinically reliable.
9. Future Research Directions
Future work will expand the dataset to include facial lesions, whole-body dermatologic presentations, and more diverse imaging scenarios, thereby broadening the model’s applicability. We also plan to develop improved confidence-scoring methods capable of more precisely quantifying model uncertainty and validate them against clinical expert assessments. Through these advancements, the multimodal VLM-based skin disease classification system proposed in this study is expected to mature into a solution that can be feasibly utilized in real-world clinical settings.
Abbreviations
The following abbreviations are used in this manuscript:
| VLM | Vision–Language Model |
| LLM | Large Language Model |
| QLoRA | Quantized Low-Rank Adaptation |
| XML | Extensible Markup Language |
| GPU | Graphics Processing Unit |
| ACC | Accuracy |
| PRC | Precision |
| REC | Recall |
| F1 | F1-Score |
References
- Esteva, Andre, et al. "Dermatologist-level classification of skin cancer with deep neural networks." nature 542.7639 (2017): 115-118. [CrossRef]
- Brinker, Titus J., et al. "Deep learning outperformed 136 of 157 dermatologists in a head-to-head dermoscopic melanoma image classification task." European Journal of Cancer 113 (2019): 47-54. [CrossRef]
- Vaswani, Ashish, et al. "Attention is all you need." Advances in neural information processing systems 30 (2017).
- Radford, Alec, et al. "Learning transferable visual models from natural language supervision." International conference on machine learning. PmLR, 2021.
- Sellergren, Andrew, et al. "Medgemma technical report." arXiv preprint arXiv:2507.05201 (2025).
- Li, Chunyuan, et al. "Llava-med: Training a large language-and-vision assistant for biomedicine in one day." Advances in Neural Information Processing Systems 36 (2023): 28541-28564.
- Ester, Martin, et al. "A density-based algorithm for discovering clusters in large spatial databases with noise." kdd. Vol. 96. No. 34. 1996.
- Krizhevsky, Alex, Ilya Sutskever, and Geoffrey E. Hinton. "Imagenet classification with deep convolutional neural networks." Advances in neural information processing systems 25 (2012).
- He, Kaiming, et al. "Deep residual learning for image recognition." Proceedings of the IEEE conference on computer vision and pattern recognition. 2016. (pp. 770-778).
- Russakovsky, Olga, et al. "Imagenet large scale visual recognition challenge." International journal of computer vision 115.3 (2015): 211-252. [CrossRef]
- Dosovitskiy, Alexey, et al. "An image is worth 16x16 words: Transformers for image recognition at scale." arXiv preprint arXiv:2010.11929 (2020).
- Zhai, Xiaohua, et al. "Sigmoid loss for language image pre-training." Proceedings of the IEEE/CVF international conference on computer vision. 2023.
- Liu, Haotian, et al. "Visual instruction tuning." Advances in neural information processing systems 36 (2023): 34892-34916.
- Kim, Young Jae, et al. "Augmenting the accuracy of trainee doctors in diagnosing skin lesions suspected of skin neoplasms in a real-world setting: A prospective controlled before-and-after study." PLoS One 17.1 (2022): e0260895. [CrossRef]
- Farooq, Muhammad Ali, et al. "Derm-t2im: Harnessing synthetic skin lesion data via stable diffusion models for enhanced skin disease classification using vit and cnn." 2024 46th Annual International Conference of the IEEE Engineering in Medicine and Biology Society (EMBC). IEEE, 2024.
- Zhao, Chen, et al. "Dermoscopy image classification based on StyleGAN and DenseNet201." Ieee Access 9 (2021): 8659-8679. [CrossRef]
- Bridle, John S. "Probabilistic interpretation of feedforward classification network outputs, with relationships to statistical pattern recognition." Neurocomputing: Algorithms, architectures and applications. Berlin, Heidelberg: Springer Berlin Heidelberg, 1990. 227-236.
- Hinton, Geoffrey, Oriol Vinyals, and Jeff Dean. "Distilling the knowledge in a neural network." arXiv preprint arXiv:1503.02531 (2015).
- Huerta-Enochian, Mathew, and Seung Yong Ko. "Instruction Fine-Tuning: Does Prompt Loss Matter?." arXiv preprint arXiv:2401.13586 (2024).
- Dettmers, Tim, et al. "Qlora: Efficient finetuning of quantized llms." Advances in neural information processing systems 36 (2023): 10088-10115.
- U.S. National Cancer Institute(NCI)’s Surveillance, Epidemiology and End Results (SEER) Program https://training.seer.cancer.gov/melanoma/intro/survival.html https://training.seer.cancer.gov/melanoma/abstract-code-stage/staging.html.
- Najungim et al. “Synthetic Skin Tumor Image Dataset.” AI Hub (constructed as part of the “Intelligent Information Industry Infrastructure Development” project supported by the Ministry of Science and ICT and the National Information Society Agency of Korea).
Figure 1.
Example synthetic image of malignant melanoma from the AI-Hub skin-tumor dataset.
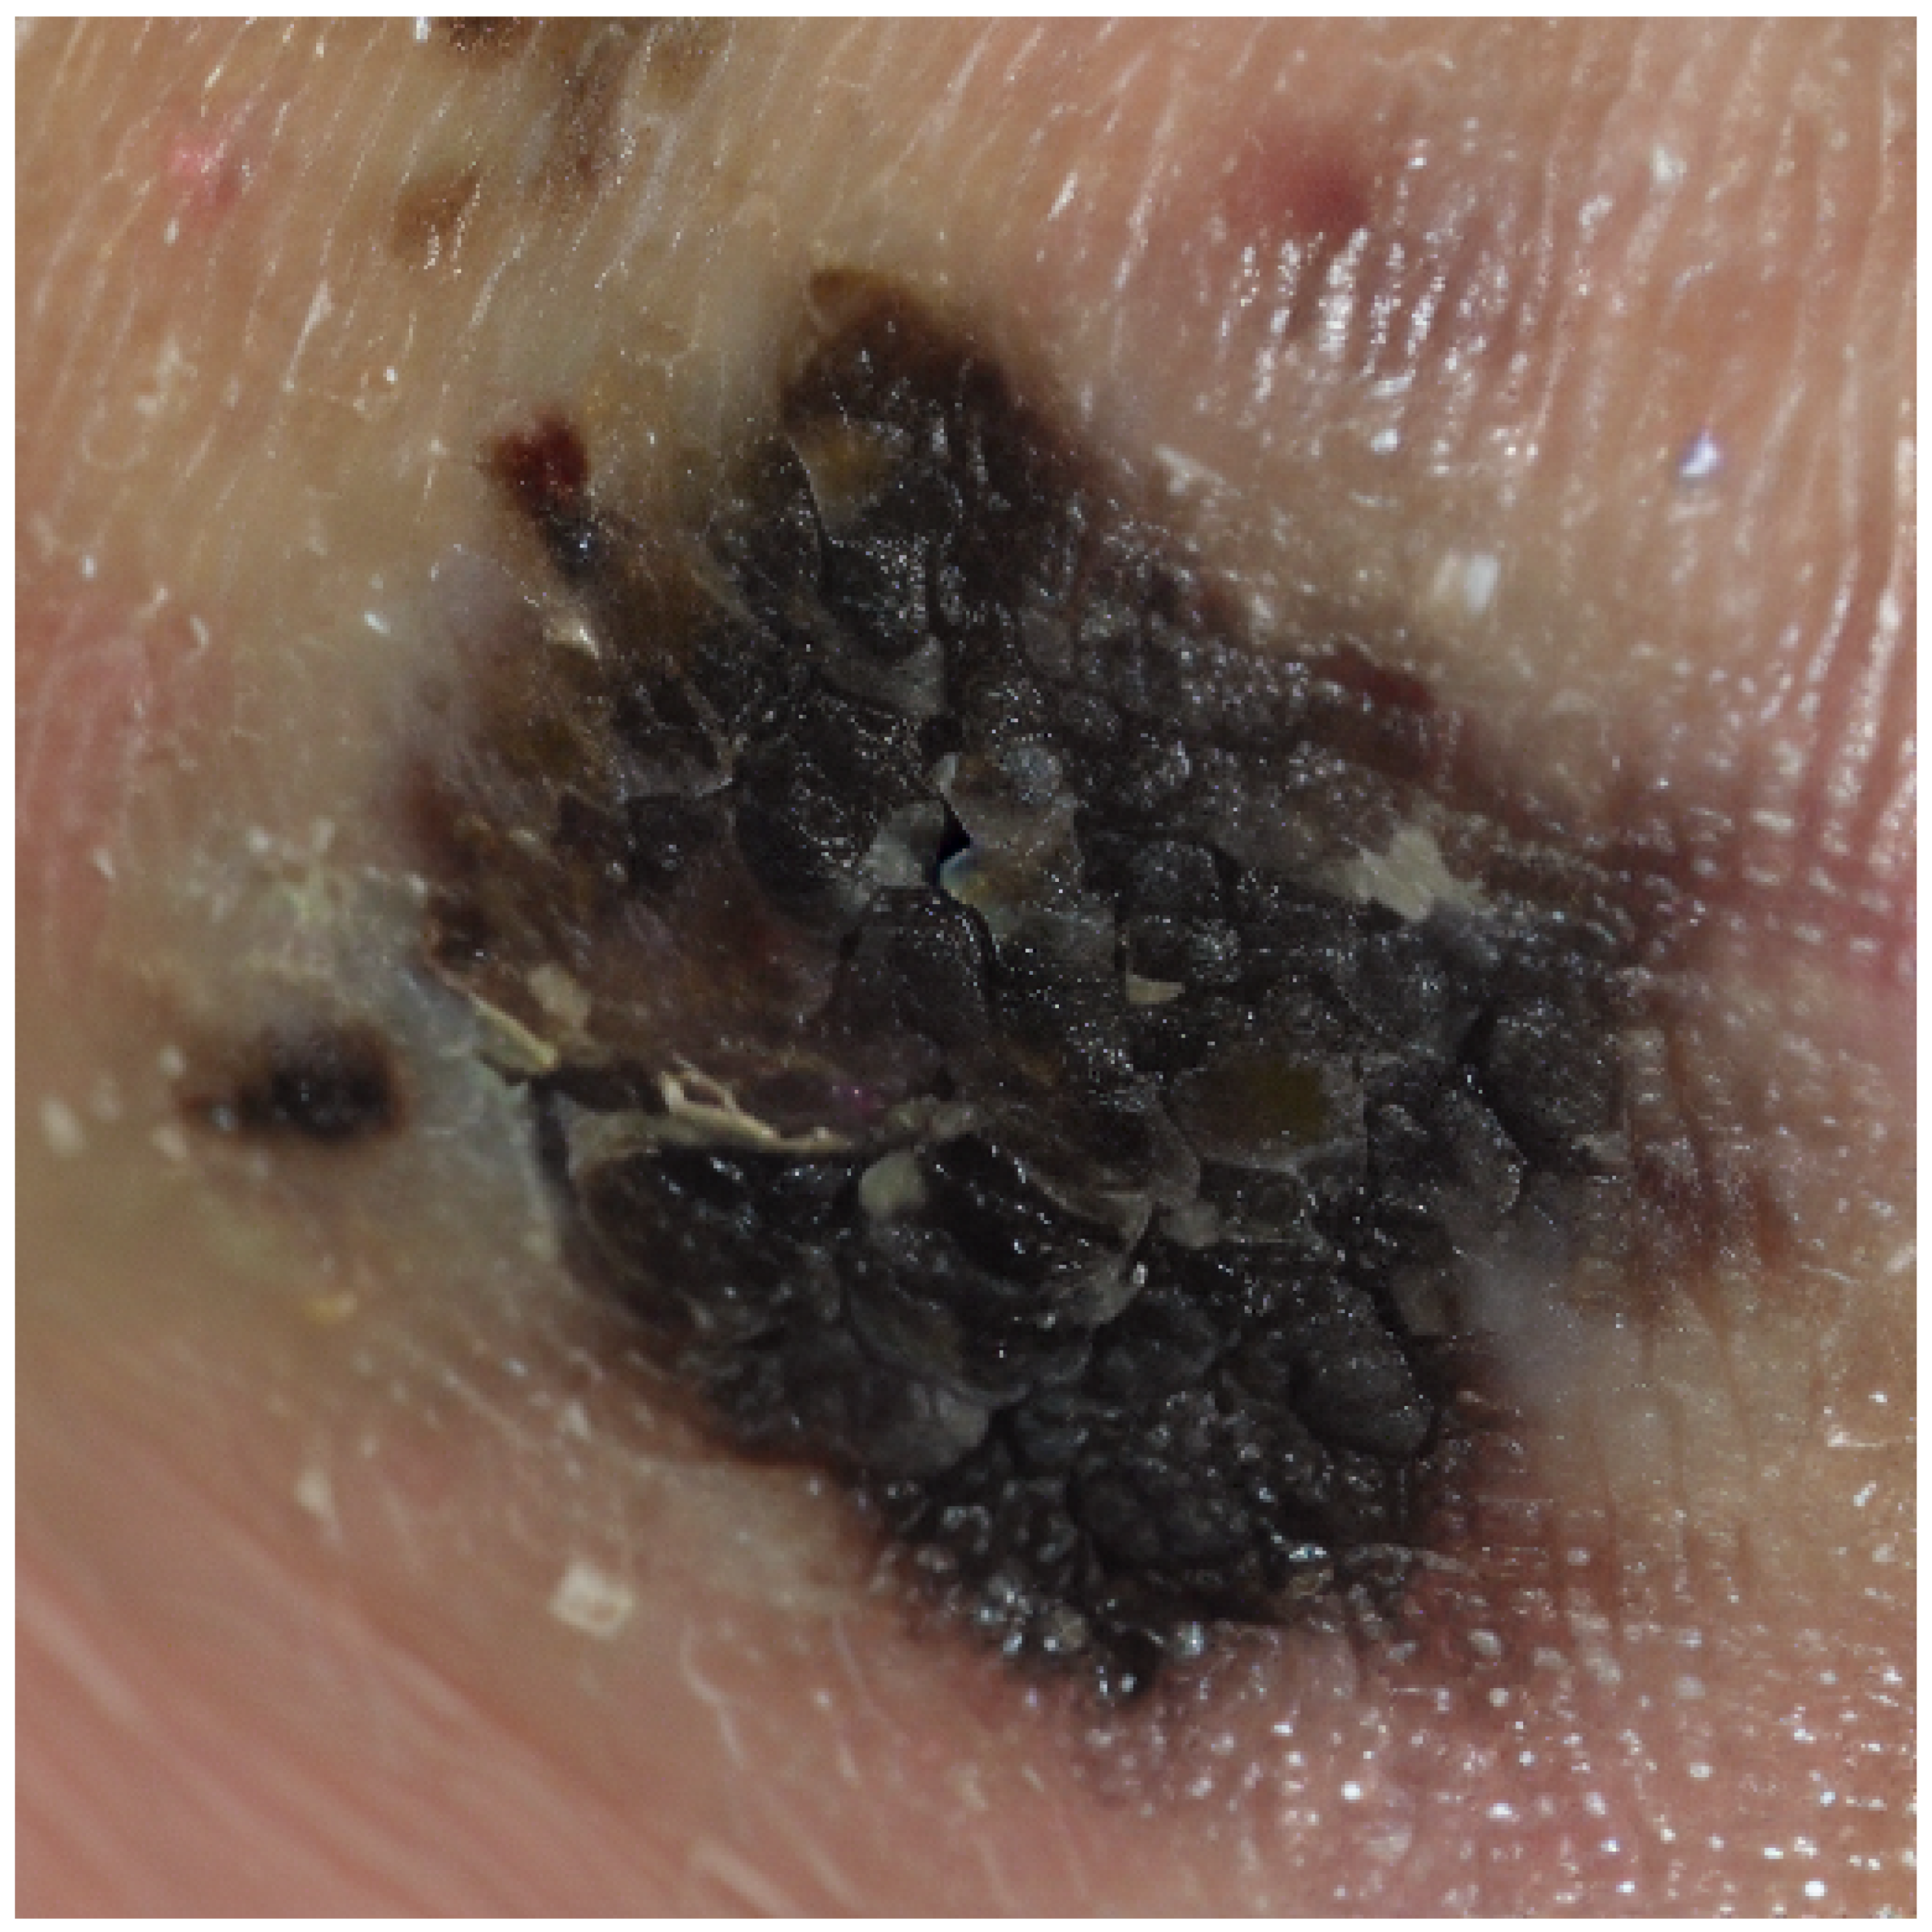
Figure 3.
wandb eval/loss Graph.
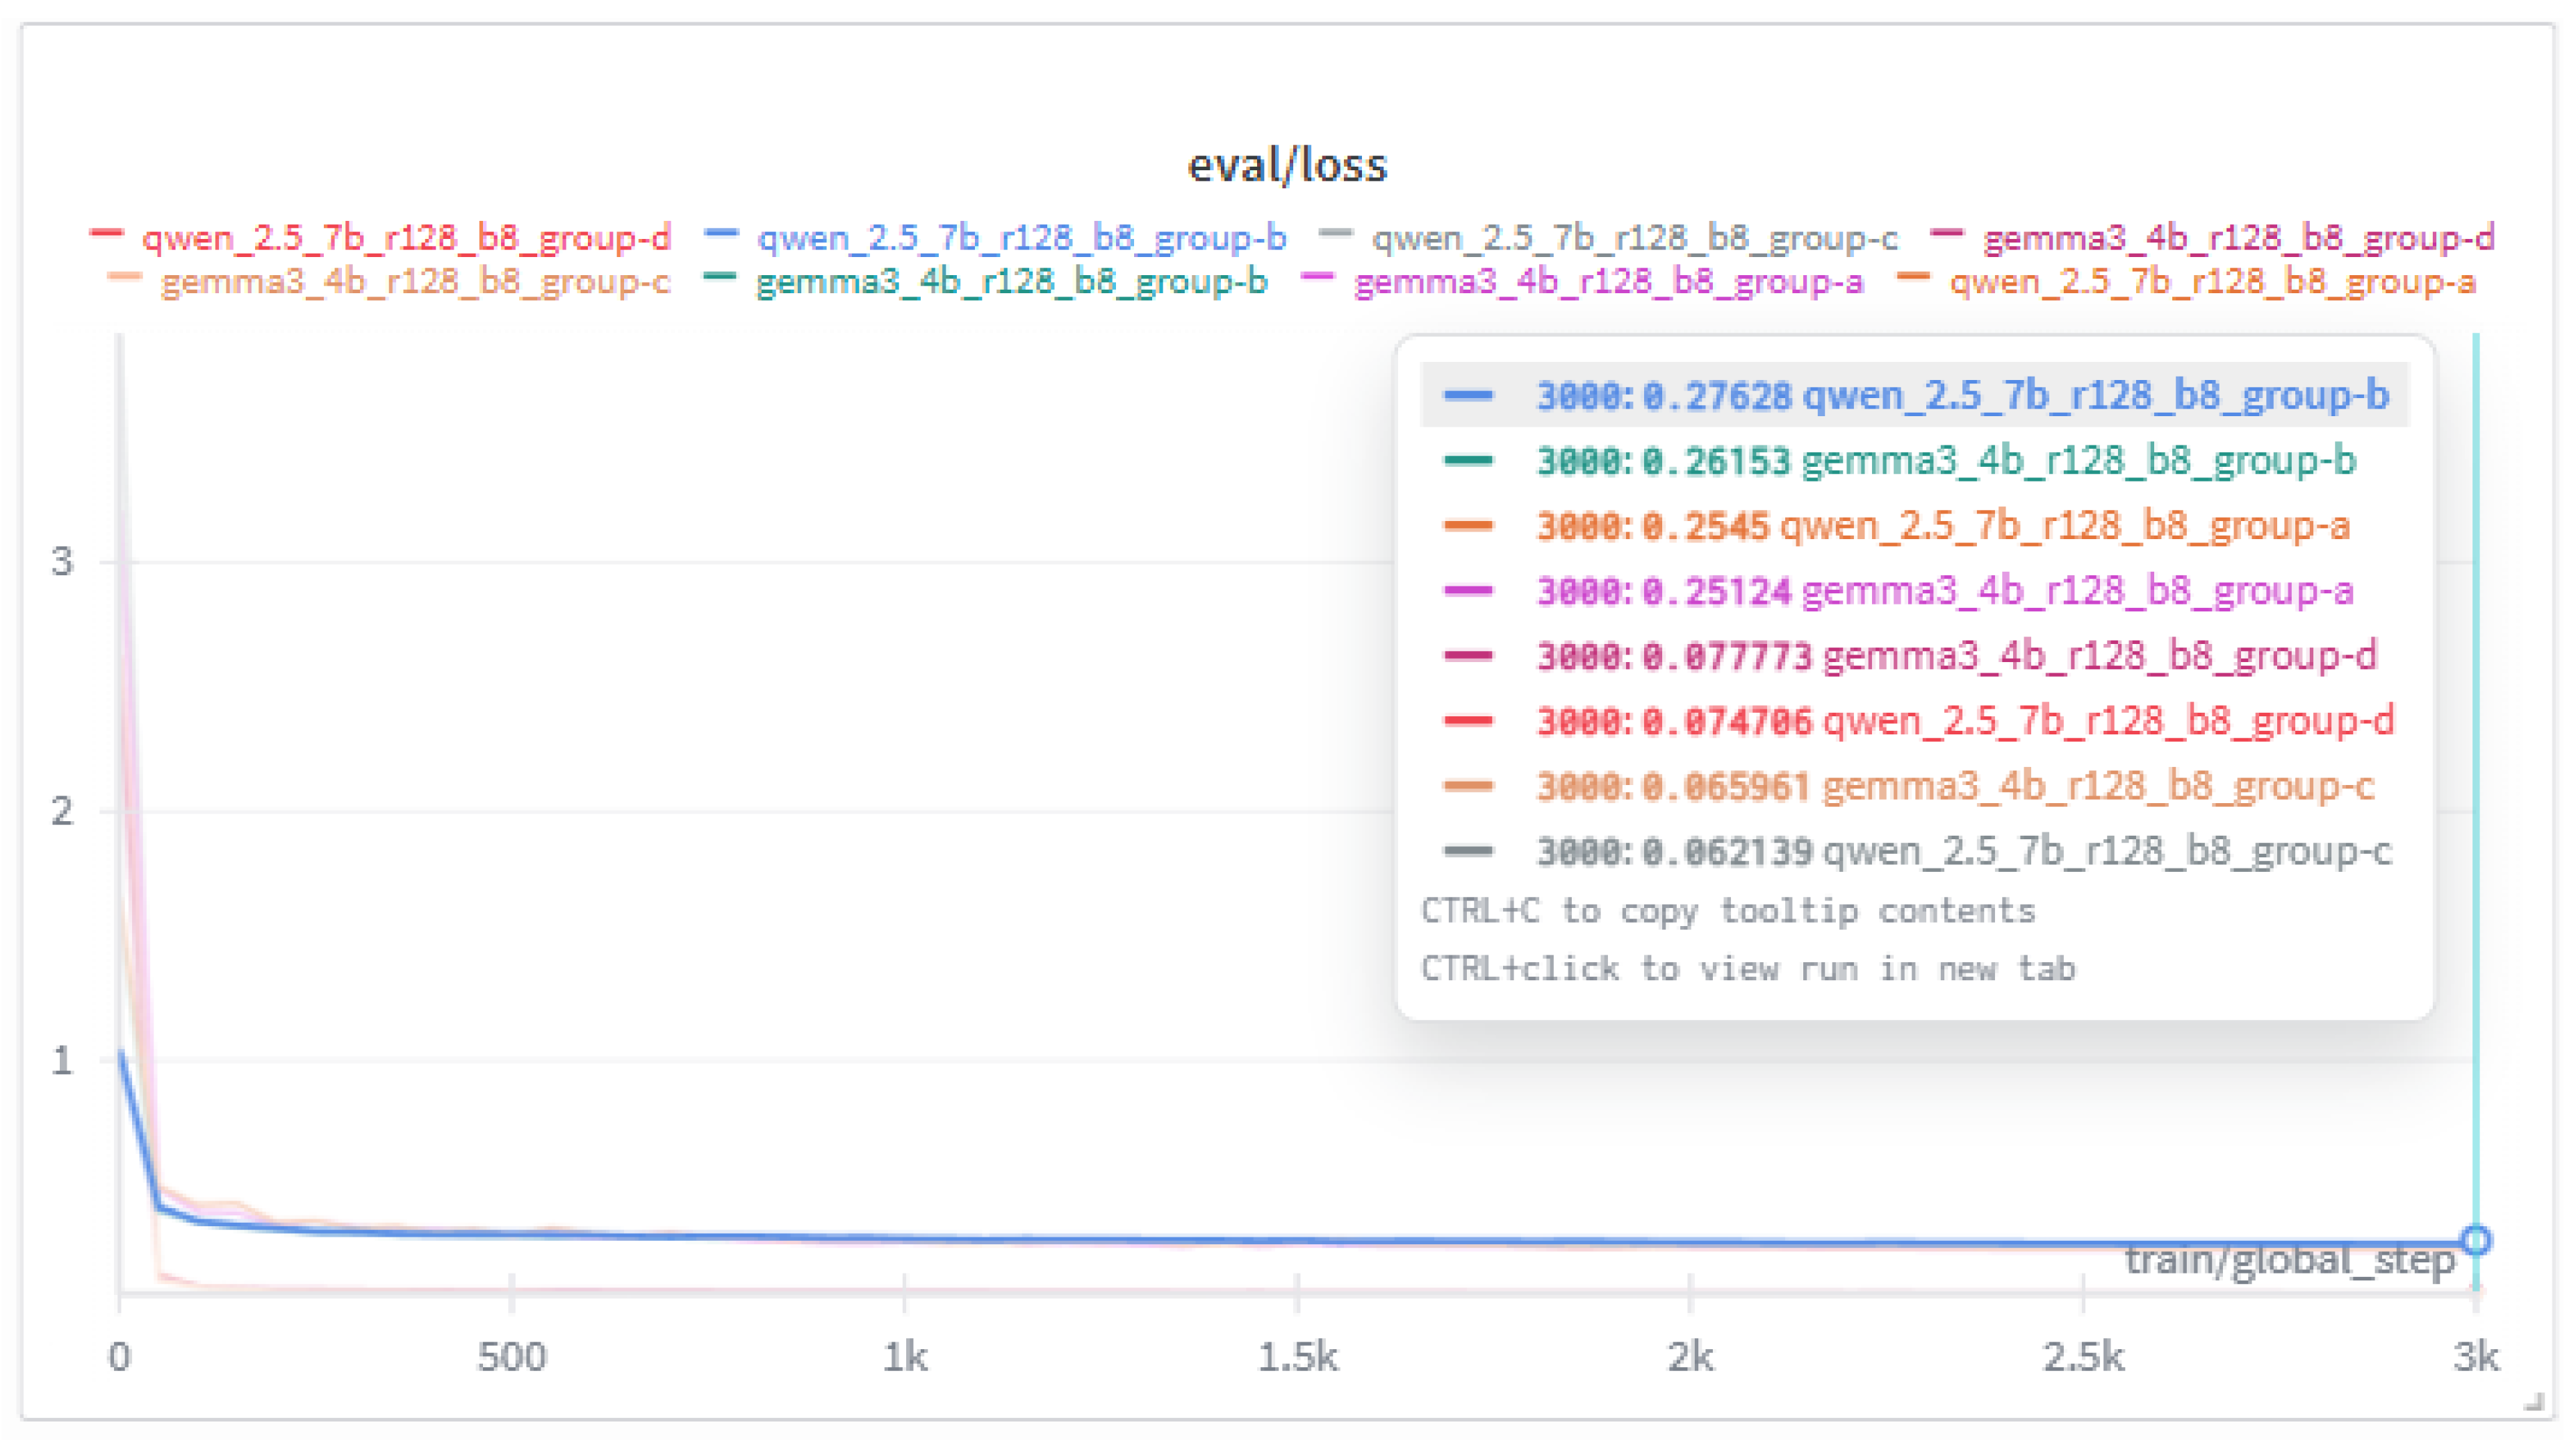
Table 1.
Stage-specific 5-year relative survival rate for melanoma.
| Stage at Diagnosis | 5-Year Relative Survival Rate | Description |
|---|---|---|
| Stage 0 | 100% | Tumor cells confined to the epidermis only. |
| Stage I-II (Localized) | 97.6% | Tumor thickness (Breslow depth) . |
| Stage III (Regional) | 60.3% | tumor thickness (Breslow depth) with regional lymph node involvement. |
| Stage IV (Distant) | 16.2% | Distant metastasis to other organs. |
Table 2.
Example of Korean JSON annotation and its English translation.
| Korean Original (JSON) | English Translation (JSON) |
|---|---|
|
{ "annotations": [ { "identifier": "Z4_2051_P0_L0", "diagnosis_info": { "diagnosis_name": "악성흑색종", "desc": "멜라닌세포의 악성 종양으로 진단을 위해 조직검사가 필요함" }, "generated_parameters": { ... }, "photograph": { ... }, "bbox": { ... } } ] } |
{ "annotations": [ { "identifier": "Z4_2051_P0_L0", "diagnosis_info": { "diagnosis_name": "Malignant melanoma", "desc": "Malignant tumor of melanocytes; biopsy is required for definitive diagnosis." }, "generated_parameters": { ... }, "photograph": { ... }, "bbox": { ... } } ] } |
Table 5.
Generated disease description
| Korean Original Output | English-Translated Output |
|---|---|
|
<label>악성흑색종</label> <summary> 이미지에서 보이는 병변은 비균일한 검정과 갈색의 혼합색상을 지니며, 경계가 불규칙한 특징을 보입니다. 이러한 비대칭성과 색상 변화는 악성흑색종의 전형적인 특징입니다. 이 병변은 빠른 크기 증가와 색 변화 가능성을 내포하고 있으며, 림프절 및 전신으로 전이될 위험이 있습니다. 조기에 발견할수록 생존율이 높지만, 진행된 경우 예후는 불량할 수 있습니다. </summary> |
<label>Malignant Melanoma</label> <summary> The lesion observed in the image exhibits an uneven mixture of black and brown pigmentation with irregular borders. Such asymmetry and color variation are characteristic features of malignant melanoma. The lesion carries the potential for rapid growth and pigment changes and poses a risk of metastasis to the lymph nodes and distant organs. Early detection is associated with a high survival rate, whereas advanced stages may result in a poor prognosis. </summary> |
Table 6.
Top 5 cosine similarity example (Melanocytic Nevus).
| Korean Original | English Translation |
|---|---|
|
[(’멜라닌세포모반’, 0.9672727286892795), (’피부섬유종’, 0.8325640355322497), (’지루각화증’, 0.8229875053707825), (’흑색점’, 0.803708897289274), (’표피낭종’, 0.7775588886435125)] |
[(’Melanocytic Nevus’, 0.9672727286892795), (’Dermatofibroma’, 0.8325640355322497), (’Seborrheic Keratosis’, 0.8229875053707825), (’Lentigo’, 0.803708897289274), (’Epidermal Inclusion Cyst’, 0.7775588886435125)] |
Table 7.
Final output format example (Actinic Keratosis).
| Korean Original Output | English-Translated Output |
|---|---|
|
<root> <label id_code="0" score="67.6">광선각화증</label> <summary>이미지에서는 자외선 노출이 많은 부위인 얼굴에 붉은색의 각질성 반점이 관찰됩니다. 이는 만성 자외선 노출로 인한 DNA 손상으로 발생하며, 장기간 방치할 경우 피부암, 특히 편평세포암으로의 진행 가능성이 있습니다. 병변의 진행 속도가 느릴 수 있으나, 조기 발견 시 적절한 치료를 통해 예후를 양호하게 할 수 있습니다.</summary> <similar_labels> <similar_label id_code="3" score="16.6">보웬병</similar_label> <similar_label id_code="1" score="5.7">기저세포암</similar_label> </similar_labels> </root> |
<root> <label id_code="0" score="67.6">Actinic Keratosis</label> <summary>In the image, erythematous, scaly macules are observed on a sun-exposed area of the face. These lesions result from chronic ultraviolet-induced DNA damage and, if left untreated, may progress to skin cancer, particularly squamous cell carcinoma. Although progression may be slow, early detection and appropriate management can lead to favorable outcomes.</summary> <similar_labels> <similar_label id_code="3" score="16.6">Bowen’s Disease</similar_label> <similar_label id_code="1" score="5.7">Basal Cell Carcinoma</similar_label> </similar_labels> </root> |
Table 8.
Training models, groups, and hyperparameters.
| Model | Rank | Grp. | Steps | LR |
|---|---|---|---|---|
| qwen2.5-vl-7b | 128 | A | 3000 | 5e-5 |
| gemma3-4b | 128 | A | 3000 | 5e-5 |
| qwen2.5-vl-7b | 128 | B | 3000 | 5e-5 |
| gemma3-4b | 128 | B | 3000 | 5e-5 |
| qwen2.5-vl-7b | 128 | C | 3000 | 5e-5 |
| gemma3-4b | 128 | C | 3000 | 5e-5 |
| qwen2.5-vl-7b | 128 | D | 3000 | 5e-5 |
| gemma3-4b | 128 | D | 3000 | 5e-5 |
Table 9.
Differences in datasets across groups.
| Group | Input | Output | Note |
|---|---|---|---|
| A | X | O | Classification-focused transformation |
| B | X | O | Original output preserved |
| C | O | O | Classification-focused transformation |
| D | O | O | Original output preserved |
Table 11.
Classification-focused output transformation (1).
| Korean Original | English Translation |
|---|---|
|
<|im_start|>user 진단병명만 말해. <|vision_start|> <|image_pad|> <|vision_end|> <|im_end|> <|im_start|>assistant 피지샘증식증<|im_end|> |
<|im_start|>user State only the diagnosis. <|vision_start|> <|image_pad|> <|vision_end|> <|im_end|> <|im_start|>assistant Sebaceous Hyperplasia<|im_end|> |
Table 12.
Classification-focused output transformation (2).
| Korean Original | English Translation |
|---|---|
|
<|im_start|>user 0: 광선각화증 1: 기저세포암 2: 멜라닌세포모반 3: 보웬병 4: 비립종 5: 사마귀 6: 악성흑색종 7: 지루각화증 8: 편평세포암 9: 표피낭종 10: 피부섬유종 11: 피지샘증식증 12: 혈관종 13: 화농 육아종 14: 흑색점 <|vision_start|> <|image_pad|> <|vision_end|> <|im_end|> <|im_start|>assistant 11<|im_end|> |
<|im_start|>user 0: Actinic Keratosis 1: Basal Cell Carcinoma 2: Melanocytic Nevus 3: Bowen’s Disease 4: Milia 5: Verruca Vulgaris 6: Malignant Melanoma 7: Seborrheic Keratosis 8: Squamous Cell Carcinoma 9: Epidermal Inclusion Cyst 10: Dermatofibroma 11: Sebaceous Hyperplasia 12: Hemangioma 13: Pyogenic Granuloma 14: Lentigo Simplex <|vision_start|> <|image_pad|> <|vision_end|> <|im_end|> <|im_start|>assistant 11<|im_end|> |
Table 13.
Key Hyperparameters.
|
lora_rank = 128, lora_alpha = 128, per_device_train_batch_size = 8, gradient_accumulation_steps = 1, warmup_steps = 5, max_steps = 3000, learning_rate = 5e-5, logging_steps = 1, eval_strategy ="steps", eval_on_start = True, eval_steps = 50, optim = "adamw_8bit", weight_decay = 0.01, lr_scheduler_type = "cosine", output_dir = "outputs", report_to = "wandb", save_total_limit = 3, max_grad_norm = 5.0, |
Table 14.
Evaluation results by model and group after training.
| Grp. | Model | Acc | Prc | Rec | F1 |
|---|---|---|---|---|---|
| A | qwen2.5 | .966 | .9665 | .966 | .9657 |
| A | gemma3 | .980 | .9824 | .980 | .9809 |
| B | qwen2.5 | .972 | .9723 | .972 | .9717 |
| B | gemma3 | .966 | .9679 | .966 | .9654 |
| C | qwen2.5 | .968 | .9681 | .968 | .9677 |
| C | gemma3 | .980 | .9804 | .980 | .9799 |
| D | qwen2.5 | .970 | .9702 | .970 | .9697 |
| D | gemma3 | .946 | .9525 | .946 | .9441 |
Table 15.
Training and evaluation loss after 3000 steps.
| Grp. | Model | Steps | Train/Loss | Eval/Loss |
|---|---|---|---|---|
| A | qwen2.5 | 3000 | .3256 | .2545 |
| A | gemma3 | 3000 | .3123 | .2512 |
| B | qwen2.5 | 3000 | .2889 | .2763 |
| B | gemma3 | 3000 | .2899 | .2615 |
| C | qwen2.5 | 3000 | .0923 | .0621 |
| C | gemma3 | 3000 | .0968 | .0660 |
| D | qwen2.5 | 3000 | .0898 | .0747 |
| D | gemma3 | 3000 | .0913 | .0778 |
Disclaimer/Publisher’s Note: The statements, opinions and data contained in all publications are solely those of the individual author(s) and contributor(s) and not of MDPI and/or the editor(s). MDPI and/or the editor(s) disclaim responsibility for any injury to people or property resulting from any ideas, methods, instructions or products referred to in the content. |
© 2025 by the authors. Licensee MDPI, Basel, Switzerland. This article is an open access article distributed under the terms and conditions of the Creative Commons Attribution (CC BY) license (http://creativecommons.org/licenses/by/4.0/).
Copyright: This open access article is published under a Creative Commons CC BY 4.0 license, which permit the free download, distribution, and reuse, provided that the author and preprint are cited in any reuse.


