Introduction
Craving may be defined as psychological and/or physiological motivational states that promote substance-seeking and ingestive behaviours (Baker, Morse, & Sherman, 1986), while food craving emphasizes on being an intense desire or urge towards consumption of a specific food type (Gendall, Joyce, & Sullivan, 1997; Weingarten & Elston, 1991). Food craving encompasses various experiences which include strong urges for seeking and consumption of food, intrusive thoughts and imagery of foods, perception of poor self-control for food consumption, and anticipation of positive and/or negative reinforcement when food is consumed (Cepeda-Benito et al., 2000; Dalton, Finlayson, Hill, & Blundell, 2015; Weingarten & Elston, 1990). Tiffany’s cognitive model of drug use and craving (Tiffany, 1990) proposed that cravings are based on automatic learned action schemata which are stimulus-bound and supported by nonautomatic cognitive processes. Consequently, cravings can be understood as sensory outcomes of automatic processes already running when initiated by cues, and/or emotions and thoughts (Kemps, Tiggemann, & Grigg, 2008).
Food craving is particularly frequent with high palatable foods containing high energy density containing high levels of sugars and/or fat (Polk, Schulte, Furman, & Gearhardt, 2017). While state craving is regularly experienced by people without eating disorders (Garcia & Hormes, 2024; Kemps & Tiggemann, 2013; Pelchat, Johnson, Chan, Valdez, & Ragland, 2004), high trait craving is associated with eating disorder pathology (Chao, Grilo, & Sinha, 2016; Dalton et al., 2015; Meule & Kubler, 2014).
Visual experiences and smells can be potent food cues strongly inducing food craving (Kanoski & Boutelle, 2022). However, the reactivity to food cues depends on physiological states i.e., hunger and satiety (Stice, Burger, & Yokum, 2013) and emotional states i.e., stress (Adam & Epel, 2007; Jastreboff et al., 2013), as well as showing circadian reactivity (Pelchat, 1997; Reichenberger et al., 2018). Moreover, heightened food cue reactivity is associated with eating disorders and obesity (Boswell & Kober, 2016). Food cravings are suggested to be strongly connected with the dopamine system (Volkow, Wise, & Baler, 2017) in brain areas for reward and incentive salience (Berridge, 2012). Functional magnetic resonance imaging (fMRI) findings reported that perception of cravings relate to activation of the hippocampus, insula, and caudate areas with using a paradigm initiating thoughts of favourite foods (Pelchat et al., 2004). A systematic review and meta-analysis of blood oxygen level dependent (BOLD) responses to visual food cues pointed towards increased activation of reward-related brain areas including the insula and orbitofrontal cortex in participants with obesity. Moreover, fasted healthy weight participants showed activation of striatum, insula, and orbitofrontal cortex, presumed to process reward and stimulus salience (Garcia-Garcia et al., 2013; Huerta, Sarkar, Duong, Laird, & Fox, 2014; Kanoski & Boutelle, 2022; Pursey et al., 2014).
Reduction of state food craving is generally connected with physiological responses to an increase of nutrient availability in the gastrointestinal tract, and concomitant decrease of ghrelin, increase in intestinal hormones (i.e., GLP-1, PYY, CCK) (Neary, Goldstone, & Bloom, 2004), and postabsorptive changes of nutrients in blood (i.e., glucose and insulin response, (Kroemer, Krebs, Kobiella, Grimm, Vollstadt-Klein, et al., 2013) and hormones, i.e. insulin, amylin (Garutti et al., 2025). Moreover, vagal responses in connection with pressure/tension changes in the gastrointestinal tract (Tack et al., 2021), as well as nutrient sensing (Sundaresan et al., 2023) and metabolic response to absorbed nutrients (Veldhuizen et al., 2017) were reported with craving reduction. These alterations provide negative feedback integrated in the hypothalamus (Heisler & Lam, 2017) and brain stem (Berthoud, 2008; Chambers, Sandoval, & Seeley, 2013), moreover, nutrient and hormonal receptors are also reported in areas which are known to be connected with hedonic responses in several brain areas (Campos, Port, & Acosta, 2022; de Araujo, Schatzker, & Small, 2020).
However, the contribution of taste, or more correctly flavour, in relation to craving response and appetite/satiety is ambiguous (Lasschuijt, de Graaf, & Mars, 2021). Flavour is thought to be the first signal of receipt of nutrients and could be one of the early signals which act as negative feedback to cravings (Aitken et al., 2024) with afferent signals towards various brain areas including striatum, insula, hypothalamus and others (Han, Bagenna, & Fu, 2019), besides of initiating preparatory responses for ingestion and digestion of food during the cephalic phase (Smeets, Erkner, & de Graaf, 2010). Sweet taste signalling is suggested to be important regulator for appetite and food intake (Han et al., 2019). Moreover, nutrients also bind to nutrient receptors in the more distal gastrointestinal tract after ingestion (Steinert & Beglinger, 2011) using vagal afferences and hormonal release as response modality (Poppitt et al., 2017). Besides establishing negative feedback (i.e., glucose sensing neurons in the hypothalamus (Burdakov, Luckman, & Verkhratsky, 2005) nutrient receptors have been also suggested with learning of rewards (McKnight & Alhadeff, 2025; Sclafani & Ackroff, 2012). Palatable foods, as well as foods which are not palatable and need to be digested before receptor active nutrients being released, should be able to inform about energy content of foods and enable reinforcement of rewards/energy content for learning processes (de Araujo et al., 2020). As example, blood glucose levels are shown to impact food related decision making on various decision-making tasks (Orquin & Kurzban, 2016).
Consequently, it could be hypothesized that flavour/taste signals of the oral cavity might have a differential function compared with more distal nutrient sensing and responses. While the oral cavity signals are involved in food reward perception and learning, they may also set a prediction of energy content related to the taste experience. The more distal gastrointestinal receptors might enable the receipt of nutrients as well as reward/energy learning with postabsorptive responses further support processes.
The interaction between oro-sensory taste signals and more distal GI nutrient signals may be thought as a part of a regulatory cycle where visual cues together with taste sets a prediction for reward and energy receipt while ingestion and postabsorptive processes acting as extinction signal for the error signal perceived as cravings. Recent studies proposed that the connection of the former systems could lead to sensory-metabolic mismatch if as example non-nutritive sweeteners are used instead of sugars (Cogan & Cooper, 2024; Veldhuizen et al., 2017). Cogan and Cooper (Cogan & Cooper, 2024) investigated the effects of mouth rinse with sucrose, sucralose, maltodextrin, or water and measured appetite and appetite hormones thereafter, as well as buffet meal energy intake. While energy intake at buffet meal was not affected by the various mouth rinses, some hormonal responses were specific to the rinsed component. However, they did not compare effects to the ingestion of the rinsed components. Mouth rinse of other nutrients i.e., fatty acids reduced hunger ratings following a standard meal, suggesting that taste influences hunger perception following the ingestion of food (Costanzo, Russell, Lewin, & Keast, 2020). Moreover, Lauritsen et al. (Lauritsen et al., 2023) found no influence of oral ingestion of glucose compared with isoglycemic infusion on appetite and satiety, suggesting no contribution of flavour to former perceptions, while they did not perform mouth rinse. Veldhuizen et al. (Veldhuizen et al., 2017) investigated the effects of ingested combinations between tasteless carbohydrates, non-nutritive sweetener for producing various levels of sweetness with different caloric content on fMRI brain responses, liking ratings, as well as metabolic response. They revealed that metabolic responses provided a signal for encoding flavour cues with nutritional value in the mesolimbic reward system. Metabolic responses were shown to relate to sweet taste perception. They concluded that non-nutritive sweetener and sugar-beverages might disrupt normal physiological responses to carbohydrate, i.e. sensory-metabolic mismatches. However, in their work they did not perform mouth rinse trials for comparison. Moreover, Creze et al. (Creze et al., 2018) combined sugary, artificial sweetener and water drinks with a standardized meal and investigated brain response to viewing of food and intake. They found that a specific brain response to sugary drink complemented meal intake in the insula region with lower intake in an ad libitum meal, while the artificial sweetener complemented meal did not affect insula activation and ad libitum meal intake compared to water. Outcomes suggested to reflect initial stages of taste-calorie uncoupling in relation to artificial sweetener use. While former literature suggests important interactions between taste and nutrients for regulation of perceptual modalities guiding eating behaviour, outcomes are not building a coherent picture of mechanisms involved.
Based on current literature, more work is needed for understanding the interaction of flavour/taste and food cues for influencing food cravings with and without receipt of nutrients into the GI.
Food cravings can be assessed by various questionnaires (Taylor, 2019). In this study, we used the Food Carving Questionnaire State (FCQ-S) (Cepeda-Benito et al., 2000) for assessment of state food craving. The questionnaire measures several dimensions of food craving: in-the-moment intense desire to consume food, outcome expectancies of positive reinforcement and negative reinforcement from eating, anticipated lack of control overeating, and physiological states that may trigger craving. The construct validity of the FCQ-S was shown in connection with expected score alterations pre and post food intake (Cepeda-Benito, Fernandez, & Moreno, 2003; Cepeda-Benito et al., 2000). However, the use of Likert scales can potentially produce response bias due to the design of the scale, like central tendency bias and others (Westland, 2022). Therefore, we used handgrip force as a surrogate response measure for the FCQ-S statements. Handgrip forces were measured with a dynamometer in connection with FCQ-S statements where the level of force applied expressed the level of agreement to the questionnaire statements. The validation of the measure and comparison with the Likert scale responses are reported in the supplementary file. However, outcomes show that the use of handgrip force is a valid and a more sensitive measure of the FCQ-S responses compared with the Likert scale (see supplementary file).
For the investigation of an interaction between taste and food cues on food craving we used a randomised crossover design. 47 healthy individuals without eating disorders performed two experimental trials. During the first trial, fasted individuals were exposed to visual food cues and reported their level of food craving before and after the exposure of food cues using handgrip forces as a response modality for the level of agreement to FCQ-S statements (see supplementary file). This was followed by ingestion of a sugary drink, and, after a 25-minute period, individuals reported their craving levels again before and after the exposure of food cues. The second trial, consisted of the same process, however, the sugary drink was not ingested but the individuals repeatedly rinsed the mouth with the sugary drink without ingestion which was followed by drinking the same volume of water as being used for the sugary drink in the first trial. Over a period of 14 days, with inclusion of the two experimental trials, continuous interstitial glucose monitoring was performed using a glucose sensor inserted into the upper arm. This enabled assessing interstitial glucose measurements during trials as well as monitoring glucose alterations over the whole 14 days period as a proxy measure for sugar/carbohydrate intake on the daytime period after the trials and beyond. In addition, on a further visit to the lab, one blood sample for leptin measurement was performed due to its major importance for energy balance regulation (Obradovic et al., 2021; Vilarino-Garcia et al., 2024) and influencing taste response in the hypothalamus (Aitken et al., 2024). Further, a battery of psychological questionnaires regarding eating behaviour, craving, and stress, and body characteristics were measured.
We hypothesized that food cues would increase craving levels in the fasted state, while taste and ingestion of sugary drink would reduce craving levels as well as would blunt the response to food cues.
Secondly, we hypothesized that the mouth rinse would not reduce food craving but would maintain craving on high levels with and without food cues, reasoning that the taste experience together with food cues would set up an error signal for nutrient receipt and energy absorption/metabolism which would be experienced as food cravings.
Thirdly, we expected that the area under the curve (AUC) of continuous glucose measurements in the daytime period after the trials would show that mouth rinse and concomitant increase in food cravings would lead to a higher AUC compared to the AUC of the period after the ingestion trial. This was suggested by the assumption that elevated food craving induced by the mouth rinse trial would drive sugar/carbohydrate intake in the period following the trial beyond the level of the ingestions trial where the error signal of craving was extinct by the receipt, physiological response, and metabolism of sugar.
Methods
Ethical approval:
This study was ethically approved by the Ethics Committee of School of Psychology and Sport Sciences at Bangor University, ethics number: 2023-17333.
Participants:
Using G*Power for calculating a priori sample size, we used the outcomes of our validation study (supplementary file) for calculating the effect size for food craving alteration in response to food intake (f=0.48). However, due to the potentially lesser effects of sugary drink intake on craving, we used an effect size of f=0.35. With alpha level of 0.05 and 95% power, based on a repeated measures ANOVA, withing-between interaction, we calculated a sample size of at least n=40. Forty-seven healthy participants (17 males and 30 females) were recruited from Bangor University and the local community in the Bangor area. Recruitment was performed via advertisements in the university, local sports clubs, and student Facebook groups. Inclusion criteria: age 18-60 years, injury free, not pregnant, non-smoker, healthy, i.e., without any cardiovascular, metabolic, or pulmonary disease, BMI between (18 to 35 kg/m2), and no medications which might limit participation, no vegetarians/vegans due to food image selection, no eating disorders. Health-screening questions were sent via Qualtrics survey link to check eligibility for taking part. All study information were sent and explained verbally with the opportunity to ask questions on the first visit and consent was taken. Participants received a reimbursement of £100 for their time after successful completion of all sessions.
Procedures:
The study included four testing sessions conducted in the laboratories of the School of Psychology and Sport Sciences. The study material was integrated into Qualtrics (www.qualtrics.com). Sessions 1 and 4 were performed on the first and the final days of a two-week period, while sessions 2 and 3 were performed on separate mornings within the two weeks at least three days apart.
- 1-
-
Session 1: participants performed this session after an overnight fast, having refrained from strenuous exercise and alcohol in the preceding 24 hours. The session consisted of the following sections:
- A-
Body characteristics were assessed including sex, age, height, weight, and body composition (i.e., body fat percentage)
- B-
Participants were asked to fill in self-report questionnaires (IPAQ, FCQ-T, TFEQ, PSS, PANAS, see Measurements).
- C-
Fasting earlobe blood samples were collected to measure blood glucose levels and for analysis of leptin levels, (see Measurement for details).
- D-
Familiarization of the handgrip force measure as a measure of agreement to the statements of the Food Craving Questionnaire State (FCQ-S). The procedure was explained, and a test trial was performed, as well as three maximum handgrip forces for the standardisation of cravings (see validation study in supplementary information).
- E-
The participants were asked to rate their current cravings (FCQ-S statements on computer screen) by applying handgrip forces for perceived agreement with statements. The handgrip dynamometer was connected to an A/D converter (PowerLab system) to record the handgrip forces (no visual feedback was available for forces applied).
- F-
Participants were shown neutral images (household items) while being asked to perform a cognitive sorting task for focusing attention on the images (see Measurement for details). After the neutral cue exposure, the assessment of their current cravings was repeated.
- G-
Participants consumed a commercially available cordial with orange taste containing 50g sugar in 250 ml volume and then rested for 25 minutes.
- H-
During the resting period, the continuous glucose monitoring sensor (CGMS) was attached to the back of the upper arm (see Measurement for details).
- I-
Participants performed the 3-minute step test for assessing cardiovascular fitness (see Measurements).
- 2-
Session 2 and 3 - the second and third sessions (Ingestion trial or Rinse trial) were performed in a counterbalanced randomized manner, and each session was on separate days (at least 72 hours apart) within the two-week CGM measuring period. Participants performed the sessions after an overnight fast, having refrained from strenuous exercise and alcohol in the preceding 24 hours. All steps of the sessions were timed by the Qualtrics program with images and FCQ-S items embedded in the program.
Participants produced three maximum handgrip forces with the dynamometer for individual standardization of the craving responses. Participants were asked to rate their current cravings (FCQT-S questions) by applying handgrip forces for perceived agreement with statements (Pre-cue measure). The researcher scanned the glucose sensor both before and following the craving ratings. Subsequently, participants were shown a set of 15 images, 11 sweet and 4 savoury food images (cues) on computer screen. The images were shown twice to the participants for 6 seconds each in a random order over 3 minutes while being asked to perform a cognitive task to focus attention on the images (see
Measurement for details). After the cue exposure, the assessment of their current cravings was repeated (post-cue measure) and glucose levels were scanned again. This was followed by the participants either ingested the orange cordial drink (Belvoir Farm) containing 50g of sugar in 250 ml of water (
Ingestion Trial) or rinsed their mouth with the same volume of cordial (
Rinse Trial). Following both ingestion and rinse, participants flushed their mouths with water to avoid continued taste effects. After mouth rinse of the rinse trial, participants ingested 250ml volume of water to match ingested volume of the ingestion trial. Then, participants rested for 25 minutes; during this resting period, the glucose sensor was scanned every 5 minutes. After the resting period, craving assessments were repeated, and glucose levels were recorded (pre-cue measure). Concurrently, the exposure to food cues were repeated and a further craving assessment performed with glucose measures recorded (post-cue measure). A flowchart of the session procedures is presented in
Figure 1.
- 3-
Session 4: This session was performed at the end of the two-week period of continuous glucose measurement. After removing the participants' CGM, the collected data was downloaded, and the participant debriefed.
Measurements:
- A-
Demographic and Body Characteristics:
Sex, age, height (standard stadiometer), weight, and body composition (i.e., body fat percentage) were measured via bioelectrical impedance using Tanita BC-418 MA system.
- B-
Self-report measures:
Participants were asked to fill in the following questionnaires during the first session:
- 1-
International Physical Activity Questionnaire (IPAQ) (Fogelholm et al., 2006) is a validated instrument for measuring regular physical activity. Reliability was assessed in 12 countries (Craig et al., 2003), with Spearman's rho 0.81.
- 2-
FCQ-T (Cepeda-Benito et al., 2000) assesses food cravings with 39 items that address behavioural, cognitive, and physiological components of cravings. The FCQ-T has an overall CRα of 0.98, with subscale alphas ranging from 0.71 to 0.95 (Cepeda-Benito et al., 2000).
- 3-
Food Cravings Questionnaire-State (FCQ-S) assesses the strength of food cravings that are influenced by one's current state. It uses 15 items measuring the agreement to the statements connected to 5 dimensions (see Measurements of food craving via handgrip dynamometer). The FCQ-S has an overall CRα of 0.96 (Cepeda-Benito et al., 2000).
- 4-
The three-Factor Eating Questionnaire (TFEQ) (Stunkard & Messick, 1985) it consists of 18 items evaluating three dimensions of eating behaviour: ‘uncontrolled eating’, ‘cognitive restraint’ and ‘emotional eating’ with Cronbach’s alpha for these scales were above 0.70 (Karlsson, Persson, Sjostrom, & Sullivan, 2000).
- 5-
The Positive and Negative Affect Schedule (PANAS) (Watson, Clark, & Tellegen, 1988) assesses affect using two separate scales for negative and positive mood scales; CRα: 0.89 (Crawford & Henry, 2004).
- 1-
The Perceived Stress Scale (PSS) assesses individuals' appraisal of stressful situations in their lives (Cohen, Kamarck, & Mermelstein, 1983). Participants respond to 10 items on a Likert scale ranging from 0 = ‘Never’ to 4 = ‘Very Often’ to assess unpredictability, lack of control, and pressure in their lives over the past month with Cronbach’s alpha for this scale above 0.70 (Lee, 2012).
- C-
Continuous glucose monitoring (CGM)
Continuous Glucose Monitoring (CGM) involves wearing a subdermal sensor that automatically monitors and tracks interstitial glucose levels continuously for up to 14 days. The CGM sensor (Abbott FreeStyle Libre 2 sensor) measures interstitial glucose levels at one minute intervals and transmits the data to a monitoring device (i.e. mobile phone). Over a two-week period, interstitial glucose levels were continuously monitored after attachment to the back of the upper arm of participants using the applicator provided with the sensor. Upon applying the sensor, participants downloaded the FreeStyle LibreLink mobile application on their smartphones and registered for the LibreView online diabetes management system. Participants were instructed on how to use their phones to scan the sensor regularly. Participants were not encouraged to monitor their glucose levels and informed that the CGM was used for avoiding taking blood samples during experiments in the lab; they were informed to continue their usual diet habits during the 14-day period. Glucose levels were measured in (mmol/L), and glucose variability was automatically assessed by calculating the percent coefficient of variation (%CV), providing a measure of glucose fluctuation over time. The data was automatically uploaded to LibreView every time the participant scanned the FreeStyle Libre 2 sensor, the participants were asked to scan the sensor every 8 hours during daytimes over the study period. Subsequently, data were downloaded in the last session.
- D-
Calculation of Area under the curve (AUC) of glucose levels over time:
The AUC of post-trial glucose was calculated to investigate the effect of trial type on glucose response. The AUC was determined by summing the changes in glucose levels relative to the baseline fasting reading over a 10-hour period, starting 2 hours after each trial. This approach, which aligns with the method described by Matthan et al. (Matthan, Ausman, Meng, Tighiouart, & Lichtenstein, 2016), focuses on the incremental changes in glucose levels above the baseline value, considering only the increases in glucose concentrations.
- E-
Cardiovascular Fitness test:
Estimation of cardiovascular fitness (V̇O2MAX; mL/kg/min) was performed using the validated Tecumseh Test (3-minute step test) with a 20.3 cm stepper (Hughes & Chaturvedi, 2017). The test consists of an initial 2-minute resting phase while the participant is seated; then after exactly two minutes, the participant started stepping up and down (step up-up-down-down) from the stepper at a rate of 96 beats per minute, the rhythm was given by a metronome for 3 minutes followed by immediate stop and sitting down while remaining seated with the arms by the side and the legs uncrossed for one minute. The heart rate data was recorded automatically throughout the test via the V 800 Polar heart rate monitor; the heart rate data was used for the estimation of the participant’s cardiovascular fitness level based on the equation using the number of heartbeats count 30 seconds to 60-second post-test (HB30to60) (one-minute recovery period).
- F-
Cues Exposure:
Cue exposures were performed with selected images showing food images (Sweet (11) and Savoury (4) during Ingestion and Rinse trials, or household items (session 1), respectively. Food images were formerly tested for recognisability and appealing features using a group of volunteers. For each cue exposure, 15 images were shown to the participants for 6 seconds each, and images were repeated in randomized order over 3 minutes. To ensure that participants focus on the images, a cognitive task was embedded in the cue exposure. There were two variations of tasks, the first variation used food images (sweet and savoury), and the second task variation used everyday household objects for not arousing food cravings as control. The cognitive tasks, being part of the cue exposures, displayed the images with word attributes (‘sweet’, ‘savoury’) for food images, and ‘round’, ‘edgy’ for household items. 5-9 incorrect pairings were embedded in the 30 image exposures. Participants were instructed to identify and count the incorrect pairings of images and words. The purpose of the test was to focus attention to images for stimulation of cravings through food cue exposure.
- G-
Blood sampling:
Fasting blood samples were collected from the earlobe for measurement of fasting blood glucose levels and leptin levels. 250µl of blood samples were collected into two capillary blood tubes (Microvette® APT 250 EDTA K2E, 250 µl). Fasting glucose was analysed by HemoCue® Glucose 201+ Analyser (HemoCue® AB, Ängelholm, Sweden). Blood was then centrifuged at 3000rpm for 10 minutes at 4°C (Eppendorf Centrifuge 5810R; Hamburg, Germany), harvesting the plasma and stored at -80°C for later analysis. Leptin concentrations were determined via enzyme-linked immunosorbent assay (ELISA) (BioVendor Research and Diagnostic Products, BioVendor – Laboratorni medicina a.s., Czech Republic) using a plate reader (Fluostar Omega, BMG Labtech, Germany). All samples were analysed in duplicate. The intra-assay coefficient of variation for Leptin was 8%.
- H-
Measurements of food craving via handgrip dynamometer - Food craving questionnaire-S (FCQ-S):
Food cravings were assessed with the FCQ-S (Cepeda-Benito et al., 2000). This questionnaire consisted of 15 items measuring craving at the very moment, with the statements covering the following 5 dimensions: intense desire to eat; anticipation of positive reinforcement that may result from eating; anticipation of relief from negative states and feelings as a result of eating; lack of control over eating; craving as a physiological state (hunger).
In this study, the handgrip force was used for the level of agreement with the statements of the Food Craving Questionnaire State (FCQ-S) for the assessment of cravings instead of the Likert scale. The method was formerly validated with 32 healthy participants (see supplementary file). The handgrip dynamometer, used to assess the craving levels, was connected to an A/D converter (PowerLab system) to record the handgrip forces. The craving response by the handgrip force (HG) was standardized using the following formula: (HG value – minimum HG value) / (maximum HG value – minimum HG value), with the maximum being the highest value produced during the three maximum HG forces at the start of the sessions. The participants were instructed to perform three maximum handgrip forces before each session to be used for the standardisation.
Statistical Analyses:
All statistical analyses were performed using IBM SPSS Statistics 29 and Microsoft Excel 2010. All data are reported as means ± SD, unless otherwise stated. Statistical significance was set at P<0.05. All data were assessed for relevant assumptions: normality, outliers, homogeneity of covariance. To compare the effects of consuming the sugary drink and performing the mouth rinse on interstitial glucose levels and food craving levels, mixed model ANOVAs with repeated measures were used followed by post-hoc analyses, including t-tests, multivariate comparisons. ANOVAs were performed with Bonferroni corrections. AUCs were tested via paired t-test. Spearman’s Correlations and Pearson’s partial correlation were used to analyse relationships between variables.
Results
Body characteristics, blood parameters, and self-report measures
47 participants completed the study. Body characteristics, self-report measures, and fasting blood levels of glucose and leptin are presented in
Table 1 and
Table 2.
The mean age of the participants was 27.9 ± 8.0 years old, with a wide range of BMI (17.30-35.50 kg/m2). The IPAQ reported the majority having a moderate to high physical activity level (93%). The average estimated cardiovascular fitness level (VO2 max) of the participants was 42.10 ± 8.19 mL/kg/min.
Self-report questionnaires showed that participants had moderate cravings (FCQ-T: 120.38 ± 30.55), and the PANAS-PA and PANAS-NA scored moderate scores for both positive and negative affects. The mean Perceived Stress Scale (PSS-10) score was 31.64 ± 3.76, indicating a high level of perceived stress among participants. TFEQ scores indicate moderate levels of cognitive restraint (53.84 ± 10.86), uncontrolled eating (48.86 ± 13.46), and emotional eating (58.39 ± 26.16).
The mean fasting glucose level was 4.63 ± 0.47 mmol/L revealing healthy fasting levels throughout. Leptin levels revealed that the sample had normal range of fasting leptin with a mean of 9.77 ± 9.75 ng/ml. (
Table 2).
Interstitial glucose levels
The CGM data over the 14 days period revealed that participants had a mean glucose level of 5.58 mmol/L, daytime glucose mean of 5.72 mmol/L, and nighttime glucose mean of 5.31 mmol/L, as well as a mean glucose variability of 16.06 %CV. Data revealed normal glucose homeostasis in our sample.
Changes in interstitial glucose levels
We hypothesized that the interstitial glucose concentrations would be only elevated by ingestion of the sugary drink (
Ingestion trial) and not during the
Rinse trial. Participants performed the two trials (
Ingestion and
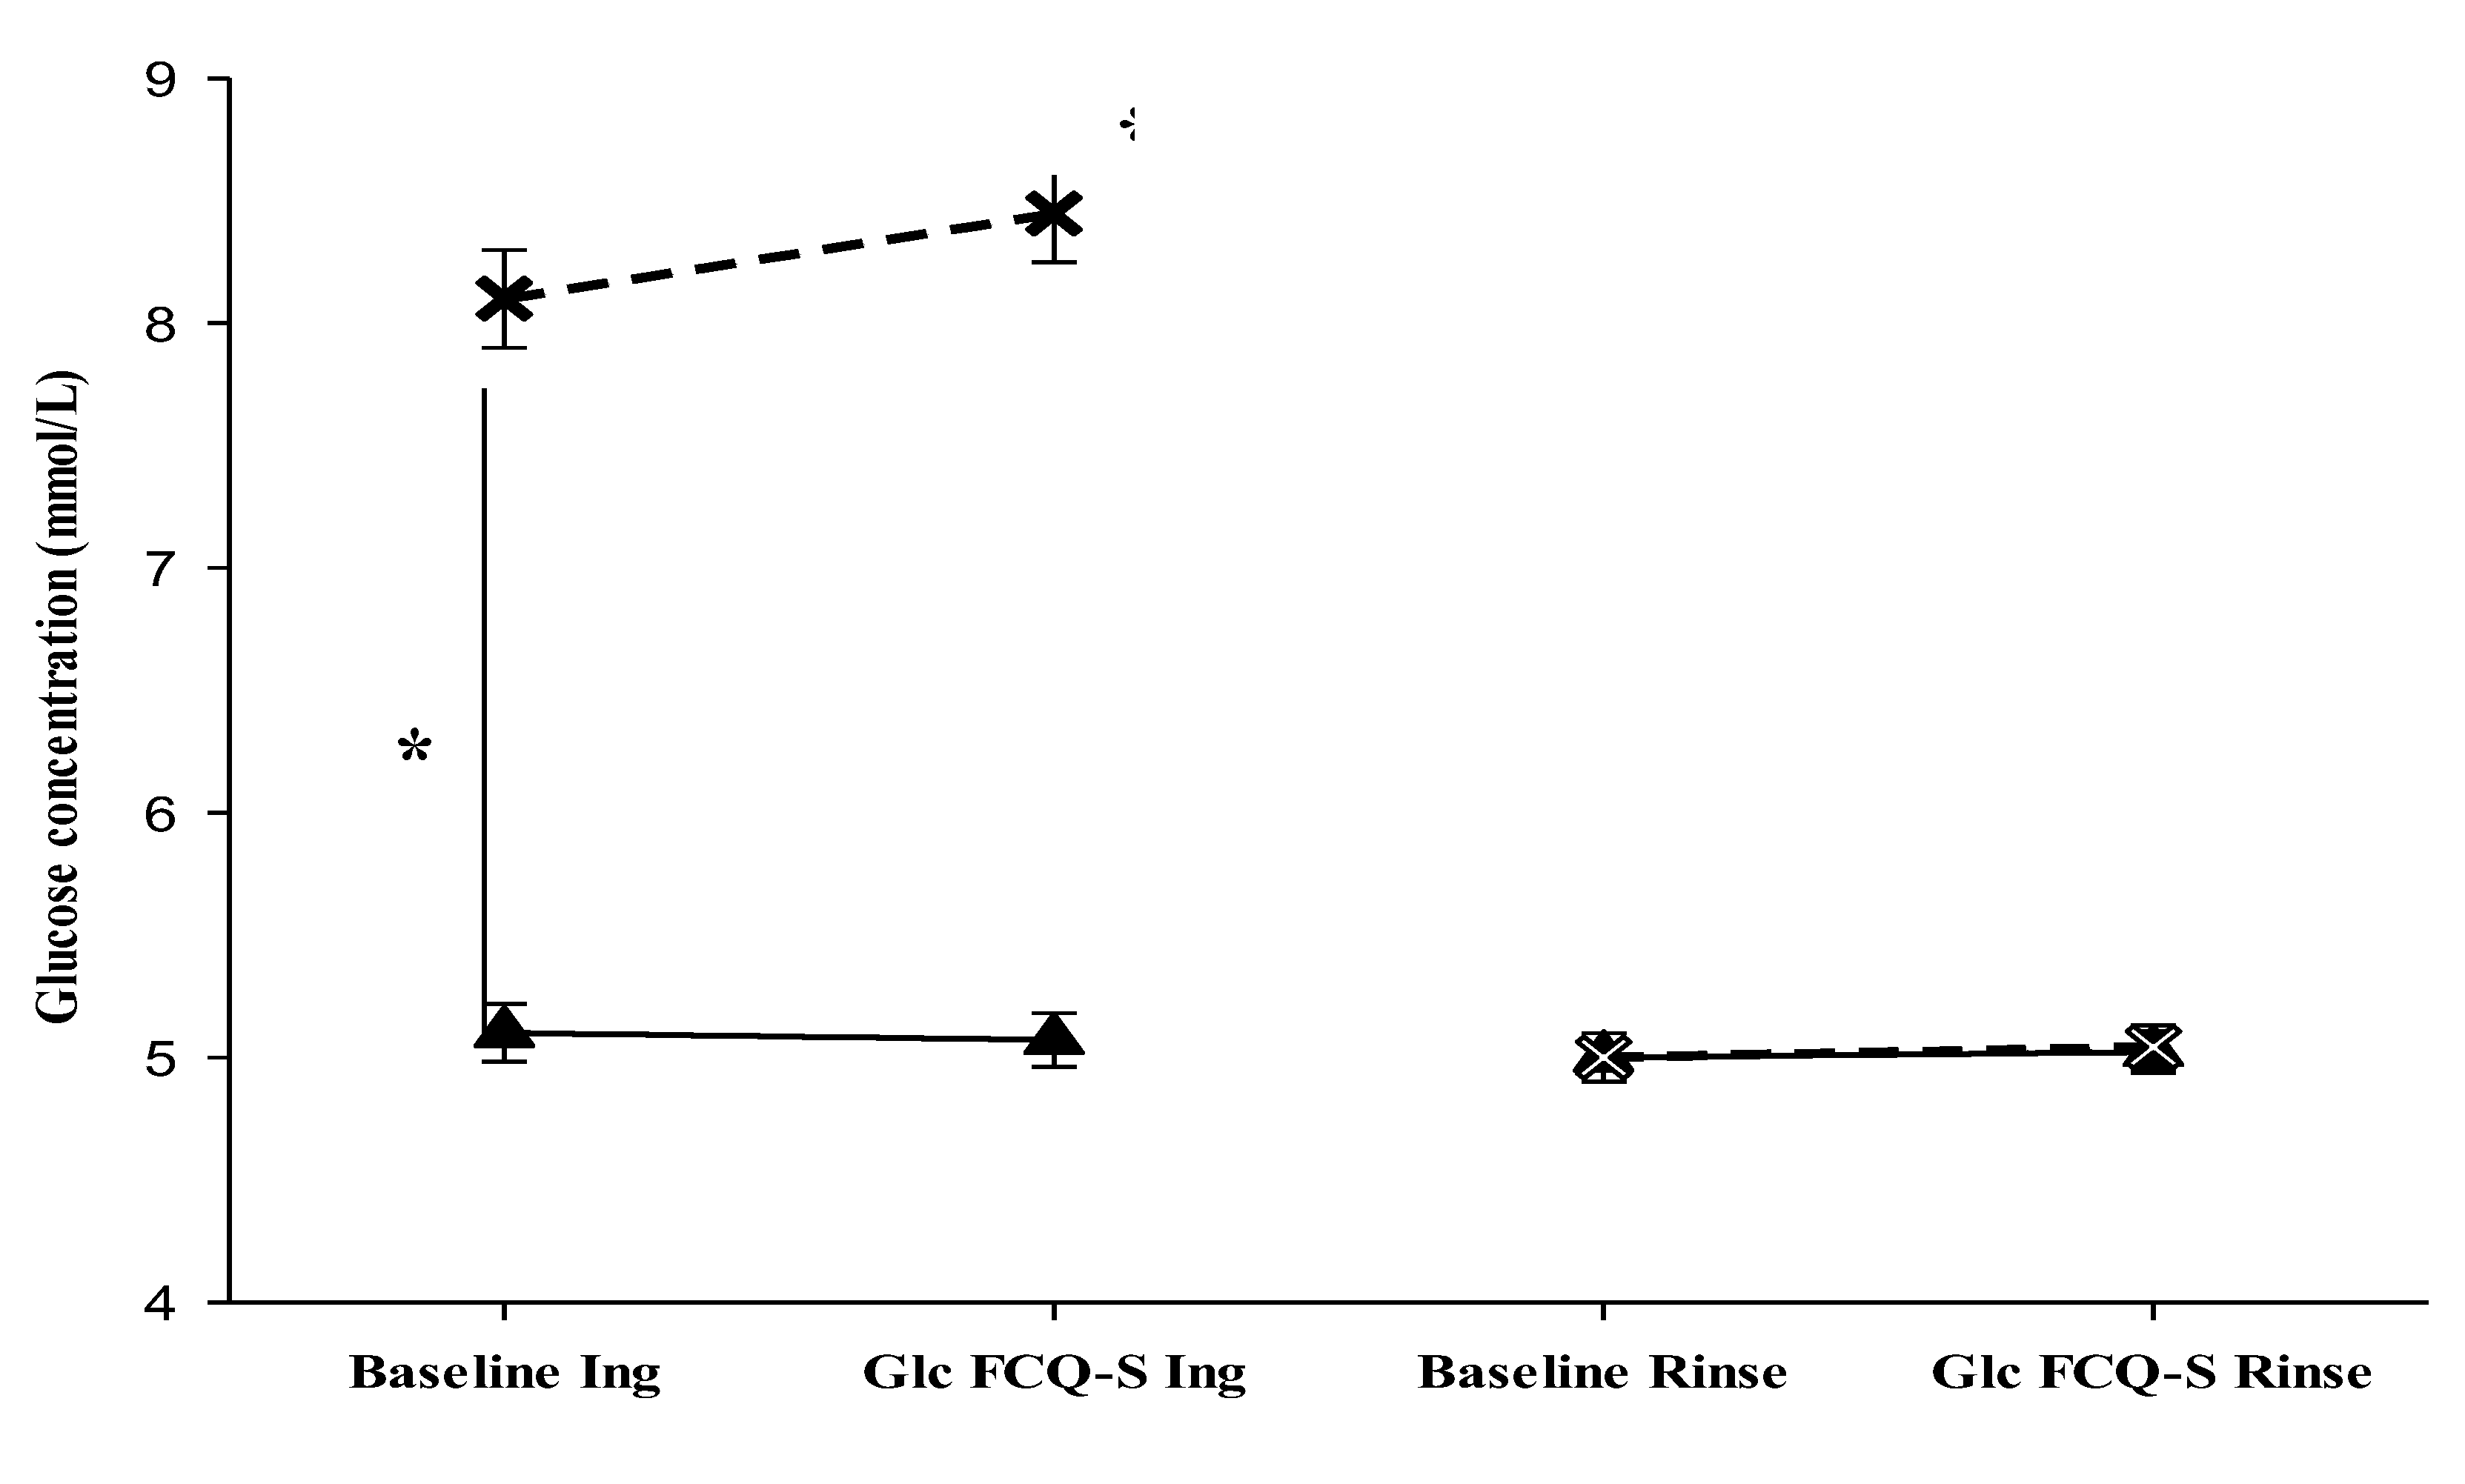
Rinse trials), being exposed to sweet food cues before and after either ingestion of sugary drink or mouth rinse. CGM data were analysed from the two trials in both fasted and after-intake or mouth rinse before food cue exposure and after during rating of the craving (FCQ-S) (pre- and post-cue exposure). The repeated measures ANOVA reported a significant main effect of time on glucose levels was observed (
F(1, 184) = 45.150,
p < .001), with a significant interactions between the time factor and trial type (
F(1, 184) = 33.763,
p < .001), between the time factor and the state (fasted vs. after intake) (
F(1, 184) = 46.830,
p < .001), with glucose levels higher after the ingestion of sugary drink (
F(1, 184) = 91.972,
p < .001). Finally, the three-way interaction between time factor × trial type × state was significant (
F(1, 184) = 46.454,
p < .001). Pairwise comparison (paired t-test) indicated that only in the ingestion trial, glucose levels significantly increased after sugary drink intake with mean differences between measures pre- and post-ingestion, baseline: 2.85 (mmol/L), during FCQ-S: 3.38 (mmol/L) respectively,
p < .001 (
Table 3,
Figure 2). Moreover, no significant differences were detected during the rinse trial in both states (fasted and after rinse). In summary, the interstitial glucose levels were significantly increased after sugary drink intake in the ingestion trial only and remained at baseline levels during the rinse trial in both states (fasted and after rinse).
Table 4.
CGM data.
| CGM data |
Mean (SD) |
Median [25, 75 percentiles] |
| Glucose variability (%CV) |
16.06 (3.89) |
16.00 [13.40, 18.70] |
| Mean glucose (mmol/L) |
5.58 (3.89) |
5.60 [5.30, 5.90] |
| Daytime glucose (mmol/L) |
5.72 (0.42) |
5.69 [5.47, 6.60] |
| Nighttime glucose (mmol/L) |
5.31 (0.52) |
5.41 [4.91, 5.70] |
Furthermore, we hypothesized that the ingestion of sugar would produce negative feedback towards higher centres and suppress future intake of sugary food after the Ingestion trial, while the mouth rinse (Rinse trial) would not deliver negative feedback and therefore sugary food intake would increase in the period after the rinse trial. Consequently, we expected a significantly higher area under the curve (AUC) for the interstitial glucose levels after the Rinse trial compared with the Ingestion trial. CGM data were analysed on the trial days between 2 hours after the specific trial and the following 10 hours. The area under the curve (AUC) of all glucose measures during these periods were calculated (see methods). The interstitial glucose AUCs after Ingestion and Rinse trials had a mean of 28.98 mmol*time and 38.56 mmol*time, respectively (
Table 5).
The mean of AUC after the Rinse trial was significantly higher than the mean of AUC after the Ingestion trial (t(46) = -2.317, p = .025), showing that glucose levels over the analysed time period were significantly higher for the Rinse trial day than for the Ingestion trial day. Outcomes suggest higher carbohydrate/sugar intake after the Rinse trial in confirmation of our hypothesis.
Changes in the craving scores
We hypothesized that craving response to food cues would be particularly strong in fasted state with significant increase of cravings after exposure to food cues, and that effects of food cues would decline after ingestion of sugary drink (Ingestion trial). In addition, we hypothesized that the mouth rinse without ingestion of sugar would lead to a maintenance of cravings levels on high levels after rinse and therefore with smaller effects of food cues due to elevated levels of cravings.
Changes in craving scores were assessed before and after exposure to sweet food cues in both fasted and post-manipulation states of the two trials (ingestion and rinse) using standardized handgrip strength as a measure of craving. The independent variables considered were time (pre-, post-food cue exposure), state (fasting, or manipulation (intake of sugary drink or mouth rinse)), and trial type (Ingestion, Rinse).
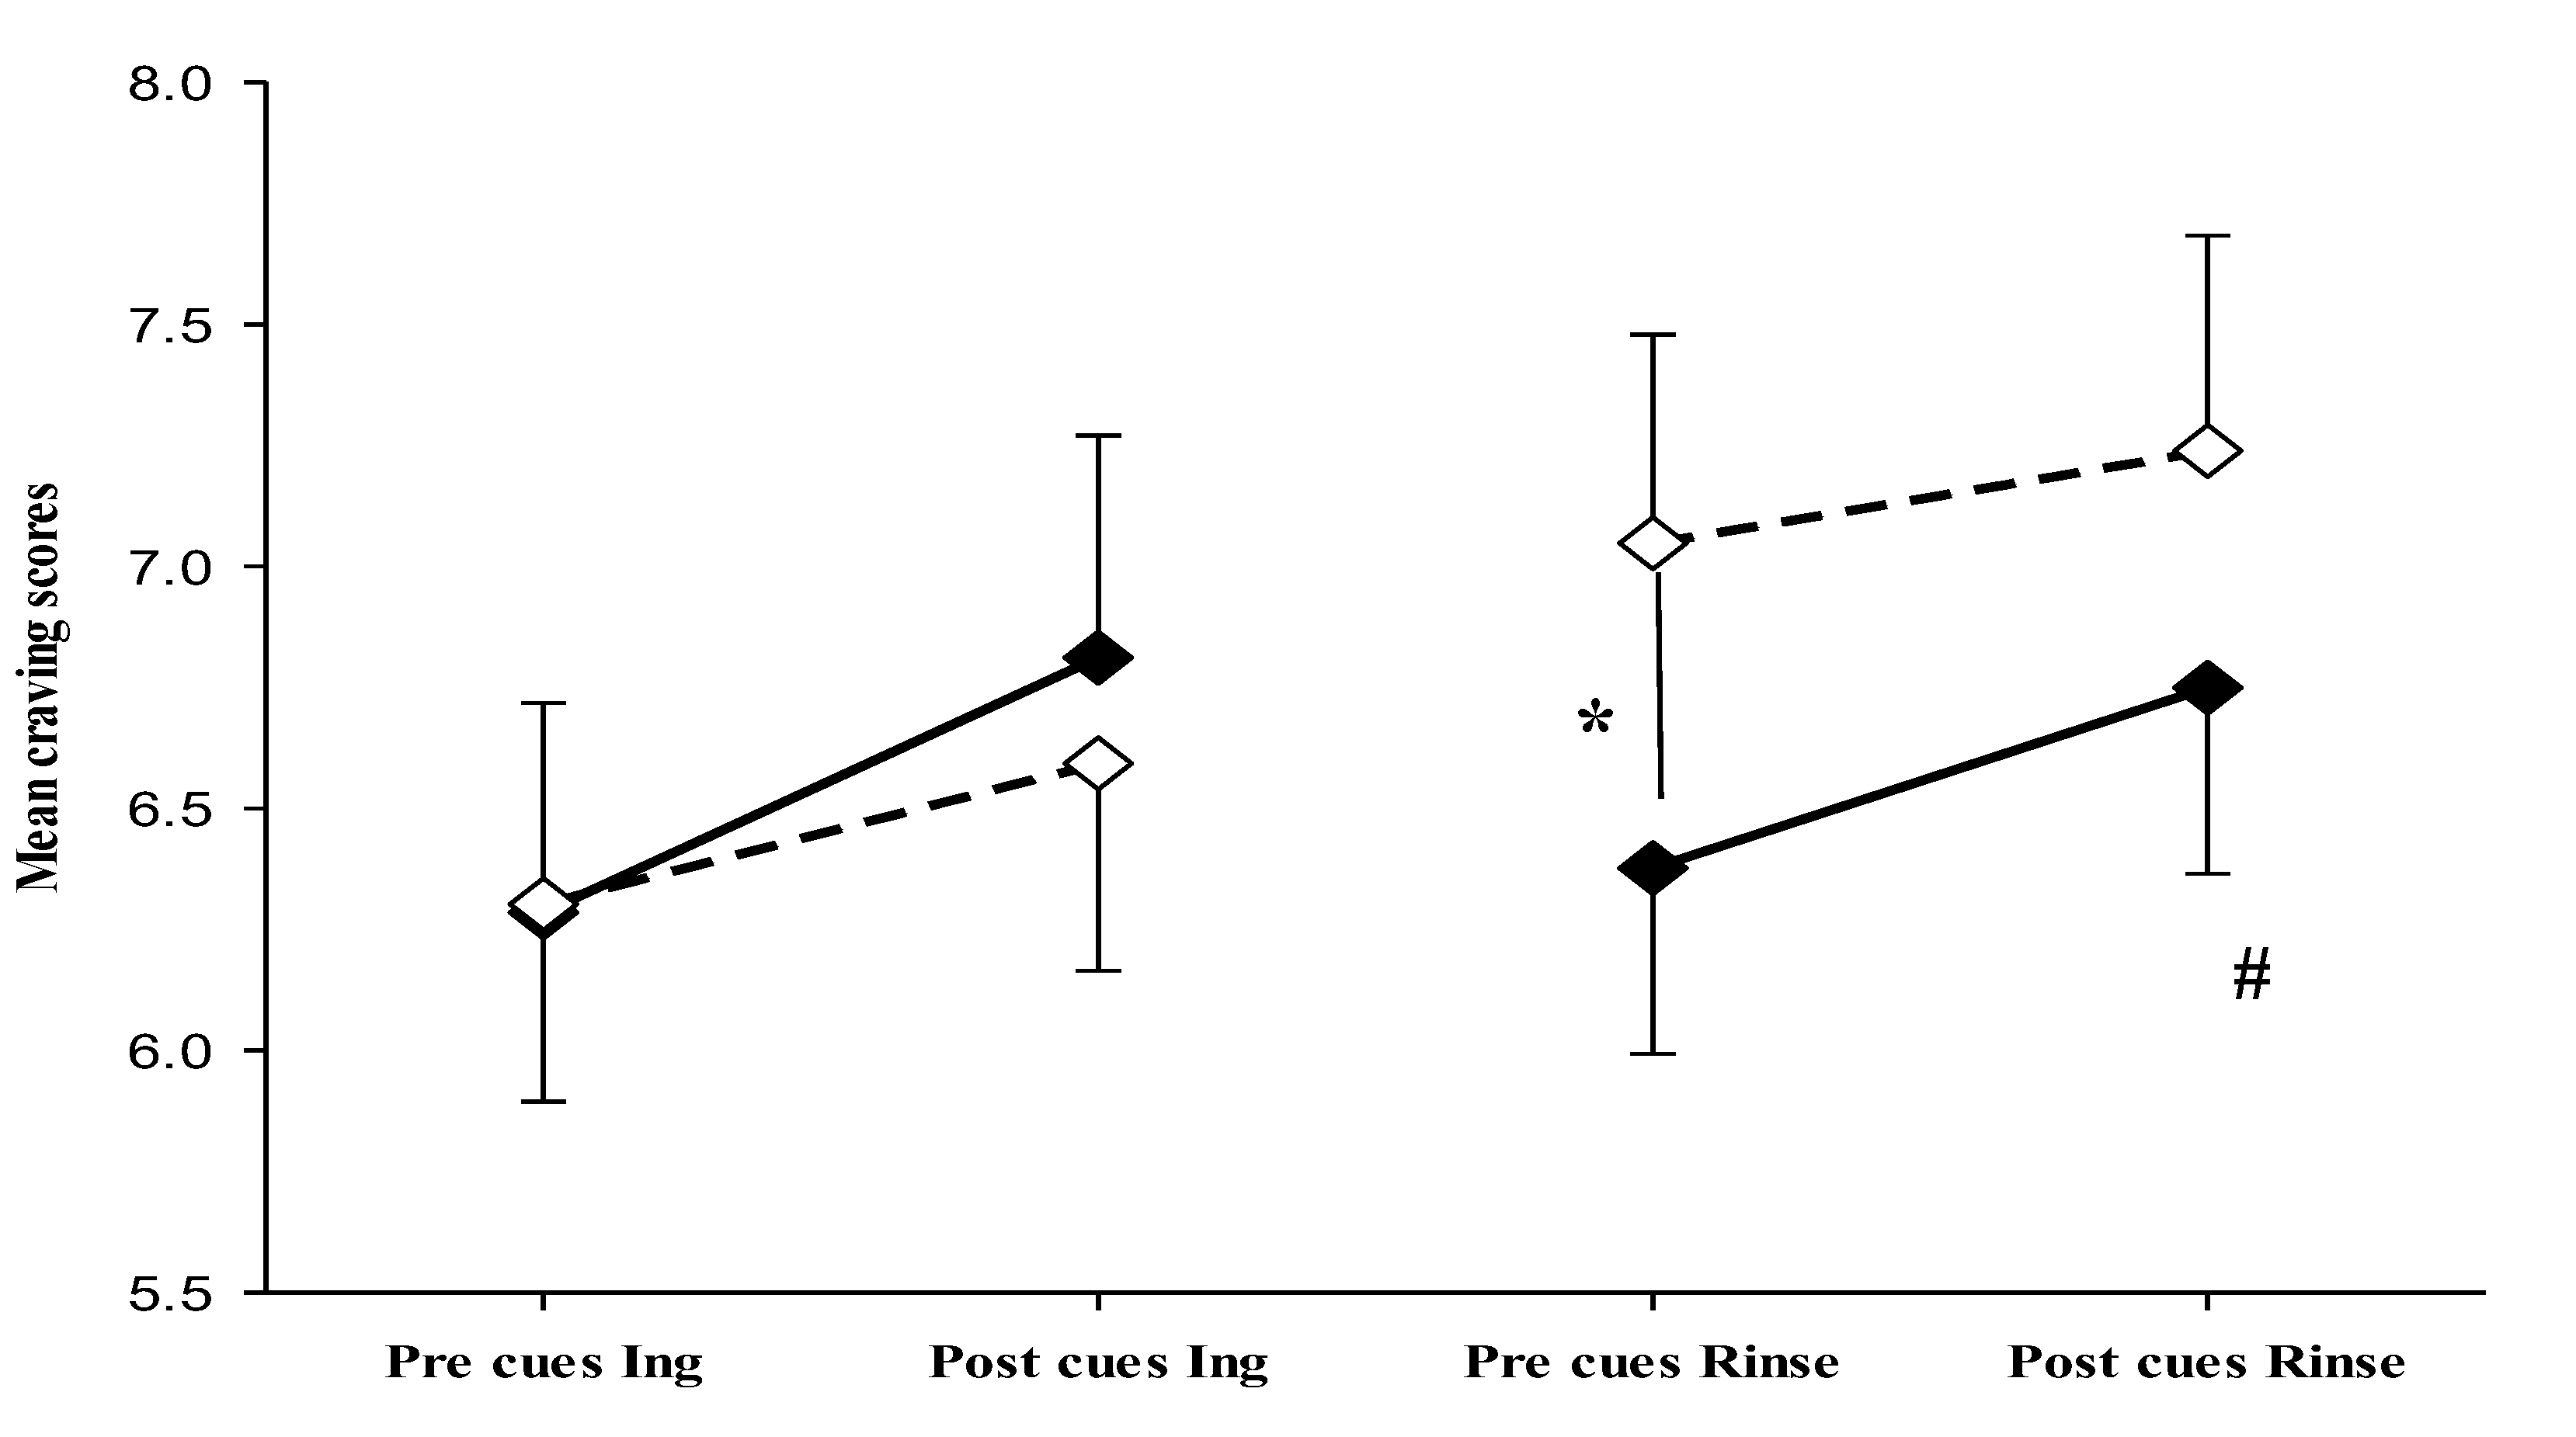
Craving data were analysed by mixed model ANOVA with repeated measures revealing a significant main effect of time on craving intensity (
F(1, 184) = 11.720,
p < .001), without significant interactions. Follow up tests (paired t-test) revealed that, in the fasted state, an increase of craving intensity from pre to post cue exposure was detected in both trials (
t(46)= -0.57,
p=0.007, ingestion trial) and (
t(46)=-1.98,
p=0.054, rinse trial), showing that food cues were effective in the fasted state. However, after ingestion and after mouth rinse no significant alterations in cravings were detected after food cue exposure. Moreover, while ingestion of sugar reduced food craving towards pre-cue fasting levels (
Table 5,
Figure 3), mouth rinse elevated the craving levels which was maintained throughout the cue exposure period (pre-cue craving fasted versus pre-cue craving after rinse (
t(46)=-2.90,
p= .006) (
Table 5,
Figure 3). Results revealed that, unlike sugar ingestion which led to reduction of craving and blunting of food cue response, mouth rinse induced a stable increase in craving.
Table 5.
FCQ-S craving scores based on normalized handgrip forces.
Table 5.
FCQ-S craving scores based on normalized handgrip forces.
| FCQ-S |
Fasted |
| |
Pre cue |
Post cue |
Change |
| Ingestion trial |
6.28 (2.97)
5.98 [3.78, 8.86] |
6.81 (3.15)
7.54 [3.86, 9.41] |
0.53 (1.28) *
0.66 [-0.32, 1.35] |
| Rinse trial |
6.38 (2.63)
6.40 [4.44, 8.29] |
6.75 (2.64)
6.86 [4.50, 8.85] |
0.37 (1.29) #
0.42 [-0.55, 1.01] |
| FCQ-S |
After intake |
| |
Pre cue |
Post cue |
Change |
| Ingestion trial |
6.30 (2.79)
5.93 [4.32, 8.30] |
6.59 (2.94)
6.30 [4.67, 9.20] |
0.26 (1.45)
0.46 [-0.86, 1.42] |
| Rinse trial |
7.05 (2.95) ⁑
7.25 [4.92, 9.67] |
7.24 (3.05)
6.81 [4.77, 10.18] |
0.19 (1.49)
0.17 [-0.91, 0.91] |
Furthermore, participants were exposed to neutral cues (household items) during the first session as a control for the sweet food cue effects. Changes in craving scores were assessed before 6.11 ± 2.66 and after 6.52 ± 3.14 exposure to neutral cues in a fasted state. Craving scores pre-cues and after exposure to neutral cues showed no significant difference (t(46) = -1.746, p = .087).
In summary, strong food craving response to food cues is bound to the fasted state, while differential effects of ingestion of sugar and mouth rinse are detected. Mouth rinse induced a stable increase in craving while ingestion of sugar reduced cravings towards pre-cue levels.
Correlation analysis:
To further investigate the influence of participants’ characteristics on the responses measured, such as changes in craving and glucose levels, correlation analyses were performed. The aim was to explore the potential role of factors like body composition, cardiovascular fitness, and hormonal levels on the observed craving and glucose responses within the experimental design.
Spearman's correlation revealed that craving change (difference in craving between pre and post cues exposure) was negatively correlated with body fat %
(r = -0.371,
p = .010) and BMI (
r = -0.426,
p = .003) in the fasted state, suggesting that participants with lower body fat and BMI experienced higher craving responses to sweet food cues when fasted (
Table 6), significant associations were not reported after ingestion or rinse.
In addition, leptin levels were significantly positively correlated with body fat % (r = 0.796, p < .001), showing the expected association. Craving levels post food cues exposure in the fasted state were negatively correlated with leptin levels (r = -0.345, p = .017). The findings indicate that individuals with lower leptin levels, lower body fat, and lower BMI show a stronger craving response following cue exposure when fasted. However, a small positive correlation was observed between leptin levels and FCQ-T scores (r = 0.325, p = .026), indicating that people with higher leptin levels tended to have higher food-craving traits.
Additionally, only after the rinse trial, the area under the curve (AUC) had a positive significant correlation with glucose variability (
r = 0.488,
p < .001), showing that the higher the glucose variability the higher the AUC after the rinse trial (
Table 6). AUC after mouth rinse was positively correlated (controlling for sex) with craving levels after cue exposure (
r = 0.321,
p= .03) suggesting an influence of craving levels on carbohydrate/sugar intake after mouth rinse. The association of AUC with craving levels was not seen in the ingestion trial. However, partial correlation, controlling for sex, revealed that AUC after ingestion trial was negatively correlated with leptin (
r = -0.369,
p= .012) and BMI (
r = -0.404,
p= .005) (
Table 6.), suggesting that intake of carbohydrate/sugar was generally moderated by leptin when sugar was formerly ingested in the ingestion trial. Outcomes suggest that craving levels influenced food intake when craving levels remained high (rinse trial), while leptin moderated the intake when sugar was formerly ingested (ingestion trial).
Discussion
This study investigated the influence of sugar ingestion and mouth rinse on sweet food cue induced food cravings in a healthy young sample population. Interstitial glucose was measured by continuous glucose monitoring using glucose sensor technology and sweet food cravings were measured with a new validated method using handgrip forces as proxy measure for craving intensity. Results revealed that food-cue-evoked cravings were diminished by ingestion of sugar with concomitant increase of interstitial glucose. In contrast, food cues in connection with mouth rinse without alteration of glucose levels maintained elevated food cravings before and after further food cue exposure. Mouth rinse induced food cravings were associated with a significant higher AUC of the interstitial glucose measures over the day after the rinse trial compared with the ingestion trial suggesting subsequent greater sugar/carbohydrate intake following the mouth rinse trial. Effect on food cravings levels were moderated by leptin levels, and body characteristics.
Physiological and food craving responses to ingestion and mouth rinse
Our study shows that food cues are particularly effective in the fasted state for increasing food cravings in agreement with former studies (Martens et al., 2013; Overduin & Jansen, 1996). We focused on sweet food cues to enable a specific connection between food cues and manipulations with sugary drink and mouth rinse. Ingestion of sugar reduced cravings and craving response to food cues significantly suggesting that post-ingestive nutrient signals and concomitant hormonal changes not only provided negative feedback for modifying state craving levels but also reduced reactivity to food cues (Stice et al., 2013). Food craving is a multidimensional construct which encompasses physiological and learned components affecting appetite, motivation, and emotions (Sun & Kober, 2020). Visual cues, smells and taste are known to initiate feedforward responses during the cephalic phase, including ghrelin secretion in the stomach (Kroemer, Krebs, Kobiella, Grimm, Pilhatsch, et al., 2013), as well as increasing motivation for food intake and emotional responses which are reaching awareness as appetite/hunger and cravings (Nederkoorn, Smulders, & Jansen, 2000). Mesolimbic pathways are known to receive input from visual, oro-sensory and olfactory stimuli modifying the dopaminergic system linked to food wanting, food reward prediction, and emotional arousal (i.e. incentive salience) (Berridge, 2012; Nicola, 2016), and signals are integrated into the hypothalamic areas for regulation of food intake. The principal physiological regulation cycles also include negative feedback to the hypothalamic areas i.e. AgRP and POMC neurons (Roger et al., 2021). These areas are shown to express receptors for various nutrients i.e. glucose, as well as numerous hormones like insulin, leptin and various gut hormones but also vagal afferences are involved in the regulation of hypothalamic modulation (Clarke, Page, & Eldeghaidy, 2024). Vagal afferences are suggested to mediate nutrient receptor activation in the gastrointestinal tract (Waise, Dranse, & Lam, 2018). While the direct influence of nutrients and hormones on the hypothalamus for controlling motivation towards food are well established in animals (Brierley & de Lartigue, 2022), the role of gastrointestinal nutrient receptors in humans is still under scrutiny. Intragastric infusion of glucose reduced appetite and concomitant food intake bypassing taste experience (Cecil, Castiglione, French, Francis, & Read, 1998); however, bypassing the gastrointestinal tract via direct venal infusion of glucose was not effective for reducing appetite versus saline infusion (Schultes et al., 2016) suggesting a strong vagal influence via nutrient receptors (Sclafani & Ackroff, 2012). In addition, oral glucose ingestion but not intravenous infusion increases GLP1 and GIP release influencing insulin release and associated effects on the hypothalamus (Holst, 2019). However, our study cannot differentiate between vagal and direct influence of glucose and concomitant insulin changes on hypothalamic regulation of food motivation in regard of negative feedback due to fact that both pathways are activated after ingestion of sugar (ingestion trial).
Our study revealed that mouth rinse elevated food cravings and maintained levels post food cue exposure. Interstitial glucose was not elevated showing that no sugar was accidentally swallowed as well as a volume of water was ingested for compensating potential activation of stretch receptor activation in the gastric cavity in the ingestion trial when the same volume of sugary drink was swallowed (Tack et al., 2021). Indeed, our data show that mere sensory activation i.e. the experience of sweet taste was elevating food cravings when no nutrient activated feedback was present and levels were even higher after food cue exposure, while a ceiling effect was detectable. Recent findings with sucralose investigating the effect hypothalamic blood flow response (Veldhuizen et al., 2017) suggested that taste receptor activation without metabolic/hormonal feedback is increasing hypothalamic blood flow and hunger response compared with sucrose intake suggesting that noncaloric sweeteners might affect appetite regulation with representing a mismatch between sensory experience and metabolic feedback. While our study did not implement noncaloric sweeteners in the experiment, our result clearly suggests that food cravings are upregulated via oro-sensory and visual pathways in a feedforward manner and without negative feedback provided via sugar dependent mechanisms projecting on hypothalamic pathways, craving is maintained. Outcomes reveal that a mismatch between sensory experience and lack of nutrient/metabolic receipt results in increased experience of food cravings.
The importance of food cravings for eating behaviour is supported by many studies (e.g., see meta-analytic review by Boswell & Kober, 2016). Moreover, ecological momentary assessment of food perception and eating behaviour using a phone application (Alabduljader et al., 2018) revealed positive correlation of trait craving levels with levels of perceived food wanting which led to reported food intake. However, the study did not measure food specific data. Otherwise, diet diaries are prone to underreporting and inaccuracies in reports (Block & Hartman, 1989; Ravelli & Schoeller, 2020), while the influence of performing diet records on eating behaviour cannot be underestimated. For our study we used data from our continuous glucose measurements for investigating behavioural consequences of the distinct trials (ingestion or mouth rinse). A recent systematic review of 17 studies using continuous glucose measurement for automatic detection of food intake (Brummer, Glasbrenner, Hechenbichler Figueroa, Koehler, & Hochsmann, 2023) concluded that automatic food intake detection is feasible based on the systems used varying between 21 to 100% sensitivity. Larger increases in interstitial blood glucose are usually consequences of food intake; high Glycemic Index foods and larger amounts of intake will generate higher positive peaks in interstitial blood glucose with inter-individual variability (Matthan et al., 2016; Merino et al., 2022). In our randomised -crossover design inter-individual responses to the trials are recognised, each participant performed both trials in randomized order with concomitant continuous measurement of interstitial glucose levels and calculation of the AUC over a 10-hour period after the trials. Outcomes revealed a significant larger AUC after the mouth rinse trial compared to the ingestion trial suggesting that the induced food cravings via taste perception and food cues without concomitant nutrient reception caused higher intake of carbohydrate/sugar foods in the following period of the day. Food craving levels were positively correlated with AUC in the rinse trial supporting the former interpretation that food craving levels maintained after mouth rinse contributed to higher food intake. These finding support the importance of sensory-metabolic mismatch for eating behaviour. Indeed, taste perception is modifiable through learning via former experience (Sartor et al., 2011) and learned reward expectations in relation to taste and food cues drive motivation for food intake as shown earlier (O'Doherty, Deichmann, Critchley, & Dolan, 2002; Rolls, 2015). The increase in food cravings after combination of mouth rinse with food cues and the decrease in food craving after ingestion of sugar highlighting the interaction of high road and low road regulatory connections (de Araujo et al., 2020) between gastrointestinal and blood nutrient sensory pathways (low road) and taste – visual pathways (high road) towards complex perceptual responses as food cravings representing hedonic and homeostatic drives.
Moderating physiological mechanisms of food cravings
In our study food cues robustly induced food cravings in the fasted state but not after sugar ingestion. This highlights the sensitivity to food cues during negative energy balance after the overnight fast in agreement with others (Stice et al., 2013). Moreover, food cravings increase was negatively associated with body fat, BMI, and leptin, revealing the moderating effect of body composition and leptin levels. Indeed, negative correlation of leptin levels with food cue induced craving increase revealed that individuals with lower leptin were more susceptible to food cues in fasted state suggesting an influence of leptin on cravings response to food cues. Leptin was shown to modify mesolimbic dopamine responsiveness to food cues (Grosshans et al., 2012; Opland, Leinninger, & Myers, 2010). Former work revealed that leptin levels were negatively associated with craving/hunger during energy restriction (Hopkins et al., 2014; Mars, de Graaf, de Groot, van Rossum, & Kok, 2006). However, Wever et al. (Wever et al., 2021) found a small positive association between high versus low caloric food cue reactivity and leptin levels in an fMRI study. Outcomes could be interpreted as a differential influence of leptin with negative associations with food cue reactivity and positive correlation of leptin with trait craving seen in our study. Cravings association with leptin was not seen after sugar intake suggesting that glucose and insulin increase dominate acute negative feedback mechanisms towards the mesolimbic system, apart from other potential mechanisms (vagal, hormones). However, negative associations of leptin with AUC were even seen after the ingestion trial showing that medium term adjustment of eating behaviour was still moderated by leptin levels after pre-load with sugar and concomitant homeostatic regulation. Moreover, associations of leptin with food cravings were not detected after mouth rinse as well as with AUC after mouth rinse trial, showing that taste and food cues dominated the motivational drive towards food in relation to high road regulation (de Araujo et al., 2020). This notion is supported by the positive association of food cravings with AUC after the rinse trial suggesting that feedforward responses via taste and food cues influenced eating behaviour encouraging subsequent intake.
Summarised, our study suggests that taste/flavour in connection with food cues generate an error signal which is experienced as food cravings, and that the receipt of sugars with concomitant physiological responses lead to extinction of the signal and concomitant reduction in food craving. Taste/flavour in connection with food cues without receipt of nutrients seemed to motivate food intake in the following period and suggest the importance of sensory-metabolic mismatch for food craving experience and eating behaviour.
Our study had several limitations; we did not measure brain activity during the experimental trials, therefore the interpretations of our outcomes regarding a potential error signal produced by the combination of taste and food cues regarding food craving responses need to be further validated by fMRI studies. Moreover, our sample population did not include people with eating disorders and severe obesity, therefore, our findings cannot be extrapolated to those populations.
Supplementary Material
The following supporting information can be downloaded at the website of this paper posted on Preprints.org. Food Craving Validation Study
Author Contributions
Conceptualization, H.P.K. and J.B.; Methodology, H.P.K., A.A., and J.B. ; Software, A.A.; Validation, H.P.K., A.A; Formal Analysis, H.P.K., A.A.; Investigation, A.A. and R.M.; Data Curation, H.P.K. and A.A; Writing – Original Draft Preparation, H.P.K. and A.A; Writing – Review & Editing, H.P.K., A.A., and J.B.; Visualization, A.A.; Supervision, H.P.K. and J.B; Project Administration, H.P.K.; Funding Acquisition, H.P.K. and A.A.
Funding
This research was funded by Embassy of Libya, grant number 13558
Institutional Review Board Statement
The study was conducted in accordance with the Declaration of Helsinki and approved by the Institutional Review Board (or Ethics Committee) of School of Psychology and Sport Science, Bangor University, UK (protocol code 2022-17200, date of approval: 05/08/2022 (validation study); protocol code 2023-17333, date of approval: 04/05/2023 (main research study)).
Informed Consent Statement
Informed consent was obtained from all subjects involved in the study.
Data Availability Statement
All data of this study are available at 10.5281/zenodo.17670127
Acknowledgment
The authors thank all the participants for taking part in the study.
Conflicts of Interest
The authors declare no conflict of interest.
References
- Adam, T. C. , & Epel, E. S. Stress, eating and the reward system. Physiol Behav 2007, 91, 449–458. [Google Scholar] [CrossRef] [PubMed]
- Aitken, T. J. , Liu, Z., Ly, T., Shehata, S., Sivakumar, N., La Santa Medina, N.,... Knight, Z. A. Negative feedback control of hypothalamic feeding circuits by the taste of food. Neuron 2024, 112, 3354–3370. [Google Scholar] [CrossRef]
- Alabduljader, K. , Cliffe, M., Sartor, F., Papini, G., Cox, W. M., & Kubis, H. P. Ecological momentary assessment of food perceptions and eating behavior using a novel phone application in adults with or without obesity. Eat Behav 2018, 30, 35–41. [Google Scholar] [CrossRef]
- Baker, T. B. , Morse, E., & Sherman, J. E. The motivation to use drugs: a psychobiological analysis of urges. Nebr Symp Motiv 1986, 34, 257–323. [Google Scholar]
- Berridge, K. C. From prediction error to incentive salience: mesolimbic computation of reward motivation.
Eur J Neurosci 2012, 35, 1124–1143. [Google Scholar] [CrossRef]
- Berthoud, H. R. Vagal and hormonal gut-brain communication: from satiation to satisfaction
. Neurogastroenterol Motil 2008, 20 Suppl 1(0 1), 64–72. [Google Scholar] [CrossRef]
- Block, G., & Hartman, A. M. Issues in reproducibility and validity of dietary studies. Am J Clin Nutr 1989, 50(5 Suppl), 1133-1138. 1133. [CrossRef]
- Boswell, R. G. , & Kober, H. Food cue reactivity and craving predict eating and weight gain: a meta-analytic review. Obes Rev 2016, 17, 159–177. [Google Scholar] [CrossRef]
- Brierley, D. I. , & de Lartigue, G. Reappraising the role of the vagus nerve in GLP-1-mediated regulation of eating. Br J Pharmacol 2022, 179, 584–599. [Google Scholar] [CrossRef]
- Brummer, J. , Glasbrenner, C., Hechenbichler Figueroa, S., Koehler, K., & Hochsmann, C. Continuous glucose monitoring for automatic real-time assessment of eating events and nutrition: a scoping review. Front Nutr 2023, 10, 1308348. [Google Scholar] [CrossRef] [PubMed]
- Burdakov, D. , Luckman, S. M., & Verkhratsky, A. Glucose-sensing neurons of the hypothalamus. Philos Trans R Soc Lond B Biol Sci 2005, 360, 2227–2235. [Google Scholar] [CrossRef] [PubMed]
- Campos, A., Port, J. D., & Acosta, A. Integrative Hedonic and Homeostatic Food Intake Regulation by the Central Nervous System: Insights from Neuroimaging. Brain Sci 2022, 12(4). [CrossRef]
- Cecil, J. E. , Castiglione, K., French, S., Francis, J., & Read, N. W. Effects of intragastric infusions of fat and carbohydrate on appetite ratings and food intake from a test meal. Appetite 1998, 30, 65–77. [Google Scholar] [CrossRef]
- Cepeda-Benito, A. , Fernandez, M. C., & Moreno, S. Relationship of gender and eating disorder symptoms to reported cravings for food: construct validation of state and trait craving questionnaires in Spanish. Appetite 2003, 40, 47–54. [Google Scholar] [CrossRef]
- Cepeda-Benito, A. , Gleaves, D. H., Fernandez, M. C., Vila, J., Williams, T. L., & Reynoso, J. The development and validation of Spanish versions of the State and Trait Food Cravings Questionnaires. Behav Res Ther 2000, 38, 1125–1138. [Google Scholar] [CrossRef]
- Chambers, A. P. , Sandoval, D. A., & Seeley, R. J. Integration of satiety signals by the central nervous system. Curr Biol 2013, 23, R379–R388. [Google Scholar] [CrossRef]
- Chao, A. M. , Grilo, C. M., & Sinha, R. Food cravings, binge eating, and eating disorder psychopathology: Exploring the moderating roles of gender and race. Eat Behav 2016, 21, 41–47. [Google Scholar] [CrossRef] [PubMed]
- Clarke, G. S. , Page, A. J., & Eldeghaidy, S. The gut-brain axis in appetite, satiety, food intake, and eating behavior: Insights from animal models and human studies. Pharmacol Res Perspect 2024, 12, e70027. [Google Scholar] [CrossRef]
- Cogan, B. , & Cooper, J. A. Differential effects of nutritive and non-nutritive sweet mouth rinsing on appetite in adults with obesity. Appetite 2024, 193, 107133. [Google Scholar] [CrossRef]
- Cohen, S. , Kamarck, T., & Mermelstein, R. A global measure of perceived stress. J Health Soc Behav 1983, 24, 385–396. [Google Scholar]
- Costanzo, A. , Russell, C. G., Lewin, S., & Keast, R. A Fatty Acid Mouth Rinse Decreases Self-Reported Hunger and Increases Self-Reported Fullness in Healthy Australian Adults: A Randomized Cross-Over Trial. Nutrients 2020, 12(3). [CrossRef]
- Craig, C. L. , Marshall, A. L., Sjostrom, M., Bauman, A. E., Booth, M. L., Ainsworth, B. E.,... Oja, P. International physical activity questionnaire: 12-country reliability and validity. Med Sci Sports Exerc 2003, 35, 1381–1395. [Google Scholar] [CrossRef]
- Crawford, J. R. , & Henry, J. D. The positive and negative affect schedule (PANAS): construct validity, measurement properties and normative data in a large non-clinical sample. Br J Clin Psychol 2004, 43(Pt 3), 245-265. [CrossRef]
- Creze, C. , Candal, L., Cros, J., Knebel, J. F., Seyssel, K., Stefanoni, N.,... Toepel, U. The Impact of Caloric and Non-Caloric Sweeteners on Food Intake and Brain Responses to Food: A Randomized Crossover Controlled Trial in Healthy Humans. Nutrients 2018, 10(5). [CrossRef]
- Dalton, M. , Finlayson, G., Hill, A., & Blundell, J. Preliminary validation and principal components analysis of the Control of Eating Questionnaire (CoEQ) for the experience of food craving. Eur J Clin Nutr 2015, 69, 1313–1317. [Google Scholar] [CrossRef] [PubMed]
- de Araujo, I. E. , Schatzker, M., & Small, D. M. Rethinking Food Reward. Annu Rev Psychol 2020, 71, 139–164. [Google Scholar] [CrossRef]
- Fogelholm, M. , Malmberg, J., Suni, J., Santtila, M., Kyrolainen, H., Mantysaari, M., & Oja, P. International Physical Activity Questionnaire: Validity against fitness. Med Sci Sports Exerc 2006, 38, 753–760. [Google Scholar] [CrossRef] [PubMed]
- Garcia-Garcia, I. , Narberhaus, A., Marques-Iturria, I., Garolera, M., Radoi, A., Segura, B.,... Jurado, M. A. Neural responses to visual food cues: insights from functional magnetic resonance imaging. Eur Eat Disord Rev 2013, 21, 89–98. [Google Scholar] [CrossRef]
- Garcia, S. C. , & Hormes, J. M. The moderating role of food cravings in the relationship between weight suppression and eating disorder psychopathology in college students. Front Psychol 2024, 15, 1343048. [Google Scholar] [CrossRef]
- Garutti, M. , Sirico, M., Noto, C., Foffano, L., Hopkins, M., & Puglisi, F. Hallmarks of Appetite: A Comprehensive Review of Hunger, Appetite, Satiation, and Satiety. Curr Obes Rep 2025, 14, 12. [Google Scholar] [CrossRef]
- Gendall, K. A. , Joyce, P. R., & Sullivan, P. F. Impact of definition on prevalence of food cravings in a random sample of young women. Appetite 1997, 28, 63–72. [Google Scholar] [CrossRef]
- Grosshans, M. , Vollmert, C., Vollstadt-Klein, S., Tost, H., Leber, S., Bach, P.,... Kiefer, F. Association of leptin with food cue-induced activation in human reward pathways. Arch Gen Psychiatry 2012, 69, 529–537. [Google Scholar] [CrossRef]
- Han, P. , Bagenna, B., & Fu, M. The sweet taste signalling pathways in the oral cavity and the gastrointestinal tract affect human appetite and food intake: a review. Int J Food Sci Nutr 2019, 70, 125–135. [Google Scholar] [CrossRef] [PubMed]
- Heisler, L. K. , & Lam, D. D. An appetite for life: brain regulation of hunger and satiety. Curr Opin Pharmacol 2017, 37, 100–106. [Google Scholar] [CrossRef]
- Holst, J. J. The incretin system in healthy humans: The role of GIP and GLP-1. Metabolism 2019, 96, 46–55. [Google Scholar] [CrossRef] [PubMed]
- Hopkins, M. , Gibbons, C., Caudwell, P., Webb, D. L., Hellstrom, P. M., Naslund, E.,... Finlayson, G. Fasting Leptin Is a Metabolic Determinant of Food Reward in Overweight and Obese Individuals during Chronic Aerobic Exercise Training. Int J Endocrinol 2014, 2014, 323728. [Google Scholar] [CrossRef]
- Huerta, C. I. , Sarkar, P. R., Duong, T. Q., Laird, A. R., & Fox, P. T. Neural bases of food perception: coordinate-based meta-analyses of neuroimaging studies in multiple modalities. Obesity (Silver Spring) 2014, 22, 1439–1446. [Google Scholar] [CrossRef]
- Hughes, A. D. , & Chaturvedi, N. Estimation of Maximal Oxygen Consumption and Heart Rate Recovery Using the Tecumseh Sub-Maximal Step Test and their Relationship to Cardiovascular Risk Factors. Artery Res 2017, 18, 29–35. [Google Scholar] [CrossRef]
- Jastreboff, A. M. , Sinha, R., Lacadie, C., Small, D. M., Sherwin, R. S., & Potenza, M. N. Neural correlates of stress- and food cue-induced food craving in obesity: association with insulin levels. Diabetes Care 2013, 36, 394–402. [Google Scholar] [CrossRef] [PubMed]
- Kanoski, S. E. , & Boutelle, K. N. Food cue reactivity: Neurobiological and behavioral underpinnings. Rev Endocr Metab Disord 2022, 23, 683–696. [Google Scholar] [CrossRef] [PubMed]
- Karlsson, J. , Persson, L. O., Sjostrom, L., & Sullivan, M. Psychometric properties and factor structure of the Three-Factor Eating Questionnaire (TFEQ) in obese men and women. Results from the Swedish Obese Subjects (SOS) study. Int J Obes Relat Metab Disord 2000, 24, 1715–1725. [Google Scholar] [CrossRef]
- Kemps, E. , & Tiggemann, M. Hand-held dynamic visual noise reduces naturally occurring food cravings and craving-related consumption. Appetite 2013, 68, 152–157. [Google Scholar] [CrossRef]
- Kemps, E. , Tiggemann, M., & Grigg, M. Food cravings consume limited cognitive resources. J Exp Psychol Appl 2008, 14, 247–254. [Google Scholar] [CrossRef] [PubMed]
- Kroemer, N. B. , Krebs, L., Kobiella, A., Grimm, O., Pilhatsch, M., Bidlingmaier, M.,... Smolka, M. N. Fasting levels of ghrelin covary with the brain response to food pictures. Addict Biol 2013, 18, 855–862. [Google Scholar] [CrossRef]
- Kroemer, N. B. , Krebs, L., Kobiella, A., Grimm, O., Vollstadt-Klein, S., Wolfensteller, U.,... Smolka, M. N. (Still) longing for food: insulin reactivity modulates response to food pictures. Hum Brain Mapp 2013, 34, 2367–2380. [Google Scholar] [CrossRef]
- Lasschuijt, M. P. , de Graaf, K., & Mars, M. Effects of Oro-Sensory Exposure on Satiation and Underlying Neurophysiological Mechanisms-What Do We Know So Far? 2021, 13(5). [CrossRef]
- Lauritsen, J. V. , Bergmann, N., Junker, A. E., Gyldenlove, M., Skov, L., Gluud, L. L.,... Knop, F. K. Oral glucose has little or no effect on appetite and satiety sensations despite a significant gastrointestinal response. Eur J Endocrinol 2023, 189, 619–626. [Google Scholar] [CrossRef]
- Lee, E. H. Review of the psychometric evidence of the perceived stress scale.
Asian Nurs Res (Korean Soc Nurs Sci) 2012, 6, 121–127. [Google Scholar] [CrossRef]
- Mars, M. , de Graaf, C., de Groot, C. P., van Rossum, C. T., & Kok, F. J. Fasting leptin and appetite responses induced by a 4-day 65%-energy-restricted diet. Int J Obes (Lond) 2006, 30, 122–128. [Google Scholar] [CrossRef]
- Martens, M. J. , Born, J. M., Lemmens, S. G., Karhunen, L., Heinecke, A., Goebel, R.,... Westerterp-Plantenga, M. S. Increased sensitivity to food cues in the fasted state and decreased inhibitory control in the satiated state in the overweight. Am J Clin Nutr 2013, 97, 471–479. [Google Scholar] [CrossRef]
- Matthan, N. R. , Ausman, L. M., Meng, H., Tighiouart, H., & Lichtenstein, A. H. Estimating the reliability of glycemic index values and potential sources of methodological and biological variability. Am J Clin Nutr 2016, 104, 1004–1013. [Google Scholar] [CrossRef] [PubMed]
- McKnight, A. D. , & Alhadeff, A. L. Nutrient detection pathways for food reinforcement and satiation. Curr Opin Neurobiol 2025, 92, 103040. [Google Scholar] [CrossRef]
- Merino, J. , Linenberg, I., Bermingham, K. M., Ganesh, S., Bakker, E., Delahanty, L. M.,... Valdes, A. M. Validity of continuous glucose monitoring for categorizing glycemic responses to diet: implications for use in personalized nutrition. Am J Clin Nutr 2022, 115, 1569–1576. [Google Scholar] [CrossRef]
- Meule, A. , & Kubler, A. Double trouble. Trait food craving and impulsivity interactively predict food-cue affected behavioral inhibition. Appetite 2014, 79, 174–182. [Google Scholar] [CrossRef]
- Neary, N. M. , Goldstone, A. P., & Bloom, S. R. Appetite regulation: from the gut to the hypothalamus. Clin Endocrinol (Oxf) 2004, 60, 153–160. [Google Scholar] [CrossRef]
- Nederkoorn, C. , Smulders, F. T., & Jansen, A. Cephalic phase responses, craving and food intake in normal subjects. Appetite 2000, 35, 45–55. [Google Scholar] [CrossRef]
- Nicola, S. M. Reassessing wanting and liking in the study of mesolimbic influence on food intake.
Am J Physiol Regul Integr Comp Physiol 2016, 311, R811–R840. [Google Scholar] [CrossRef]
- O'Doherty, J. P. , Deichmann, R., Critchley, H. D., & Dolan, R. J. Neural responses during anticipation of a primary taste reward. Neuron 2002, 33, 815–826. [Google Scholar] [CrossRef]
- Obradovic, M. , Sudar-Milovanovic, E., Soskic, S., Essack, M., Arya, S., Stewart, A. J.,... Isenovic, E. R. Leptin and Obesity: Role and Clinical Implication. Front Endocrinol (Lausanne) 2021, 12, 585887. [Google Scholar] [CrossRef]
- Opland, D. M. , Leinninger, G. M., & Myers, M. G., Jr. Modulation of the mesolimbic dopamine system by leptin. Brain Res 2010, 1350, 65–70. [Google Scholar] [CrossRef]
- Orquin, J. L. , & Kurzban, R. A meta-analysis of blood glucose effects on human decision making. Psychol Bull 2016, 142, 546–567. [Google Scholar] [CrossRef]
- Overduin, J. , & Jansen, A. Food Cue Reactivity in Fasting and Non-Fasting Subjects. Eur Eat Disord Rev 1996, 4, 249–259. [Google Scholar] [CrossRef]
- Pelchat, M. L. Food cravings in young and elderly adults
. Appetite 1997, 28, 103–113. [Google Scholar] [CrossRef] [PubMed]
- Pelchat, M. L. , Johnson, A., Chan, R., Valdez, J., & Ragland, J. D. Images of desire: food-craving activation during fMRI. Neuroimage 2004, 23, 1486–1493. [Google Scholar] [CrossRef]
- Polk, S. E. , Schulte, E. M., Furman, C. R., & Gearhardt, A. N. Wanting and liking: Separable components in problematic eating behavior? Appetite 2017, 115, 45–53. [Google Scholar] [CrossRef]
- Poppitt, S. D. , Shin, H. S., McGill, A. T., Budgett, S. C., Lo, K., Pahl, M.,... Ingram, J. R. Duodenal and ileal glucose infusions differentially alter gastrointestinal peptides, appetite response, and food intake: a tube feeding study. Am J Clin Nutr 2017, 106, 725–735. [Google Scholar] [CrossRef]
- Pursey, K. M. , Stanwell, P., Callister, R. J., Brain, K., Collins, C. E., & Burrows, T. L. Neural responses to visual food cues according to weight status: a systematic review of functional magnetic resonance imaging studies. Front Nutr 2014, 1, 7. [Google Scholar] [CrossRef]
- Ravelli, M. N. , & Schoeller, D. A. Traditional Self-Reported Dietary Instruments Are Prone to Inaccuracies and New Approaches Are Needed. Front Nutr 2020, 7, 90. [Google Scholar] [CrossRef] [PubMed]
- Reichenberger, J. , Richard, A., Smyth, J. M., Fischer, D., Pollatos, O., & Blechert, J. It's craving time: time of day effects on momentary hunger and food craving in daily life. Nutrition 2018, 55-56, 15-20. [CrossRef]
- Roger, C. , Lasbleiz, A., Guye, M., Dutour, A., Gaborit, B., & Ranjeva, J. P. The Role of the Human Hypothalamus in Food Intake Networks: An MRI Perspective. Front Nutr 2021, 8, 760914. [Google Scholar] [CrossRef]
- Rolls, E. T. Taste, olfactory, and food reward value processing in the brain. Prog Neurobiol 2015, 127-128, 64-90. [CrossRef]
- Sartor, F. , Donaldson, L. F., Markland, D. A., Loveday, H., Jackson, M. J., & Kubis, H. P. Taste perception and implicit attitude toward sweet related to body mass index and soft drink supplementation. Appetite 2011, 57, 237–246. [Google Scholar] [CrossRef]
- Schultes, B. , Panknin, A. K., Hallschmid, M., Jauch-Chara, K., Wilms, B., de Courbiere, F.,... Schmid, S. M. Glycemic increase induced by intravenous glucose infusion fails to affect hunger, appetite, or satiety following breakfast in healthy men. Appetite 2016, 105, 562–566. [Google Scholar] [CrossRef]
- Sclafani, A. , & Ackroff, K. Role of gut nutrient sensing in stimulating appetite and conditioning food preferences. Am J Physiol Regul Integr Comp Physiol 2012, 302, R1119–R1133. [Google Scholar] [CrossRef] [PubMed]
- Smeets, P. A. , Erkner, A., & de Graaf, C. Cephalic phase responses and appetite. Nutr Rev 2010, 68, 643–655. [Google Scholar] [CrossRef] [PubMed]
- Steinert, R. E. , & Beglinger, C. Nutrient sensing in the gut: interactions between chemosensory cells, visceral afferents and the secretion of satiation peptides. Physiol Behav 2011, 105, 62–70. [Google Scholar] [CrossRef]
- Stice, E. , Burger, K., & Yokum, S. Caloric deprivation increases responsivity of attention and reward brain regions to intake, anticipated intake, and images of palatable foods. Neuroimage 2013, 67, 322–330. [Google Scholar] [CrossRef]
- Stunkard, A. J. , & Messick, S. The three-factor eating questionnaire to measure dietary restraint, disinhibition and hunger. J Psychosom Res 1985, 29, 71–83. [Google Scholar] [CrossRef]
- Sun, W. , & Kober, H. Regulating food craving: From mechanisms to interventions. Physiol Behav 2020, 222, 112878. [Google Scholar] [CrossRef]
- Sundaresan, S. , Johnson, C., Dixon, K. B., Dole, M., Kilkelly, D., Antoun, J.,... Tamboli, R. Intraduodenal nutrient infusion differentially alters intestinal nutrient sensing, appetite, and satiety responses in lean and obese subjects. Am J Clin Nutr 2023, 118, 646–656. [Google Scholar] [CrossRef] [PubMed]
- Tack, J. , Verbeure, W., Mori, H., Schol, J., Van den Houte, K., Huang, I. H.,... Carbone, F. The gastrointestinal tract in hunger and satiety signalling. United European Gastroenterol J 2021, 9, 727–734. [Google Scholar] [CrossRef]
- Taylor, M. A review of food craving measures. Eat Behav 2019, 32, 101–110. [Google Scholar] [CrossRef]
- Tiffany, S. T. A cognitive model of drug urges and drug-use behavior: role of automatic and nonautomatic processes.
Psychol Rev 1990, 97, 147–168. [Google Scholar] [CrossRef]
- Veldhuizen, M. G. , Babbs, R. K., Patel, B., Fobbs, W., Kroemer, N. B., Garcia, E.,... Small, D. M. Integration of Sweet Taste and Metabolism Determines Carbohydrate Reward. Curr Biol 2017, 27, 2476–2485. [Google Scholar] [CrossRef]
- Vilarino-Garcia, T. , Polonio-Gonzalez, M. L., Perez-Perez, A., Ribalta, J., Arrieta, F., Aguilar, M.,... Sanchez-Margalet, V. Role of Leptin in Obesity, Cardiovascular Disease, and Type 2 Diabetes. Int J Mol Sci. [CrossRef]
- Volkow, N. D. , Wise, R. A., & Baler, R. The dopamine motive system: implications for drug and food addiction. Nat Rev Neurosci 2017, 18, 741–752. [Google Scholar] [CrossRef] [PubMed]
- Waise, T. Z. , Dranse, H. J., & Lam, T. K. The metabolic role of vagal afferent innervation. Nature reviews Gastroenterology & hepatology 2018, 15, 625–636. [Google Scholar]
- Watson, D. , Clark, L. A., & Tellegen, A. Development and validation of brief measures of positive and negative affect: the PANAS scales. J Pers Soc Psychol 1988, 54, 1063–1070. [Google Scholar] [CrossRef]
- Weingarten, H. P. , & Elston, D. The phenomenology of food cravings. Appetite 1990, 15, 231–246. [Google Scholar] [CrossRef]
- Weingarten, H. P. , & Elston, D. Food cravings in a college population. Appetite 1991, 17, 167–175. [Google Scholar] [CrossRef] [PubMed]
- Westland, J. C. Information loss and bias in likert survey responses.
PLoS One 2022, 17, e0271949. [Google Scholar] [CrossRef]
- Wever, M. C. M. , van Meer, F., Charbonnier, L., Crabtree, D. R., Buosi, W., Giannopoulou, A.,... Full4Health, c. Associations between ghrelin and leptin and neural food cue reactivity in a fasted and sated state. Neuroimage 2021, 240, 118374. [Google Scholar] [CrossRef] [PubMed]
|
Disclaimer/Publisher’s Note: The statements, opinions and data contained in all publications are solely those of the individual author(s) and contributor(s) and not of MDPI and/or the editor(s). MDPI and/or the editor(s) disclaim responsibility for any injury to people or property resulting from any ideas, methods, instructions or products referred to in the content. |
© 2025 by the authors. Licensee MDPI, Basel, Switzerland. This article is an open access article distributed under the terms and conditions of the Creative Commons Attribution (CC BY) license (http://creativecommons.org/licenses/by/4.0/).