
Submitted:
24 November 2025
Posted:
25 November 2025
You are already at the latest version
Abstract
Most modelling of photosynthesis of higher plants utilizes the Farquhar, Von Caemmerer, Berry photosynthesis model of C3 photosynthesis. At current air levels of CO2, C3 photosynthesis at high photosynthetic photon flux density is most often limited by the maximum capacity of RuBisco carboxylation, VCmax. This study tested whether experimentally determined values of VCmax corrected for variation in measurement temperature were consistent from week to week during mid-season in two major C3 crop species, soybean and wheat. Gas exchange was measured on single upper canopy leaves near mid-day on sunny days, at the current air temperature and humidity, every 3-9 days during mid-season for two years and was used to estimate VCmax. It was found that VCmax values corrected to the same temperature sometimes varied by a factor of about 1.5 in both species from day to day. Variation in VCmax was not associated with prior 4-day means of temperature, or cloudiness, or with day of year in either species. However, VCmax in both species and years was significantly negatively correlated with the leaf to air difference in water vapor pressure (VPD) at the time of measurement. The results indicate a strong negative impact of high VPD on mid-day leaf photosynthesis which was not evident from sub-stomatal CO2 concentrations, which varied little from day to day. Because VPD increases with global warming, these results indicate that increasing VPD could diminish crop growth beyond any direct effects of warming.
Keywords:
photosynthesis
; Rubisco
; vapor pressure deficit
; climate change
; wheat
; soybean
1. Introduction
Models of photosynthesis of higher plants are often used in diverse agronomic and ecological applications to predict the income of fixed carbon into ecosystems. Updated versions of the original Farquhar, von Caemmerer, Berry C3 photosynthesis model [1] are very widely used [e.g., [2,3,4,5,6]]. The model parameter, the maximum rate of carboxylation (VCmax), along with stomatal conductance (gs), are the rate limiting parameters at current air levels of CO2 and high light, under most environmental situations. VCmax increases exponentially with temperature over a wide range of temperatures. The temperature dependency of VCmax may vary considerably among species and with prior temperature exposure within species [e.g. [7,8,9]]. While the temperature dependency of VCmax is an important issue, this paper focuses on a more fundamental issue, the degree of variation in VCmax in the middle of a growing season, after accounting for different measurement temperatures. This study focused on the temporal variation in midday VCmax at high light for soybean and wheat crops during mid-season.
The Farquhar, von Caemmerer, Berry model [1] initially did not consider mesophyll conductance, and in many applications the model is still used without incorporating mesophyll conductance, because values for mesophyll conductance and its possible variation with Ci [10] remain unknown for most species. In wheat, estimates of VCmax made with and without estimates of mesophyll conductance produced very similar seasonal patterns [5].
Variation in leaf photosynthetic capacity with the light and temperature environment during leaf development, “acclimation”, is well known [11,12], with cool temperatures, above some lower limit, and high light generally leading to higher photosynthetic capacity when measured at moderate temperatures [9,13,14]. In this study, near mid-season, both soybean (an indeterminate cultivar) and wheat were still producing new leaves, so measurements of upper canopy leaves made over time were on leaves at higher nodes, with similar leaf ages of all measured leaves. This approach differs from prior studies of soybean and wheat [15,16] which compared leaves throughout a growing season, and where leaf age was more variable.
In wheat, Sun et al. [5] found that when measured at a constant 25 oC, VCmax ranged from about 80 to 125 mmol m-2 s-1 over the season, using the standard FVC model, and from about 70 to 115 mmol m-2 s-1 using the FVC model separating out mesophyll conductance. In that study, VCmax values generally decreased as growing degree days increased. In another study of wheat [15] maximum assimilation rates at midday measured at ambient temperatures ranged from 17 to 25 mmol m-2 s-1, with no clear seasonal pattern. In soybean, Bernacchi et al. [16] measured assimilation rate at ambient CO2 and temperature near midday in upper canopy leaves 4 to 6 times per year for three years, and found that rates varied from about 17 to 31 mmol m-2 s-1, with no clear seasonal pattern, although measurement temperature was also not constant in that study.
At high light, photosynthesis in plants with C3 metabolism may be limited by VCmax, Jmax, or TPU [17]. Limitation by the last two parameters is evident from little or no increase in photosynthesis with increased CO2. In this study we confirmed limitation of photosynthesis by VCmax each day by measuring photosynthesis of each leaf first at current air levels of CO2 (380 mmol mol-1) and then at 570 mmol mol-1of CO2. In all cases, photosynthetic rates were higher at the higher CO2 concentration by 20 to 40% for temperatures ranging from 17 to 32 oC. This test indicated that photosynthesis measured at the lower CO2 concentration was limited by VCmax in all cases.
Global warming not only increases air temperature, but, because of the exponential increase in saturated water vapor pressure with temperature, warming also increases the daytime leaf to air difference in water vapor pressure (VPD) [18]. VPD is the driving force for transpiration. It is becoming recognized from observations of crop yields and weather variables over time, as well as crop modelling studies that high VPD often reduces crop yields in current and projected warmer environments, sometimes more so than would increased air temperatures [18,19,20,21,22,23,24,25,26].
2. Results
Photosynthetic carbon dioxide assimilation rates (A) measured at ambient temperature, humidity, and carbon dioxide concentration in full sunlight varied greatly from day to day in both wheat and soybean (Figure 1), with no clear relationship between A and temperature in either species. Measurements in wheat, in the spring, covered a wider range of temperatures than the summer measurements in soybeans.
In both species, VCmax generally increased with the measurement temperature, but with very large variability among days within the same year (Figure 2). Figure 2 also includes the modelled response of VCmax to temperature for both species, with the values of VCmax for each species set to approximately match the upper limit of measured values. Clearly, while a few of the measured values matched this upper limit in each species over a wide range of temperatures, most of the measured values were lower, with several values only 60% of this upper limit. In wheat, the values of VCmax averaged 83% of the upper limit of values in Figure 2, and in soybeans they averaged 75% of the upper limit of values. Therefore, for both species, day to day variation in VCmax values substantially reduced midday photosynthesis.
Possible causes of variation in VCmax across measurement days were explored by regressions of the actual VCmax on a given date relative to that expected from the measurement temperature taken from Figure 2 against the variables of a) the difference between the measurement temperature and the mean temperature of the prior four days, b) the amount of photosynthetically active radiation (PAR) averaged over the four days prior to the measurements day of year, and c) day of year. The four-day interval was chosen based on the high correlation between the light and temperature environment of the four days before reaching full expansion to the photosynthetic capacity of fully expanded soybean leaves [28]. No comparable information was found for wheat. No linear regressions between the fraction of VCmax and these three environmental variables were significant at P = 0.05 in either soybeans or wheat (Figure 3, Figure 4 and Figure 5). Multiple linear regressions of the fraction of VCmax on these three environmental variables were also not significant in either species.
Variation in Ci across measurements dates showed no clear relationship with VPD in either species (Figure 6). Mean Ci values ranged from about 260 to 320 mmol mol-1 in wheat and 280 to 330 mmol mol-1 in soybean on the different measurement dates.
In both species and in both years, the ratio of the observed VCmax to that expected based on the measurement temperature decreased linearly with the VPD on the day of leaf gas exchange measurement (Figure 7). Values of r2 of the linear regressions ranged from 0.72 to 0.91 for the two species and two years of data, and all of the slopes were significant at the P = 0.05 level (Table 1). Combined over the two years, the r2 values were 0.517 (P = 0.0056) for wheat and 0.612 (P = 0.0003) for soybean. The overall mid-season means of 17 to 25% reductions in midday VCmax values for these two species (Figure 2) occurred for average VPD values of only 12-13 hPa, and the maximum VPD values were about 17 hPa in both species.
3. Discussion
Reductions in photosynthesis at high light caused by increases in VPD are well-known consequences of reduced stomatal conductance at high VPD [18,28,29,30,31]. Reductions in stomatal conductance with increasing VPD result in progressively lower internal CO2 concentrations, which in turn reduce photosynthesis. Such experiments have almost exclusively been conducted on individual leaves or parts of leaves, where the VPD around the rest of the plant has been constant. Results of these types of experiments are generally consistent with a constant VCmax over the range of experimental VPDs, and contrast with the results presented here, where VCmax significantly decreased with increasing VPD. A clear difference between the results presented here and previous experiments in which single leaves or parts of leaves were exposed to high VPD, is that in this study, the day-to-day variation in the VPD values for the measured leaves also occurred for the whole plants. This distinction is important, because exposure of whole plants to increased VPD would likely increase whole plant transpiration, which in turn would decrease leaf water potential and thereby also decrease VCmax, as in typical soil water stress responses. The concept of high VPD reducing VCmax by lowering leaf water potential of whole plants is supported by reports of high VPD reducing canopy photosynthesis in C4 species such as maize and sorghum [18,32,33], because in single leaves of C4 species, high VPD generally does not decrease photosynthesis substantially despite reducing stomatal conductance, since photosynthesis in C4 leaves is usually nearly saturated for CO2 at ambient CO2 concentrations [34,35]. Reductions in photosynthesis at a given Ci value caused by high VPD were previously reported in potato (C3 metabolism) and sorghum (C4 metabolism) under field conditions [36], although those reports were not analyzed in terms of changes in parameters of photosynthesis models. Reductions in photosynthesis at a given Ci value caused by high VPD occurred for both ambient and elevated CO2 growth conditions, in both potato and sorghum [36]. The reductions in photosynthesis at saturating Ci values in potato also indicate that the photosynthesis model parameter Jmax was also reduced by the high VPD. In cases such as potato and sorghum, rising atmospheric CO2 did not prevent high VPD from reducing photosynthesis.
This study identified VPD as an important factor affecting day to day variation in VCmax of soybean and wheat crops in mid-season under the current climate. Because global climate change would increase VPD along with CO2 and temperature, impacts of high VPD on these crops, and others, will become more severe. A reduction in VCmax by high VPD, as shown in these experiments, would, by itself, reduce light-saturated leaf photosynthesis at limiting CO2 levels, with potential consequences of reducing crop growth and yield. The maximum VPD values in these observations are generally less than the daily maximum values, because the measurements presented here were all taken before solar noon in order to avoid later cloudiness, and maximum daily VPDs would coincide with maximum daily air temperatures, which normally occur a few hours after solar noon. Therefore, the maximum impacts of high VPD on photosynthesis of these two species were likely larger than the impacts reported here, and they probably would also be larger in less humid climates.
Because VCmax is reduced by high VPD applied to the whole plant, climate warming would decrease VCmax and whole plant photosynthesis by increasing VPD, regardless of direct impacts of high temperature on photosynthesis. Reduction in whole plant photosynthesis by rising VPD would decrease plant growth in general, and agronomic yield. Observations of reduced photosynthesis by high VPD even at elevated CO2 concentrations in potato and sorghum [37], suggest that rising atmospheric CO2 concentrations would not overcome negative effects of rising VPD on photosynthesis and plant growth due to climate warming.
4. Materials and Methods
Both crops were grown at the South Farm of the Beltsville Agricultural Research Center, in Beltsville, Maryland USA. The 5m x 5m plot used for both crops (39 ON, 77 OW, elevation 30 m) has a Codorus silt loam soil. This plot was surrounded by extensive (several hectare) soybean and wheat crops which were not part of the experiment. The row width was 30 cm for soybean, with a planting density of 40 plants m-2, and for wheat the row width was 20 cm, and the plant density was 120 plants m-2. Wheat plots were fertilized with 10-10-10 NPK at the rate of 25 g N m-2 in early spring. No pesticides were applied to either crop species, and weeds were pulled by hand. The plots were not irrigated, but frequent precipitation prevented any significant soil water deficits. A weather station adjacent to the plot recorded light, air temperature, humidity and precipitation. The mean air temperatures for these soybean and wheat growing seasons were 24.9 and 23.2 oC for soybean, and 10.5 and 13.3 oC for wheat, which are close to the long-term mean temperatures at this location at those times of year.
Measurements of leaf gas exchange on soybean (Glycine max L. cv. Spencer) and wheat (Triticum aestivum L. cv. Choptank) were conducted during the spring (wheat) and summer (soybean) in 2013 and 2014. Choptank is a winter wheat variety, and was planted in late October of 2012 and 2013 for leaf gas exchange measurements in the springs of 2013 and 2014. The soybean crops were planted in the same plots after the wheat crops were harvested, in late May of 2013 and 2014 for measurements of leaf gas exchange in mid-summer of 2013 and 2014. The plot was tilled with a rotary tiller a few days before the planting of each crop. Weeds were removed by hand pulling.
Leaf gas exchange was measured using a CIRAS-3 portable gas exchange system, with a leaf cuvette with a 2.5 cm diameter circular window. The cuvette air temperature was set to match that of the outside at the beginning of gas exchange measurements each day. Measurements were confined to mid-morning to noon on clear days, and no lamp was used. The PPFD inside the cuvette was at least 1500 mmol m-2 s-1 for all measurements. Air entering the cuvette was partly dried, so that air within the cuvette had nearly the same water vapor pressure as that of the outside air. Leaves to be measured were selected as recently fully expanded leaves which had been fully illuminated by the sun for at least several minutes just before enclosure in the leaf cuvette. Each leaf was first measured at a CO2 concentration of 380 mmol mol-1 and then at 570 mmol mol-1. On each measurement date, three leaves were measured at both CO2 concentrations. Steady gas exchange rates occurred within about a minute of enclosure in the cuvette, and time was allowed for stomatal conductance to decrease to a new stable value after shifting to the higher measurement CO2 concentration. For wheat, leaf gas exchange measurements were made from days of year 100 to 152, and for soybean, from days of year 198 to 261.
From the observed means values of A, Ci, and leaf temperature measured at the external CO2 concentration of 380 mmol mol-1 for each species and measurement date, values of VCmax were calculated from the Farquhar, von Caemmerer, Berry photosynthesis model [1] not incorporating mesophyll conductance, because mesophyll conductance values and their temperature dependence were not known. The 20 to 40% increase in A when external CO2 was increased to 570 mmol mol-1 indicated that A at the lower Ci was limited by VCmax in all cases.
Funding
This research received no external funding.
Data Availability Statement
Data not contained in the article are available from the author upon request.
Acknowledgments
Thanks to Frances Caulfield and Martha Tomecek for technical assistance.
Conflicts of Interest
The author declares no conflicts of interest.
References
- Farquhar, G.D.; von Caemmerer, S.; Berry, J.A. A biochemical model of photosynthetic CO2 assimilation in leaves of C3 species. Planta 1980, 149, 78–90. [CrossRef]
- Wittemann, M.; Andersson, M.X.; Ntirugulirwa, B.; Tarvainen, L.; Wallin, G.; Uddling, J. Temperature acclimation of net photosynthesis and its underlying component processes in four tropical tree species. Tree Physiol. 2022, 42, 1188-1202. [CrossRef]
- Sargent, D. et al. The importance of species-specific and temperature-sensitive parameterization of A/Ci models: A case study using cotton (Gossypium hirsutum L.) and the automated ‘OptiPitACi’ R-oackage. Plant Cell Environ. 2024, 47, 1701-1715. [CrossRef]
- Kumarathunge, D.P. et al. Acclimation and adaptation components of the temperature dependence of plant photosynthesis at the global scale. New Phytol. 2019, 222, 768-784. [CrossRef]
- Sun, J.; Sun, J.; Feng, Z. Modelling photosynthesis in flag leaves of winter wheat (Triticum aestivum) considering the variation in photosynthesis parameters during development. Func. Pl. Biol. 2015, 42, 1036-1044. [CrossRef]
- Bagley, J.; Rosenthal, D.M.; Ruiz-Vera, M.; Siebers, M.H.; Kumar, P.; Ort, D.R.; Bernacchi, C.J. The influence of photosynthetic acclimation to rising CO2 and warmer temperatures on leaf and canopy photosynthesis models. Global Biogeochem. Cycles 2015, 29, 194-206. [CrossRef]
- Bunce, J. Changes in the Responses of Leaf Gas Exchange to Temperature and Photosynthesis Model Parameters in Four C3 Species in the Field. Plants 2025, 14, 550. [CrossRef]
- Bunce, J.A. Thermal acclimation of the temperature dependence of the VCmax of Rubisco in quinoa. Photosynthetica 2018, 56, 1171–1176. [CrossRef]
- Kattge, J.; Knorr, W. Temperature acclimation in a biochemical model of photosynthesis: A reanalysis of data from 36 species. Plant Cell Environ. 2007, 30, 1176–1190. [CrossRef]
- Bunce, J.A. Three Methods of Estimating Mesophyll Conductance Agree Regarding its CO2 Sensitivity in the Rubisco-Limited Ci Range. Plants 2018, 7, 62. [CrossRef]
- Bunce, J.A.: Acclimation of photosynthesis to temperature in eight cool and warm climate herbaceous C3 species: Temperature dependence of parameters of a biochemical photosynthesis model. Photosynth. Res. 2000, 63, 59-67. [CrossRef]
- Yamori, W.; Hikosaka, H.; Way, D.A. Temperature responses of photosynthesis in C3, C4, and CAM plants: Temperature acclimation and temperature adaptation. Photosynth. Res. 2014, 119, 101–117. [CrossRef]
- Slatyer, R.O.; Ferrar, P.J. Altitudinal variation in the photosynthetic characteristics of snow gum, Eucalyptus pauciflora Sieb. Ex Spring. II. Effect of growth under controlled conditions. Aust. J. Plant Physiol. 1977, 4, 289–299. [CrossRef]
- Hikosaka, K.; Ishikawa, K.; Borjigidai, A.; Muller, O.; Onoda, Y.: Temperature acclimation of photosynthesis: mechanisms involved in the changes in temperature dependence of photosynthetic rate. J. exp. Bot. 2006, 57, 291-302. [CrossRef]
- Garcia, R.L. et al. Photosynthesis and stomatal conductance of spring-wheat leaves: field response to continuous free-air atmospheric CO2 enrichment. Plant Cell and Environ 1988, 21, 659-689.
- Bernacchi, C.J. et al. Hourly and seasonal variation in photosynthesis and stomatal conductance of soybean grown at future CO2 and ozone concentrations for 3 years under fully open-air field conditions. Plant Cell Environ 2006, 29, 2077-2090. [CrossRef]
- Sharkey, T.D.; Bernacchi, C.J.; Farquhar, G.D.; Singsaas, E.L. Fitting photosynthetic carbon dioxide response curves for C3 leaves. Plant Cell Environ. 2007, 30, 1035–1040. [CrossRef]
- Novick, K.A. et al. The impacts of rising vapour pressure deficit in natural and managed ecosystems. Plant Cell Environ. 2024, 47, 3561–3589. [CrossRef]
- Hsiao, J.; Swann, A.L.S.; Kim, S.-H. Maize yield under a changing climate: the hidden role of vapor pressure deficit. Agric. For. Met., 2019, 279, 107692. [CrossRef]
- Kimm, H.; et al. (2020) Redefining droughts for the US Corn Belt: the dominant role of atmospheric vapor pressure deficit over soil moisture in regulating stomatal behavior of maize and soybean. Agric. For. Met., 2020, 287, 107930. [CrossRef]
- Li, Y., Guan, K.; et al. Toward building a transparent statistical model for improving crop yield prediction: modeling rainfed corn in the US. Field Crops Res., 2019, 234, 55–65. [CrossRef]
- Zhou, W.; Guan, K.; Peng, B.; Shi, J.; Jiang, C.; Wardlow, B. et al. Connections between the hydrological cycle and crop yield in the rainfed US Corn Belt. J.Hydrol., 2020, 590, 125398. [CrossRef]
- Lobell, D.B.; Roberts, M.J.; Schlenker, W.; Braun, N.; Little, B.B.; Rejesus, R.M. et al. Greater sensitivity to drought accompanies maize yield increase in the US Midwest. Science, 2014, 344, 516–519. [CrossRef]
- Mourtzinis, S.; Specht, J.E.; Conley, S.P. Defining optimal soybean sowing dates across the US. Scientific Reports, 2019, 9, 2800. [CrossRef]
- Zhang, S.; Tao, F.; Zhang, Z. Spatial and temporal changes in vapor pressure deficit and their impacts on crop yields in China during 1980–2008. J. Meteor. Res., 2017, 31, 800–808. [CrossRef]
- Sun, W.; Fleisher, D.; Timlin, D.; Ray, C.; Wang, Z.; Beegum, S. et al. (2023) Projected long-term climate trends reveal the critical role of vapor deficit for soybean yields in the US Midwest. Sci. Total Environ., 2023, 878, 162960. [CrossRef]
- Bunce, J. A. Effects of weather during leaf development on photosynthetic characteristics of soybean leaves. Photosyn. Res. 1985, 6, 215-220. [CrossRef]
- Cowan I.R. Stomatal behavior and environment. Stomatal behavior and environment. Adv. In Bot. Res. 1977; 4: 117-228.
- Farquhar, G.D. Feedforward responses of stomata to humidity. Austral J Pl Physiol. 1978, 5, 787-800. [CrossRef]
- Lange, O.L.; Losch, R.; Schulze, E-D.; Kappen, L. Responses of stomata to changes in humidity. 1971. Planta 1971, 100, 567-577. [CrossRef]
- Bunce, J.A. Comparative responses of leaf conductance to humidity in single attached leaves. J Exp. Bot. 1981, 32, 629-634. [CrossRef]
- Pettigrew, W.T.; Hesketh J.D.; Peters, D.B.; Woolley J.T. (1990) A vapor pressure deficit effect on crop canopy photosynthesis. Photosyn. Res. 1990, 24, 27-34. [CrossRef]
- Stockle, C.O.; Kiniry, J.R. Variability in crop radiation-use efficiency associated with vapor-pressure deficit. Field Crops Res. 1990, 25, 171-181. [CrossRef]
- Bunce, J.A. (1982) Low humidity effects on photosynthesis in single leaves of C4 plants. Oecol. 1982, 54, 233-235. [CrossRef]
- Bunce, J.A. Differential sensitivity to humidity of daily photosynthesis in the field in C3 and C4 species. Oecol. 1983, 57, 262-265. [CrossRef]
- Bunce, J.A. Effects of water vapor pressure difference on leaf gas exchange in potato and sorghum at ambient and elevated CO2 under field conditions. Field Crops Res. 2003, 82, 37-47. [CrossRef]
Figure 1.
Midday carbon dioxide assimilation rates (A) in single, upper canopy leaves of wheat and soybeans as a function of measurement temperature. Combined data for 2013 and 2014 are presented.
Figure 1.
Midday carbon dioxide assimilation rates (A) in single, upper canopy leaves of wheat and soybeans as a function of measurement temperature. Combined data for 2013 and 2014 are presented.
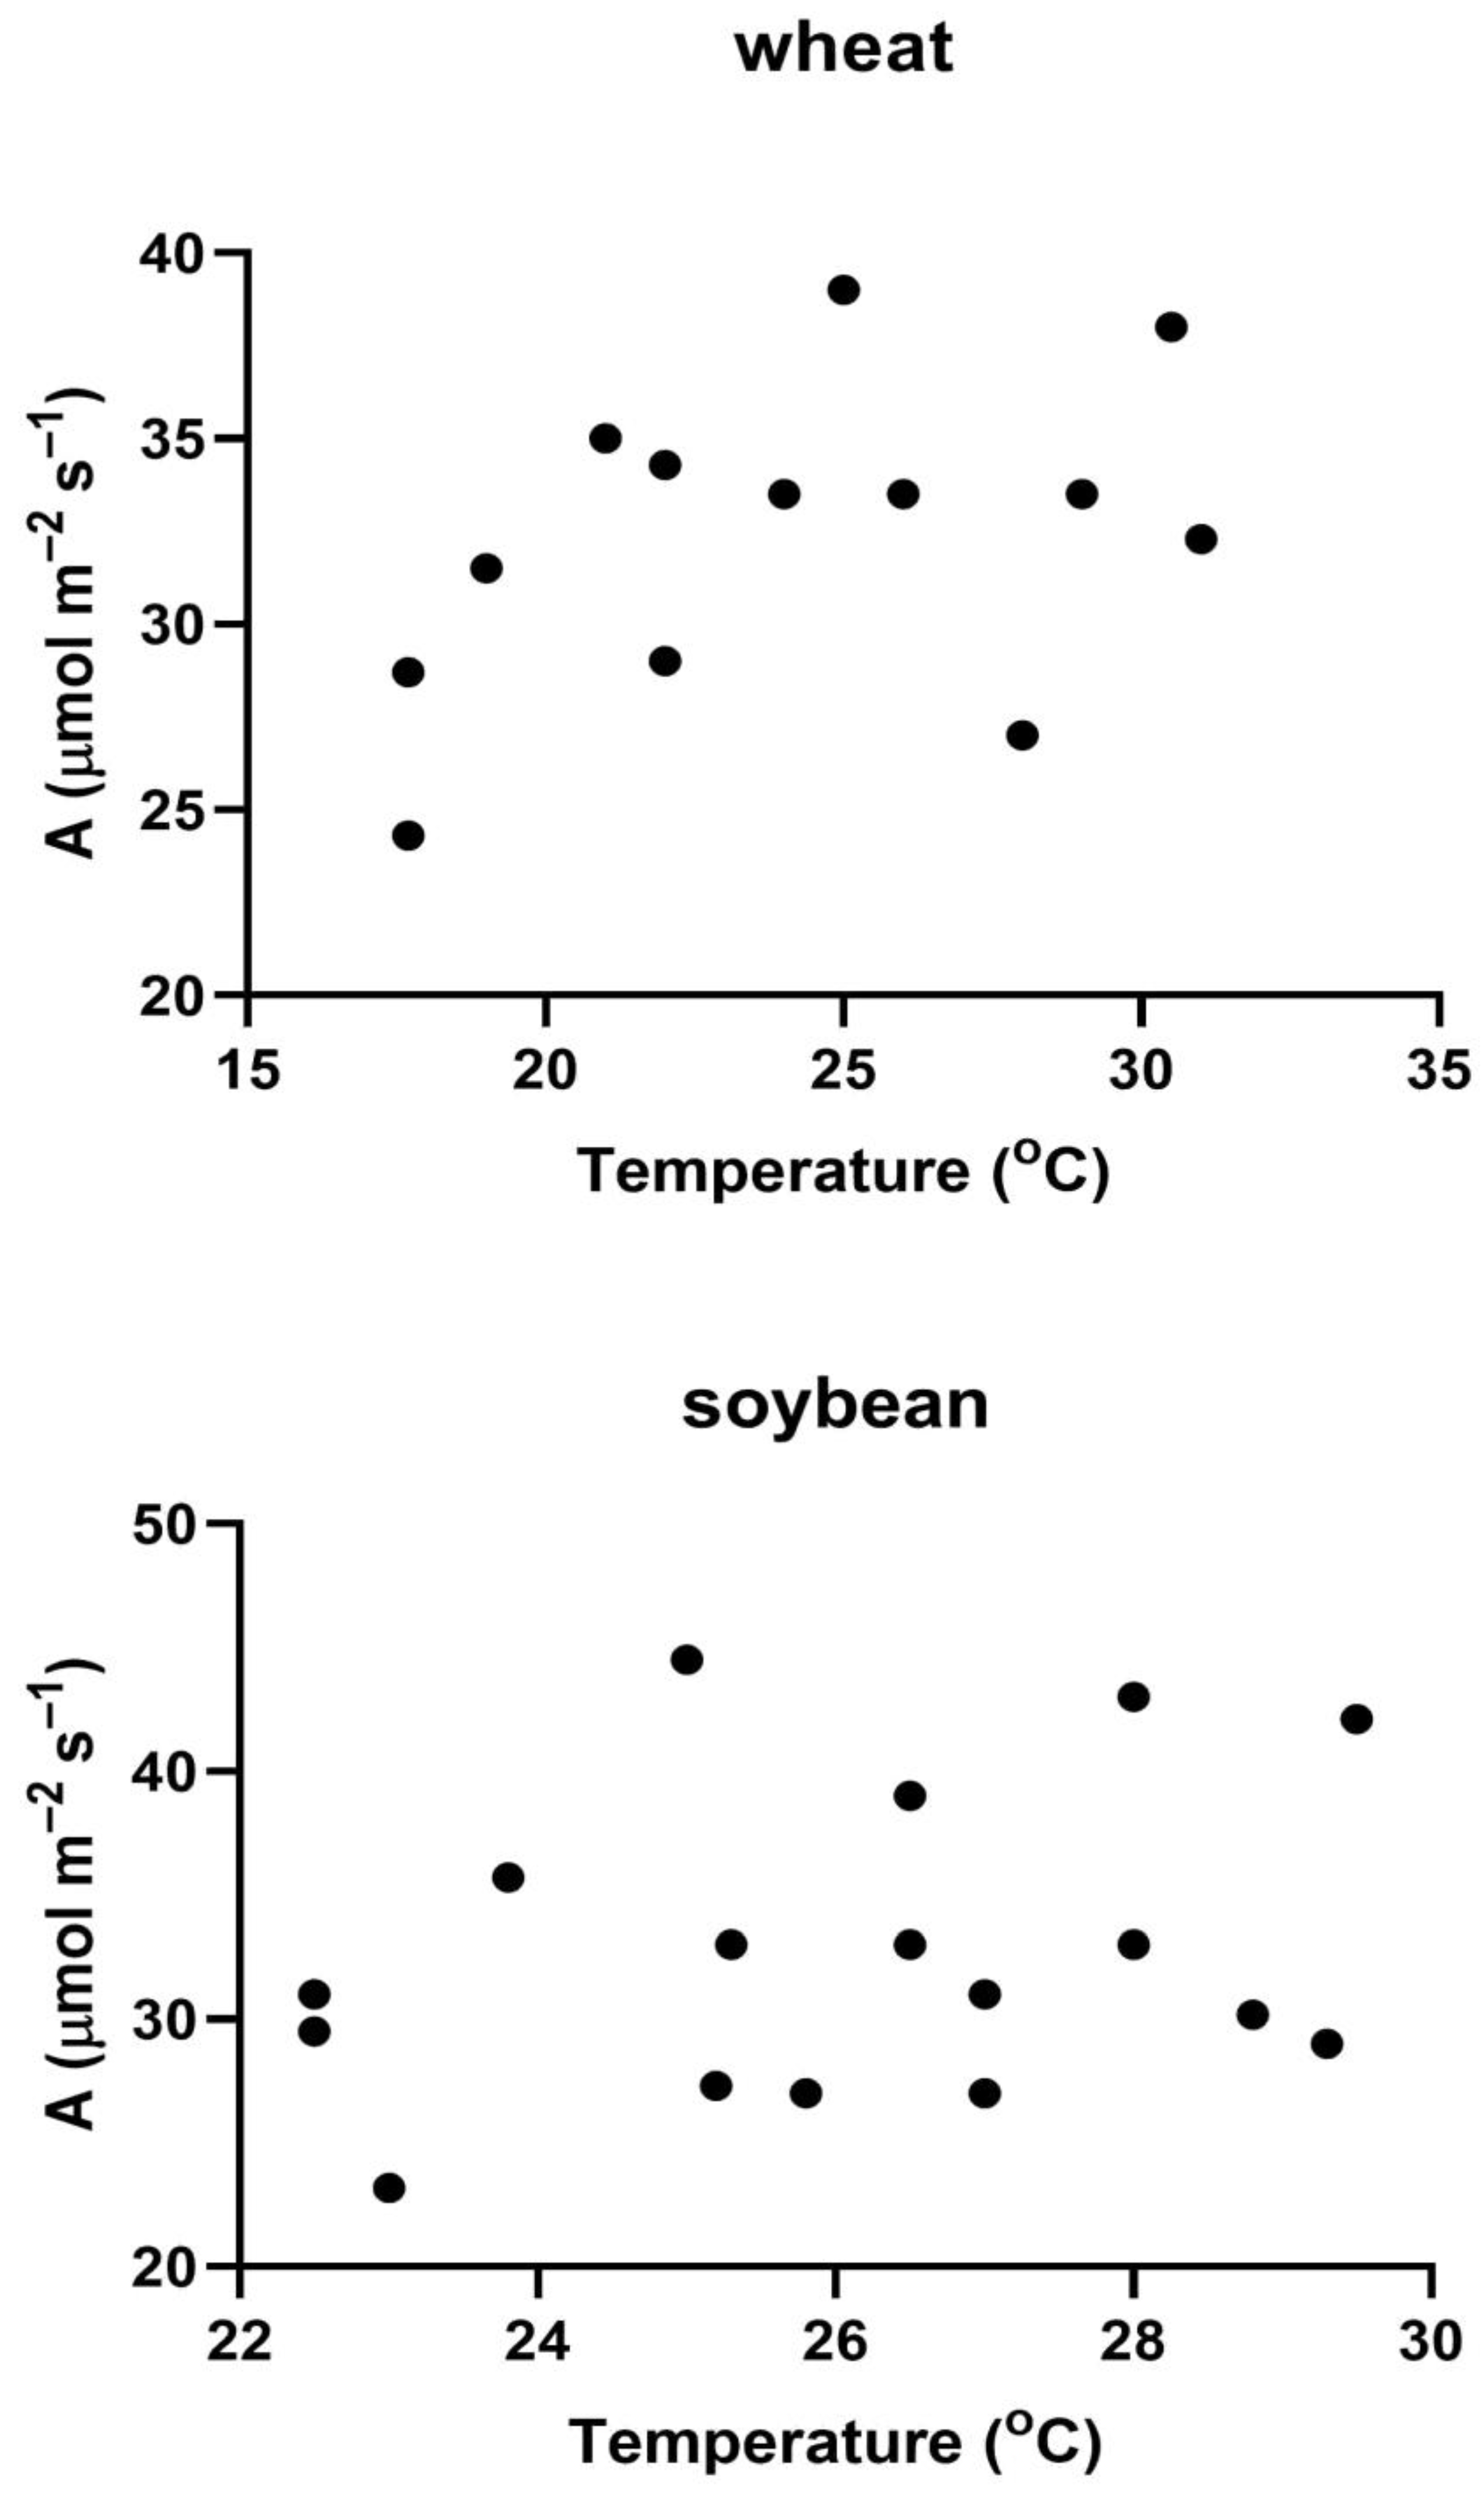
Figure 2.
Relationships between VCmax and measurement temperature on different days in 2013 and 2014 in single, upper canopy leaves of wheat and soybean measured in full sunlight, and the standard response of VCmax to temperature, with the standard VCmax value set for each species to approximate the highest observed values of VCmax.
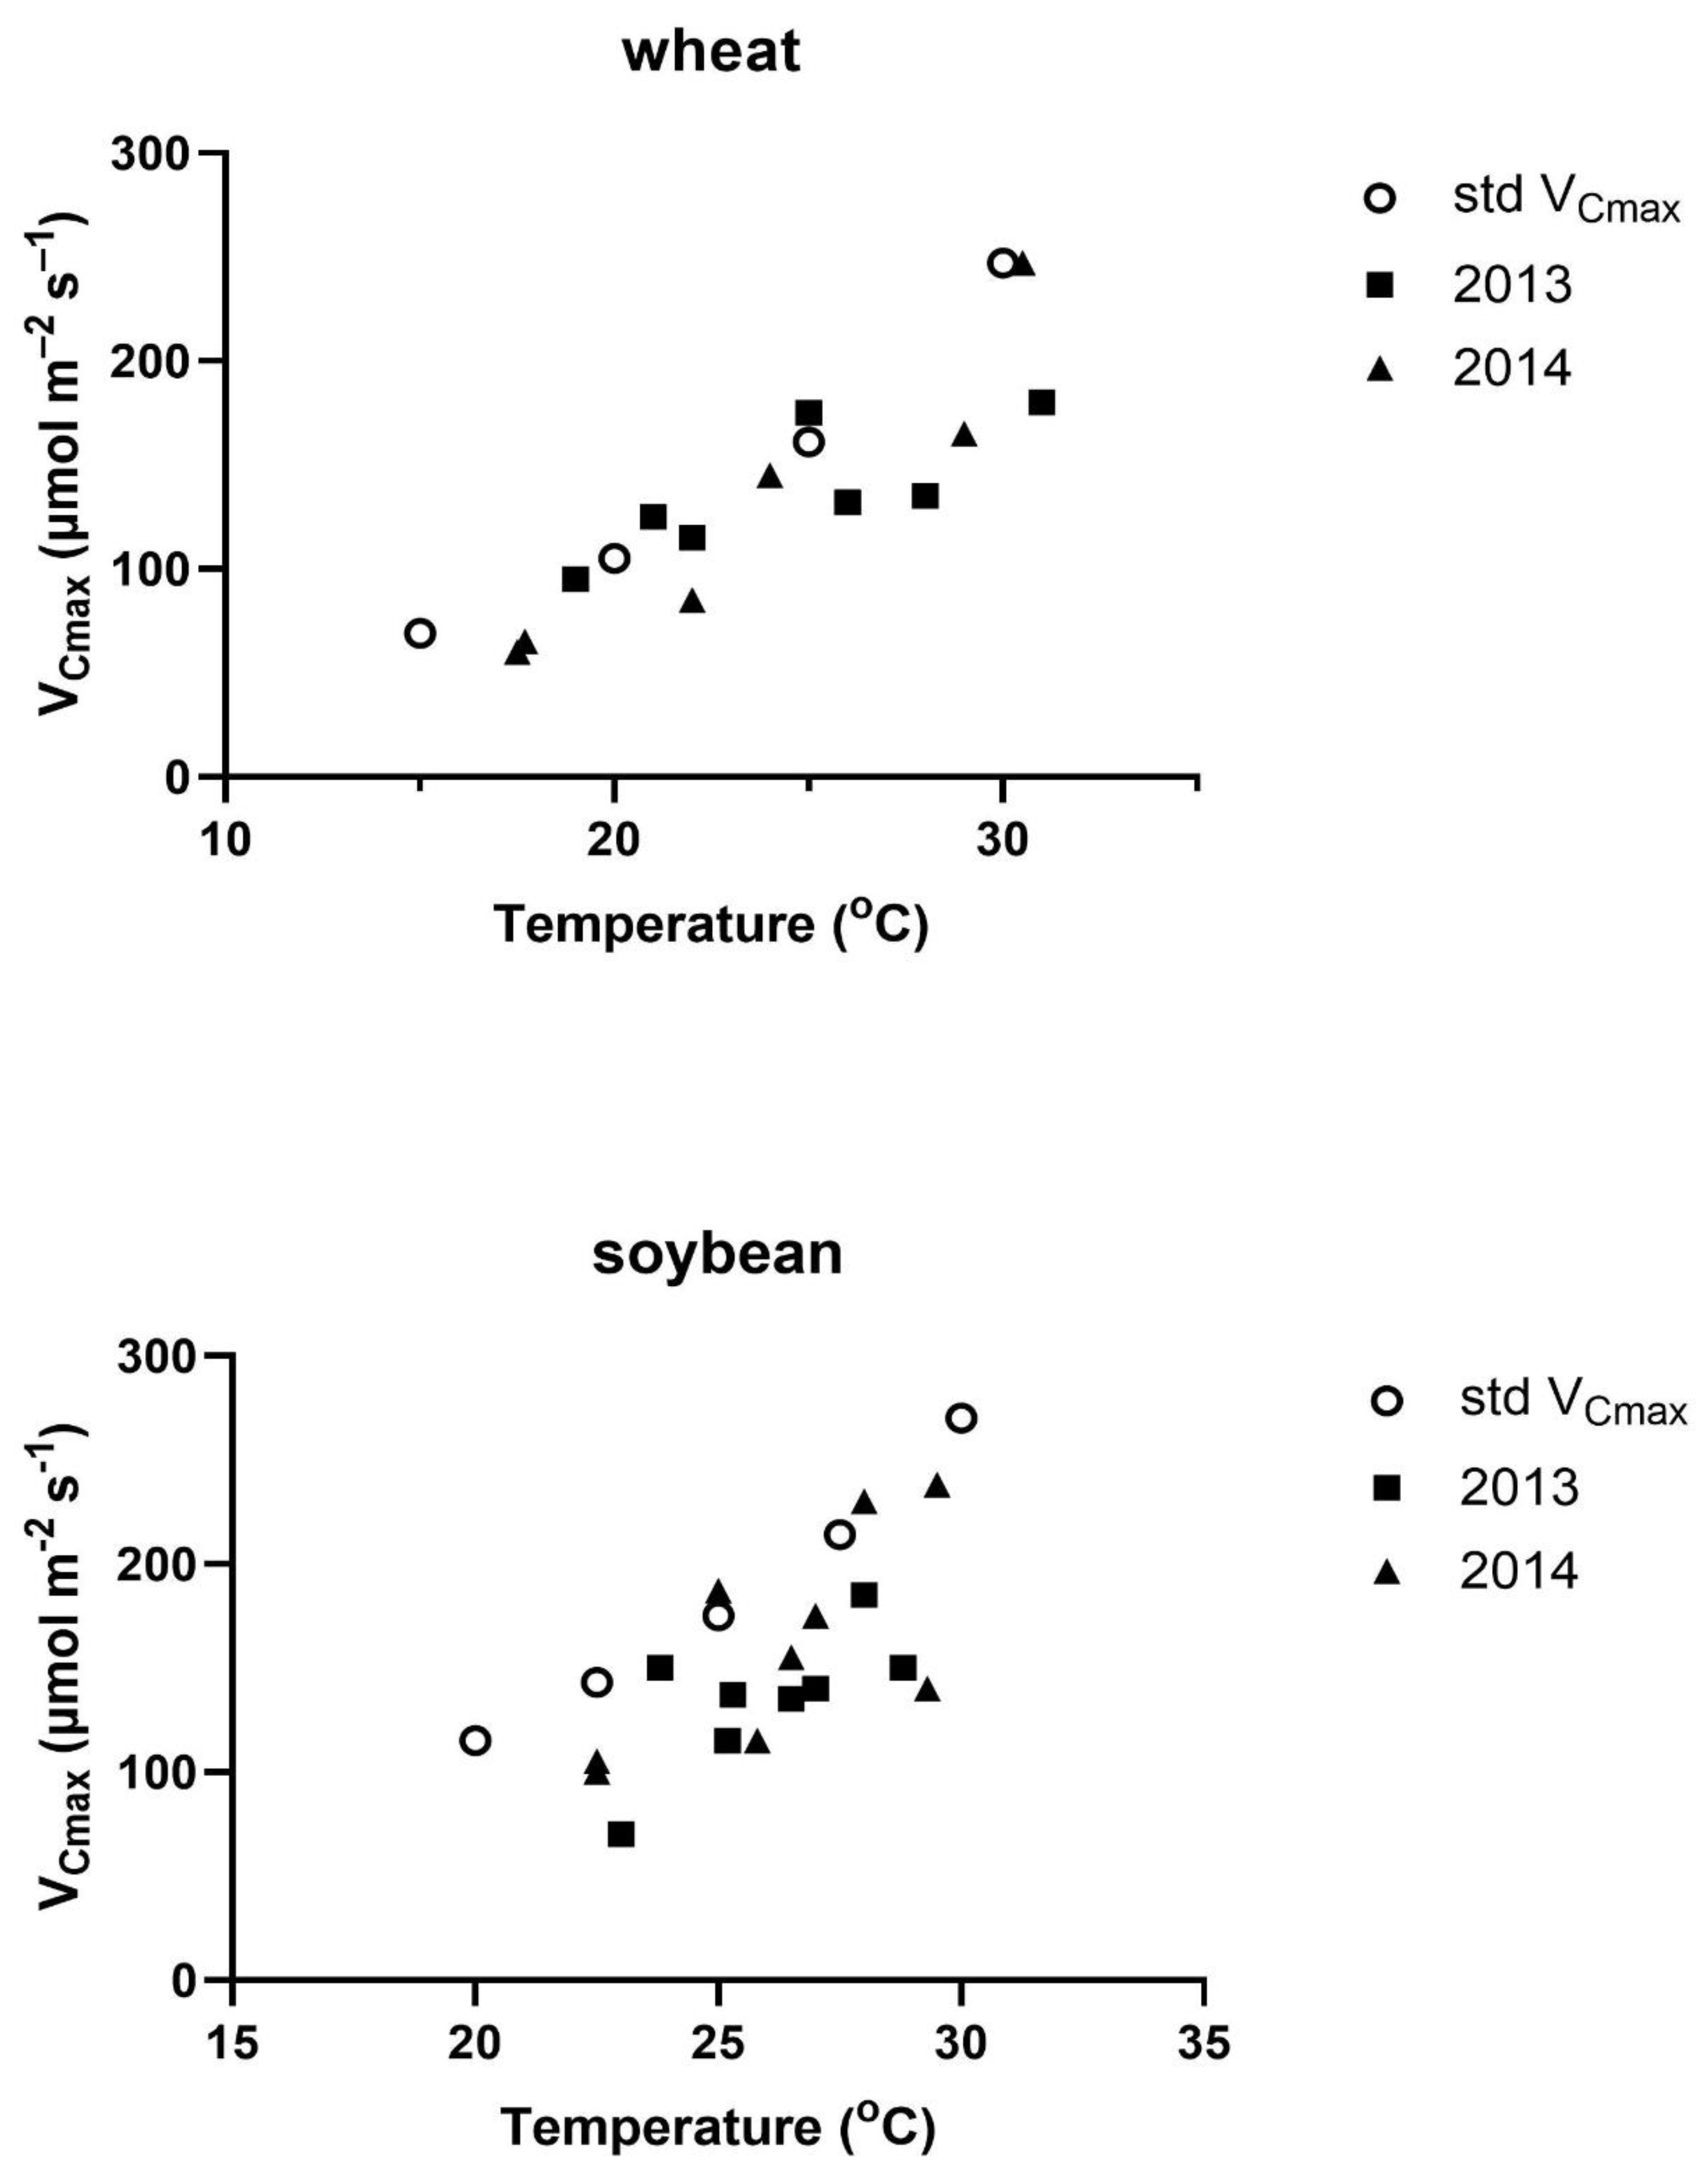
Figure 3.
The fraction of the theoretical value of VCmax from Figure 1 observed on each measurement date in relation to the temperature deviation for the four days prior to the measurement day compared with the temperature on the day of measurement. Correlations were not significant in either species.
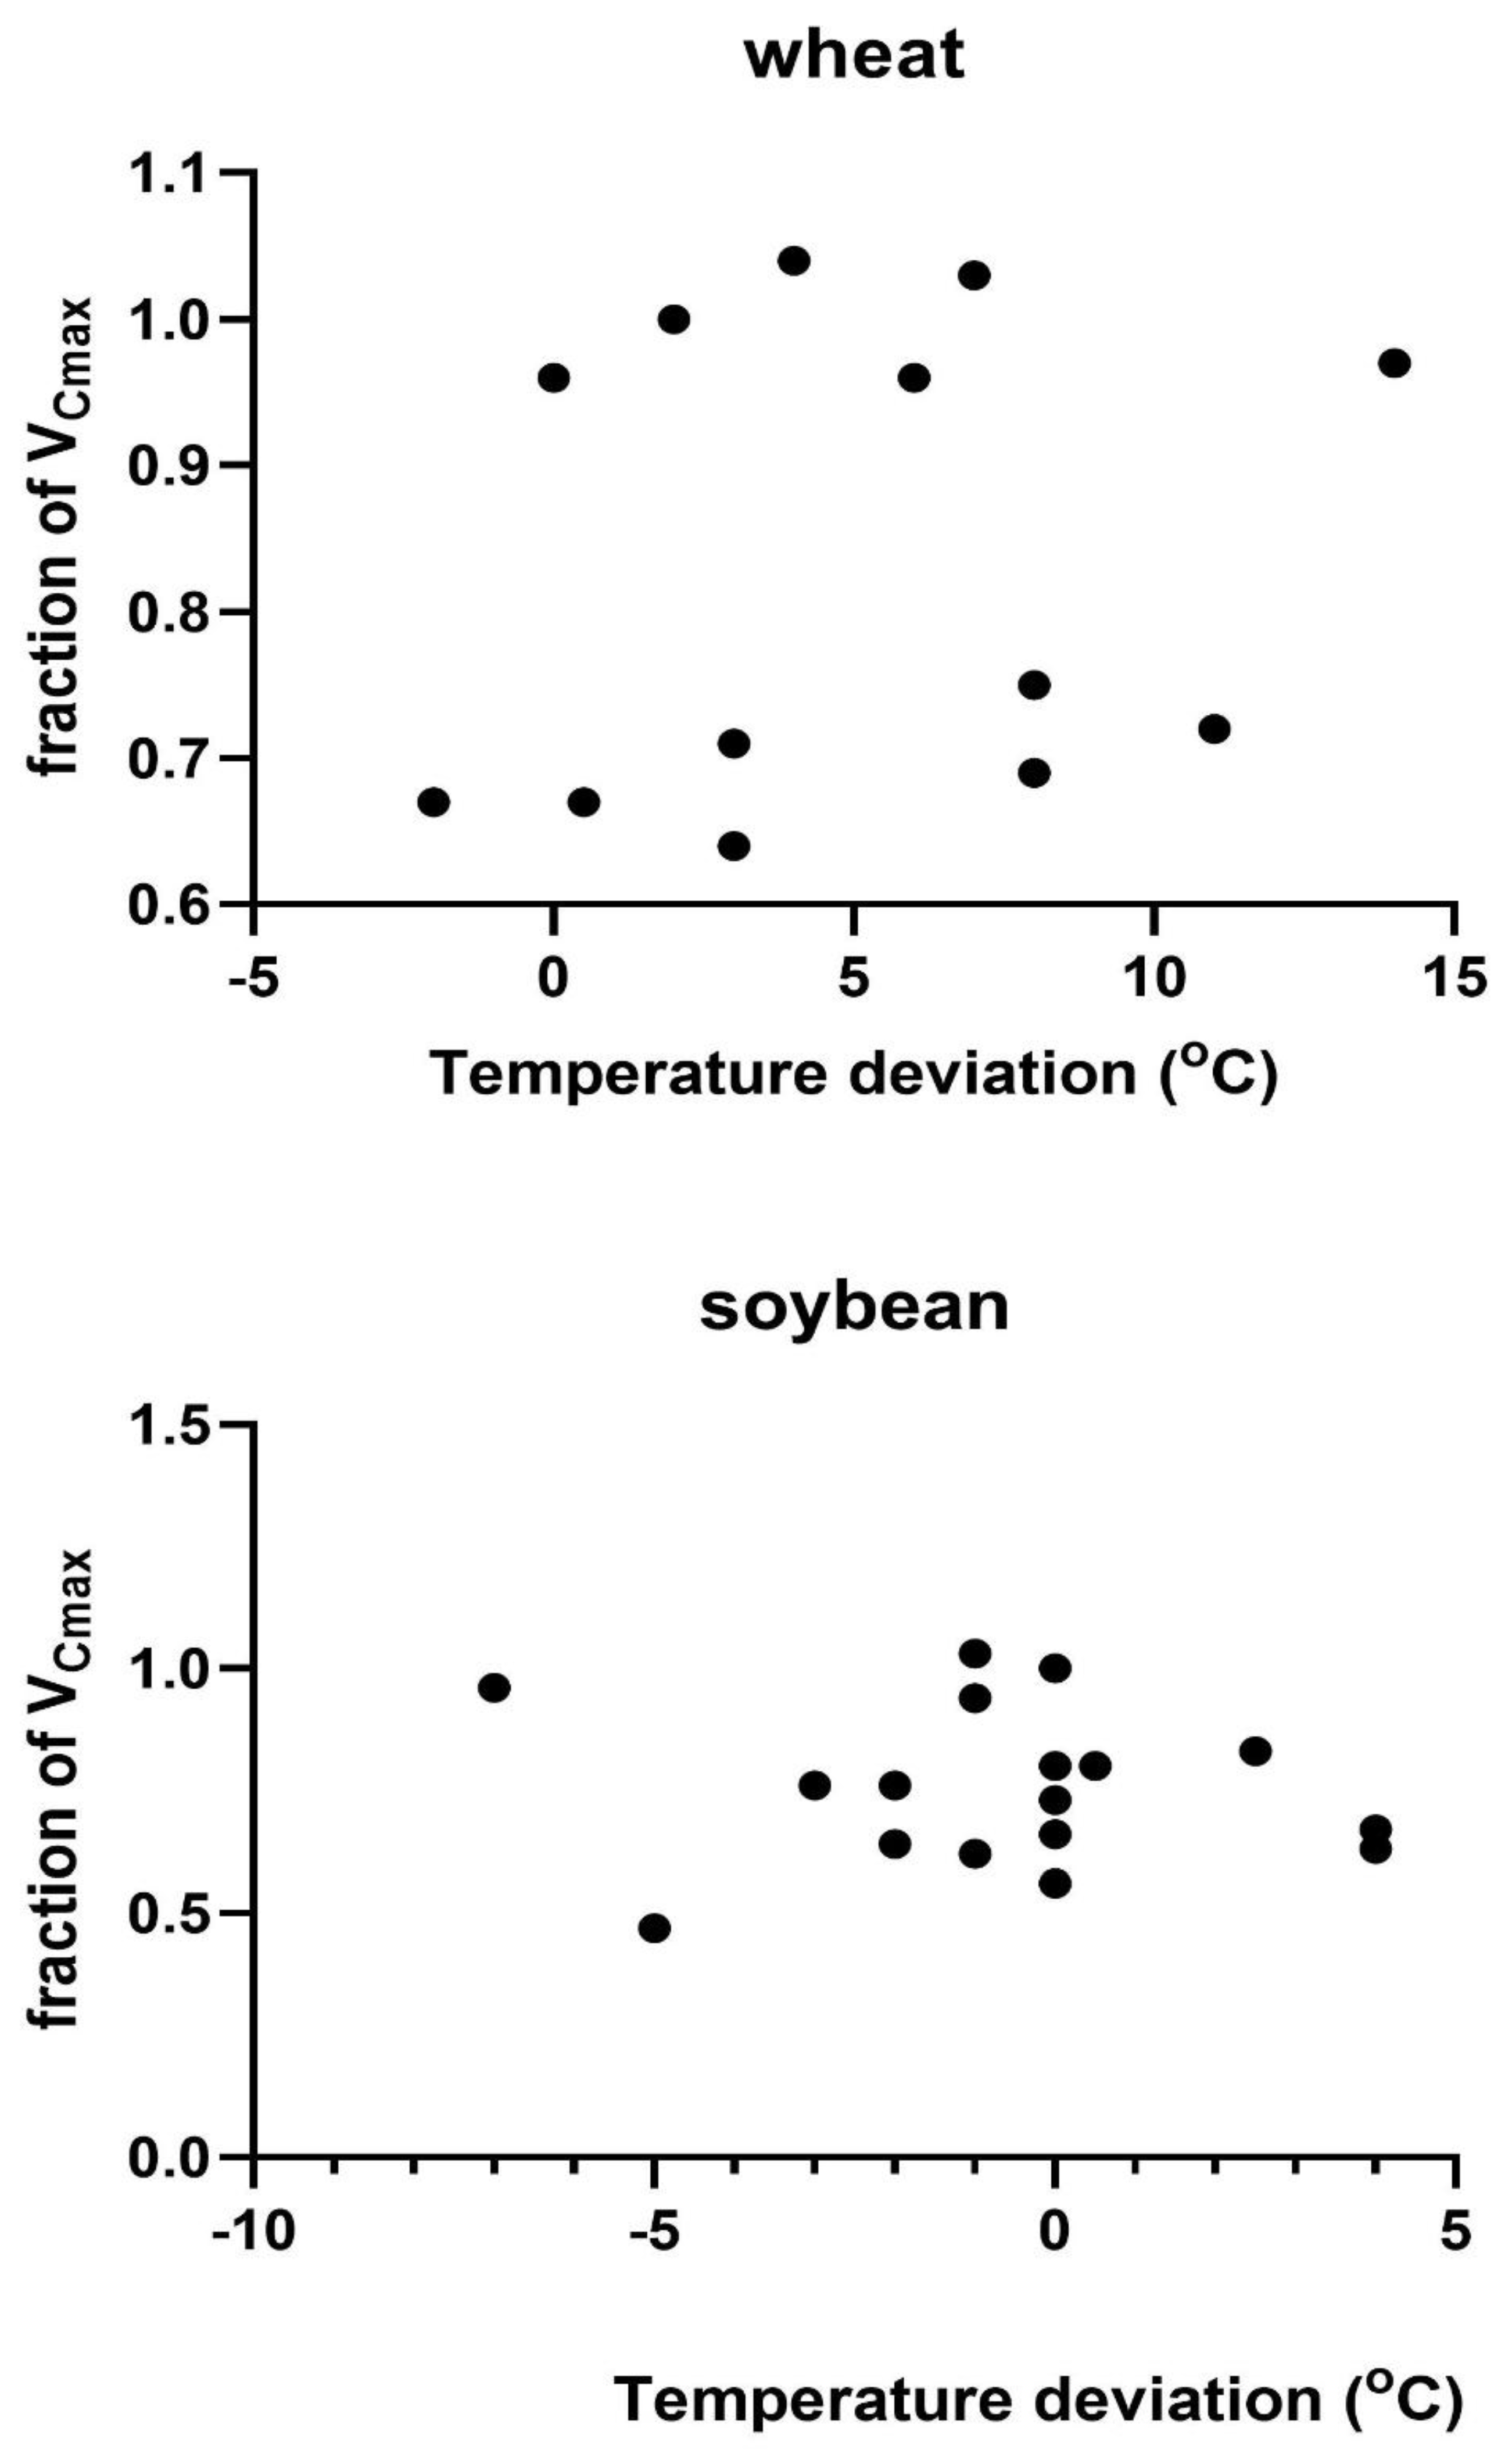
Figure 4.
The fraction of the theoretical value of VCmax from Figure 1 observed on each measurement date in relation to the mean daily photosynthetically active radiation for the four days prior to the measurement day. Correlations were not significant in either species.
Figure 4.
The fraction of the theoretical value of VCmax from Figure 1 observed on each measurement date in relation to the mean daily photosynthetically active radiation for the four days prior to the measurement day. Correlations were not significant in either species.
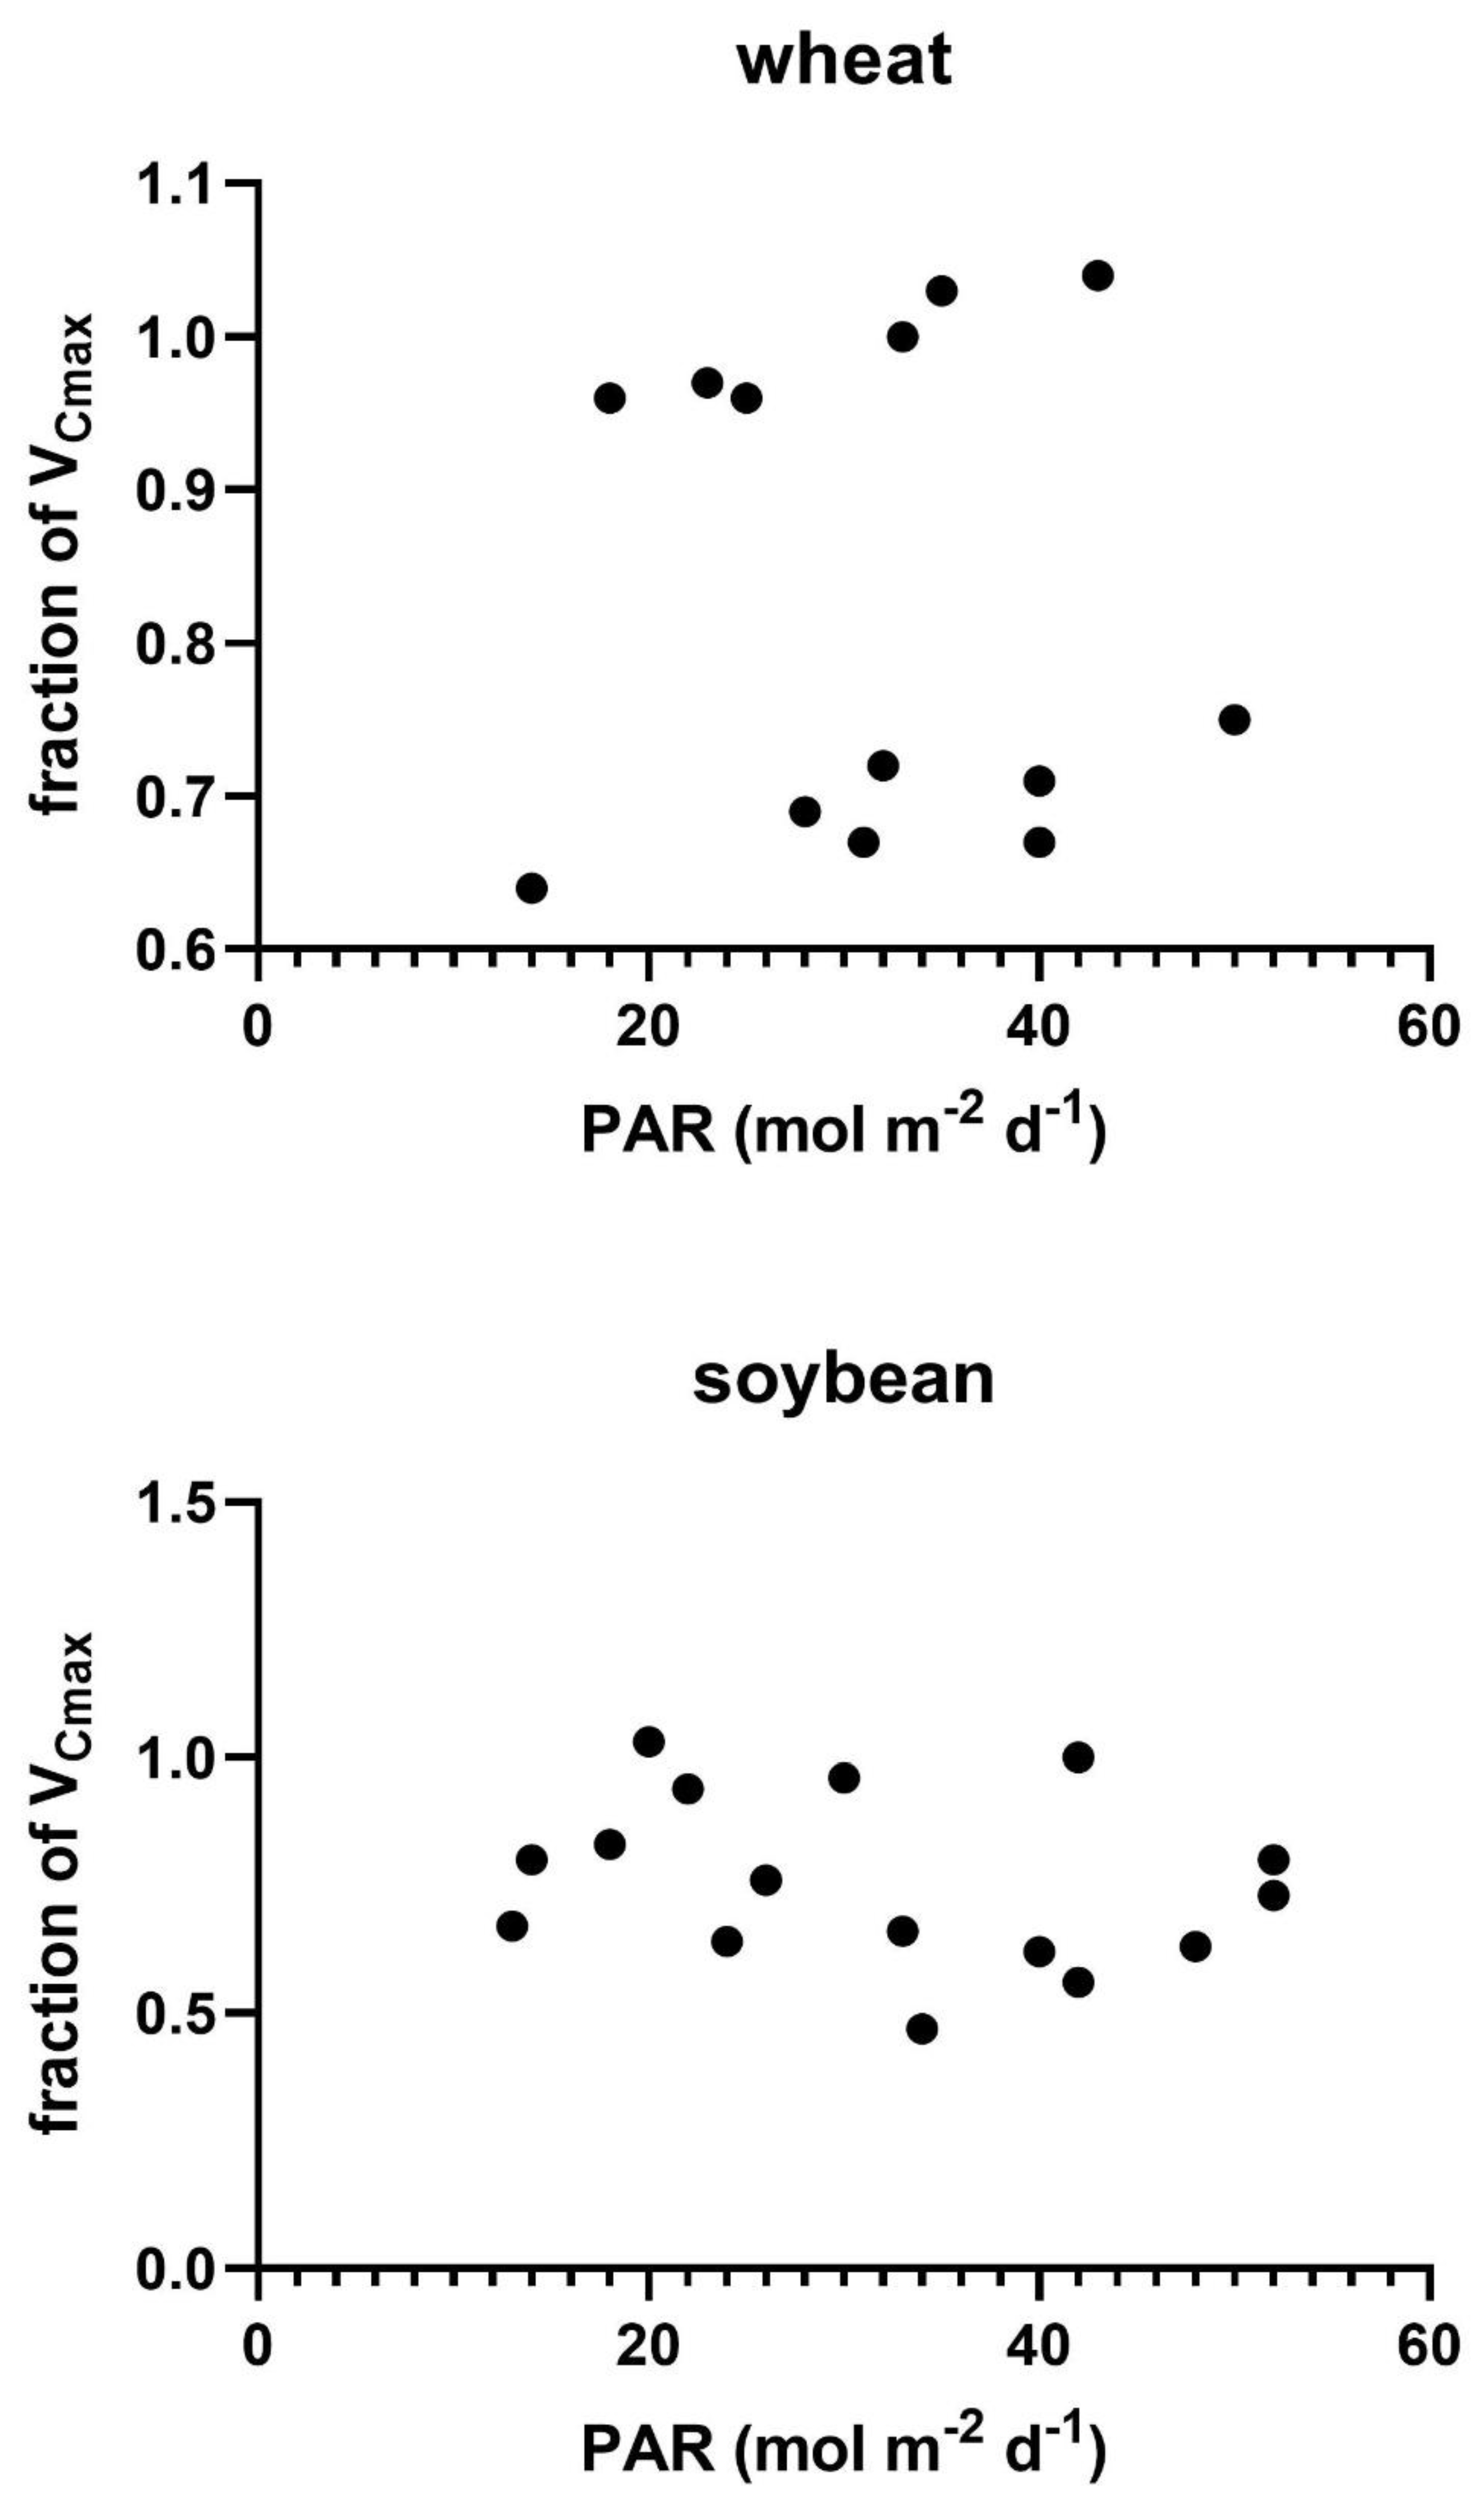
Figure 5.
The fraction of the theoretical value of VCmax from Figure 1 observed on each measurement date in relation to the day of year of the measurement of VCmax. Correlations were not significant in either species.
Figure 5.
The fraction of the theoretical value of VCmax from Figure 1 observed on each measurement date in relation to the day of year of the measurement of VCmax. Correlations were not significant in either species.
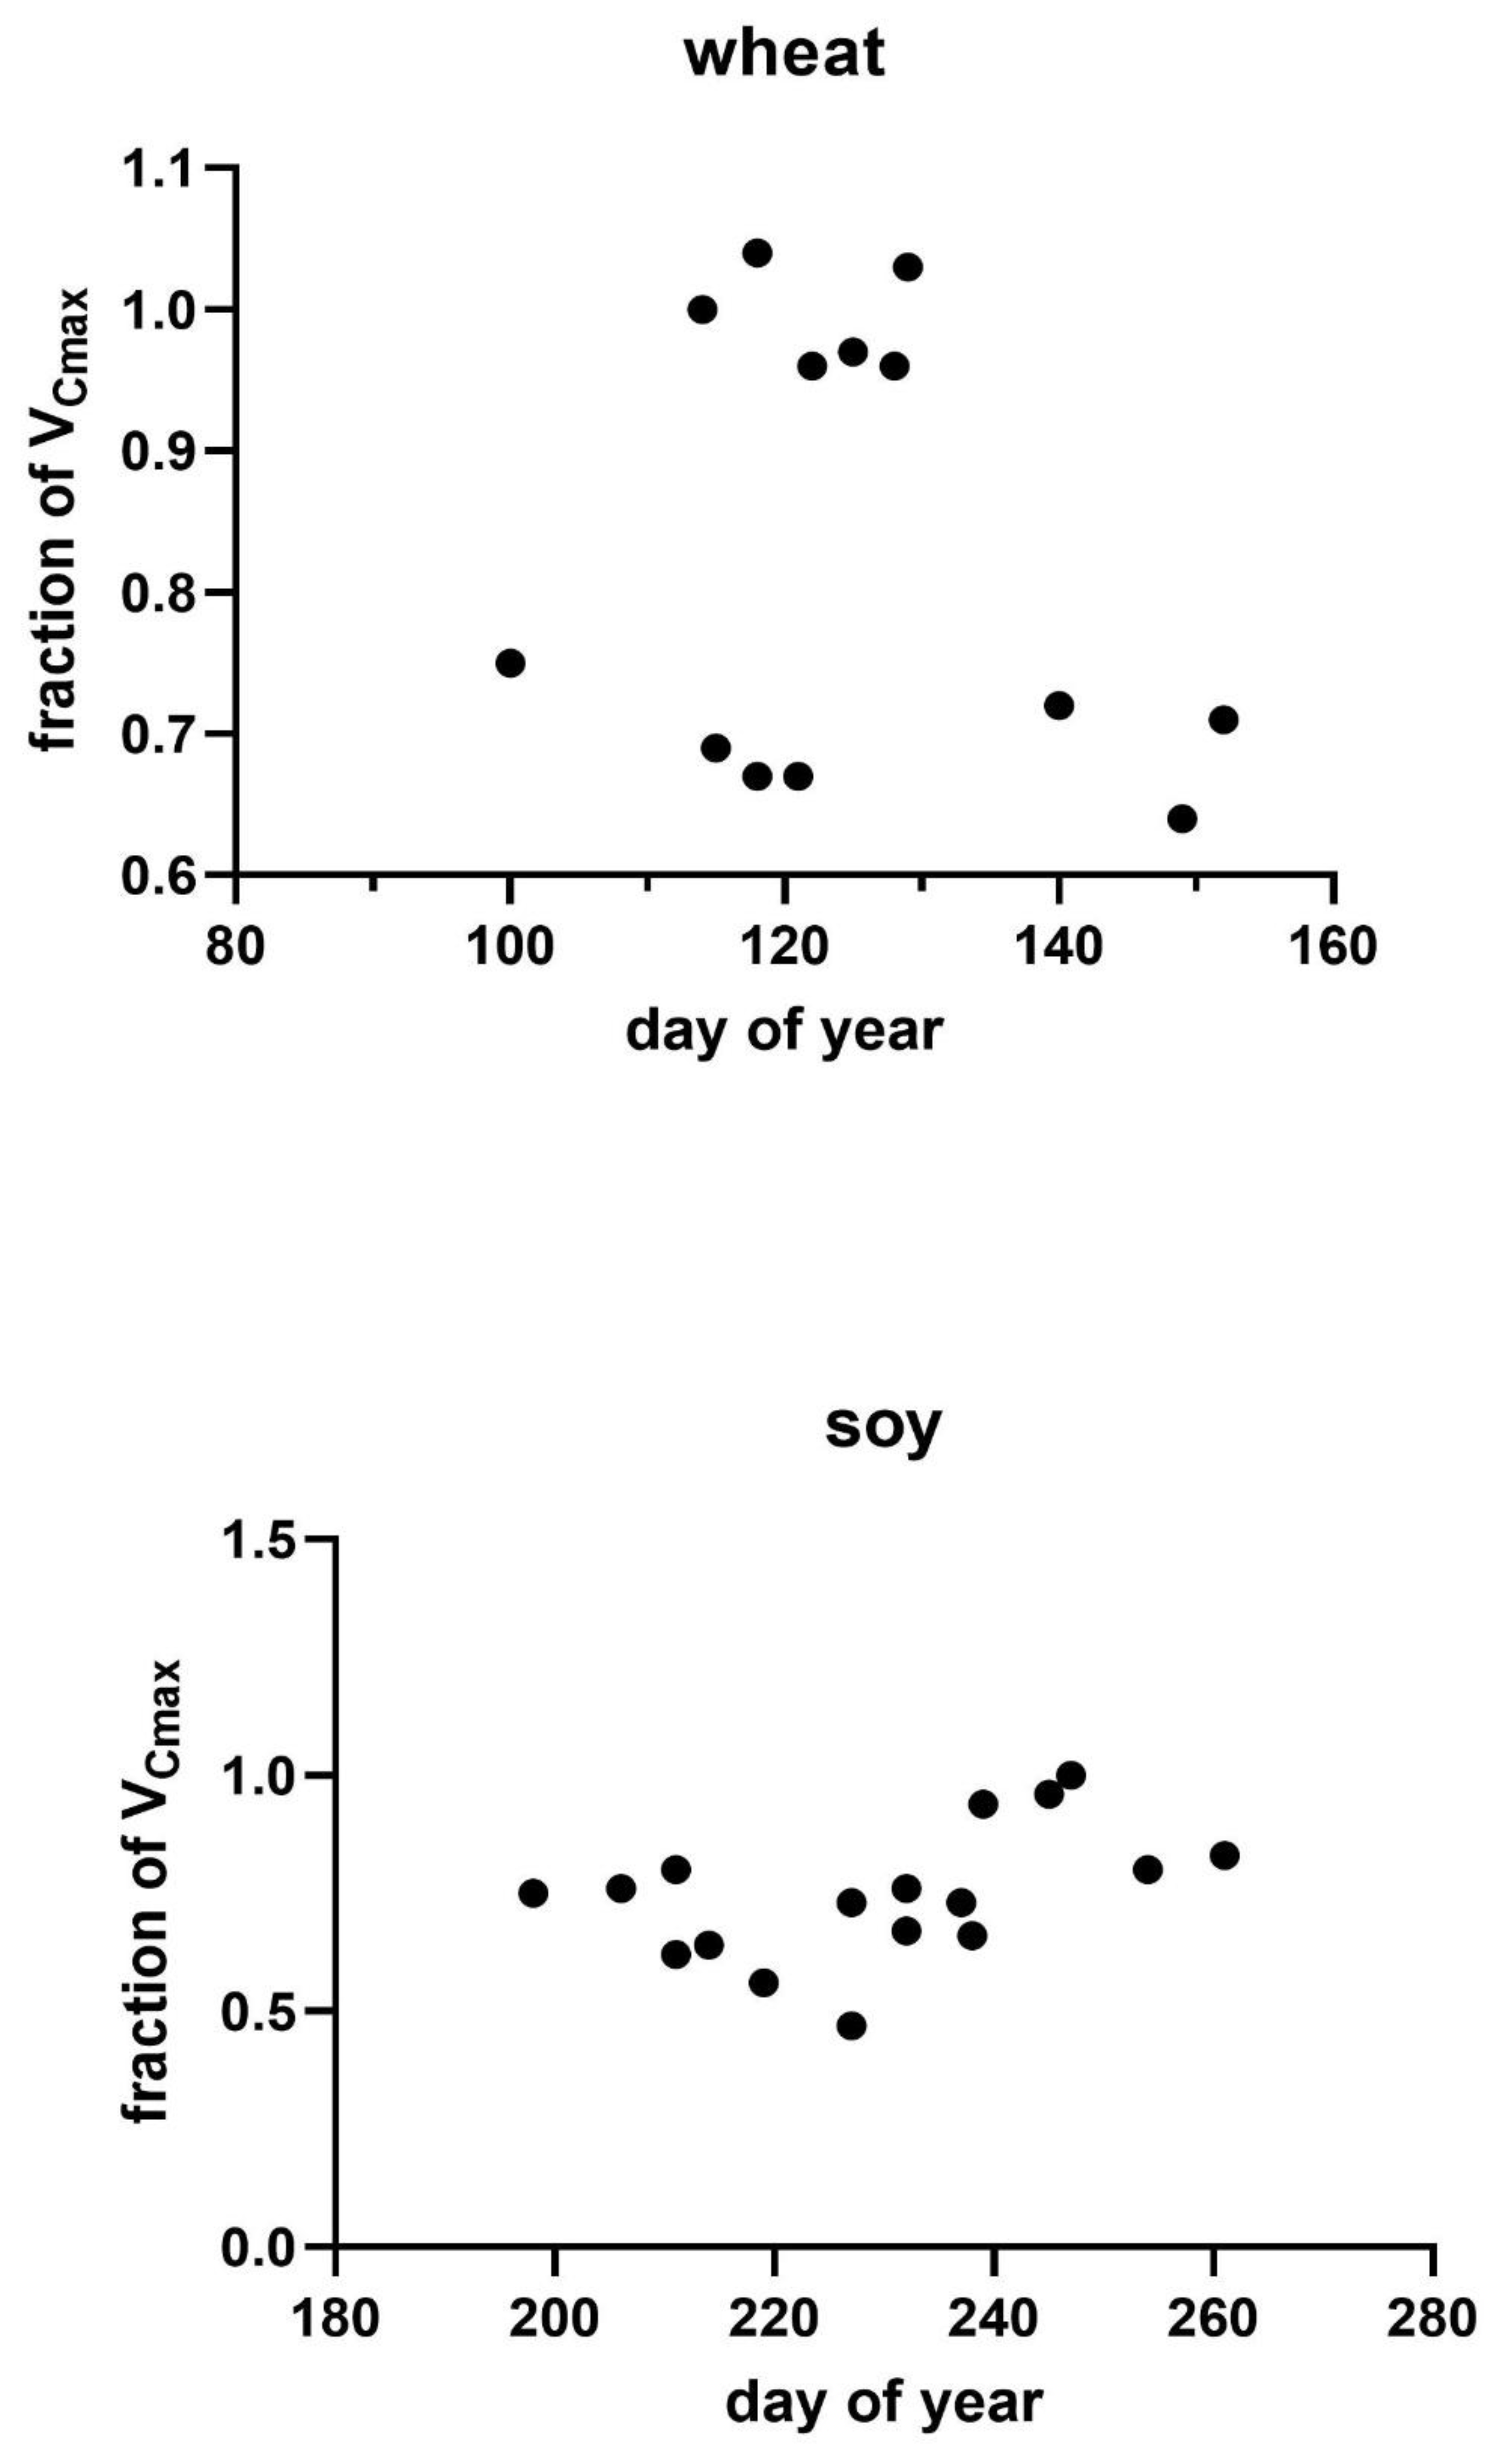
Figure 6.
Internal CO2 values (Ci) as a function of VPD on all measurement days in wheat and soybean. Correlations were not significant in either species.
Figure 6.
Internal CO2 values (Ci) as a function of VPD on all measurement days in wheat and soybean. Correlations were not significant in either species.
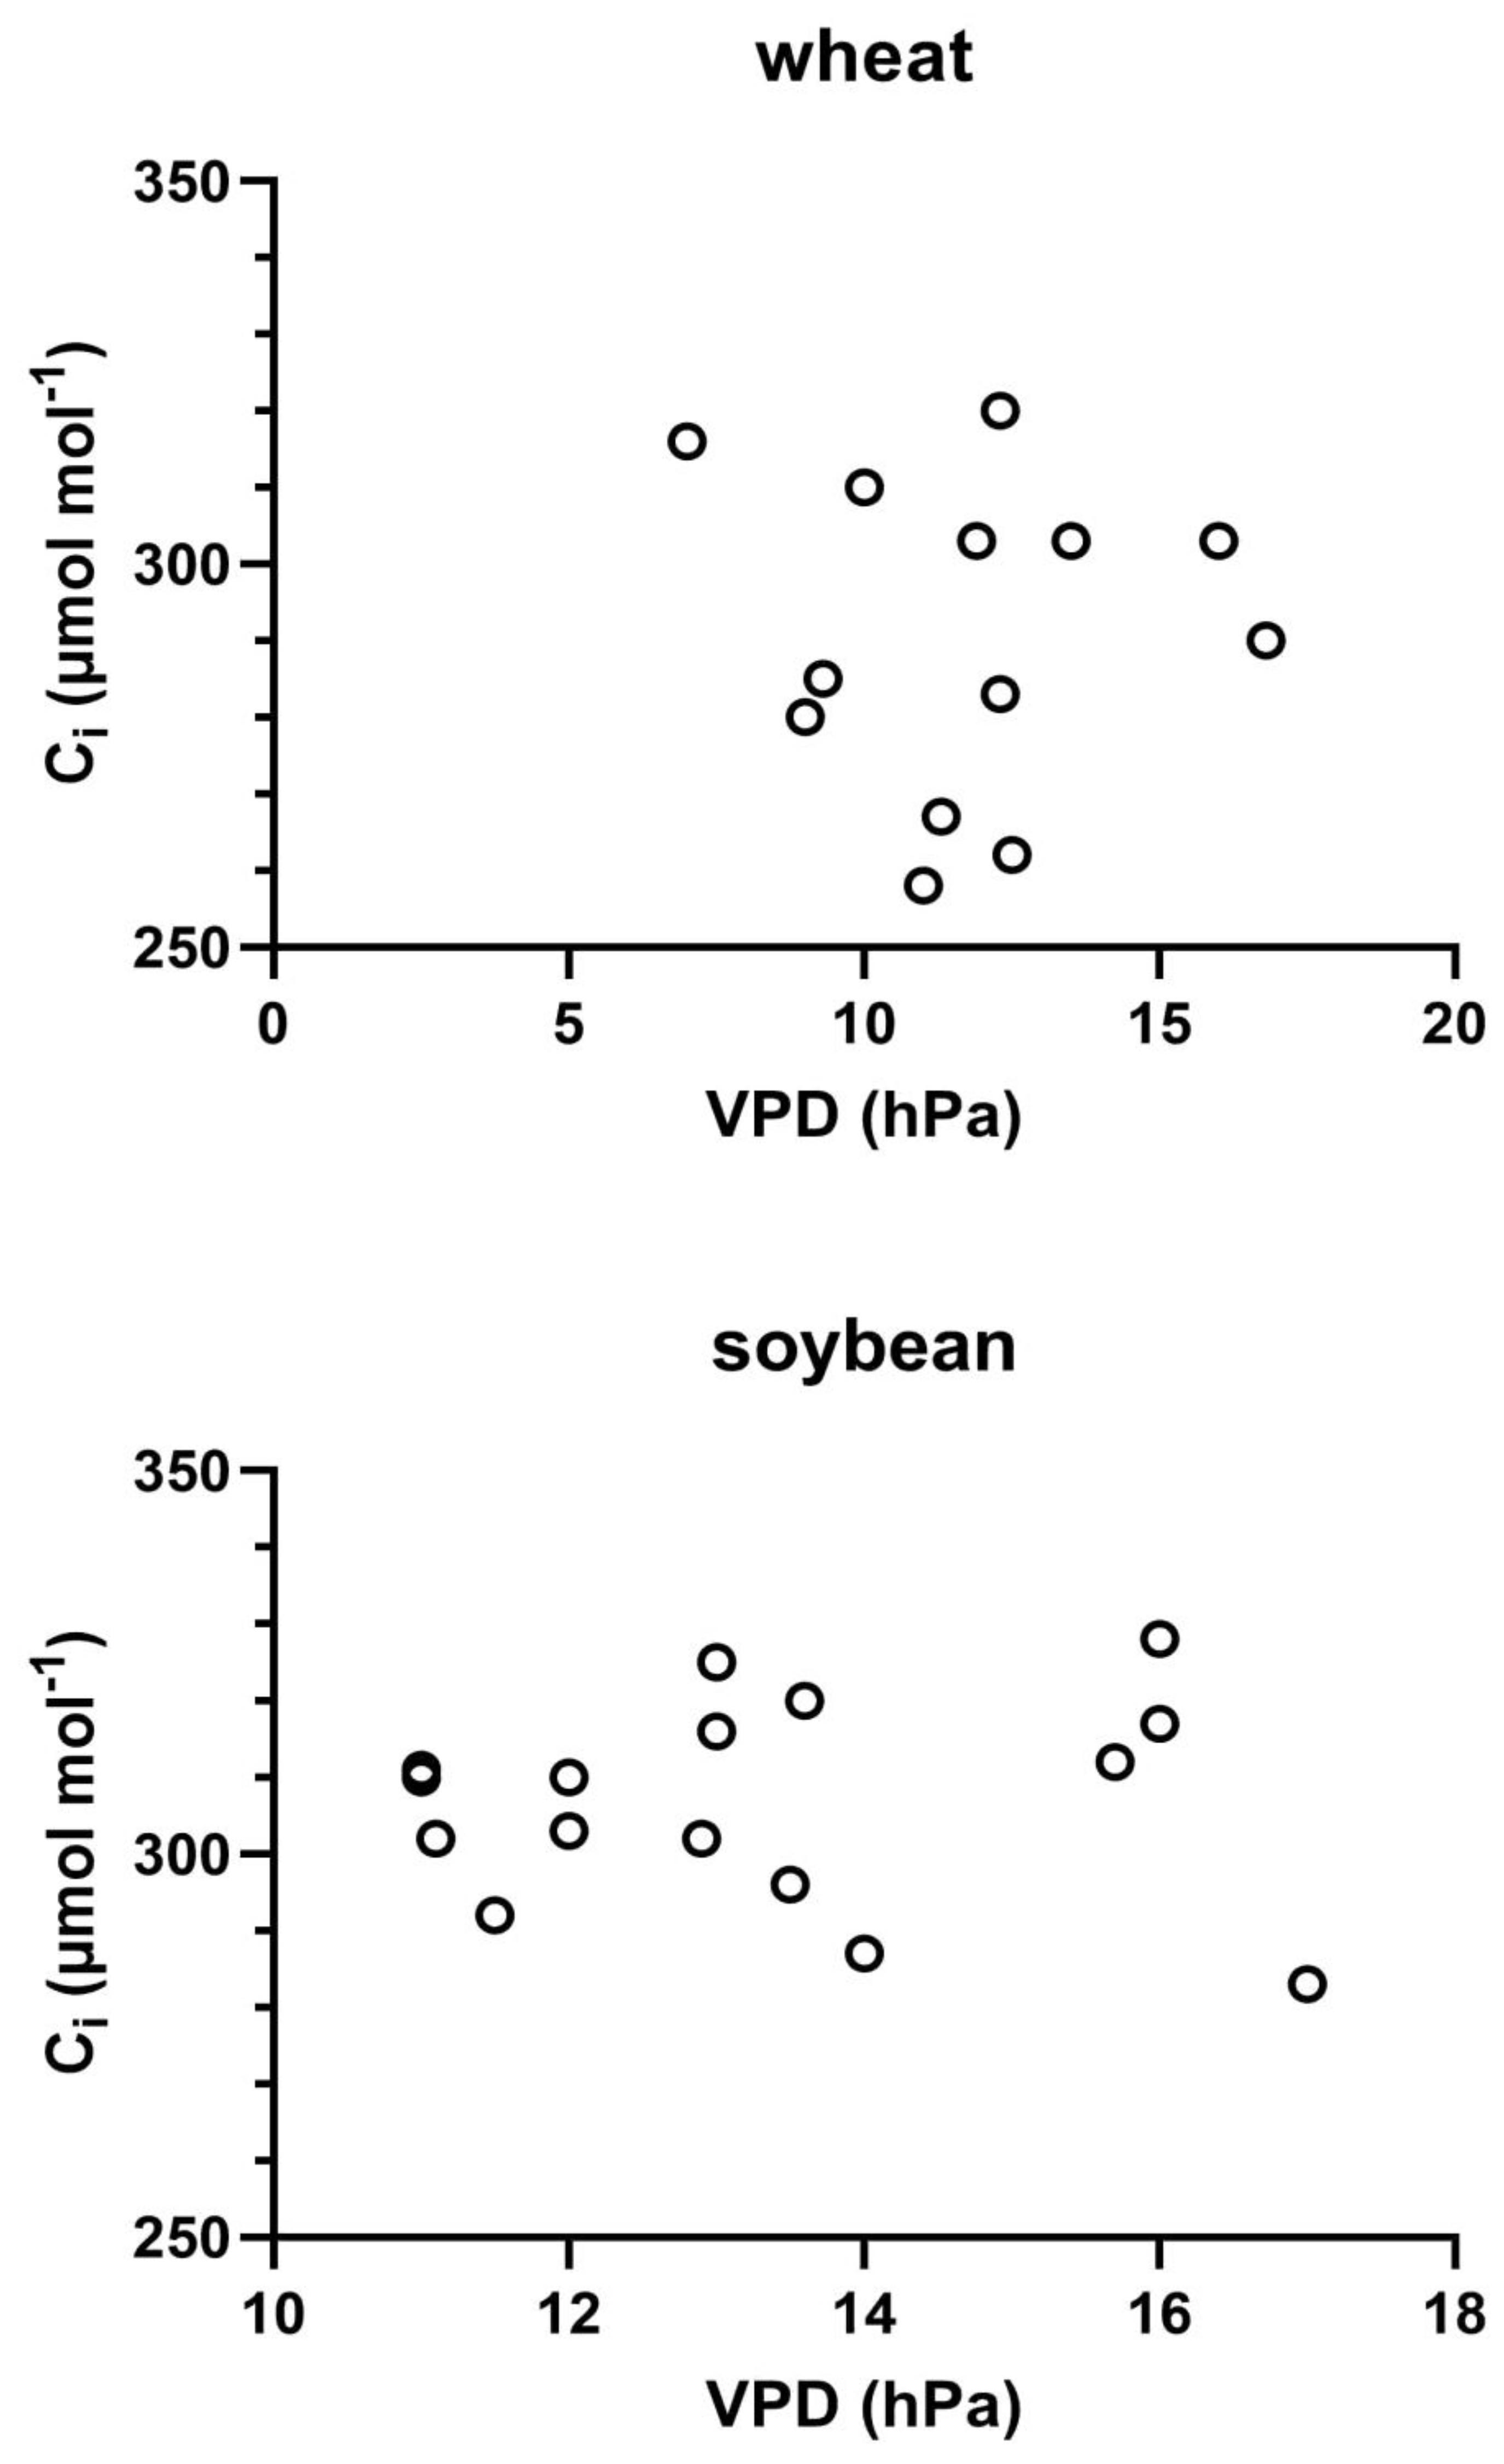
Figure 7.
The ratio of observed VCmax on each measurement day relative to the maximum VCmax expected for that temperature in relation to the VPD at the time of measurement of VCmax on each day. r2 values were 0.517 for wheat and 0.612 for soybean.
Figure 7.
The ratio of observed VCmax on each measurement day relative to the maximum VCmax expected for that temperature in relation to the VPD at the time of measurement of VCmax on each day. r2 values were 0.517 for wheat and 0.612 for soybean.
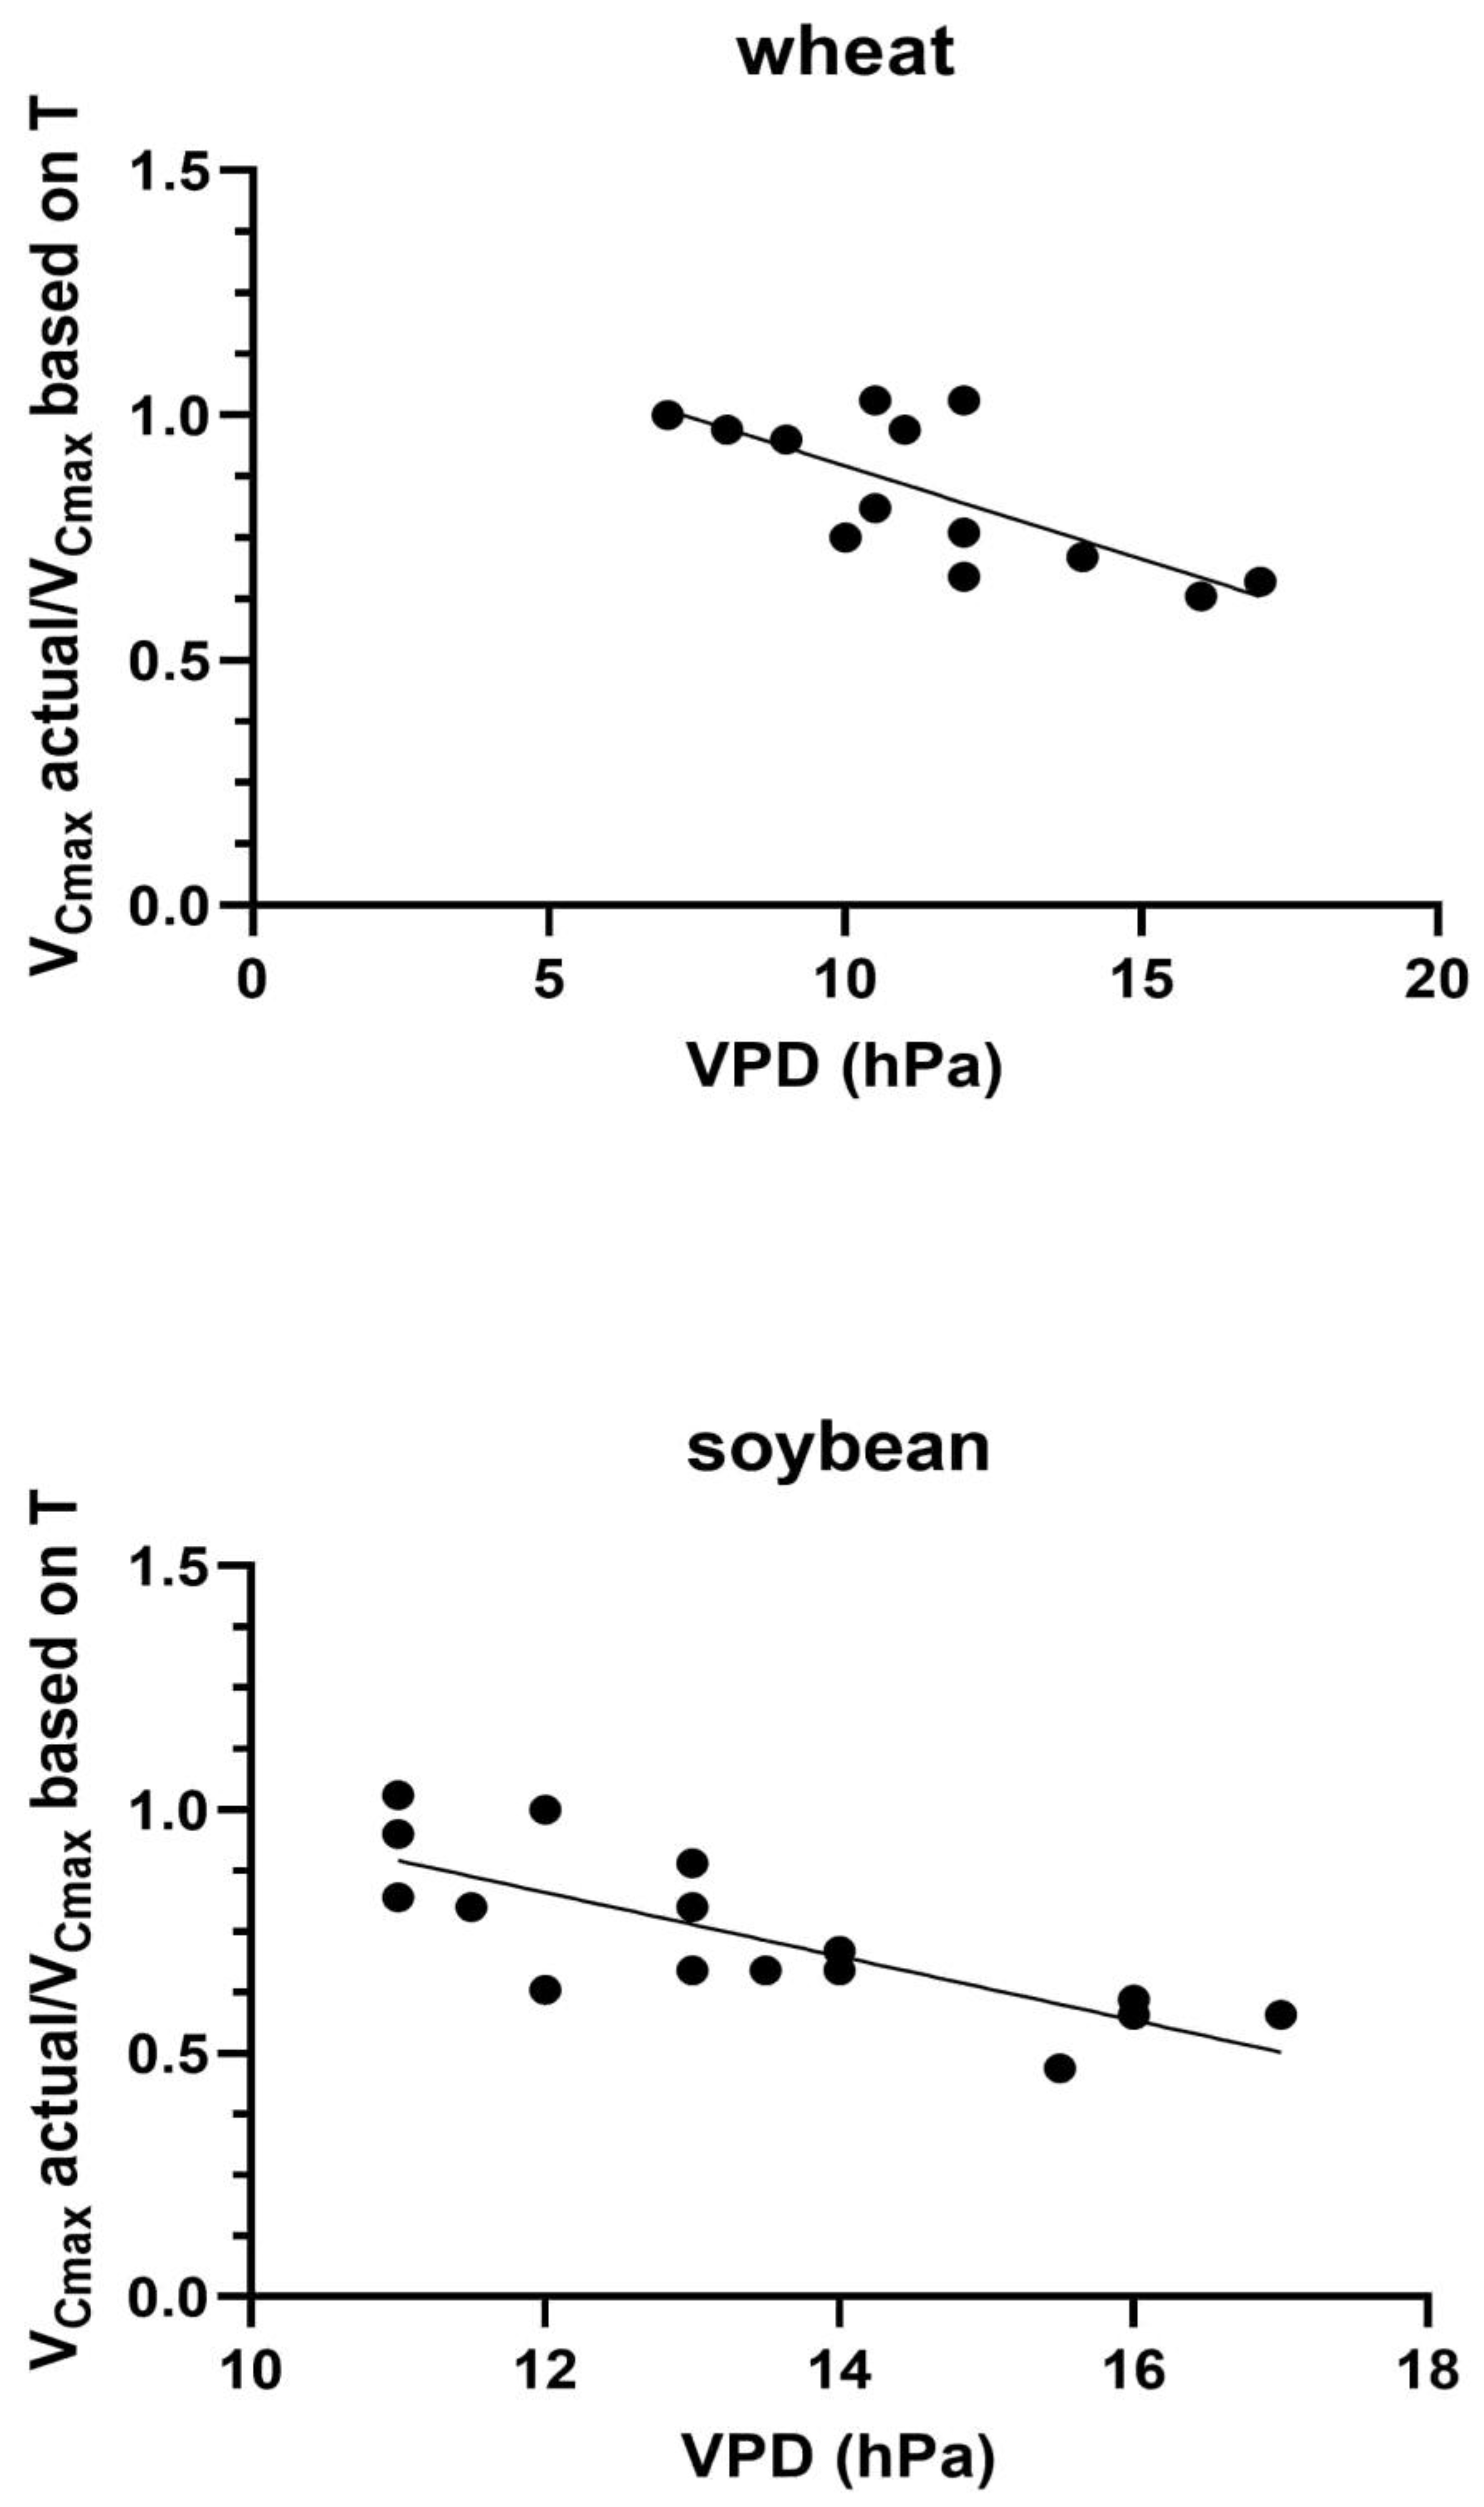

Table 1.
Slopes and r2 values of linear regressions of (actual VCmax)/(VCmax based on temperature) against VPD for each year of the wheat and soybean measurements.
Table 1.
Slopes and r2 values of linear regressions of (actual VCmax)/(VCmax based on temperature) against VPD for each year of the wheat and soybean measurements.
| Species | Year | Slope | r2 | Probability value |
|---|---|---|---|---|
| Wheat | 2013 | -0.055 | 0.72 | 0.0160 |
| Wheat | 2014 | -0.063 | 0.81 | 0.0146 |
| Soybean | 2013 | -0.050 | 0.83 | 0.0016 |
| Soybean | 2014 | -0.093 | 0.91 | 0.0002 |
Disclaimer/Publisher’s Note: The statements, opinions and data contained in all publications are solely those of the individual author(s) and contributor(s) and not of MDPI and/or the editor(s). MDPI and/or the editor(s) disclaim responsibility for any injury to people or property resulting from any ideas, methods, instructions or products referred to in the content. |
© 2025 by the authors. Licensee MDPI, Basel, Switzerland. This article is an open access article distributed under the terms and conditions of the Creative Commons Attribution (CC BY) license (http://creativecommons.org/licenses/by/4.0/).
Copyright: This open access article is published under a Creative Commons CC BY 4.0 license, which permit the free download, distribution, and reuse, provided that the author and preprint are cited in any reuse.


