Submitted:
24 November 2025
Posted:
26 November 2025
You are already at the latest version
Abstract
Insects rely on a variety of sensory cues for orientation, with antennae playing a central role in receiving and transmitting information about the environment. Philaenus spumarius (Hemiptera: Aphrophoridae), a spittlebug and vector of the bacterium Xylella fastidiosa, has reduced number of antennal sensilla, yet demonstrates effective multimodal commu-nication through olfactory and vibrational signals. This study aimed to investigate how the simplified sensory system of P. spumarius relates to the primary neuropils of the brain. We examined the ultrastructural organization of Johnston’s organ using scanning and transmission electron microscopy, complemented by previous data on antennal sen-silla. Brain organization was investigated by Micro-CT and confocal laser scanning mi-croscopy, which enabled us to identify the primary neuropiles. In addition, we did anten-nal and single sensillum backfills to trace sensory neurons to the brain. Our findings pro-vide insight into the adaptation of a simplified sensory system for effective communica-tion and orientation in P. spumarius.
Keywords:
neuroanatomy
; micro-CT
; morphology
; confocal
; antennae
; Xylella fastidiosa
1. Introduction
Insects orient themselves in the environment using different sensory modalities (i.e., chemical, mechanical, physical) [1,2,3,4], mediated by different stimuli that are primarily detected by the antennae, considered the insect’s primary sensory organs [5]. The functional units responsible for perceiving these stimuli are the sensilla, i.e., minute functional organs capable of detecting specific stimuli. Given the extraordinarily high diversity of insects and the variety of stimuli on which they rely throughout their lives, sensilla are adapted to specific functions. In chemoreceptors, pores are usually located at the sensillum tip or scattered on the sensillum cuticular wall [6,7]. The sensilla sensory neurons axons project to the central nervous system and terminate at specific neuropiles [8,9,10,11].
In addition to externally visible sensilla, insects possess sensilla present in the internal lumen of various organs/body parts, including legs, wings, antennae, abdomen, and tympanal organ. These internal sensilla are known as scolopidia and are particularly prominent in the insects’ antennae [12]. In the second antennal segment, the pedicel, scolopidia are arranged in a circular pattern, forming a specialized structure called Johnston’s organ (JO) [12,13,14]. Scolopidia are extremely sensitive organs, capable of responding to the slightest antennal movement. The degree of their sensitivity was recorded in Toxyrhynchites brevipalpis females, which responded to antennal deflections of ± 0.0005° induced by ± 11 nm air particles [15]. To date, Johnston’s organ has been associated with various functions, from gravireception to sound perception, flight control, airflow detection, and vibrational sensing [16,17,18].
The axons of all antennal sensory organs are merged into the antennal nerve and project to the primary neuropiles in the brain. Different neuropiles are specialized for processing specific sensory signals. For instance, visual signals from eyes are processed in the optic lobes (Ols), mechanical signals are analyzed in the antennal mechanosensory and motor center (AMMC), whereas the olfactory signals are primarily analyzed in the antennal lobes (Als). The Als, considered as the primary olfactory centers of insect’s brain, are organized into small spherical functional units, called olfactory glomeruli. The number of glomeruli ranges from fewer than 10 up to several hundred, and each glomerulus receives inputs from the olfactory sensory neurons that express the same type of olfactory receptors [9,11,19]. Olfactory information is subsequently modulated by local interneurons, and relayed to higher brain regions via projection neurons. Projection neurons convey information to the higher olfactory centers, including lateral horn and the mushroom bodies [10,11,20,21].
Sensory organs are adapted to specific ecological needs, resulting in their better performance (i.e., finding a food source, mate etc.). This is especially evident in insects which have developed macroglomeruili in the antennal lobe which are common in insects that use pheromones for long-range communication. However, it has been shown that macroglomeruli are also associated with food odours [22,23]. The changes in glomeruli size are primarily associated with the number of OSNs they receive [20,24] and the number of synapses [25]. In addition to differences in the size of individual glomeruli, significant variations have been observed in the number of glomeruli between various species. In most species, the AL is composed of approximately 50-200 glomeruli [26,27,28,29,30]. However, extreme values were found in some species, as in the case of locust, which shows between 1000 and 3000 glomeruli [31,32]. In contrast, species like aphids [33,34], dragonflies [35], planthoppers and leafhoppers [36] either lack glomeruli or only have a very low number. Moreover, variations were observed in the mushroom body development, being larger in social insects that display non-stereotyped behavioural responses [37].
Philaenus spumarius L. (Hemiptera: Aphrophoridae), commonly known as the meadow spittlebug, is a species that has received increasing attention in recent years due to its role as the primary vector of Xylella fastidiosa, a destructive xylem-limited bacterium currently spreading across Italy and Europe [38]. Beyond its characteristic xylem-feeding behaviour and spittle mass production, P. spumarius is characterized by having a significantly reduced number of antennal sensilla [39]. A recent investigation of P. spumarius antennae revealed the presence of only three olfactory sensilla (sensilla basiconica), each one housing 21 olfactory sensory neurons (OSN) [39]. Despite this limited number of olfactory sensilla, P. spumarius has shown positive responses to a variety of chemical compounds from plants and conspecifics in laboratory behavioural bioassays [40,41,42,43,44]. In addition to olfactory cues, P. spumarius utilizes vibrational signals for communication. The vibrational repertoire of P. spumarius has been characterized, revealing the use of vibrational signals in intraspecific sexual communication [45]. Thus, P. spumarius relies on a multimodal communication system.
This study aimed to investigate how the simplified sensory system of P. spumarius antennae correlates with brain development. To do this, we first investigated the ultrastructural organization of Johnston’s organ by scanning and transmission electron microscopy. By Micro-CT and confocal laser scanning microscopy, we studied the brain organization and identified the primary neuropiles. Moreover, we conducted antennal and single sensilla backfills, enabling us to investigate the target regions within the P. spumarius brain.
2. Materials and Methods
Adults of P. spumarius were collected during 2020 and 2021 on meadows near University of Konstanz (Germany) and in Umbria region (Italy). Once captured, insects were transferred to the rearing facility. Insects were reared in mesh cages (Kweekkooi 40x40x60 cm, Vermandel, Hulst, The Netherlands) under controlled conditions (25±2°C, L16:D8, RH 60±5%). Fresh Vicia faba L. plants were placed inside the cage as a food source and replaced every 10 days.
Scanning Electron Microscopy
Scanning electron observations were conducted on 10 individuals, which were anesthetized by low-temperature exposure (-18°C for 2 min) and placed in 50% ethanol. To observe antennae in natural position, the whole head with the antennae was detached from the rest of the body. Moreover, to observe the antennae from all sides, they were removed from the head by a fine scalpel blade under a stereomicroscope. The prepared specimens were dehydrated in a series of graded ethanol (60, 70, 80, 90, 95, and 99%), each step for 15 min. After dehydration, specimens were submerged in pure HMDS (Hexamethyldisilazane, Sigma-Aldrich, Dorset, UK), and allowed to dry under the hood, at room temperature. Samples were mounted on aluminium stubs, and to obtain a clear view of the different sides, the specimens were positioned with different orientations. Mounted specimens were gold-sputtered using a “Balzers Union® SCD 040” unit (Balzers, Vaduz, Liechtenstein). The observations were carried out using a FE-SEM Zeiss® SUPRA 40 (Carl Zeiss NTS GmbH, Oberkochen, Germany) and a Philips® XL 30 (Eindhoven, The Netherlands) operating at 7-10 KV, WD 9-10 mm, and analyzed by a SMART-SEM® software.
Light and Transmission Electron Microscopy
Ten individuals were anesthetized by exposure to low temperature (-18°C for 1 min). Immediately after, they were immersed in a solution of 2% glutaraldehyde and 2.5% paraformaldehyde in 0.1 M cacodylate buffer+5% sucrose, pH 7.2–7.3. Complete antennae were detached from the head and left at 4°C for 2h. The specimens were kept at 4 °C overnight in the same buffer, then the specimens were post-fixed in 1% OsO4 (osmium tetroxide) for 1 h at 4 °C and rinsed in the same buffer. Later, the specimens were dehydrated in a series of graded ethanol from 60 to 99% and embedded in Epon-Araldite with propylene oxide as bridging solvent. Thin sections were taken with a diamond knife on a LEICA ULTRACUT R ultramicrotome (Leica®) and mounted on formvar-coated 50 mesh grids. Then, sections on grids were stained with uranyl acetate (20 min, room temperature) and lead citrate (5 min, room temperature). Finally, the sections were investigated with a Philips® EM 208. Digital pictures (1376 x 1032 pixels, 8b, uncompressed greyscale TIFF files) were obtained using a high-resolution digital camera MegaViewIII (SIS®) connected to the TEM.
Histology and Immunocytochemistry
Live P. spumarius individuals were anesthetized by placing them in a freezer for 2 minutes. Using fine tweezers, brains were carefully dissected and immediately placed in freshly prepared 4% paraformaldehyde (PFA, Electron Microscopy Science, USA) dissolved in 0.01 M phosphate-buffered saline solution (PBS) for fixation. The samples were kept at room temperature on a shaker for 1 hour. After fixation, the brains were washed 7 times for 15 minutes with PBS containing 1% Triton X-100 (PBS-Tx, Sigma Aldrich, USA). The brains were preincubated overnight in an antibody blocking solution. Subsequently, the brains were incubated with primary antibody, monoclonal anti-mouse Synapsin 1 (Hybridoma Bank, USA, SYNORF1) at a 1:30 dilution for 3 days at room temperature on a shaker. After primary antibody incubation, the brains were rinsed 8 times for 30 minutes with PBS-Tx and incubated for 3 days with the secondary goat anti-mouse conjugated to Alexa Fluor 546 antibody (Thermo Fisher Scientific, USA) diluted 1:500. To visualize cell nuclei, DAPI (Sigma-Aldrich, Germany) at a dilution of 1:500 was added simultaneously with the secondary antibody. After antibody incubations, the brains were washed 11 times for 20 minutes with PBS-Tx and dehydrated in an ethanol series of increasing concentrations (50, 75, 95, and twice in 100%) for 30 minutes each step. Following dehydration, the brains were treated with xylene for 2 minutes and embedded in DPX mounting medium (Sigma-Aldrich, USA) between two cover slips separated by a custom-made metal spacer.
Antennal Backfills
Insect were anesthetized for 2 minutes in a freezer and immobilized on a cover glass. The antennae were positioned vertically and secured using Patafix, which was shaped into a wall around the scape. Within this Patafix wall, one µl of 4% Neurobiotin (Neurobiotin Plus, Vector Laboratories) was applied, after which the flagellum was removed by a razor. The insects were then placed in a dark chamber for 2 hours with a piece of wet paper to maintain high humidity. Brains dissection and fixation were carried out as described above. Synapsin-rich neuropiles were stained with a monoclonal anti-mouse Synapsin 1 was applied at 1:30 dilution followed by 8 washes PBS-Tx for 30 min each. The brains were subsequently incubated with Cy3 conjugated Streptavidin (Jackson ImmunoResearch) at a 1:400 dilution, goat anti-mouse conjugated to Alexa Fluor 488 (Thermo Fisher Scientific, USA, 1:500) and DAPI (Sigma-Aldrich, Germany, 1:500) for 3 days. Subsequently, the brains were washed 11 times in PBS-Tx for 20 min each, dehydrated in graded series of ethanol, cleared in xylene and mounted in DPX as reported above.
Single Sensillum Backfills
Insects were immobilized on a cover glass with ventral side facing upward using dental wax. A thin layer of the dental wax was applied on the antennal ledge, on which pedicel was attached. To facilitate the approach of the glass electrode to the sensilla basiconica, the arista was halved using micro scissors. The prepared specimens were positioned under light microscope (Examiner A1, Zeiss, Germany) equipped with a 250x magnification objective lens. A glass electrode, prepared using a micropipette puller (Sutter instrument, P-2000, CA, USA), was connected to a frequency generator via piezo element and mounted on a micromanipulator. When the electrode was positioned near the sensillum basiconica, the frequency was adjusted such that the glass electrode started to vibrate, causing the sensillum to break. Immediately afterward, 1 µl of 4% Neurobiotin (Neurobiotin Plus, SP-1150; Vector) was applied over the broken sensillum. The specimens were then placed in a dark box for 2 hours. Subsequently, brains were dissected and fixed as previously described. To visualize neurobiotin, Alexa Fluor 488 conjugated streptavidin was applied (Thermo Fisher Scientific, 1:400), whereas for neuropile identification monoclonal anti-mouse synapsin 1 followed with secondary goat anti-mouse conjugated to Alexa Fluor 546 antibody.
Confocal Laser Scanning Microscopy
Whole-mount preparations were scanned with a Zeiss LSM 510 or a Zeis LSM 880 confocal laser scanning microscope, equipped with a 10x and 20x objective lenses. Images were acquired in sequential mode, utilizing three different excitation wavelengths simultaneously (405 nm for DAPI, 488 nm for Alexa Fluor 488 and Alexa Fluor 488 streptavidin, 540 nm for Cy3 and 560 nm for Alexa Fluor 546). These wavelengths allowed for the visualization of antisynapsin staining, antennal nerve fill and cell body staining. Images were taken at intervals of 0.5 or 1 µm.
The 3D reconstruction of identified neuropiles was performed using Amira software (Amira 5.3, Visage Imaging, Fürth, Germany). Neuropiles were labelled using the segmentation editor with the interpolation option and were subsequently manually verified for accuracy. The final labels were rendered using the SurfaceGen tool.
Micro Computed Tomography (Micro-CT)
Individuals of P. spumarius were anesthetized by exposure to low temperatures (-20°C) for two minutes and immersed in a solution of 2% glutaraldehyde and 2.5% paraformaldehyde in 0.1 M cacodylate buffer +5% sucrose, pH 7.2–7.3 for 24 h at 4°C. Following fixation, specimens were washed with the same buffer two times for 15 minutes and stored in 99% ethanol. Specimens were subsequently stained with Lugol’s iodine solution for one week at 4°C, then washed two times for 15 minutes with 99% ethanol, mounted in a pipette tip filed with 99% ethanol and sealed with the parafilm. Micro-CT scanning was performed using a Bruker-SkyScan 1172 (Bruker, MA, USA) with a voltage of 60 kV and an amperage of 167 uA, a 360° rotation and step size of 0.15°. The resulting image projections were processed with NRecon (Version 1.7.4.6) and exported as an 8-bit BMP image series. The image series were subsequently transformed into a single 8-bit TIFF file. Segmentation was carried out in Dragonfly 2022.2 (Comet Technologies, Canada). To ensure uniformity in the segmentation an OTSU thresholding was applied. The cuticle, brain, and retina were pre-segmented by manually annotating every 25th slice. Regions of interest (ROIs) were exported as a single grayscale TIFF image, where each ROI was assigned a unique label (1-3) and everything else was labelled as background (0). Both the greyscale image and Micro-CT dataset were uploaded to Biomedisa, an online platform for semi-automatic segmentation. The resulting segmentations were imported back to Dragonfly, where ROIs were extracted and compared to assess the segmentation accuracy. Lastly, areas with spilling into the wrong ROI were manually corrected, smoothed, and rendered in 3D using Dragonfly.
3. Results
Antenna General Morphology
In P. spumarius, the antennae were composed of three segments: the scape, the pedicel and the flagellum. The flagellum was made up of a basal bulbous structure called ampulla and a long, thread-like segment known as arista (Figure 1A, B). The antennae were about 800 μm long and 110 μm in diameter. No sexual dimorphism was observed in the number or positioning of the sensory structures. The ampulla contained three sensilla basiconica and twelve sensilla coeloconica, as previously described in detail by Ranieri et al. (2016) (Figure 1D). The arista was long and tapered, often displaying a broken tip. Ultrathin cross-sections of the medial region of the ampulla revealed a single sensory neuron encased in electron-dense material (Figure 2A inset). The ampulla was inserted into the central area of the pedicel. The pedicel was notably enlarged, with a prominent external ridge on its apex, forming a concave area when observed from above (Figure 1C, D). In the space between the pedicel and the ampulla, a campaniform sensillum was observed (Figure 1E). The ultrastructure of the campaniform sensillum followed the characteristic morphology of this type of sensillum, with a thick cuticular wall slightly raised above the antenna cuticle, forming a cap-like structure. Beneath this cuticular cap, a single sensory neuron was observed, ending in a tubular body in central position and close to the internal area of the cuticular cap. The neuron was surrounded by a fine dendritic sheath and was positioned within a socket-like septum (Figure 2B).
Johnston’s Organ Organization
TEM investigations of the antenna of P. spumarius revealed details of the organization at the level of the flagellum-pedicel joint. The flagellum was inserted into the pedicel through a flexible joint membrane (Figure 2C). At this level, a thin epicuticular layer apparently originating from the epicuticle of the flagellum and pedicel, surrounds the base of the flagellum (Figure 2D). The cuticular wall of the proximal part of the flagellum ends within the pedicel lumen, where it is connected to the pedicel itself through a layer of suspension fibers (Figure 2C-E). Two cuticular apodemes, originating from the inner ridge of the pedicel, serve as anchoring point of the suspension fibers, therefore connecting the flagellum with the pedicel (Figure 2C). The Johnston’s organ (JO) of P. spumarius was composed of approximately 110 scolopidia arranged around the entire circumference of the pedicel lumen. Serial cross sections revealed that the scolopidia were organized in semicircular groups, symmetrically distributed along the inner wall of the pedicel (Figure 2E). All scolopidia were of the amphinematic type. Each scolopidium consisted of two sensory neurons enveloped by three accessory cells: the scolopale cell (SC), the attachment cell (AC), and the glial cell (GC) (Figure 3A-D). The sensory neurons were structurally similar, both presenting an axoneme with the typical 9 x 2 + 0 configuration of microtubules. Their dendrites projected distally into the scolopale space, where they were surrounded by the electron-dense extracellular scolopale tube secreted by the SC (Figure 3A-B). The very distal part of each scolopidium was bent towards the central lumen, and was ultimately connected with the joint membrane, forming an aggregation of electron-dense material (Figure 2D-F). The ciliary region of the dendrites was supported by scolopale rods, composed of longitudinally oriented microtubules embedded in actin filaments (Figure 3C-D). Within this extracellular lumen, granular material surrounded the dendritic cilium (Figure 3A). At the distal level of the pedicel, the scolopidia established a firm anchoring with the apical region by means of the attachment cell. The AC enclosed the distal part of the scolopale tube and extended towards the pedicel apex. The AC terminated at the level of the suspension fibers, where the distal dendritic ends were anchored without penetrating the cuticle of the flagellum. In this way, the terminal portion of the scolopidia was embedded within the dense fibrous matrix, ensuring mechanical coupling between antennal movements and deformation of the dendritic cilia (Figure 2E-F).
The inner dendritic segments (IDS) of the two sensory neurons contained a double basal body. The proximal basal body was surrounded by ciliary rootlets that extended from the distal basal body and fused together near the sensory soma, forming a typical ciliary root (Figure 3F). The somata of the sensory neurons were located at the periphery of the antennal lumen, in close association with epidermal cells. The cell bodies contained large nuclei and were rich in mitochondria (Figure 3E). The scolopale cell enveloped the sensory neurons from the level of the cell body up to the distal dendritic segments. Its proximal portion formed a complex labyrinth of cytoplasmic processes, while its distal portion secreted the scolopale rods. At the junction with the attachment cell, the SC produced a mesaxon that enclosed the cilia within the scolopale lumen. The glial cell contributed to the general insulation and support of the scolopidium, occupying the periphery of the complex. The attachment cell, in addition to anchoring the scolopidium distally, also ensured continuity with the suspension fibers of the pedicel apex. Unlike what has been described in other cicadellids, no central organ was detected in the antenna of P. spumarius.
General Brain Anatomy
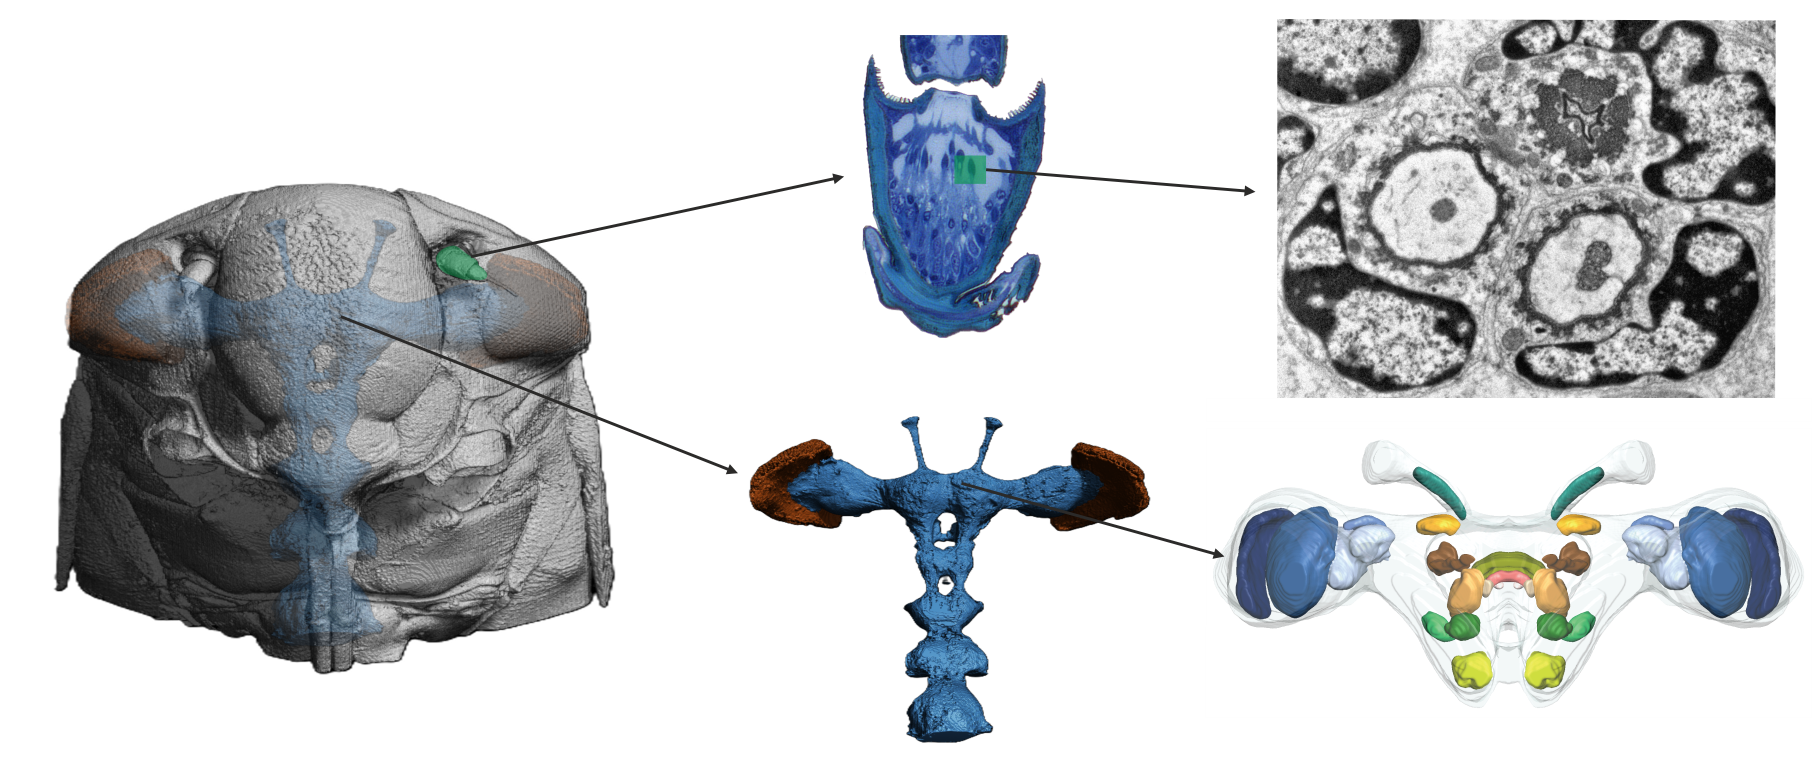
Micro-CT scans revealed the structural organization of P. spumarius brain, consisting of the central brain, sub- and supra-esophageal zones (Figure 4C, D). Brain regions appeared approximately symmetrical, with no visible distortion. The retina of the compound eye was firmly attached to the exoskeleton with no visible shrinkage (Figure 4B). The Antennal nerve passed through the anterior tentorial pit and entered the brain dorso-laterally, below the optic lobes (Figure 8A). Two ocelli were clearly distinguishable (Figure 4C, D). Although general brain staining with Lugol for Micro-CT was effective, it did not allow for differentiation of brain regions. However, the immunohistological staining with synapsin revealed distinct neuropils (Figure 5A). We identified optic lobes (Ols), the anterior optic tubercle, central complex (CX), lateral complex (LX), antennal lobes (Als), antennal mechanosensory and motor center (AMMC), mushroom bodies (MB) and tritocerebrum (Figure 5 and Figure 6).
The protocerebrum of P. spumarius comprised the optic lobes and the central brain. The Ols subdivided into well-defined Lamina (LA), Medulla (ME) and lobula complex (LOX) (Figure 5 B, C, 6A, A’, B, B’).
The LA, the most distal optic neuropile, appeared as a narrow, elongated and curved structure, that extended over the ME. The ME was the largest optic neuropile, situated between the LA and the LOX. The LOX lay medially to the ME and was further divided into lobula (LO) and lobula plate (LOP). The LO was located anteriorly while the LOP was located posteriorly and appeared shallower (Figure 5B-C, 6A, A’). The anterior optic tubercle (AOTB) was intensively stained by anti-synapsin and was connected to OLs via the anterior optic tract (Figure 5B, C). Both sexes possessed a pair of ocelli, which were located antero-dorsally between the compound eyes. The CX consisted of a group of neuropiles located at the center of the brain (Figure 5B, C). It included four substructures: central body, the protocerebral bridge and the noduli (Figure 6B, B’, C, C’). The central body was divided into upper central body (CBU, also known as fan-shaped body in some insects) and lower central body (CBL, or ellipsoid body in some insects). The PB, the most posterior neuropile, consisted of two L bar-shaped hemispheres, which get closer to one another but never made direct contact (Figure 6C, C’). The CBU, the largest substructure of the CX, was positioned dorsally and encapsulated the CBL. Below the CBL were the two NO, the smallest structures within the CX (Figure 6B, B’).
The lateral accessory lobe (LAL) was located laterally to the CBL and dorsally relative to the antennal lobe (AL). Mushroom body was less prominent neuropile. The calyx was identified by the intensive nuclei staining of the Kenyon cell bodies, which appeared smaller in size when compared with nuclei of other parts of the brain (Figure 6E, E’). Pedunculus of the MB was identified following synapsin-free regions of the brain connected to the calyx. The deutocerebrum of P. spumarius consisted of the antennal lobes (ALs) and the antennal mechanosensory and motor center (AMMC) (Figure 6D, D’). The AL, the most anterior neuropile, was located medially next to the oesophagus and appeared as hemispherical protrusions on the ventral brain surface. AL occupied 0.4% of the total brain volume and appeared to be made of numerous glomeruli (Figure 7A). However, their delimitation was not sufficient to enable us to do a 3D reconstruction of the AL. Adjacent to the AL lay the AMMC, which was positioned laterally and dorso-posteriorly to the AL.
In P. spumarius, sensory neurons from the antenna projected into the brain via a prominent antennal nerve. The afferent projections were identified following the anterograde tracings applied at the distal part of the pedicel. The antennal nerve entered the brain near the lateral complex (LX), with the majority of axons terminating in the AMMC (Figure 7B, C). From the AMMC, a subset of neurons projected into the AL (Figure 7D). Single sensillum backfills revealed individual neurons entering the AL and extensively arborizing throughout it, covering the majority of its surface (Figure 7E-F). No evidence of functional grouping was observed within the AL. Another subset of neurons bypassed the AMMC, projecting through the tritocerebrum to the gnathal ganglia (GNG)(Figure 8A, C, D). At the GNG, the primary outputs of the sensory neurons terminated. A small number of these neurons projected further, extending to and terminating in the prothoracic ganglia (Figure 8D).
4. Discussion
The present study revealed the ultrastructural organization of the Johnston’s organ in P. spumarius and provided an overview of its general brain organization. In many insects, intra- and interspecific communication signals are generated as mechanical stimuli resulting from abdomen trembling, wing spreading, stridulation, or drumming [13]. These signals are detected by chordotonal organs (such as tympanal organs and the Johnston’s organ) located in key positions, including the wing base, femur, ventral abdomen, larval abdominal wall, or antennae. The auditory organ consists of a series of scolopidia grouped into a larger structural unit—the Johnston’s organ [13,46,47].
The number of scolopidia that make up the Johnston’s organ varies across taxa. The most advanced Johnston’s organ, found in mosquitoes, consists of over 7,000 scolopidia [48,49]. In contrast, Periplaneta americana has a Johnston’s organ with approximately 150 scolopidia, while in P. spumarius, we recorded 110 scolopidia. This number is comparable to those observed in related groups, such as Heteroptera and Sternorrhyncha (Aphididae), where the number of scolopidia typically does not exceed 50 [50,51]. However, among other closely related species, scolopidia counts vary, ranging from 25 in Scaphoideus titanus Ball, to 66 in Hyalesthes obsoletus Signoret, and 72 in Metcalfa pruinosa Say [52].
The complexity of the Johnston’s organ reflects the selective pressure for intra- and interspecific communication. In honeybees, the Johnston’s organ detects the vibrations generated during the waggle dance [3], while in Drosophila melanogaster, it responds to courtship signals produced by female wing vibrations. In planthoppers, the Johnston’s organ is involved in vibrational communication via substrate-borne signals.
In P. spumarius, we identified two types of scolopidia, distinguished by the number of sensory neurons they contain. This variation may suggest a potential multifunctional role for each type. The most common type contained two sensory neurons, while the scolopidia with one sensory neuron was less prevalent. Scolopidia with two sensory neurons are commonly observed in other insects, including aphids, Periplaneta americana, Drosophila, and mosquitoes [48,49,53,54]. In Aedes aegypti, this type of scolopidium is the most abundant and plays a key role in sound perception, accounting for 97% of the total scolopidia [48,49]. Recent physiological studies in D. melanogaster have shown that within these two-neuron scolopidia, one sensory cell is sensitive to vibrations, while the other responds to static deflections [55]. These findings support the hypothesis that one sensory neuron in the Johnston’s organ is specialized for hearing, while the other is involved in detecting gravity and wind.
In addition to the similarities in the ultrastructural organization of scolopidia, we aim to draw a parallel between the antennal organization and signal transmission mechanisms in D. melanogaster and P. spumarius. The antennae of D. melanogaster consist of three segments, with a feather-like arista located on the final segment, the funiculus [56]. In Drosophila, the arista and funiculus are the primary mechanotransducers, closely linked to one another. When sound particles or wind cause the displacement of the arista, it induces the rotation of the funiculus. This rotation generates a force on the scolopidia at the attachment point, stretching them and triggering mechanosensory cilia in the nerve cells. This process opens stretch-gated mechanotransduction channels, resulting in action potentials being transmitted along the antennal nerve [57,58,59].
A similar signal reception pathway likely occurs in P. spumarius, although with a key difference in antennal structure. In Drosophila, the arista is feather-like, while in P. spumarius, it is replaced by a long, thread-like filament. In P. spumarius, displacement of the flagellum by sound waves may transmit mechanical forces to the scolopidia of the Johnston’s organ, which are attached at the base of the flagellum, within the pedicel.
Apart the well-developed Johnston’s organ, a single sensillum campaniform and a single nerve at the base of the thread flagellum were observed. Taking into consideration the campaniform sensillum position (at the cuticular base of the flagellum), this sensillum could easily perceive slight flagellar movement, which could induce pressure on the sensillum. The direct pressure on the tip of the sensilla would result in its depolarization or, in contrast, hyperpolarization, similarly to the response of scolopidia in Drosophila [60]. Besides, the presence of the sensory neuron at the flagellum base indicates a potential proprioceptive role of this structure.
The brain of P. spumarius followed the general organization found in the clade. However, when compared with the brain of true bugs (Hemiptera), it had less prominent MB and low delimitation of the AL glomeruli [30]. Moreover, differences were found at the ganglia level, which appeared to be highly fused in aphids, whereas in P. spumarius they were separated by the short connectives [33].
Previous studies on the antennal lobe organization in Homoptera and Auchenorrhyncha have reported the presence of small, aglomerular or glomerular ALs [33,34,36]. Our observations are consistent with these findings, as the AL in P. spumarius occupies approximately 0.4% of the total brain volume. A similar size has been reported for Hyalesthes obsoletus, where the AL constitutes about 0.6% of the brain [36]. This relatively small size stands in sharp contrast to the well-developed ALs of commonly studied model organisms. For instance, in Nasonia vitripennis (Walker) (Pteromalidae), the AL accounts for 12% of the total brain volume [27]; in Apis mellifera, it represents approximately 5.7% [37]; in Bombus terrestris L., 5.2% [61]; and in D. melanogaster, around 5% [62,63]. Moreover, in Apolygus lucorum Meyer-Dür (Miridae), the AL occupies nearly 15% of the brain volume, making it the species with the most prominent AL reported to date [30].
The relatively small volume of the antennal lobe (AL) in the brain of P. spumarius likely reflects its sensory ecology. Indeed, the antennae of P. spumarius exhibit a significantly reduced sensory system, consisting of only 15 sensilla, of which just three are olfactory [39]. This low number of olfactory sensilla likely contributes to the small size of the glomeruli and the AL overall. A similarly reduced number of olfactory sensory neurons (OSNs) has been reported in other species, such as psyllids and larvae of D. melanogaster [64,65].
No sexual dimorphism in AL size was observed. This is not surprising, as both sexes share a similar sensory system organization and ecological function. Differences in AL size between sexes have been reported in species where males and females exhibit distinct ecological behaviors, such as in the ant Camponotus japonicus. In this species, significant differences in AL size were found between males and unmated queens; however, no difference was observed between queens and workers [66].
Our staining of synapsin-rich neuropiles was largely successful. However, the glomeruli within the antennal lobes (ALs) appeared poorly delimited, which prevented us from performing a 3D reconstruction. This low glomerular resolution may be associated with the presence of a thin glial sheath, which plays a crucial role in glomerular organization, as previously reported in Diptera [67].
Antennal backfill analysis revealed a prominent antennal nerve projecting into both the antennal mechanosensory and motor center (AMMC) and the AL. Most of the fibers were associated with the AMMC, while only a few entered the AL. To further characterize the spatial organization of the AL, we performed single sensillum backfills. However, in addition to labelling sensory neurons from the sensilla basiconica, we also stained the nerve from the Johnston’s organ. To better visualize the sensilla and isolate individual sensilla, we extended the antennae up to the antennal ledge. This manipulation, however, led to the rupture of Johnston’s organ nerves. As a result, when neurobiotin was applied, it labelled both the targeted sensillum neurons and residual nerves from the Johnston’s organ. Despite this overlap, the staining clearly showed that the fibers entering the AL originated from the sensilla basiconica, and not from other sensillum types.
Our single sensillum backfills performed on sensilla basiconica revealed sensory neuron terminals arborizing across a large portion of the AL, without a clear functional subdivision in their arborization pattern. This diffuse localization may reflect the number of OSNs housed within each sensillum basiconicum and the total number of glomeruli. A previous study showed that each sensillum basiconicum contains 21 OSNs [39]. It is therefore conceivable that multiple OSNs from a single sensillum converge onto the same glomerulus. Similar findings have been reported in other species. In the mite Phytoseiulus persimilis, the peripheral olfactory system comprises five putative olfactory sensilla, with each glomerulus receiving input from a single sensory neuron [68]. A similar arrangement is also observed in the larvae of D. melanogaster, where 21 OSNs project to a single glomerulus [65]. However, in other insects, sensory neurons can be functionally arborized within the AL, receiving input from particular types of sensory neurons, such as olfactory or thermo-/hygroreceptive neurons [69,70,71,72] or receive inputs from multiple OSN [73].
The overall neural pattern of the Johnston’s organ afferents in P. spumarius is comparable with other species. In Drosophila, ants, and Mythimna separata a major part of the Johnston’s organ projects to the AMMC [74,75,76]. In the earlier study on Drosophila, the AMMC was divided into five zones, depending on the spatial organization of the Johnston’s organ afferents [53,76,77,78,79]. Furthermore, each zone was associated with the specific function. Zones A and B receive inputs from the nerve cells responsible for detection of near-sound and high-frequency vibrations. While zones C and E are associated with the gravitational forces and wind-induced deflections. Contrary to Drosophila and P. spumarius, in honeybees, the afferents from Johnston’s organ are slightly different diverged in the brain [80]. Most of the afferents projects to the posterior protocerebrum and subesophageal ganglion, while just a small number of afferents terminates in the AMMC.
Apart from the AMMC, the afferent neurons often project to other neuropiles. In Drosophila they are gnathal ganglia, wedge, thoracic-abdominal ganglia, anterior ventrolateral protocerebrum, saddle, ventrolateral protocerebrum [81]. The former neuropile (ventrolateral protocerebrum) receives intensive inputs from the visual interneurons, thus is also known as a visual centre in the central brain. Moreover, it receives inputs from the lateral horn. Therefore, the extension of the Johnston’s organ afferent to the ventrolateral protocerebrum may allow integration of both visual and mechanosensory signals, possibly improving continuous coordination during the flight by detecting wind currents [53,80].
Although the subesophageal ganglion is the primary centre of gustatory neurons of the mouth parts, in Drosophila brain the gustatory and Johnston’s organ neurons do not intersect. Thus, it is unlikely that these neurons have a direct contact. Moreover, as the subesophageal ganglion houses terminals of the neurons derived from the thoracic and abdominal ganglia, it was proposed that this neuropile acts as an integration centre for mechanosensory inputs from the Johnston’s organ and other parts of the brain [53].
In P. spumarius brain, we recorded an additional output centre of the Johnston’s organ centre, the prothoracic ganglia. This neuronal cell could simply be involved in transmitting information of different mechanosensory modalities to the prothoracic ganglia [78].
5. Conclusions
This study provides an integrated characterization of the Johnston’s organ and brain organization of P. spumarius. It reveals a complex mechanosensory system with approximately 110 scolopidia and a reduced olfactory system, reflected by the small and weakly glomerular AL. Neural tracing showed that most sensory neurons terminated in the AMMC, whereas only a few projected to the AL without forming clear functional arborizations. Additionally, several sensory neurons projected to both the sub- and supraoesophageal zones. This study offers new insights into the functional adaptations that enable P. spumarius to detect environmental as well as inter- and intraspecific signals, thereby supporting the development of improved control strategies for this harmful pest.
Author Contributions
Conceptualization, M.S., R.R.; methodology, M.S., R.R.; validation, M.S. R.R.; formal analysis, M.S., R.R.; investigation, M.S; resources, R.R.; data curation, M.S.; writing - original draft preparation, M.S.; writing - review and editing, M.S. R.R.; visualization, M.S.; supervision, R.R.; funding acquisition, R.R. All authors have read and agreed to the published version of the manuscript.
Funding
This research was funded by the PRIN2022 project “Exploring biological adaptations of the spittlebug Philaenus spumarius in search of alternative and sustainable control strategies (SpittleStop)”, 2022FP3FBF, assigned to Roberto Romani.
Data Availability Statement
All data are available from the authors upon request.
Acknowledgments
SEM images were obtained at the Centro Universitario di Microscopia Elettronica e a Fluorescenza (CUMEF), University of Perugia, Italy. Confocal imaging was done at Bioimaging Centre of University of Konstanz. We are grateful to Heike Naumann for her help in confocal set-up and imaging of samples. MicroCT scans were performed at the CRIST (Centro di Cristallografia Strutturale), University of Florence. We are indebted to Dr. Samuele Ciattini for helping in scanning and preliminary processing of MicroCT data.
Conflicts of Interest
The authors declare no conflicts of interest.
References
- Cocroft, R.B.; Rodríguez, R.L. The Behavioral Ecology of Insect Vibrational Communication. Bioscience 2005, 55, 323–334. [Google Scholar] [CrossRef]
- Goubaulr, M.; Batchelor, T.P.; Romani, R.; Linforth, R.S.T.; Fritzsche, M.; Francke, W.; Hardy, I.C.W. Volatile Chemical Release by Bethylid Wasps: Identity, Phylogeny, Anatomy and Behaviour. Biological Journal of the Linnean Society 2008, 94, 837–852. [Google Scholar] [CrossRef]
- Ai, H.; Kai, K.; Kumaraswamy, A.; Ikeno, H.; Wachtler, T. Interneurons in the Honeybee Primary Auditory Center Responding to Waggle Dance-like Vibration Pulses. Journal of Neuroscience 2017, 37, 10624–10635. [Google Scholar] [CrossRef]
- Saitta, V.; Rebora, M.; Piersanti, S.; Salerno, G. Visual and Chemical Cues in the Host Plant Selection of the Melon Ladybird Chnootriba Elaterii (Coleoptera: Coccinellidae). Arthropod Plant Interact 2024, 18, 637–649. [Google Scholar] [CrossRef]
- Zacharuk, R.Y. Antennae and Sensilla. In Comprehensive Insect Physiology, Chemistry and Pharmacology; Kerkut, G.A., Gilbert, L.I., Eds.; Pergamon Press: Oxford, 1985. [Google Scholar]
- Keil, T.A. Morphology and Development of the Peripheral Olfactory Organs. In Insect Olfaction; Hansson, B.S., Ed.; Springer: Berlin, 1999; pp. 5–47. [Google Scholar]
- Romani, R.; Isidoro, N.; Bin, F. Antennal Structures Used in Communication by Egg Parasitoids. In Egg Parasitoids in Agroecosystems with Emphasis on Trichogramma; 2010; pp. 57–96. ISBN 978-1-4020-9109-4.
- Dippel, S.; Kollmann, M.; Oberhofer, G.; Montino, A.; Knoll, C.; Krala, M.; Rexer, K.-H.; Frank, S.; Kumpf, R.; Schachtner, J.; et al. Morphological and Transcriptomic Analysis of a Beetle Chemosensory System Reveals a Gnathal Olfactory Center. BMC Biol 2016, 14, 90. [Google Scholar] [CrossRef] [PubMed]
- Galizia, C.G.; Rössler, W. Parallel Olfactory Systems in Insects: Anatomy and Function. Annu Rev Entomol 2010, 55, 399–420. [Google Scholar] [CrossRef] [PubMed]
- Masse, N.Y.; Turner, G.C.; Jefferis, G.S.X.E. Olfactory Information Processing in Drosophila. Current Biology 2009, 19, R700–R713. [Google Scholar] [CrossRef]
- Vosshall, L.B.; Stocker, R.F. Molecular Architecture of Smell and Taste in Drosophila. Annu Rev Neurosci 2007, 30, 505–533. [Google Scholar] [CrossRef]
- Yack, J.E. The Structure and Function of Auditory Chordotonal Organs in Insects. Microsc Res Tech 2004, 63, 315–337. [Google Scholar] [CrossRef]
- Field, L.H.; Matheson, T. Chordotonal Organs of Insects. Adv In Insect Phys 1998, 1–56. [Google Scholar] [CrossRef]
- Kavlie, R.G.; Albert, J.T. Chordotonal Organs. Current Biology 2013, 23, R334–R335. [Google Scholar] [CrossRef]
- Göpfert, M.C.; Robert, D. Nanometre-Range Acoustic Sensitivity in Male and Female Mosquitoes. Proceedings of the Royal Society B: Biological Sciences 2000, 267, 453–457. [Google Scholar] [CrossRef] [PubMed]
- Krishnan, A.; Sane, S.P. Antennal Mechanosensors and Their Evolutionary Antecedents. In Advances in Insect Physiology; Elsevier Ltd., 2015; Vol. 49, pp. 59–99.
- Matsuo, E.; Kamikouchi, A. Neuronal Encoding of Sound, Gravity, and Wind in the Fruit Fly. J Comp Physiol A Neuroethol Sens Neural Behav Physiol 2013, 199, 253–262. [Google Scholar] [CrossRef] [PubMed]
- Sun, Y.; Liu, L.; Ben-Shahar, Y.; Jacobs, J.S.; Eberl, D.F.; Welsh, M.J. TRPA Channels Distinguish Gravity Sensing from Hearing in Johnston’s Organ. Proc Natl Acad Sci U S A 2009, 106, 13606–13611. [Google Scholar] [CrossRef] [PubMed]
- Anton, S.; Homberg, U. Antennal Lobe Structure. In Insect Olfaction; Springer Berlin Heidelberg: Berlin, Heidelberg, 1999; pp. 97–124. [Google Scholar]
- Grabe, V.; Baschwitz, A.; Dweck, H.K.M.; Lavista-Llanos, S.; Hansson, B.S.; Sachse, S. Elucidating the Neuronal Architecture of Olfactory Glomeruli in the Drosophila Antennal Lobe. Cell Rep 2016, 16, 3401–3413. [Google Scholar] [CrossRef]
- Strausfeld, N.J. Arthropod Brains: Evolution, Functional Elegance, and Historical Significance, 1st ed.; Harward University Press, 2012; ISBN 0674046331.
- Dekker, T.; Ibba, I.; Siju, K.P.; Stensmyr, M.C.; Hansson, B.S. Olfactory Shifts Parallel Superspecialism for Toxic Fruit in Drosophila Melanogaster Sibling, D. Sechellia. Current Biology 2006, 16, 101–109. [Google Scholar] [CrossRef]
- Ibba, I.; Angioy, A.M.; Hansson, B.S.; Dekker, T. Macroglomeruli for Fruit Odors Change Blend Preference in Drosophila. Naturwissenschaften 2010, 97, 1059–1066. [Google Scholar] [CrossRef]
- Bressel, O.C.; Khan, M.; Mombaerts, P. Linear Correlation between the Number of Olfactory Sensory Neurons Expressing a given Mouse Odorant Receptor Gene and the Total Volume of the Corresponding Glomeruli in the Olfactory Bulb. Journal of Comparative Neurology 2016, 524, 199–209. [Google Scholar] [CrossRef]
- Acebes, A.; Ferrús, A. Increasing the Number of Synapses Modifies Olfactory Perception in Drosophila. The Journal of Neuroscience 2001, 21, 6264–6273. [Google Scholar] [CrossRef]
- Galizia, C.G.; McIlwrath, S.L.; Menzel, R. A Digital Three-Dimensional Atlas of the Honeybee Antennal Lobe Based on Optical Sections Acquired by Confocal Microscopy. Cell Tissue Res 1999, 295, 383–394. [Google Scholar] [CrossRef]
- Groothuis, J.; Pfeiffer, K.; el Jundi, B.; Smid, H.M. The Jewel Wasp Standard Brain: Average Shape Atlas and Morphology of the Female Nasonia Vitripennis Brain. Arthropod Struct Dev 2019, 51, 41–51. [Google Scholar] [CrossRef]
- Laissue, P.P.; Reiter, C.; Hiesinger, P.R.; Halter, S.; Fischbach, K.F.; Stocker, R.F. Three-Dimensional Reconstruction of the Antennal Lobe in Drosophila Melanogaster. Journal of Comparative Neurology 1999, 405, 543–552. [Google Scholar] [CrossRef]
- Solari, P.; Corda, V.; Sollai, G.; Kreissl, S.; Galizia, C.G.; Crnjar, R. Morphological Characterization of the Antennal Lobes in the Mediterranean Fruit Fly Ceratitis Capitata. J Comp Physiol A Neuroethol Sens Neural Behav Physiol 2016, 202, 131–146. [Google Scholar] [CrossRef] [PubMed]
- Xie, G.Y.; Ma, B.W.; Liu, X.L.; Chang, Y.J.; Chen, W.B.; Li, G.P.; Feng, H.Q.; Zhang, Y.J.; Berg, B.G.; Zhao, X.C. Brain Organization of Apolygus Lucorum: A Hemipteran Species with Prominent Antennal Lobes. Front Neuroanat 2019, 13, 1–13. [Google Scholar] [CrossRef] [PubMed]
- Ignell, R.; Anton, S.; Hansson, B.S. The Antennal Lobe of Orthoptera - Anatomy and Evolution. Brain Behav Evol 2001, 57, 1–17. [Google Scholar] [CrossRef]
- Schachtner, J.; Schmidt, M.; Homberg, U. Organization and Evolutionary Trends of Primary Olfactory Brain Centers in Tetraconata (Crustacea+Hexapoda). Arthropod Struct Dev 2005, 34, 257–299. [Google Scholar] [CrossRef]
- Kollmann, M.; Minoli, S.; Bonhomme, J.; Homberg, U.; Schachtner, J.; Tagu, D.; Anton, S. Revisiting the Anatomy of the Central Nervous System of a Hemimetabolous Model Insect Species: The Pea Aphid Acyrthosiphon Pisum. Cell Tissue Res 2011, 343, 343–355. [Google Scholar] [CrossRef]
- Kristoffersen, L.; Hansson, B.S.; Anderbrant, O.; Larsson, M.C. Aglomerular Hemipteran Antennal Lobes - Basic Neuroanatomy of a Small Nose. Chem Senses 2008, 33, 771–778. [Google Scholar] [CrossRef]
- Rebora, M.; Piersanti, S.; Salerno, G.; Gorb, S. The Antenna of a Burrowing Dragonfly Larva, Onychogomphus Forcipatus (Anisoptera, Gomphidae). Arthropod Struct Dev 2015, 44, 595–603. [Google Scholar] [CrossRef]
- Rossi Stacconi, M.V.; Hansson, B.S.; Rybak, J.; Romani, R. Comparative Neuroanatomy of the Antennal Lobes of 2 Homopteran Species. Chem Senses 2014, 39, 283–294. [Google Scholar] [CrossRef]
- Brandt, R.; Rohlfing, T.; Rybak, J.; Krofczik, S.; Maye, A.; Westerhoff, M.; Hege, H.C.; Menzel, R. Three-Dimensional Average-Shape Atlas of the Honeybee Brain and Its Applications. Journal of Comparative Neurology 2005, 492, 1–19. [Google Scholar] [CrossRef] [PubMed]
- Saponari, M.; Boscia, D.; Nigro, F.; Martelli, G.P. Identification of DNA Sequences Related to Xylella Fastidiosa in Oleander, Almond and Olive Trees Exhibiting Leaf Scorch Symptoms in Apulia (Southern Italy). Journal of Plant Pathology 2013, 95, 668. [Google Scholar] [CrossRef]
- Ranieri, E.; Ruschioni, S.; Riolo, P.; Isidoro, N.; Romani, R. Fine Structure of Antennal Sensilla of the Spittlebug Philaenus Spumarius L. (Insecta: Hemiptera: Aphrophoridae). I. Chemoreceptors and Thermo-/Hygroreceptors. Arthropod Struct Dev 2016, 45, 432–439. [Google Scholar] [CrossRef] [PubMed]
- Anastasaki, E.; Psoma, A.; Partsinevelos, G.; Papachristos, D.; Milonas, P. Electrophysiological Responses of Philaenus Spumarius and Neophilaenus Campestris Females to Plant Volatiles. Phytochemistry 2021, 189, 112848. [Google Scholar] [CrossRef] [PubMed]
- Cascone, P.; Quarto, R.; Iodice, L.; Cencetti, G.; Formisano, G.; Spiezia, G.; Giorgini, M.; Michelozzi, M.; Guerrieri, E. Behavioural Response of the Main Vector of Xylella Fastidiosa towards Olive VOCs. Entomologia Generalis 2022, 42, 35–44. [Google Scholar] [CrossRef]
- Ganassi, S.; Cascone, P.; Di Domenico, C.; Pistillo, M.; Formisano, G.; Giorgini, M.; Grazioso, P.; Germinara, G.S.; De Cristofaro, A.; Guerrieri, E. Electrophysiological and Behavioural Response of Philaenus Spumarius to Essential Oils and Aromatic Plants. Sci Rep 2020, 10, 1–10. [Google Scholar] [CrossRef]
- Sevarika, M.; Rondoni, G.; Ganassi, S.; Pistillo, O.M.; Germinara, G.S.; De Cristofaro, A.; Romani, R.; Conti, E. Behavioural and Electrophysiological Responses of Philaenus Spumarius to Odours from Conspecifics. Sci Rep 2022, 12, 1–9. [Google Scholar] [CrossRef]
- Sevarika, M.; Di Giulio, A.; Rondoni, G.; Conti, E.; Romani, R. Morpho-Functional Analysis of the Head Glands in Three Auchenorrhyncha Species and Their Possible Biological Significance. Microscopy and Microanalysis 2022, 28, 2177–2187. [Google Scholar] [CrossRef]
- Avosani, S.; Daher, E.; Franceschi, P.; Ciolli, M.; Verrastro, V.; Mazzoni, V. Vibrational Communication and Mating Behavior of the Meadow Spittlebug Philaenus Spumarius. Entomologia Generalis 2020, 40, 307–321. [Google Scholar] [CrossRef]
- Keil, T.A. Functional Morphology of Insect Mechanoreceptors. Microsc Res Tech 1997, 39, 506–531. [Google Scholar] [CrossRef]
- McIver, S.B. Mechanoreception. Comprehensive Insect Physiology, Biochemistry and Phramacology 1985, 6, 71–132. [Google Scholar]
- Boo, K.S.; Richards, A.G. Fine Structure of the Scolopidia in the Johnston’s Organ of Male Aedes Aegypti (L.) (Diptera: Culicidae). Int J Insect Morphol Embryol 1975, 4, 549–566. [Google Scholar] [CrossRef]
- Boo, K.S.; Richards, A.G. Fine Structure of Scolopidia in Johnston’s Organ of Female Aedes Aegypti Compared with That of the Male. J Insect Physiol 1975, 21, 1129–1139. [Google Scholar] [CrossRef] [PubMed]
- Bromley, A.K.; Dunn, J.A.; Anderson, M. Ultrastructure of the Antennal Sensilla of Aphids. Cell Tissue Res 1980, 205, 493–511. [Google Scholar] [CrossRef] [PubMed]
- Jeram, S.; Pabst, M.A. Johnston’s Organ and Central Organ in Nezara Viridula (L.) (Heteroptera, Pentatomidae). Tissue Cell 1996, 28, 227–235. [Google Scholar] [CrossRef]
- Rossi Stacconi, M.V.; Romani, R. The Johnston’s Organ of Three Homopteran Species: A Comparative Ultrastructural Study. Arthropod Struct Dev 2013, 42, 219–228. [Google Scholar] [CrossRef]
- Kamikouchi, A.; Shimada, T.; Ito, K. Comprehensive Classification of the Auditory Sensory Projections in the Brain of the Fruit Fly Drosophila Melanogaster. Journal of Comparative Neurology 2006, 499, 317–356. [Google Scholar] [CrossRef]
- Toh, Y. Fine Structure of Sense Organs on the Antennal Pedicel and Scape of the Male Cockroach, Periplaneta Americana. Journal of Ultrasructure Research 1981, 77, 119–132. [Google Scholar] [CrossRef]
- Ishikawa, Y.; Fujiwara, M.; Wong, J.; Ura, A.; Kamikouchi, A. Stereotyped Combination of Hearing and Wind/Gravity-Sensing Neurons in the Johnston’s Organ of Drosophila. Front Physiol 2020, 10, 1–8. [Google Scholar] [CrossRef]
- Foelix, R.F.; Stocker, R.F.; Steinbrecht, R.A. Fine Structure of a Sensory Organ in the Arista of Drosophila Melanogaster and Some Other Dipterans. Cell Tissue Res 1989, 258, 277–287. [Google Scholar] [CrossRef]
- Eberl, D.F. Feeling the Vibes: Chordotonal Mechanisms in Insect Hearing. Curr Opin Neurobiol 1999, 9, 389–393. [Google Scholar] [CrossRef]
- Göpfert, M.C.; Robert, D. The Mechanical Basis of Drosophila Audition. Journal of Experimental Biology 2002, 205, 1199–1208. [Google Scholar] [CrossRef] [PubMed]
- Todi, S.V.; Sharma, Y.; Eberl, D.F. Anatomical and Molecular Design of the Drosophila Antenna as a Flagellar Auditory Organ. Microsc Res Tech 2004, 63, 388–399. [Google Scholar] [CrossRef] [PubMed]
- Pézier, A.; Blagburn, J.M. Auditory Responses of Engrailed and Invected-Expressing Johnston’s Organ Neurons in Drosophila Melanogaster. PLoS One 2013, 8. [Google Scholar] [CrossRef] [PubMed]
- Rother, L.; Kraft, N.; Smith, D.B.; el Jundi, B.; Gill, R.J.; Pfeiffer, K. A Micro-CT-Based Standard Brain Atlas of the Bumblebee. Cell Tissue Res 2021, 386, 29–45. [Google Scholar] [CrossRef]
- Rein, K.; Zöckler, M.; Mader, M.T.; Grübel, C.; Heisenberg, M. The Drosophila Standard Brain. Current Biology 2002, 12, 227–231. [Google Scholar] [CrossRef]
- Shao, H.C.; Wu, C.C.; Chen, G.Y.; Chang, H.M.; Chiang, A.S.; Chen, Y.C. Developing a Stereotypical Drosophila Brain Atlas. IEEE Trans Biomed Eng 2014, 61, 2848–2858. [Google Scholar] [CrossRef]
- Kristoffersen, L.; Hallberg, E.; Wallén, R.; Anderbrant, O. Sparse Sensillar Array on Trioza Apicalis (Homoptera, Triozidae) Antennae-an Adaptation to High Stimulus Levels? Arthropod Struct Dev 2006, 35, 85–92. [Google Scholar] [CrossRef]
- Ramaekers, A.; Magnenat, E.; Marin, E.C.; Gendre, N.; Jefferis, G.S.X.E.; Luo, L.; Stocker, R.F. Glomerular Maps without Cellular Redundancy at Successive Levels of the Drosophila Larval Olfactory Circuit. Current Biology 2005, 15, 982–992. [Google Scholar] [CrossRef]
- Nishikawa, M.; Nishino, H.; Misaka, Y.; Kubota, M.; Tsuji, E.; Satoji, Y.; Ozaki, M.; Yokohari, F. Sexual Dimorphism in the Antennal Lobe of the Ant Camponotus Japonicus. Zoolog Sci 2008, 25, 195–204. [Google Scholar] [CrossRef]
- Stocker, R.F.; Lienhard, M.C.; Borst, A.; Fischbach, K.F. Neuronal Architecture of the Antennal Lobe in Drosophila Melanogaster. Cell Tissue Res 1990, 262, 9–34. [Google Scholar] [CrossRef]
- Van Wijk, M.; Wadman, W.J.; Sabelis, M.W. Morphology of the Olfactory System in the Predatory Mite Phytoseiulus Persimilis. Exp Appl Acarol 2006, 40, 217–229. [Google Scholar] [CrossRef] [PubMed]
- Hansson, B.S.; Christensen, T.A.; Hildebrand, J.G. Functionally Distinct Subdivisions of the Macroglomerular Complex in the Antennal Lobe of the Male Sphinx Moth Manduca Sexta. Journal of Comparative Neurology 1991, 312, 264–278. [Google Scholar] [CrossRef] [PubMed]
- Kanzaki, R.; Soo, K.; Seki, Y.; Wada, S. Projections to Higher Olfactory Centers from Subdivisions of the Antennal Lobe Macroglomerular Complex of the Male Silkmoth. Chem Senses 2003, 28, 113–130. [Google Scholar] [CrossRef] [PubMed]
- Kleineidam, C.J.; Obermayer, M.; Halbich, W.; Rössler, W. A Macroglomerulus in the Antennal Lobe of Leaf-Cutting Ant Workers and Its Possible Functional Significance. Chem Senses 2005, 30, 383–392. [Google Scholar] [CrossRef]
- Ruchty, M.; Helmchen, F.; Wehner, R.; Kleineidam, C.J. Representation of Thermal Information in the Antennal Lobe of Leaf-Cutting Ants. Front Behav Neurosci 2010, 4, 1–11. [Google Scholar] [CrossRef]
- Bicker, G.; Stern, M. Structural and Functional Plasticity in the Regenerating Olfactory System of the Migratory Locust. Front Physiol 2020, 11. [Google Scholar] [CrossRef]
- Grob, R.; Tritscher, C.; Grübel, K.; Stigloher, C.; Groh, C.; Fleischmann, P.N.; Rössler, W. Johnston’s Organ and Its Central Projections in Cataglyphis Desert Ants. Journal of Comparative Neurology 2021, 529, 2138–2155. [Google Scholar] [CrossRef]
- Ma, B.W.; Zhao, X.C.; Berg, B.G.; Xie, G.Y.; Tang, Q.B.; Wang, G.R. Central Projections of Antennal and Labial Palp Sensory Neurons in the Migratory Armyworm Mythimna Separata. Front Cell Neurosci 2017, 11, 1–13. [Google Scholar] [CrossRef]
- Patella, P.; Wilson, R.I. Functional Maps of Mechanosensory Features in the Drosophila Brain. Current Biology 2018, 28, 1189–1203.e5. [Google Scholar] [CrossRef]
- Kamikouchi, A.; Inagaki, H.K.; Effertz, T.; Hendrich, O.; Fiala, A.; Göpfert, M.C.; Ito, K. The Neural Basis of Drosophila Gravity-Sensing and Hearing. Nature 2009, 458, 165–171. [Google Scholar] [CrossRef]
- Matsuo, E.; Yamada, D.; Ishikawa, Y.; Asai, T.; Ishimoto, H.; Kamikouchi, A. Identification of Novel Vibration- and Deflection-Sensitive Neuronal Subgroups in Johnston’s Organ of the Fruit Fly. Front Physiol 2014, 5, 1–13. [Google Scholar] [CrossRef]
- Yorozu, S.; Wong, A.; Fischer, B.J.; Dankert, H.; Kernan, M.J.; Kamikouchi, A.; Ito, K.; Anderson, D.J. Distinct Sensory Representations of Wind and Near-Field Sound in the Drosophila Brain. Nature 2009, 458, 201–205. [Google Scholar] [CrossRef]
- Ai, H.; Nishino, H.; Itoh, T. Topographic Organization of Sensory Afferents of Johnston’s Organ in the Honeybee Brain. Journal of Comparative Neurology 2007, 502, 1030–1046. [Google Scholar] [CrossRef]
- Matsuo, E.; Seki, H.; Asai, T.; Morimoto, T.; Miyakawa, H.; Ito, K.; Kamikouchi, A. Organization of Projection Neurons and Local Neurons of the Primary Auditory Center in the Fruit Fly Drosophila Melanogaster. Journal of Comparative Neurology 2016, 524, 1099–1164. [Google Scholar] [CrossRef]
Figure 1.
Scanning and light microscopy micrograph of Philaenus spumarius antennae. A) Ventral view of the antenna showing a short scape (Sc), a large pedicel (Pd) and the flagellum (Fl) which is composed of a basal ampulla (Am) and a long arista (Ar). B) Close-up view of the basal part of the antenna. C) Longitudinal LM section of the pedicel, showing several scolopidia (white arrowheads) belonging to the Johnston’s organ. D) Frontal view of the antennae showing sensory structures present on the ampulla and the area between the ampulla and the apical part of the pedicel. A campaniform sensillum (Ca) can be observed at the apical part of the pedicel. E) Higher magnification image of the Ca sensillum. Scale bars: A = 200 μm, B = 50 μm, C = 25 μm, D = 20 μm, E = 10 μm.
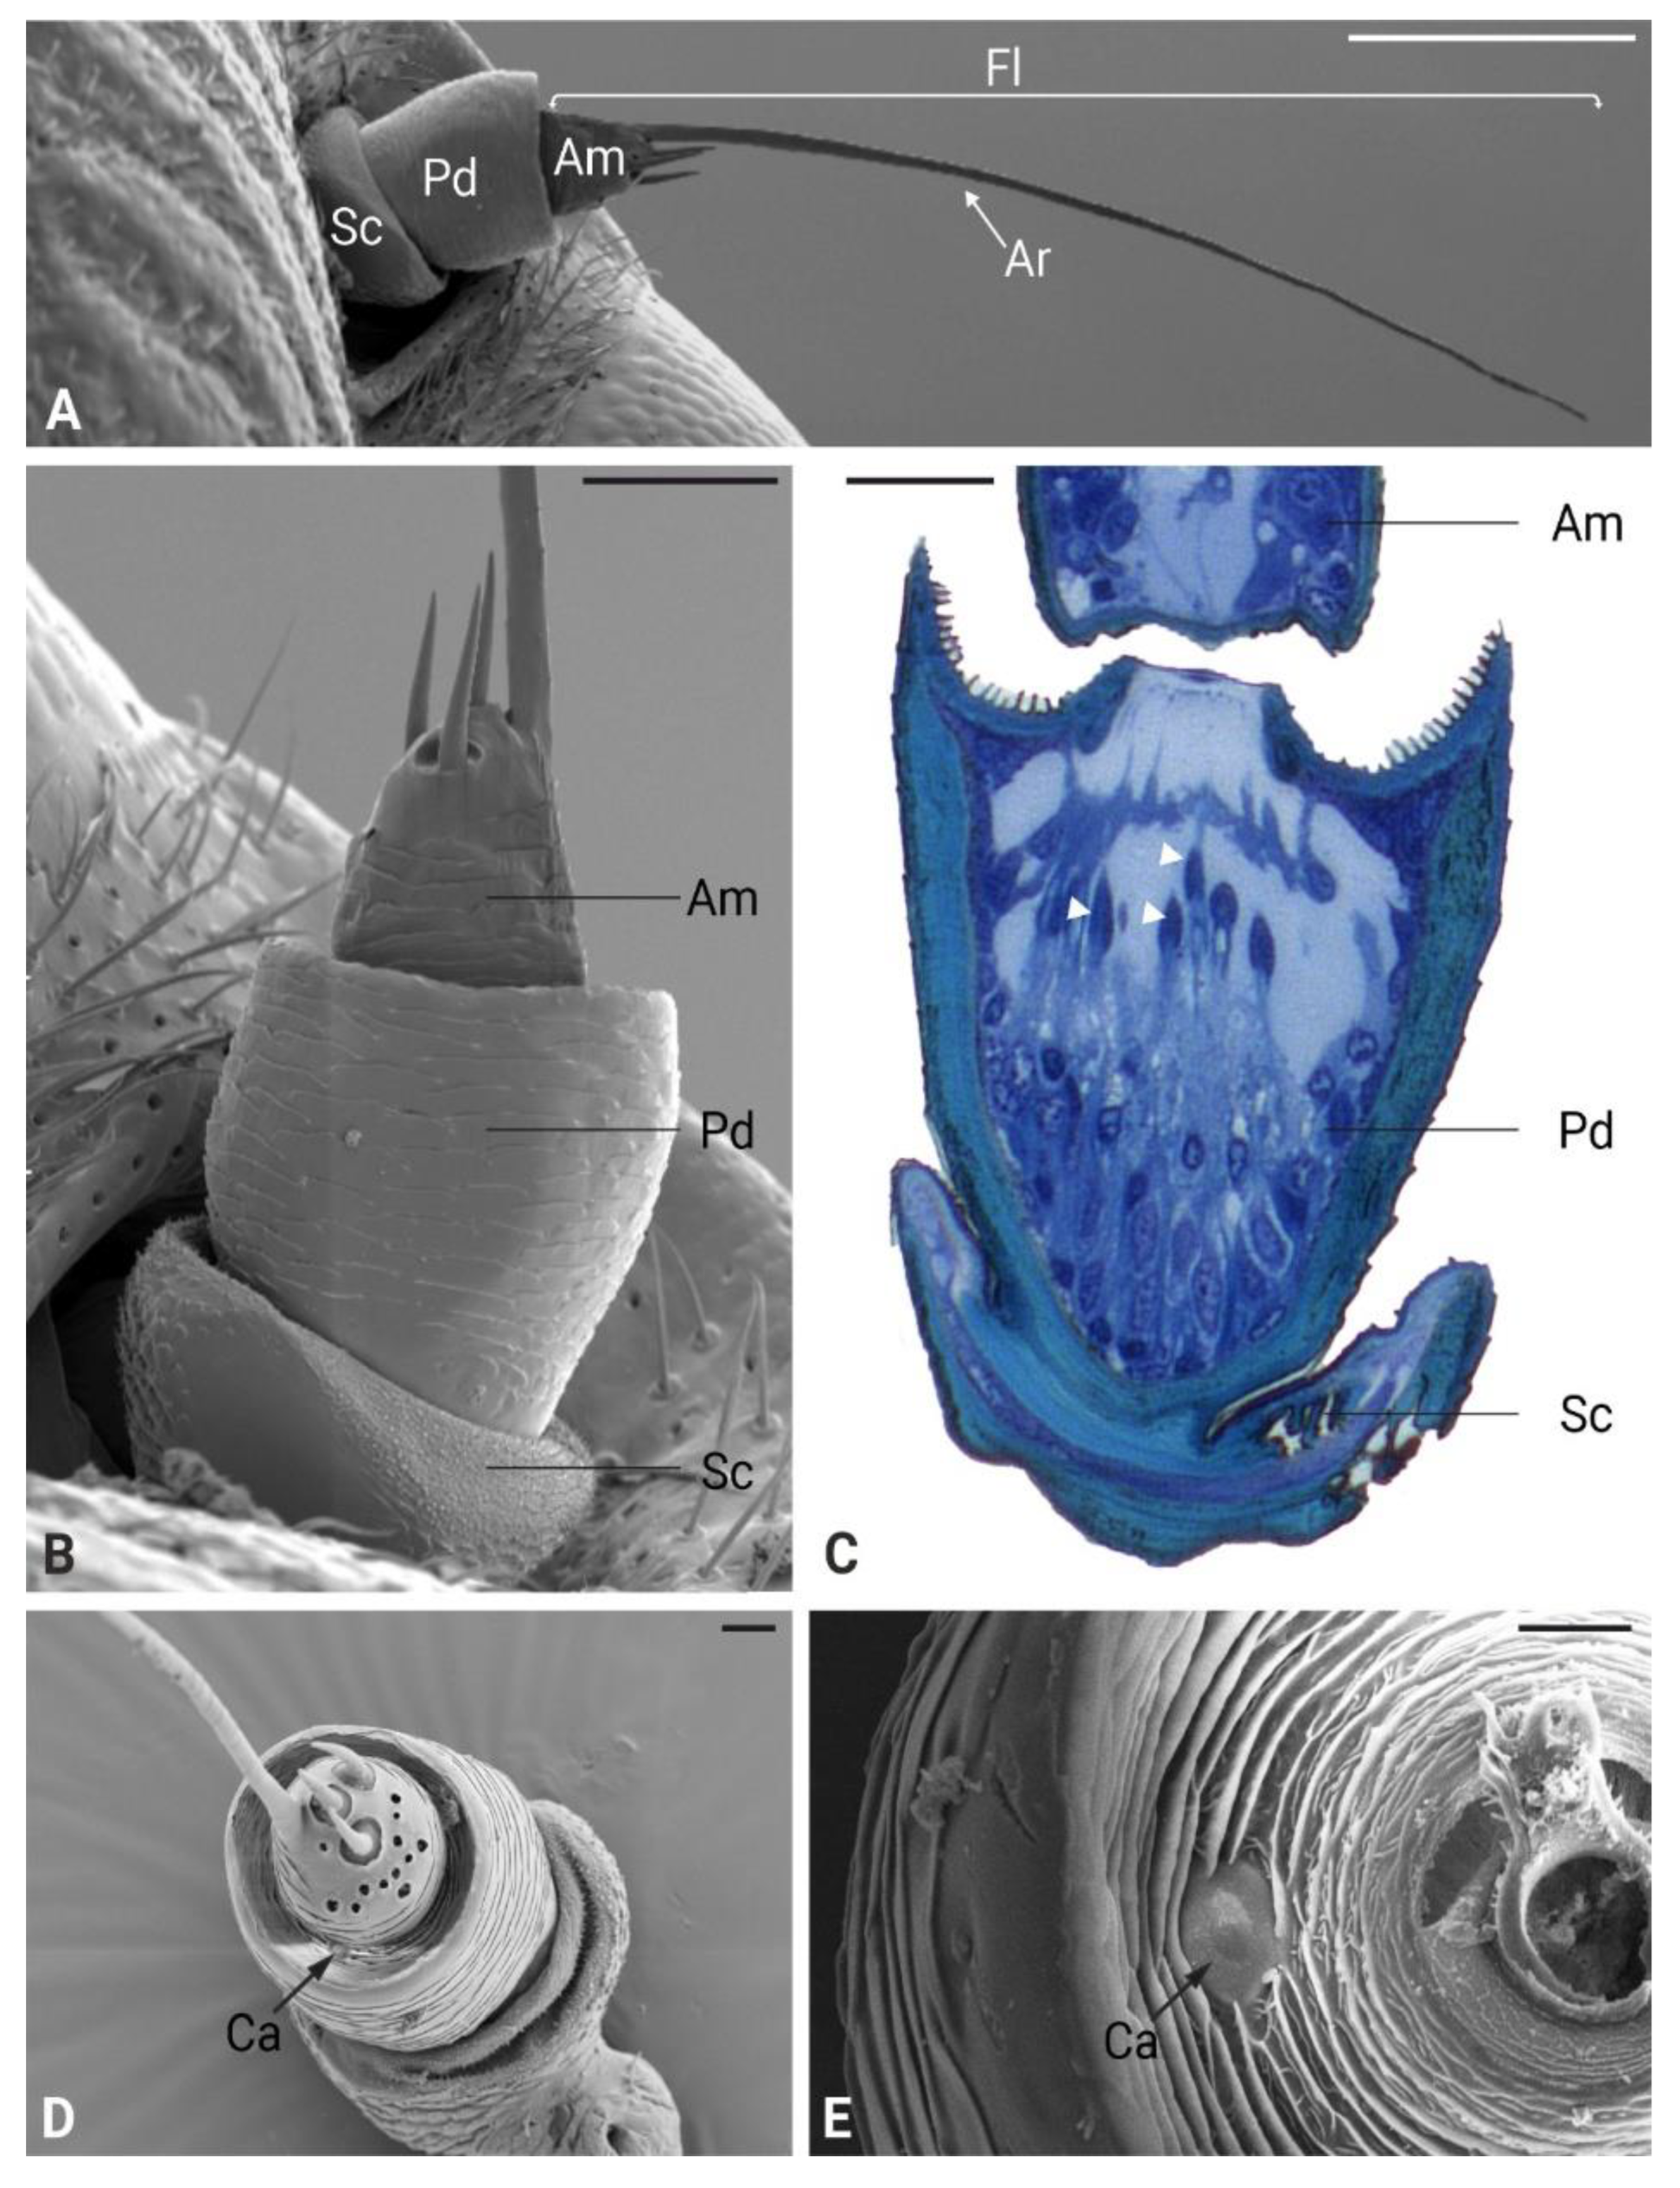
Figure 2.
Ultrastructural organization of Philaenus spumarius antennae. A) Cross-section of the middle portion of the arista showing an electron-dense cuticular wall (CW): on one side, a single sensory neuron surrounded by a dendrite sheath is present. Inset: higher magnification image of the sensory neuron. B) Longitudinal section of sensilla campaniformia showing the cuticular cap (CC) inserted on the thicker antennal wall (CW). A single sensory neuron surrounded by the dendrite sheath (DS) enters the Ca lumen and ends just below the CC. The apical tubular body (TB) is clearly visible. The sensory neuron is positioned below the cuticular cap and surrounded by a socket septum (SS). C) Longitudinal section at the joint level between the pedicel and the ampulla of the flagellum. The joint membrane (JM) extends over the apical part of the pedicel and attaches to the flagellum. The flagellum is inserted on the suspension fibers (arrowheads) which connect to the apodeme (AP). At the central lumen of the pedicel a series of scolopidia (SC) are visible. D). Higher magnification image of the suspension fibers. E) Cross section of the apical part of the pedicel with the basal flagellum at its center. The antennal nerve occupies a large portion of the flagellum’s lumen. The scolopidia of Johnston’s organ are distributed in a circular pattern around the flagellum. Individual scolopidia are embedded in the suspension fibers between pedicel and flagellum. E) High magnification image of the scolopidia attachment to the flagellum. Scale bars: A = 5 μm, B = 2 μm, C = 10 μm, D = 2 μm, E = 5 μm, F = 0.5 μm.
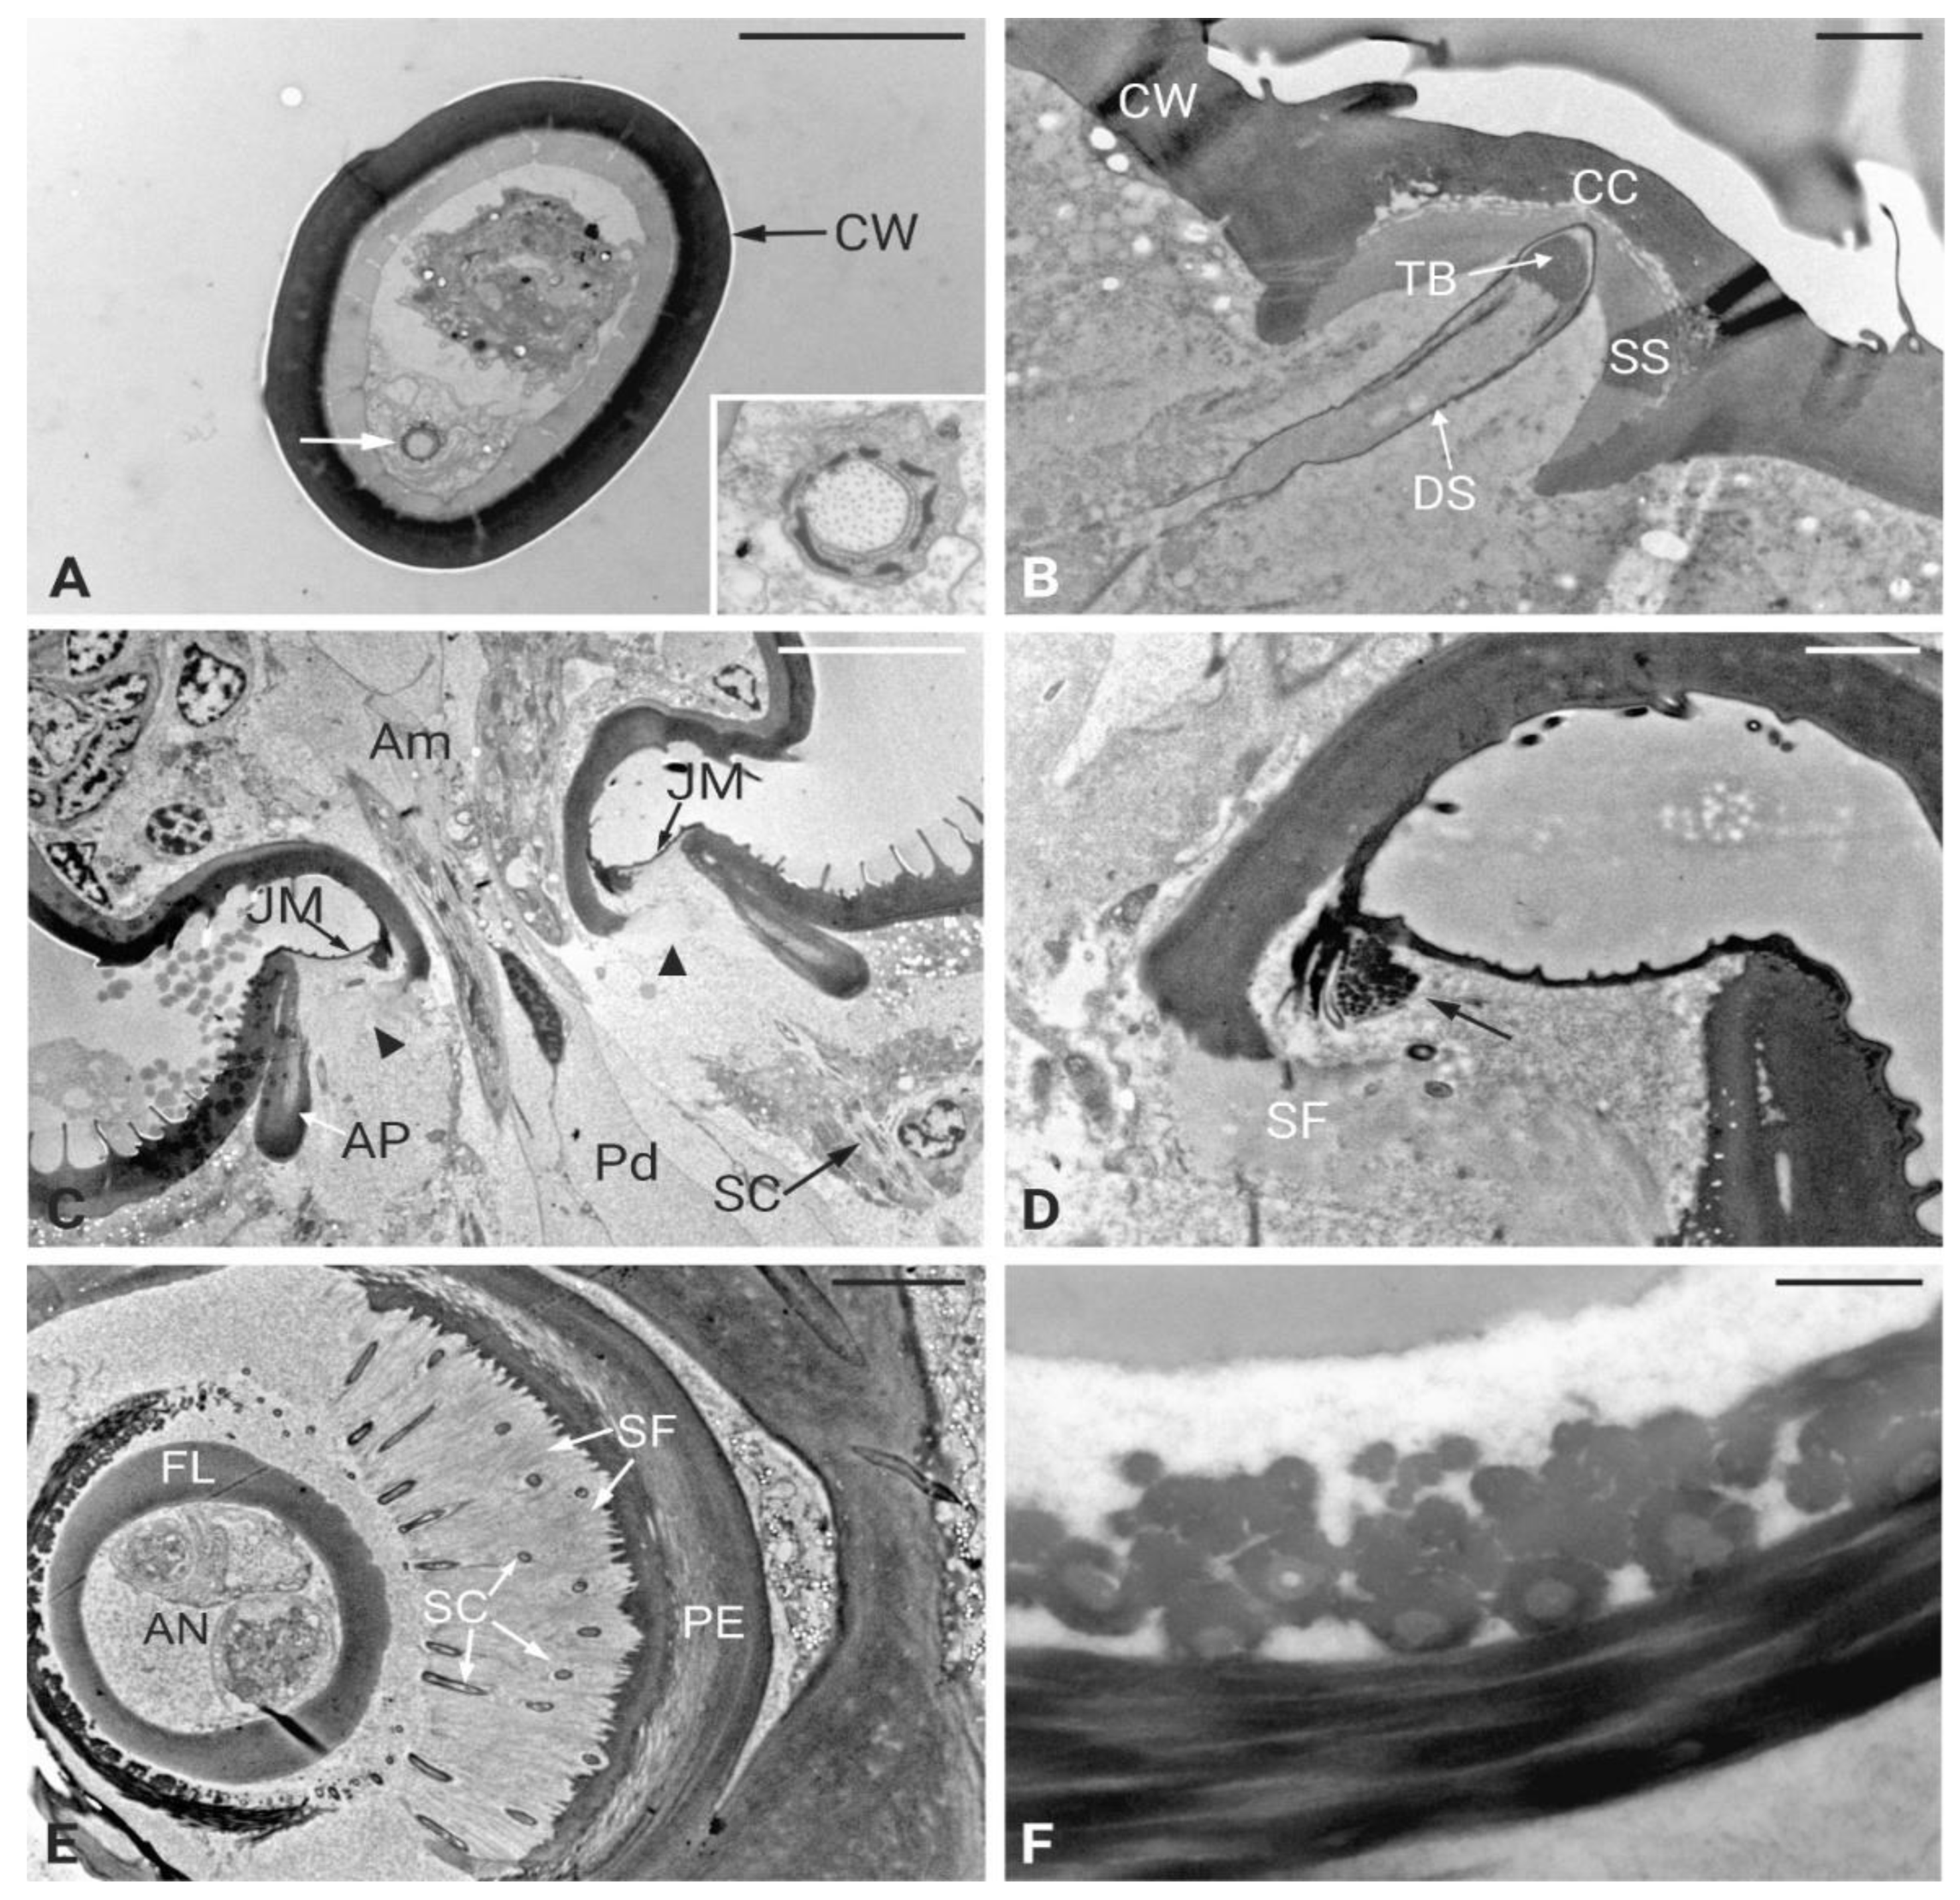
Figure 3.
Ultrastructural organization of the scolopidia of Johnston’s organ in Philaenus spumarius. A) Cross-section of three scolopidia, each containing a different number of cilia and a large nucleus. B) Distal part of a scolopidium showing two cilia (C) surrounded by an extracellular cap (EC). The scolopale rods (SR) are almost fused at this stage and the scolopale cell is significantly reduced. C) More proximal section of the scolopidium showing two almost fused cilia. D) Sections taken at the basal part of the scolopidium showing the ciliary roots (CR) and desmosome (DE). Within the scolopale cell, six segments of scolopale rods (SR) are visible. E) Longitudinal section taken at the basal part of the pedicel showing several scolopidia with large nuclei. F) Longitudinal section of scolopidia surrounded by scolopale rods (SR). Within the rods, a cilium (C) is visible at its proximal part, while at the distal part, the basal bodies (BB) and granular material (GM) are present. Inset: high magnification image of the proximal and distal basal bodies. Scale bars: , A, B = 1 μm; E = 5 μm; F, C = 2 μm; D = 0.5 μm.
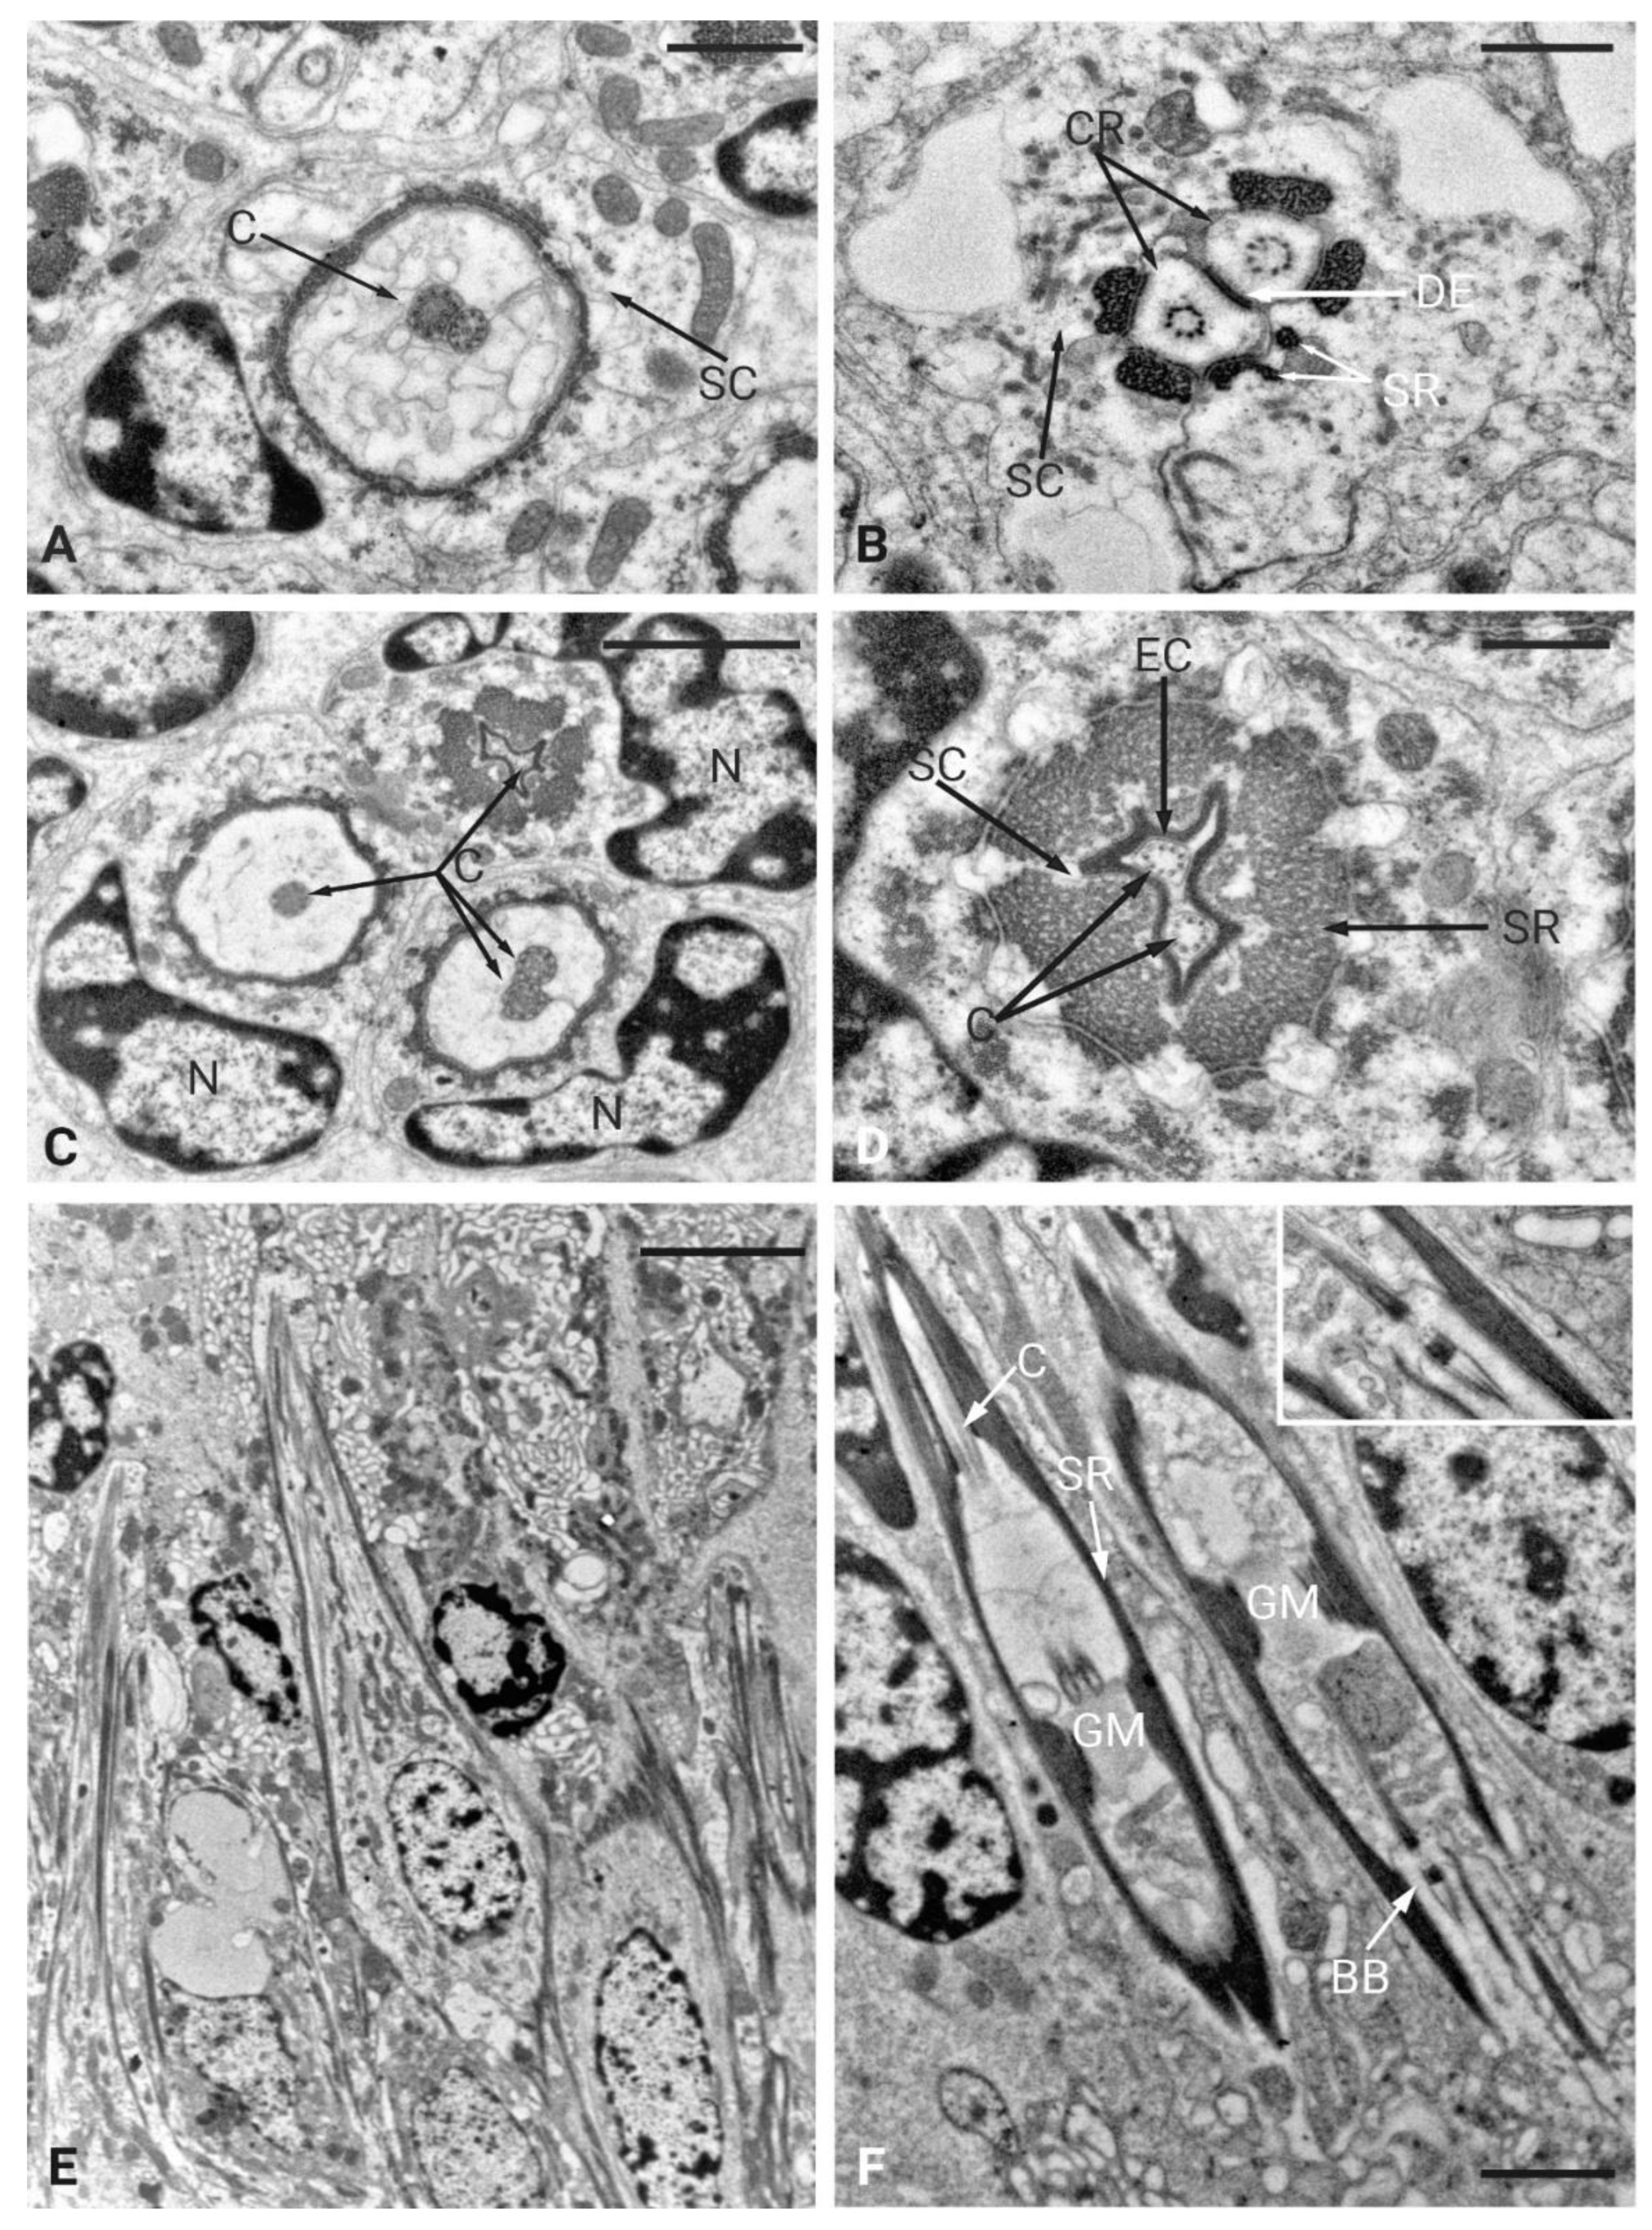
Figure 4.
Micro-CT based 3D reconstruction of the head and brain in Philaenus spumarius. A) 3D Reconstruction of the head of P. spumarius. B) Cross section of the head showing the brain within the internal lumen and retina attached to the cuticle. C) Ventral view of P. spumarius brain with the gnathal (gng) and three thoracic ganglia (ptg, mtg, msg). D) Dorsal side of P. spumarius brain. retina (ret), ocelli (oce), central brain (cb), optic lobes (ol). Scale bars: A, B, C, D = 500 μm.
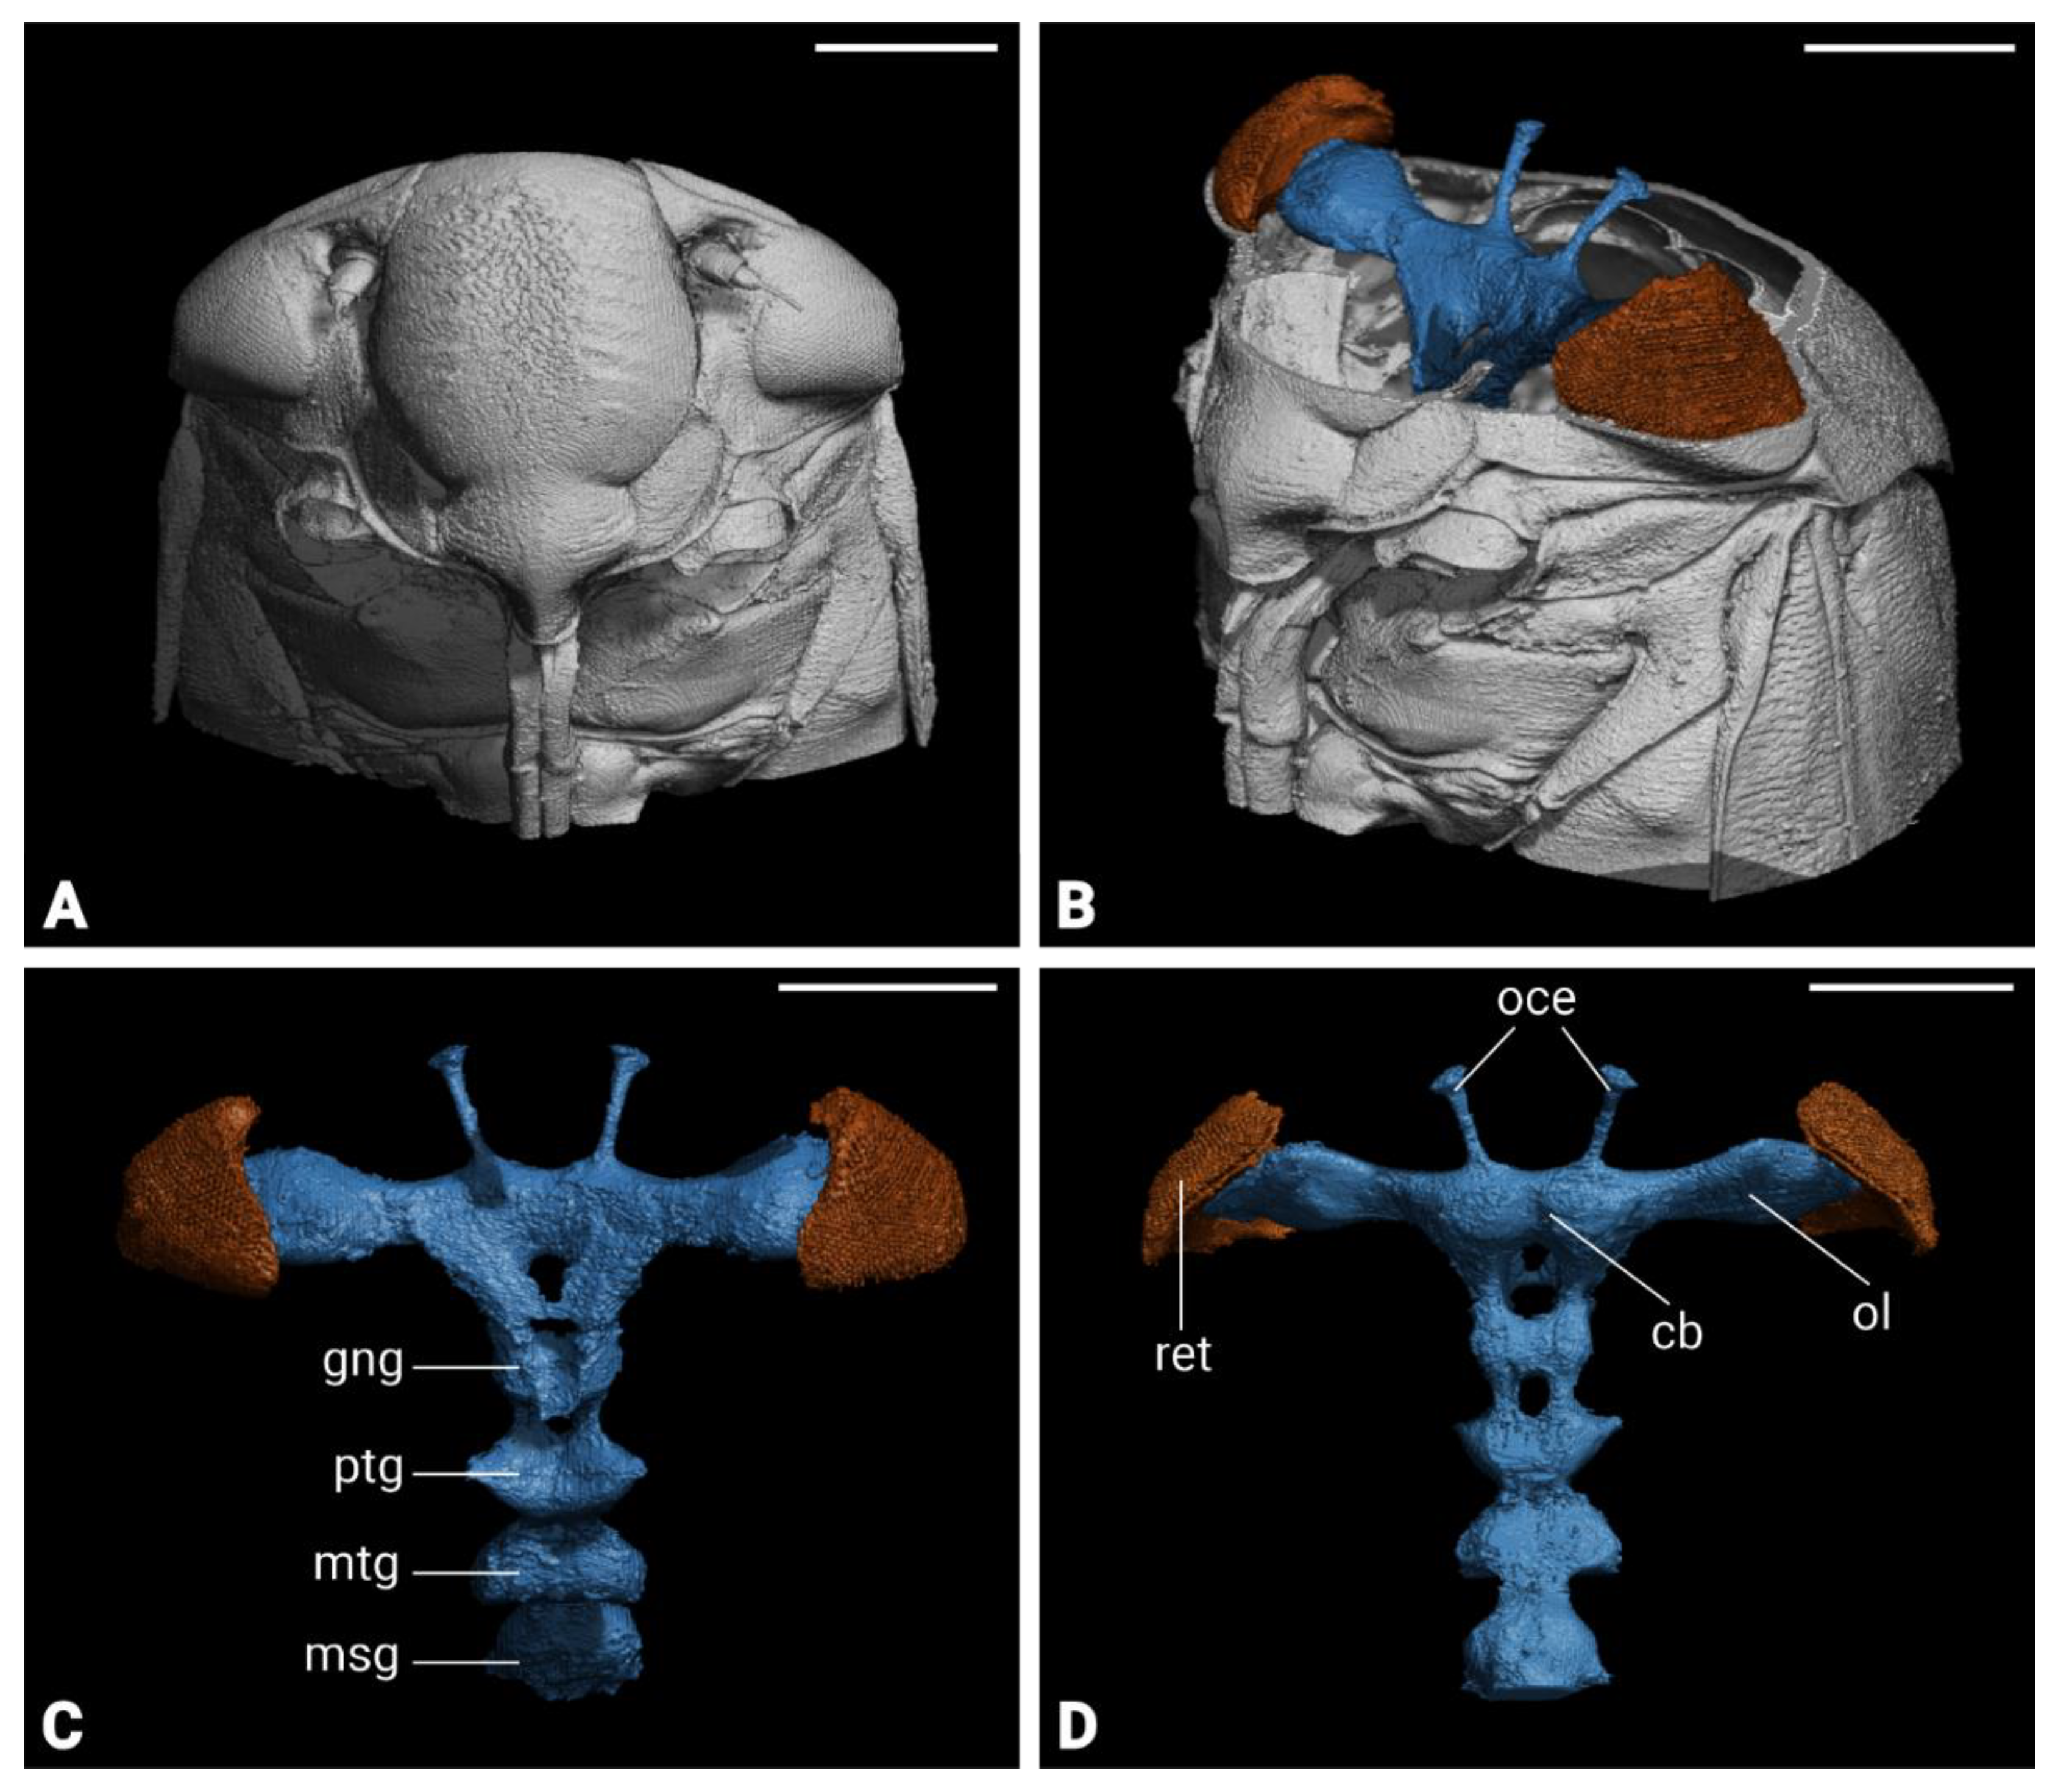
Figure 5.
Immunocytochemistry-based 3D reconstruction of the brain of Philaenus. spumarius. A) Single optical section through medial pat of the brain showing anti-synapsin staining. B) Frontal view of P. spumarius brain with major neuropiles labeled. C) Posterior view of the brain. Abbreviations: AL, antennal lobe; AMMC, antennal mechanosensory and motor centre; AOTB, anterior optic tubercle; EB, ellipsoid body; FB, fan-shaped body; LA, lamina; LAL, lateral accessory lobe; LO, lobula; LOP, lobula plate; MB, mushroom body; ME, medulla; NO, Noduli, PB, protocerebral bridge; TR, tritocerebrum. Scale bars: A = 150 μm, B, C = 100 μm.
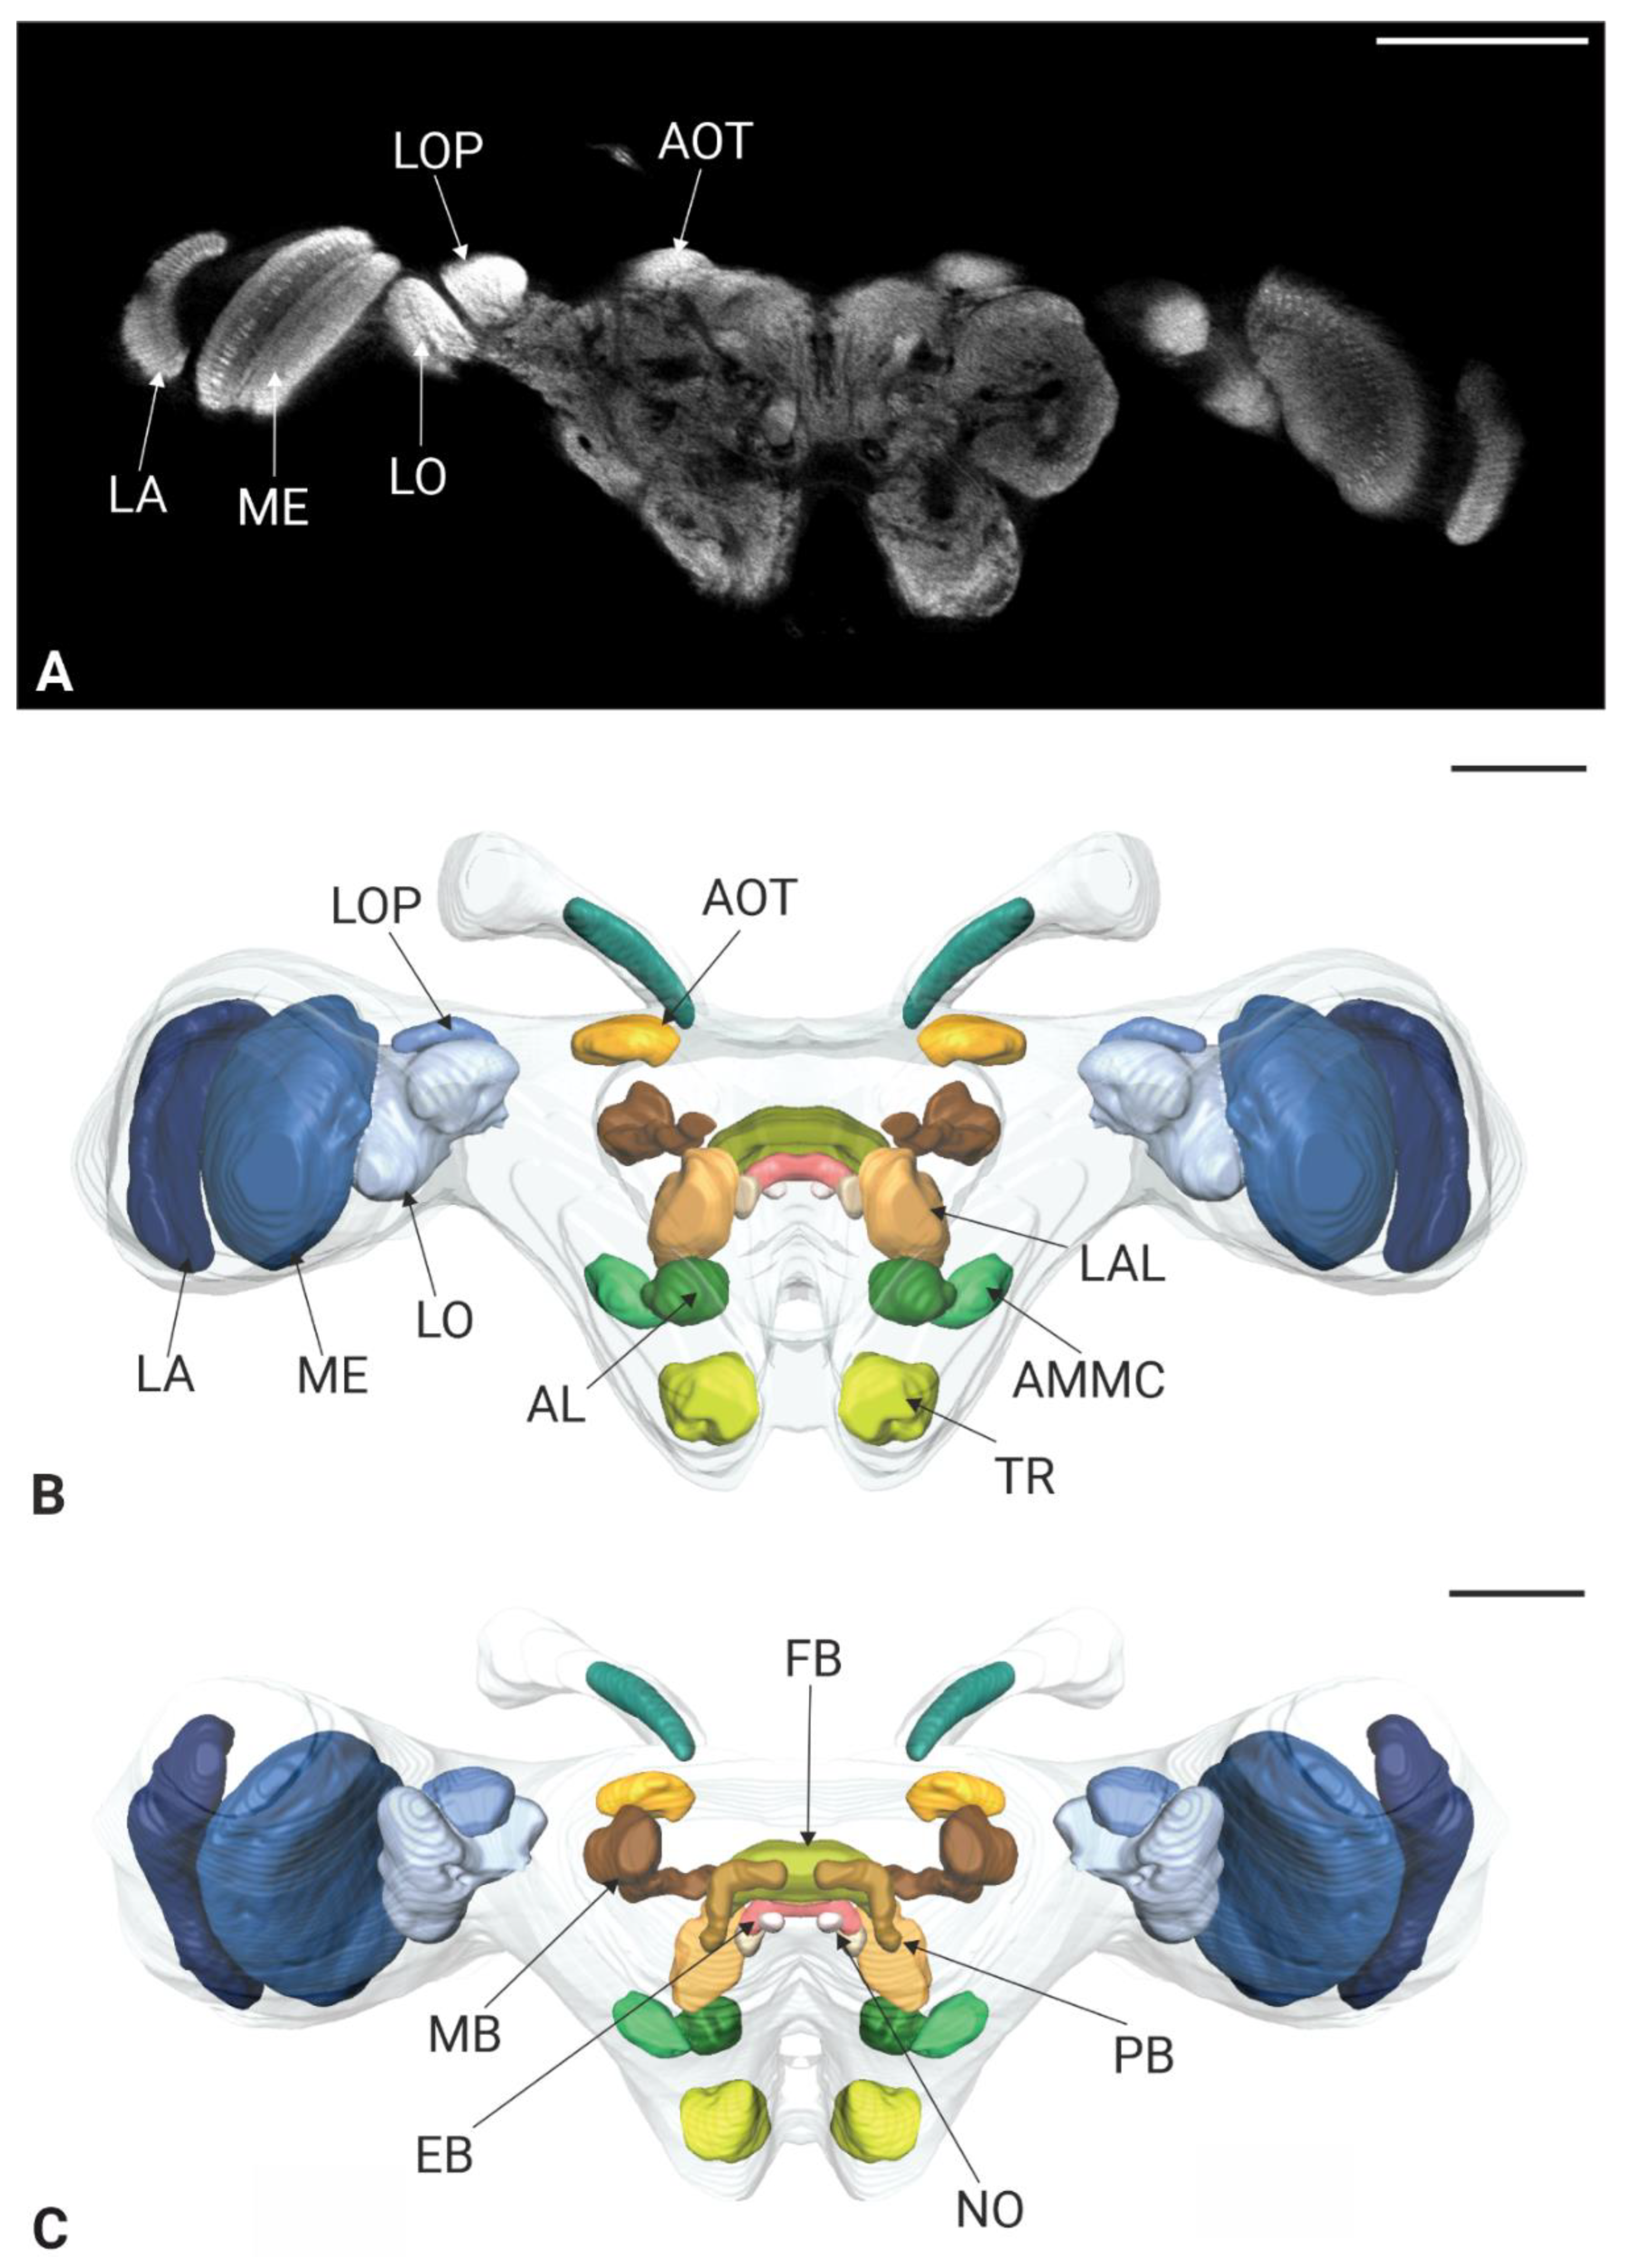
Figure 6.
Optical sections and 3D renderings of neuropules in the brain of Philaenus spumarius. A, A’) Optic lobe showing Lamina (LA), Medula (ME), Lobula (LO) and Lobula plate (LOP), B, B’) Central body and its 3D reconstruction, including the fan shaped body (FB), ellipsoid body (ED) and noduli (NO). C, C’) Protocerebral bridge (PB) and its 3D reconstruction, D, D’) Single section showing antennal lobe (AL), antennal mechanosensory and motor centre (AMMC), and tritocerebrum (TR) together with 3D reconstruction, E, E’) Section showing dense nuclei of Kenyon cells (KC) used as a landmark for the mushroom body. Scale bars: A, A’ = 100 μm , B, B’, C, C’ = 50 μm, D, D’ = 20 μm, E,E’ = 100 μm.
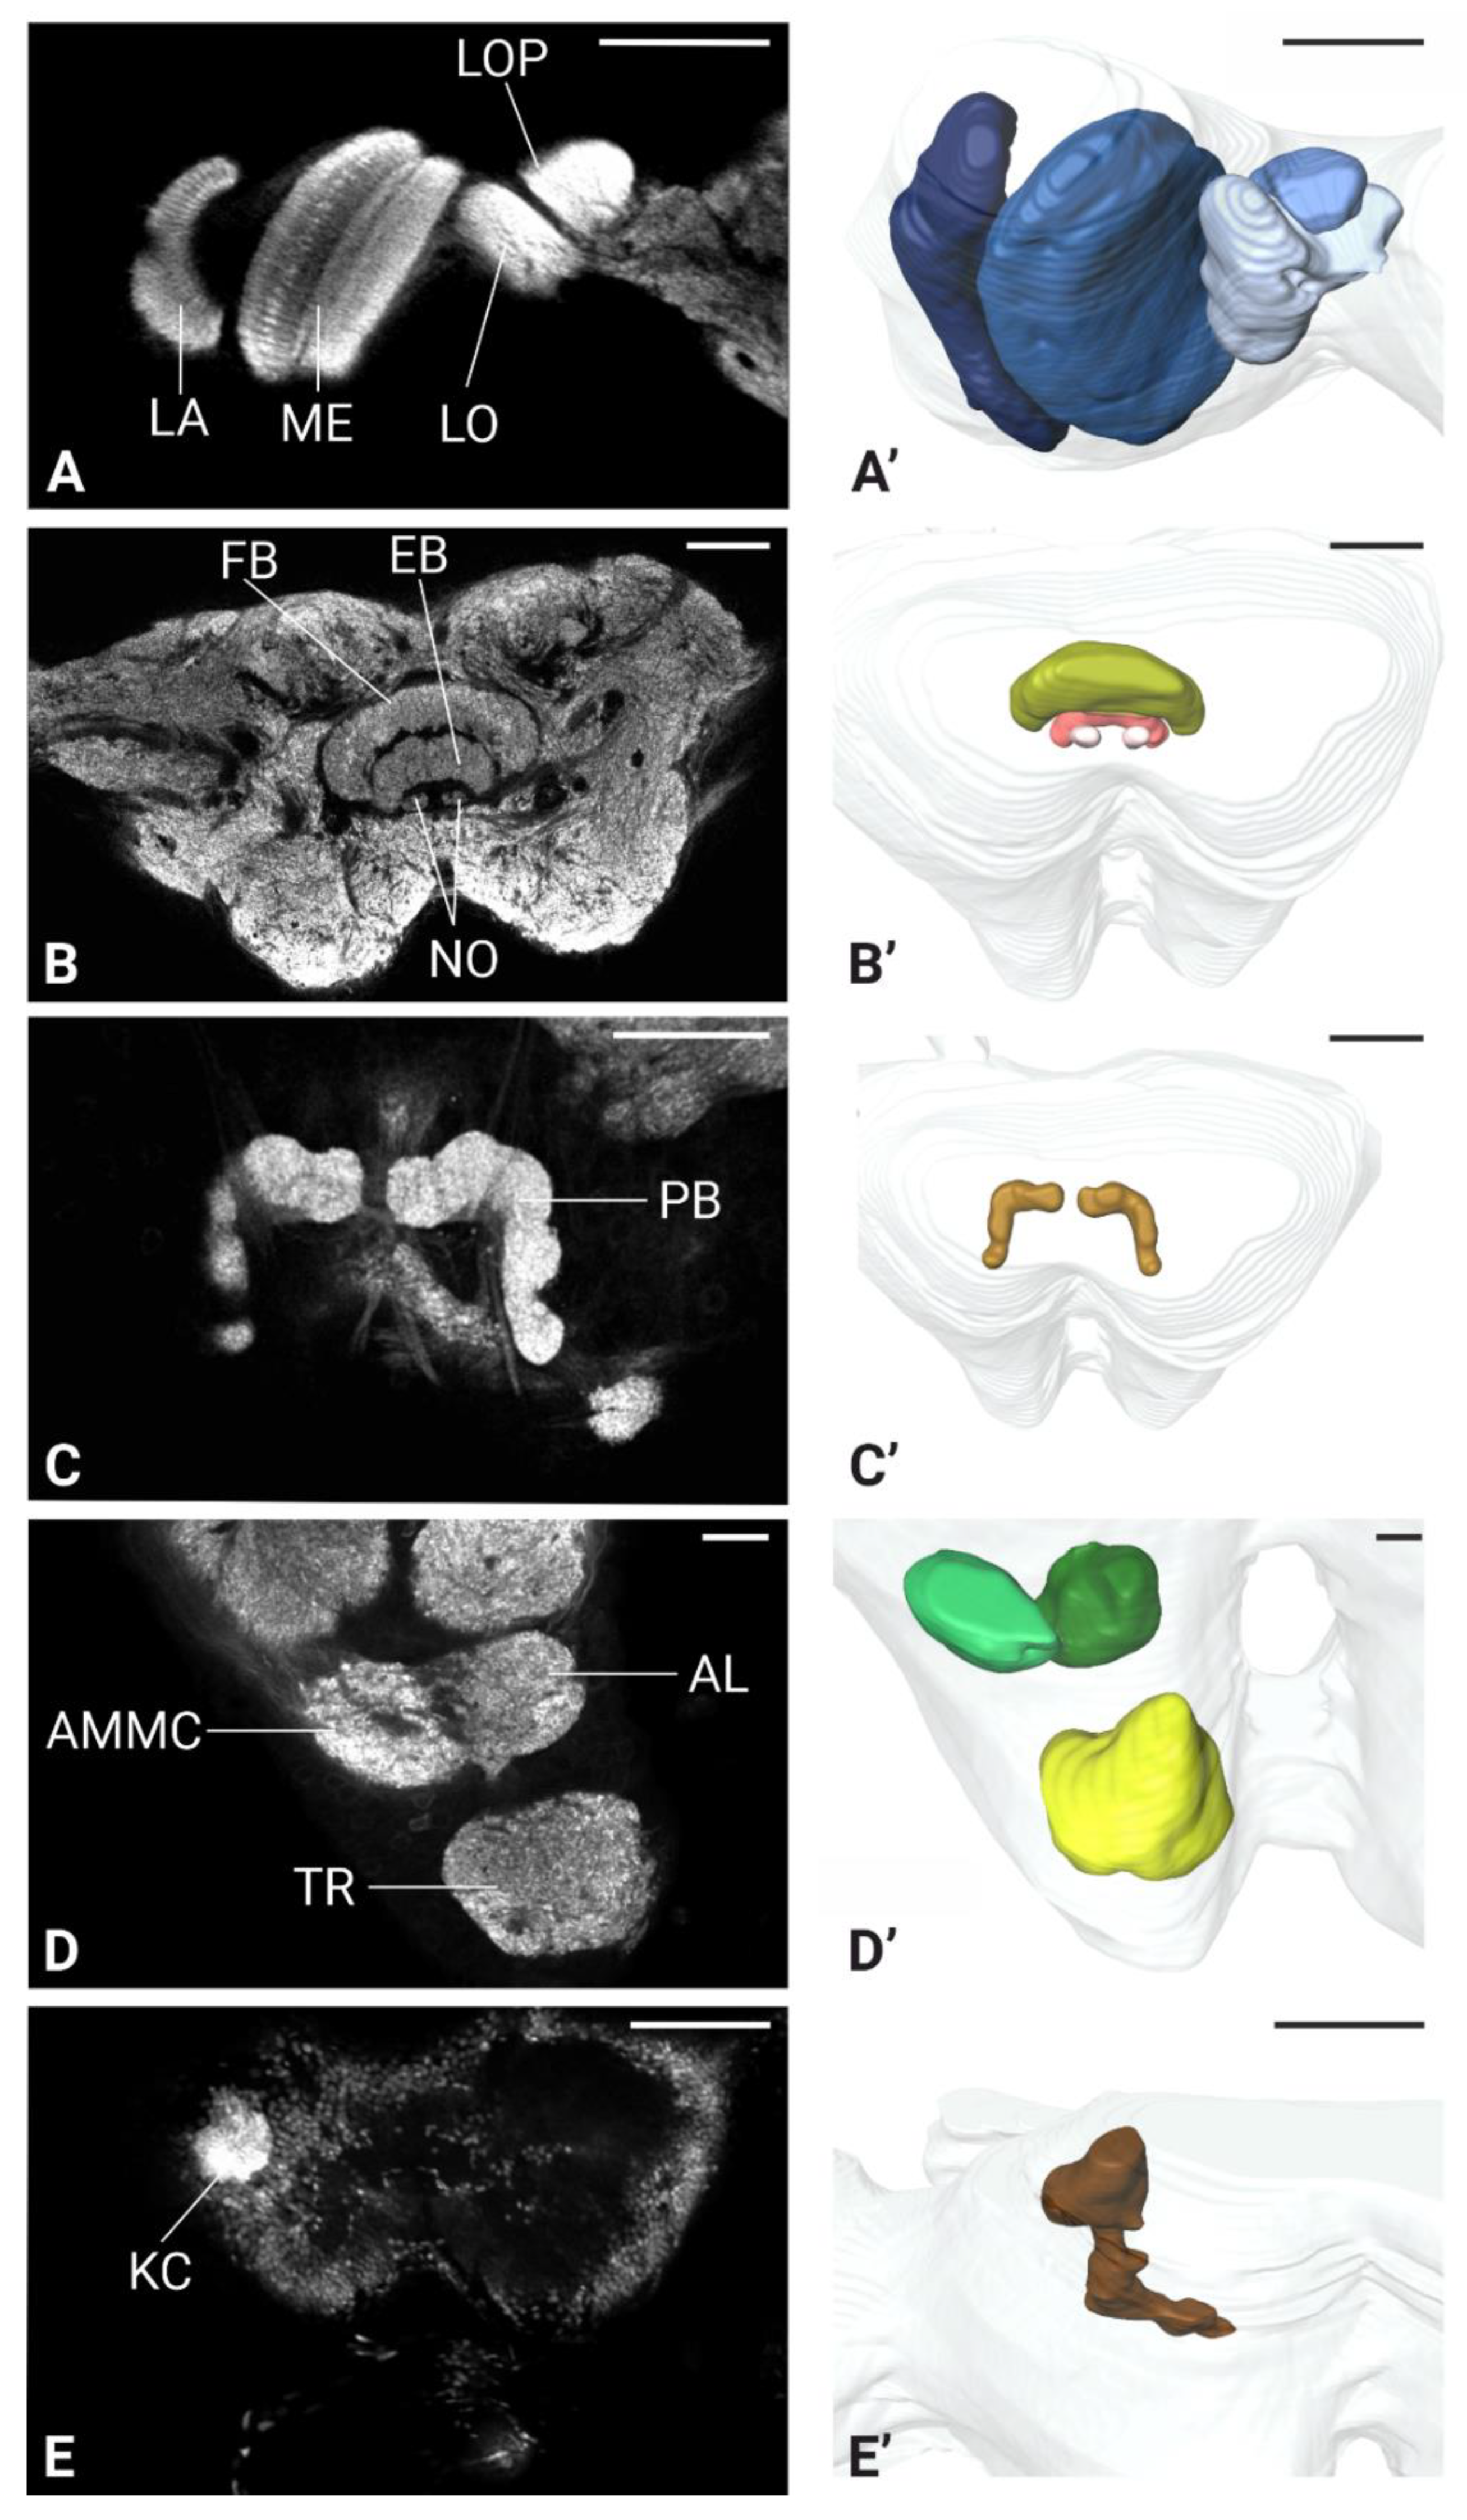
Figure 7.
Antennal lobe and antennal nerve projection in the brain of P. spumarius. A) Mid-level section of the antennal lobe showing numerous small, rounded glomeruli (*). B) Antennal backfills staining revealing the antennal nerve (AN) passing through the AMMC towards the tritocerebrum. C, D) Sensory neuros terminating in the antennal lobe (AL) shown via antennal nerve backfills. E, F), Single sensillum backfills indicating sensory neurons arborization at different levels within the antennal lobe. Scale bars: A-F = 20 μm.
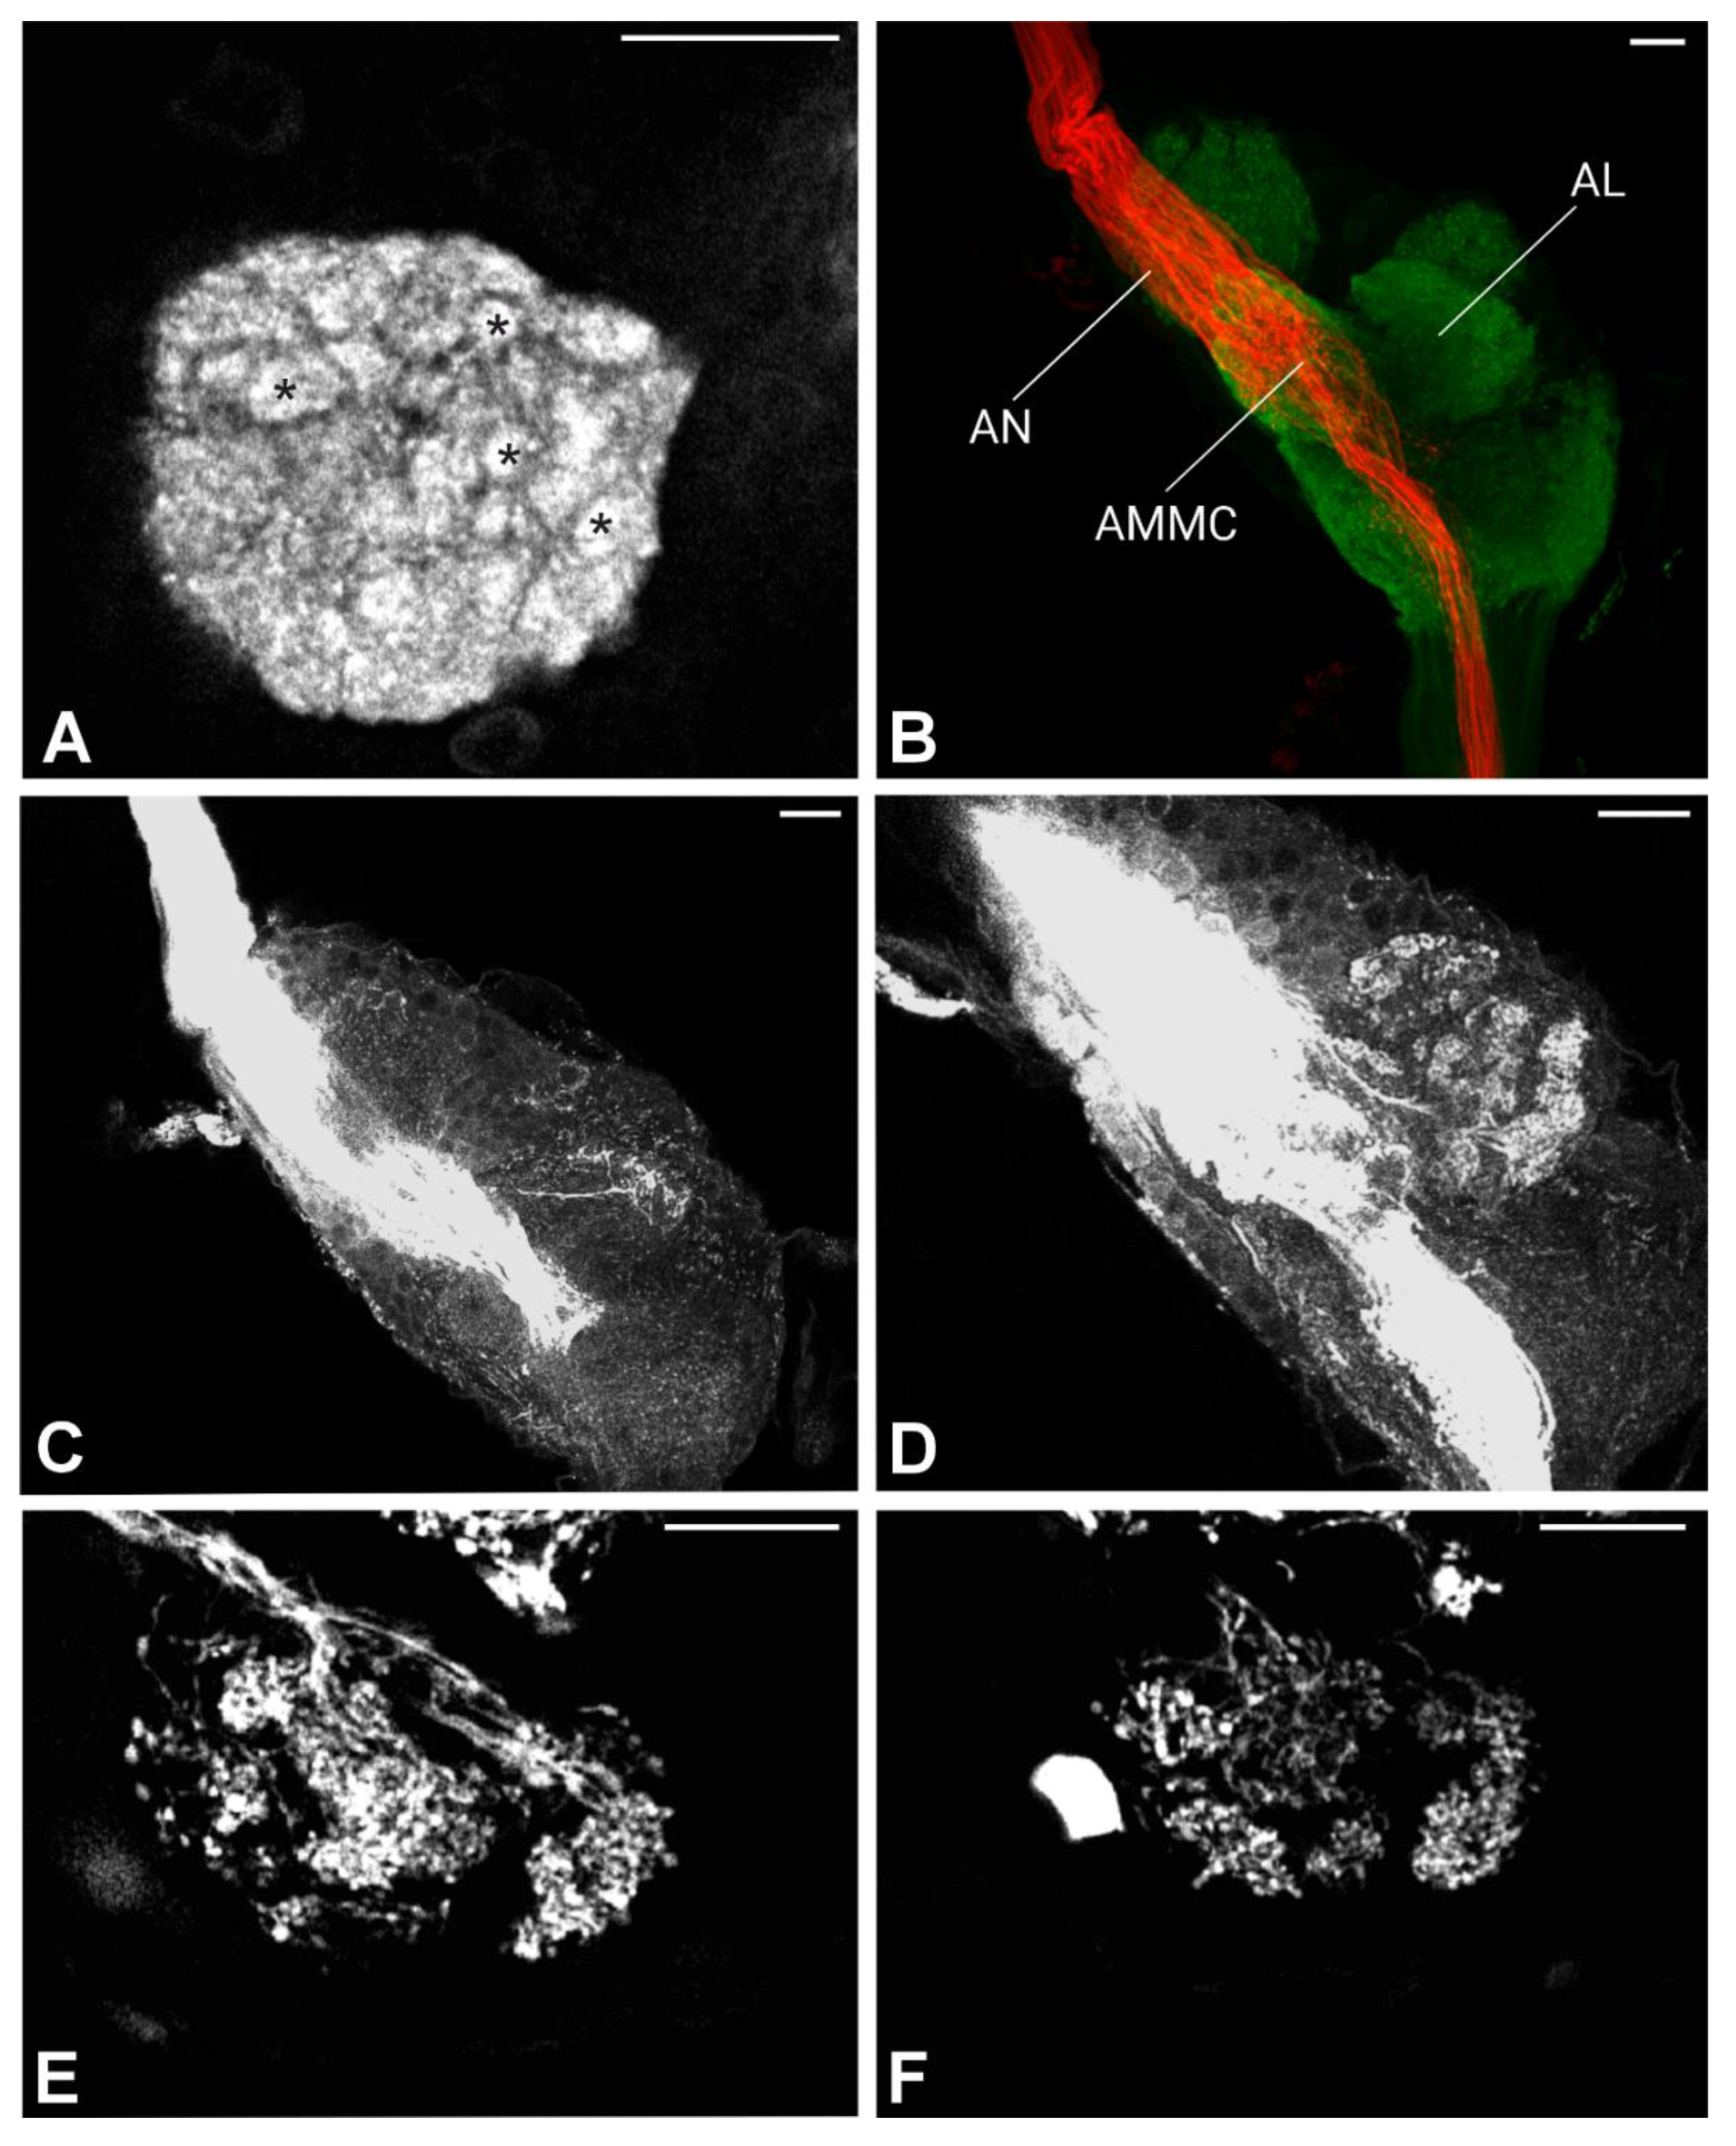
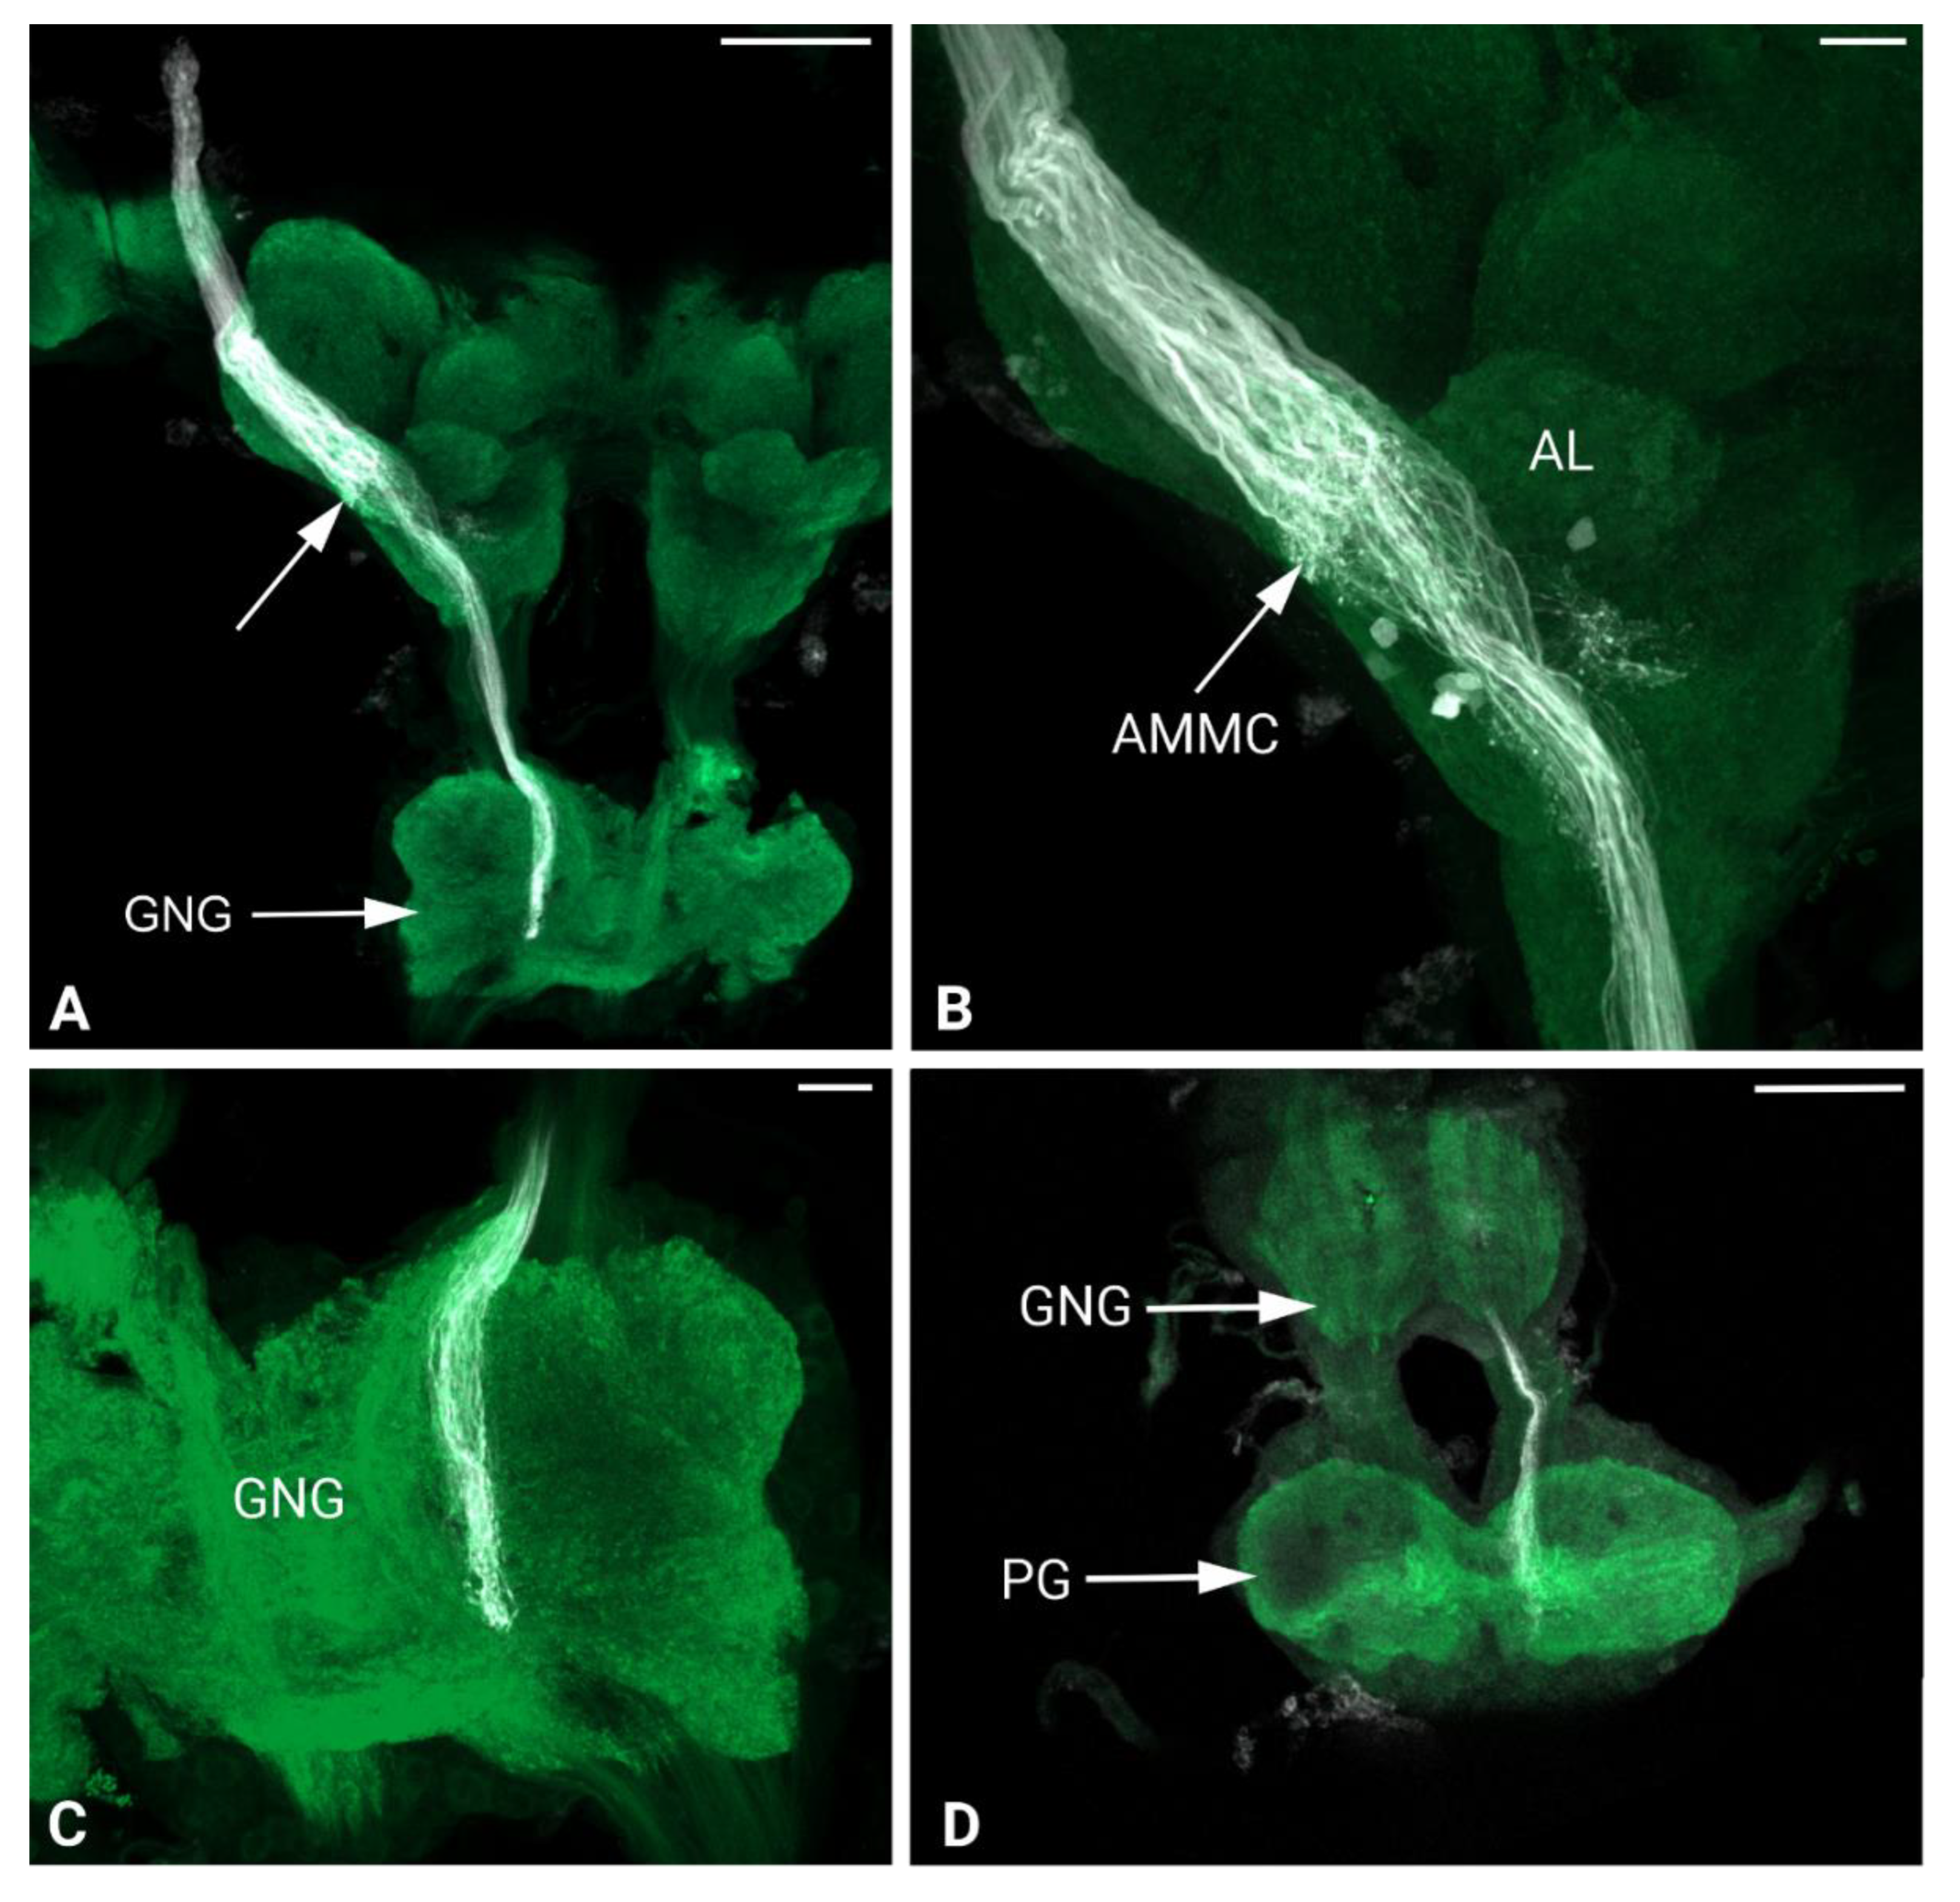
Figure 8.
Maximum intensity projections of the confocal images of Philaenus spumarius brain. A) Overview of antennal nerve projections through the brain. A massive nerve staining is visible at the apical part of the brain, which becomes reduced when arborized at the AMMC level (arrow). Here the nerve project until the gnathal ganglion. B) Johnston’s organ afferents terminating at the AMMC, before continuing downward. C) Johnston’s organ afferents at the gnathal ganglion (GNG) level. D) Johnston’s organ nerve terminating at the prothoracic ganglia (PG). Scale bars: A = 100 μm, B, C = 20 μm, D = 100 μm.
Disclaimer/Publisher’s Note: The statements, opinions and data contained in all publications are solely those of the individual author(s) and contributor(s) and not of MDPI and/or the editor(s). MDPI and/or the editor(s) disclaim responsibility for any injury to people or property resulting from any ideas, methods, instructions or products referred to in the content. |
© 2025 by the authors. Licensee MDPI, Basel, Switzerland. This article is an open access article distributed under the terms and conditions of the Creative Commons Attribution (CC BY) license (http://creativecommons.org/licenses/by/4.0/).
Copyright: This open access article is published under a Creative Commons CC BY 4.0 license, which permit the free download, distribution, and reuse, provided that the author and preprint are cited in any reuse.


