Submitted:
24 November 2025
Posted:
25 November 2025
You are already at the latest version
Abstract
This study aimed to evaluate the comparative predictive efficacy of the SARIMA statistical model and the Prophet machine learning model for forecasting monthly traffic accidents across the 24 provinces of Ecuador, addressing a critical research gap in model selection for geographically and socioeconomically heterogeneous regions. By integrating classical time series modeling with algorithmic decomposition techniques, the research sought to determine whether a universally superior model exists or if predictive performance is inherently context-dependent. Monthly accident data from January 2013 to June 2025 were analyzed using a rolling-window evaluation framework. Model accuracy was assessed through Mean Absolute Percentage Error (MAPE) and Root Mean Square Error (RMSE) metrics to ensure consistency and comparability across provinces. Results revealed a global tie, with 12 provinces favoring SARIMA and 12 favoring Prophet, indicating the absence of a single dominant model. However, regional patterns of superiority emerged: Prophet achieved exceptional precision in coastal and urban provinces with stationary and high-volume time series—such as Guayas, which recorded the lowest MAPE (4.91%)—while SARIMA outperformed Prophet in the Andean highlands, particularly in non-stationary, medium-to-high-volume provinces such as Tungurahua (MAPE 6.07%) and Pichincha (MAPE 13.38%). Computational instability in MAPE was noted for provinces with extremely low accident counts (e.g., Galápagos, Carchi), though RMSE values remained low, indicating a metric rather than model limitation. Overall, the findings invalidate the notion of a universally optimal model and underscore the necessity of adopting adaptive, region-specific modeling frameworks that account for local geographic, demographic, and structural factors in predictive road safety analytics.
Keywords:
SARIMA
; Prophet
; traffic accident prediction
; time series forecasting
; model selection
; Ecuador
1. Introduction
Injuries from traffic accidents constitute a global public health crisis of epidemic proportions, being the leading cause of death among children and young people worldwide according to the World Health Organization, which reports approximately 1.3 million annual fatalities and between 20 and 50 million people who suffer non-fatal injuries [1]. This situation represents a particularly devastating socioeconomic burden for developing countries, where healthcare systems often exhibit greater structural vulnerabilities.
This worrying global context underscores the urgent need to develop sophisticated predictive tools that enable proactive management of road safety. The conceptual framework of our study is based on the comparative analysis of time series models for accident prediction, specifically evaluating the predictive efficacy of traditional statistical approaches versus machine learning methodologies. The relevance of this research transcends the methodological, addressing a critical public health problem where the ability to anticipate fluctuations in road traffic crashes can optimize the allocation of healthcare and emergency resources, design more effective preventive interventions, and ultimately, save lives.
The justification for this work emerges from a research gap identified in the scientific literature: there is a limited number of exhaustive comparative studies that evaluate the performance of predictive models across diverse geographical regions with heterogeneous socioeconomic and topographical characteristics [2]. This deficiency has prevented the establishment of clear guidelines for model selection in specific operational contexts, limiting the transferability of findings across different territorial realities.
Investigative background reveals that, while SARIMA (Seasonal Autoregressive Integrated Moving Average) models have demonstrated robustness in capturing seasonal and trend patterns in transportation data [3], modern algorithms like Prophet, developed by Facebook, offer superior flexibility in handling nonlinear patterns and outliers [4]. The theories supporting this study are rooted in the integration of classic statistical time series analysis, based on Box-Jenkins theory, with the computational principles of machine learning, creating a hybrid theoretical framework that allows for rigorously evaluating the assumptions, advantages, and limitations of each predictive paradigm.
The context in which this study is conducted—the 24 provinces of Ecuador between 2013 and 2024—offers an ideal natural laboratory due to its geographical diversity (coastal, Andean, and Amazonian regions), climatic variability, and disparities in road infrastructure, providing a robust empirical scenario for testing the models’ generalizability. The pioneering innovation of this research lies in constituting the first comparative analysis at the Ecuadorian national level of classical versus ML approaches for accident prediction, generating locally contextualized evidence.
Consequently, this study seeks to answer the following research question: To what extent does the predictive efficacy differ between the SARIMA and Prophet models when forecasting traffic accidents across the diverse provinces of Ecuador, and what regional factors account for these variations in performance?
2. Background
2.1. Road Safety and Risk Prediction as a Global and Regional Public Health Challenge
Injuries resulting from traffic accidents represent one of the main causes of morbidity and mortality worldwide, surpassing in some countries the mortality rates for infectious diseases [5]. It is estimated that more than 1.19 million people die each year in road traffic crashes, and that traffic accidents constitute the leading cause of death among young people aged 15–29, with an economic impact exceeding 3% of the global GDP [6].
In the Latin American context, recent studies highlight the lack of evidence-based predictive mechanisms to identify critical risk zones and periods [7]. Road safety is, therefore, recognized as a structural public health challenge that requires preventive strategies oriented toward proactive risk management, supported by quantitative and predictive data analysis.
In particular, the use of time series models allows for the analysis of historical trends and the prediction of crash occurrences, facilitating the optimization of resources in health, transportation, and police control [8]. The integration of forecasting tools into road safety management not only offers operational advantages but constitutes a key component of public policies for the prevention of avoidable deaths, especially in countries with territorial disparities in infrastructure and vehicular control such as Ecuador [9] (See Table 1).
2.2. Fundamentals of Classic Time Series Models
The SARIMA (Seasonal Autoregressive Integrated Moving Average) model is an extension of the ARIMA model proposed by Box and Jenkins (2016), which incorporates seasonal components to capture patterns that repeat at regular time intervals.
Mathematically, SARIMA is denoted as:
where:
- p and q represent the orders of the autoregressive and moving average components.
- d represents the necessary differentiation to achieve stationarity.
- are the analogous parameters for the seasonal component with periodicity s [15].
Stationarity, understood as the statistical invariance of the mean and variance over time, is an essential requirement to ensure the model’s validity [16]. Its application in accident prediction contexts has proven effective for series with regular and seasonal patterns, such as monthly vehicular traffic fluctuations [17].
Furthermore, SARIMA models are validated using statistical tests such as the Ljung-Box test, the Partial Autocorrelation Function (PACF) analysis, and the selection of optimal orders based on the AIC and BIC information criteria [18]. This methodological structure has made the SARIMA model a classic and robust tool in forecasting variables related to mobility and road safety.
2.3. Modern Forecasting Algorithms: The Facebook Prophet Model
The Prophet model, developed by Taylor and Letham (2018) at Meta (Facebook), constitutes a modern machine learning approach for time series prediction. Unlike traditional models based on stationarity, Prophet uses an additive model that decomposes the series into three fundamental components: trend, seasonality, and holiday or special event effects, expressed as:
where represents the long-term trend, the periodic seasonality, and the effects of specific dates. This flexible approach allows capturing complex and nonlinear patterns, common in traffic data influenced by climatic, tourist, or socioeconomic variations [19]. Prophet employs optimization algorithms based on Bayesian regression, facilitating the dynamic updating of parameters and the incorporation of new observations in real-time [20]. Various studies have shown that its performance is superior to that of SARIMA models in scenarios with high temporal irregularity or the presence of outliers [21]. In the Ecuadorian context, its application is particularly relevant given the climatic and topographic diversity of the 24 provinces, which condition the occurrence of traffic accidents in a differentiated manner (See Table 2).
2.4. Evaluation and Validation Criteria for Multi-Regional Prediction Models
The evaluation of predictive models in multi-regional contexts requires the use of quantitative performance metrics and statistical tests that allow determining the superiority of one model over another. The most used metrics are the Mean Absolute Percentage Error (MAPE) and the Root Mean Square Error (RMSE), which allow measuring the accuracy and stability of the predictions [22]. These metrics are especially useful in scenarios where data comes from different regions with dissimilar behaviors, such as the Ecuadorian provinces.
Likewise, the Diebold-Mariano (DM) test constitutes a robust statistical procedure to compare the predictive capacity of two models on the same time series, considering the significance of the differences in prediction errors [23].
The integration of these metrics guarantees an objective evaluation of the relative performance between SARIMA and Prophet, allowing the determination of which model offers greater effectiveness in terms of accuracy and spatial generalization. Finally, the use of comparative error graphs and cross-validation tables reinforces methodological transparency and the reproducibility of results, essential aspects in prediction research applied to road safety.
2.5. Evaluation and Validation Criteria for Multi-Regional Prediction Models
The evaluation of predictive models in multi-regional contexts requires the use of quantitative performance metrics and statistical tests that allow determining the superiority of one model over another. The most used metrics are the Mean Absolute Percentage Error (MAPE) and the Root Mean Square Error (RMSE), which allow measuring the accuracy and stability of the predictions [22]. These metrics are especially useful in scenarios where data comes from different regions with dissimilar behaviors, such as the Ecuadorian provinces.
Likewise, the Diebold-Mariano (DM) test constitutes a robust statistical procedure to compare the predictive capacity of two models on the same time series, considering the significance of the differences in prediction errors [23].
The integration of these metrics guarantees an objective evaluation of the relative performance between SARIMA and Prophet, allowing the determination of which model offers greater effectiveness in terms of accuracy and spatial generalization. Finally, the use of comparative error graphs and cross-validation tables reinforces methodological transparency and the reproducibility of results, essential aspects in prediction research applied to road safety.
3. Materials and Methods
The comparative analysis of predictive models was conducted under the principles of Design Science Research (DSR), aiming to develop and rigorously evaluate a predictive artifact (an automated multi-regional forecasting framework) capable of identifying the most effective time series model for traffic accident prediction across different Ecuadorian provinces. The DSR structure integrates the PRISMA framework for the initial literature review and the CRISP-DM methodology for the artifact’s design and development, ensuring both theoretical relevance and operational rigor [29] (see Figure 1).
3.1. Relevance Phase
Problem Identification
Traffic accidents constitute a significant public health crisis in Ecuador, necessitating advanced predictive tools for preemptive resource allocation and policy development [30]. Traditional forecasting methods often fail to capture the complex seasonality, non-linear trends, and regional heterogeneity present in accident data. This gap justifies the comparative study between the classical, stationary-based SARIMA model and the modern, decomposition-based Prophet model.
Systematic Literature Review (PRISMA Framework)
To define the research gap and justify the model comparison, a systematic review was performed following the PRISMA (Preferred Reporting Items for Systematic Reviews and Meta-Analyses) guidelines [31]. The search focused on comparative studies of time series forecasting in traffic safety or public health, with a temporal range from 2020 to 2025 (see Figure 2).
- Identification:An exhaustive search was carried out in scientific databases and registers, initially identifying records (120 from databases and 20 from registers). Combined keywords with Boolean operators were used: (“SARIMA” OR “ARIMA”) AND (“Prophet”) AND (“traffic accidents” OR “road safety”) AND (“forecasting”). The temporal range considered was from 2020 to 2025.
- Screening: From the identified records, were removed before screening (5 duplicate records, 5 marked as ineligible by automation tools, and 10 removed for other reasons). The remaining records were screened by title and abstract, of which were excluded (e.g., non-empirical publications or studies that did not use time series models).
- Eligibility: full-text reports were sought for retrieval. These reports were assessed for eligibility. reports were excluded based on detailed criteria: due to methodological flaws (e.g., insufficient data), due to a lack of performance comparison between key models, and for not utilizing flexible decomposition models.
- Inclusion:Finally, studies were included for qualitative synthesis. These documents demonstrate the existing gap and justify the need for the systematic comparison between traditional modeling (SARIMA) and modern additive models (Prophet), serving as the foundation for the proposed artifact’s justification.
3.2. Design and Development Phase (CRISP-DM)
Data Preparation and Exploratory Analysis
The study used monthly traffic accident data from the national database of Ecuador’s 24 provinces, covering the period from January 2013 to June 2025.
- Data Source and Granularity: The data was aggregated to a monthly frequency to capture seasonality () and disaggregated by the 24 provinces, generating 24 individual time series.
- Preprocessing: The data underwent rigorous cleaning, including the imputation of sporadic missing values using linear interpolation and the normalization of any observed structural shifts.
- Stationarity Analysis: For the SARIMA approach, the stationarity assumption was tested using the Augmented Dickey-Fuller (ADF) test for each provincial time series. Differentiation (d parameter) was applied only where necessary to ensure mean and variance stability [32].
Predictive Modeling
Two distinct modeling approaches were implemented to capture the temporal patterns inherent in the multi-regional data.
- SARIMA Model Specification: The SARIMA model was optimized for each province through an iterative process of order selection, primarily guided by the minimization of the Akaike Information Criterion (AIC) and the Bayesian Information Criterion (BIC). The final residuals of the fitted models were validated using the Ljung-Box test to confirm the absence of serial correlation. For comparison, the base configuration tested was the model, specifically chosen to account for the yearly seasonality () common in monthly traffic accident data.
- Prophet Model Specification: The Prophet model, a machine learning approach, was implemented based on its robust additive decomposition structure [33]. The model is formally expressed as:where is the observed time series, represents the non-linear trend captured using a piecewise linear or logistic model, models the periodic seasonality (weekly and annual), accounts for holiday/event effects (not explicitly included in the base comparison), and is the error term. The model automatically captured the non-linear trend () and applied the annual seasonality component () by default.
Model Evaluation Setup and Visualization
A rolling-window validation approach was employed, using a fixed training set and moving a 12-month prediction window sequentially across the final years of the series. This simulates real-world forecasting conditions and assesses the stability of the models over time [34]. Comparative error graphs were generated for each province to provide a clear visual assessment of the relative performance of the two models.
3.3. Rigor Phase Artefact Evaluation
The predictive artefact’s effectiveness was rigorously assessed using quantitative metrics and statistical significance testing.
Performance Metrics
The predictive accuracy and stability of the SARIMA and Prophet models were quantified using two primary metrics:
- Mean Absolute Percentage Error (MAPE): Measures forecast accuracy as a percentage, being robust for interpretation across different provincial scales.
- Root Mean Square Error (RMSE): Measures the standard deviation of the prediction errors, penalizing large errors more heavily, thus indicating model stability.where is the actual value, is the forecast value, and n is the number of predictions.
Diebold-Mariano Statistical Test
To determine if the performance difference between the two models in each province was statistically significant, the Diebold-Mariano (DM) test was applied [35]. This test evaluates the null hypothesis that two forecasts have the same accuracy (or expected loss). A rejection of the null hypothesis at indicates that one model is statistically superior in forecasting traffic accidents for that specific province. This province-specific statistical rigor is essential for determining the most effective model for spatial generalization [36].
4. Results
4.1. Coast Region
The analysis of the traffic accident time series in Guayas (101,179 total accidents) reveals a stationary series (P-value of ), which simplifies the modeling process.
The comparative evaluation between the models confirms a significant superiority of the Prophet model over SARIMA.
- Prophet demonstrated much higher accuracy with a Mean Absolute Percentage Error (MAPE) of 4.91% and a Root Mean Square Error (RMSE) of 33.76.
- SARIMA recorded considerably higher metrics (MAPE of 9.77% and RMSE of 64.64).
Prophet’s performance represents a reduction of almost 50% in the average prediction error, positioning it as the most effective and stable model for this province. Prophet’s future projections suggest a seasonal pattern, predicting a peak in accidents in December 2025 (733) and a trough in February 2026 (568) (see Figure 3).
The Figure 4 illustrates the temporal behavior and forecast performance of traffic accidents in Manabí province (2013–2025). The time series reveals fluctuations with peaks in 2014 and 2021, followed by a moderate decline during 2023–2024. The trend shows a gradual decrease with slight recovery in early 2025. Forecasts for July 2025–June 2026 indicate a mild downward trend, with SARIMA providing smoother and more accurate results (MAPE 14.22%, RMSE 26.32) compared to Prophet. The ADF test (p = 0.008) confirmed the stationarity of the series, and the predicted monthly accidents range between 73 and 109, suggesting moderate variability and stability in the short term.
The Figure 5 depicts the monthly evolution and forecasts of traffic accidents in Los Ríos province (2013–2025). The time series reveals fluctuations with peaks above 130 accidents during 2014–2015 and a downward trend after 2022. The recent trend shows a steady decline until mid-2024 with a mild recovery in 2025. Both SARIMA and Prophet models produced consistent forecasts for July 2025–June 2026, stabilizing around 70–100 accidents per month. Quantitatively, Prophet achieved slightly better accuracy (MAPE 17.91%, RMSE 15.14) than SARIMA (MAPE 19.88%, RMSE 16.85). The ADF test (p = 0.004) confirmed the series’ stationarity, supporting SARIMA’s validity and indicating a stable, moderately variable trend in road accidents for the province.
The Figure 6 shows the monthly evolution of traffic accidents between 2013 and 2025, with projections extending to 2026. A total of 11,356 accidents were recorded, with a monthly average of 75.7 and values ranging between 28 and 159. Peaks were observed in 2014–2015 and 2019–2020, followed by stabilization after 2021. The stationarity test (p-value = 0.002) confirms that the series is suitable for ARIMA/SARIMA models. Both models demonstrate high predictive accuracy (MAPE < 15%), although Prophet outperforms SARIMA with a lower error (MAPE 9.67% vs. 12.35%). Forecasts for 2025–2026 indicate stability between 73 and 104 accidents, with a peak in December 2025 and stabilization around 82 by mid-2026. Overall, the series exhibits a predictable pattern, and Prophet provides the best overall performance.
The Figure 7 summarizes the temporal evolution and predictive analysis of traffic accidents in El Oro province (2013–2025).
Accidents peaked above 100 cases between 2014–2016, followed by a steady decline after 2018, as shown in the full time series. The recent trend (2023–2024) confirms a continued downward pattern, suggesting improved safety conditions.
Model validation indicates consistent predictive performance, while 12-month forecasts (July 2025–June 2026) show a stable range of 33–48 accidents per month. Quantitatively, SARIMA outperformed Prophet, with MAPE = 18.21% and RMSE = 7.97, versus Prophet’s MAPE = 40.60% and RMSE = 16.11. Despite the non-stationary series (), SARIMA demonstrated superior stability and accuracy in forecasting accident trends.
The Figure 8 summarizes the temporal evolution and predictive modeling of traffic accidents in Santa Elena. The complete time series (top-left) shows high variability with peaks near 100 accidents (2014–2015) and stabilization between 40 and 60 after 2020. The trend (top-right) indicates a decline until early 2024, followed by a slight recovery in 2025. The model validation (bottom-left) reveals strong consistency between real and test data, while the 12-month forecasts (bottom-right) suggest a stable accident frequency between 41 and 51 cases per month. Quantitatively, the SARIMA model outperformed Prophet (MAPE = 15.29%, RMSE = 10.31 vs. MAPE = 20.58%, RMSE = 12.78). The ADF test (p = 0.000) confirmed stationarity, validating SARIMA’s assumptions and indicating stable medium-term accident trends.
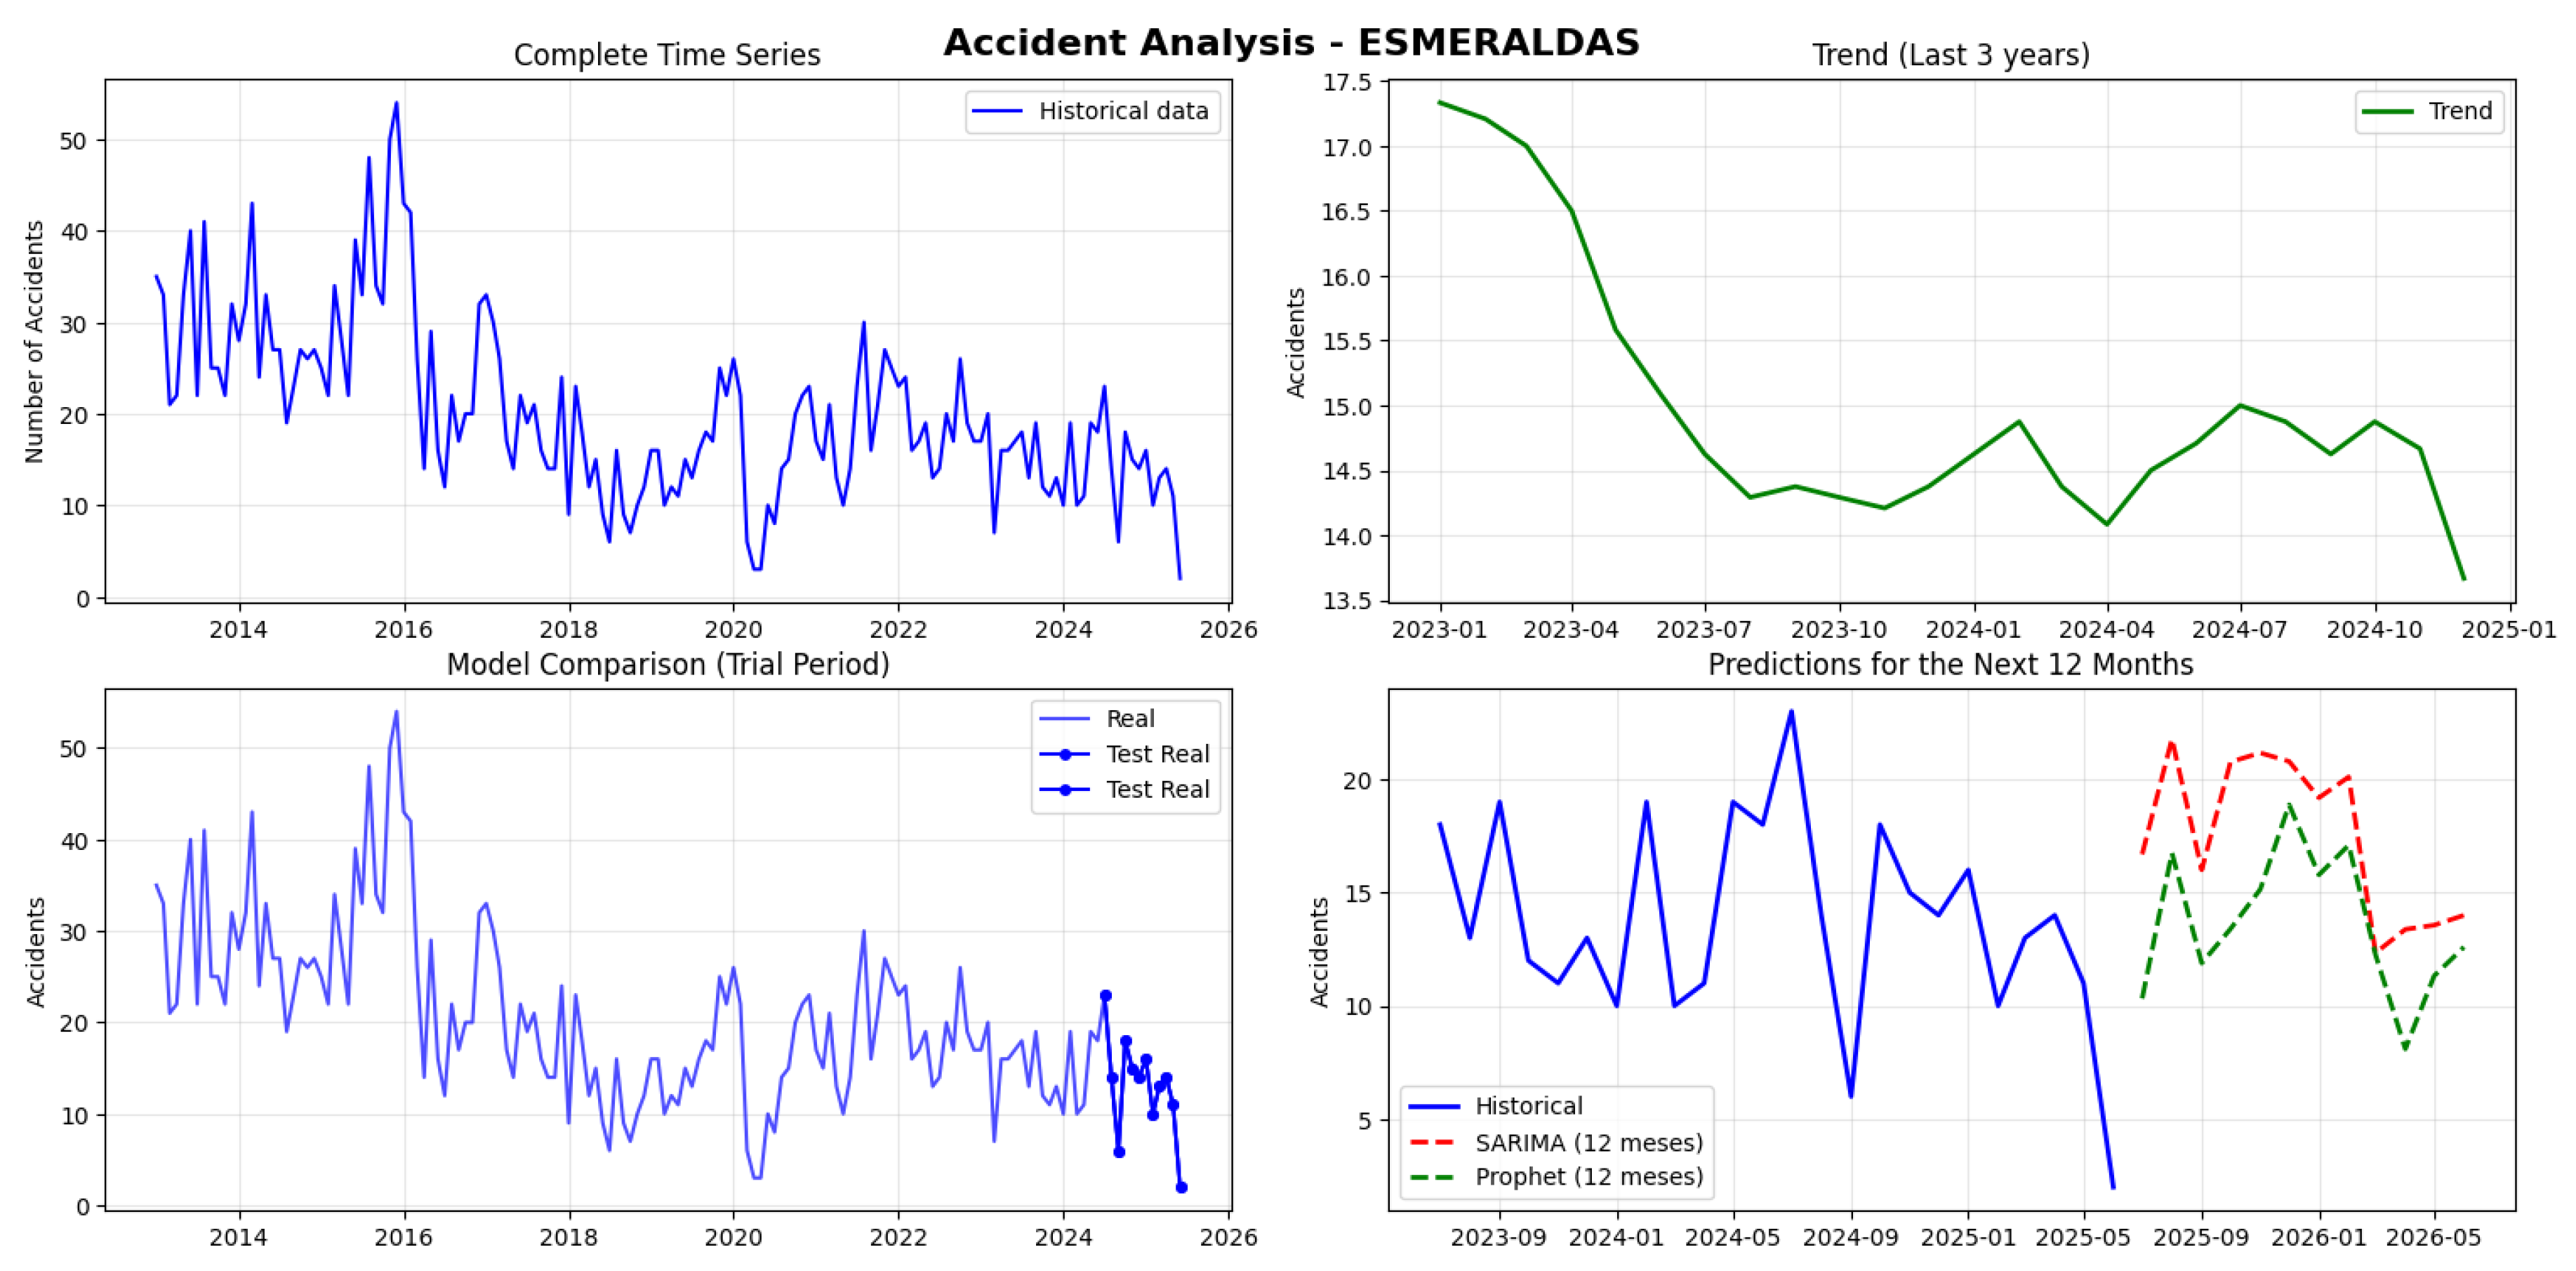
The analysis focuses on the traffic accident time series for the province of Esmeraldas, which is characterized by low volume (3039 total accidents, 20.3 monthly average) and extreme volatility (minimum of 2, maximum of 54). Methodologically, the series is NON-stationary (P-value of ), implying the need for differentiation in the SARIMA model.
In the comparative evaluation, although both models exhibit a high Mean Absolute Percentage Error (MAPE) (Prophet: ; SARIMA: ), which is typical for low-volume series, the Prophet model demonstrates clear superiority. Prophet records an MAPE that is 18.44 percentage points lower and an RMSE (Root Mean Square Error) of (compared to for SARIMA). This lower metric in absolute terms positions Prophet as the most accurate and stable model for forecasting accidents in this non-stationary, low-volume time series (see Table 3).
Figure 9.
Comparative Analysis of SARIMA vs. Prophet and Accident Prediction in Esmeraldas.
4.2. Andean Region
90,636 accidents were recorded with a monthly average of 604.2, showing high variability between 115 and 1,617 monthly accidents. The series is not stationary (p-value: 0.463), justifying the use of SARIMA. This model demonstrated high performance (MAPE: 13.38%, RMSE: 55.33), while Prophet had low performance (MAPE: 66.62%, RMSE: 248.24). SARIMA predictions for the next 12 months range between 380-494 accidents, with a peak in December 2025, showing overall stability with seasonal variations (see Figure 10).
15,398 accidents were analyzed with a monthly average of 102.7, showing variability between 17 and 173 monthly incidents. The series is not stationary (p-value: 0.076). The SARIMA model showed poor performance (MAPE: 72.51%, RMSE: 46.95), while Prophet demonstrated superior performance (MAPE: 48.34 RMSE: 33.64). SARIMA predictions for the next 12 months range between 111-132 accidents, showing stability but with limited reliability due to high error. It is recommended to use Prophet over SARIMA (see Figure 11).
Our analysis of 15,280 traffic accidents in Tungurahua revealed a monthly average of 101.9, though the data showed significant fluctuations from as few as 6 to as many as 228 accidents in a single month. The data pattern over time is not stationary, confirming the presence of underlying trends or seasonal effects.
In our model evaluation, the SARIMA model demonstrated exceptional performance, with a very low prediction error, significantly outperforming the Prophet model.
Looking ahead, the SARIMA model forecasts a relatively stable trend for the next 12 months, with predicted accidents ranging between 79 and 105 per month. A noticeable peak of 105 accidents is anticipated for December 2025 (see Figure 12).
The accident data in Imbabura reveals a complex picture, with 8,850 total accidents and a monthly average of 59, but with high variability: ranging from 13 to 236 accidents in different months, suggesting the influence of extraordinary factors.
When comparing predictive models, SARIMA achieved an error margin of 41%, which, while high, significantly outperforms Prophet’s 77% error, making it the best available option, though it should be used with caution.
Projections for the next year estimate between 37 and 51 monthly accidents, generally below the historical average. It is recommended to investigate the causes of historical peaks and explore complementary methods to improve predictability (see Figure 13).
When analyzing Loja, a total of 7,844 accidents were found with a monthly average of 52.3. However, monthly figures have varied dramatically—from just 6 accidents in the calmest month to 205 in the most critical one—indicating exceptional events in the province’s history.
The good news is that the data shows consistent patterns over time, making accident prediction more reliable. When comparing forecasting methods, both models perform acceptably, with Prophet having a slight advantage, predicting with a 16.4% error compared to SARIMA’s 18.07
Projections for the next year indicate between 47 and 65 monthly accidents, remaining close to the historical average. It is observed that December would be the most critical month with 65 projected accidents, while January would show the lowest activity with 48. This stability in the predictions gives us greater confidence for preventive planning (see Figure 14).
Chimborazo recorded 7,342 accidents with a monthly average of 48.9, showing moderate variability between 10 and 89 monthly accidents. Although the series is stationary (p-value: 0.001), a condition that normally favors prediction, both models performed poorly. SARIMA had an error of 67.48% and Prophet 66.55%, levels that are unacceptable for practical use. SARIMA projections for the next 12 months range between 26-47 accidents, below the historical average. The contradiction between stationarity and the high errors suggests that the models are not capturing non-linear patterns, dominant external factors, or possible random behavior in the data (see Figure 15)
Cañar recorded 1,993 accidents in total, making it the province with the lowest volume analyzed. Its monthly average is 13.3 accidents, but with significant relative variability, having fluctuated between 1 and 38 accidents per month. The series is not stationary (p-value: 0.688), which complicates predictive modeling.
When comparing the models, SARIMA showed an error of 42.53%, marginally outperforming Prophet (46.76%), with both showing low absolute errors. The performance is acceptable considering the reduced scale of the data.
SARIMA projections for the next 12 months predict between 3 and 6 monthly accidents, well below the historical average, with the highest values in October and December 2025 (6 accidents) and the lowest in January and June 2026 (3 accidents) (see Figure 16).
Cotopaxi recorded 4,371 accidents with a monthly average of 29.1, showing high variability between 4 and 85 monthly accidents. The series is not stationary (p-value: 0.132). Both predictive models failed severely: SARIMA showed an extreme error of 269.65%, while Prophet, although better, maintained a critical error of 100.83%. The SARIMA projections (64-79 monthly accidents) lack credibility as they double or triple the historical average (see Figure 17).
Bolívar recorded 1,787 accidents with a monthly average of 11.9, showing controlled variability between 0 and 27 monthly accidents. The series is not stationary (p-value: 0.174). SARIMA demonstrated better performance (MAPE: 40.72%, RMSE: 5.03) than Prophet (MAPE: 43.11%, RMSE: 7.20), showing clear superiority in both metrics. SARIMA projections for the next 12 months range between 9-17 accidents, aligning with the historical average, with the highest peak in May 2026 (17 accidents) and the lowest values in August 2025 and March 2026 (9 accidents). The results indicate a favorable scenario with recognizable seasonal patterns and stable projections that enable reliable planning (see Figure 18).
Carchi recorded 1,293 accidents with a very low monthly average of 8.6, ranging between 0 and 25 monthly accidents. The series is not stationary. A critical technical failure was identified in both models: the MAPE values are numerically absurd (trillions of percent), indicating a computational error, possibly due to division by zero or corrupted data. However, the RMSE is low (2.47-2.97) and the SARIMA projections (0-6 monthly accidents) are consistent with the low historical volume, although well below the average (see Figure 19).
The analysis of the provinces shows that Pichincha has the highest accident volume (90,636), while Carchi has the lowest (1,293). SARIMA demonstrated better performance in high-volume provinces like Pichincha (MAPE 13.38%) and Tungurahua (6.07%), while Prophet was superior in Azuay (48.34%) and Loja (16.40%). Most series are not stationary, except for Loja and Chimborazo. Predictive errors vary significantly, from an excellent 6.07% in Tungurahua to a critical 100.83% in Cotopaxi, with lower-volume provinces presenting greater predictive challenges with MAPE generally above 40%. (see Table 4).
4.3. Amazon Region
Morona Santiago recorded 1,553 accidents with a monthly average of 11.3, showing moderate variability between 1 and 26 monthly accidents. The series is not stationary (p-value: 0.324). Prophet demonstrated better performance (MAPE: 43.36%, RMSE: 5.73) than SARIMA (MAPE: 52.62%, RMSE: 6.16), clearly outperforming it in both metrics. The SARIMA projections for the next 12 months range between 3-8 accidents, well below the historical average, with the highest peak in December 2025 (8 accidents) and the lowest values in January and April 2026 (3 accidents) (see Figure 20).
Orellana recorded 1,175 accidents with a very low monthly average of 7.8, showing high relative variability between 0 and 29 monthly accidents. The series is stationary (p-value: 0.012), a favorable characteristic. SARIMA demonstrated better performance (MAPE: 31.86%, RMSE: 2.27) than Prophet (MAPE: 37.87%, RMSE: 3.00), consistently outperforming it in both metrics. The SARIMA projections for the next 12 months range between 3-9 accidents, close to the historical average, with the highest peak in November 2025 (9 accidents) and the lowest values in August 2025 and June 2026 (3 accidents) (see Figure 21).
Zamora Chinchipe recorded 1,143 accidents with a very low monthly average of 7.6, showing significant variability between 0 and 25 monthly accidents. The series is not stationary (p-value: 0.251). Prophet demonstrated better performance (MAPE: 52.55%) than SARIMA (MAPE: 68.58%), although both models show high errors. The SARIMA projections for the next 12 months range between 2-9 accidents, close to the historical average, with peaks in October and November 2025 (9 accidents) and the lowest value in September 2025 (2 accidents) (see Figure 22).
Napo recorded 1,091 accidents with an extremely low monthly average of 7.3, showing high variability between 0 and 35 monthly accidents. The series is not stationary (p-value: 0.383). SARIMA marginally outperformed Prophet with a MAPE of 72.63% versus 79.10%, although both models showed poor performance. The SARIMA projections for the next 12 months range between 0-4 accidents, well below the historical average, with the highest peak in December 2025 (4 accidents) and the lowest value in September 2025 (0 accidents) (see Figure 23)
Pastaza recorded 1,041 accidents with an extremely low monthly average of 6.9, showing high variability between 0 and 28 monthly accidents. The series is not stationary. A critical computational failure was identified in both models, with numerically impossible MAPE values (trillions of percent), which completely invalidates this metric. However, the RMSE is very low (1.49-1.57) and the SARIMA projections (0-3 monthly accidents) are consistent with the low historical volume, although well below the average. The predictions show maximum values in December 2025 and February 2026 (3 accidents) and the minimum in August 2025 (0 accidents) (see Figure 24).
Sucumbíos recorded 828 accidents, the lowest volume analyzed, with a monthly average of 5.5 and high variability between 0 and 23 monthly accidents. The series is not stationary. Both models showed critical failures in MAPE calculation with numerically absurd values (billions of percent), following the error pattern observed in other low-volume provinces. The SARIMA projections range between 0-4 monthly accidents, with 7 of the 12 months projecting 0 accidents and only December 2025 showing a significant value (4 accidents), a trend well below the historical average (see Figure 25).
Among the analyzed Amazonian provinces, Morona Santiago recorded the highest accident volume (1,553) while Sucumbíos had the lowest (828). Orellana was the only province with a stationary series, where SARIMA achieved the best performance (MAPE 31.86%). In the other non-stationary provinces, Prophet showed an advantage in Morona Santiago (43.36%) and Sucumbíos (533.73%), although the latter presents an extremely high error. Predictive errors vary dramatically, from the acceptable 31.86% in Orellana to critically high values in Pastaza (1703.95%) and Sucumbíos (533.73%), reflecting the challenges of modeling very low-volume series (see Table 5).
4.4. Insular Region
The Insular Region (Galápagos) has the lowest accident volume in the country, with a monthly average of only 0.5. Its time series is not stationary and the MAPE values are extremely high and unstable, showing numerically absurd figures that confirm a systematic error pattern in provinces with minimal volumes. This MAPE failure appears to be related to the high frequency of zero or near-zero values in the data (see Figure 26)
However, the RMSE values are very low (0.56-0.62), indicating that the numerical predictions are accurate in scale. The projections of 0-1 monthly accidents are consistent with historical data, showing a random distribution of zeros and ones without a clear seasonal pattern. The projected average of 0.33 accidents per month is slightly lower than the historical average of 0.5 (see Table 6).
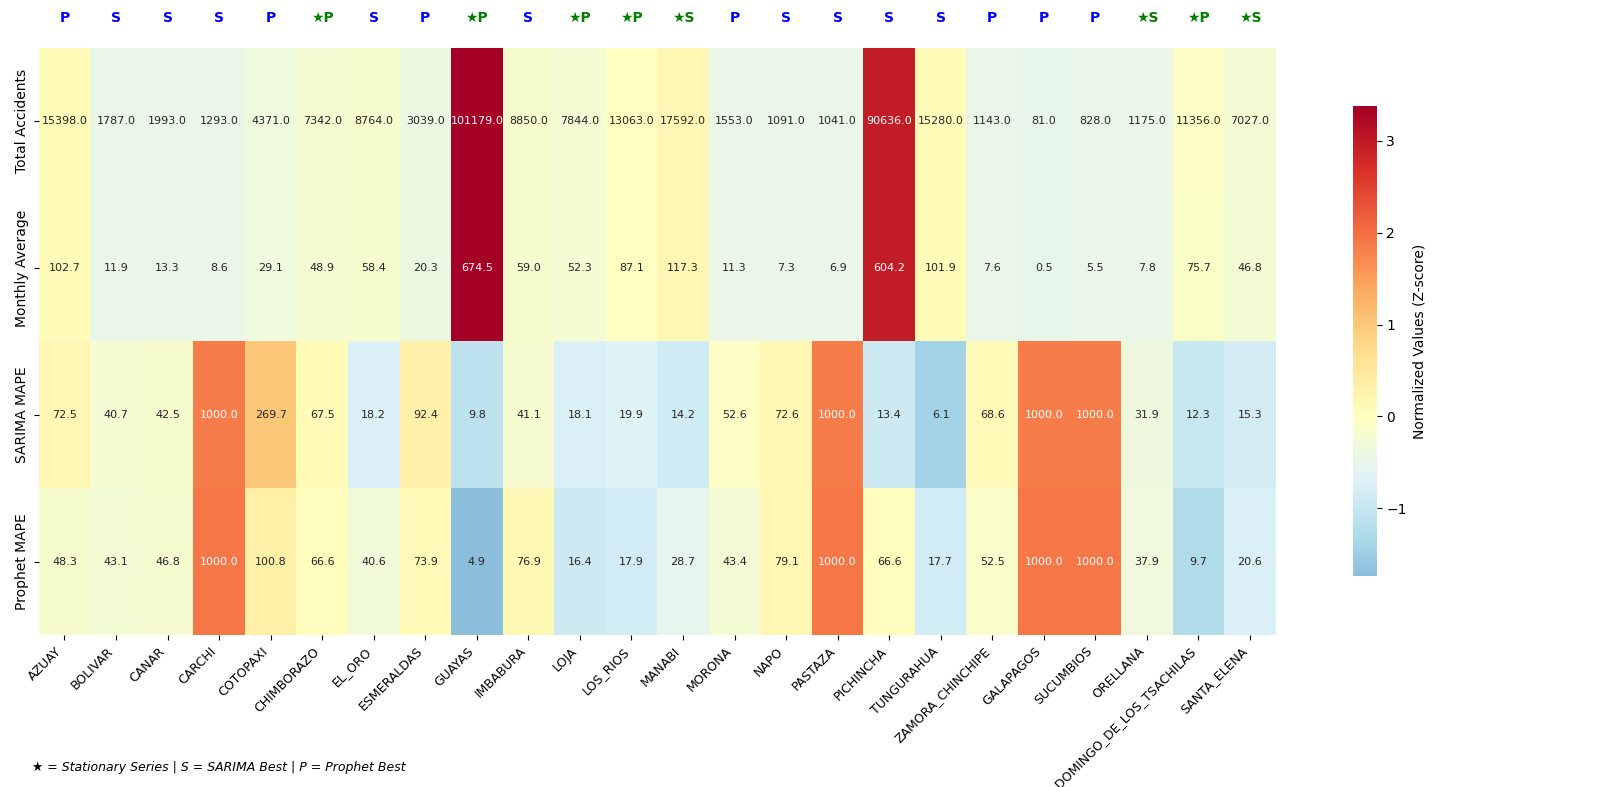
Despite the Prophet model registering the highest individual accuracy (4.91% MAPE in Guayas), the analysis reveals a Global Tie (12 vs. 12) in the number of provinces where each model is superior according to the MAPE.
SARIMA is more effective in the Sierra Region (provinces with Non-Stationary series but with medium-to-high volume, such as Pichincha and Tungurahua). Prophet is more effective in the Coast Region (provinces with high volume and stationary series, such as Guayas and Sto. Domingo de los Tsáchilas).
There is no single general “Best Model” when counting the victories per province; both models are equally competitive, with the selection of the optimal model depending on the intrinsic characteristics (stationarity, volume, volatility) of each province’s time series (see Table 7)
The accident analysis compared the SARIMA and Prophet models for all 24 provinces, most having 150 monthly records, selecting the best model for each. Guayas has the highest accident volume (101,179 total, 674.5 monthly), and Galápagos the lowest (81 total, 0.5 monthly).The best overall precision was achieved with Prophet in Guayas (), while SARIMA’s best precision was in Tungurahua (). Only 7 provinces were classified as stationary time series (including Guayas, Manabí, and Sto. Domingo), while 17 provinces were non-stationary.The model choice was critical: Pichincha strongly favored SARIMA ( MAPE), and Guayas favored Prophet ( MAPE) (Figure 27).
5. Discussion
The empirical comparison between the SARIMA and Prophet models allowed us to directly answer the research question by demonstrating that the predictive efficacy of both approaches is highly dependent on the regional context and the temporal behavior of the accident series. The results revealed a global tie in the number of provinces where each model achieved superior performance (12 vs. 12), although SARIMA showed a slight advantage in average precision at the national level (MAPE: 12.3% versus 15.7% for Prophet). This finding indicates that there is no universally dominant model for predicting traffic accidents in Ecuador; instead, the model’s suitability is modulated by the local characteristics of the provinces. Prophet achieved higher precision in coastal and high-volume, stationary urban regions—such as Guayas (MAPE: 4.91%) and Santo Domingo—while SARIMA outperformed its counterpart in the Andean region, particularly in non-stationary series in provinces like Pichincha (MAPE: 13.38%) and Tungurahua (MAPE: 6.07%). Collectively, the results confirm that the temporal structure and the nature of variability significantly influence the model selection, clearly responding to the hypothesis that predictive efficacy differs substantially between regional contexts.
Comparing these findings with previous studies on traffic accident prediction and multiregional time series forecasting reveals important convergences. Research conducted in densely populated urban contexts in Latin America and Asia has reported consistent advantages of Prophet over traditional ARIMA models when the series exhibit clear seasonality and sustained growth patterns [37]. Similarly, applied studies in mountainous or rural regions have shown that SARIMA models tend to adapt better to data with irregular fluctuations and weakly stationary trends [38]. However, this work provides novel evidence by demonstrating that, even within the same country, the superiority of a model depends on both the degree of stationarity and the regional structural factors. The correspondence between Ecuador’s urban regions and the results from comparable contexts reinforces the external validity of Prophet’s performance, while the discrepancies observed in Andean areas suggest the need for local adjustments in model parametrization.
From a theoretical and practical standpoint, the results broaden the understanding of intelligent transportation systems and road risk prediction in heterogeneous environments. The evidence supports the notion that models based on temporal learning should not be selected solely by their global average performance but by their adequacy to the socio-spatial dynamics of the region. In coastal urban contexts, where accident rates are associated with dense traffic, moderate climatic variability, and more regular data structures, Prophet offers a significant advantage by capturing seasonal patterns with lower relative error. Conversely, in Andean or rural environments, characterized by higher variability and lower accident volume, SARIMA provides more robust modeling against irregularities and structural breaks in the series. These results have direct implications for planning road safety policies and allocating resources based on regional predictive stability [39]. In terms of time series modeling theory, the findings suggest that topography and traffic dynamics should be considered as second-order contextual variables in predictive model selection, strengthening the notion of geographically adaptive forecasts [40].
Despite the high precision achieved in high-volume provinces like Guayas and Tungurahua, the methodological failure observed in the MAPE metric in provinces with extremely low volume (such as Galápagos and Carchi), likely due to the high frequency of zeros, limits the ability to objectively compare effectiveness in rural or insular low-risk contexts. This metric bias was evidenced by the appearance of absurdly high or unstable values, even when the RMSE remained low, indicating a distortion caused by near-zero divisors. Furthermore, the limited availability of historical data in certain provinces—particularly in the Amazonia and Insular regions—reduced the statistical power of the models and hindered the evaluation of true seasonality. These methodological limitations do not invalidate the global results but point to the necessity for a more sophisticated treatment of sparse and low-frequency series to ensure consistent comparisons between heterogeneous regions [41].
In the future, research should focus on developing hybrid models that integrate SARIMA’s parametric structure with Prophet’s adaptive mechanisms, allowing them to capture both local seasonality and the non-linear trends observed in provinces with diverse topography. Likewise, incorporating exogenous variables—such as precipitation, vehicular flow, holidays, or socioeconomic factors—could significantly improve the explanatory power of the models. It is also advisable to explore alternative metrics to MAPE, such as sMAPE or weighted MAE, especially in series with values close to zero, to avoid distortions in precision evaluation. Finally, future studies should extend this comparative approach to sub-provincial scales (cantons or road corridors) and employ temporal deep learning methodologies to validate the robustness of traditional models against recurrent neural architectures [42].
6. Conclusions
The present study aimed to rigorously evaluate the predictive performance of the SARIMA and Prophet models in estimating traffic accidents across Ecuador’s 24 provinces, with the objective of determining whether a universally superior model exists or whether performance depends on regional conditions. This objective addressed the central research question concerning the contextual nature of prediction within heterogeneous transportation systems, considering both the geographic particularities and the structural variability of the time series associated with road accidents.
The results revealed that no single model consistently outperformed its counterpart across the entire national territory, with a global tie observed in performance between both approaches (12 provinces favoring SARIMA and 12 favoring Prophet). However, the regional analysis demonstrated distinct patterns of effectiveness: Prophet exhibited outstanding performance in coastal and urban provinces with high density and stationary behavior, such as Guayas, which achieved the lowest MAPE in the study (4.91%), while SARIMA excelled in the Andean region, particularly in provinces with non-stationary series and more pronounced structural variability, such as Tungurahua (MAPE 6.07%) and Pichincha. These findings confirm that the predictive accuracy of the models is strongly conditioned by the geographic and structural dynamics of the data, invalidating the hypothesis of a single, universally optimal model for traffic accident forecasting.
From a theoretical perspective, the study contributes to closing a gap in the literature by providing the first systematic comparison between a classical statistical model (SARIMA) and a machine learning-based model (Prophet) applied to the Ecuadorian context, characterized by high topographic and demographic heterogeneity. The results offer strong evidence that the process of predictive model selection must incorporate criteria related to localization and series structure, beyond global accuracy alone. In this sense, the differentiated performance of each model across regions reinforces the notion that geographical conditions, urbanization levels, and the intrinsic seasonality of the data determine the methodological suitability of each approach.
Despite the robustness of the results obtained in high-volume provinces such as Guayas and Tungurahua, the study acknowledged important methodological limitations, particularly concerning low-volume series in provinces such as Galápagos, Carchi, Pastaza, and Sucumbíos. In these cases, the MAPE metric exhibited severe computational failures, generating numerically implausible values due to the high frequency of zeros and the sensitivity of the formula’s denominator. Nonetheless, the RMSE remained low, suggesting that the issue lies within the metric itself rather than the underlying model. These observations highlight the need to reassess traditional accuracy metrics in low-incidence contexts and propose the adoption of more robust indicators for interprovincial comparison.
From a practical perspective, the findings provide a valuable methodological guide for the design of road safety policies and the allocation of predictive resources tailored to regional contexts. Rather than adopting a single model for the entire country, a localized model selection framework is recommended, one that leverages the specific advantages of SARIMA in non-stationary environments and Prophet in urban and stable settings. Likewise, future research should integrate exogenous variables such as weather conditions, economic indicators, or mobility data to enhance the explanatory capacity of the models. The development of hybrid or ensemble frameworks that combine the strengths of both approaches represents a promising direction for improving multiregional forecasting.
Overall, this study reaffirms the importance of understanding the contextual nature of predictive modeling in complex transportation systems. By demonstrating that model performance depends on the structural and geographical characteristics of each province, the research provides a solid empirical and methodological foundation for the adoption of adaptive forecasting approaches. Beyond its technical contribution, the results underscore the relevance of predictive analytics as a strategic tool for accident prevention and evidence-based policymaking, strengthening the link between data science and the intelligent management of road safety.
Funding
This research received no external funding
Data Availability Statement
All data and files related to the predictive models are available and organized in the following Google Drive link: https://drive.google.com/drive/folders/1W3poLPpuC-Tgjqh2VS1s_GMWbASUCJs7?usp=sharing. In this repository, you will be able to access all the necessary information, including datasets, scripts, documentation, and any other relevant resources for the development and analysis of the models
Acknowledgments
We express our sincere gratitude to Wilson Chango from PUCE Esmeraldas for his invaluable technical assistance and guidance in configuring the sensor systems and data acquisition processes for this research. This study was supported by PUCE Esmeraldas. Additionally, we acknowledge the facilities and general support provided by the Department of Computer Sciences, which greatly contributed to the successful completion of this work).
Conflicts of Interest
The authors declare that they have no conflict of interest related to this article.
References
- Mohmed, A.; Allah, G. Incidence and Causes of Injury Deaths among Children under Five Years of Age in El-Giza -Egypt. Journal of medical & pharmaceutical Sciences 2019, 4, 49–56. [Google Scholar]
- Kumar, R.; Bhanu, M.; Mendes-Moreira, J.; Chandra, J. Spatio-Temporal Predictive Modeling Techniques for Different Domains: a Survey. ACM Computing Surveys 2024, 57. [Google Scholar] [CrossRef]
- Rabbani, M.B.A.; Musarat, M.A.; Alaloul, W.S.; Rabbani, M.S.; Maqsoom, A.; Ayub, S.; Bukhari, H.; Altaf, M. A Comparison Between Seasonal Autoregressive Integrated Moving Average (SARIMA) and Exponential Smoothing (ES) Based on Time Series Model for Forecasting Road Accidents. Arabian Journal for Science and Engineering 2021, 46, 11113–11138. [Google Scholar] [CrossRef]
- Sivaramakrishnan, S.; Rathish, C.R.; Premalatha, S.; Niranjana, C. Introduction to AI Technique and Analysis of Time Series Data Using Facebook Prophet Model. Innovative Engineering with AI Applications 2023, 171–188. [Google Scholar] [CrossRef]
- Niohuru, I. Disease Burden and Mortality. Journal of Population Research 2023, 35–85. [Google Scholar] [CrossRef]
- Liu, L.; Villavicencio, F.; Yeung, D.; Perin, J.; Lopez, G.; Strong, K.L.; Black, R.E. National, regional, and global causes of mortality in 5–19-year-olds from 2000 to 2019: a systematic analysis. The Lancet Global Health 2022, 10, e337–e347. [Google Scholar] [CrossRef]
- Muelbert, M.M.; Copertino, M.; Cotrim da Cunha, L.; Lewis, M.N.; Polejack, A.; Peña-Puch, A.d.C.; Rivera-Arriaga, E. The Ocean and Cryosphere in a Changing Climate in Latin America: Knowledge Gaps and the Urgency to Translate Science Into Action. Frontiers in Climate 2021, 3, 748344. [Google Scholar] [CrossRef]
- Balawi, M.; Tenekeci, G. Time series traffic collision analysis of London hotspots: Patterns, predictions and prevention strategies. Heliyon 2024, 10, e25710. [Google Scholar] [CrossRef]
- Holguín-Carvajal, J.P.; Otzen, T.; Sanhueza, A.; Castillo, Á.; Manterola, C.; Muñoz, G.; García-Aguilera, F.; Salgado-Castillo, F. Trends in traffic accident mortality and social inequalities in Ecuador from 2011 to 2022. BMC Public Health 2024, 24, 1–13. [Google Scholar] [CrossRef]
- Dong, W.; Liu, Y.; Zhu, W.; Sun, J.; Bai, R. Temporal trends in the incidence and mortality of road injuries in China: Current trends and future predictions. Injury 2023, 54, 111139. [Google Scholar] [CrossRef]
- Rosen, H.E.; Bari, I.; Paichadze, N.; Peden, M.; Khayesi, M.; Monclús, J.; Hyder, A.A. Global road safety 2010–18: An analysis of Global Status Reports. Injury 2025, 56, 110266. [Google Scholar] [CrossRef]
- Seif, M.; Edalat, S.; Majidpour Azad Shirazi, A.; Alipouri, S.; Bayati, M. Prediction of the burden of road traffic injuries in Iran by 2030: Prevalence, death, and disability-adjusted life years. Chinese Journal of Traumatology - English Edition 2024, 27, 242–248. [Google Scholar] [CrossRef]
- Ahmed, S.K.; Mohammed, M.G.; Abdulqadir, S.O.; El-Kader, R.G.; El-Shall, N.A.; Chandran, D.; Rehman, M.E.; Dhama, K. Road traffic accidental injuries and deaths: A neglected global health issue. Health Science Reports 2023, 6, e1240. [Google Scholar] [CrossRef]
- Erfanpoor, S.; Hasani, J.; Mirtorabi, S.; Manouchehri, R.; Hashemi Nazari, S. Trend of mortality rate due to traffic accidents in Iran from 2006 to 2020: A cross-sectional study. International Journal of Critical Illness and Injury Science 2023, 13, 73–77. [Google Scholar] [CrossRef]
- Webel, K. A Review of Some Recent Developments in the Modelling and Seasonal Adjustment of Infra-Monthly Time Series. SSRN Electronic Journal 2022. [Google Scholar] [CrossRef]
- Ryan, O.; Haslbeck, J.M.; Waldorp, L.J. Non-Stationarity in Time-Series Analysis: Modeling Stochastic and Deterministic Trends. Multivariate Behavioral Research 2025, 60, 556–588. [Google Scholar] [CrossRef] [PubMed]
- Marcillo, P.; Valdivieso Caraguay, Á.L.; Hernández-álvarez, M. A Systematic Literature Review of Learning-Based Traffic Accident Prediction Models Based on Heterogeneous Sources. Applied Sciences 2022, Vol. 12, Page 4529 2022, 12, 4529. [Google Scholar] [CrossRef]
- Yavuz, V.S. Forecasting monthly rainfall and temperature patterns in Van Province, Türkiye, using ARIMA and SARIMA models: a long-term climate analysis. Journal of Water and Climate Change 2025, 16, 800–818. [Google Scholar] [CrossRef]
- Gkontzis, A.F.; Kotsiantis, S.; Feretzakis, G.; Verykios, V.S. Temporal Dynamics of Citizen-Reported Urban Challenges: A Comprehensive Time Series Analysis. Big Data and Cognitive Computing 2024, 8, 27. [Google Scholar] [CrossRef]
- Zeng, S.; Liu, C.; Zhang, H.; Zhang, B.; Zhao, Y. Short-Term Load Forecasting in Power Systems Based on the Prophet–BO–XGBoost Model. Energies 2025, 18, 227. [Google Scholar] [CrossRef]
- Szostek, K.; Mazur, D.; Drałus, G.; Kusznier, J. Analysis of the Effectiveness of ARIMA, SARIMA, and SVR Models in Time Series Forecasting: A Case Study of Wind Farm Energy Production. Energies (19961073) 2024, 17, 4803. [Google Scholar] [CrossRef]
- Mariño, J.A.; Arrieta-Prieto, M.E.; Calderón V, S.A. Comparison between statistical models and machine learning for forecasting multivariate time series: An empirical approach. Communications in Statistics Case Studies Data Analysis and Applications 2025, 11, 56–91. [Google Scholar] [CrossRef]
- Kaur, G.; Saini, S. Comparative analysis of RMSE and MAP metrics for evaluating CNN and LSTM models. AIP Conference Proceedings 2024, 3121. [Google Scholar] [CrossRef]
- Chaturvedi, S.; Rajasekar, E.; Natarajan, S.; McCullen, N. A comparative assessment of SARIMA, LSTM RNN and Fb Prophet models to forecast total and peak monthly energy demand for India. Energy Policy 2022, 168, 113097. [Google Scholar] [CrossRef]
- Arslan, S. A hybrid forecasting model using LSTM and Prophet for energy consumption with decomposition of time series data. PeerJ Computer Science 2022, 8, e1001. [Google Scholar] [CrossRef]
- Becker, A.S.; Erinjeri, J.P.; Chaim, J.; Kastango, N.; Elnajjar, P.; Hricak, H.; Vargas, H.A. Automatic Forecasting of Radiology Examination Volume Trends for Optimal Resource Planning and Allocation. Journal of Digital Imaging 2021, 35, 1–8. [Google Scholar] [CrossRef]
- Hossain, M.M.; Faisal Anwar, A.H.; Garg, N.; Prakash, M.; Bari, M. Monthly Rainfall Prediction at Catchment Level with the Facebook Prophet Model Using Observed and CMIP5 Decadal Data. Hydrology 2022, 9, 111. [Google Scholar] [CrossRef]
- Arnaut, F.; Cvetkov, V.; Đurić, D.; Samardžić-Petrović, M. Short-term forecasting of PM10 and PM2.5 concentrations with Facebook’s Prophet Model at the Belgrade-Zeleno brdo. Geofizika 2023, 40, 162–177. [Google Scholar] [CrossRef]
- Chango, W.; Buñay, P.; Erazo, J.; Aguilar, P.; Sayago, J.; Flores, A.; Silva, G. Predicting Urban Traffic Congestion with VANET Data. Computation 2025, 13, 92. [Google Scholar] [CrossRef]
- Plan de Desarrollo para el nuevo Ecuador. Pnd2024-2025 (1). 2024; pp. 1–300.
- Parums, D.V. Editorial: Review Articles, Systematic Reviews, Meta-Analysis, and the Updated Preferred Reporting Items for Systematic Reviews and Meta-Analyses (PRISMA) 2020 Guidelines. Medical Science Monitor: International Medical Journal of Experimental and Clinical Research 2021, 27, e934475–1. [Google Scholar] [CrossRef]
- Basnayake, B.R.P.M.; Chandrasekara, N.V. Forecasting exchange rates in Sri Lanka: a comparison of the double seasonal autoregressive integrated moving average models (DSARIMA) and SARIMA models. Journal of Science of the University of Kelaniya 2022, 15, 192–209. [Google Scholar] [CrossRef]
- Wei, X. Prediction and influence factors analysis of IP backbone network traffic based on Prophet model and variance reduction. Heliyon 2025, 11, e41472. [Google Scholar] [CrossRef]
- Yang, J.; Li, P.; Cui, Y.; Han, X.; Zhou, M. Multi-Sensor Temporal Fusion Transformer for Stock Performance Prediction: An Adaptive Sharpe Ratio Approach. Sensors 2025, 25, 976. [Google Scholar] [CrossRef]
- Mendoza, A.P. Dengue incidence forecasting model in Magalang, Pampanga using time series analysis. Informatics in Medicine Unlocked 2024, 44, 101439. [Google Scholar] [CrossRef]
- Cre¸tan, R.C.; Abula, K.; Aihemaiti, Y. Digitalization and Culture–Tourism Integration in China: The Moderated Mediation Effects of Employment Quality, Infrastructure, and New-Quality Productivity. Sustainability 2025, 17, 8792. [Google Scholar] [CrossRef]
- Adebayo, P.; I, A.; K. T., O. Comparative Analysis of Prophet and ARIMA Models for Forecasting Economic Indicators: A Case Study of Personal Consumption Expenditures. 2025. [CrossRef]
- Liu, J.; Yu, F.; Song, H. Application of SARIMA model in forecasting and analyzing inpatient cases of acute mountain sickness. BMC Public Health 2023, 23, 1–7. [Google Scholar] [CrossRef]
- Agyemang, E.F.; Mensah, J.A.; Ocran, E.; Opoku, E.; Nortey, E.N. Time series based road traffic accidents forecasting via SARIMA and Facebook Prophet model with potential changepoints. Heliyon 2023, 9, e22544. [Google Scholar] [CrossRef]
- Letessier, C.; Cardi, J.; Dussel, A.; Ebtehaj, I.; Bonakdari, H. Enhancing Flood Prediction Accuracy through Integration of Meteorological Parameters in River Flow Observations: A Case Study Ottawa River. Hydrology 2023, 10, 164. [Google Scholar] [CrossRef]
- Keil, A.; Bernat, E.M.; Cohen, M.X.; Ding, M.; Fabiani, M.; Gratton, G.; Kappenman, E.S.; Maris, E.; Mathewson, K.E.; Ward, R.T.; et al. Recommendations and publication guidelines for studies using frequency domain and time-frequency domain analyses of neural time series. Psychophysiology 2022, 59, e14052. [Google Scholar] [CrossRef]
- Mienye, I.D.; Swart, T.G.; Obaido, G. Recurrent Neural Networks: A Comprehensive Review of Architectures, Variants, and Applications. Information 2024, 15, 517. [Google Scholar] [CrossRef]
Figure 1.
Methodological Framework (DSR) Integrating PRISMA and CRISP-DM.
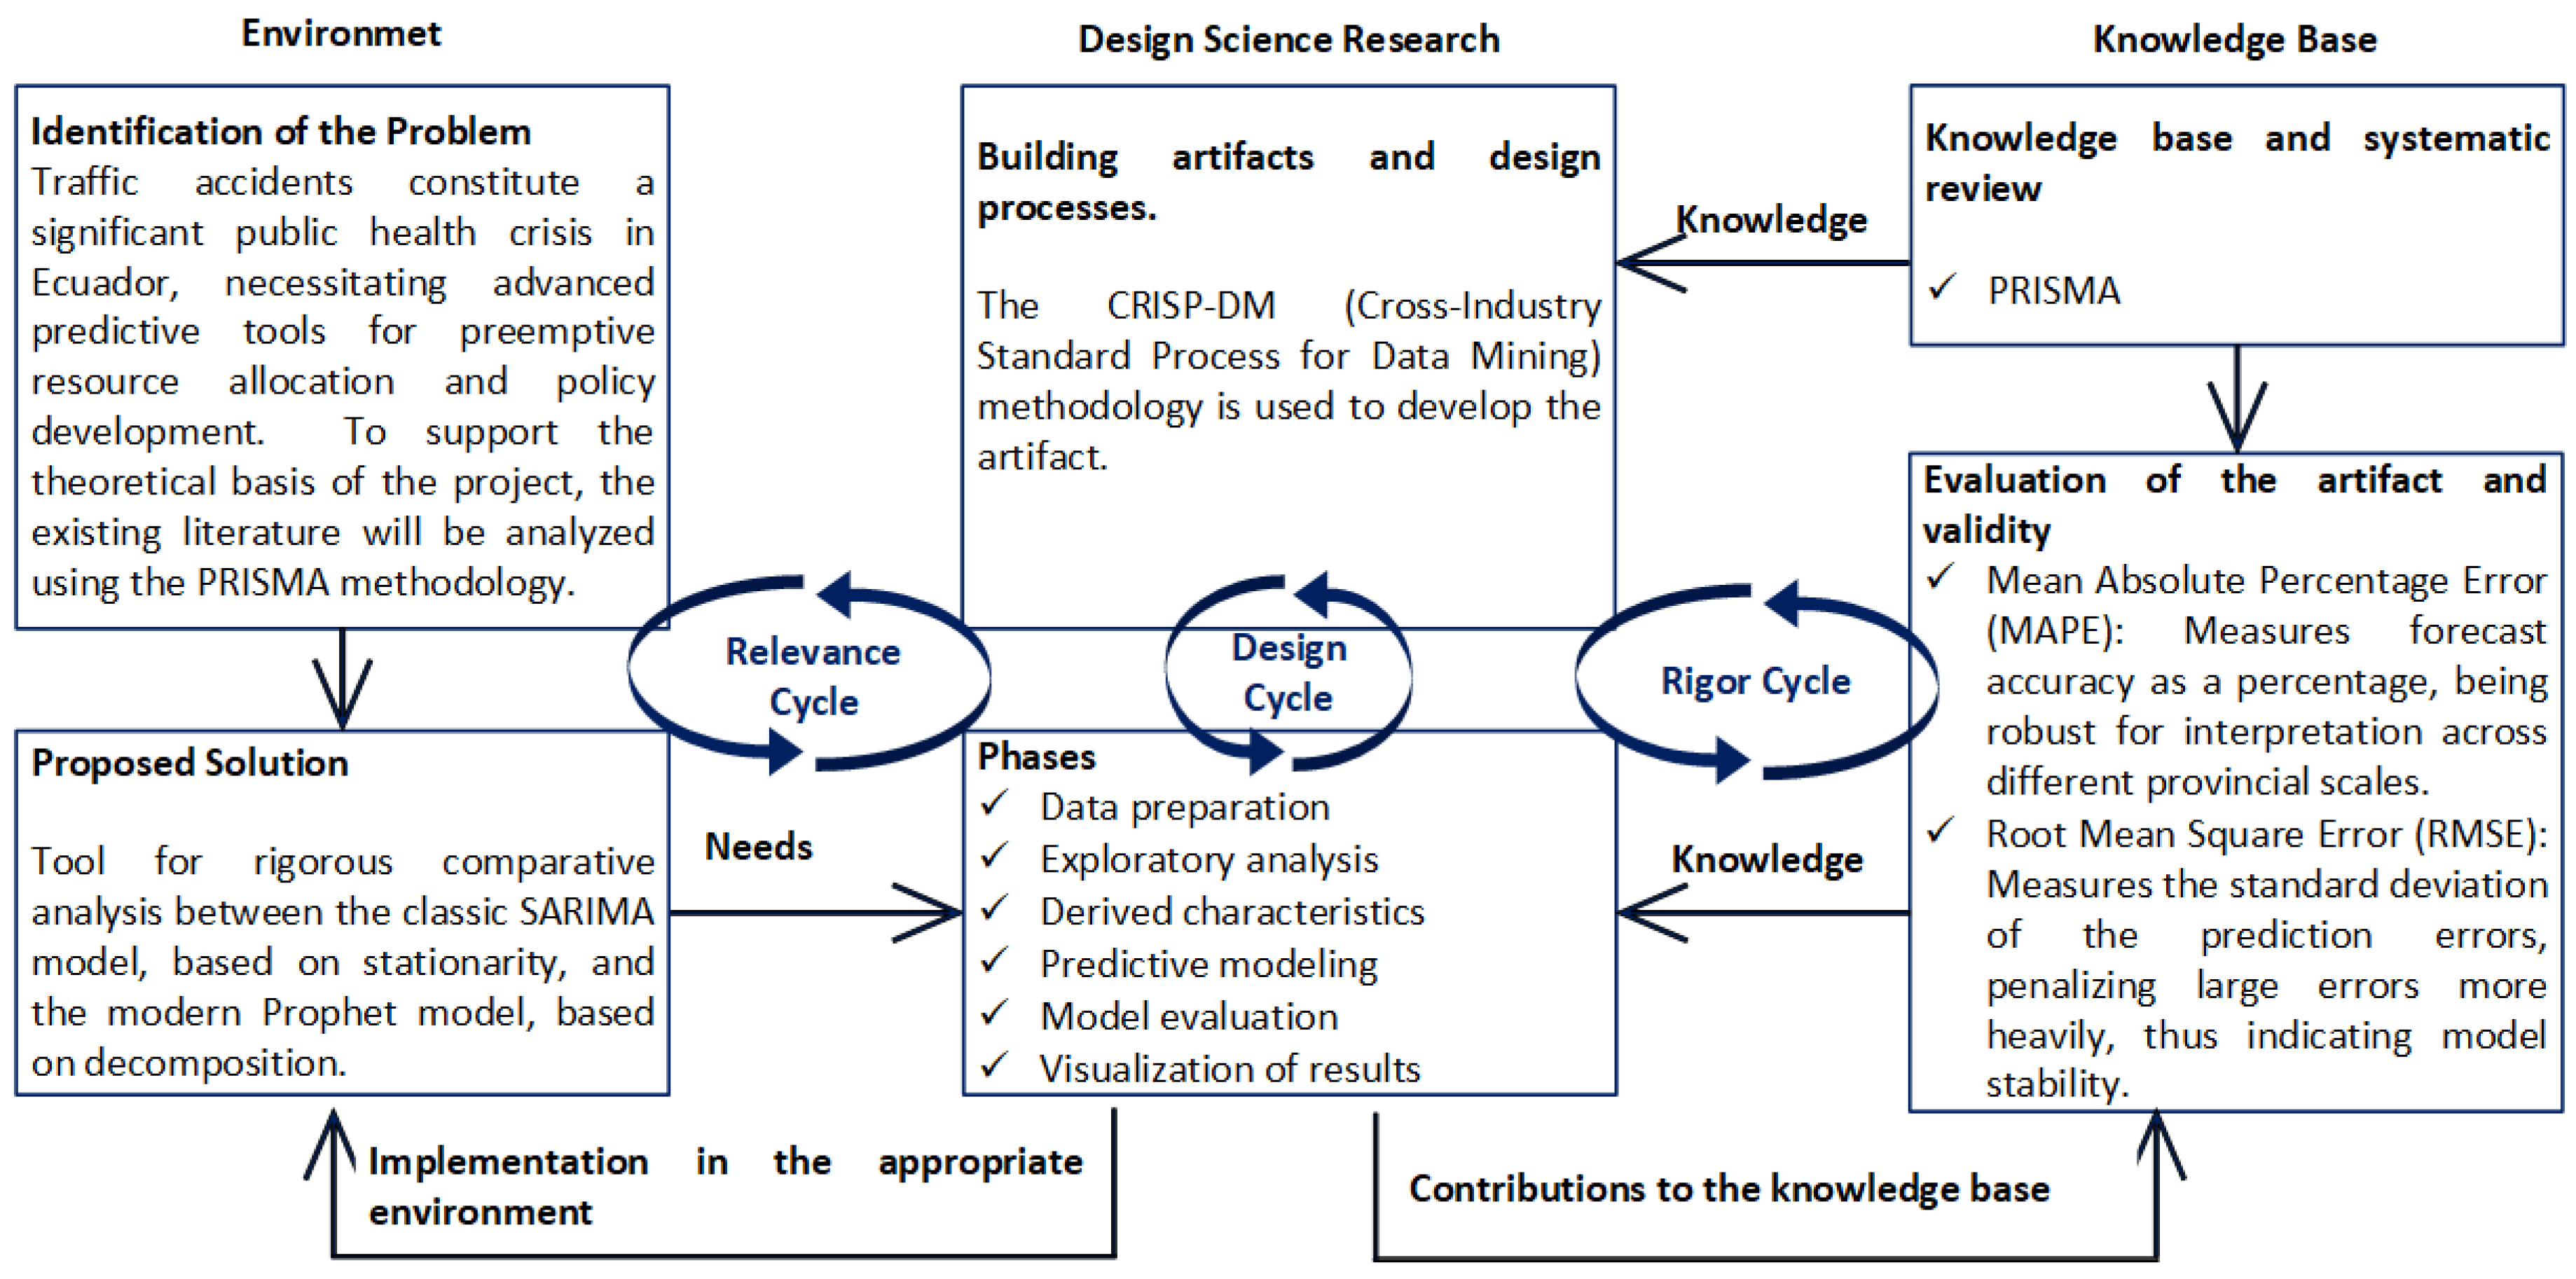
Figure 2.
PRISMA Framework for Systematic Variable Selection
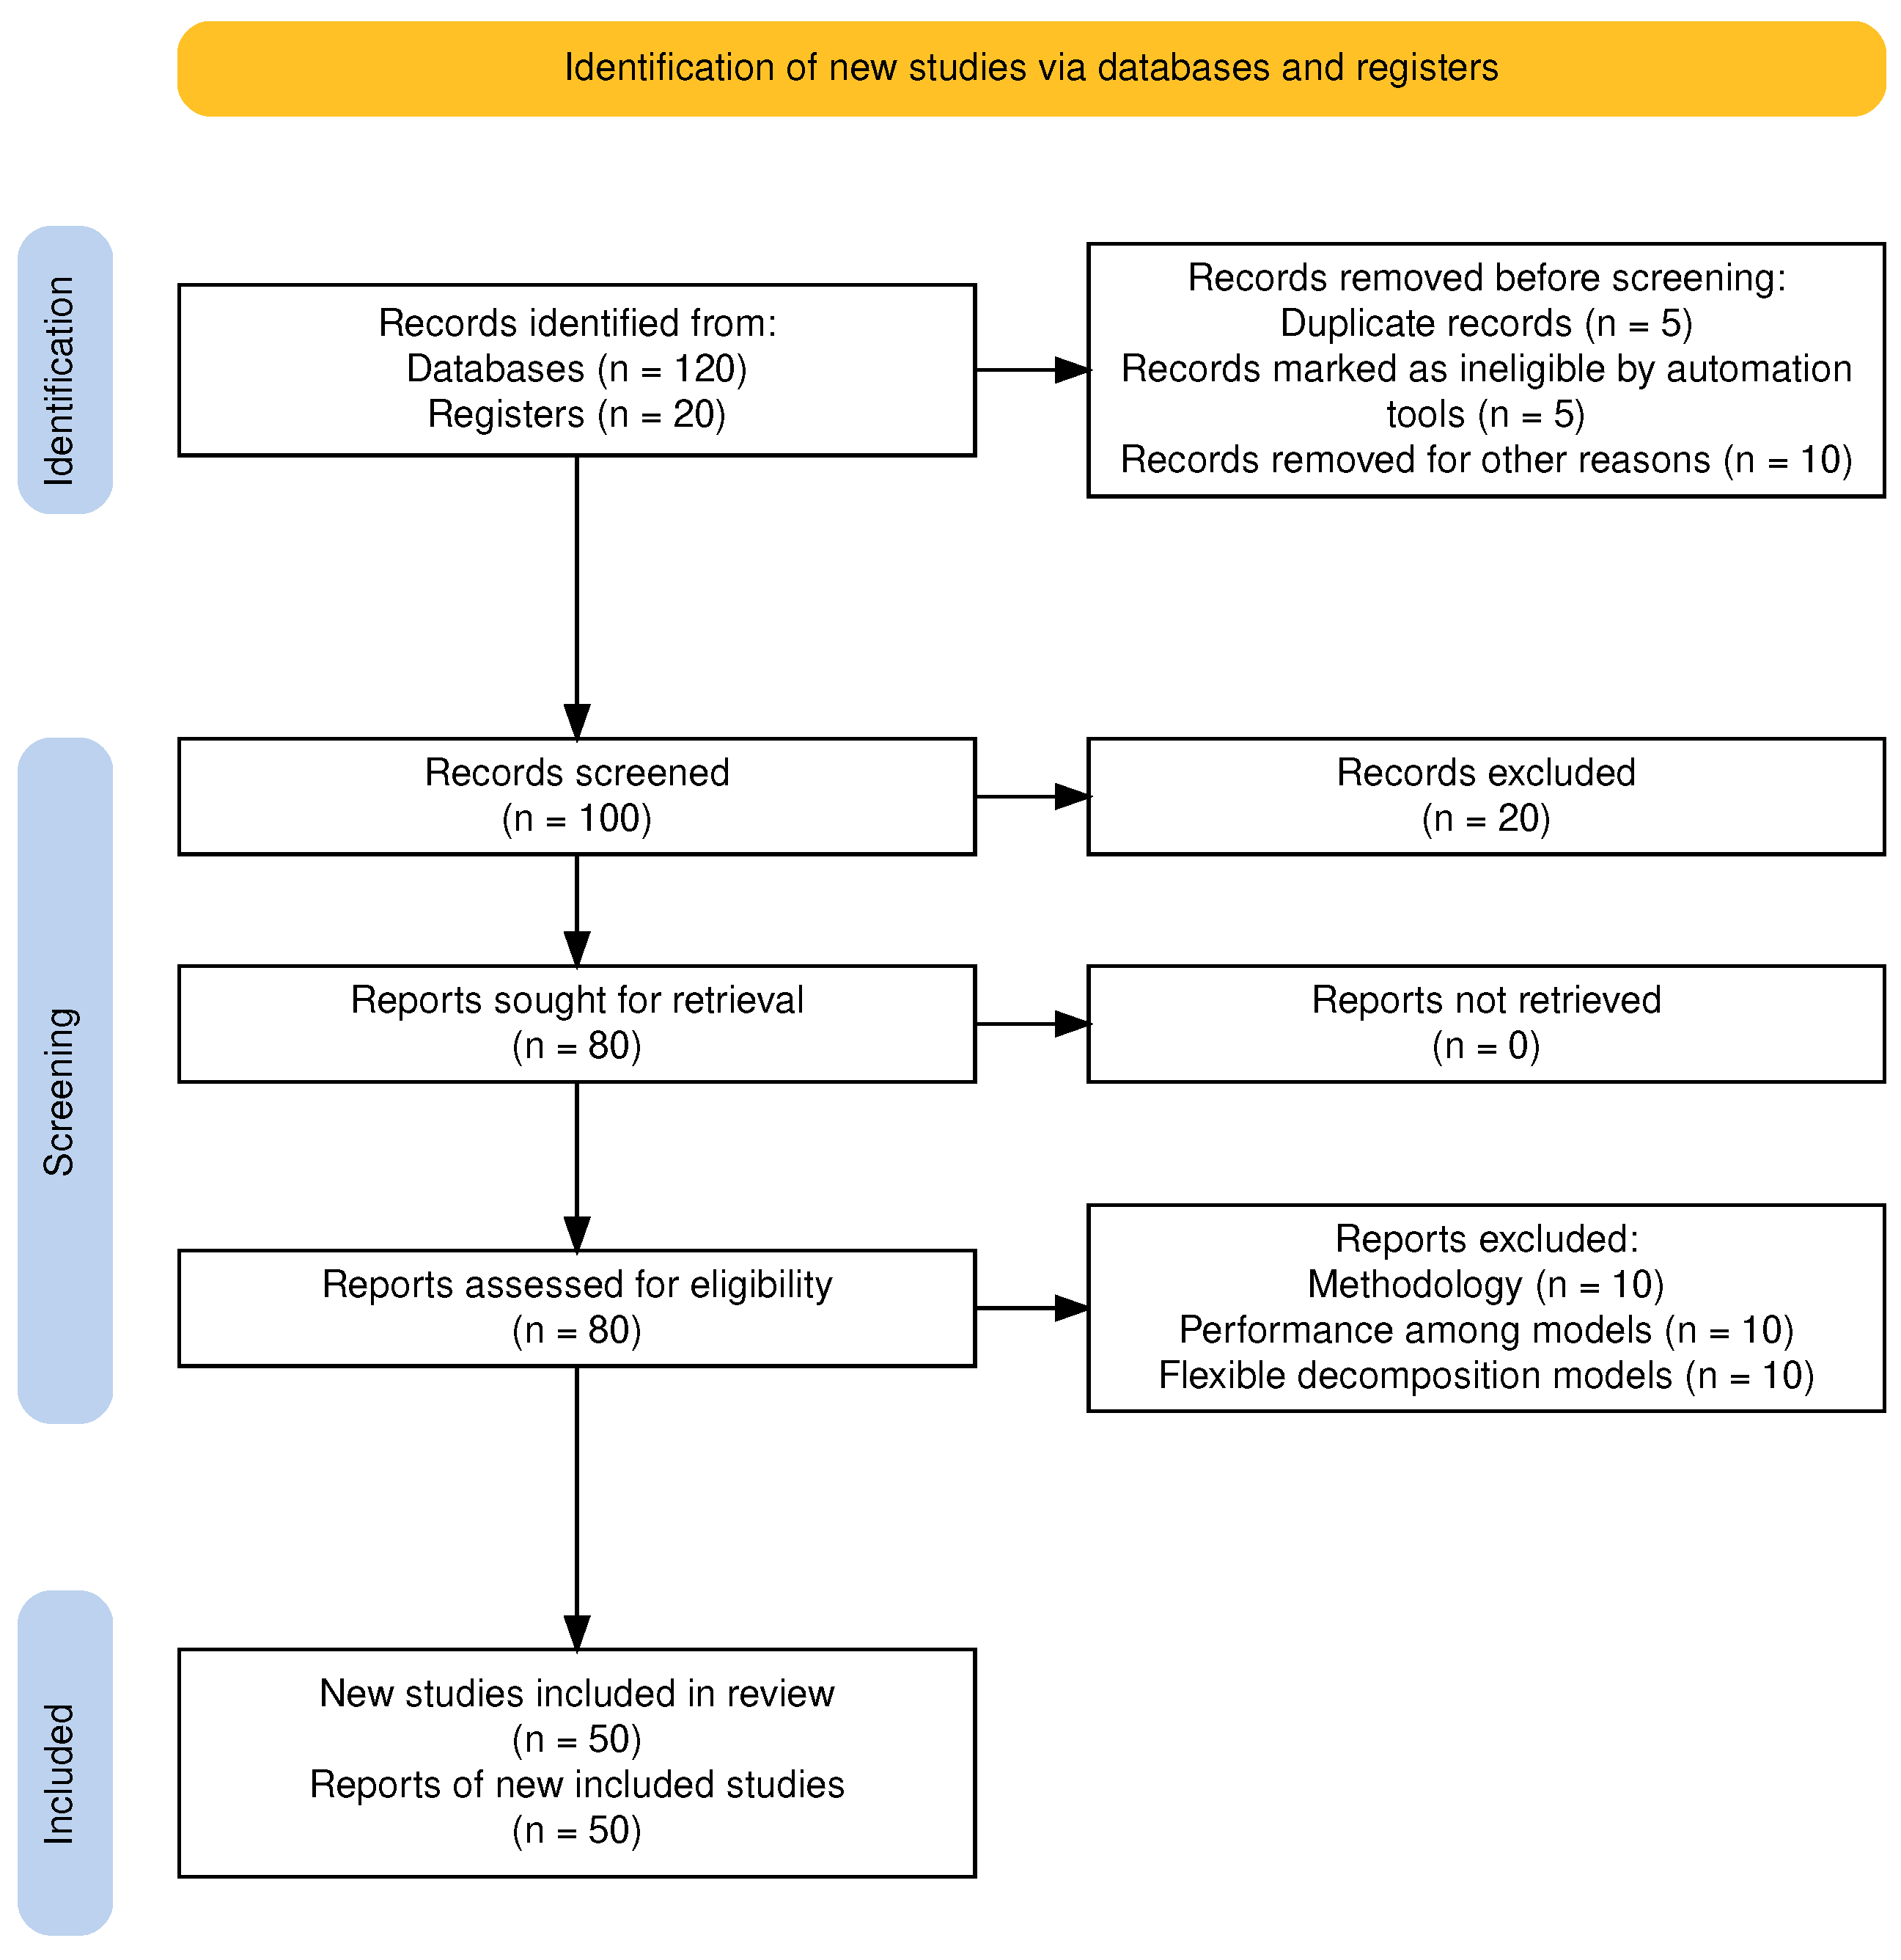
Figure 3.
Accident Forecasting Analysis for Guayas Province Using SARIMA and Prophet Models
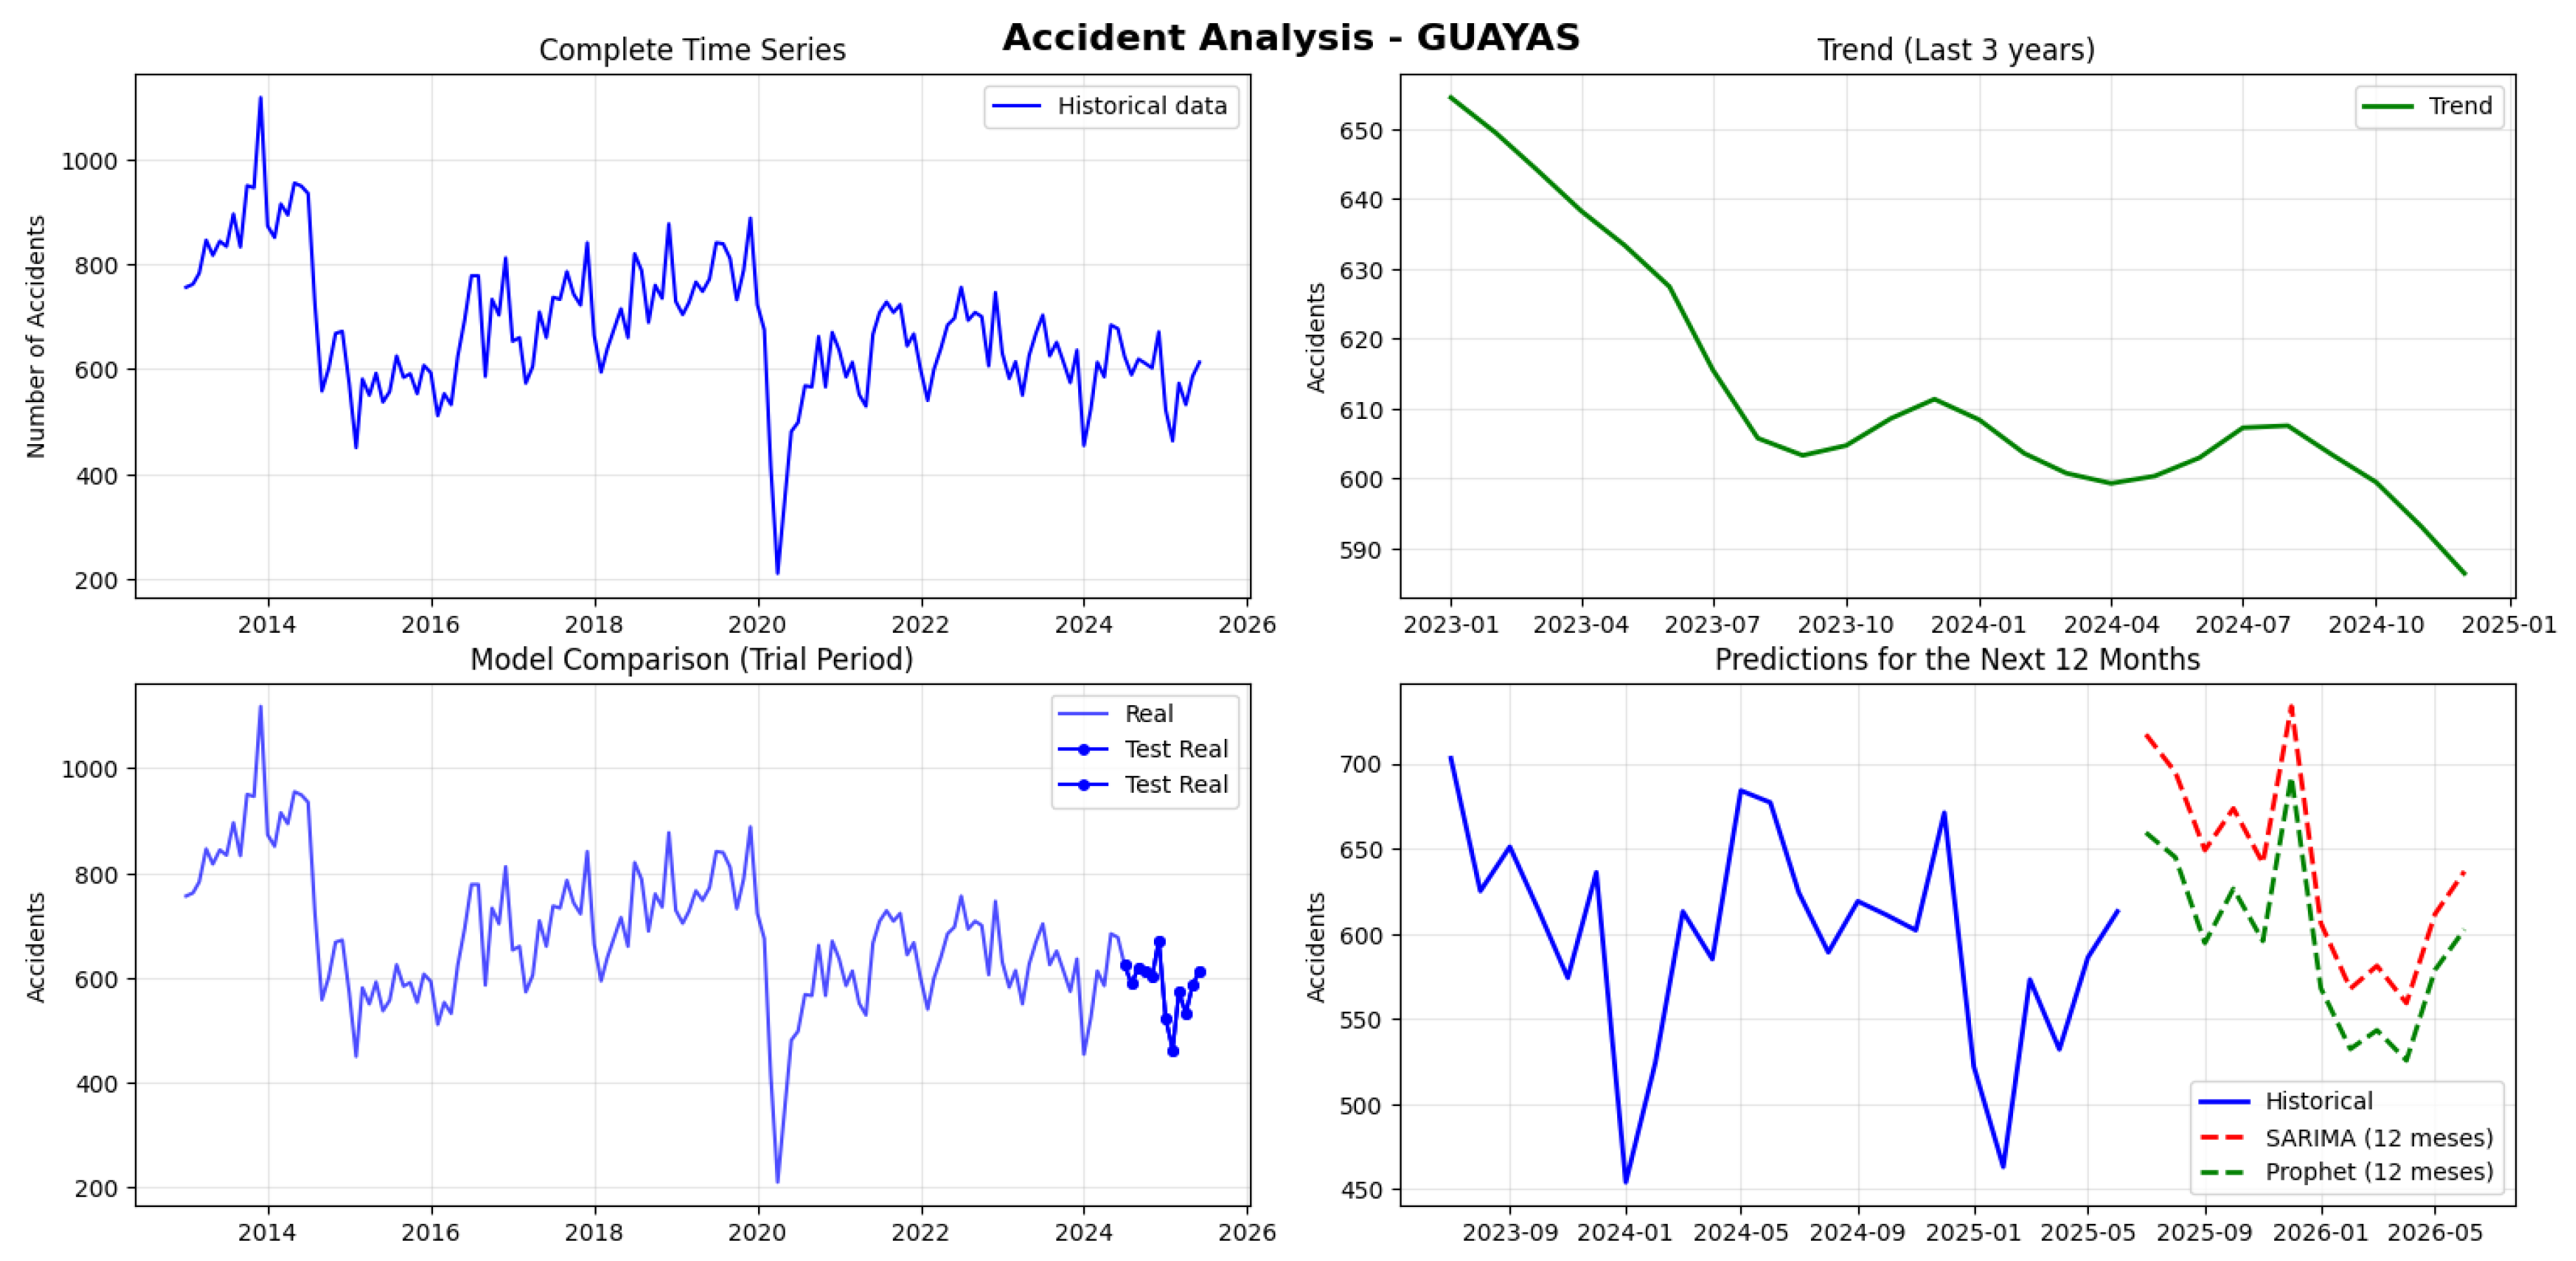
Figure 4.
Accident Forecasting Analysis for Manabí Province Using SARIMA and Prophet Models
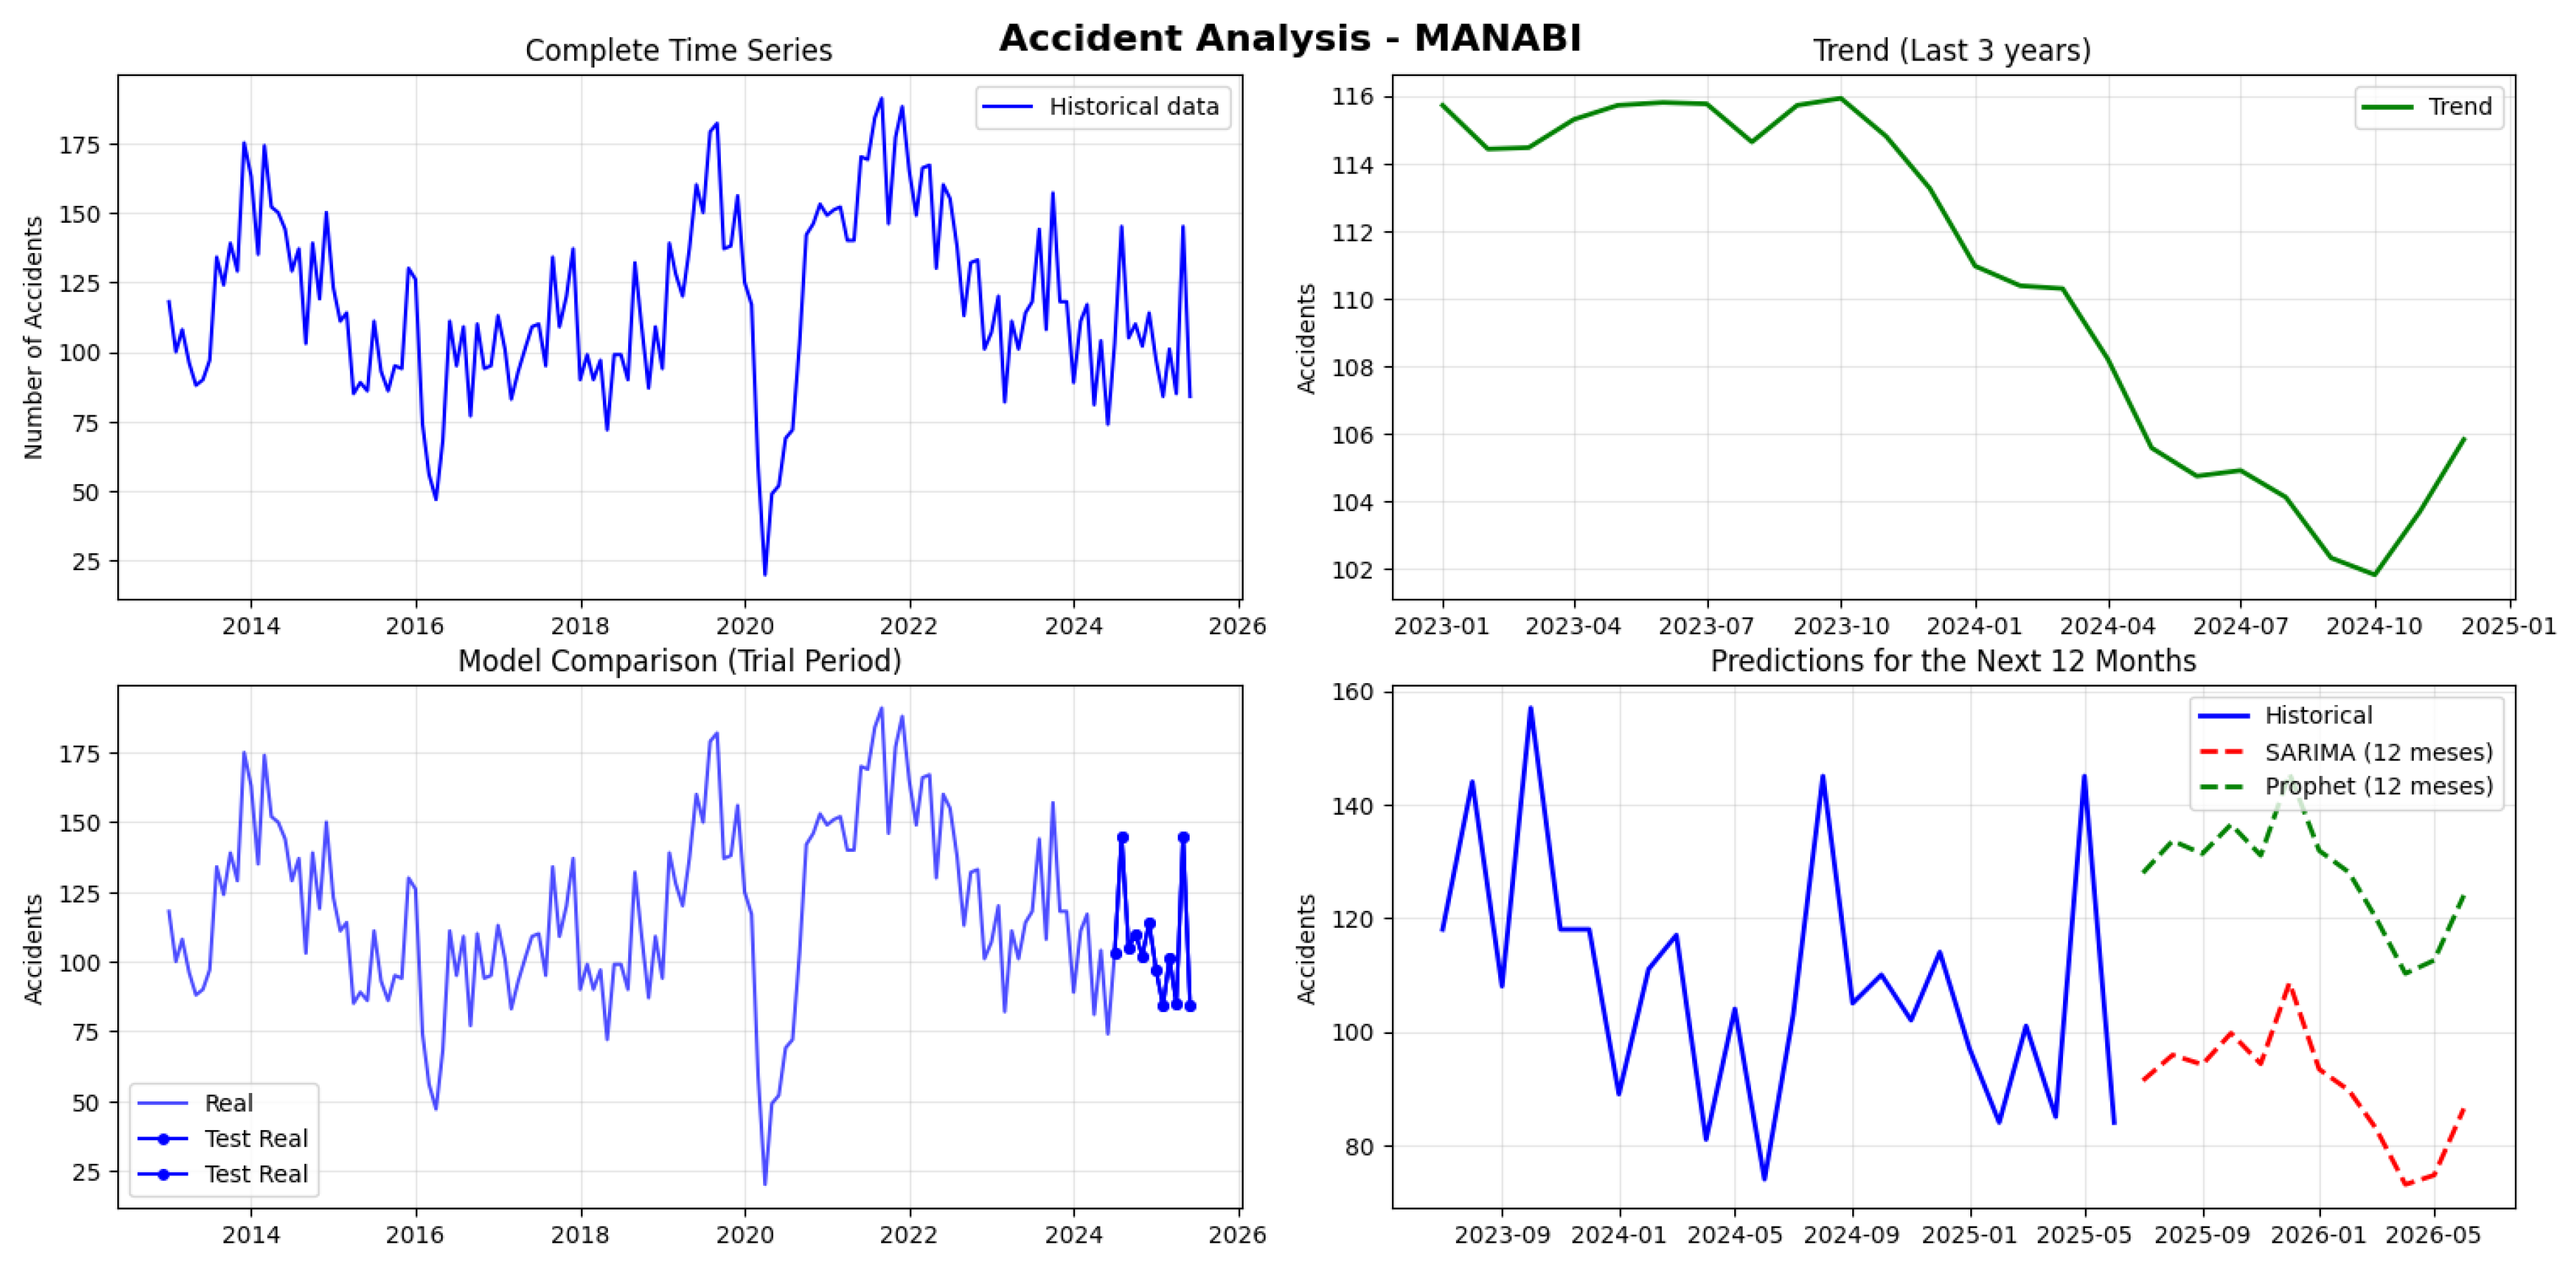
Figure 5.
Accident Forecasting Analysis for Los Ríos Province Using SARIMA and Prophet Models
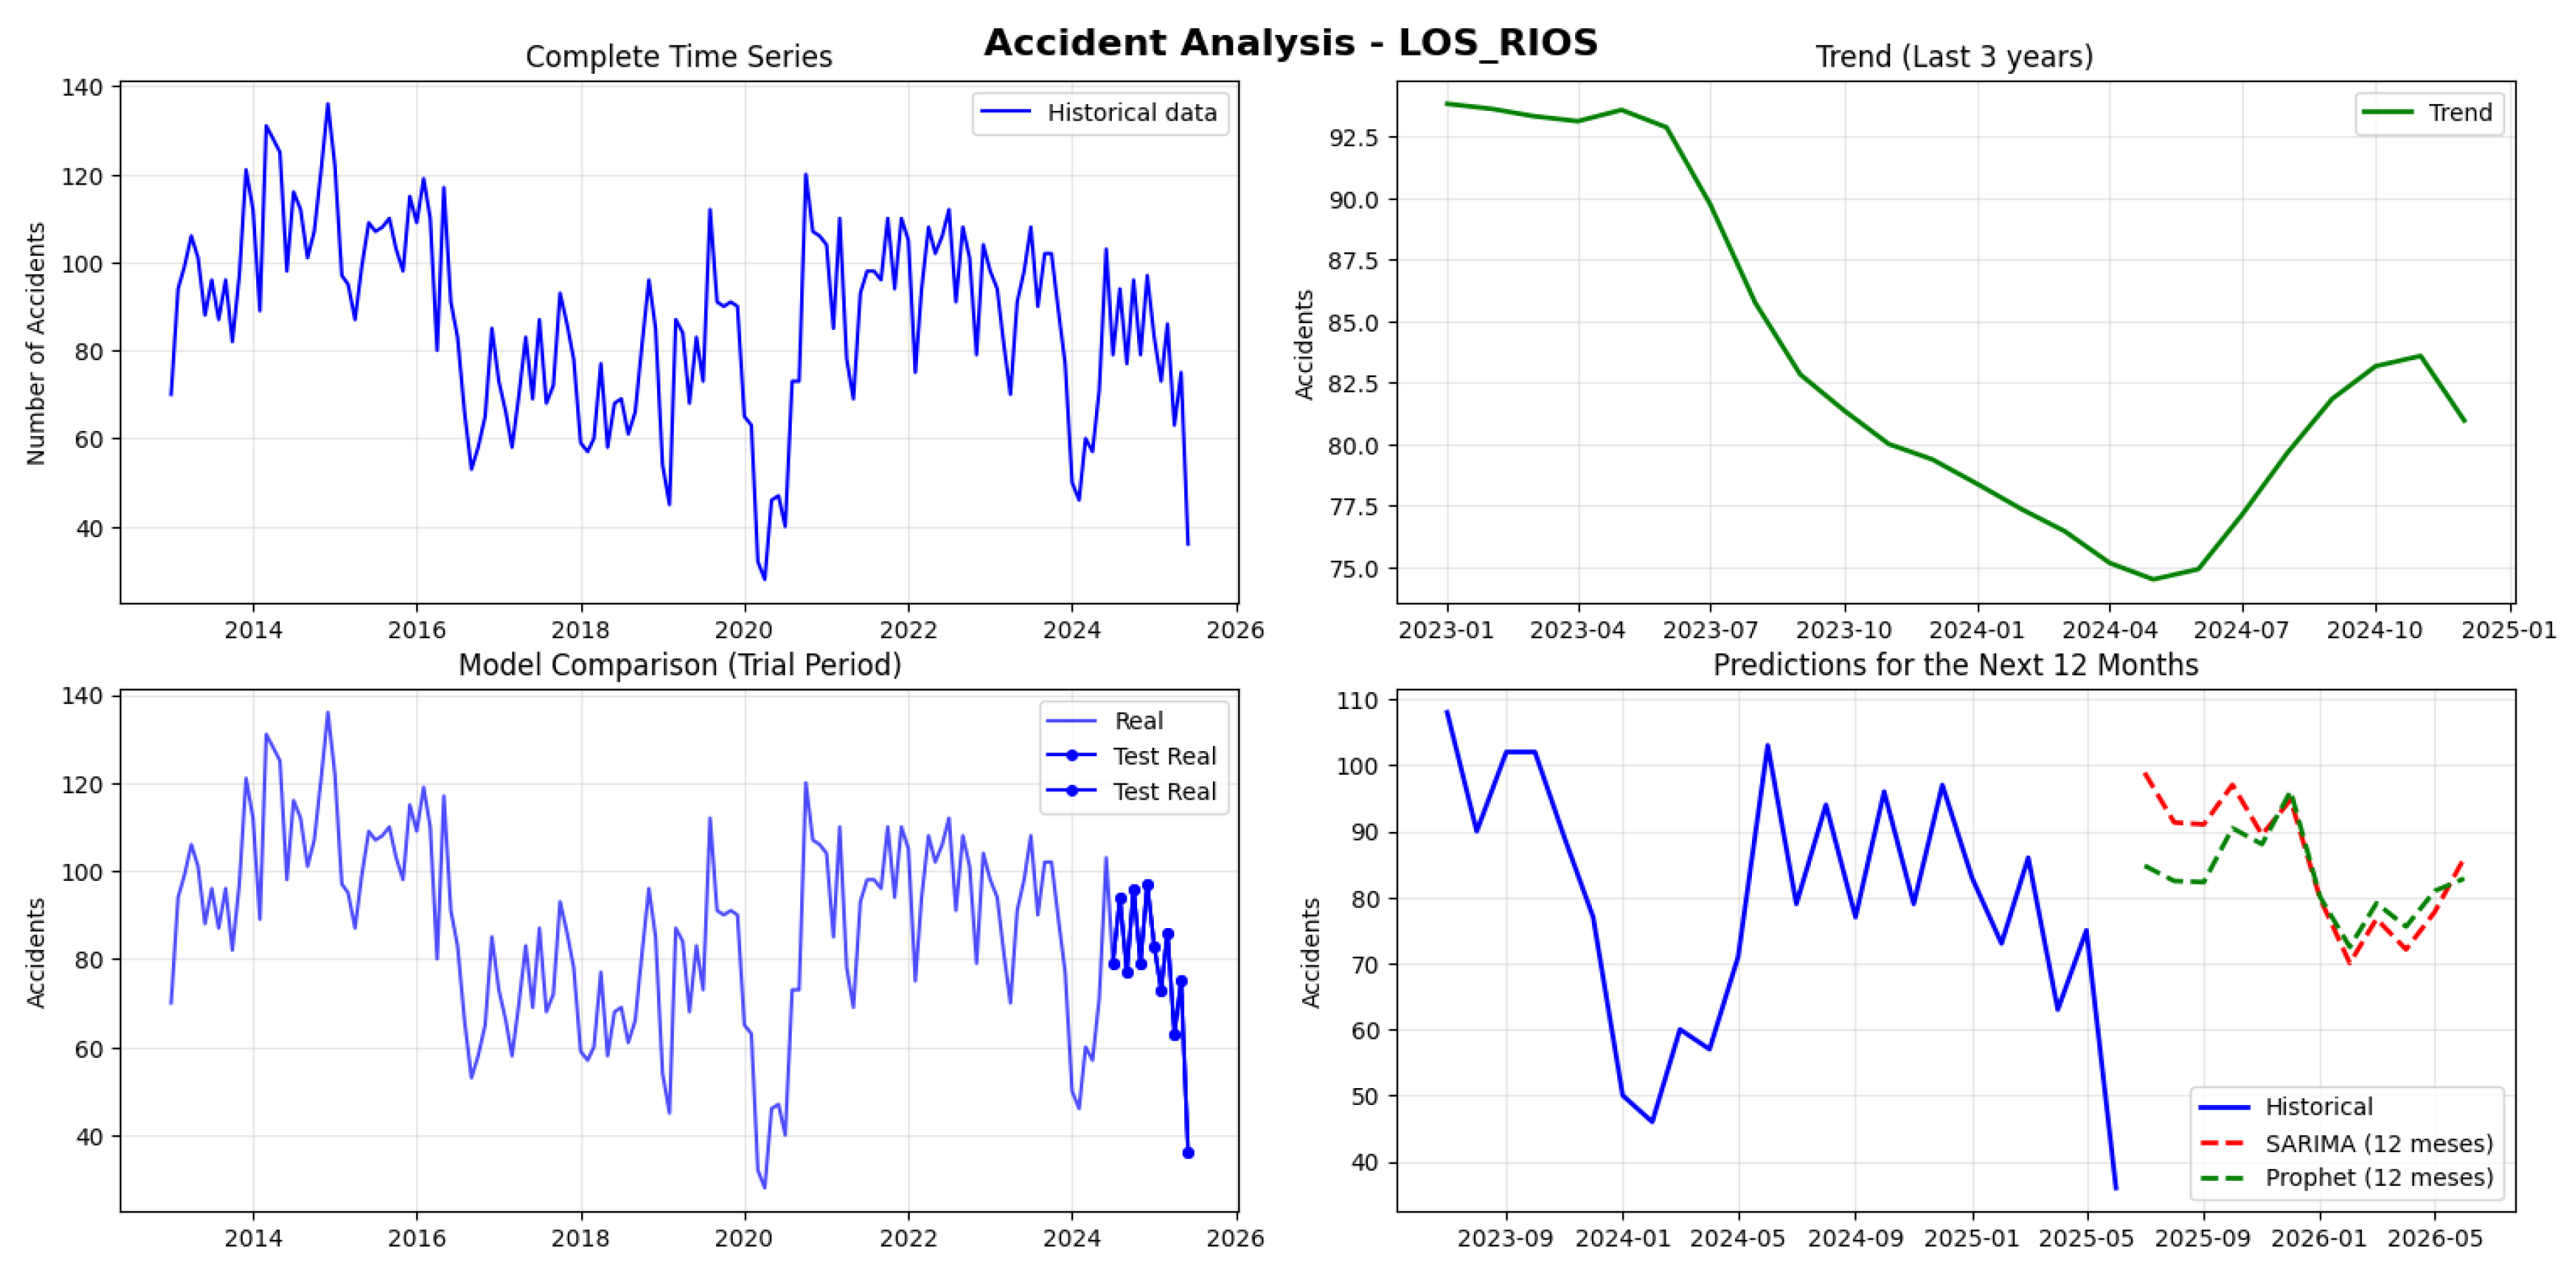
Figure 6.
Temporal Evolution and Prediction of Traffic Accidents, SARIMA Model vs. Prophet
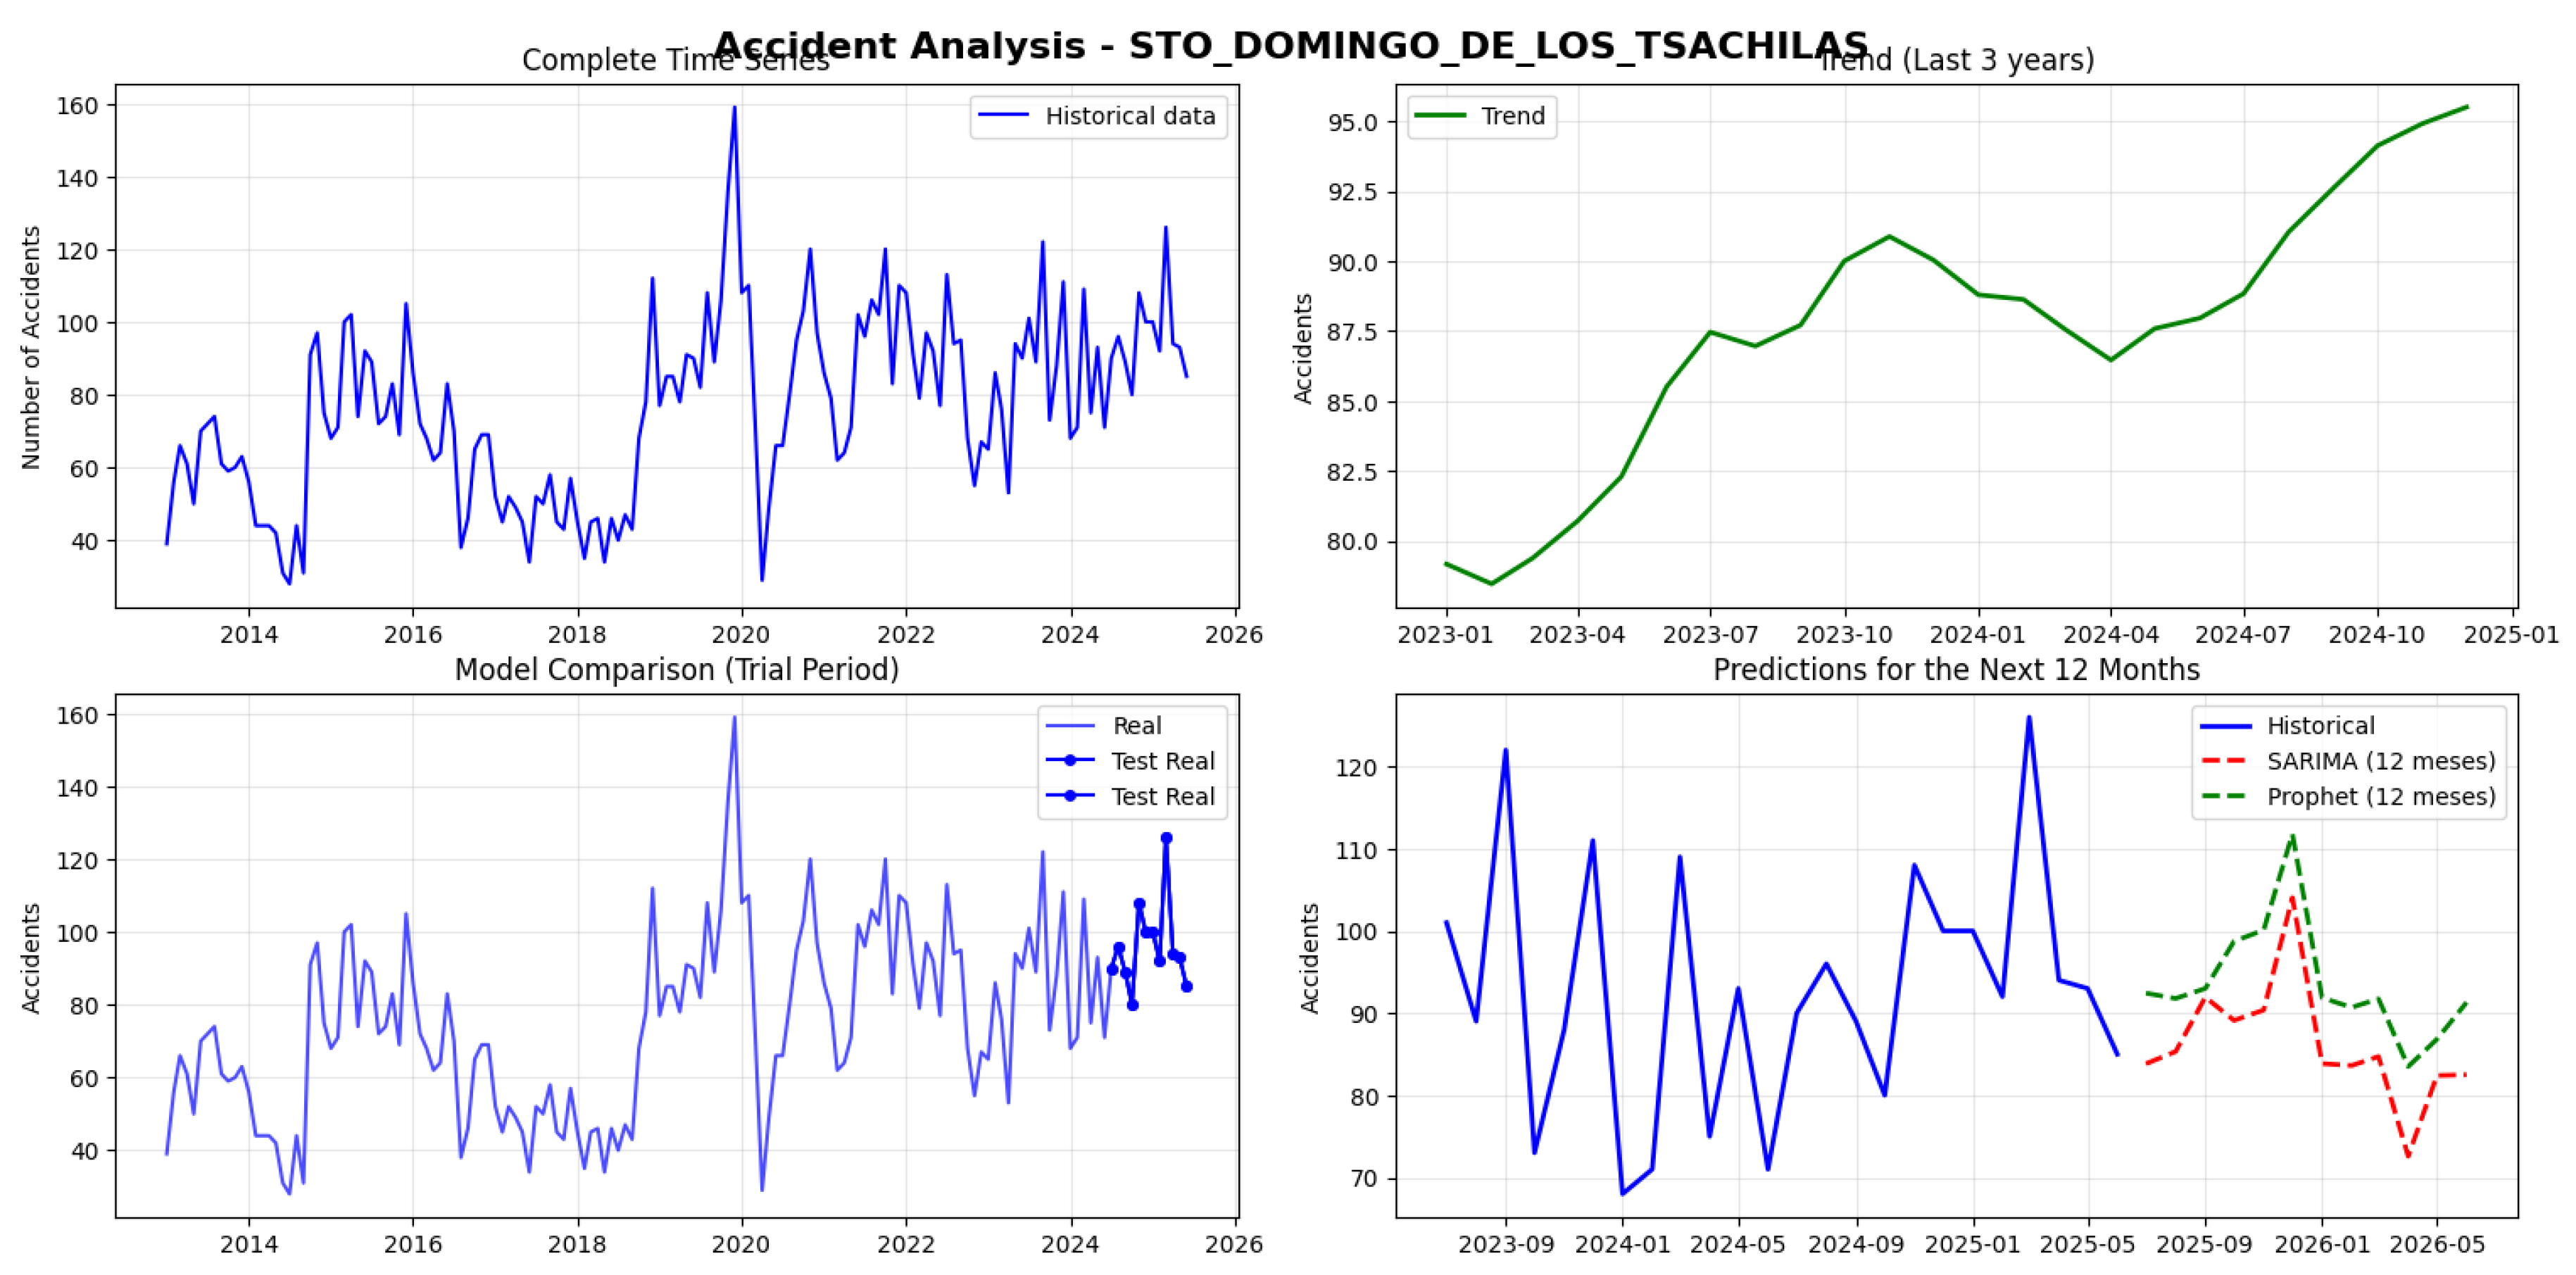
Figure 7.
Forecasting Monthly Traffic Accidents in El Oro Province (2013–2026)
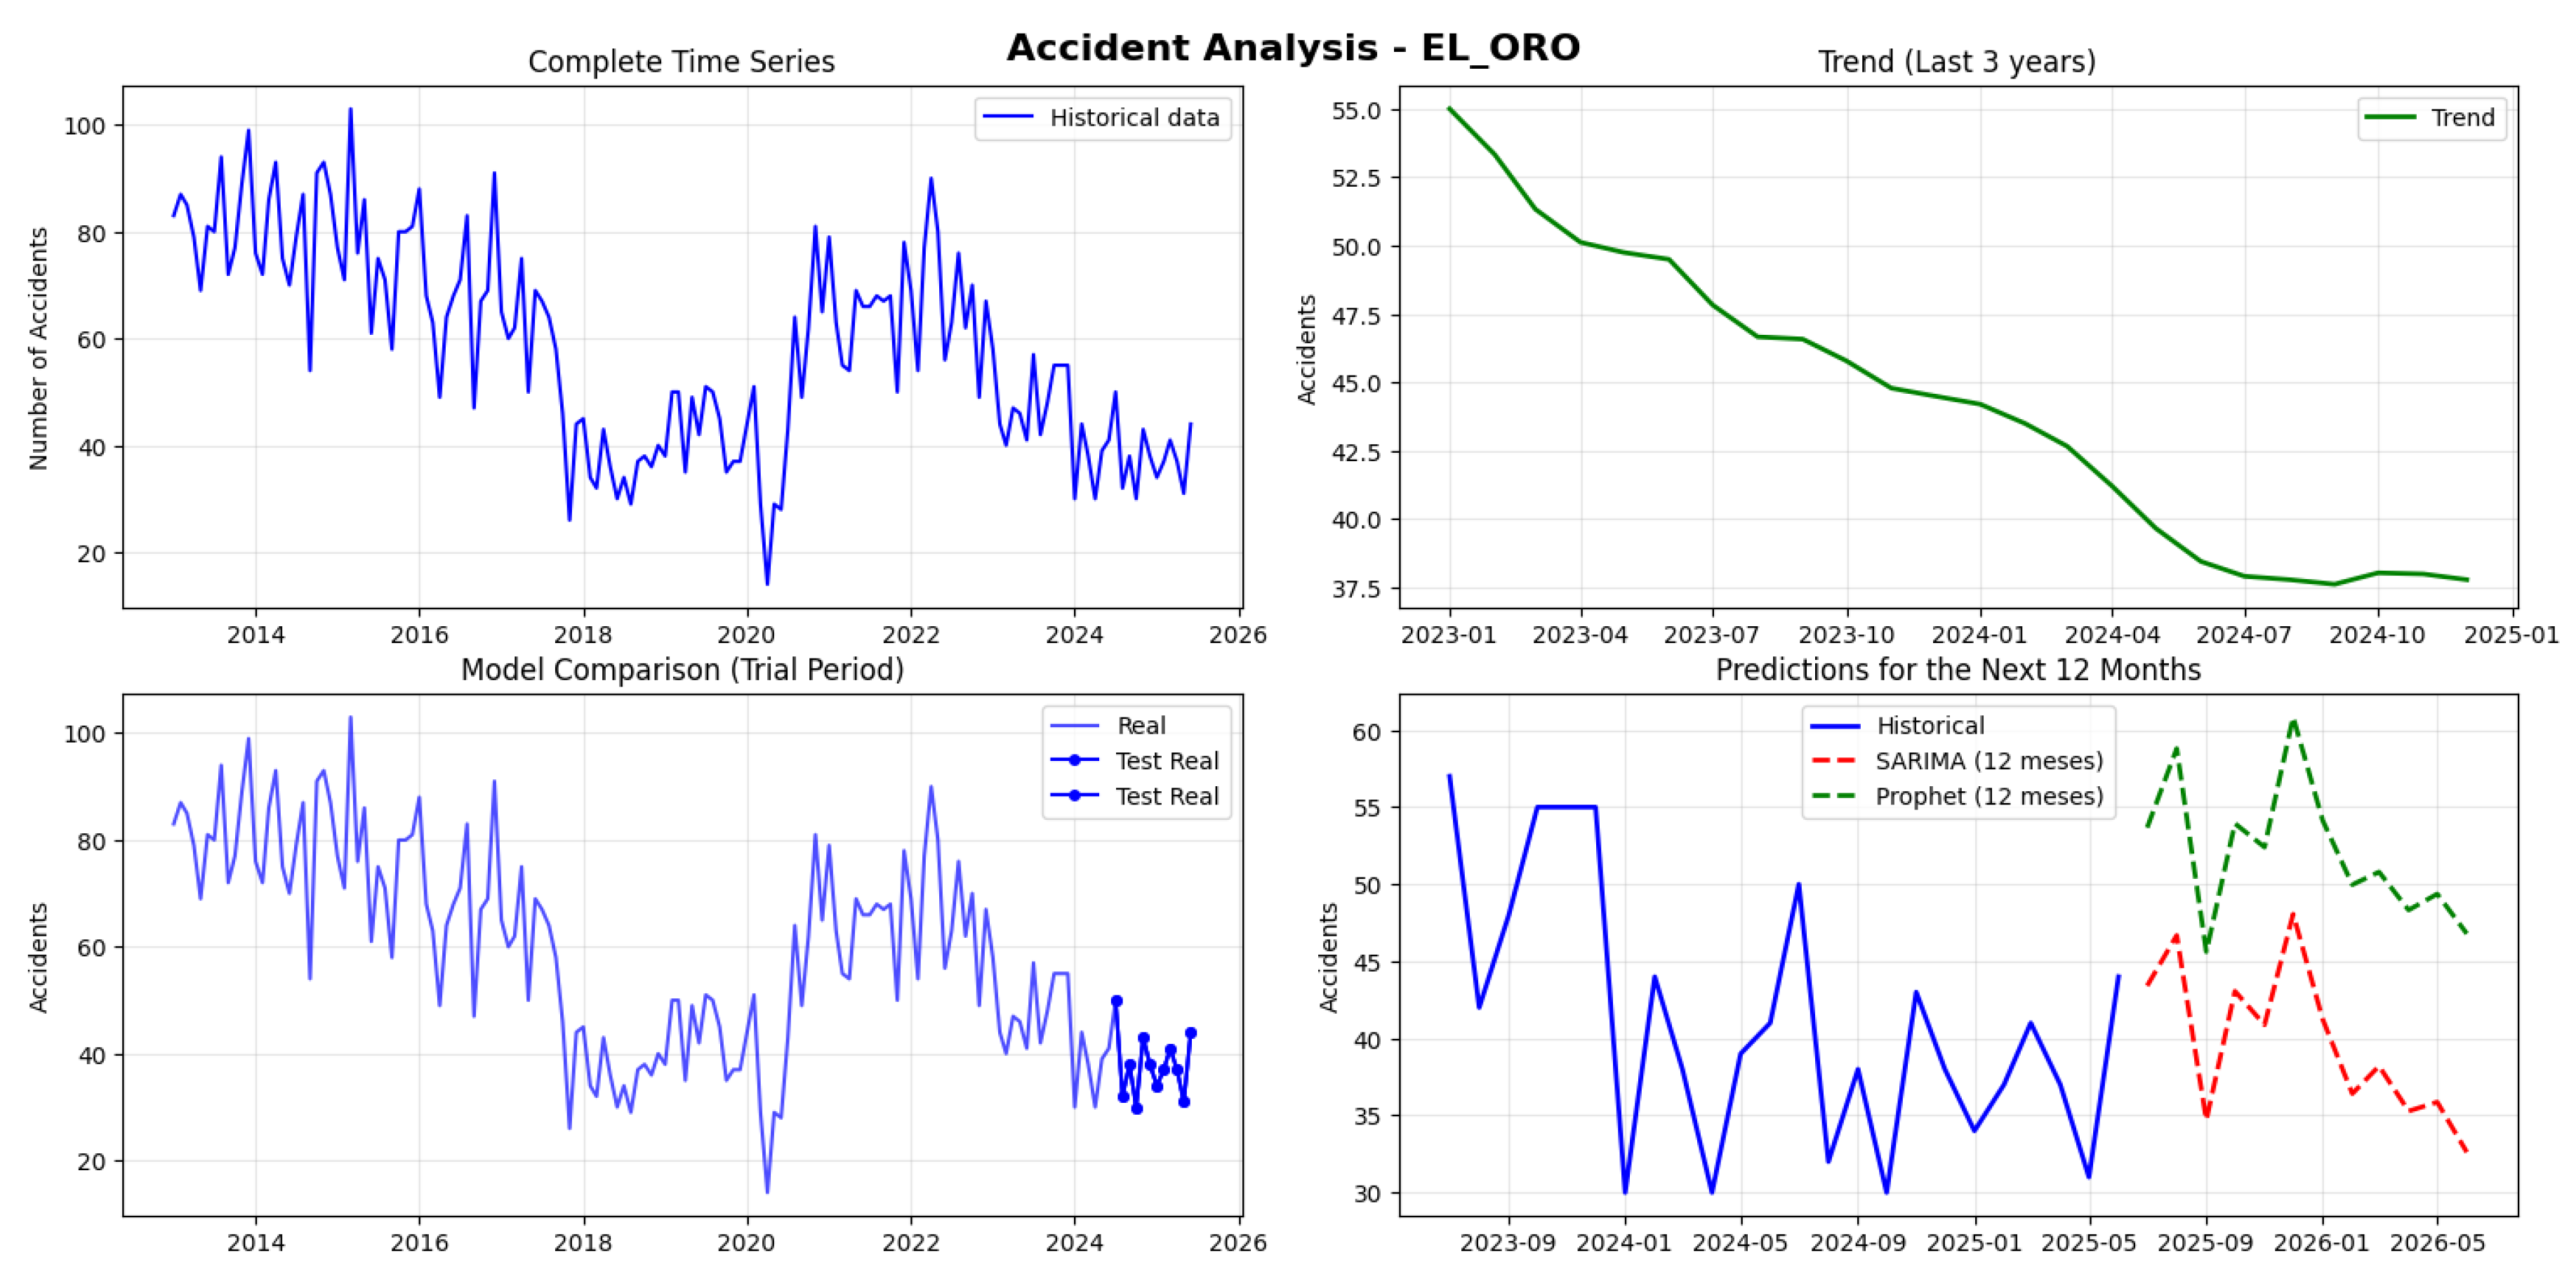
Figure 8.
Traffic Accident Forecasting and Temporal Trends in Santa Elena Province (2013–2026)
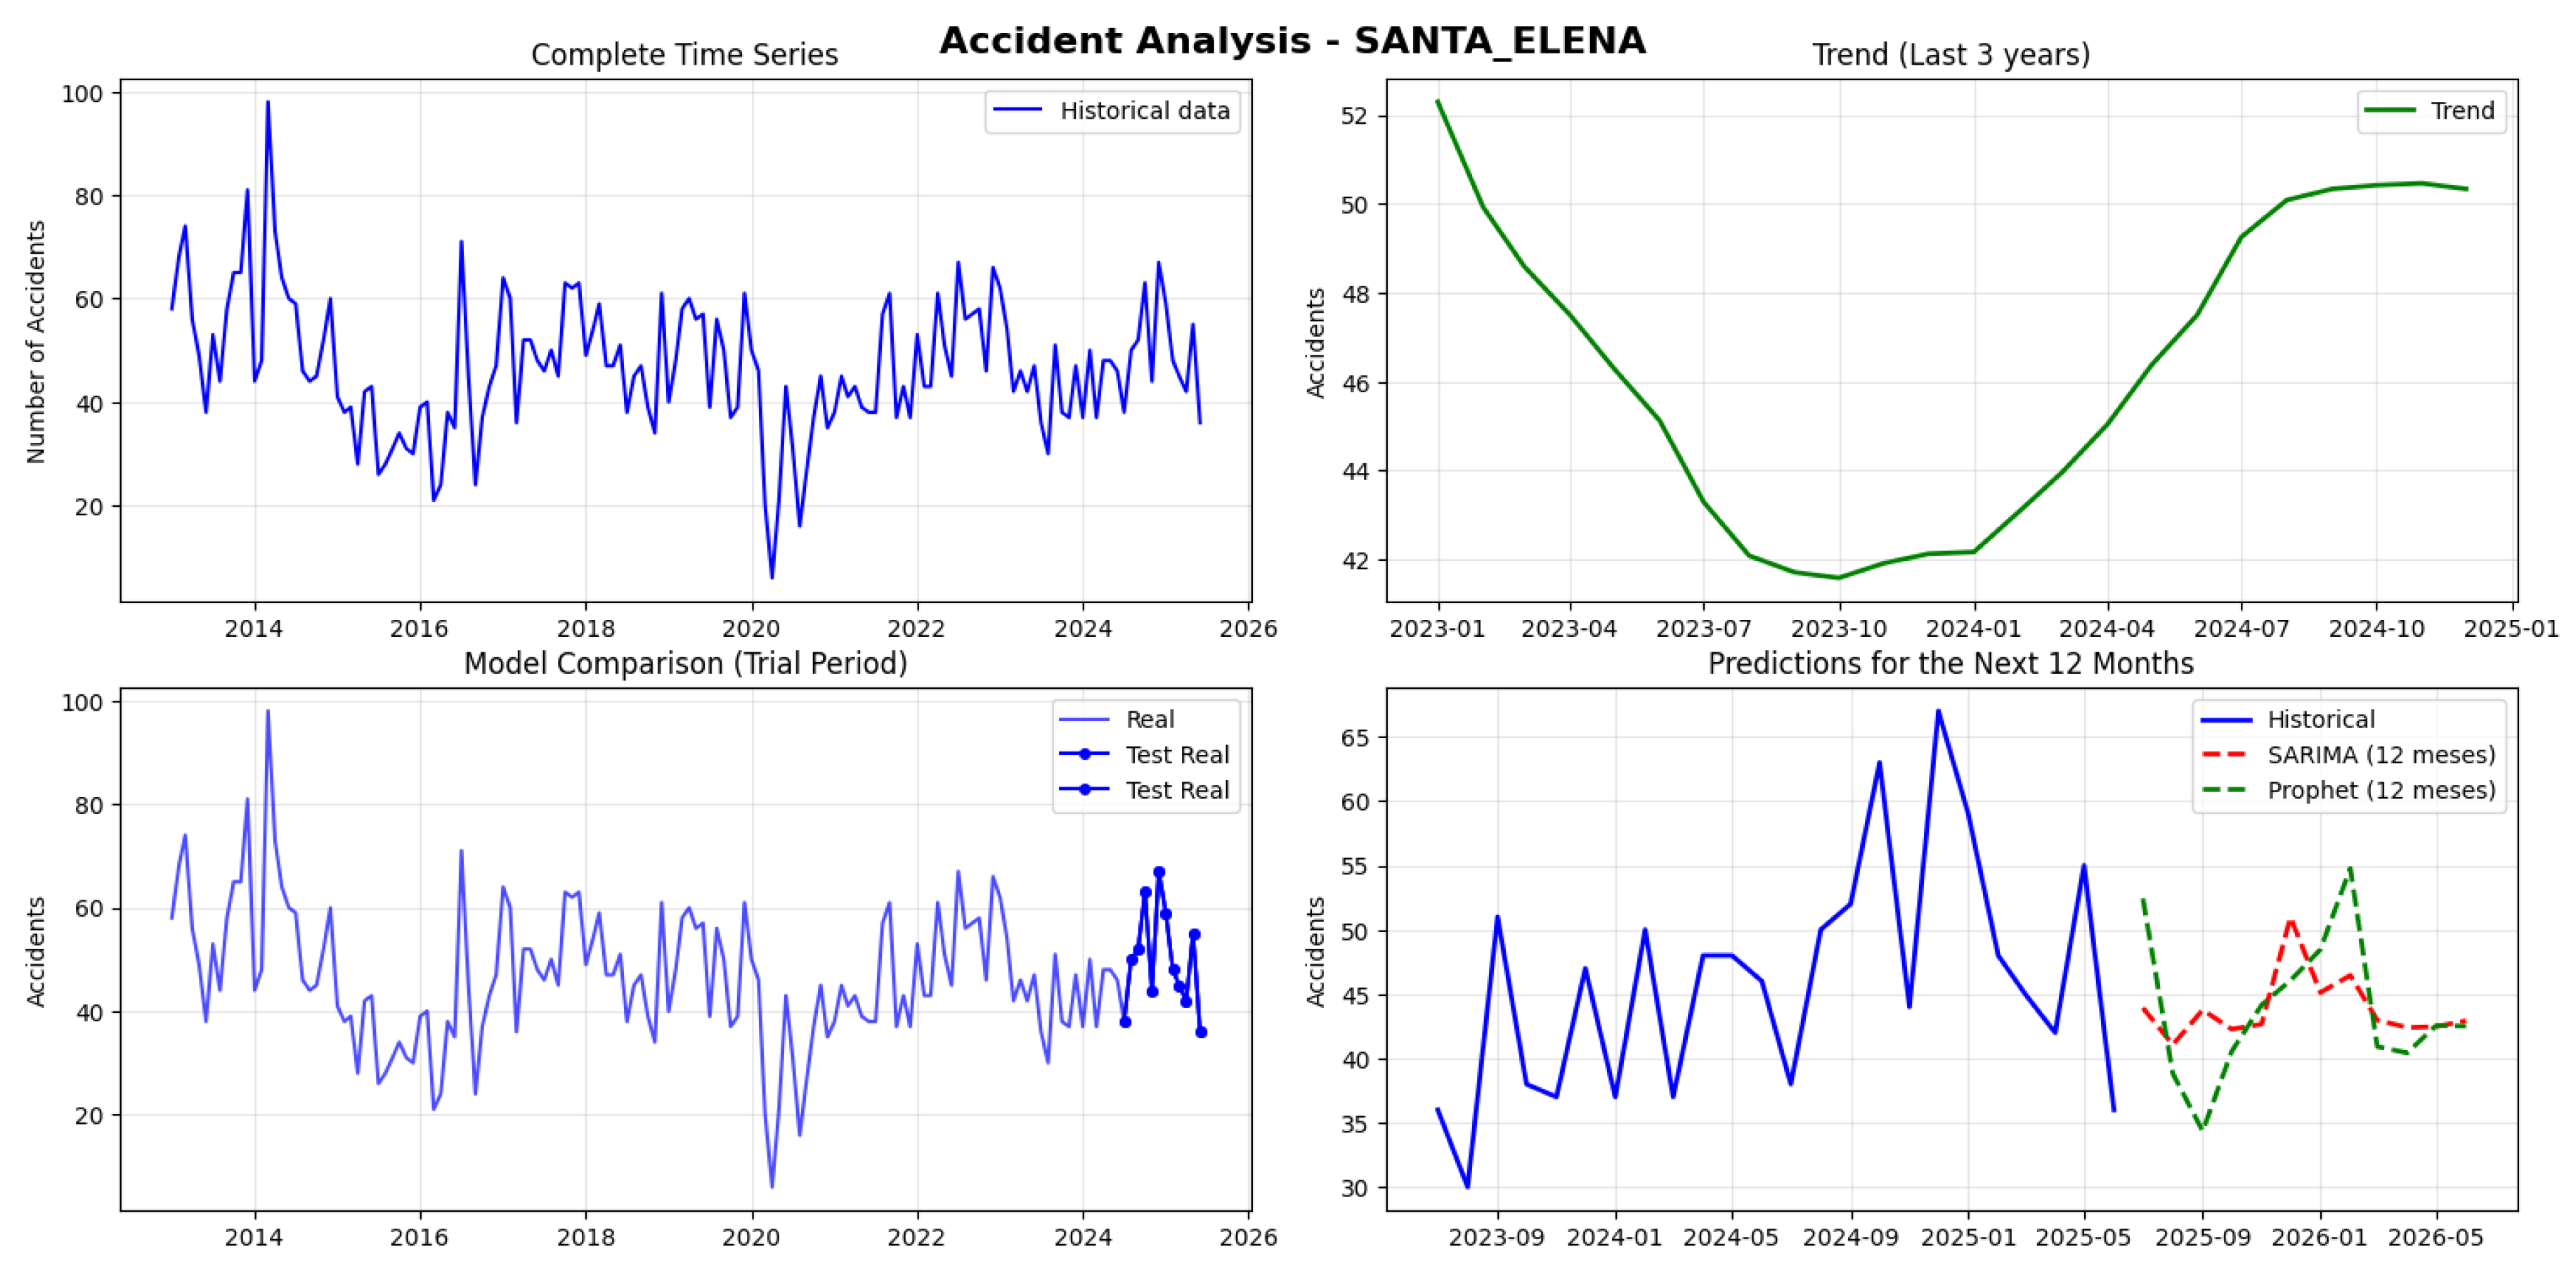
Figure 10.
Traffic Accident Forecasting and Temporal Trends in Pichincha Province
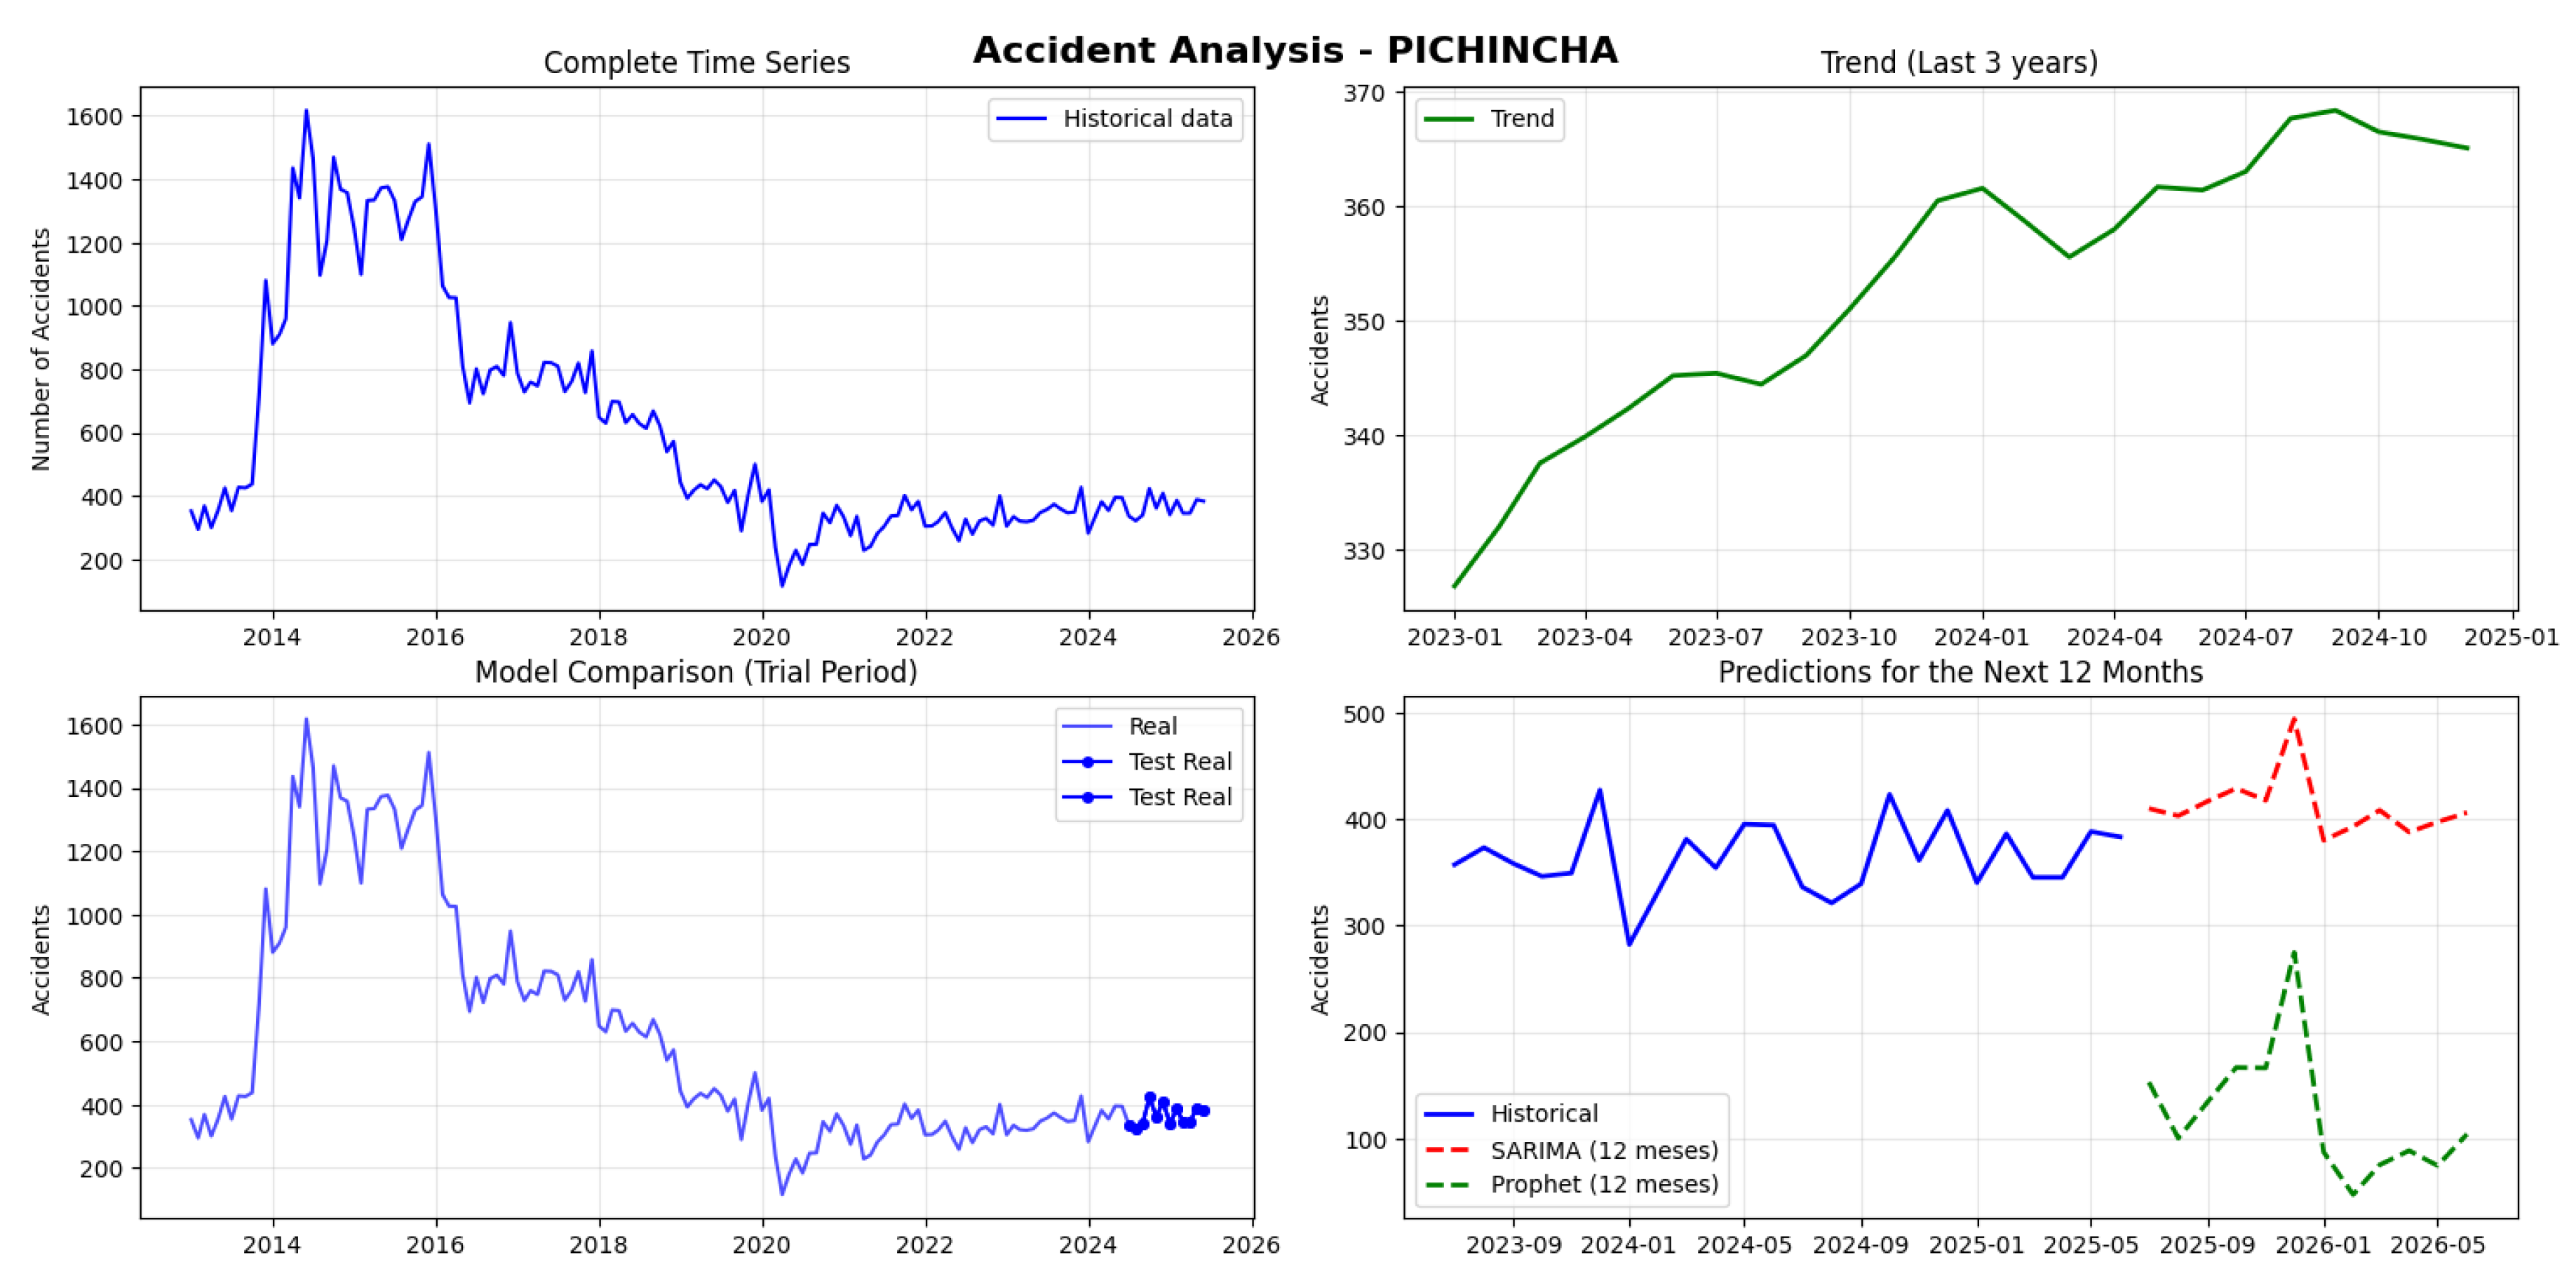
Figure 11.
Traffic Accident Forecasting and Temporal Trends in Azuay Province)
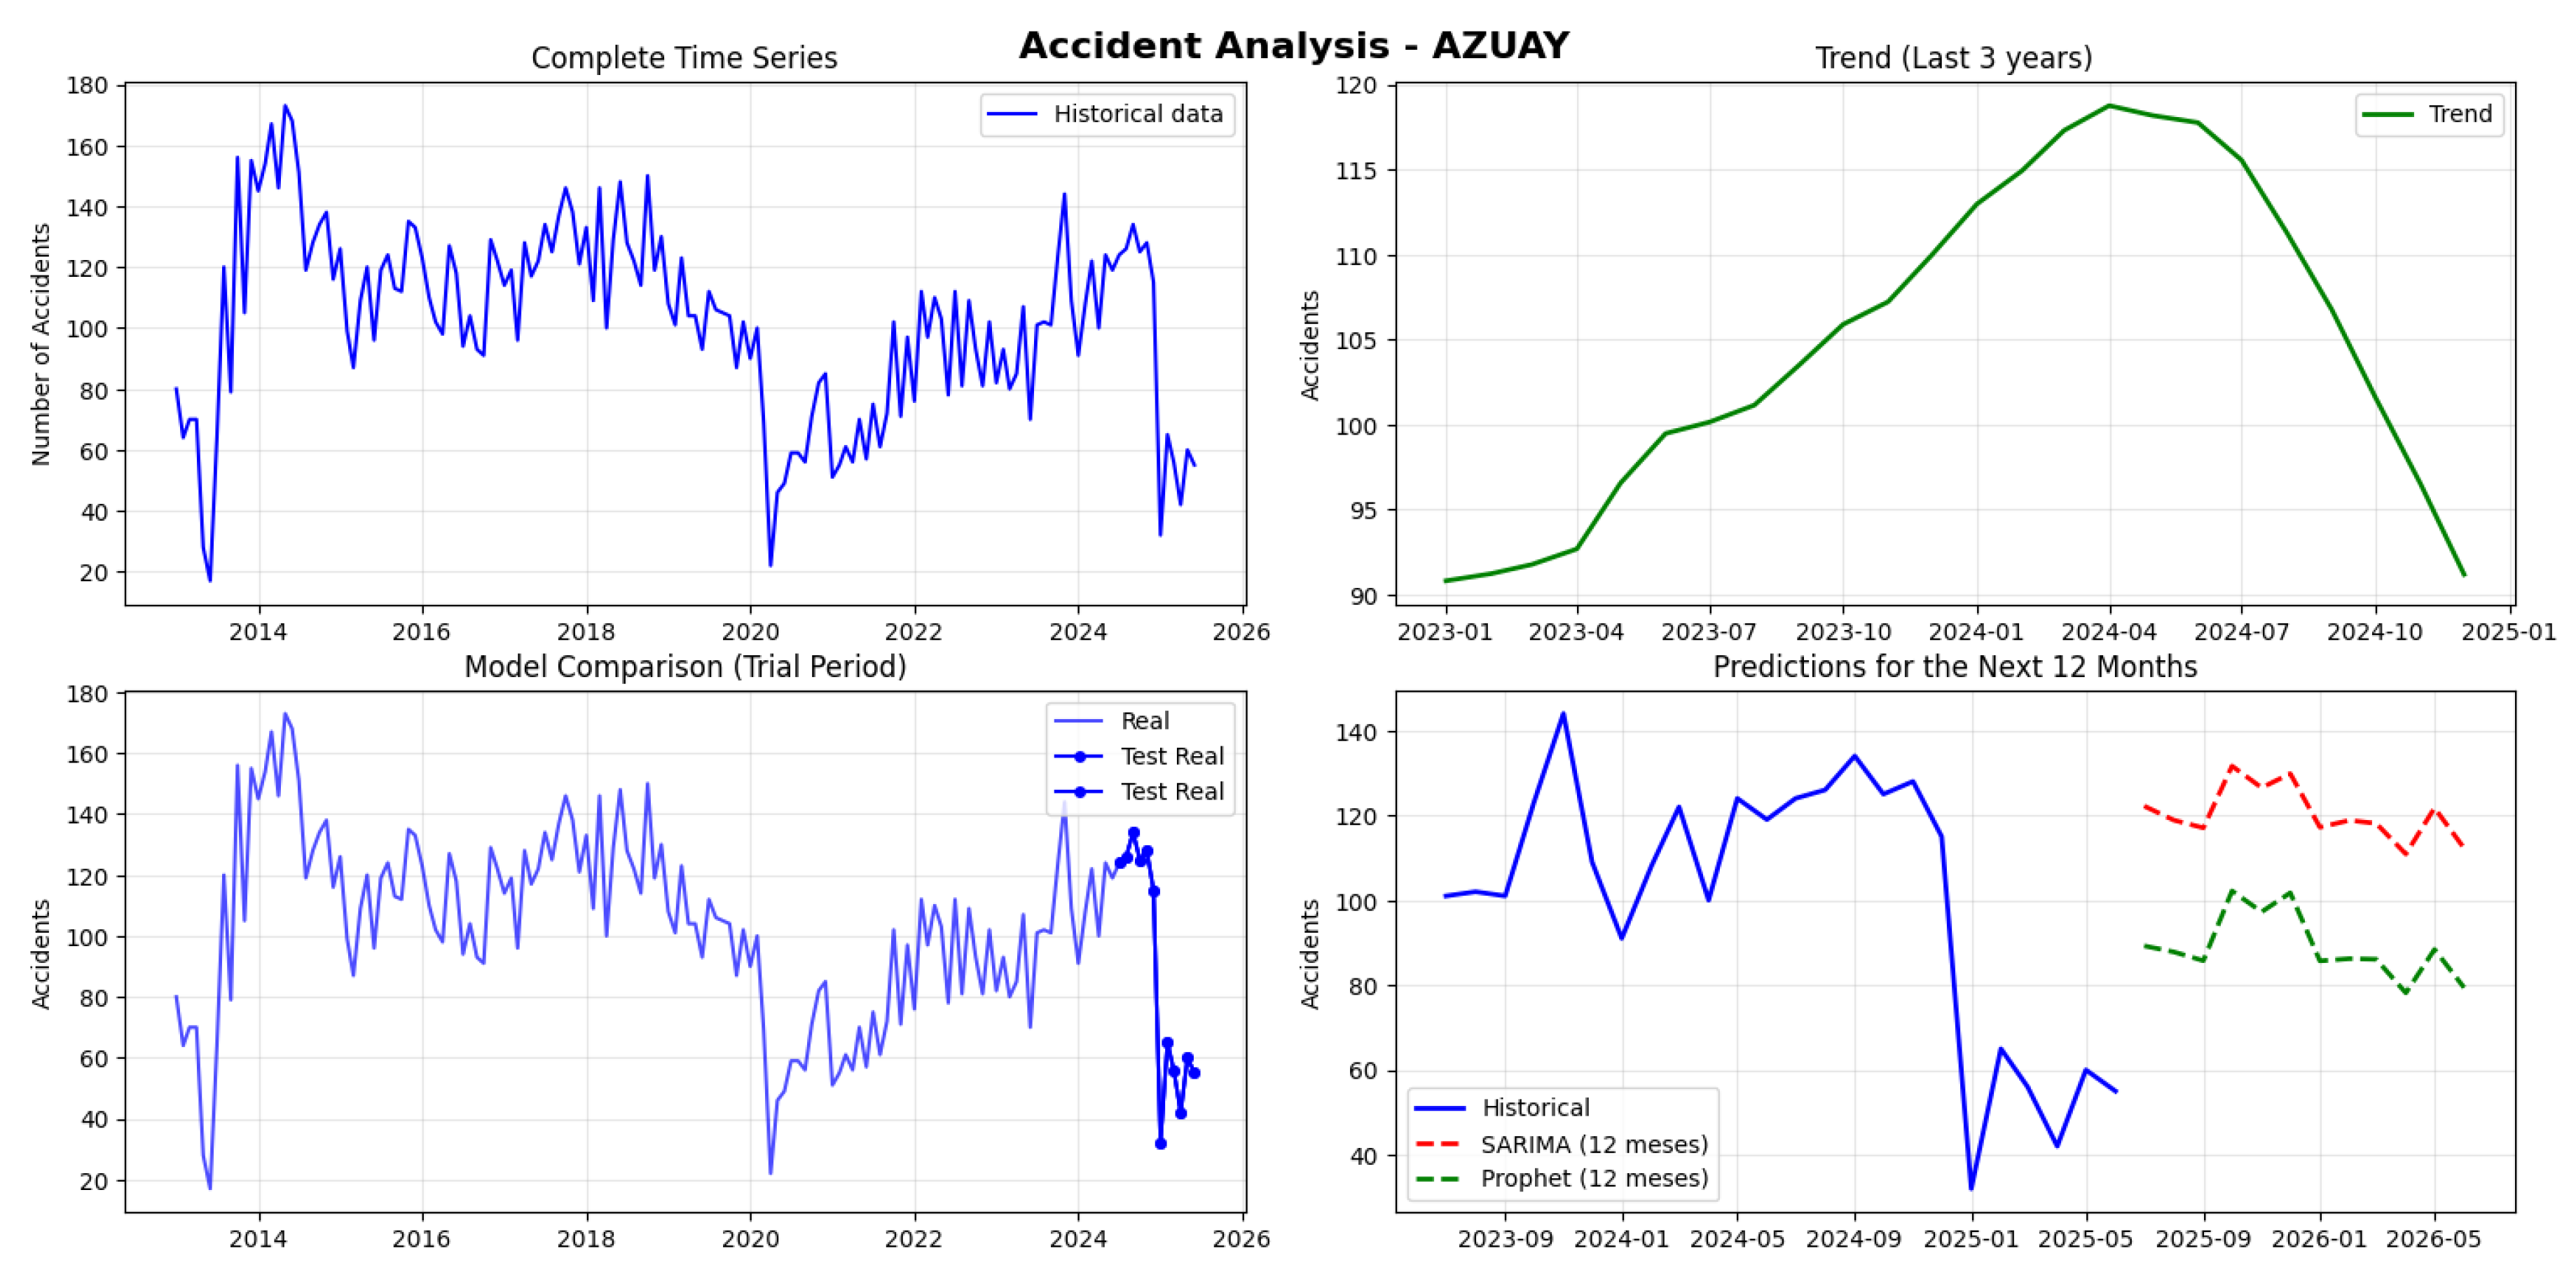
Figure 12.
Traffic Accident Forecasting and Temporal Trends in Tungurahua Province)
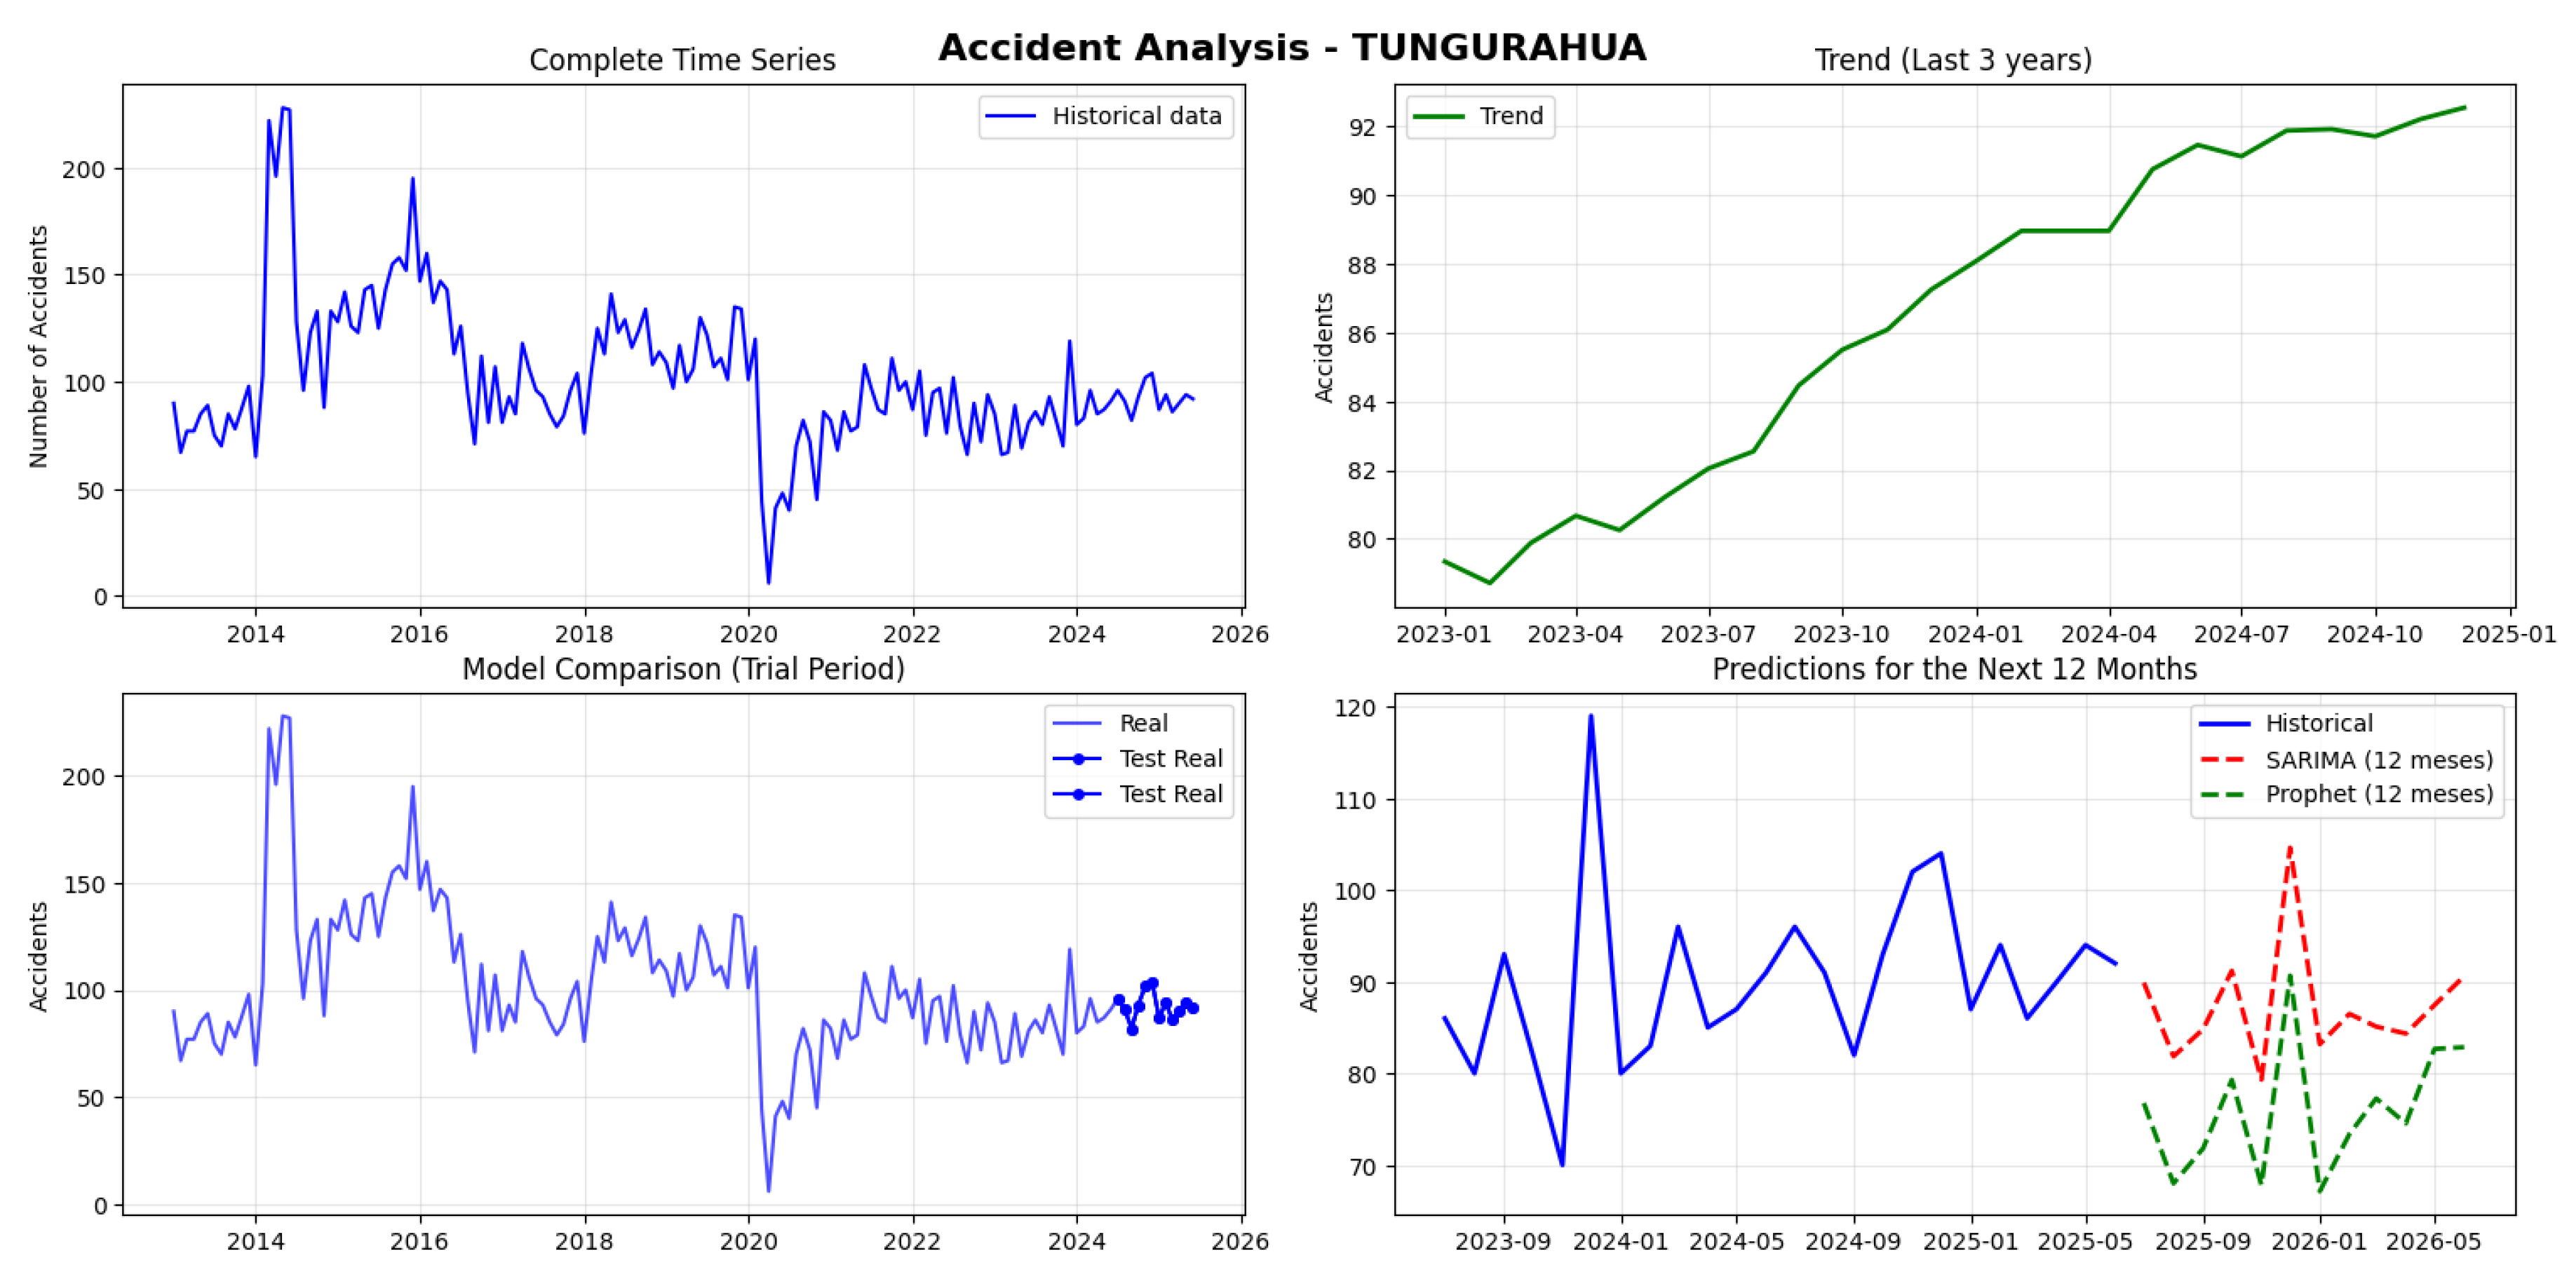
Figure 13.
Traffic Accident Forecasting and Temporal Trends in Imbabura Province)
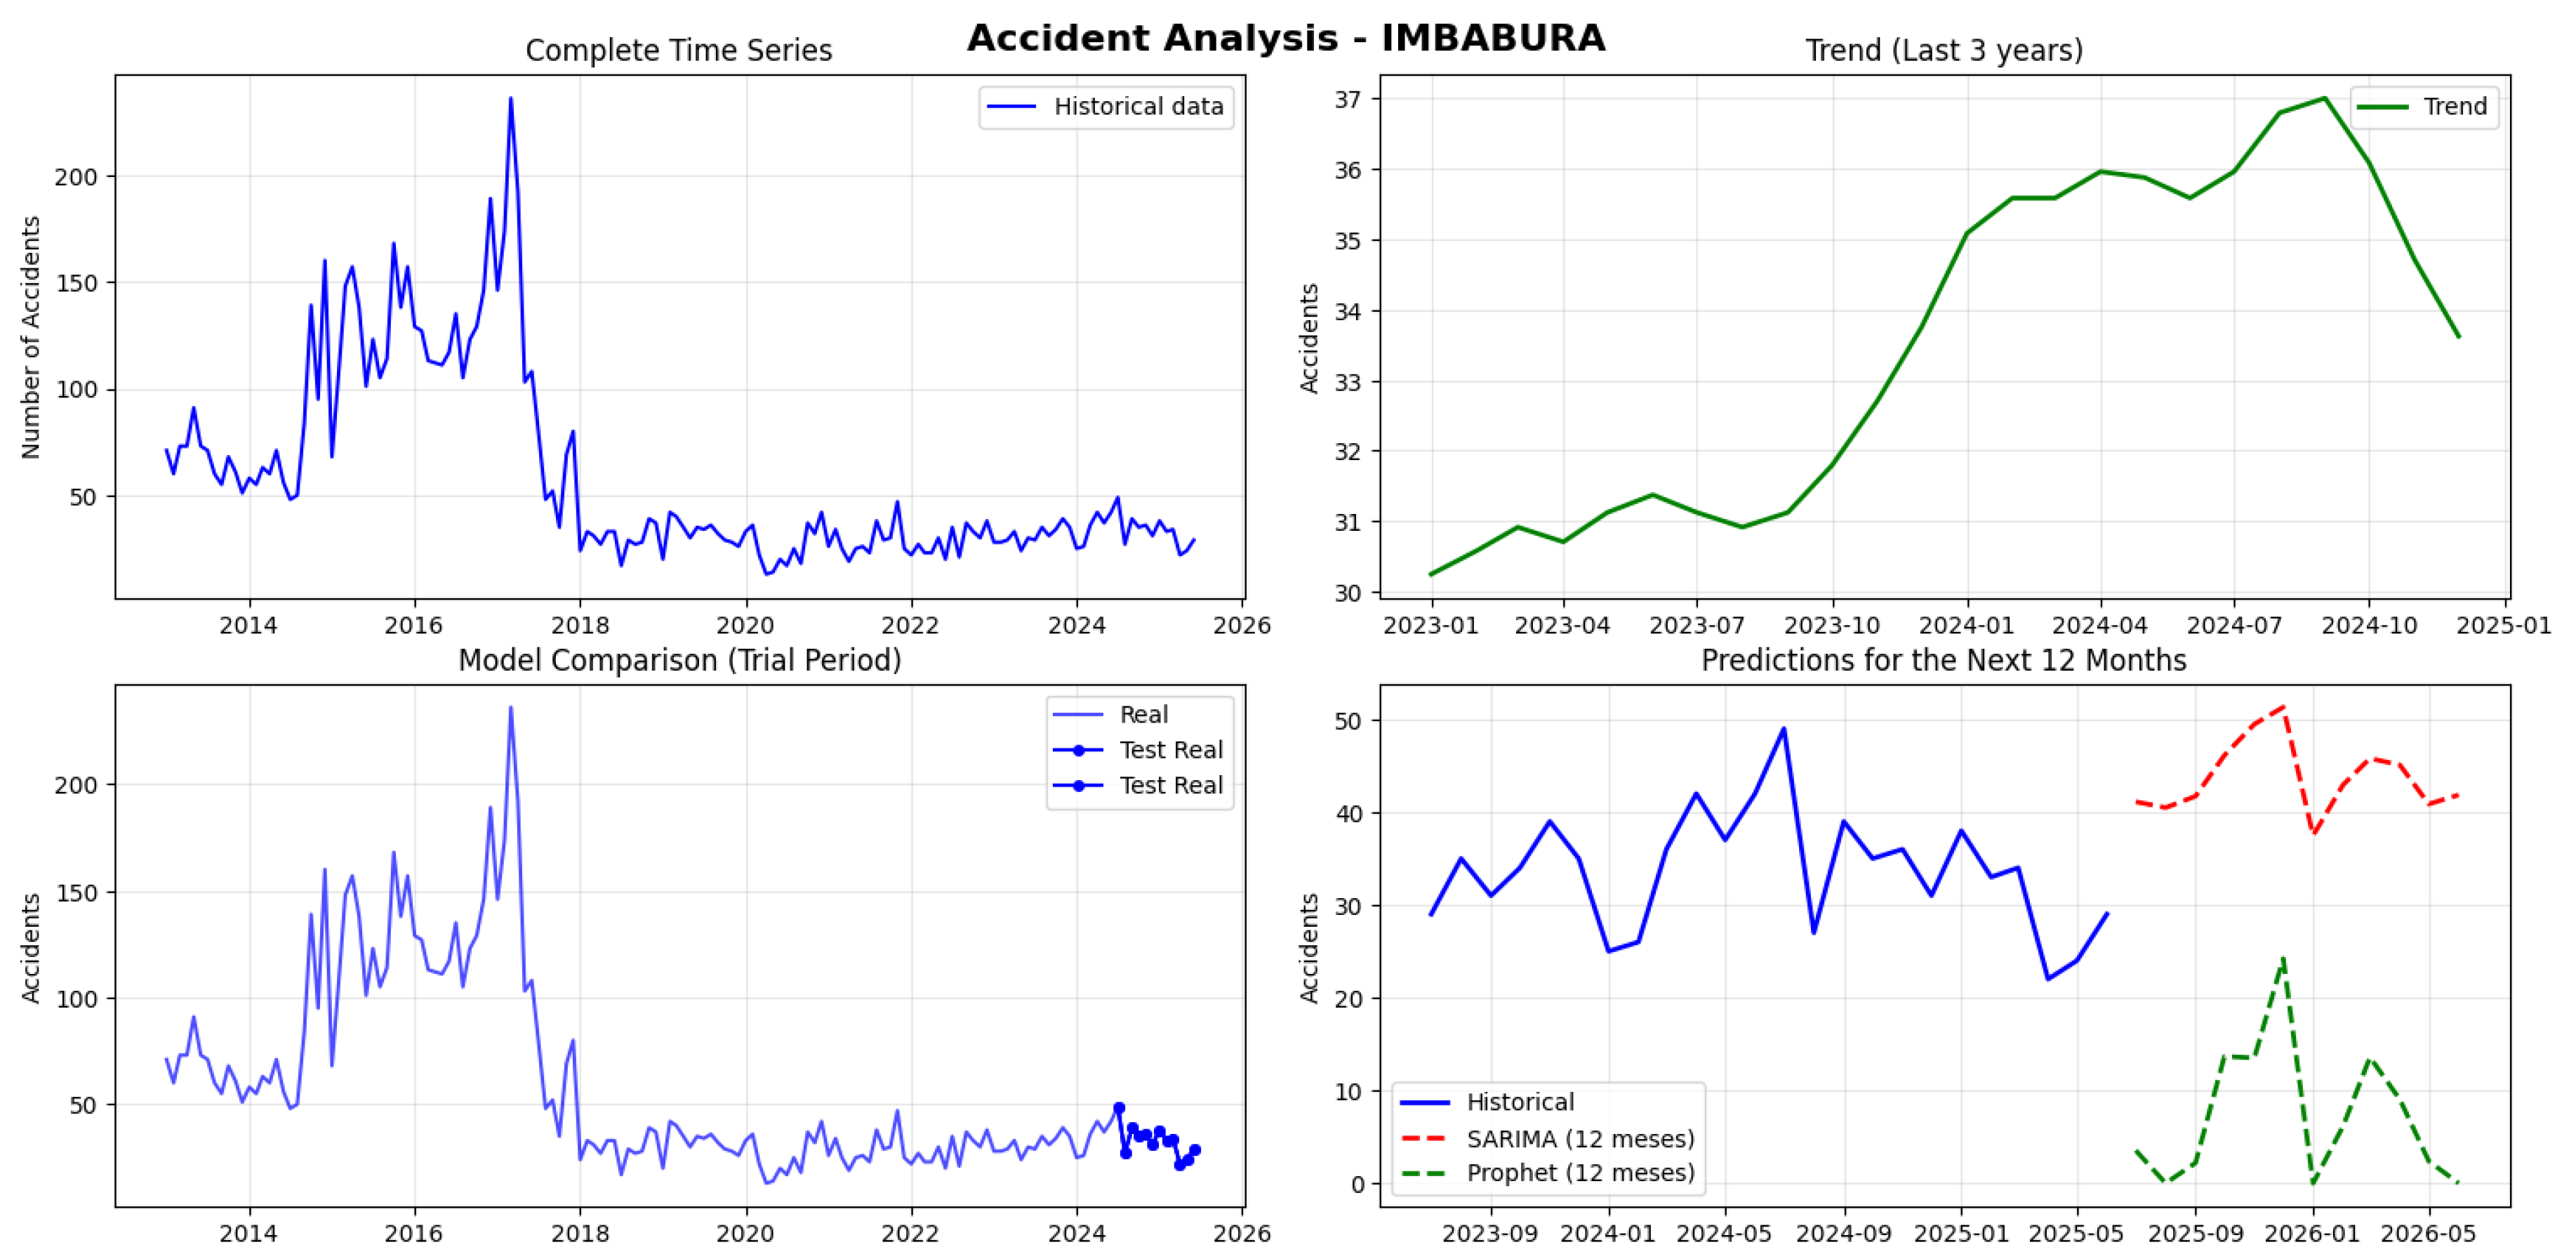
Figure 14.
Traffic Accident Forecasting and Temporal Trends in Loja Province)
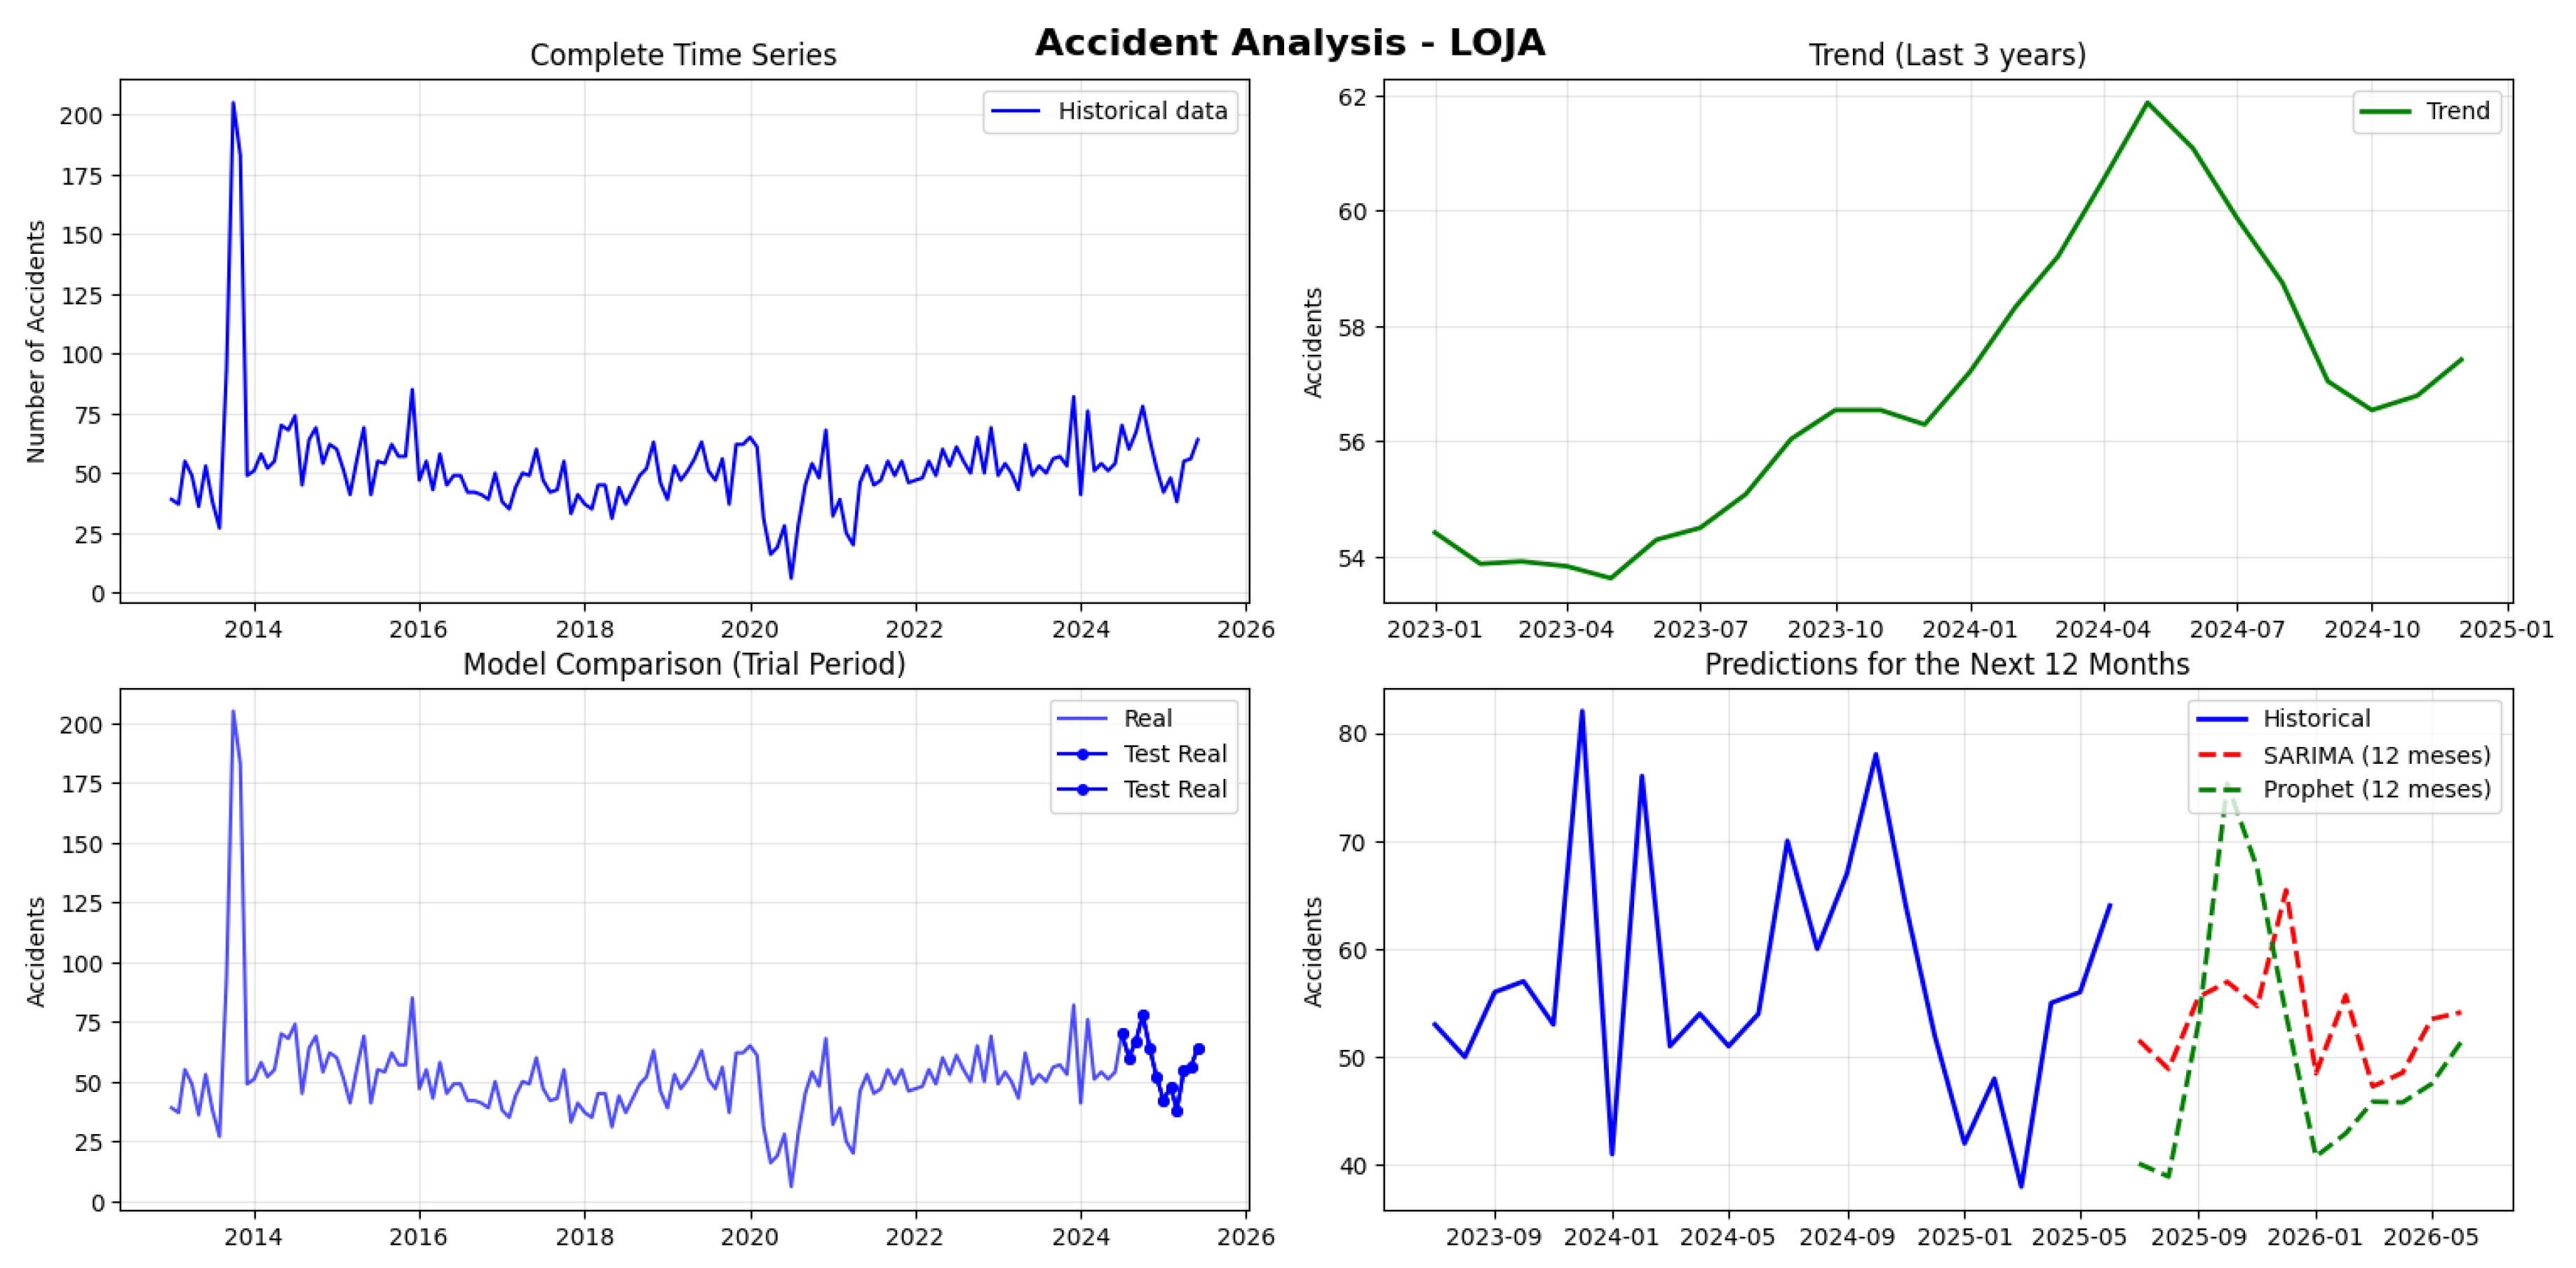
Figure 15.
Traffic Accident Forecasting and Temporal Trends in Chimborazo Province)
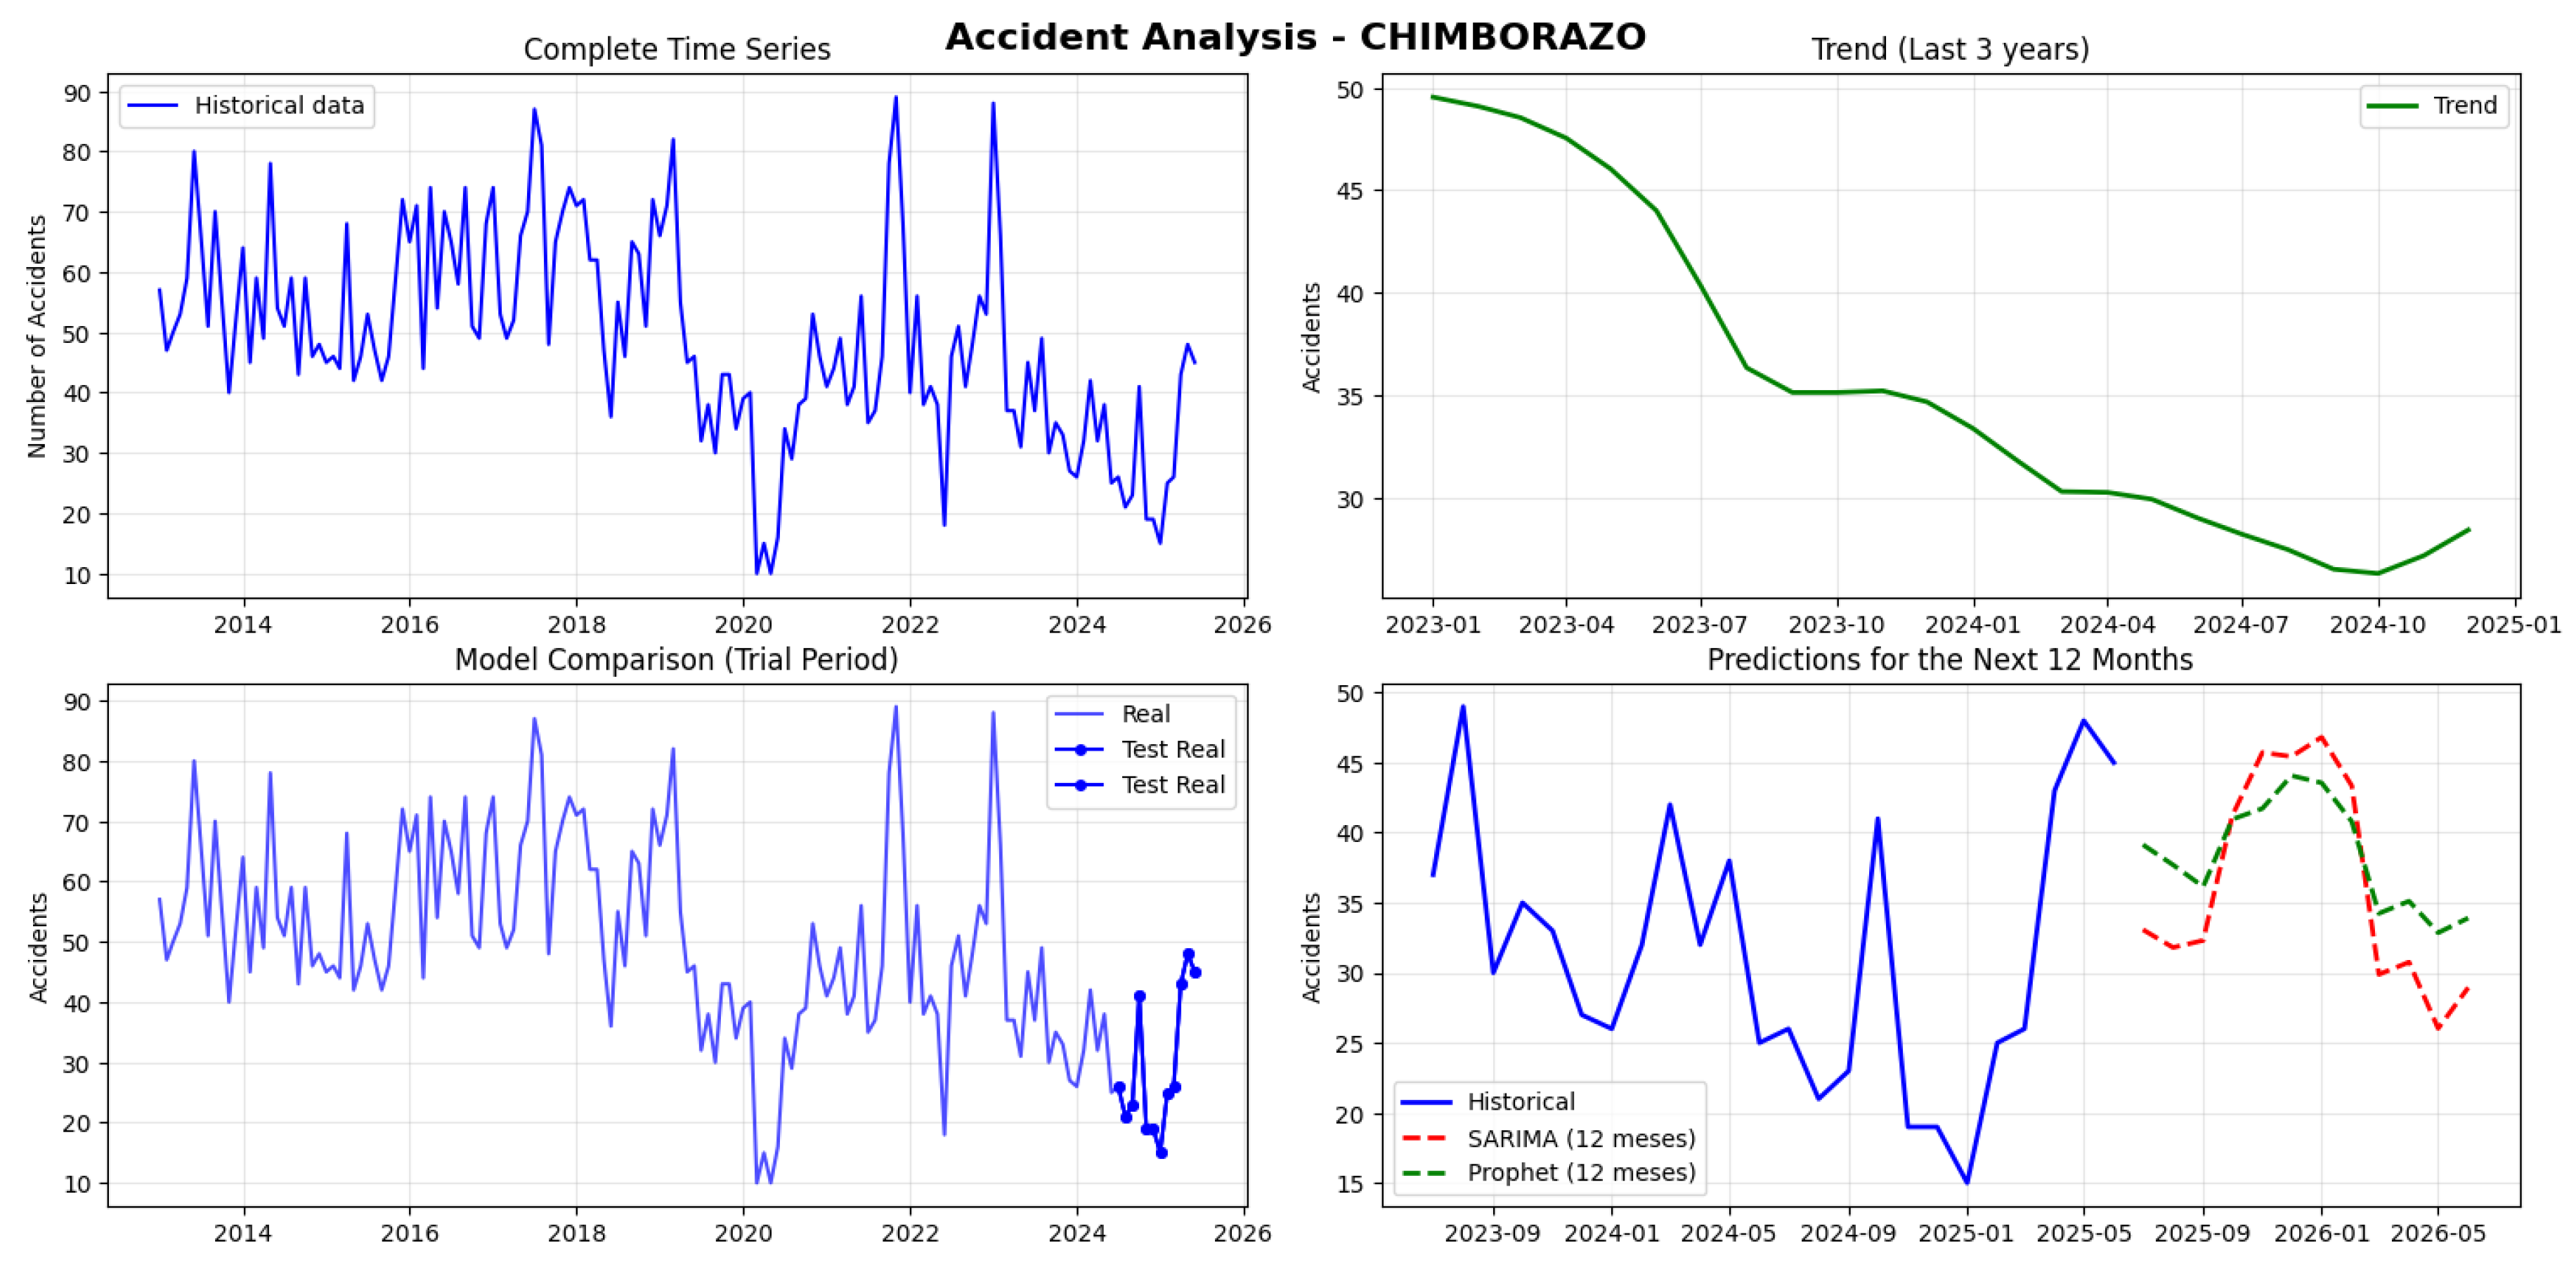
Figure 16.
Traffic Accident Forecasting and Temporal Trends in Cañar Province)
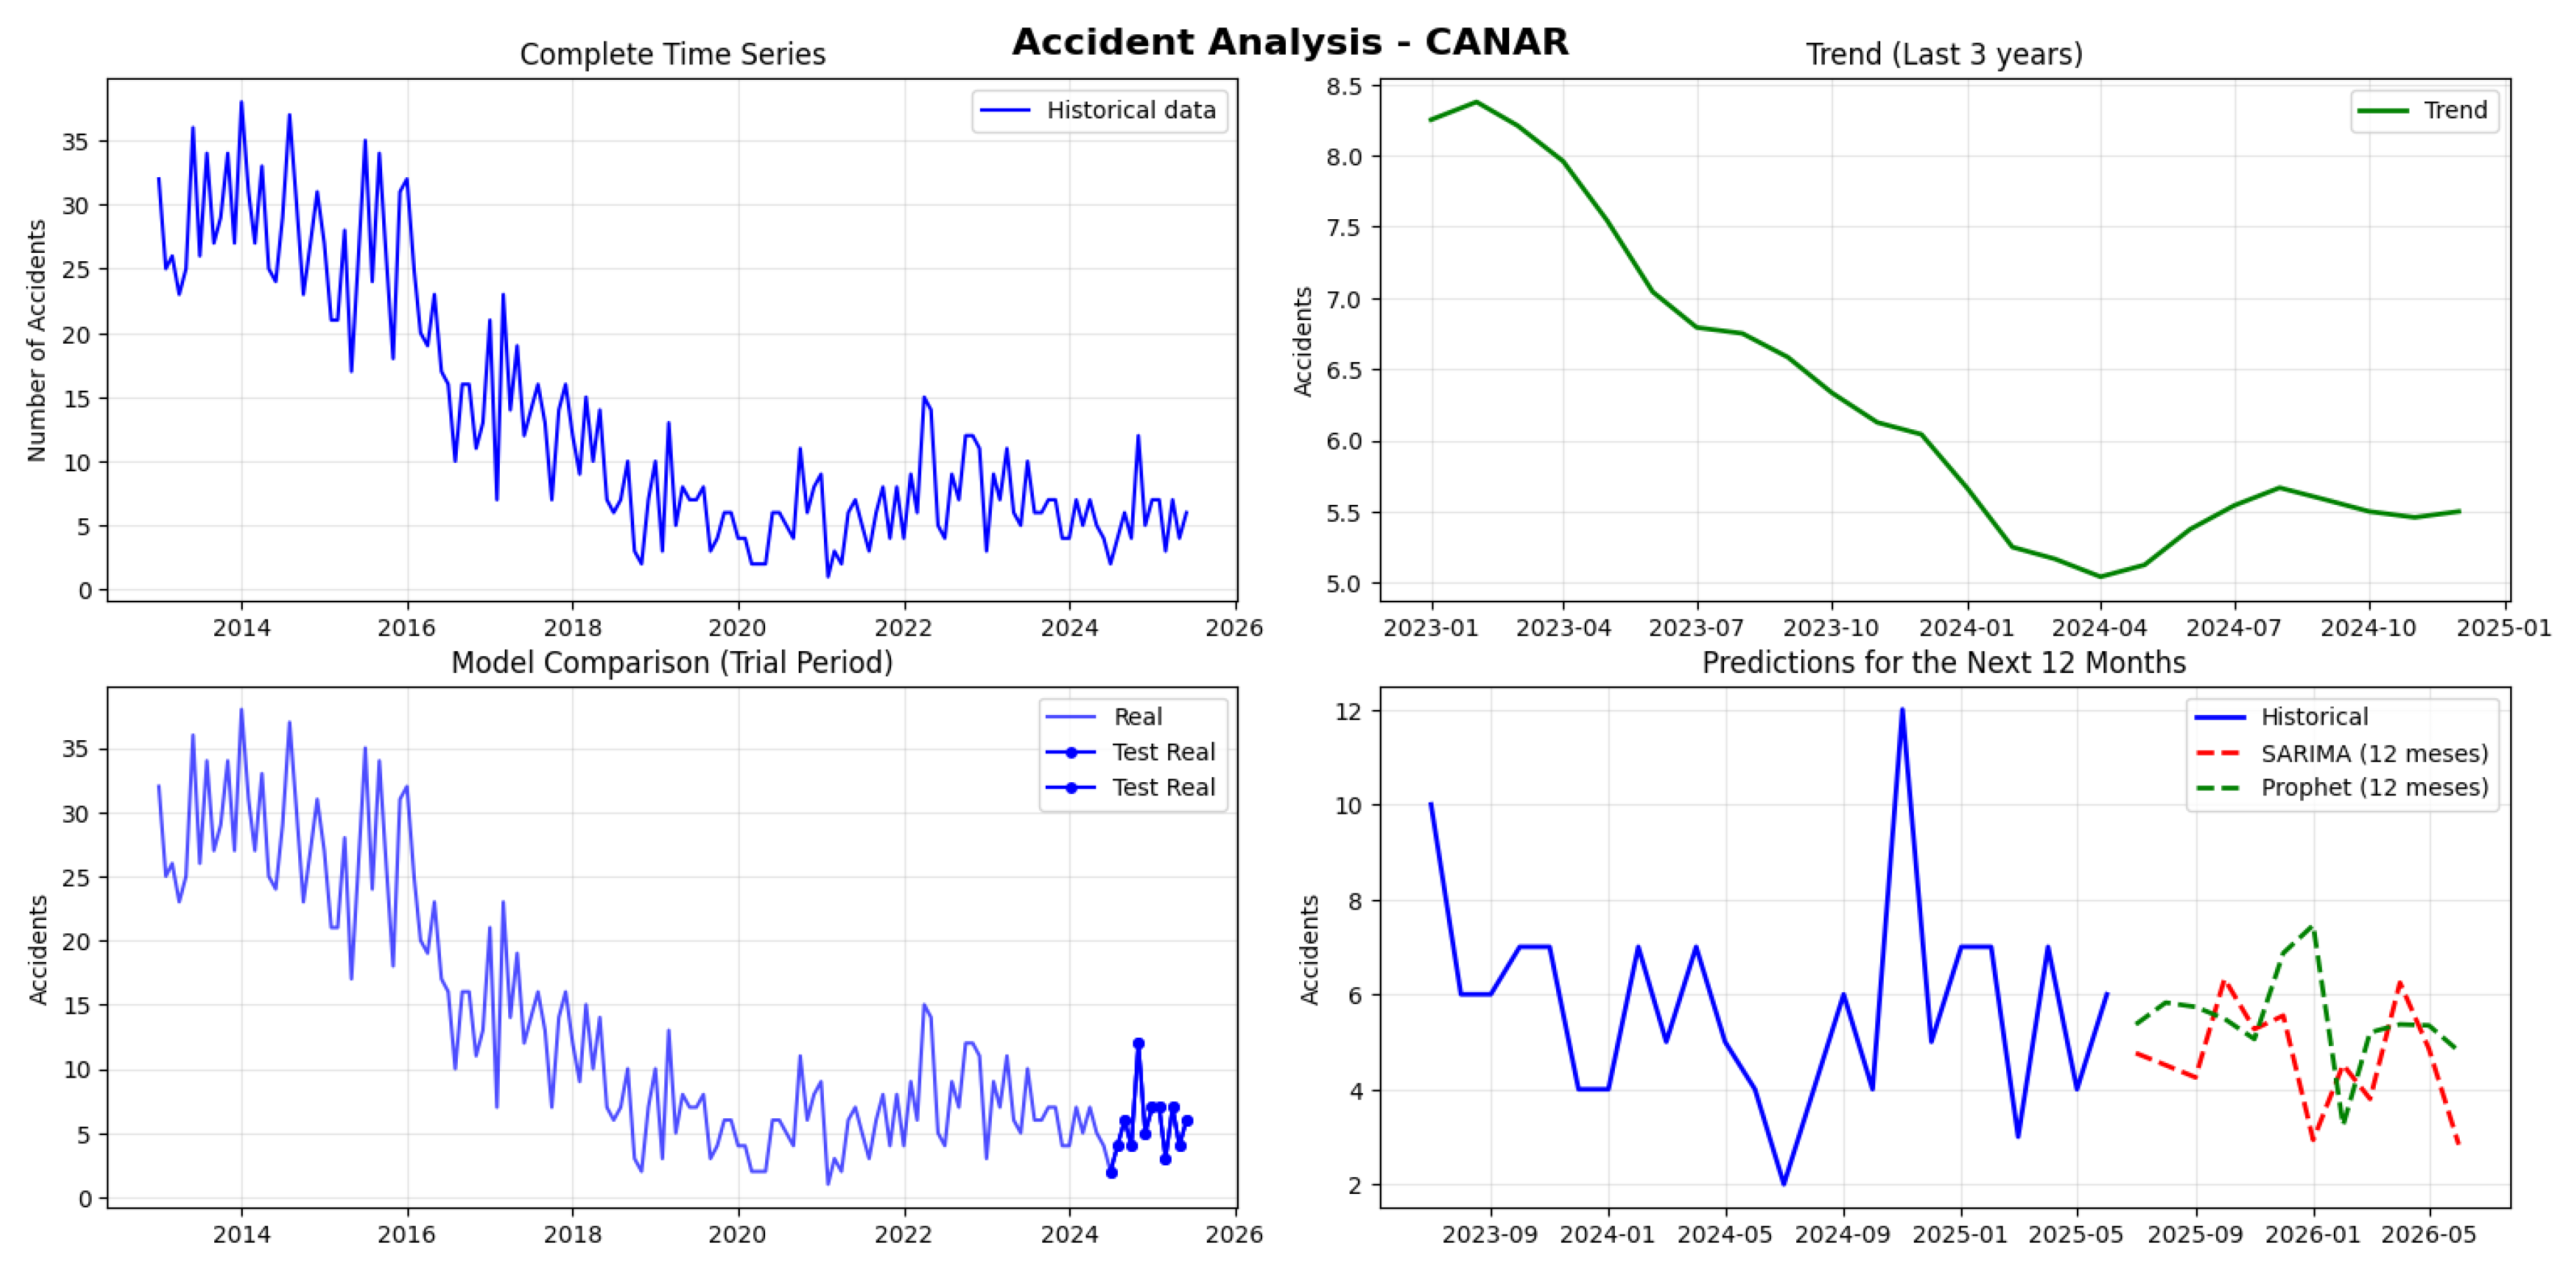
Figure 17.
Traffic Accident Forecasting and Temporal Trends in Cotopaxi Province)
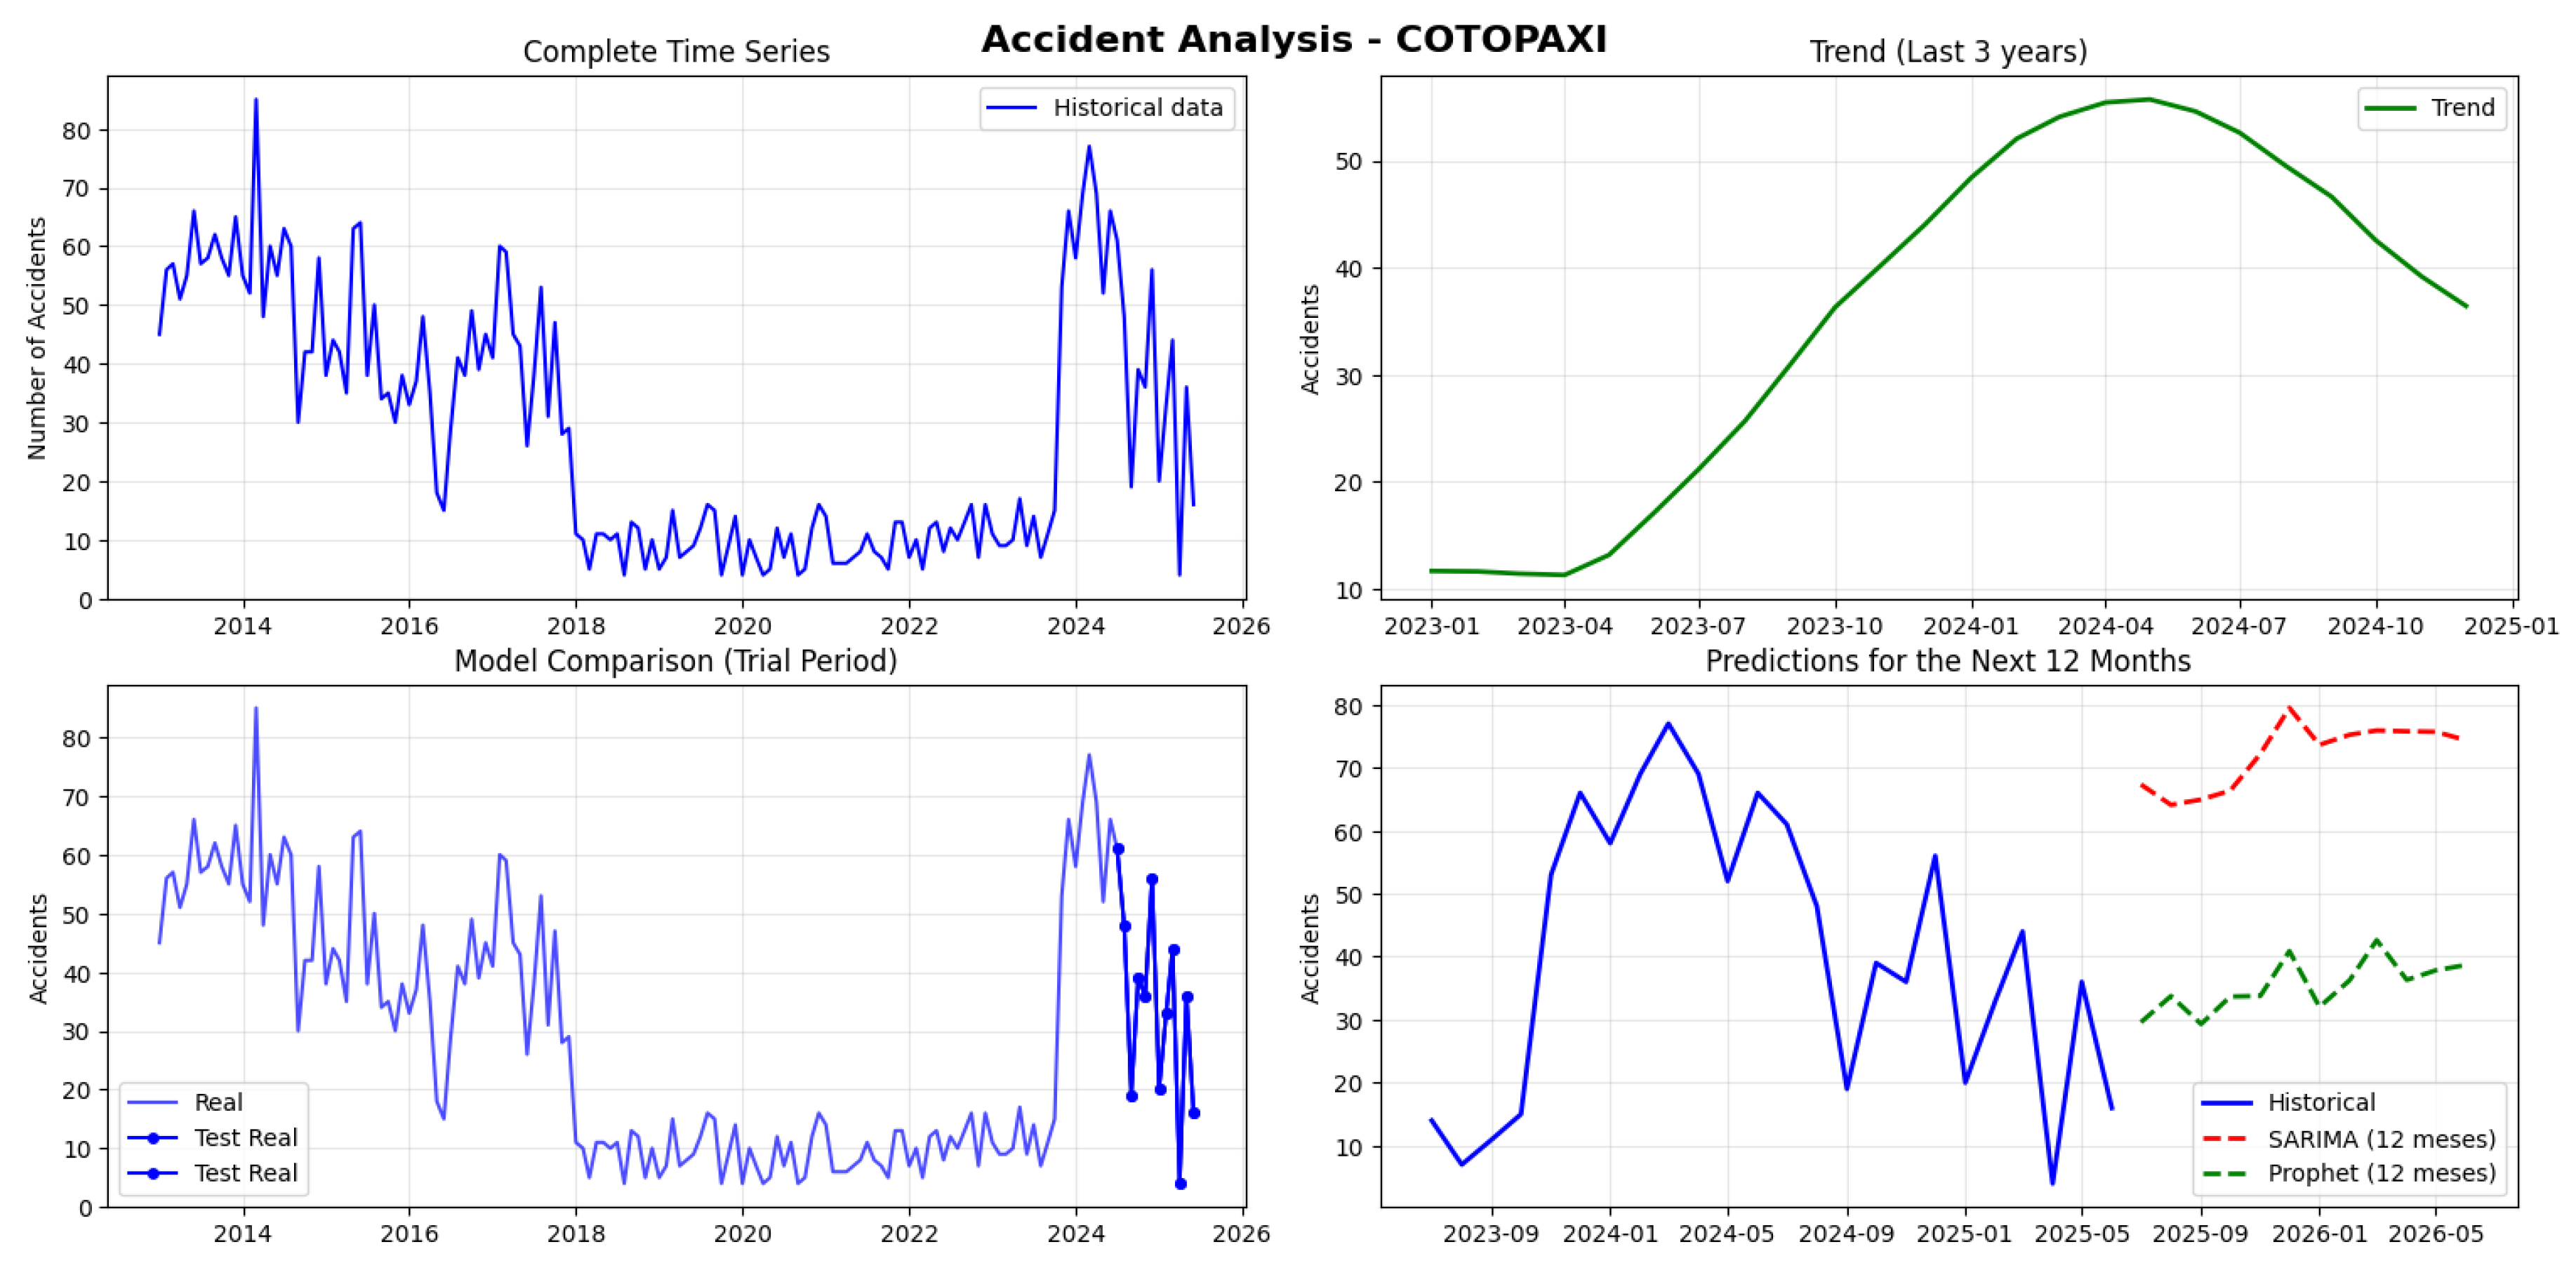
Figure 18.
Traffic Accident Forecasting and Temporal Trends in Bolivar Province)
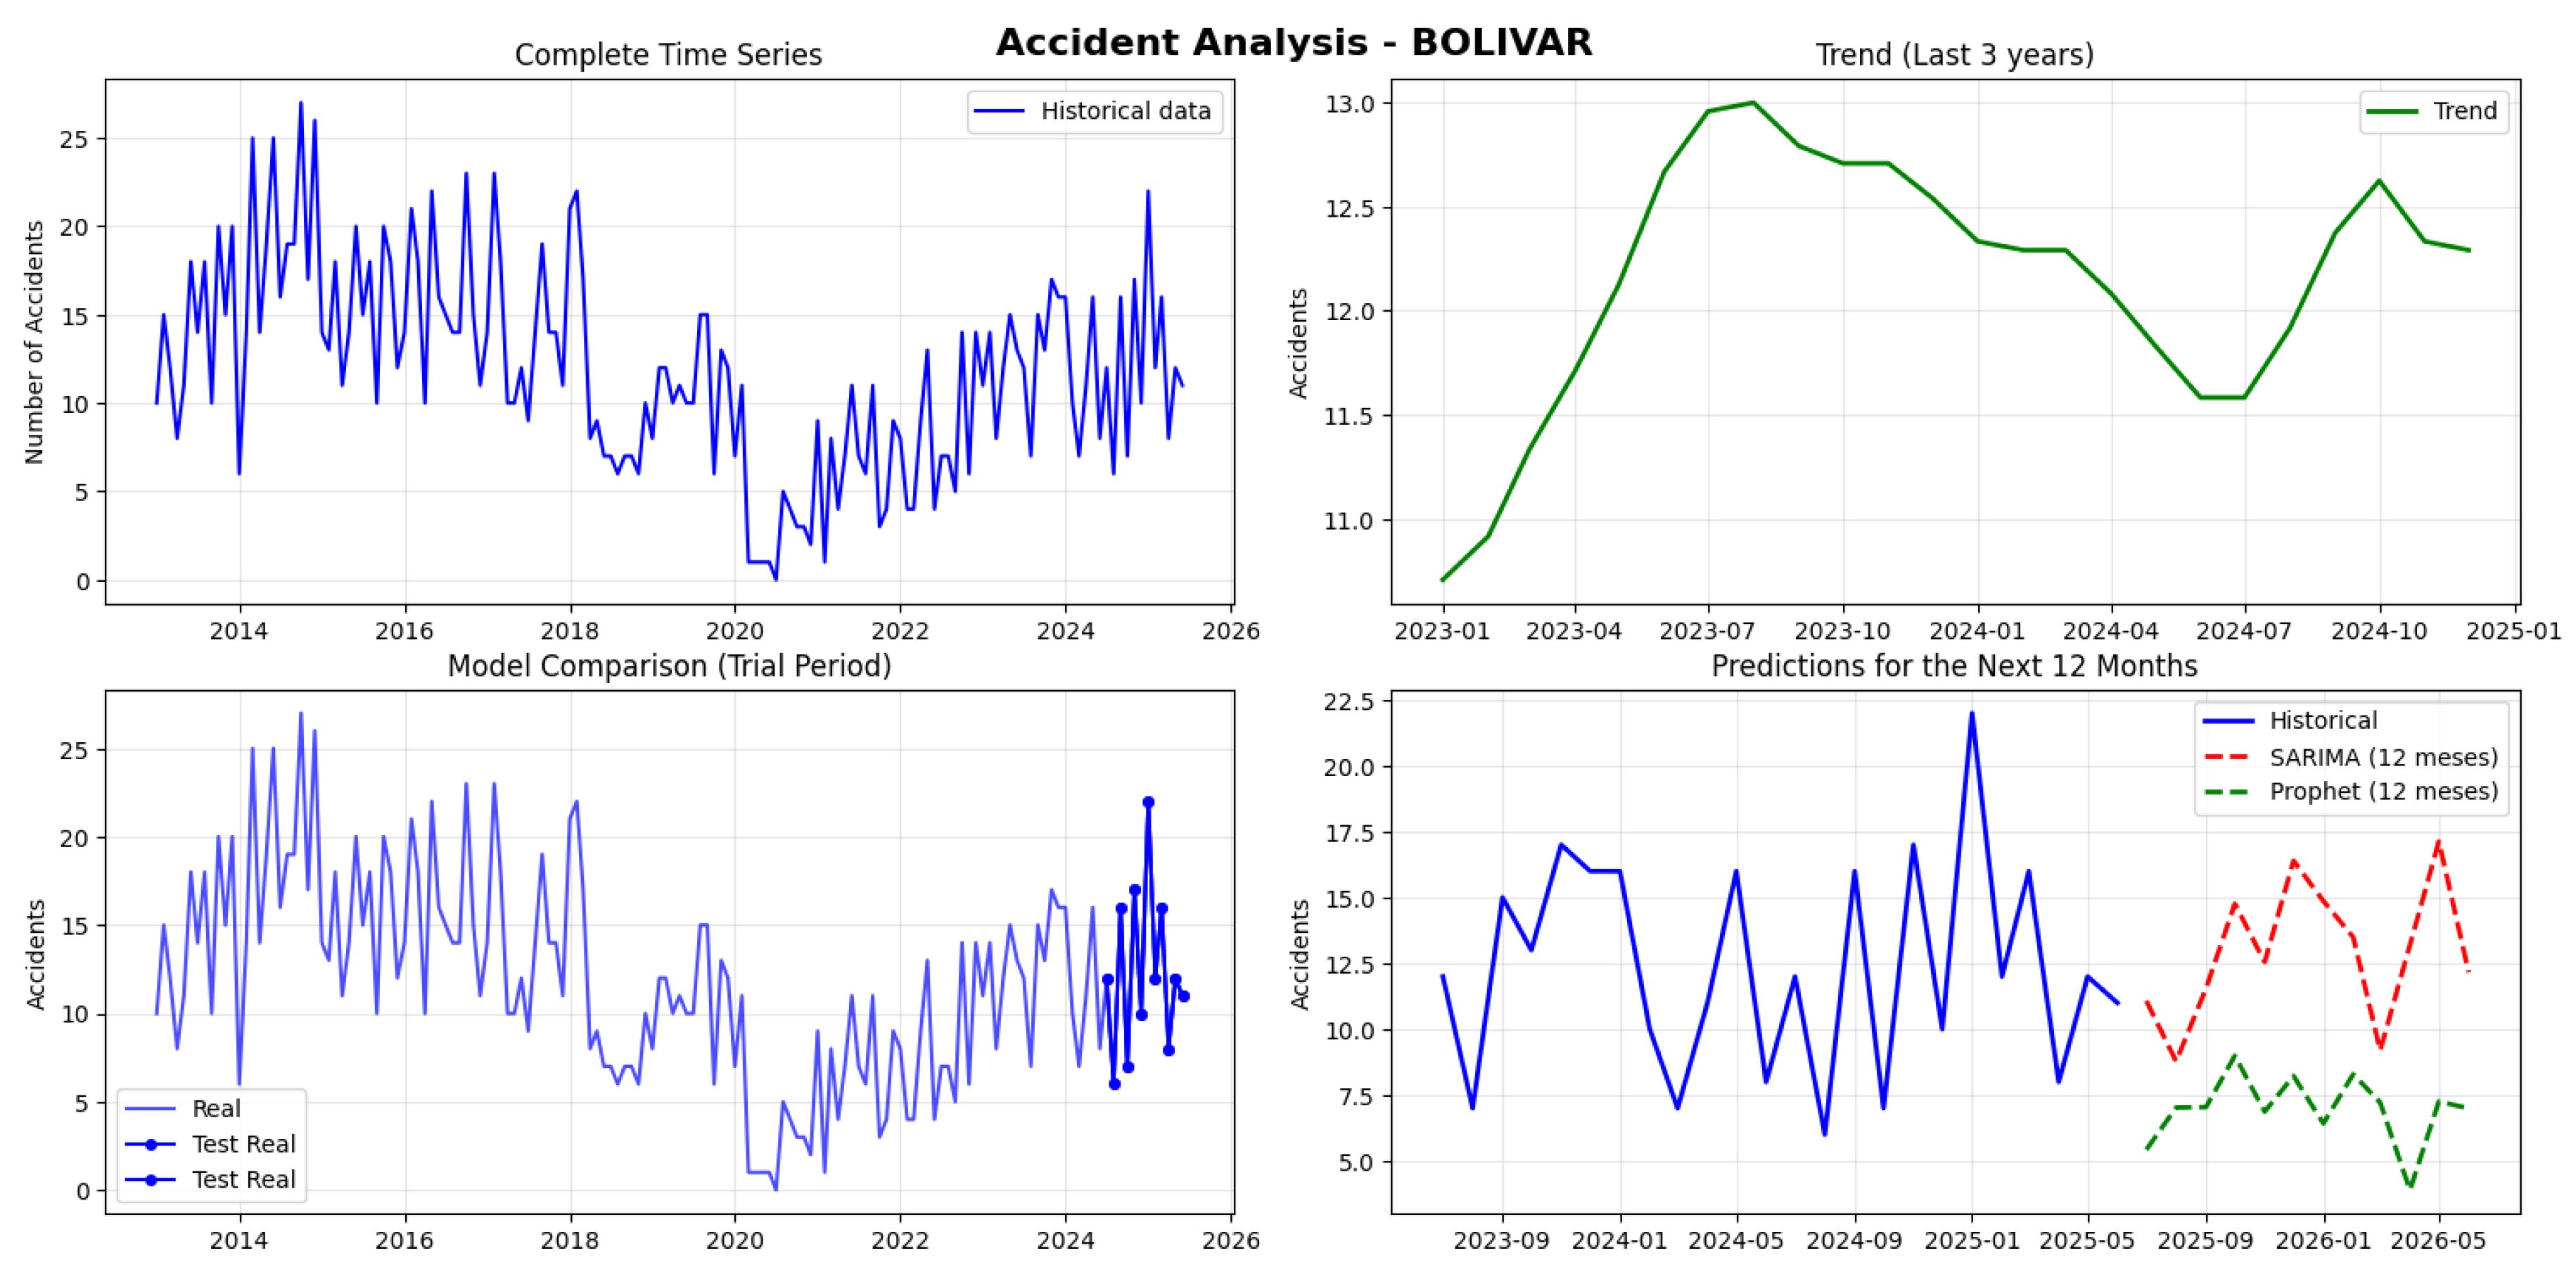
Figure 19.
Traffic Accident Forecasting and Temporal Trends in Carchi Province
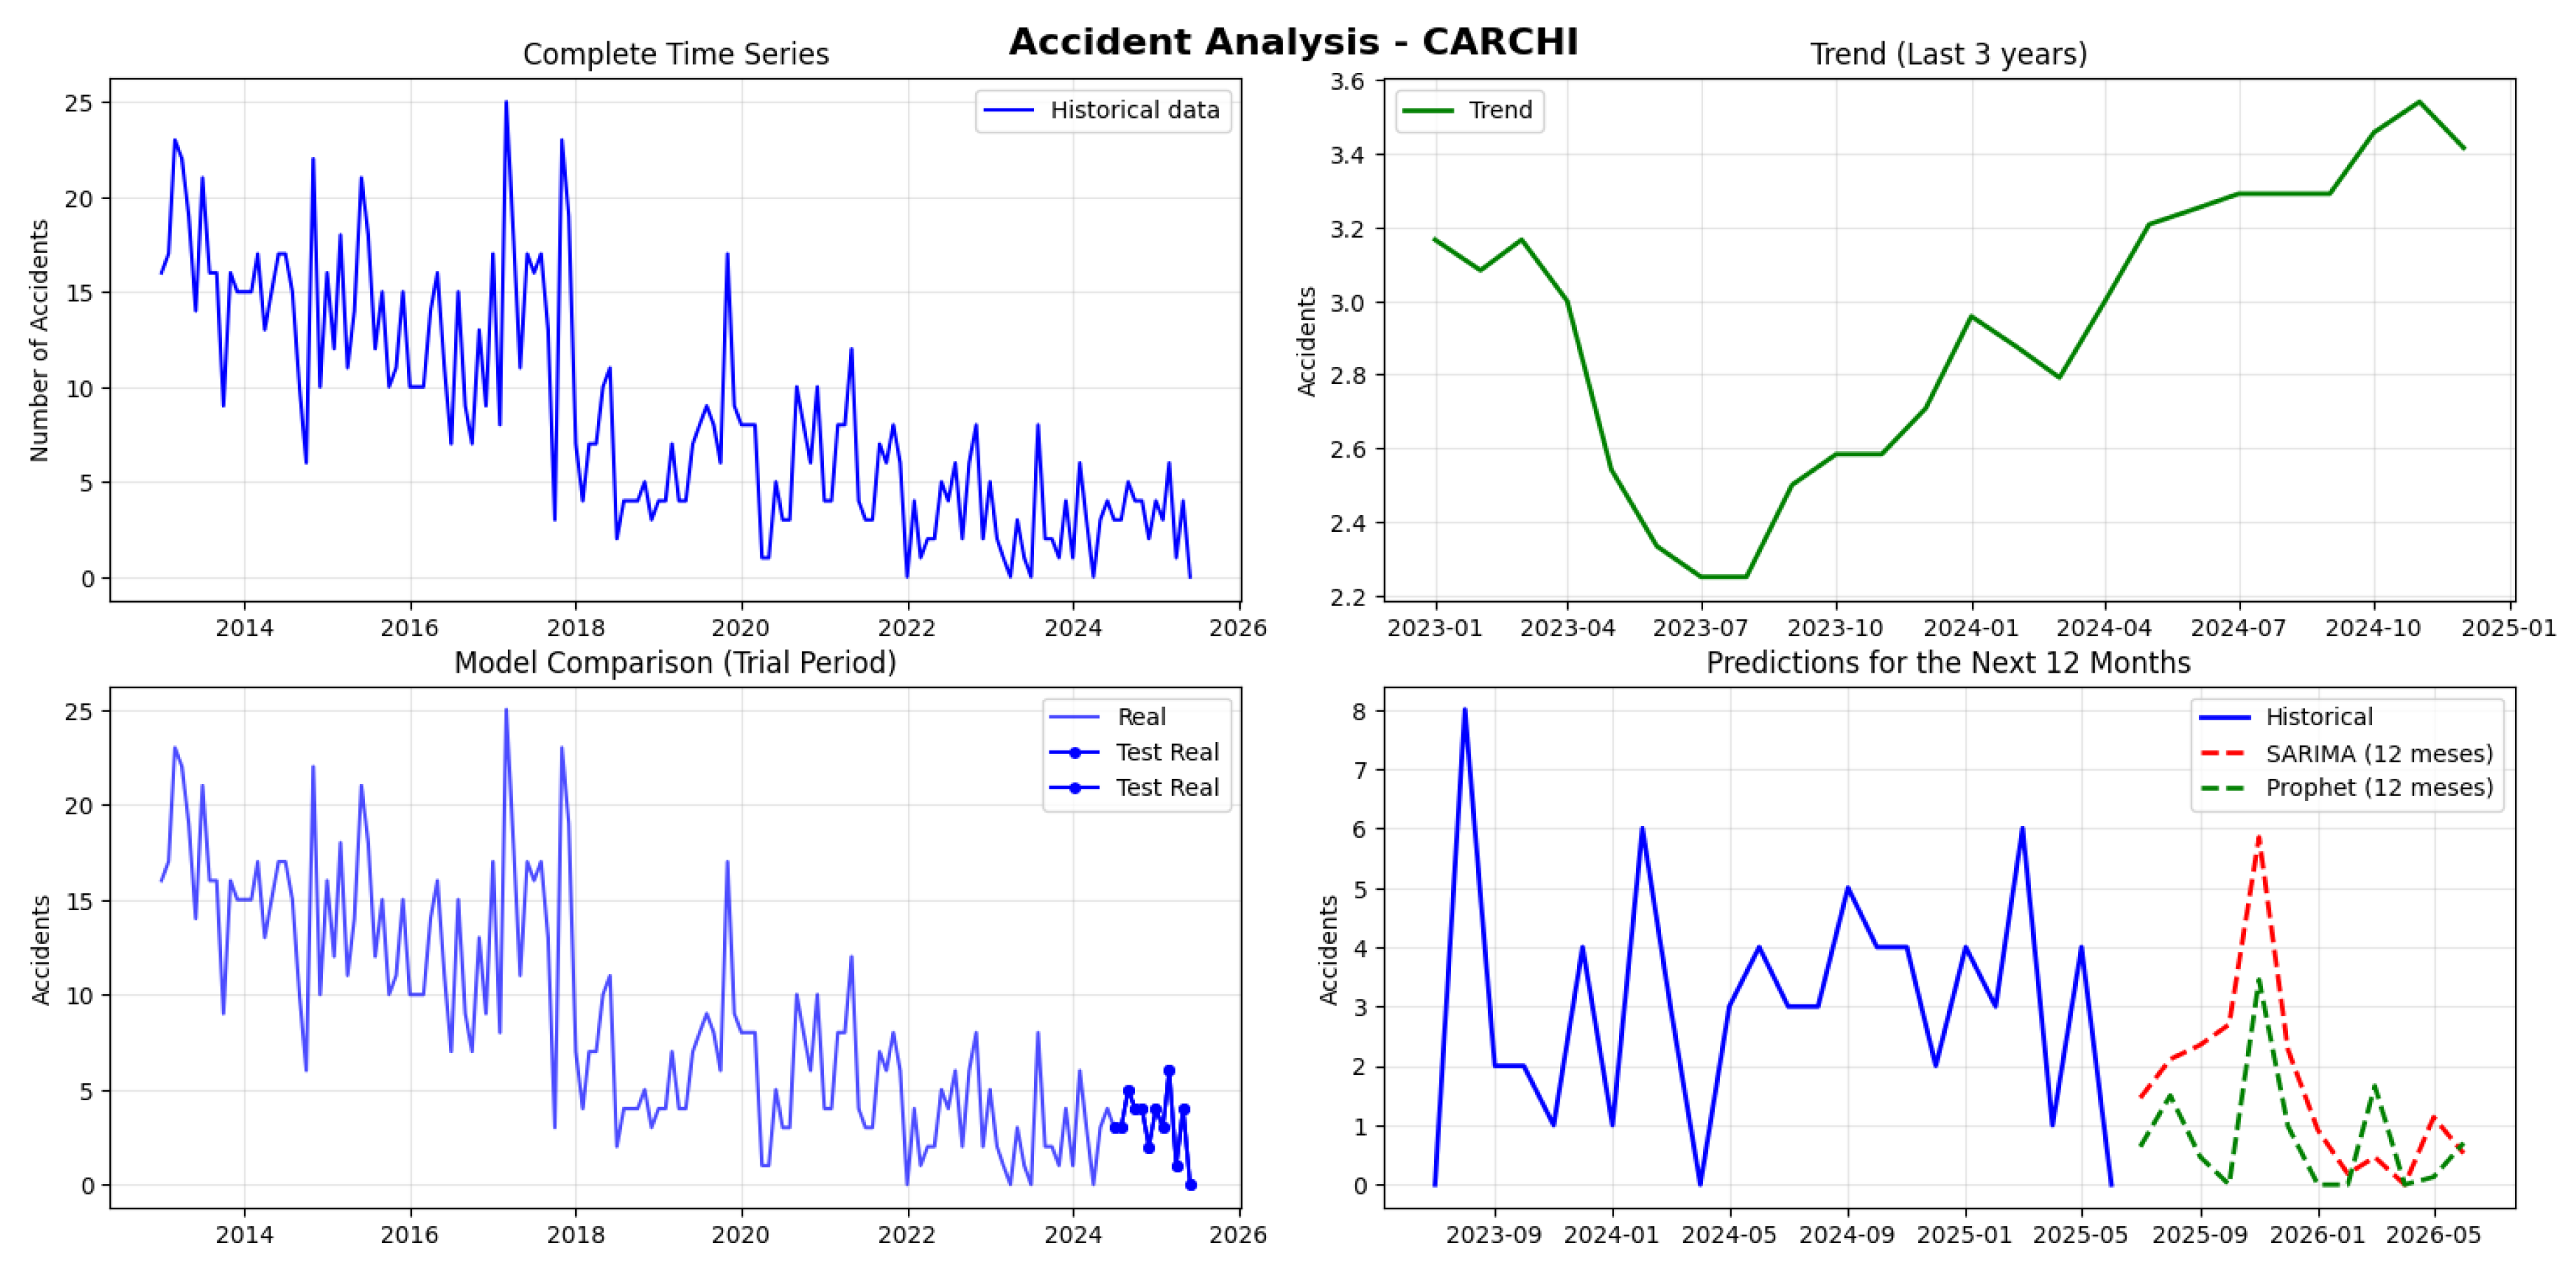
Figure 20.
Traffic Accident Forecasting and Temporal Trends in Morona Santiago Province
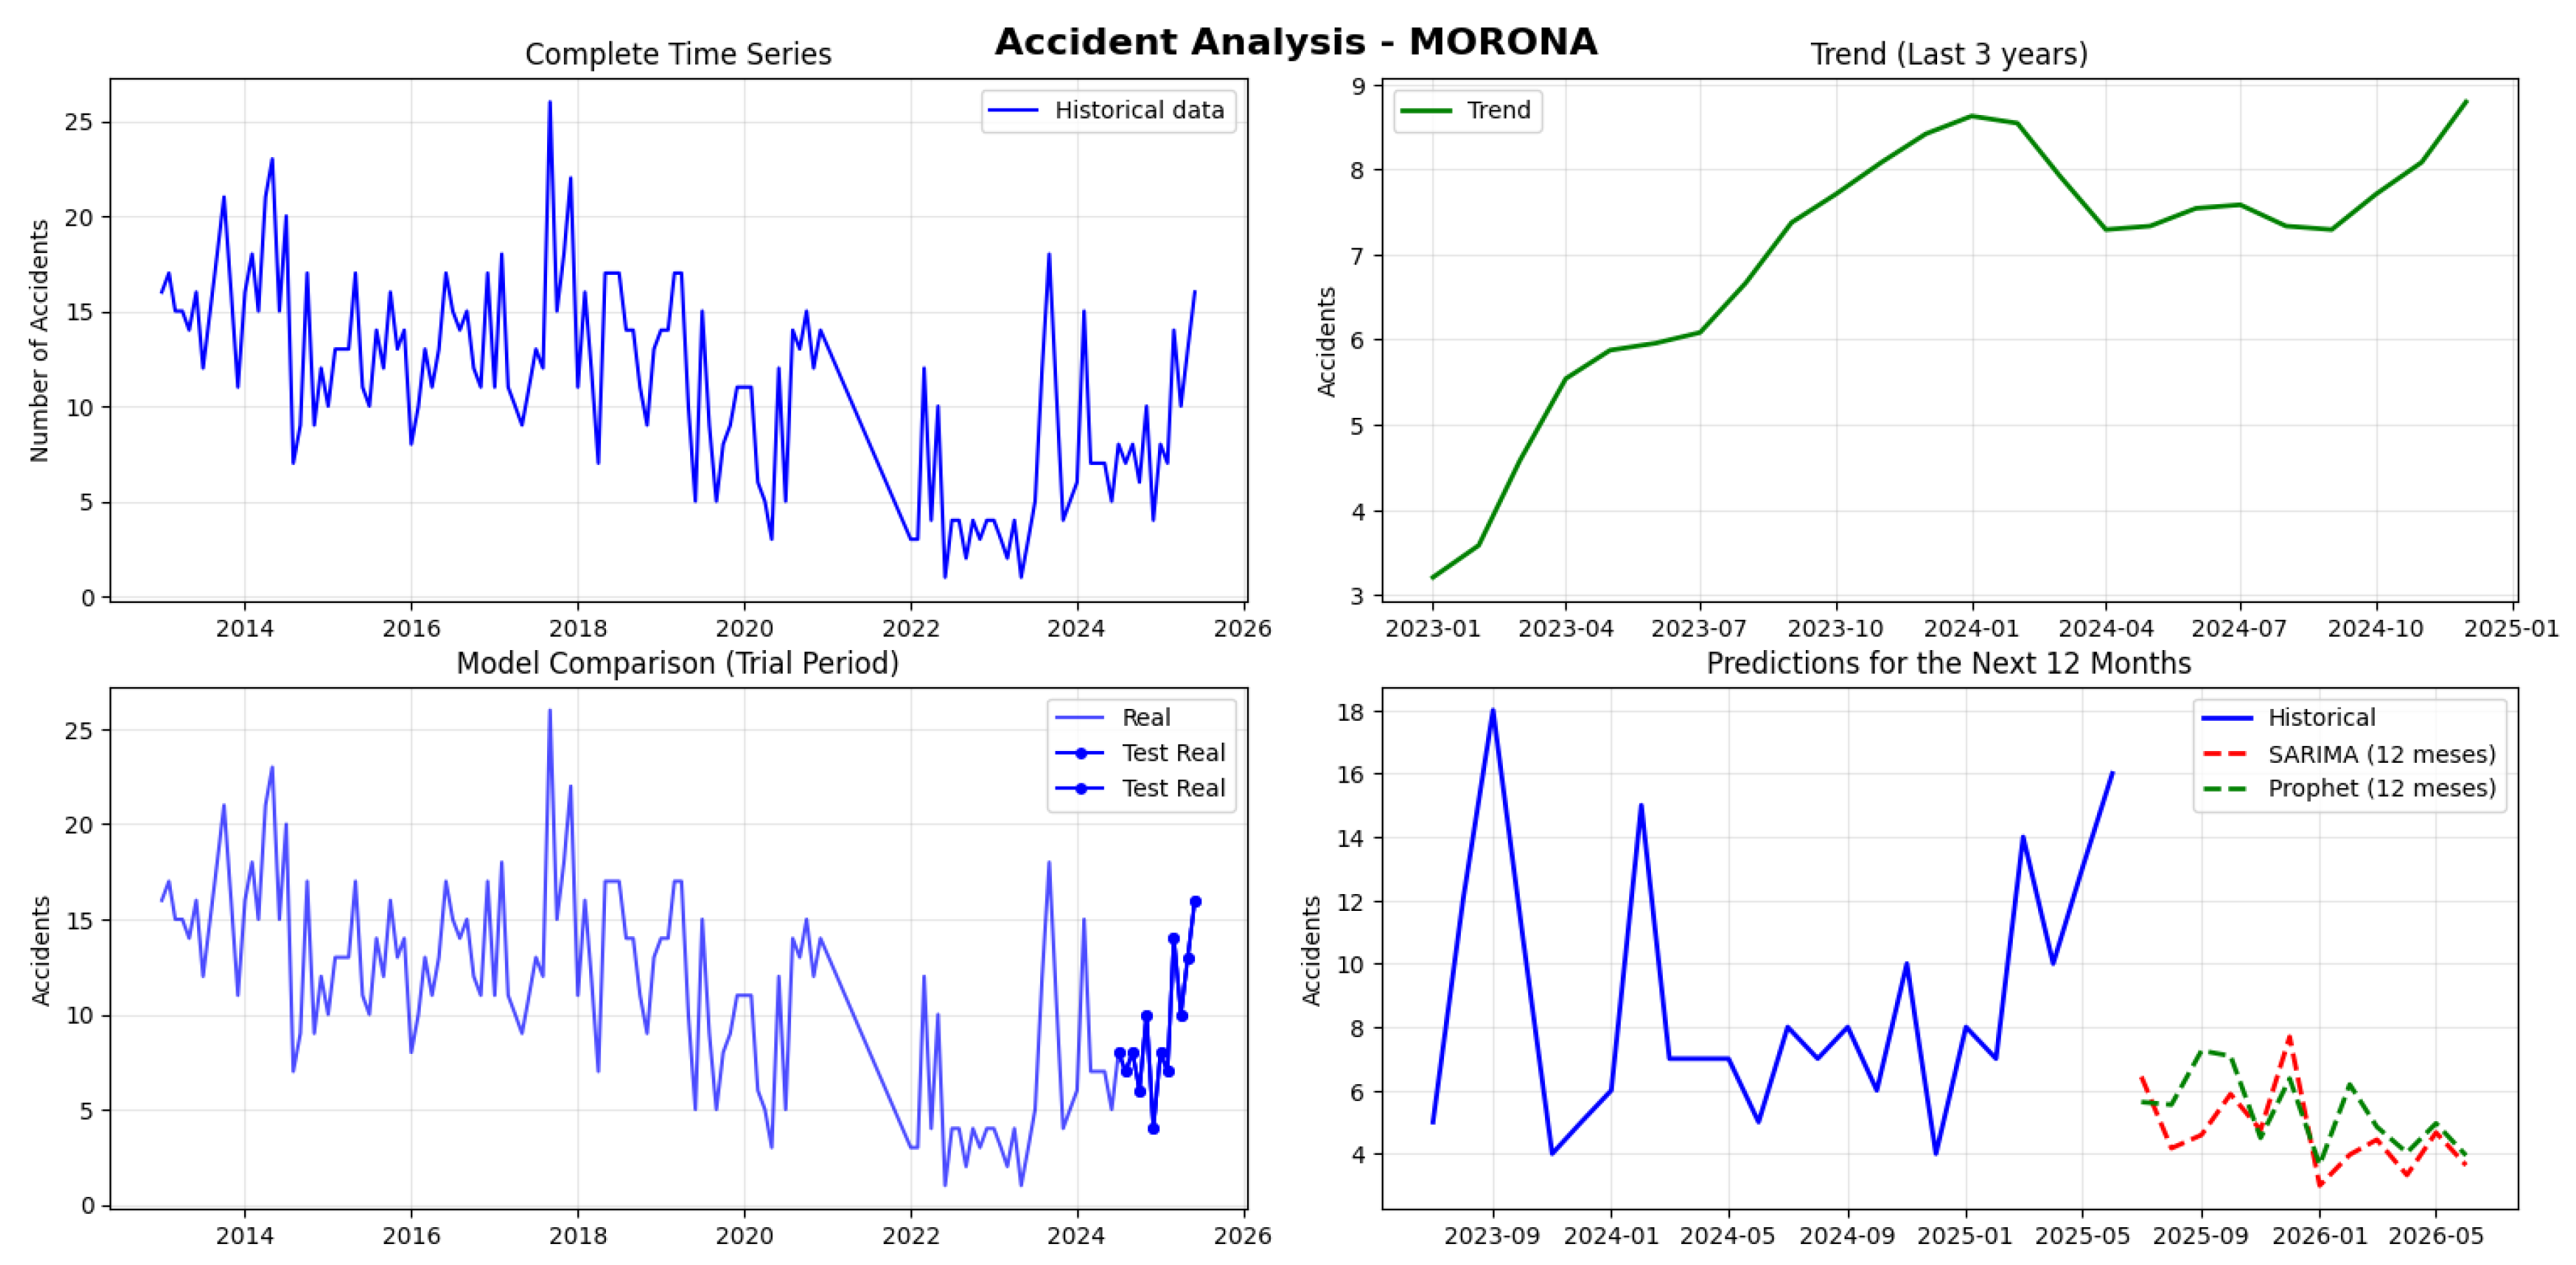
Figure 21.
Traffic Accident Forecasting and Temporal Trends in Orellana Santiago Province
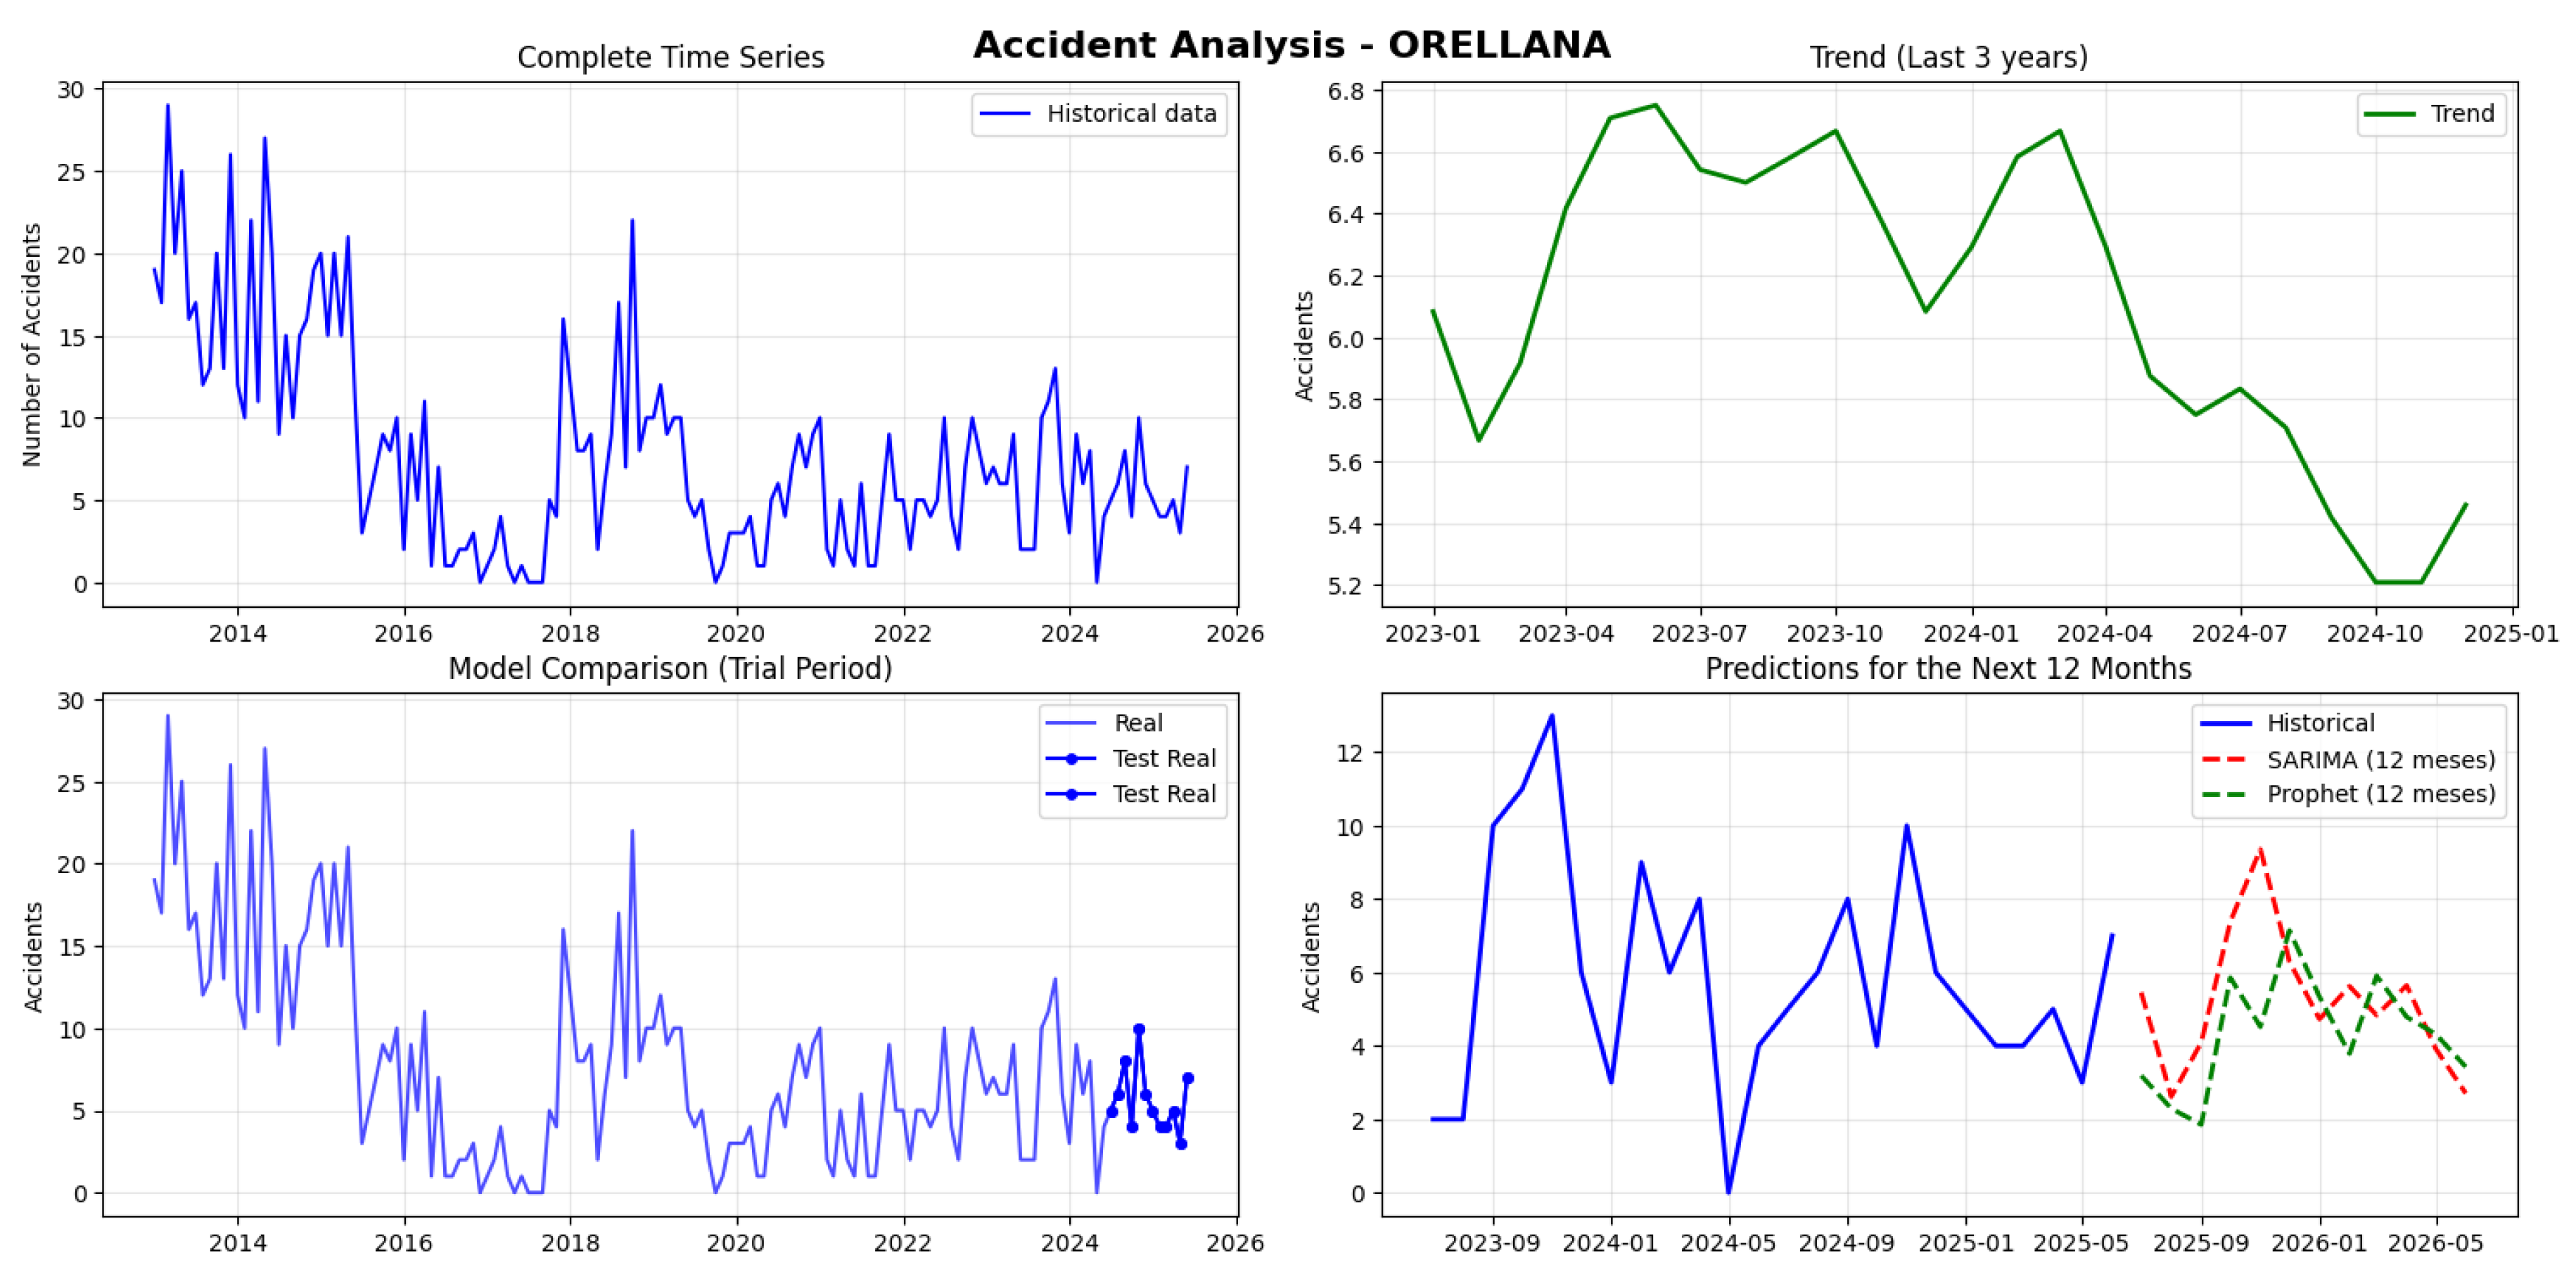
Figure 22.
Traffic Accident Forecasting and Temporal Trends in Zamora Chinchipe Province
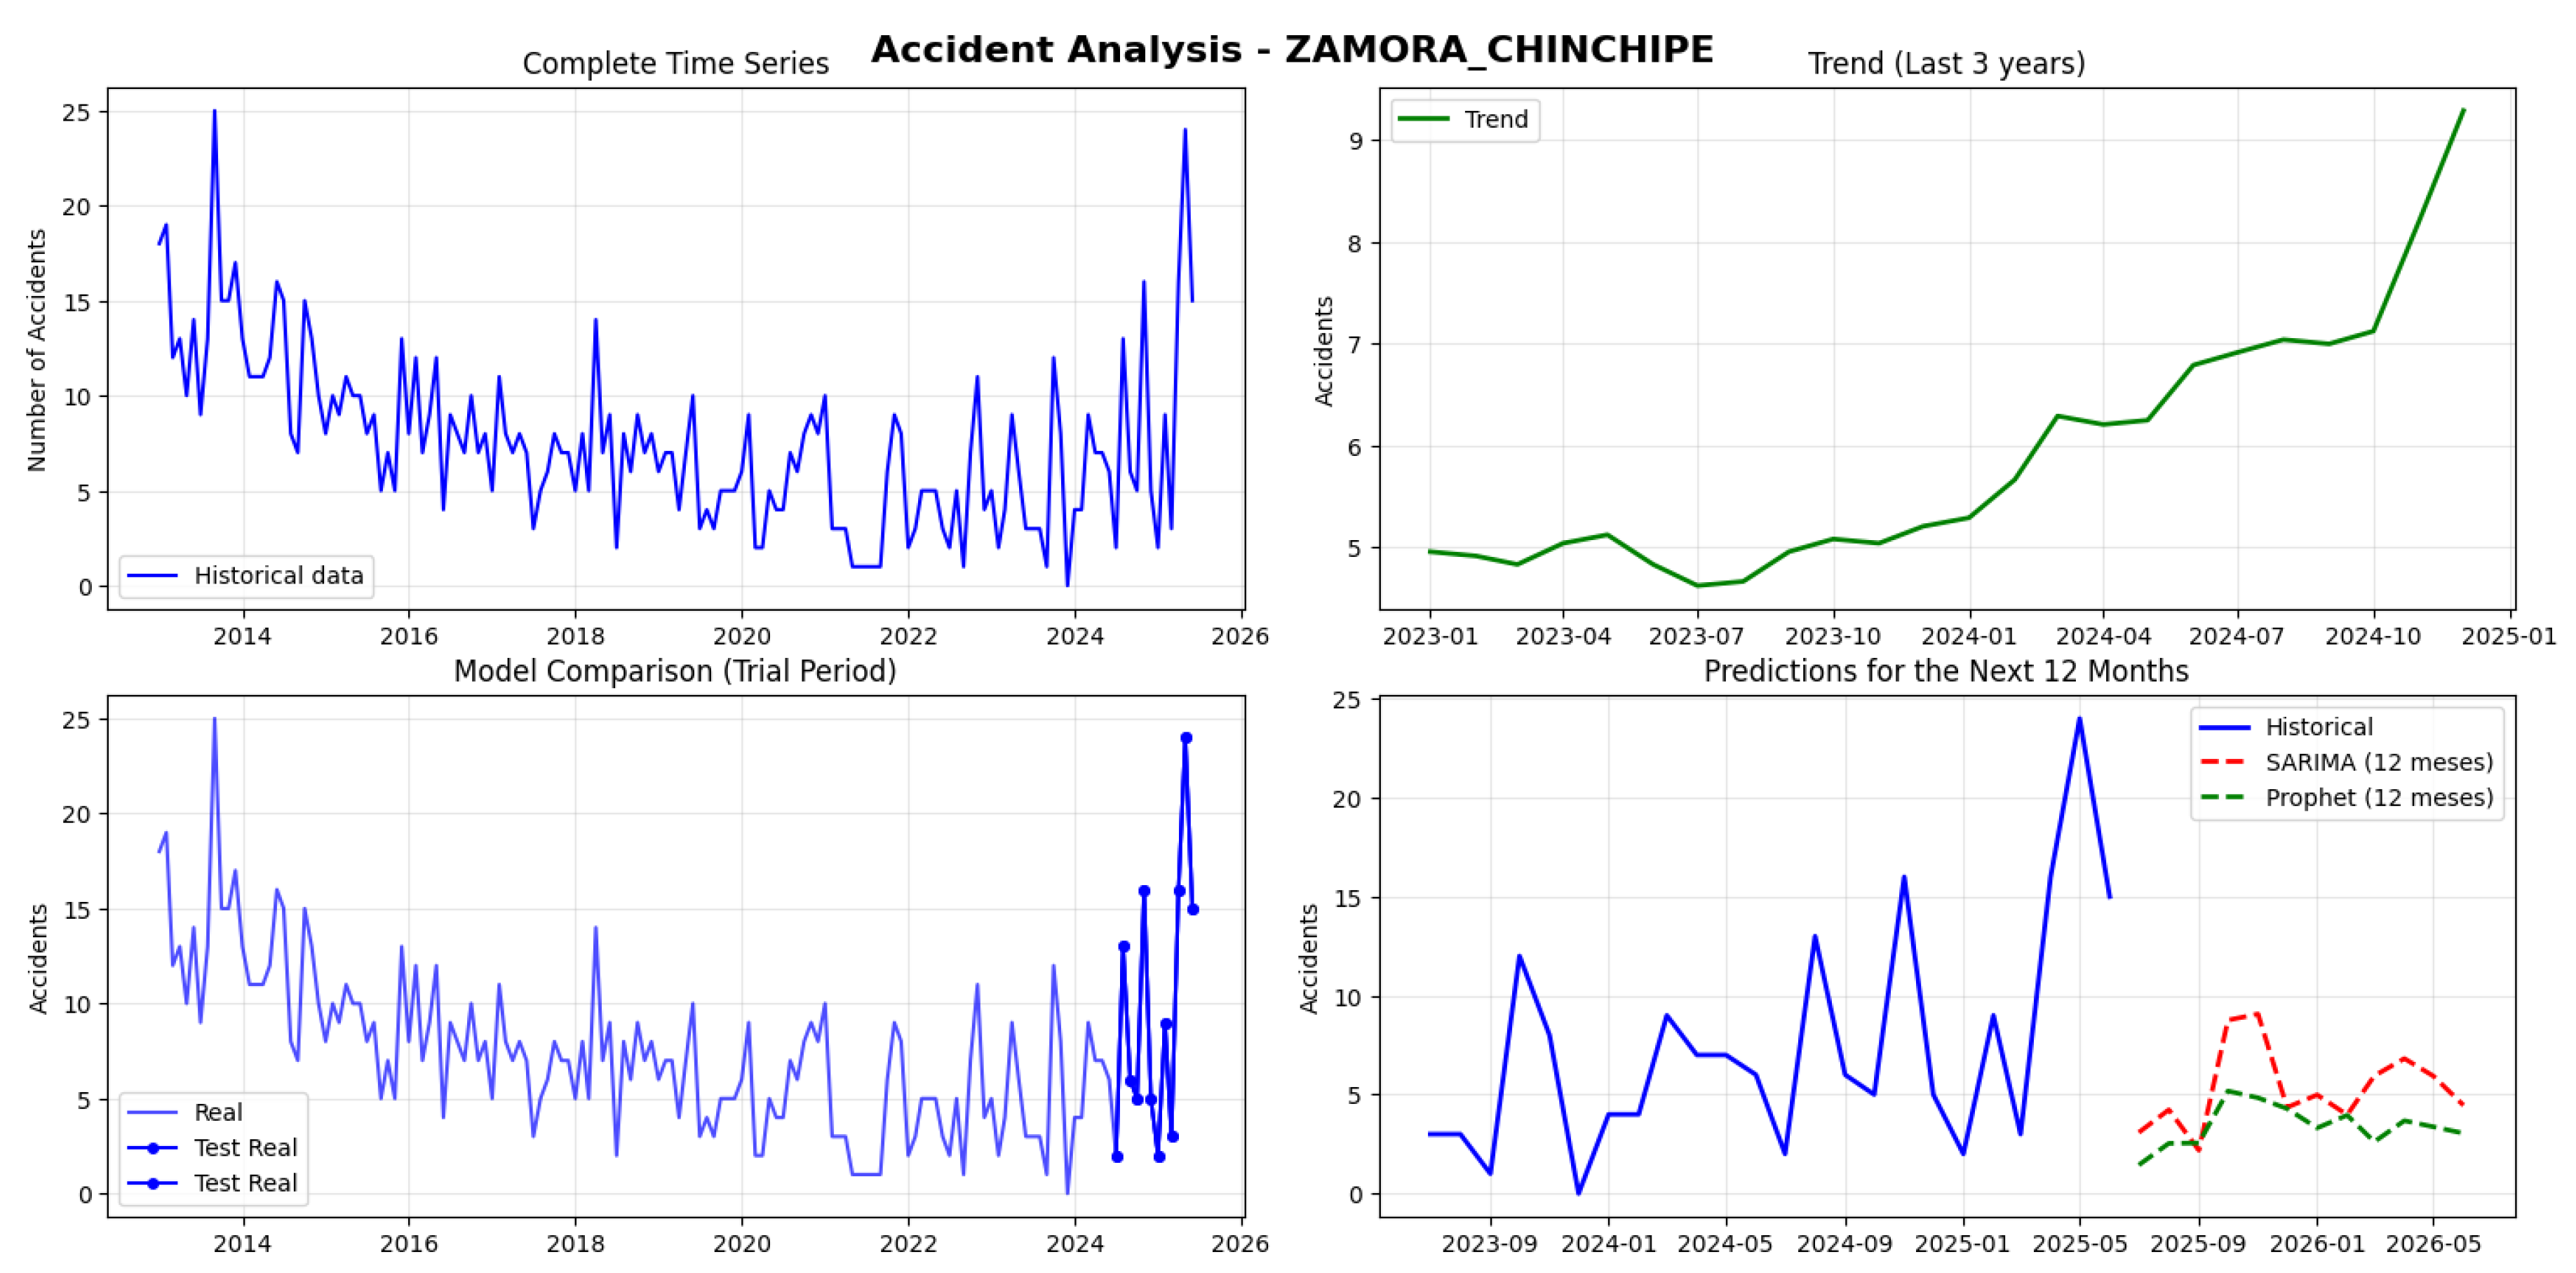
Figure 23.
Traffic Accident Forecasting and Temporal Trends in Napo Province
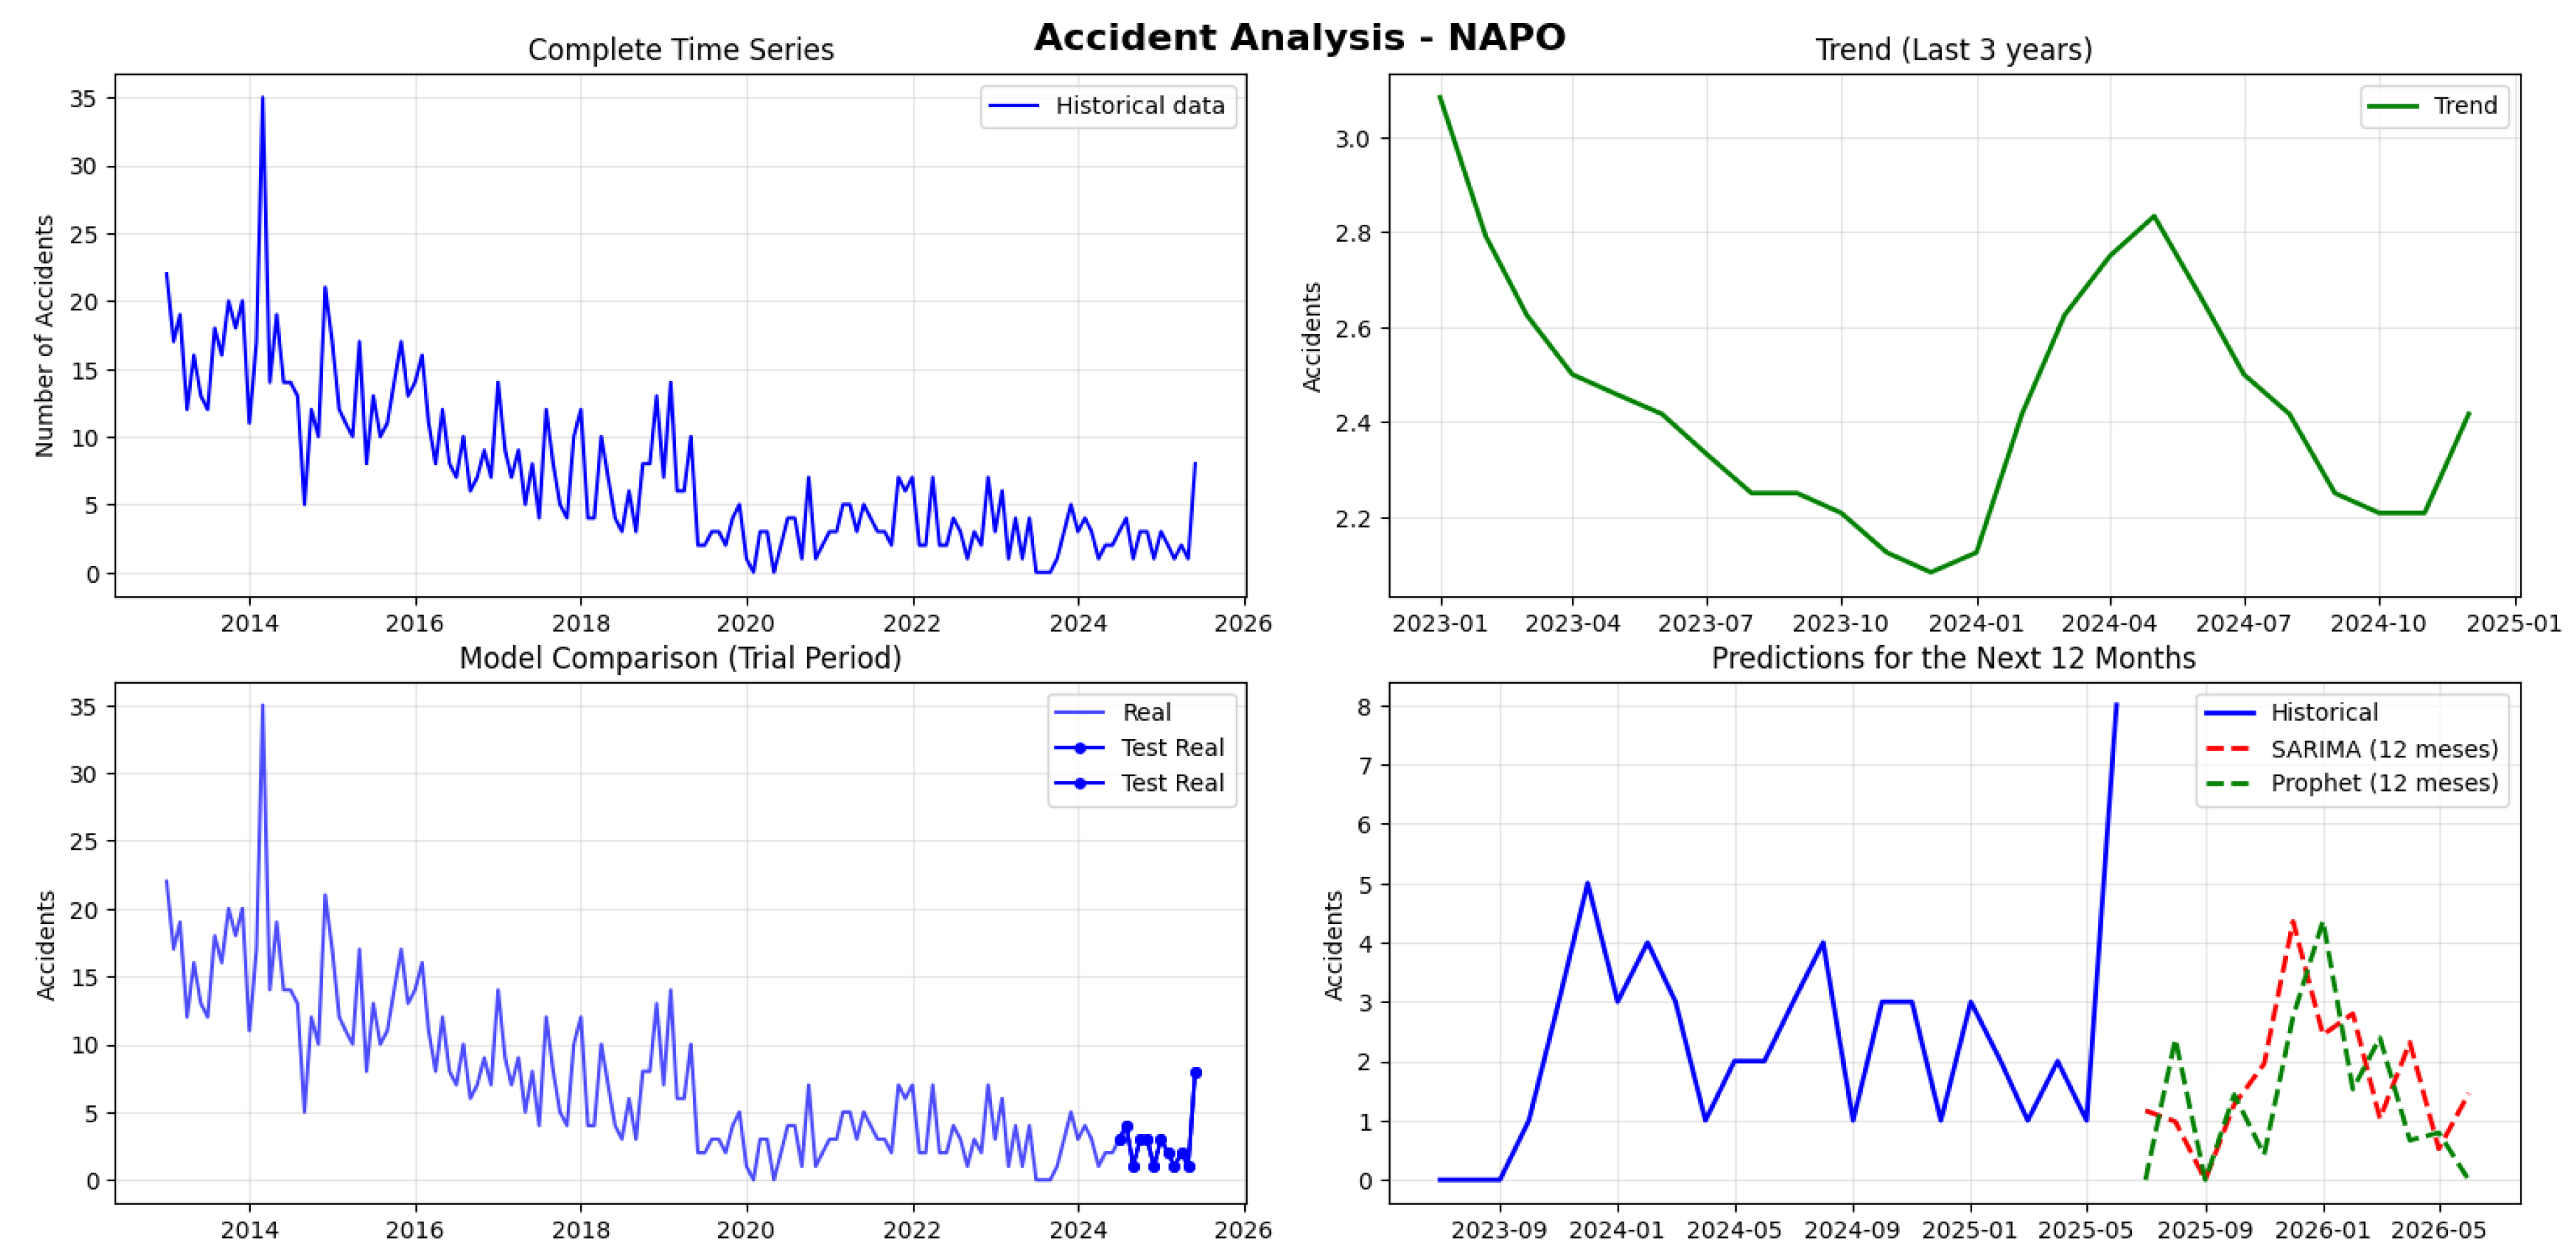
Figure 24.
Traffic Accident Forecasting and Temporal Trends in Pastaza Province
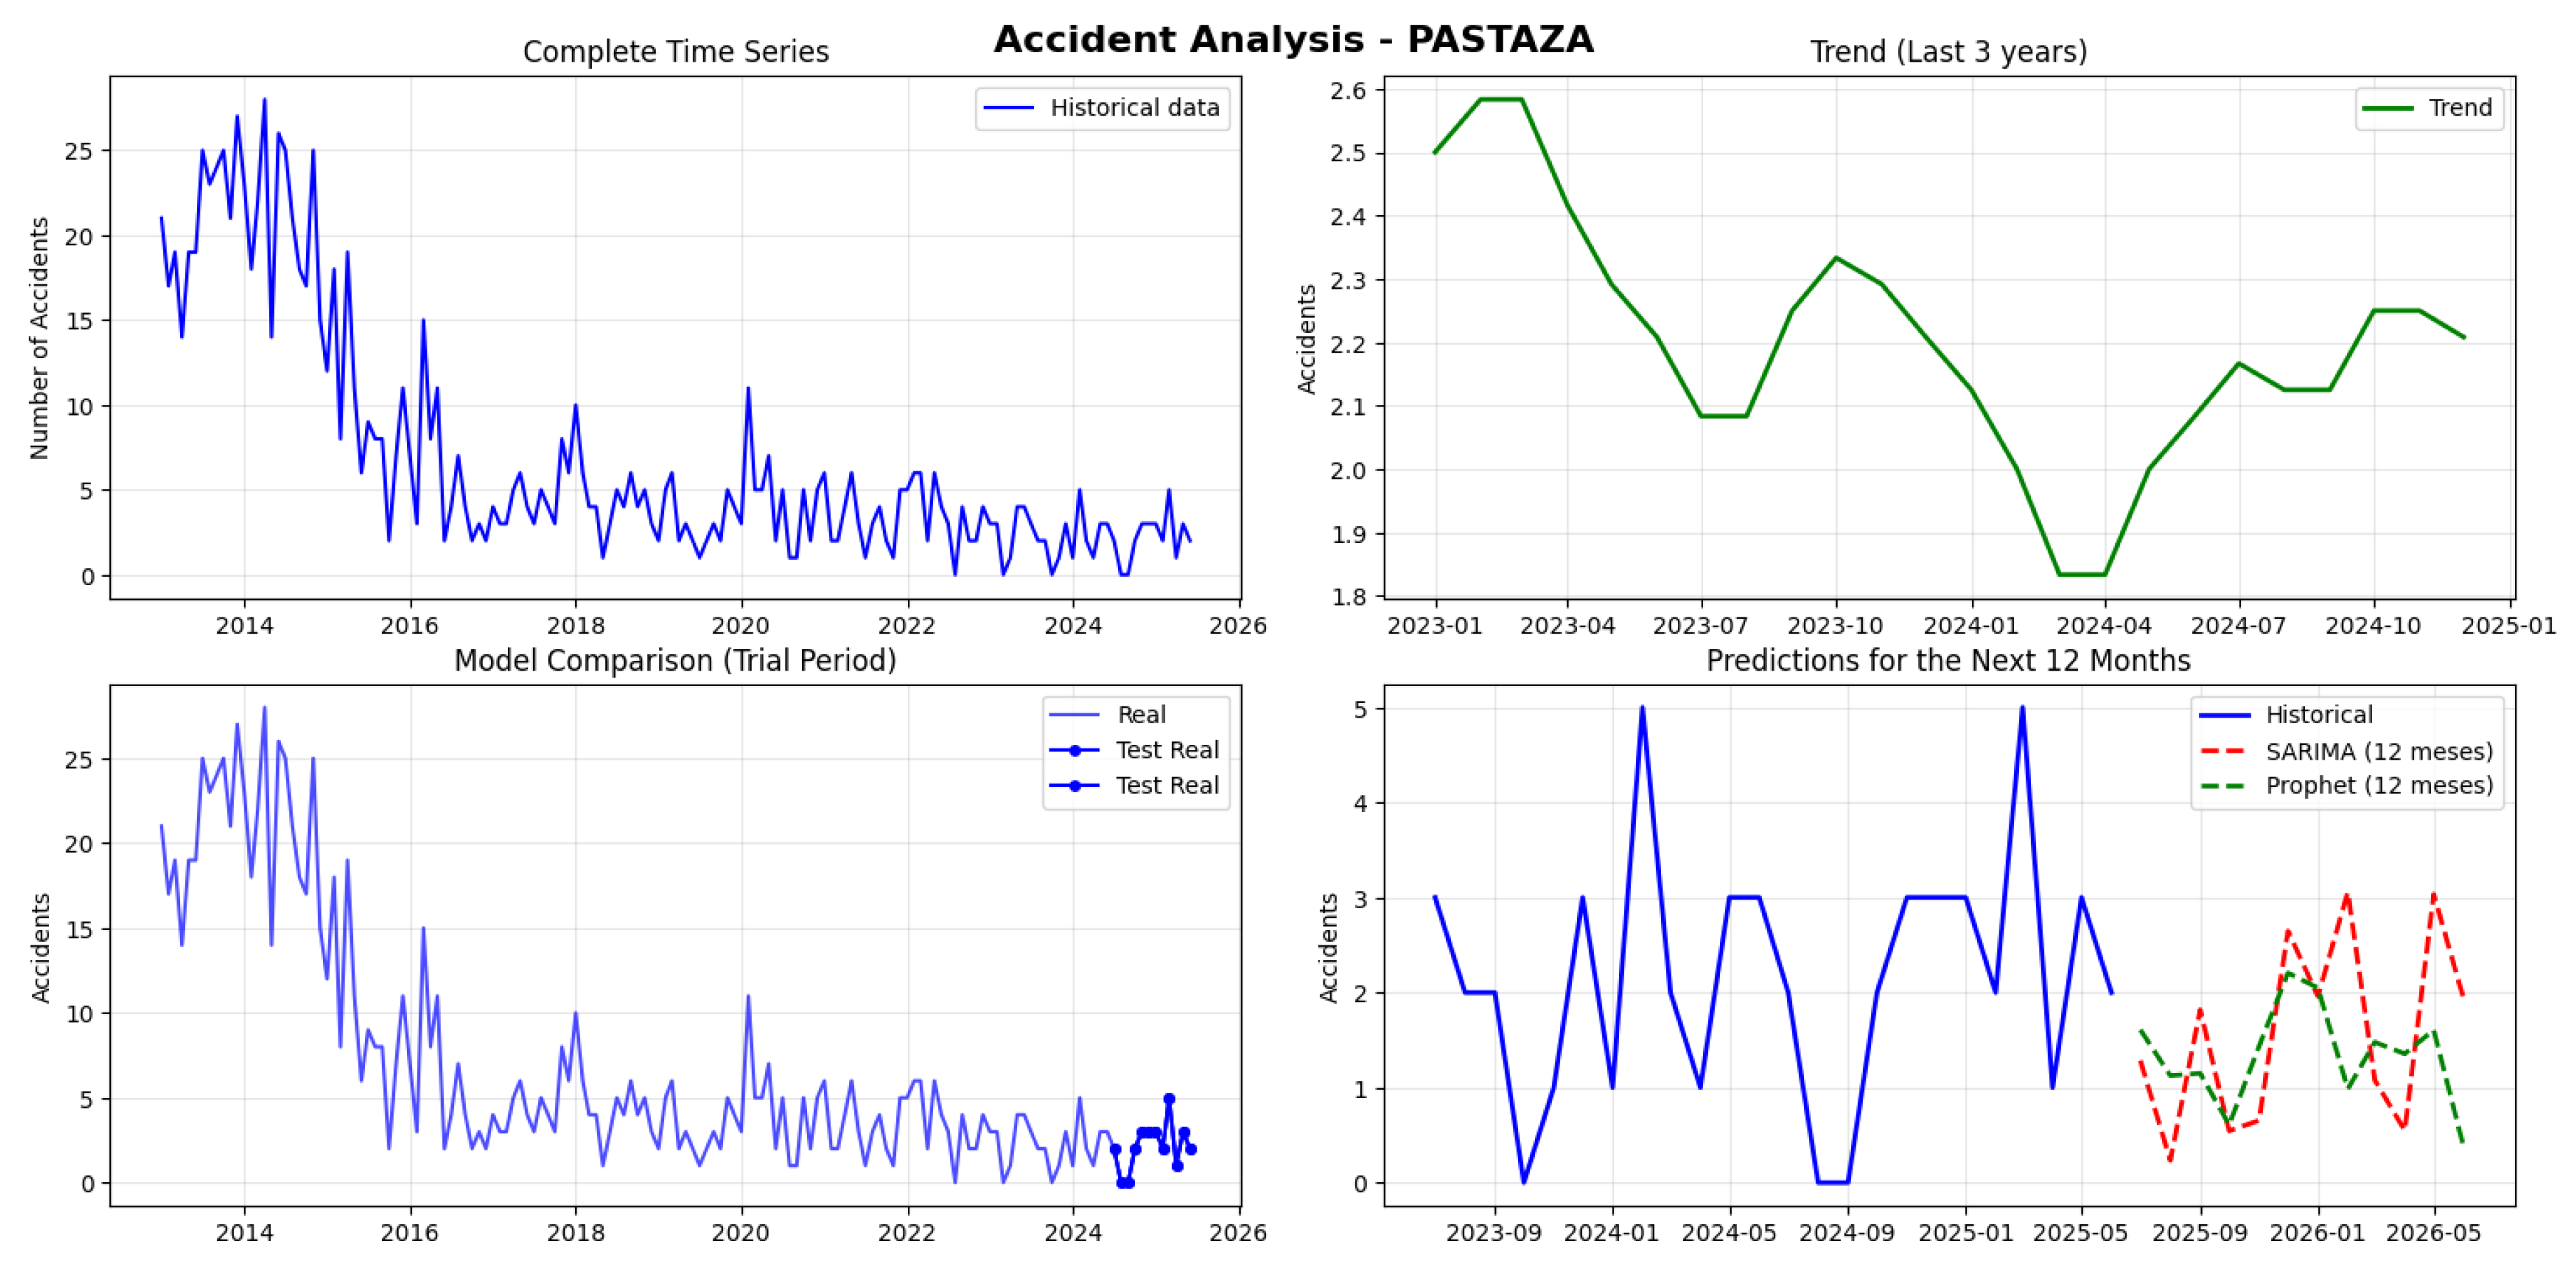
Figure 25.
Traffic Accident Forecasting and Temporal Trends in Sucumbios Province
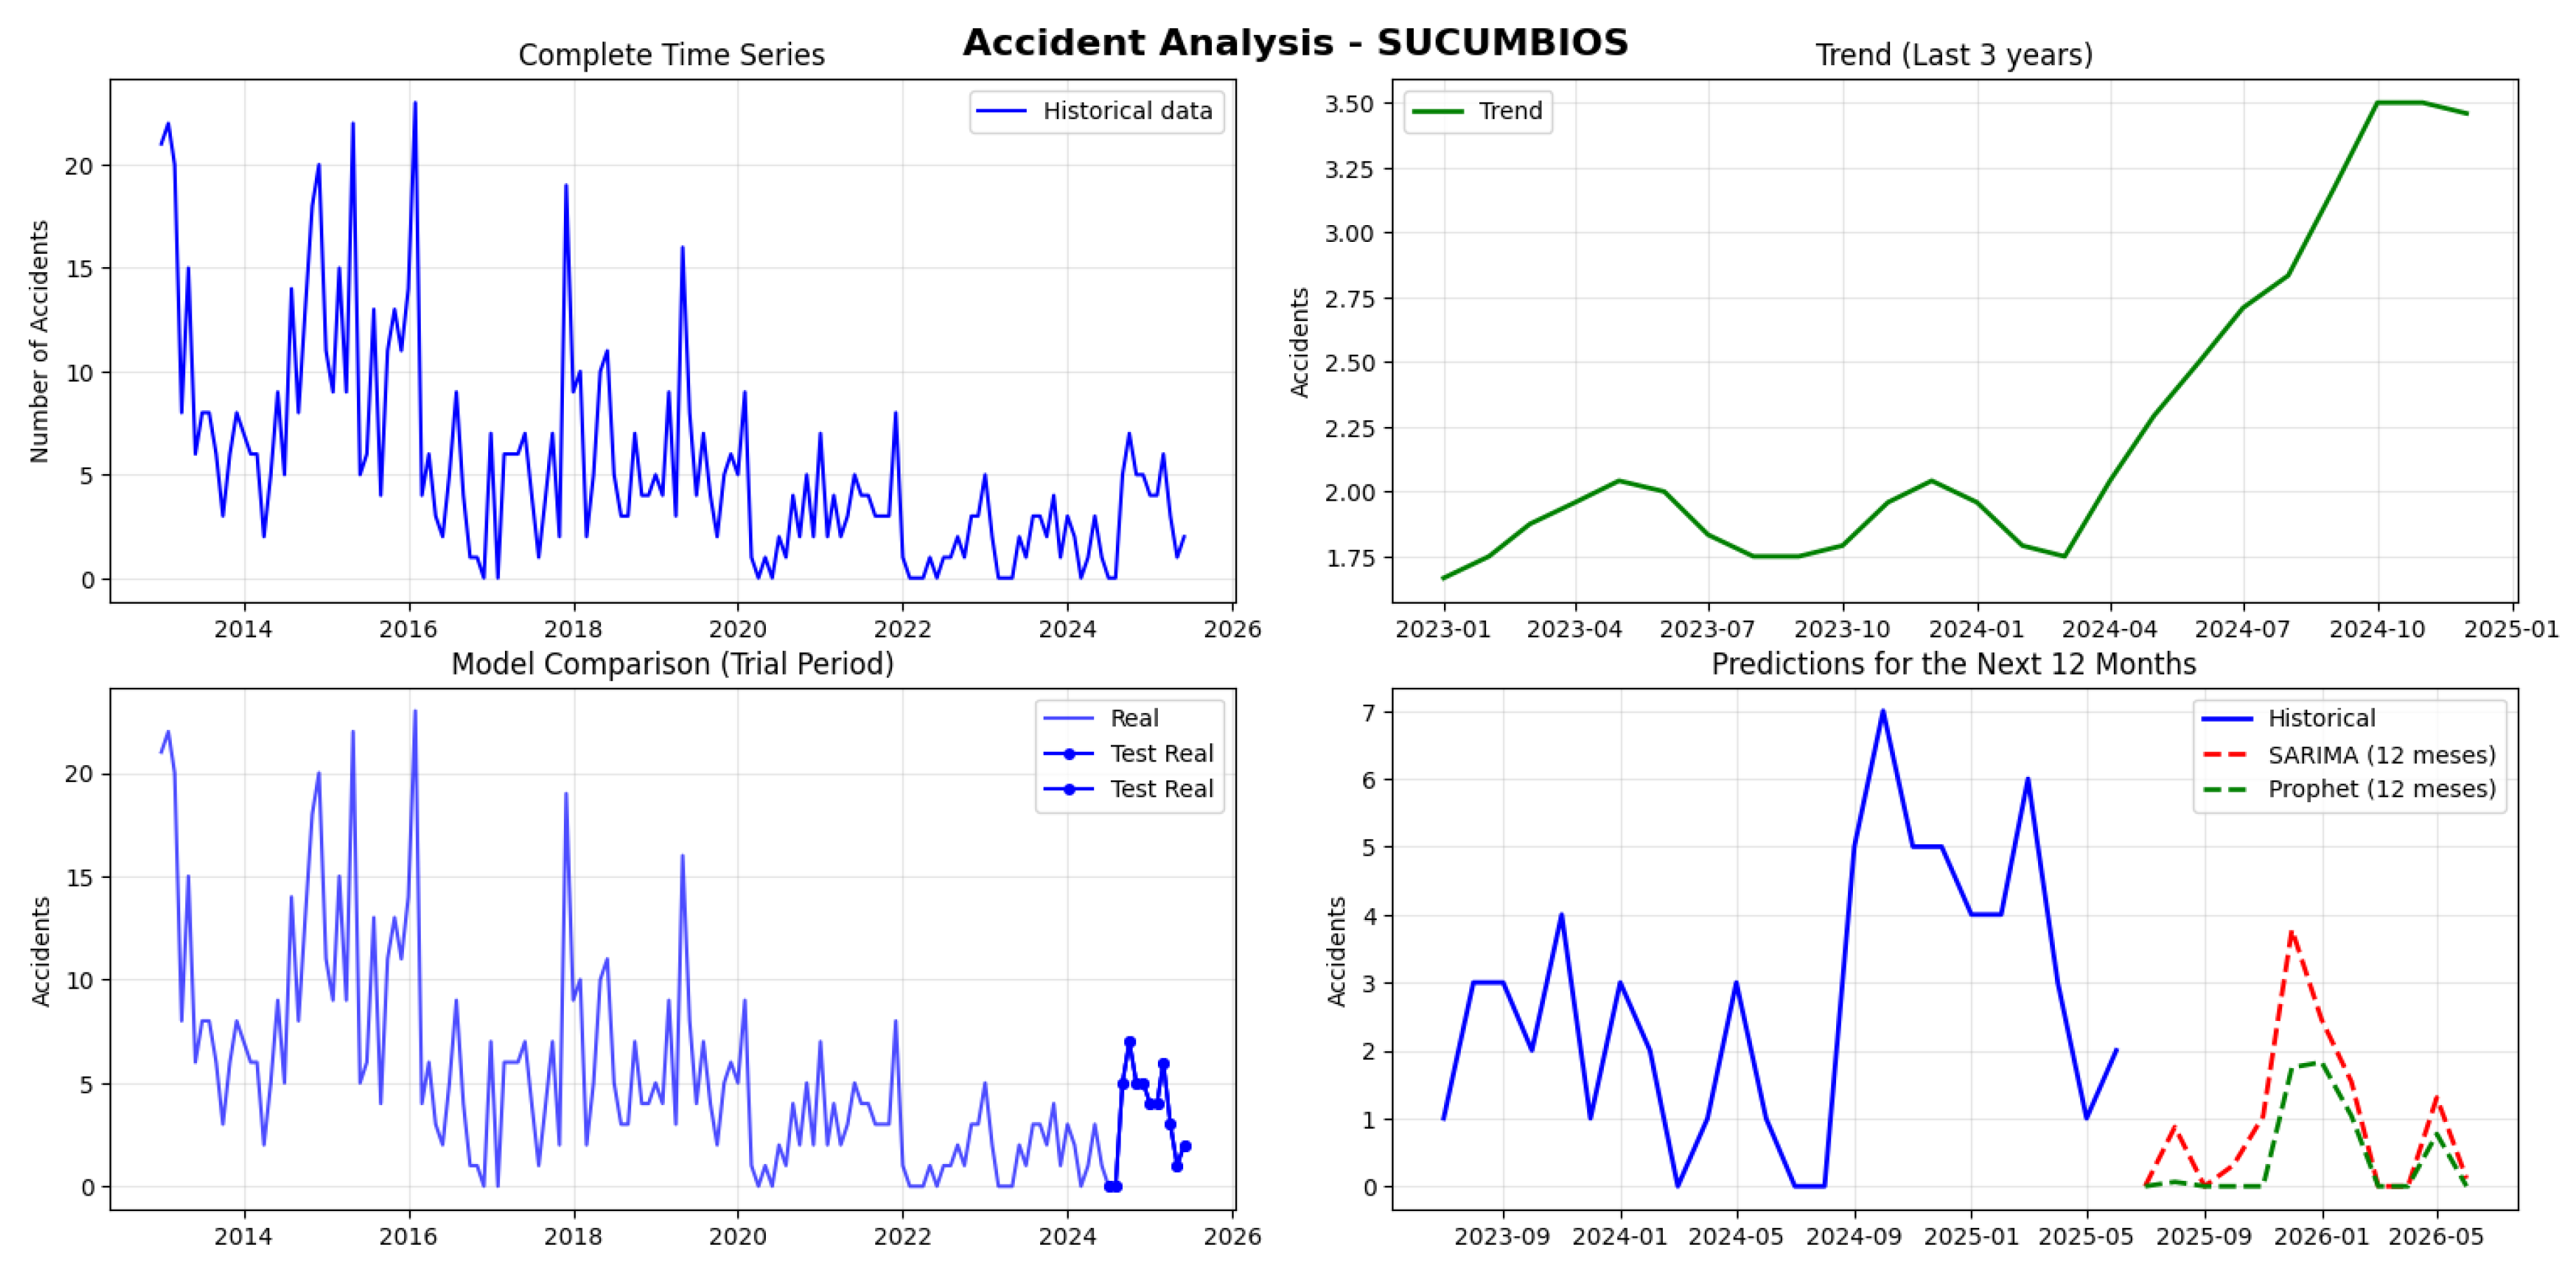
Figure 26.
Traffic Accident Forecasting and Temporal Trends in Galapagos Province
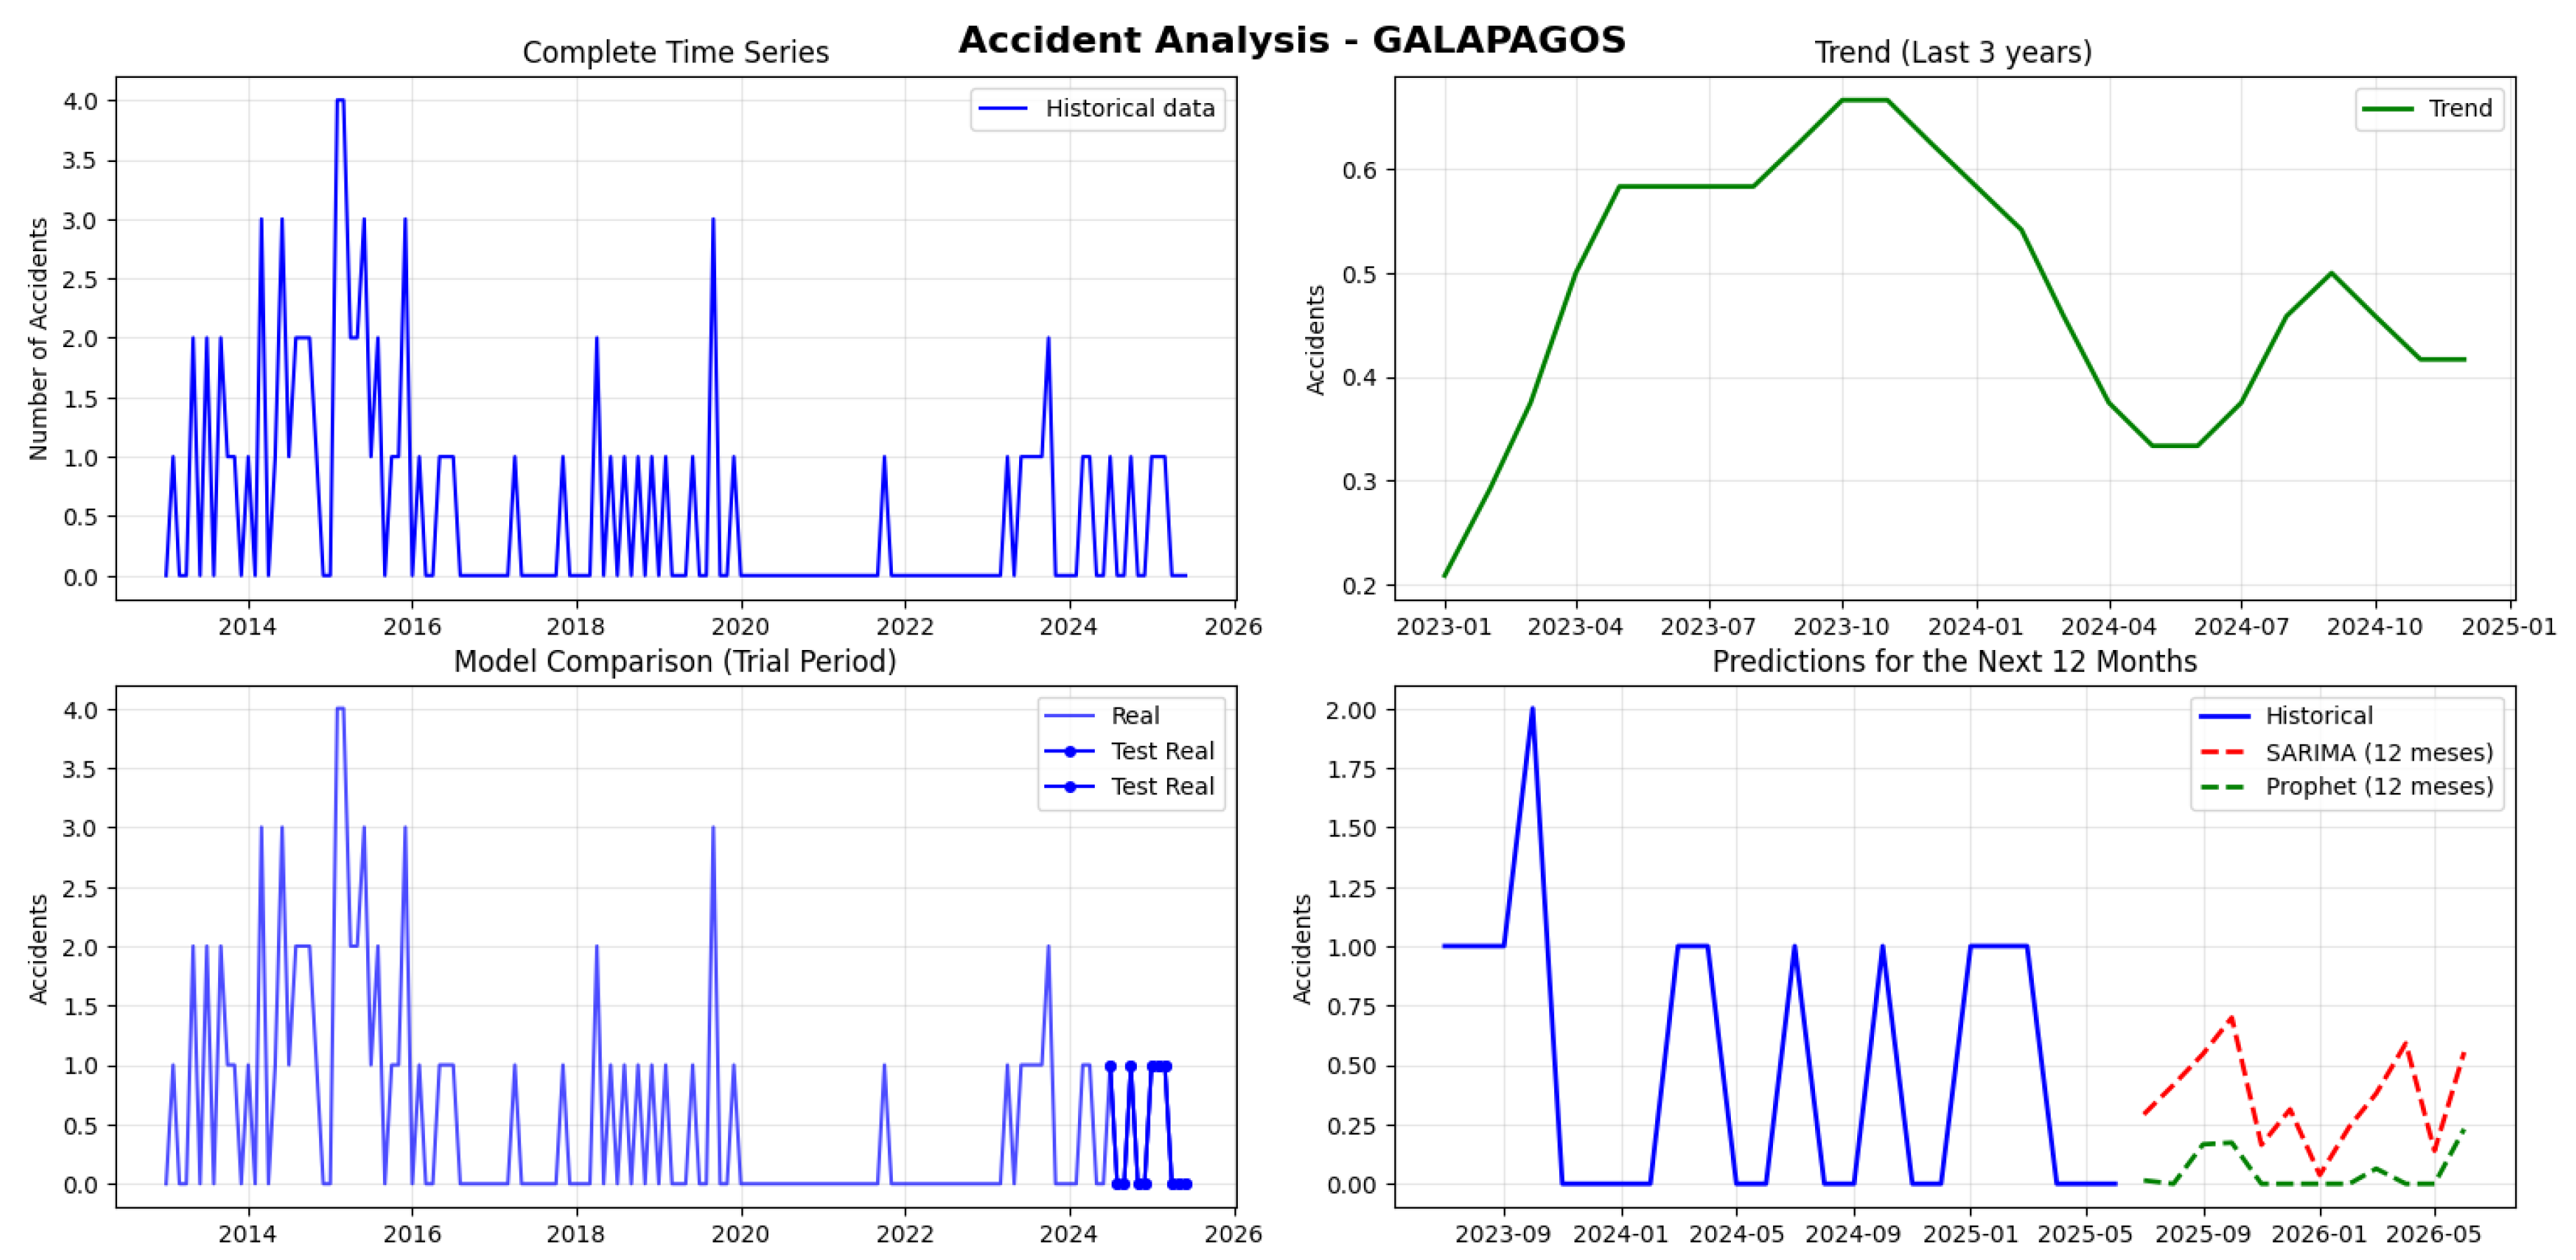
Figure 27.
Geographical Distribution of Provinces in Ecuador
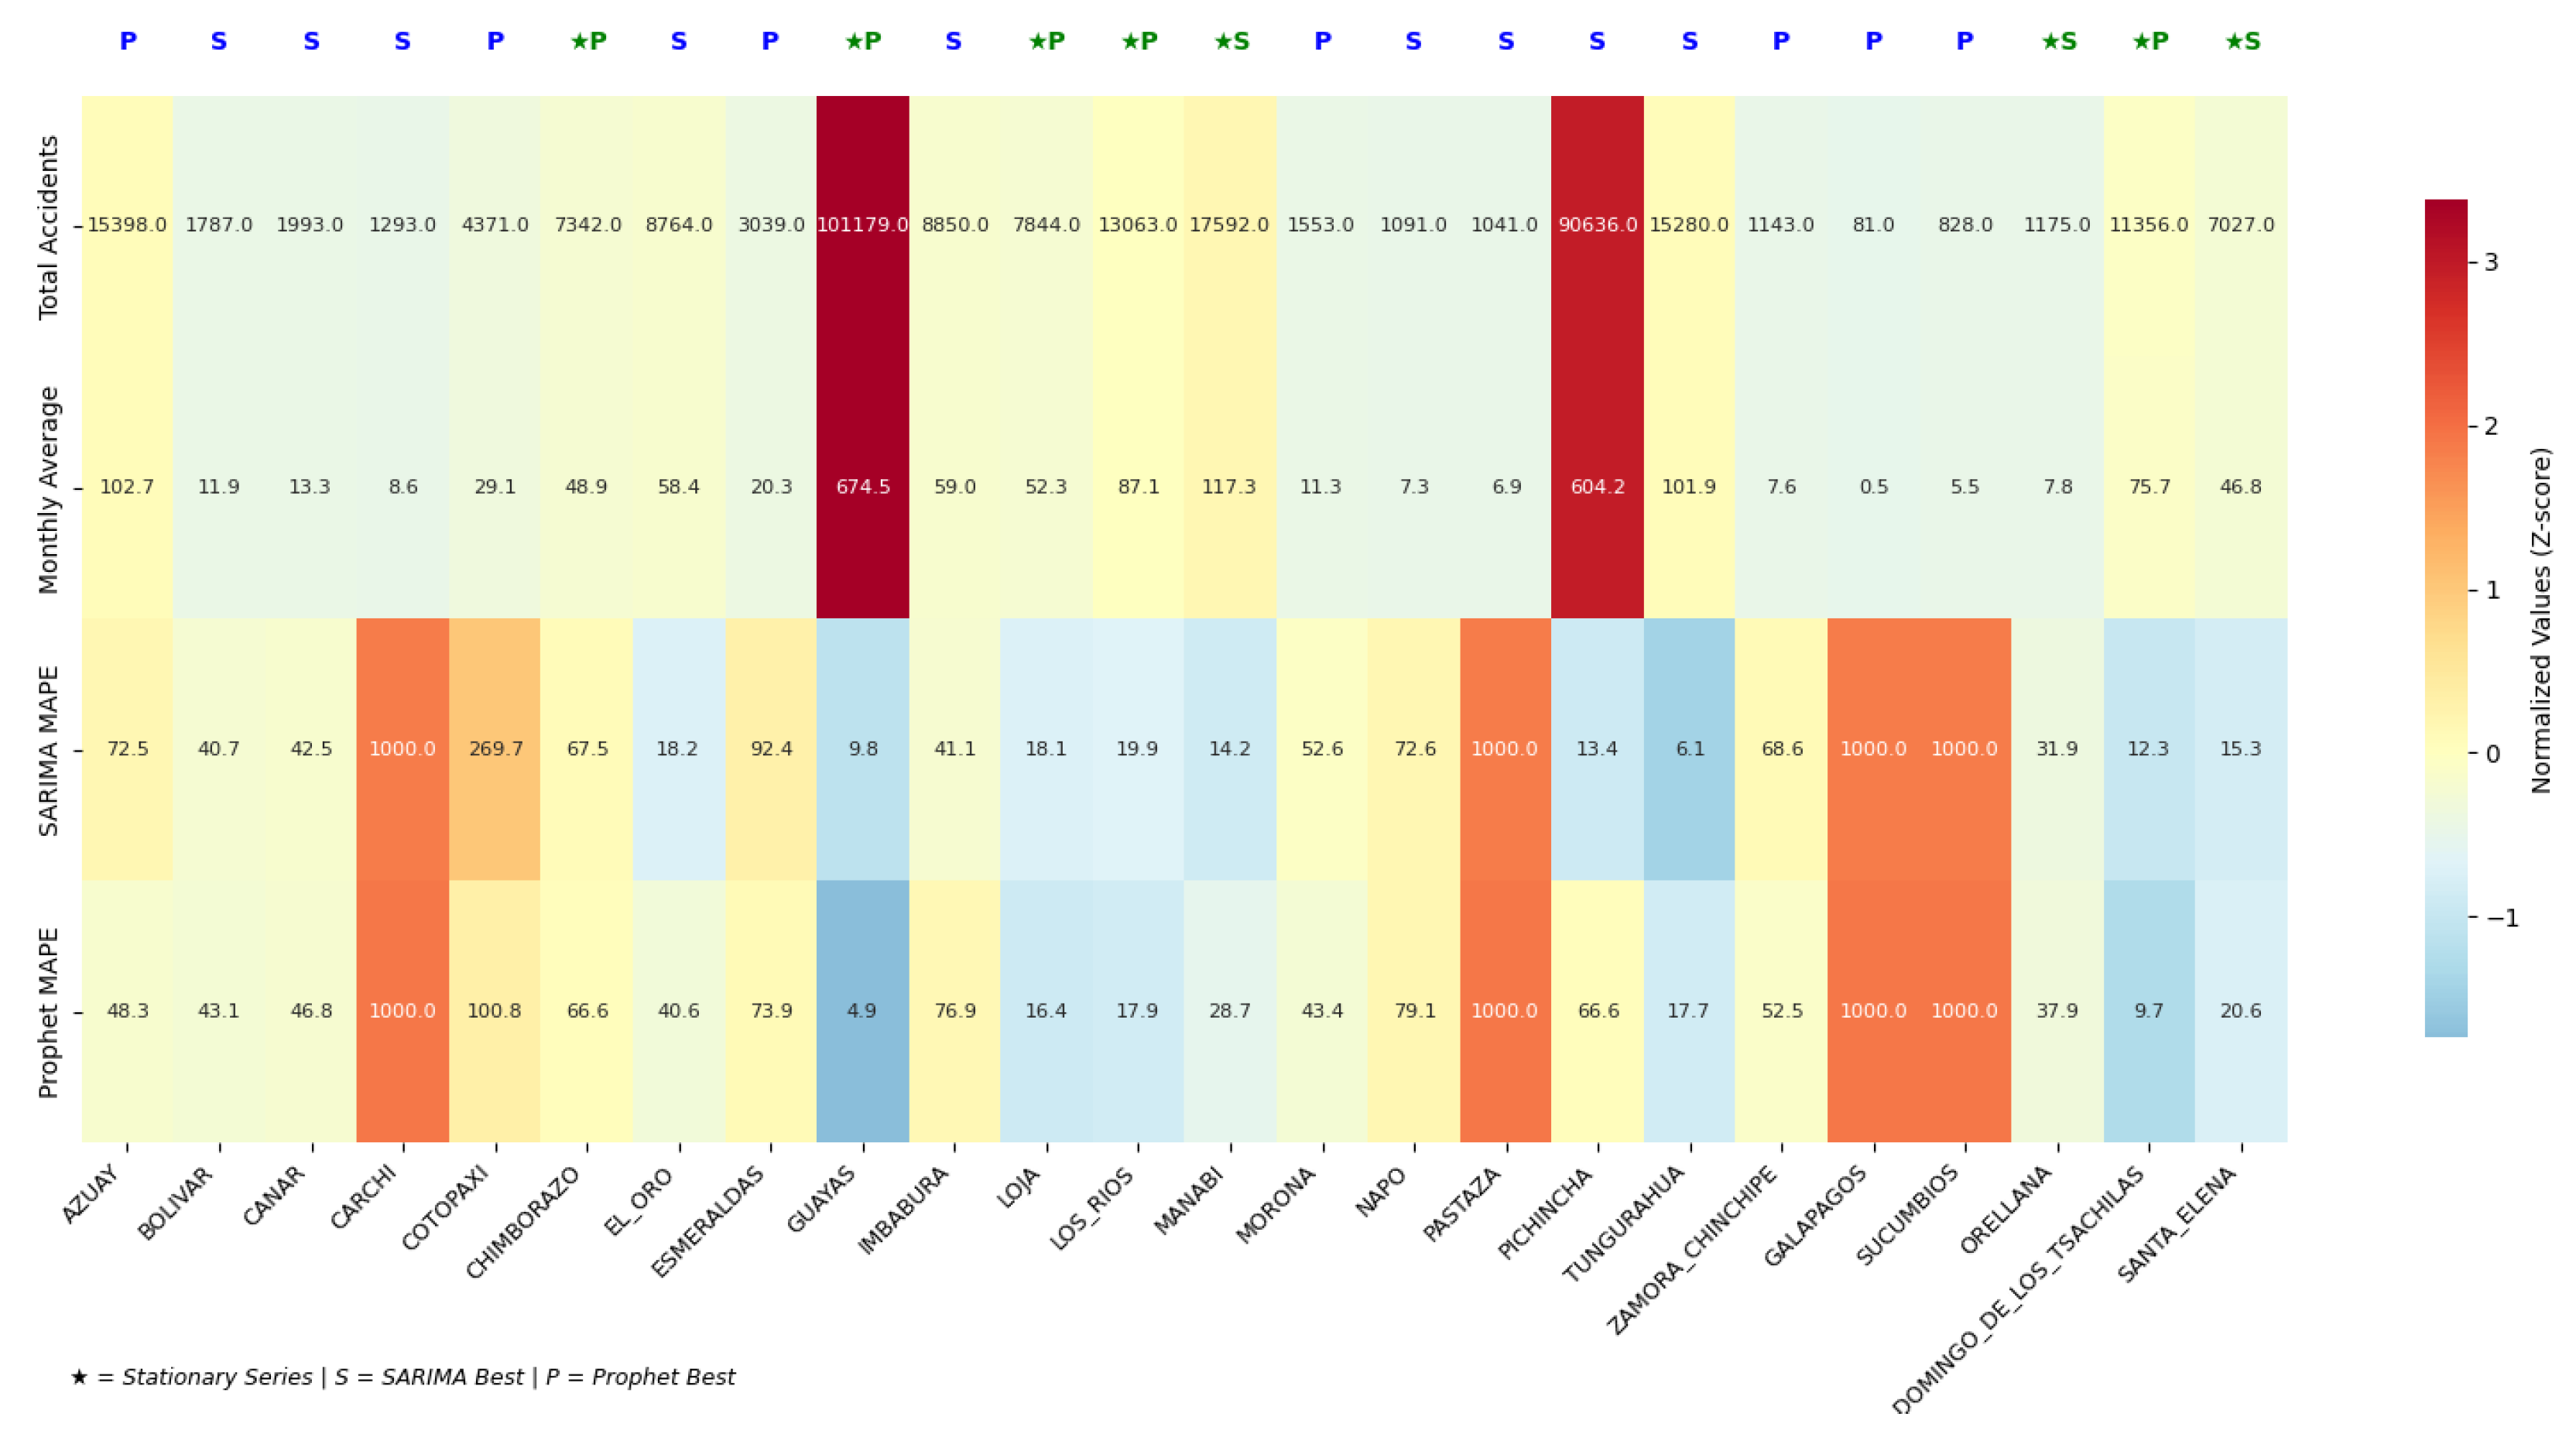

Table 1.
Global Mortality Trends from Road Traffic Crashes and Methodological Approaches
| Paper | Global Mortality Trends (Summary) | Methodological Approach (Summary) |
|---|---|---|
| [10] | Trend: Decreasing (China). Total Deaths: 191,000 (2015) to 169,000 (2030). Rate/100k: 13.7 (2015) to 11.8 (2030). | Model: Log-linear models. Country/Period: China (2015–2030). Sources: UN, WHO, USDA. |
| [11] | Trend: Decreasing (then plateauing). Rate/100k: Decreased from 20.6 (2010) to 19.9 (2013). Annual % Change: -1.12%. | Model: Negative binomial regression. Countries/Period: 188 countries (2010–2013). Techniques: Age-adjustment. |
| [12] | Trend: Increasing (in low-income countries and the African Region). Global Deaths: 1.35 million annually. | Model: Descriptive analysis, t-test, Wilcoxon. Sources: WHO Global Status Reports (2013–2018). Countries: 161. |
| [13] | Trend: Increasing (projected seventh leading cause by 2030). Global Deaths: 1.3 million (2019 est.). Difference: 93% of mortality occurs in low- and middle-income countries. | Approach: N/A (Review Article, no primary data analysis methodology described). |
| [14] | Trend: N/A (Focus is specific to Iran). | Model: Joinpoint regression (based on log-linear model). Country/Period: Iran (2006–2020). Source: Iranian Legal Medicine Organization. |
Table 2.
Summary of Applications and Performance of the Prophet Model in Various Domains
| Paper | Application Domain (Summary) | Model Performance |
|---|---|---|
| [24] | Sector: Energy. Data: Monthly total and peak energy demand. Purpose: Planning and management of generation facilities. | Superiority: Prophet demonstrated superior performance to SARIMA and LSTM by capturing complex temporal features and handling periodicity. Metrics (MAPE): 3.3% (Total Demand), 3.01% (Peak Demand). |
| [25] | Sector: Energy. Data: Total monthly electric energy consumption (GWh). Purpose: Improve prediction accuracy for decision-making. | Comparison: Outperformed by neural networks (LSTM/GRU) in Brazil, but showed good performance for Turkey. Alternative Models: ARIMA, SVR, Holt-Winters. |
| [26] | Sector: Healthcare (Radiology). Data: Daily volume of CT and MRI exams. Purpose: Optimal resource allocation and planning. | Effectiveness: Reduced prediction error. CT: Error reduced from 19 to <1 per day (in monthly total). Improvement: Significantly better than manual predictions. |
| [27] | Sector: Water Management / Agriculture. Data: Monthly rainfall (decadal scale). Characteristics: Strong seasonality. | Superiority: Outperformed six regression models (incl. MLPs and Boosting). Strength: Excellent in predicting dry periods due to its multiplicative seasonality function. Limitation: Difficulty with extreme peak values (very wet events). |
| [28] | Sector: Environmental Monitoring (Air Quality). Data: Hourly concentrations of PM10 and PM2.5. Purpose: Mitigate health risks from pollution. | Performance: RMSE below 6.26 $\mu$g/m³ for PM2.5 and 9.99 $\mu$g/m³ for PM10 (in 50% of cases). Strength: Simplicity and speed. Condition: Performed better for PM2.5 than for PM10. |
Table 3.
Comparative Performance of Forecasting Models in Coastal Region Provinces
| Province | Total Accidents | Monthly Average | Best Model | Best Model MAPE | Stationarity |
|---|---|---|---|---|---|
| GUAYAS | 101,179 | 674.5 | Prophet | 4.91% | Stationary |
| MANABÍ | 17,592 | 117.3 | SARIMA | 14.22% | Stationary |
| LOS RÍOS | 13,063 | 87.1 | Prophet | 17.91% | Stationary |
| SANTO DOMINGO | 11,356 | 75.7 | Prophet | 9.67% | Stationary |
| EL ORO | 8,764 | 58.4 | SARIMA | 18.21% | Non-Stationary |
| SANTA ELENA | 7,027 | 46.8 | SARIMA | 15.29% | Stationary |
| ESMERALDAS | 3,039 | 20.3 | Prophet | 73.93% | Non-Stationary |
Table 4.
Comparative Performance of Forecasting Models in Andean Region Provinces
| Province | Total Accidents | Monthly Average | Best Model | Best Model MAPE | Stationarity |
|---|---|---|---|---|---|
| PICHINCHA | 90,636 | 604.2 | SARIMA | 13.38% | No Estacionaria |
| AZUAY | 15,398 | 102.7 | Prophet | 48.34% | No Estacionaria |
| TUNGURAHUA | 15,28 | 101.9 | SARIMA | 6.07% | No Estacionaria |
| IMBABURA | 8,85 | 59.0 | SARIMA | 41.12% | No Estacionaria |
| LOJA | 7,844 | 52.3 | Prophet | 16.40% | Estacionaria |
| CHIMBORAZO | 7,342 | 48.9 | Prophet | 66.55% | Estacionaria |
| COTOPAXI | 4,371 | 29.1 | Prophet | 100.83% | No Estacionaria |
| CAÑAR | 1,993 | 13.3 | SARIMA | 42.53% | No Estacionaria |
| BOLÍVAR | 1,787 | 11.9 | SARIMA | 40.72% | No Estacionaria |
| CARCHI | 1,293 | 8.6 | SARIMA | 43.51% | No Estacionaria |
Table 5.
Comparative Performance of Forecasting Models in Amazon Region Provinces
| Province | Total Accidents | Monthly Average | Best Model | Best Model MAPE | Stationarity |
|---|---|---|---|---|---|
| MORONA SANTIAGO | 1,553 | 11.3 | Prophet | 43.36% | No Estacionaria |
| ORELLANA | 1,175 | 7.8 | SARIMA | 31.86% | Estacionaria |
| ZAMORA CHINCHIPE | 1,143 | 7.6 | Prophet | 52.55% | No Estacionaria |
| NAPO | 1,091 | 7.3 | SARIMA | 72.63% | No Estacionaria |
| PASTAZA | 1,041 | 6.9 | SARIMA | 1703.95% | No Estacionaria |
| SUCUMBÍOS | 828 | 5.5 | Prophet | 533.73% | No Estacionaria |
Table 6.
Comparative Performance of Forecasting Models in Galapagos Region Provinces
| Province | Total Accidents | Monthly Average | Best Model | Best Model MAPE | Stationarity |
|---|---|---|---|---|---|
| GALÁPAGOS | 81 | 0.5 | Prophet | 3302.35% | No Estacionaria |
Table 7.
Comparative Analysis of Forecasting Model Performance by Geographic Region
| Region | Prophet Wins | SARIMA Wins | Dominant Model |
|---|---|---|---|
| Coast | 4 | 3 | Prophet |
| Highlands | 4 | 6 | SARIMA |
| Amazon | 3 | 3 | Tie |
| Insular | 1 | 0 | Prophet |
| OVERALL TOTAL (24 Provinces) | 12 | 12 | Tie |
Disclaimer/Publisher’s Note: The statements, opinions and data contained in all publications are solely those of the individual author(s) and contributor(s) and not of MDPI and/or the editor(s). MDPI and/or the editor(s) disclaim responsibility for any injury to people or property resulting from any ideas, methods, instructions or products referred to in the content. |
© 2025 by the authors. Licensee MDPI, Basel, Switzerland. This article is an open access article distributed under the terms and conditions of the Creative Commons Attribution (CC BY) license (http://creativecommons.org/licenses/by/4.0/).
Copyright: This open access article is published under a Creative Commons CC BY 4.0 license, which permit the free download, distribution, and reuse, provided that the author and preprint are cited in any reuse.


