Submitted:
23 November 2025
Posted:
25 November 2025
You are already at the latest version
Abstract
Heavy precipitation clustering is an important factor for flood risk and hydrological forecasting, but its simulation in climate models is still uncertain. This study examines European climate simulations by comparing global climate models with long-term observations. Consecutive wet days (CWD) and very wet days (R95p) were used as indicators, and clustering behavior was assessed across major regions in Europe. The results show that models capture large-scale extremes with moderate accuracy but underestimate clustering by 20–30% in Mediterranean and Alpine areas. Sensitivity tests also show that clustering depends on temporal resolution, with daily indices showing stronger underestimation than multi-day metrics. These outcomes suggest that current models reproduce intensity more reliably than persistence, which lowers confidence in hydrological forecasts and flood risk analysis. The study concludes that improvements in physical schemes and the use of convection-permitting models are needed to better simulate precipitation clustering in Europe.
Keywords:
heavy precipitation
; clustering patterns
; climate models
; Europe
; extreme weather
; hydrological forecasting
; model performance
1. Introduction
Extreme precipitation is one of the most damaging weather phenomena in Europe, closely linked to floods, landslides, and infrastructure failures [1]. Reliable hydrological forecasting therefore requires not only accurate estimates of event intensity but also a realistic representation of temporal clustering, since multi-day rainfall episodes strongly control antecedent soil moisture and runoff generation [2]. Recent studies have reported increases in the frequency and intensity of heavy precipitation across Europe, with pronounced spatial contrasts between northern, central, and Mediterranean regions [3]. Despite these advances, the representation of clustered rainfall—defined as sequences of consecutive heavy-rain days—remains a persistent weakness in both global and regional climate models [4]. Climate models have progressively improved their simulation of mean precipitation, seasonal cycles, and daily extremes owing to better horizontal resolution and refined physical parameterizations [5]. However, many still underestimate persistence, fragmenting prolonged rainfall episodes into shorter events [6]. This limits their utility for flood prediction, as peak streamflow typically results from rainfall accumulated over multiple wet days rather than isolated single-day extremes [7]. Model comparison studies further show substantial regional contrasts: clustering tends to be better reproduced in maritime climates but is often poorly captured in convective and mountainous regions, including the Alps and the Mediterranean [8]. A key challenge is that clusters depend strongly on mesoscale dynamics, storm organization, and local convective processes, which are difficult to resolve at GCM grid scales [9]. High-resolution models and convection-permitting simulations alleviate some of these deficiencies, yet large inter-model spread persists, especially for metrics describing temporal structure such as mean cluster length and maximum consecutive wet days [10]. Importantly, earlier CMIP evaluations demonstrated that climate models systematically underestimate temporal clustering of heavy precipitation over Europe, with strong spatial variability in model skill, suggesting that the temporal structure of extremes is more challenging to reproduce than intensity alone [11]. These results highlight a substantial knowledge gap in how models represent the timing and persistence of extreme rainfall events. Observational datasets remain essential for model evaluation, but they carry uncertainties associated with sparse station coverage, interpolation, and differences across gridded products, especially in southeastern Europe [12,13]. These limitations can influence derived cluster metrics, which are sensitive to daily variability and spatial smoothing. In addition, methodological choices—such as percentile thresholds used to define extremes and the rules for linking events—can substantially alter clustering statistics, complicating cross-study comparison [14,15]. Such sensitivities indicate the need for consistent evaluation frameworks that assess persistence alongside intensity and frequency. While many studies have focused on the magnitude of precipitation extremes, fewer have examined clustering itself and its hydrological implications [16]. As a result, important questions remain regarding the spatial structure of clustering biases, the model processes responsible for underestimating persistence, and the implications for flood hazard assessment. Addressing these gaps requires systematic evaluation of multiple cluster metrics across different climate zones using consistent datasets and methods.
This study investigates the ability of CMIP6 global climate models to reproduce the temporal clustering of heavy precipitation across Europe. Using long-term observational products as reference, we analyze mean cluster length, maximum consecutive wet days, and sensitivity to extreme-event thresholds and linking rules. The evaluation further characterizes inter-model spread and regional differences, identifying where persistence is most underestimated. By focusing on the temporal organization of extreme rainfall rather than isolated events, this work provides new insight into model skill relevant to hydrological prediction. The results highlight systematic clustering deficiencies, point to limitations in representing mesoscale storm processes, and offer guidance for improving model-based flood risk assessment and future climate projections.
2. Materials and Methods
2.1. Study Area and Data Sample
The study was conducted for the European region, covering latitudes 35°N–70°N and longitudes 10°W–30°E. Daily precipitation records for 1980–2020 were taken from the E-OBS v25.0 dataset at 0.1° resolution, which combines data from more than 2,000 stations. Six CMIP6 global climate models were selected according to data availability and grid resolution. Heavy precipitation events were defined as daily rainfall above the 95th percentile at each grid cell, resulting in more than 10,500 events used for clustering analysis.
2.2. Experimental Design and Control Comparison
Model simulations were considered the experimental groups, while E-OBS observations served as the control. Both datasets were processed using the same thresholds and clustering rules to allow direct comparison. Europe was divided into northern, central, and Mediterranean subregions to reflect differences in climate regimes. This design made it possible to evaluate how model skill changes under maritime, continental, and semi-arid conditions.
2.3. Measurement Procedures and Quality Control
Observation series were checked for completeness before use. Records with more than 5% missing values were excluded. Short gaps of one to two days were filled by linear interpolation, and longer gaps were removed. Outliers exceeding four standard deviations from the mean were flagged and verified against station reports. Model outputs were interpolated to the E-OBS grid by bilinear remapping. These steps reduced inconsistencies between observations and simulations.
2.4. Data Processing and Statistical Formulations
Clusters were defined as sequences of consecutive days above the 95th percentile. Two indices were calculated: mean cluster length (MCL) and maximum consecutive wet days (CWD). Agreement between models and observations was tested using a linear regression [17]:
where is the observed index, is the modeled index, and is the residual term. Model efficiency was also evaluated with the Nash–Sutcliffe Efficiency (NSE):
where and are observed and modeled values, and is the observed mean.
2.5. Statistical Analysis
Model errors were measured with mean bias, root mean square error (RMSE), and mean absolute error (MAE). Confidence intervals for clustering indices were calculated with bootstrap resampling using 1,000 iterations. Paired t-tests at the 95% level were applied to test the significance of differences between models and observations. All analyses were carried out using R version 4.3 and Python version 3.11.
3. Results and Discussion
3.1. Overall Reproduction of Precipitation Extremes
The analysis shows that most climate models capture the broad spatial distribution of precipitation extremes but perform less well in representing clustering. Over western Europe, the correlation between simulations and observations is moderate (0.55–0.70), while southern regions show stronger biases due to convective rainfall. A comparison of indices indicates that consecutive wet days (CWD) and very wet days (R95p) are generally underestimated, with inter-model differences exceeding 20%. As seen in Figure 1, ensembles reproduce the overall level of extremes but not their persistence, which is consistent with earlier CMIP6 studies [18].
3.2. Sensitivity to Temporal Aggregation
Clustering metrics depend strongly on the temporal resolution used to define events. When daily thresholds are applied, models underestimate clustering, while five-day aggregated indices reduce biases but also smooth short events. Raising the percentile threshold reduces the number of extremes by about 35% but increases the mean duration of clusters. These results show that methodological choices influence the robustness of clustering indicators. Earlier research also pointed out that temporal aggregation alters precipitation statistics and limits comparability across models [19].
3.3. Regional Patterns of Bias
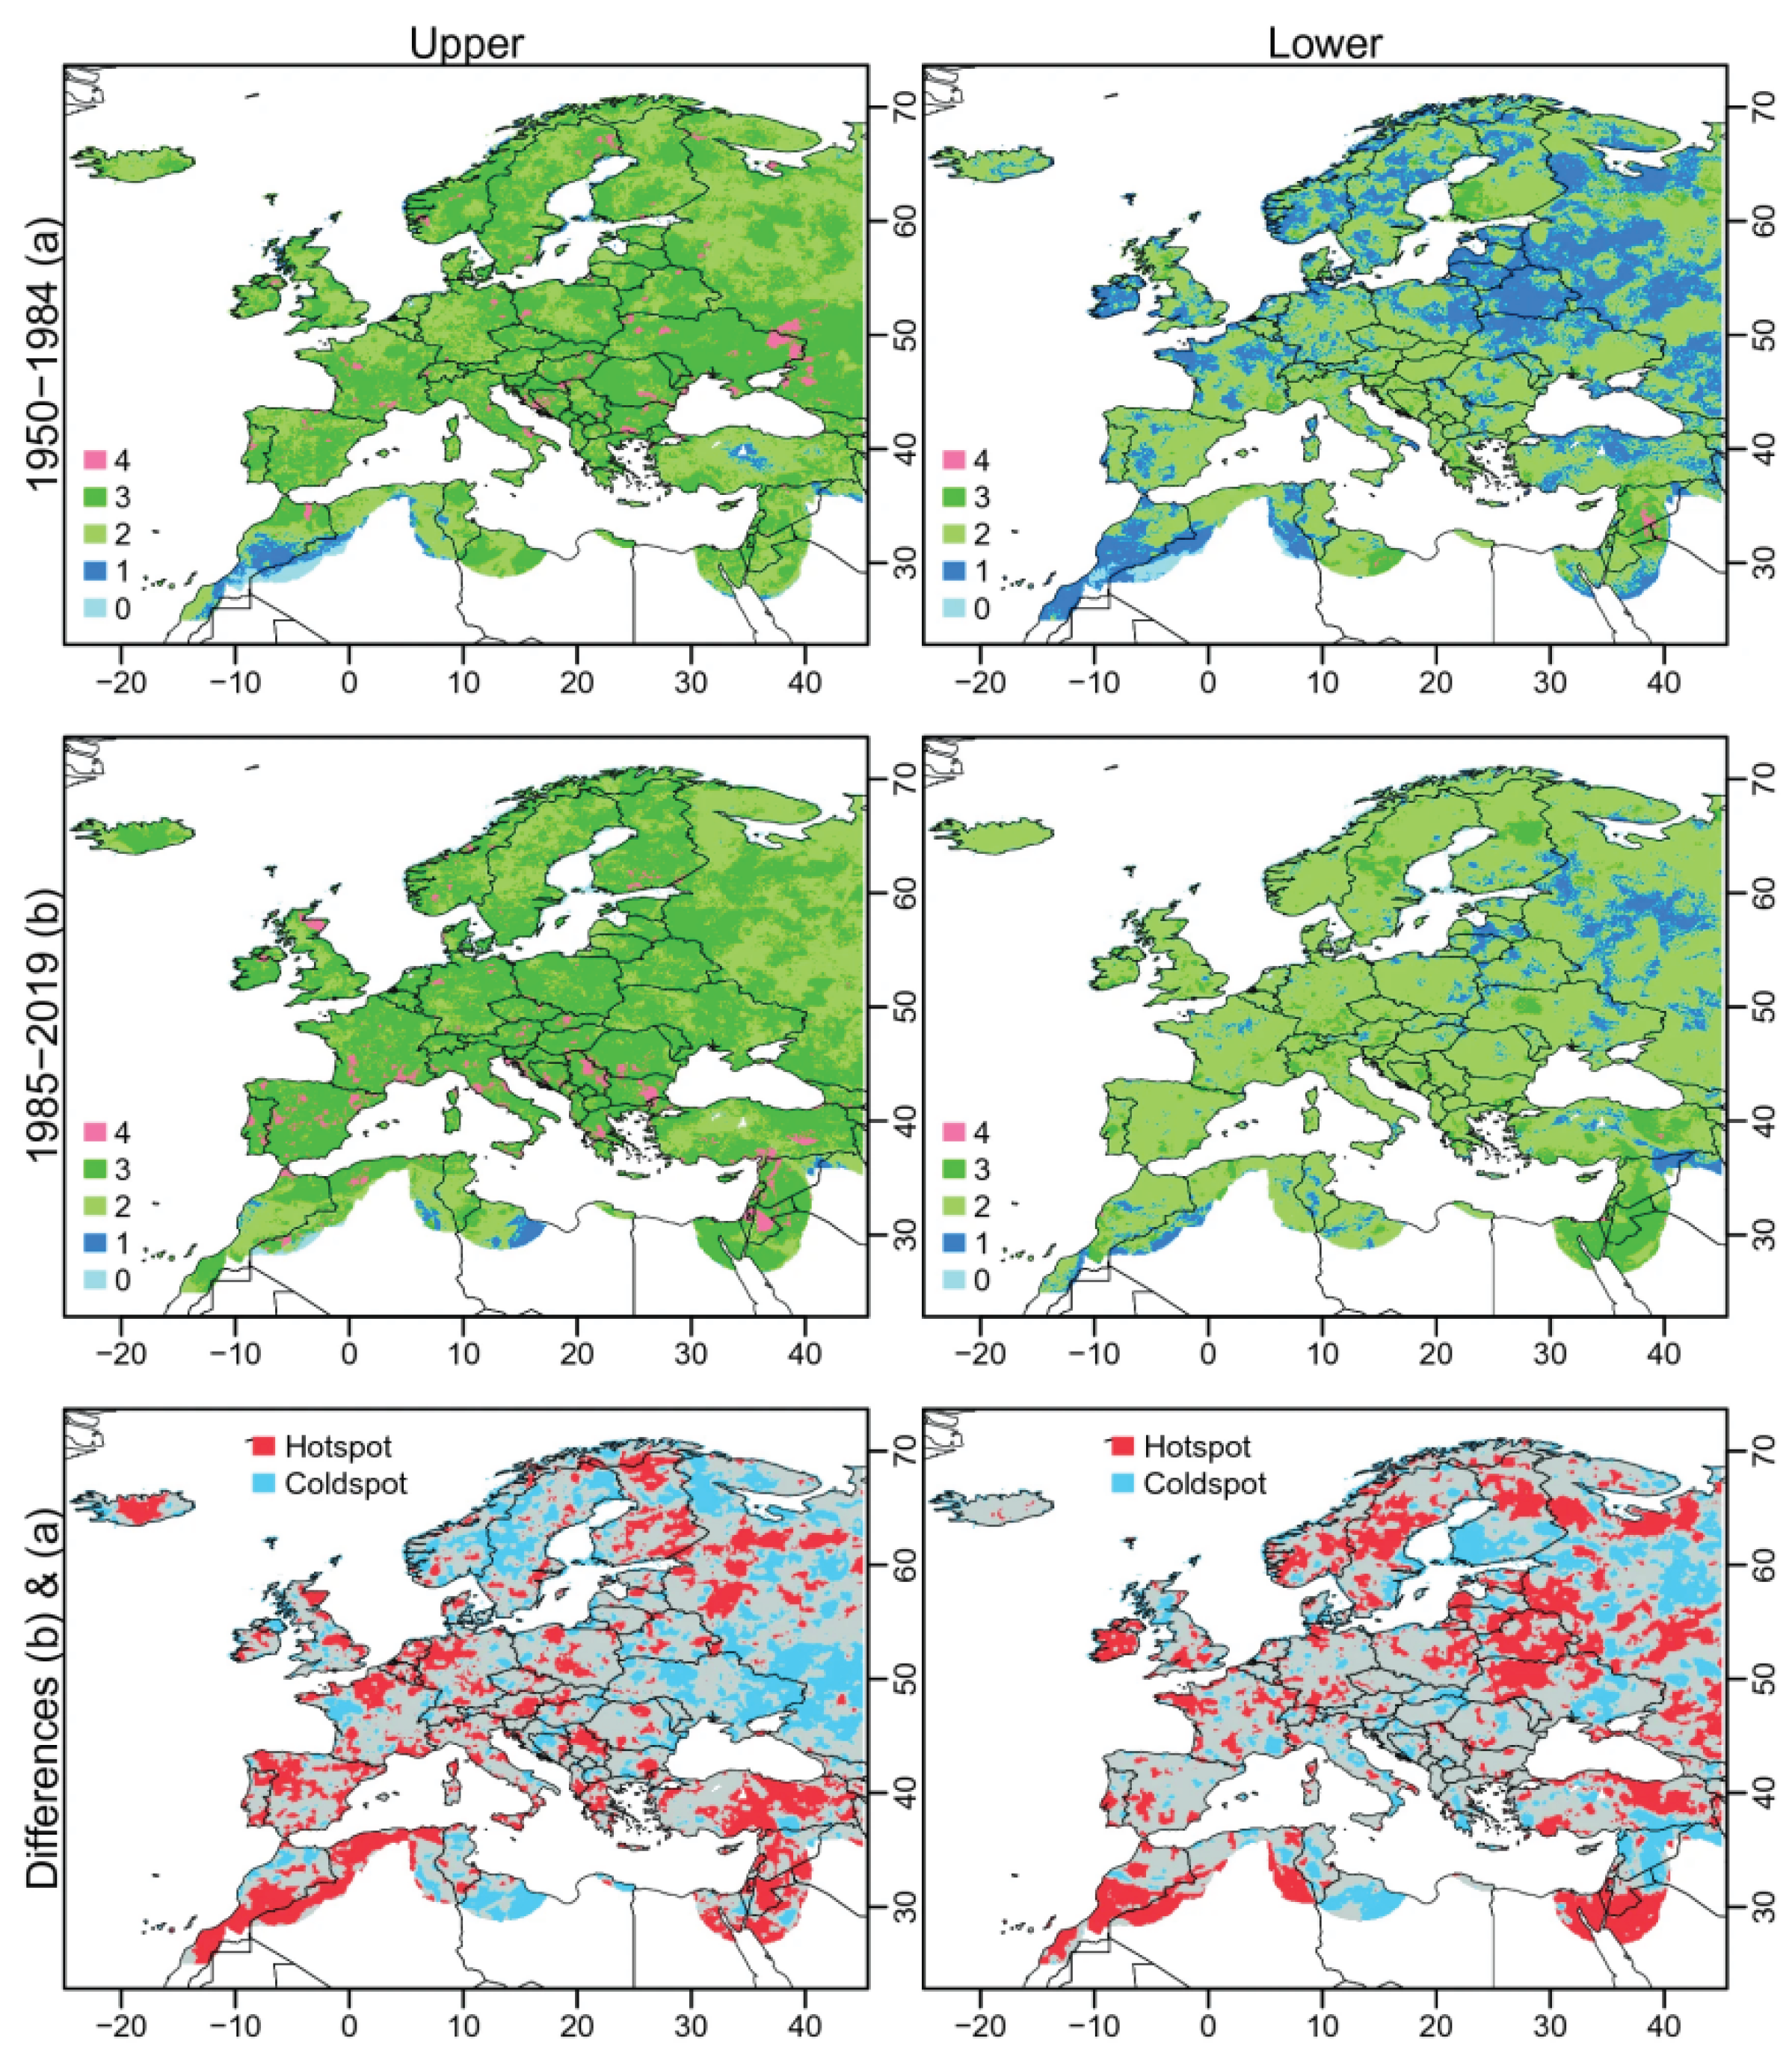
The regional assessment reveals clear differences across Europe. Atlantic and central regions are simulated with smaller deviations, while Mediterranean and Alpine areas show an underestimation of cluster duration by more than 25%. As illustrated in Figure 2, regional indices display heterogeneous patterns, with the Iberian Peninsula showing marked underestimation. These results suggest that convective systems and local topography remain difficult to represent in current models. Other recent studies also reported larger errors in southern Europe compared with northern maritime regions [20].
3.4. Broader Implications and Limitations
The results indicate that climate models represent the frequency and intensity of extremes more reliably than their temporal persistence. This limitation reduces confidence in flood risk analysis where clustering plays a key role. Refining physical parameterizations and using convection-permitting models are promising ways to improve performance. The use of gridded datasets may smooth localized extremes, and only part of the model ensemble was evaluated. Future studies should expand the scope to higher-resolution reanalyses and coordinated intercomparison projects to better capture spatiotemporal features of clustered events.
4. Conclusion
This study examined how climate models reproduce the temporal clustering of heavy precipitation events across Europe. The results show that most models capture the large-scale distribution of extremes but underestimate the persistence of consecutive wet days, with the strongest biases in Mediterranean and Alpine regions. The analysis also reveals a gap between the simulation of intensity and duration, which reduces confidence in flood and hydrological forecasts. Using consistent metrics, improving model schemes, and applying convection-permitting simulations are possible ways to narrow this gap. The contribution of this work is to connect clustering behavior with hydrological prediction, which has not been fully addressed in previous studies. The study is limited by the use of gridded datasets and a restricted set of models, but it provides clear guidance for improving precipitation simulations. Future research should use higher-resolution reanalyses and coordinated model experiments to capture local extremes and to support better water management.
References
- Kron, W., Löw, P., & Kundzewicz, Z. W. (2019). Changes in risk of extreme weather events in Europe. Environmental Science & Policy, 100, 74-83. [CrossRef]
- Nissen, K. M., & Ulbrich, U. (2017). Increasing frequencies and changing characteristics of heavy precipitation events threatening infrastructure in Europe under climate change. Natural Hazards and Earth System Sciences, 17(7), 1177-1190. [CrossRef]
- Sun, X., Meng, K., Wang, W., & Wang, Q. (2025, March). Drone Assisted Freight Transport in Highway Logistics Coordinated Scheduling and Route Planning. In 2025 4th International Symposium on Computer Applications and Information Technology (ISCAIT) (pp. 1254-1257). IEEE.
- Wright, D. B. (2018). Rainfall information for global flood modeling. Global flood hazard: Applications in modeling, mapping, and forecasting, 17-42. [CrossRef]
- Whitmore, J., Mehra, P., Yang, J., & Linford, E. (2025). Privacy Preserving Risk Modeling Across Financial Institutions via Federated Learning with Adaptive Optimization. Frontiers in Artificial Intelligence Research, 2(1), 35-43. [CrossRef]
- Alizadeh, O. (2022). Advances and challenges in climate modeling. Climatic Change, 170(1), 18. [CrossRef]
- LINCOLN, W. S. (2014). Analysis of the 15 June 2013 Isolated Extreme Rainfall Event in Springfield, Missouri. Journal of Operational Meteorology, 2(19).
- Müller, S. K., Caillaud, C., Chan, S., de Vries, H., Bastin, S., Berthou, S., ... & Warrach-Sagi, K. (2023). Evaluation of Alpine-Mediterranean precipitation events in convection-permitting regional climate models using a set of tracking algorithms. Climate Dynamics, 61(1), 939-957. [CrossRef]
- Yang, Z., DeFlorio, M. J., Sengupta, A., Wang, J., Castellano, C. M., Gershunov, A., ... & Ralph, F. M. (2024). Seasonality and climate modes influence the temporal clustering of unique atmospheric rivers in the Western US. Communications Earth & Environment, 5(1), 734. [CrossRef]
- Lucas-Picher, P., Argüeso, D., Brisson, E., Tramblay, Y., Berg, P., Lemonsu, A., ... & Caillaud, C. (2021). Convection-permitting modeling with regional climate models: Latest developments and next steps. Wiley Interdisciplinary Reviews: Climate Change, 12(6), e731. [CrossRef]
- Ehmele, F., Kautz, L. A., Feldmann, H., & Pinto, J. G. (2020). Long-term variance of heavy precipitation across central Europe using a large ensemble of regional climate model simulations. Earth System Dynamics, 11(2), 469-490. [CrossRef]
- Herrera, S., Kotlarski, S., Soares, P. M., Cardoso, R. M., Jaczewski, A., Gutiérrez, J. M., & Maraun, D. (2019). Uncertainty in gridded precipitation products: Influence of station density, interpolation method and grid resolution. [CrossRef]
- Wang, C., & Chakrapani, V. (2023). Environmental Factors Controlling the Electronic Properties and Oxidative Activities of Birnessite Minerals. ACS Earth and Space Chemistry, 7(4), 774-787. [CrossRef]
- Prein, A. F., & Gobiet, A. (2017). Impacts of uncertainties in European gridded precipitation observations on regional climate analysis. International Journal of Climatology, 37(1), 305-327. [CrossRef]
- Bissi, F. (2024). Heat wave and heat stress space-time pattern analysis in Lombardy using climate reanalysis data.
- Barlow, M., Gutowski Jr, W. J., Gyakum, J. R., Katz, R. W., Lim, Y. K., Schumacher, R. S., ... & Min, S. K. (2019). North American extreme precipitation events and related large-scale meteorological patterns: a review of statistical methods, dynamics, modeling, and trends. Climate Dynamics, 53(11), 6835-6875. [CrossRef]
- Xu, K., Lu, Y., Hou, S., Liu, K., Du, Y., Huang, M., ... & Sun, X. (2024). Detecting anomalous anatomic regions in spatial transcriptomics with STANDS. Nature Communications, 15(1), 8223. [CrossRef]
- Morbidelli, R., Saltalippi, C., Flammini, A., Corradini, C., Wilkinson, S. M., & Fowler, H. J. (2018). Influence of temporal data aggregation on trend estimation for intense rainfall. Advances in Water Resources, 122, 304-316. [CrossRef]
- Wang, Y., Shen, M., Wang, L., Wen, Y., & Cai, H. (2024). Comparative Modulation of Immune Responses and Inflammation by n-6 and n-3 Polyunsaturated Fatty Acids in Oxylipin-Mediated Pathways. [CrossRef]
- Colucci, R. R., Žebre, M., Torma, C. Z., Glasser, N. F., Maset, E., Del Gobbo, C., & Pillon, S. (2021). Recent increases in winter snowfall provide resilience to very small glaciers in the Julian Alps, Europe. Atmosphere, 12(2), 263. [CrossRef]
Figure 1.
Changes in consecutive wet days over Europe under high-emission scenarios.
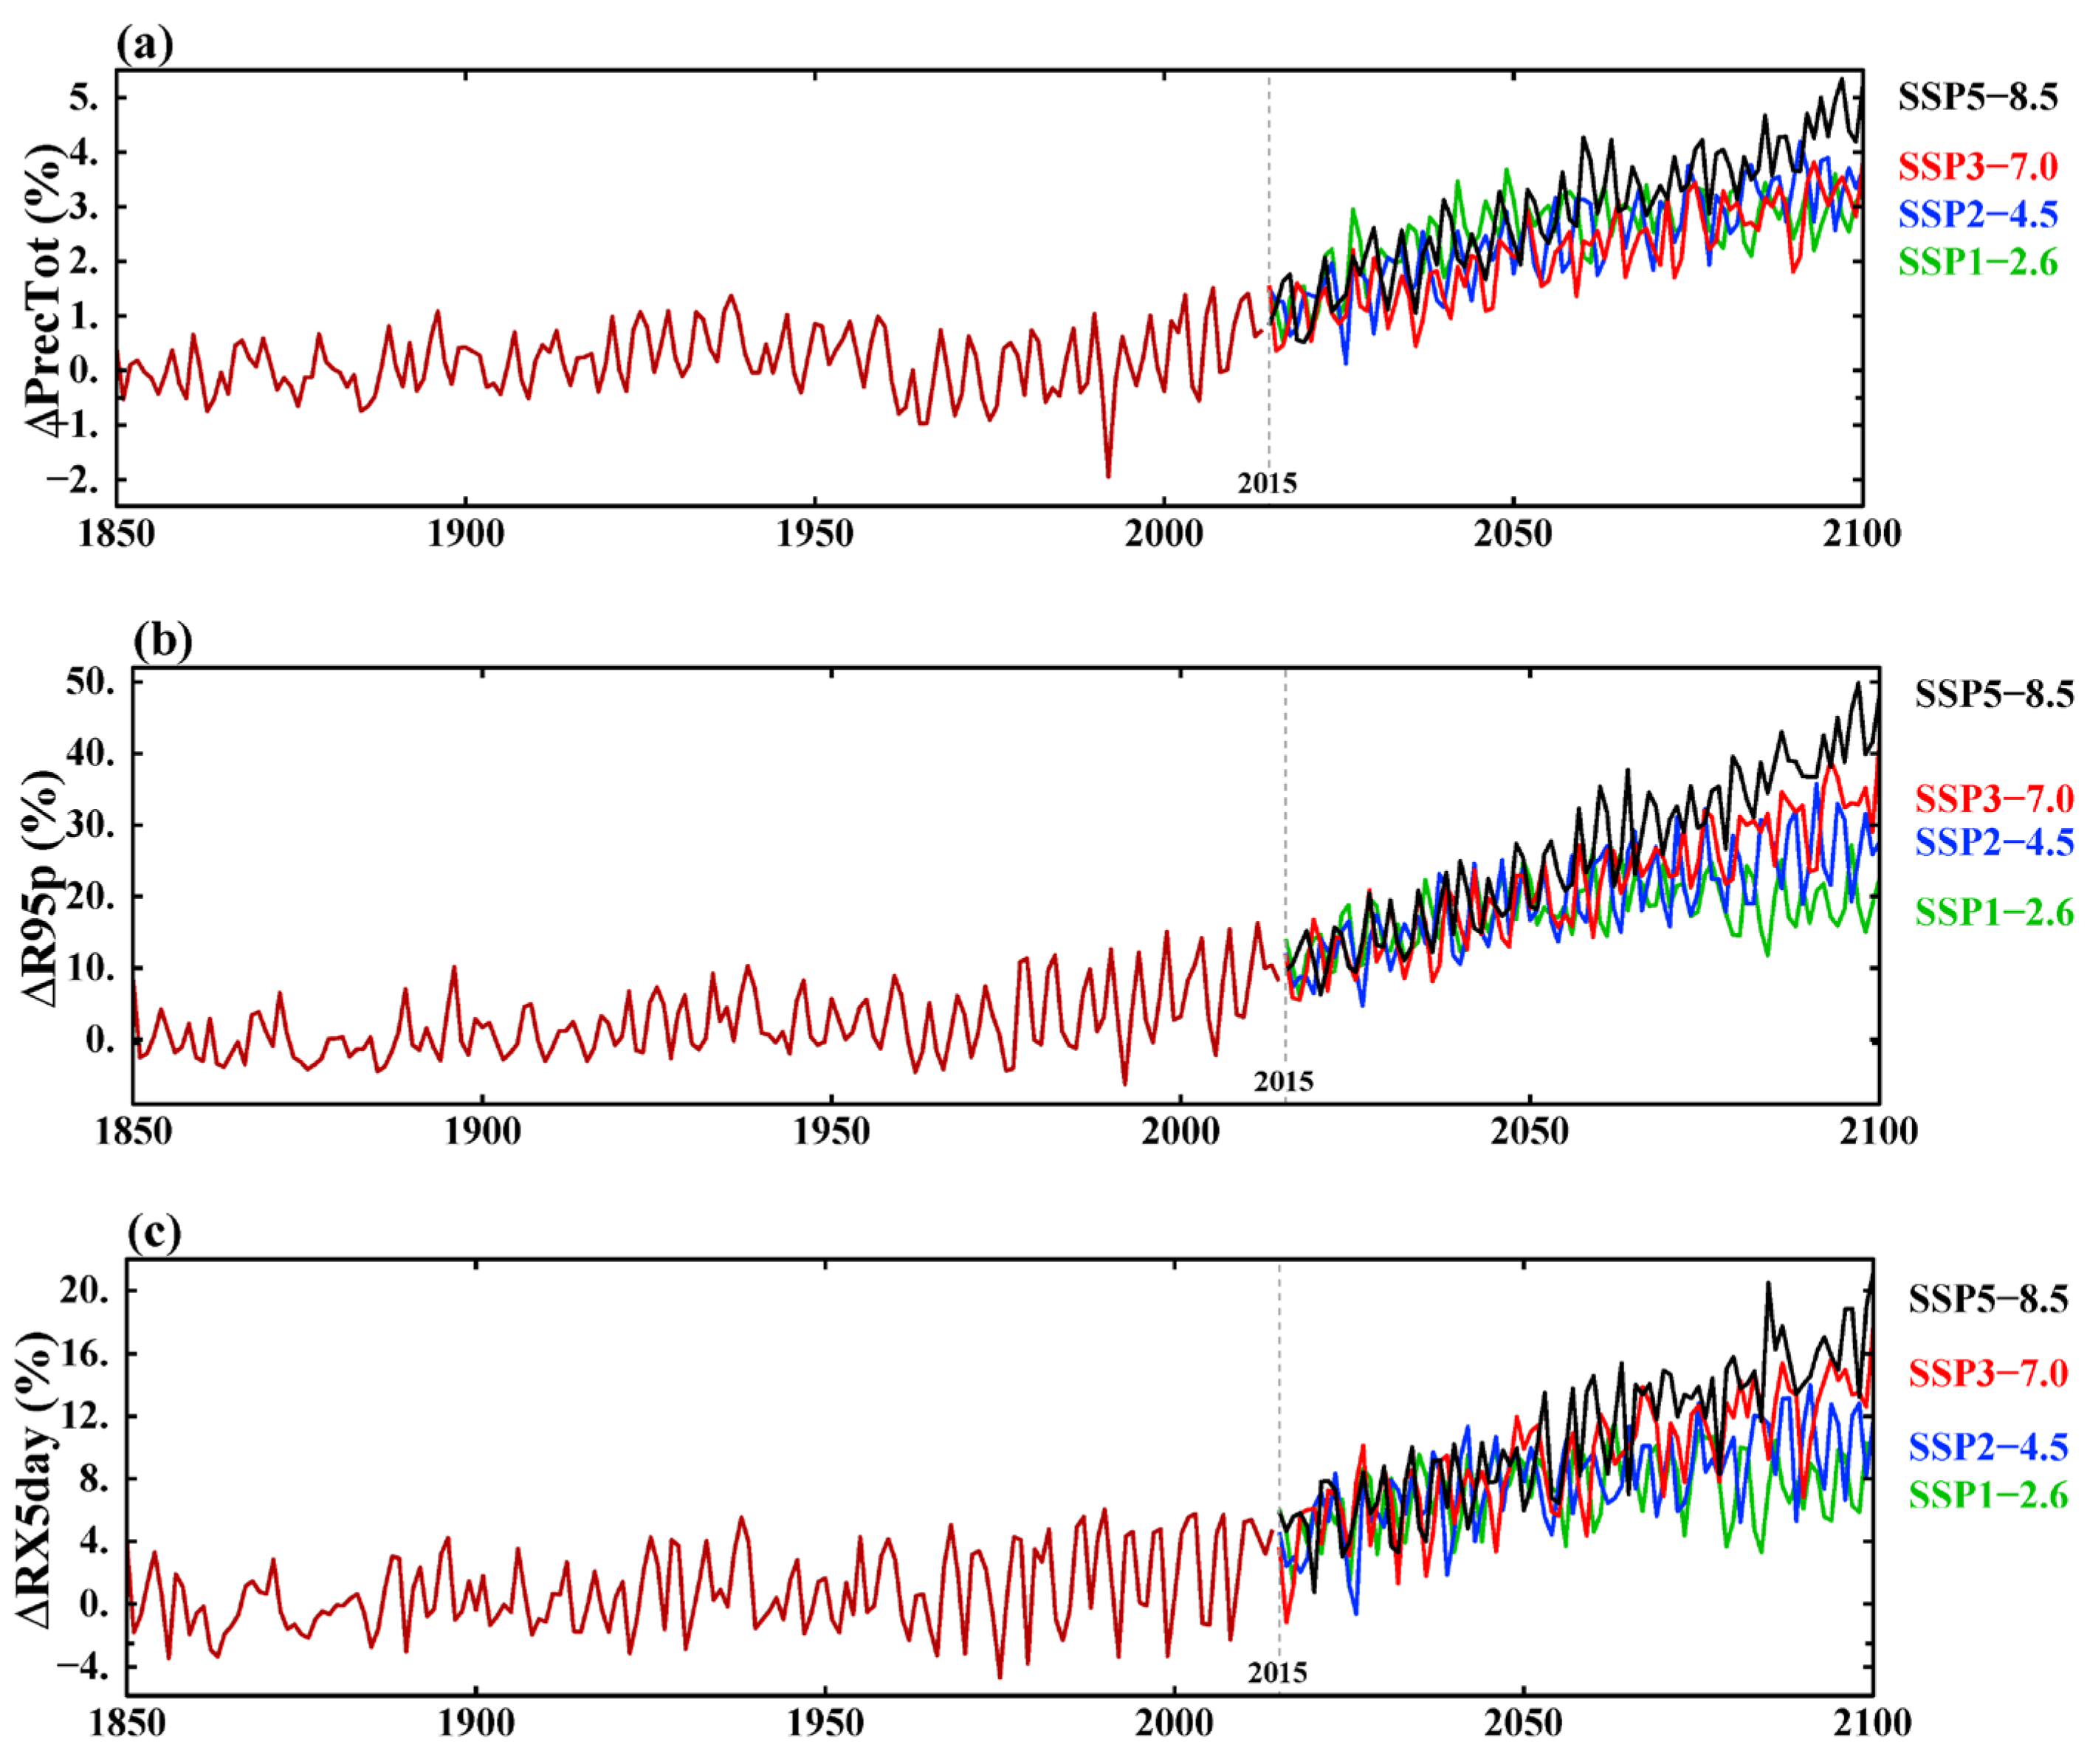
Figure 2.
Regional differences in extreme precipitation indices with notable clustering bias in southern Europe.
Figure 2.
Regional differences in extreme precipitation indices with notable clustering bias in southern Europe.
Disclaimer/Publisher’s Note: The statements, opinions and data contained in all publications are solely those of the individual author(s) and contributor(s) and not of MDPI and/or the editor(s). MDPI and/or the editor(s) disclaim responsibility for any injury to people or property resulting from any ideas, methods, instructions or products referred to in the content. |
© 2025 by the authors. Licensee MDPI, Basel, Switzerland. This article is an open access article distributed under the terms and conditions of the Creative Commons Attribution (CC BY) license (http://creativecommons.org/licenses/by/4.0/).
Copyright: This open access article is published under a Creative Commons CC BY 4.0 license, which permit the free download, distribution, and reuse, provided that the author and preprint are cited in any reuse.


