
Submitted:
24 November 2025
Posted:
25 November 2025
You are already at the latest version
Abstract
For the past few decades, promising results from various research conducted on alkali-activated binders to progressively increase their potential use in the construction industry as a replacement for ordinary Portland cement (OPC) for concrete production has emerged. However, due to the high corrosiveness of liquid materials used in the preparation of these binders, which requires extreme handling precautions, a development of a one-part mixing system is needed for replacement of the used conventional two-part system. This paper establishes a parallelism between one-part and two-part mixing system of alkali-activated mortars (AAM). One-part mortars produced using only solid particles, were made of the same mixtures’ proportions used to produce the conventional two-part AAM, which normally made using solid precursor and liquid activators. Both one-part and two-part mortar specimens were mixed, cured and tested under the same conditions. The fresh and hardened properties as well as the microstructure development were compared for both one-part and two-mortar mixes. Setting time results demonstrated that one-part mortars set faster than corresponding two-part mortar mixes; while their workability were relatively the same. In terms of strength development, at early ages of eight hours, the compressive strength of one-part mortar mixes were equivalent to only 3% of corresponding two-part mixes. However, it increased up to 50% of that in two-part mortars specimens after 24 hours of oven curing. Microstructural analysis demonstrated presence of hydrogarnet crystal phases in one-part mortar mixes which was responsible for the faster setting properties of these mortars. But also factors such as low pH, lack of solubility of solid activator played a significant role in lowering the strength of AAM at different ages compared to conventional two-part mixes.
Keywords:
class C fly ash
; alkali-activated mortars
; one-part mixing
; compressive strength
; XRD
1. Introduction
The use of concrete in the construction industry has increased so much to a level of making it the most used man-made material, and second used material on earth after water. When associating this high usability rate of concrete to the manufacturing process of ordinary Portland concrete (OPC), which emits a high quantity of carbon dioxide to the atmosphere, it result in a negative environmental footprint that keeps on increasing and needs to be taken care of [1]. The use of by-product materials such as ground granulated blast furnace slag (GGBFS) and coal fly ash (FA) in a full substitution for OPC as the main binder for concrete, in response to its negative environmental impact, is a plausible solution that is still being investigated by many authors. These binders are commonly called geopolymers or alkali-activated (AA) binders.
AA binder results from a reaction between an aluminosilicate source material and an alkaline activator. These binders exhibit good properties such as high early compressive strength, and better durability such as acid resistance and fire resistance [2,3]. AA binders normally are produced using a two-part mix [4,5,6,7] where a solid source material is mixed with a high alkalinity liquid activator and extra water may be added mostly for rheology purposes. However, its applicability is still restricted to laboratory and pre-cast industries with facilities required to accommodate for storage, and handling of the liquid activators which are very corrosive materials. In addition, producing this type of binders needs well-trained personnel, which put extra limit on using it. In order to overcome these restrictions, the development of a much simpler, safer and user-friendly version of AA binder using one-part mixing with all solid components is essential.
Over the years, different combinations of materials have been proposed by researchers to develop one-part AA binder. Most of these authors proposed complex mixes such as the case with Heitzmann et al. [8] who came up with a mix of metakaolin, amorphous silica, slag, potassium hydroxide, potassium silicate combined with either fly ash or calcined clay. Same thing with Davidovits [9] when he proposed a one part mix composed of metakaolin, slag, sodium/potassium disilicate. With intensions of developing a much more commercial one-part zero-cement binder, Duxson [10] did suggest to mix coal and feldspar rich in calcium, melted separately, cooled and grinded together to produce powdered one-part zero-cement precursor. All of the above proposed one-part binders used very complex materials or combination of materials, were not cost effective, and still needed well-trained personnel to handle; which made them hard to be implemented.
In terms of using fly ash, more recent researches have been conducted using much simpler combination of materials. Hajimohammadi et al. [11] used only class F fly ash combined with solid sodium hydroxide and sodium silicates. In his experiments, fly ash was mixed to solid sodium silicate before adding water and at last, solid sodium hydroxide were added to the wet mix. Results from his experiment reported compressive strength of 65 MPa after 3 weeks of continuous heat curing at 40º C, this long duration of the curing process made it hard to be implemented. Yang and Song [12], developed one-part zero-cement using fly ash as well with the same combination of solid sodium hydroxide and sodium silicate but cured all specimens at ambient temperature, reporting a 28 days compressive strength of 9.45 MPa, yet while repeating the same experience by substituting fly ash with slag, the strength increased up to 50 MPa after 28 days of ambient curing. However, in term of cost of evaluation, the use of slag is very expensive compared to fly ash. Askarian [13] included OPC into in various proportions to form a hybrid OPC-class F fly ash geopolymer concrete, and reported that it did had a significant effect on the compressive strength at early ages and at ultimate strength because of the rapid reaction between OPC and the used alkali activators. The compressive strength of concrete specimens increased from 11.4MPa to 33.4Mpa after 28 days of ambient curing, but a decrease in the workability and setting time occurred as a result of the addition of OPC into zero-cement mixes.
Since the majority of the produced fly ash in the United States are class C fly ash with a relatively high calcium content, it is important to develop a one-part zero-cement mix that utilize this fly ash as the precursor. According to the best knowledge of the authors, there is no published research that addressed this point. In this study, class C fly ash was used in attempting to produce one-part zero-cement mortars.
As an initial trial, the same mix proportions used to produce two-part AAM in previous studies [14], were used to generate one-part AAM in this study. All activator solutions were replaced by solid materials, while keeping the ratio between different elements constant. Both one-part and two-part AAM mixes were made, and a comparison between one-part and two-part mixing were conducted to evaluate the difference in terms of fresh properties, and compressive strength development during early ages. A microstructure analysis of these binders was investigated as well in order to determine the difference of phase compositions occurring in each of the two types of AA binder.
2. Materials Properties
2.1. Fly Ash
Three class C fly ashes with different characteristics were used as precursor (Table 1). The calcium content of the FAs varied from 21% to 37%, the alumina content from 14% to 20%, and the silica content from 37% to 44%. The nomenclature of the FAs started with the letter C followed by the percentage of calcium oxide present in that FA. The fineness of FA particles was measured by evaluating the surface area using a Nova 2000e surface area analyzer according to the Brunauer-Emmett-Teller (BET) theory (Table1).
2.2. Activators
Both solid and liquid activators were used in this study. The solid activators consisted of sodium hydroxide pellets (SH) and solid sodium silicate powder (SS). The liquid sodium silicate was a type D solution with ingredient composition of 56% water and 44% sodium silicate solids. The liquid sodium hydroxide was a 10M solution prepared in the laboratory by dissolving solid sodium hydroxide pellets into distilled water. These two liquid solutions, SS and SH, were mixed together half an hour prior to mortar mixing and the resulting mix were used as the activator medium for the mortar preparation.
2.3. Sand
Surface saturated dry (SSD) river sand, meeting ASTM C30, with a specific gravity of 2.6 was used in this study.
3. Experimental Procedure
3.1. Mix Design
Three different mixtures including low alkaline (LA), high alkaline (HA), and high silicates (HS) were prepared out of each fly ash using two different mixing procedures, i.e., one-part and two-part mixing, i.e., 18 mixtures were investigated during this research. Both LA and HA mixtures are considered also low silicate (Table 2). For comparison purposes, both the one-part and two-part mixing were designed to have the same amount of water and solid activator, i.e., SS and SH. Therefore, despite the difference between the ratio of liquid activator to FA (LA/FA) used for two-part mixing, and the ratio of solid activator to FA (SA/FA) used for one-part mixing, the total ratio of activator to FA (AC/FA) is the same in both one-part and two-part mixing (Table 2 and Table 3).
The selection of these three mix designs was based on a previous study conducted using the same FAs where a wide range of mix proportions were investigated and optimized [14]. The nomenclature of the mortar mixtures consisted of a letter “M” standing for mortar, followed by percent of the calcium content in the precursor, a short dash, and either LA, HA or HS for alkaline solution. For example, mix M21-HA represented a mortar mix made from FA C21, using the “HA” mix design.
3.2. Mixing Procedure
A Hobart mixer and a mixing time of 13 minutes were used for all mixtures following Gomaa et al. (2019). In the case of one-part, the SS and SH were mixed together with the fly ash for two minutes; then, sand was added to the mixture and mixed for another minute at speed of 130 rpm to allow a homogenous mix. Water was then added gradually over two minutes and then the mix was stopped for 0.5 minutes to remove stuck particles at the bottom and on the walls of the mixing bowl. Finally, the mix was restarted at speed of 300 rpm for six minutes.
In the two-part mixing, sand and fly ash were mixed together for one minute at a speed of 130 rpm, followed by gradually adding water to the mixture over one minute. Then, the mix was stopped and scrapped for 0.5 minutes to remove stuck particles, restarted and the activator solution were added to the mixture into a 5 equivalent proportions over five minutes. The mix was stopped for a second time and scrapped for 0.5 minutes and restarted at a speed of 300 rpm for 5 more minutes.
3.3. Curing Process
After mixing, mortar was placed into a 50 mm cube brass molds and compacted per ASTM C109-16a. Then, the specimens were sealed into plastic oven bags, to avoid moisture loss, and oven cured at different temperatures and durations as follows. One group of the specimens were cured at 30º C, simulating ambient temperature during a summer season in the Midwest of the US [15], for 24 hours or 168 hours (7-days). The other group of specimens were cured at either 55º C or 70º C for either 8, 16, or 24 hours.
3.4. Fresh and Hardened Properties Tests
The workability and setting time of all mortar mixtures were measured per ASTM C143/C 143M and ASTM C807, respectively. The workability was measured by compacting two equivalent layers of mortar mixtures into a standard cone with a known base diameter of 100 mm (4 in) resting on a circular base plate, safely remove the cone, rising and dropping the base plate 25 times within 15 seconds, and finally record the expansion of the mortar over the plate (flow). The setting time was measured by means of a Vicat needle, recording the penetration of the needle into the mortar over time (Figure 1).
At the end of the curing process, all mortar specimens were removed from the oven and demolded. The compressive strengths of three replicate cubes per mixture were measured using a Tinius Olsen compression machine per ASTM C109-16a and the average strength per mixture was determined.
3.5. Microstructure Analysis
The formation of chemical components during the hardening process under each curing condition was investigated using X-Ray Diffraction technics (XRD) on both one-part and two-part AA paste. Paste was selected rather than mortar to avoid including diffraction patterns of quartz crystals present in sand grains, and thus obtaining more accurate results. Paste mixtures corresponding to the different mortar mixtures were prepared and cured using the same characteristics as the corresponding mortar mixes. The pastes were then crushed into very fine particles using a mortar and pestle. Approximately 1 gram of the resulting powder for each paste sample was placed into a sample holder and XRD measurements were performed using a PANalytical Multipurpose Diffractometer utilizing a Cu source and a PIXcel detector. Diffraction patterns of the present crystalline phases in each sample reflected in the form of sharp peaks appearing at different 2Ɵ locations were determined and analyzed. A comparison between XRD patterns of one-part and the corresponding two-part paste samples was evaluated to determine the difference in phase composition of the two AA mixes.
4. Results and Discussion
The fresh and hardened properties of all mixtures are discussed in this section. The section also includes discussion of the microstructure of the paste mixtures.
4.1. Fresh Properties
The one-part mixtures set two to ten times faster than the corresponding two-part mixtures, depending on the variation of Si/Al ratio and the surface area of FA. The final setting time values of the one-part AAM mixtures ranged from 30 to 85 min for M29, 45 to 165 min for M21, and 120 to 190 min for M37 (Figure 2). While in the case of two-part mixing, the setting times ranged from 300 to 320 min, 290 to 330 min, and 210 to 245 min for M29, M21, and M37, respectively.
For all mixtures, the setting time decreased with decreasing the Si/Al content in the mixture solution (Figure 3). In the case of the two-part mixtures, the availability of dissolved silica species in the liquid sodium silicate activator before the dissolution of the FA particles led to a high Si/Al ratio in the mixture solution which resulted in longer setting time. However, in the case of the one-part mixtures, all constituents, i.e., FA and solid activators dissolute, the faster dissolution of calcium and alumina species in water compared to silica led to formation of calcium-aluminate-hydrates components such as Hydrogarnet (CaO)3.(Al2O3).(H2O)6 which triggers flash setting of cementitious materials [16]. This phenomenon explains the rapid setting time of all one-part mixtures compared to the corresponding two-part mixtures. As a result, both mixes LA and HA with low silica content had lower setting time values compared to mixes HS. The alkalinity had insignificant effect on the setting time with LA had slightly shorter setting time. In addition, M29 mortar mixes had the shortest setting times among all the mixes due to the highest surface area FA C29 (Table 1), a faster reaction rate is expected to occur as compared to the two other FA batches. M37 mixes took longer time to set since they had the smallest surface area and thus slower reaction rate.
Workability results were expressed in percentage increase (%), with 0 representing zero flow, and 150 the maximum flow that can be recorded (Figure 4). The trend of the workability was similar to that of the setting time results. The one-part AAM mixes had less workability compared to their corresponding two-part AAM mixes. The workability values of the one-part mixtures ranged from 5% to 65%, 50% to 70%, and 65% to 95% for mixes M29, M21, and M37, respectively, while those of the corresponding two-part mixtures ranged from 85% to 125%, 85% to 110% , and 85 to 105%, respectively. The poor workability of one-part mixes compared to two-part mixes was essentially due to their faster setting properties for the reason mentioned earlier.
4.2. Compressive Strength of AAM
In this section, the compressive strength of all mixtures is discussed.
4.2.1. Compressive Strength of AAM Cured at Ambient Temperatures
M37 had the highest compressive strength values for specimens cured at 30° C (86° F), followed by M29, and M21 with two-part mixes displayed higher compressive strengths than the corresponding one-part mixes. The compressive strength of the one-part mixtures cured at 30° C (86° F) for 24 hours ranged from 17.4 to 25.4 MPa (2520 to 3680 psi) for M29, from 0.84 to 10.5 MPa (120 to 1520 psi), for M21, and 11.5 to 15.7 MPa (1670 to 2280 psi) for M37 (Figure 5). These values represented approximately 94% to 99% of the compressive strength of their corresponding two-part M29, 5% to 42% for M21, and 38% to 52% for M37.
The compressive strength of the one-part and two-part mixture increased with increasing the curing time to 7 days. The compressive strength values increased by approximately 37%, 15%, and 44% for mixes LA, HA, and HS mixes of M29; approximately 120% and 290% for LA and HA mixes of M21, while in the case of mix HS, the 7-day compressive strength was 10 times greater than the 1-day strength. For M37 mixes, a 76%, 89%, and 75% strength increase were observed between the 1-day and 7-day strength of mixes LA, HA, and HS, respectively.
The tremendous difference in the compressive strengths of one-part and two-part AAM mixes was due to the physical properties of the mix (i.e. workability), the pH, and the solubility product of the materials.
It was shown in previous studies that the strength development of alkali-activated systems comes from a combination between the geopolymerization and hydration processes. The contribution of each process depends on many factors, such as, curing temperature, curing time, added alkali-activators, and the chemical composition of FA. In short, the geopolymerization process’s contribution to the strength development increases with increasing the curing temperature, curing time, alkali-activators and the silica and alumina contents of the FA. The hydration process’s contribution to the strength development increases with decreasing the curing temperature (in case of oven-dry curing), increasing curing time, and increasing the calcium content of FA.
As stated earlier, in the case of one-part mixing system the dissolutions of all elements in water started simultaneously. Contrary to the two-part mixing system, using liquid activator solutions created a favorable environment for the geopolymerization reaction by improving the dissolution and hydrolysis mechanisms [17,18] which affected the compressive strength development of the mixes.
The geopolymerization reaction is influenced by the Si/Al and calcium content of the precursor as well as the alkalinity and constituent of the activators. The silica availability controls the strength development while the alumina content controls the setting properties [12]. In the case of two-part mixes, the high availability of dissolved silica in addition to the presence of dissolved calcium led to formation of products such calcium-silicate-hydrate (CSH) and/or calcium-aluminate-silicate- hydrate (CASH) which influences the high strength development of cementitious materials at ambient temperature. For one-part mixes, the faster dissolution of alumina compared to silica, leads to a high concentration of dissolved alumina in the solution which reduces the dissolution capacity of Si in water [19]. In addition, the dissolution of calcium species and hydroxyl ions in the mix, would lead to having a solution saturated essentially with calcium, alumina and hydroxyl ions, and thus precipitation of products such as calcium hydroxide (Ca(OH)2) and calcium-aluminate-hydrates which hinders the strength development of the mixes [20].
The variation of compressive strength of AAM mixes with respect to their source material (FA), was mainly due to the difference in the chemical composition of their respective source materials (i.e. FA). FA C37 having the highest calcium content, had the higher ability for its mixes to develop relatively higher strength at 30° C (86° F) where the hydration process does not require relatively high temperature to take place. FA C21 with the lowest calcium content and higher Al and Si content, required much elevated temperature for fast strength development. However, due to the high surface area of FA C29 (Table 1) compared to the remaining FAs, both the dissolution and the reaction rate of M29 mixes happened faster, which influenced the strength development of these mixes at early ages, allowing the 1-day strength of one-part mixes to be similar to those of two-part mixes (Figure 5a).
4.2.2. Compressive Strength of AAM Cured at Elevated Temperatures
The compressive strengths of the one-part mix M29-HS cured at 55° C (131° F) reached a maximum of 1.5 MPa (220 psi) after 24 h of curing (Figure 6). However, those of mixes M29-LA and M29-HA increased from 7.89 to 11.7 MPa (1150 to 1690 psi), and from 14.2 to 19.3 MPa (2070 to 2800 psi), respectively, when the curing duration was increased from eight hours to 24 hours. These increases are corresponding to an average strength increase of about 36 - 48%. The two-part mortar mixes displayed compressive strengths of 20 – 23.4 MPa (2900 - 3400 psi) for all M29 mixes, after eight hours of curing; which increased to 27.6 to 32.4 MPa (4000 to 4700 psi) after 24h of curing. These values represent approximately 175% of that of the corresponding one-part M29-LA and M29-HA mixes.
Increasing the curing temperature to 70° C (158° F), improved the strength of one-part M29-LA and M29-HA cured for eight hours by approximately 12%. However, when these mixes were subjected to extended curing time of 16 and 24 hours at 70° C (158° F), they displayed either slightly improved or unchanged strength. Furthermore, higher curing temperature and extending curing time was quite effective for the one-part M29-HS reaching 17.8 MPa (2580 psi) at 24 hours curing time being 11 times greater than the corresponding mixture cured at 55° C (131° F).
In the case of two-part mixing and with increasing the curing temperature, the compressive strengths of mixes M29-HS and M29-HA were approximately the same at eight hours curing and then increased from about 27.6 to 31.0 MPa (4000 to 4500 psi) as the curing duration was increased to 24 hours, respectively; and the strength of mix M29-LA increased from 19.3 to 24.8 MPa (2800 to 3600 psi). Furthermore, increasing the curing temperature from 55 °C (131 °F) to 70° C (158° F) increased the compressive strength by an average of 6% for mixes HA and HS, and 24% for mix LA . At short curing duration of eight hours, the strength of the two-part mix M29-HS was 13 times greater than its one-part counterpart. However, by 24 hours of curing, the one-part mixing strength considerably increased and the average strength of all one-part M29 mixes reached 50% - 80% of the corresponding two-part mixes.
The relatively higher compressive strength of the two-part mixes when compared to the corresponding one-part mixes were related to the favorable reaction environment created by the liquid activators used in two-part as mentioned earlier. The lower strength development of mix M29-HS compared to mixes M29-LA and M29-HA for both one-part and two-part mixes cured at 55° C (131° F) was related to the proportion configuration of these mixes. As shown in Table 2, mix HS had a SS/SH ratio of 2, while mixes LA and HA had a SS/SH ratio of 1, therefore the lower availability of hydroxyl ions in mix HS as compared to mixes LA and HA implied a lower pH, and thus a relatively slower dissolution rate of the element in this mix (HS). But when the curing temperature was increased to 70° C (158° F), a considerable increase in strength of this mix occurred especially for the one-part mixing, since with increasing the temperature, more silica dissolved and contributed to the strength development of mixes leading to formation of compounds rich in silica, calcium and alumina (CASH).
The compressive strengths of the one-part mix M21-HS cured at 55° C (131° F) reached a maximum of 0.34 MPa (50 psi) after 24 h of curing (Figure 7). However, those of mixes M21-LA and M21-HA significantly increased by 395% to 670%, i.e. from approximately 4 MPa (600 psi) to 18.5 and 26.7 (2680 and 3900 psi), respectively, when the curing duration was increased to 24 hours. The two-part mortar mixes displayed compressive strengths of 17.2 MPa to 27.5 MPa (2500 to 3990 psi) for all M21 mixes, after eight hours of curing; which increased to 31 to 36.7 MPa (4500 to 5320 psi) after 24 hours of curing. These strengths of the two-part M21-LA and M21-HA mixes cured for 24 hours represented approximately 125% to 200% of the corresponding one-part mixtures. For the case of two-part M21-HS mix, the strength was multiple folds higher than that of the corresponding one-part mix at all curing times since the one-part developed very low strength.
Increasing the curing temperature to 70° C (158° F), improved the strength of one-part M21-LA and M21-HA cured for eight hours by approximately 300% and 445% compared to curing at 55° C (131° F). The specimens continued to gain strength as the curing time increased to 16 hours and 24 hours for M21-HA and M21-LA, respectively. However, neither the higher curing temperature nor the extending curing time was effective for the one-part M21-HS reaching 0.7 MPa (100 psi) at 24 hours curing time.
In the case of two-part mixing and with increasing the curing temperature to 70° C (158° F), the compressive strengths of all mixes at eight hours curing increased by 30% to 74% compared to those cured at 55° C (131° F) and then slightly increased reaching 35.2 to 37.9 MPa (5100 to 5500 psi) as the curing duration was increased to 24 hours. At short curing duration of eight hours, the average strengths of the two-part mix M21-LA and M21-HA was approximately 140 - 170% of its counterpart one-part. However, by 24 hours of curing, the one-part mixing strength considerably increased, and the average strength of two-part mixes reached 17% -23% of the corresponding one-part mixes.
The poor strength development observed in the case of mix M21-HS as compared to mixes M21-LA and M21-HA for both one- and two-part AAM was related the less amount of sodium hydroxide in the activator as mentioned earlier. In addition, due to the lower calcium content of FA C21 as shown with Table 1, formed products in this case would essentially be rich in silica and alumina, which requires high temperature for faster strength development as it is related to the activation energy theory whereby higher kinetic energy is needed to intrigue the geopolymerization action [21]. The kinetic energy increased by either increasing the temperature or prolonging the duration of curing. This explained the high rise in strength of all mixes as the temperature was increased from 55° C to 70° C (from 131° F to 158° F), or when the duration of curing went from eight hours to 24 hours.
The compressive strength of M37 mortar mixes is summarized in Figure 8. At 55° C (131° F) of oven curing, for one-part mixing, the compressive strength of mix M37-HS was less than 0.55 MPa (80 psi) after the first eight hours of curing, then consistently increased to reach up to 17.2 MPa (~2500 psi) after 24 hours of curing; while strengths of mixes M37-LA and M37-HA only increased from 13.8 – 14.5 MPa (2000 - 2100 psi) to 17.2 – 20.7 MPa (2500 and 3000 psi) as the duration of curing went from eight to 16 hours, respectively. This represented about 200% strength increase in the case of mix M37-HS; 45% and 25% for mixes M37-LA and M37-HA, respectively.
In the case of corresponding two-part mixing, mix M37-HS demonstrated a high strength from early ages equal to 26.9 MPa (3900 psi) after only eight hours of curing; mixes M37-LA and M37-HA had strengths equal to 23.4 and 22.8 MPa (3400 and 3300 psi), respectively. These strengths were 1.6, 1.7 times greater than the one-part mixing for mixes LA and HA; and 40 times greater for mix HS, respectively.
When the curing temperature was elevated to 70° C (158° F), the strength of one-part mixes increased considerably especially in the case of mix M37-HS which had a compressive strength of 11.7 MPa (1700 psi) after only eight hours of curing, and 25.5 MPa (3700 psi) after 24 hours; while the strength of mixes M37-LA and M37-HA went from 22.1 – 23.4 MPa (3200 – 3400 psi) to 27.6 – 28.2 MPa (4000 – 4100 psi) as the curing duration increased from eight to 24 hours. This represented a rise in compressive strength on a scale of 1.5 for all three mixes when considering the final strength after 24 hours of curing, as the temperature went from 55 to 70° C (131 to 158° F).
For equivalent two-part mixes cured at the same temperature, all three mixes had high compressive strength from early ages, ranging between 31 MPa (4500 psi) for mix M37-LA and 35.2 MPa (5100 psi) for mix M37-HS after eight hours of curing. Then only a slight increase of about 20% happened as the duration of curing went from eight to 24 hours for these mixes. The final compressive strength of two-part mixes were 1.2 to 1.6 times greater than their corresponding one-part mixes.
FA C37 had the highest calcium content among all the three used FAs, therefore formed products of M37 mixes would essentially be rich in Ca species, which explained their higher ambient strength, as discussed earlier. But as the temperature increases, the leaching of Ca is known to be reduced [22]. This explained why there wasn’t a major change in strength as the temperature increased from 55 to 70° C (131 to 158° F) in the case of two-part mixes. However, for one-part mixes, the rise in temperature increased the dissolution rate of elements and thus led to higher strength.
4.3. Micro Structure Analysis
The microstructure assessment of different mixes and FAs were evaluated using X-Ray diffraction (XRD) analyses in order to identify the crystalline phases present in both unreacted FAs and AA paste mixtures, then define the correlation between the crystalline phases present and their respective effect on the setting time, workability and compressive strength properties as described the previous sections (4.1 and 4.2). In the unreacted FAs (C29, C21, and C37), it is expected for the XRD results to be generate peaks corresponding to crystalline phases in form oxides representing crystalline phases of unreacted components, and hydrates representing crystalline phases of newly formed components.
In the case crystalline oxides, they must coincide with the different the chemical composition of the FAs as shown in Table 1. Therefore, crystalline phases such as Quartz (hereinafter Q), Periclase (hereinafter P), Hatrurite (hereinafter H), Lime (hereinafter L), Mullite (hereinafter M), and Gelhenite (hereinafter G) are the expected crystalline phases of unreacted components.
In the case newly formed components, they are generally spotted by the presence of new peaks other those of unreacted components. The presence of crystalline phases in the form calcium-silicate-hydrates (CSH) generally improve the ambient strength of mixes, while the presence of crystalline phases in the form of calcium-alumina-hydrates (CAH) are found to be responsible for the flash setting of mixes and thus negatively impact the setting time and workability properties, and the compressive strength of mixes. The presence of calcium hydroxide (CH) is also found to hinder the strength development of mixes as well. The presence of crystalline phases in a form of sodium-aluminosilicate-hydrates, (NASH), calcium-aluminosilicate-hydrates (CASH), and/or calcium-sodium-aluminosilcate-hydrates (CNASH), and zeolites (Z) are usually spotted in mixes cured at elevated temperatures as they do require heat for faster strength development. NASH, CASH and CNASH usually referred to as geopolymer gel are the most formed products.
However, it is known that AA formed products are mostly in an amorphous phase rather than crystalline, and are usually spotted by a broad peak occurring at 2Ɵ locations of 28 - 30°. But they require more advanced technics to be clearly identified.
The observed crystalline phases present in AA paste mixtures are shown in figure. 9 – 17. The observed XRD results showed that there were differences in the formation of crystal phases depending on mixing type (one-part vs. two-part), mix proportions (LA, HA, and HS), and type of FAs used (C21, C29, and C37). These differences in crystal phases depended essentially on the chemical composition of FAs, nature of activator used and curing temperature as describe the next sub-sections.
4.3.1. XRD Results of M29 AA Paste Mixtures
The XRD of M29 mixes displayed peaks that corresponded to Quartz, Periclase, Gehlenite, and Lime crystalline phases which constituted the majority of unreacted components.
In the case of newly formed components, for one-part M29 mixes cured at 30° C (86° F), the presence of peaks corresponding to hydrogarnet (hereinafter H*), were spotted at 2Ɵ of 18º - 20º, and calcium-aluminum-oxide-hydrate (hereinafter C*) at 2Ɵ of 30º - 32º in all three mixes (i.e. M29-LA, M29-HA, and M29-HS). In addition, the presence of CSH (hereinafter C) were spotted at 2Ɵ of 7º in M29-LA and M29-HA, while kilchoanite (hereinafter K*) were spotted at 2Ɵ of 29° - 30° in mix M29-HS (Figure 9a).
For two-part M29 mixes, the presence of CSH (C) peaks at 2Ɵ locations of 7º, 30° - 32° were more predominant in mixes M29-LA and M29-HA, while kilchoanite peaks were found in mix M29-HS (Figure 9b).
When M29 mixes cured at 55° C (131º F), XRD patterns of one-part M29 mixes were predominately composed of peaks corresponding to katoite (hereinafter K), hydrogarnet, and calcium-aluminum-oxide-hydrate (hereinafter C*) (Figure 10a). While for two-part M29 mixes, the presence of katoite was predominant in mixes M29-LA and M29-HS while kilchoanite was in M29-HS (Figure 10b).
At 70° C (158º F) of curing, XRD patterns of one-part M29 mixes were displayed peaks of katoite, hydrogarnet, and calcium-aluminum-oxide-hydrate, just like at 55° C (131º F) but with high peak intensity (Figure 11a). While in the case of two-part M29 katoite was the predominant peaks observed in all three mixes (Figure 11b).
The presence of crystal phases rich in aluminum (Al) and hydroxyl (OH) species in one-part M29 mixes cured at ambient temperature (i.e., 30° C or 86 º F) explained the faster setting properties of these mixes, as newly formed components were in form of CAH which are best known to trigger flash setting. However, the presence of CSH crystals were responsible the relatively high ambient compressive strength of these mixes (Figure 5a). In fact, due to the high surface area of C29, the dissolution of FA elements happened at faster rate than in the case of C21, therefore some Si species could be dissolved and react with Ca to form CSH. At elevated temperatures, more Si could be dissolved and react with Ca and Al to form CASH products and thus results in high strength with increase in temperature (Figure 6a).
In the case of two-part M29 mixes, the presence of CSH and kilchoanite which are CSH products were responsible for the higher ambient compressive strength. When the curing temperature were elevated to 55° C (131º F) and later to 70° C (158º F), less Ca species were dissolved leading to a less concentration of Ca relative to Al and Si, thus leading to formation of CASH products such as katoite which result in higher strength with increasing the curing temperature (Figure 6b).
4.3.2. XRD Results of M21 AA Paste Mixtures
At ambient temperature of 30° C (86º F), for one-part M21 mixes, XRD patterns did not reveal peaks corresponding to new formed products other than Hydrogarnet spotted at 2Ɵ of 30º - 32º, the remaining peaks corresponded to crystal phases of as Quartz, Periclase and Gelhenite for all three mixes M21-LA, M21-HA and M21-HS (Figure 12a). In the case of two-part mixes, the presence of a broad peak was observed by peaks located at 2Ɵ of 31° - 33° which corresponded to an amorphous product forming essentially a geopolymer gel (Figure 12b).
At 55° C (131° F), XRD patterns of one-part M21 mixes revealed the presence of Katoite at 2Ɵ of 26º – 28º mostly in mixes M21-LA and M21-HA, in addition to the unreacted components as mentioned earlier. In the case of two-part M21 mixes, a broad peak at 2Ɵ locations of 28° - 30° was observed while only peaks corresponded to unreacted components only were observed (Figure 13).
At 70° C (158° F), there were not a huge difference between the observed XRD patterns compared to those of M21 mixes cured at 55° C (131° F), expect the fact that the broad peak at 2Ɵ locations of 28° - 30° became more intense at 70° C (158° F) for two-part mixes, and the presence of zeolites p (hereinafter Z) in XRD patterns one-part M21-HS (Figure 14).
The presence of hydrogarnet in one-part M21 mixes, explained the faster setting properties of these mixes in comparison to their corresponding two-part mixes (Figure 2, Figure 3 and Figure 4), since hydrogarnet is a CAH product known to cause flash setting and negatively affect the compressive strength of mixes as describe earlier.
The presence of katoite in M21-LA and M21-HA mixes cured at elevated temperatures, explained the observed rise in compressive strength of these two mixes in comparison to mix M21-HS, as katoite is a CASH product which results in higher strength at elevated temperatures. Similarly, the presence of zeolite p in one-part M21-HS explained the observed slight rise in compressive strength of this mix when cured at 70° C (158° F) (Figure 7b).
The observed broad peak occurring at 2Ɵ locations of 28° - 30° in two-part M21 mixes, which is characteristic of the presence of an amorphous geopolymer gel that requires heat for faster strength development, explains the observed higher compressive strength of two-part M21 mixes. In addition, the observed high intensity of the broad peak in M21 mixes cured at 70° C (158° F) compared to those cured at 55° C (131° F) represented the presence of more formed products, thus a much dense gel, which explained the higher compressive strength of M21 mixes cured at this temperature (i.e. 70° C or 158° F).
4.3.3. XRD Results of M37 AA Paste Mixtures
XRD results of one-part and two-part M37 mixes are shown in Figure 15, Figure 16 and Figure 17. The predominant unreacted components were Quartz, Periclase, and Hatrurite (hereinafter H). In the case of newly formed products, for one-part M37 mixes cured at 30° C (131º F), the presence of peaks at 2Ɵ locations of 29° - 30°, and 50° corresponded to CSH for all three mixes M37-LA, M37-HA, and M37-HS, respectively (Figure 15a). For two-part M29 mixes, CSH peaks were spotted at 2Ɵ locations of 29° - 32° and 50° for mixes all three mixes (Figure 15b).
At 55° C (131º F) of curing temperature, in the case of one-part M37 mixes, a reduction in CSH peaks at 2Ɵ locations of 29° - 32° and 50° were observed, while the formation of new peak corresponding to Portlandite (hereinafter P*) were spotted at 2Ɵ locations of 18° - 20° in all three mixes (Figure 16a). While in the case of corresponding two-part, the presence of katoite peaks was spotted at 2Ɵ of 30°, in addition to the CSH peaks at 2Ɵ locations of 28° and 50° (Figure 16b).
At 70° C (158 º F) of curing temperature, XRD patterns of one-part M37 mixes were predominantly composed of katoite peaks at 2Ɵ of 30°, and Portlandite at 2Ɵ of 18°-20º with high intensity than peaks observed at 55° C (131º F) (Figure 17a). While in the case of two-part M37 mixes, calcium-aluminum-oxide-hydrate peaks were observed at 2Ɵ locations of 31° – 33°. (Figure 17b).
For both one-part and two-part M37 mixes, the observed higher ambient compressive strength in comparison to M29 and M21 mixes was due to the presence of CSH as explained earlier. However, the observed less effect of increasing temperature to the compressive strength of oven-cured mixes was due to the presence of Portlandite which was spotted to form as the temperature increased from 55° C (131º F) to 70° C (158 º F). In fact, as more Portlandite form, the pH of the solution decreases and thus the overall dissolution of Al and Si decreases as well, which reduces the resulting compressive strength.
4.3.4. XRD Summary
The XRD results of AA mixes, demonstrated that, the presence of already available soluble Si and OH species in the activating solution of two-part mixes favorited the development of crystal phases rich in Si and Ca such as CSH or CASH, which were found to be beneficial for strength development of these mixes. While in the case of one-part mixes, with all species dissolving at the same time, the presence of crystal phases such as CAOH, CH, and Hydrogarnet; rich in alumina or hydroxyl ions, which were found to impact negatively the setting properties and strength development of AA mixes.
5. Conclusions
AAM mixtures were made through one-part mixing by using only solid particles and two-part mixing using a combination of solid precursor and liquid activator solutions. Three different FAs were used (C21-2.20, C28-2.20, and C35-2.65) out of which three mix proportions (L.A, H.A, and H.S) were used to produce one-part and two-part mortar mixes. Fresh properties and harden properties of mortars mixes were assessed and a comparison between results of one-part and two-part mixing were conducted which resulted in the following conclusions:
In terms of setting time properties, one-part mortar samples set faster than two-part mortars for all mixes made from each of the three FAs (i.e., C21-2.20, C29-2.20, and C37-2.65, respectively). This was mainly due to the Si/Al ratio and surface area of each FA. For one-part mixes, the flash setting of mixes was due to the presence of calcium-aluminum-hydrates such as hydrogarnet resulting from the fast dissolution of Ca and Al in water as compared to Si. The faster setting properties of one-part mixes influenced their workability.
In terms of strength development, the compressive strength of one-part mortar mixes cured at temperature were extremely lower than those of corresponding two-part mixes at early ages, equivalent to 3 – 10% of corresponding two-part mixes after 1 day of curing. But increased with time, reaching up to 35 – 50% of corresponding two-part mixes compressive strength after only 7 days of curing. This was mainly due to the low rate of reaction of these mixes.
When cured at elevated temperatures, (i.e., 55° and 70° C), the compressive strength of one-part mortars increased with either an increasing in temperature (i.e., from 55 to 70° C) or a prolonged duration of curing (i.e., from 8h, to 16h and 24h respectively). This phenomenon was also noticed to happen in the case of two-part mortars, but the tremendous difference in the compressive strength depended on factors such as: pH, solubility of activator, and fresh properties of mixes.
In terms of microstructure analysis, the use of soluble species in the case of two-part mixes; resulted in formation of crystal phases such as calcium-silicate-hydrate (CSH), or even other forms of reacted calcium-silicate-oxides such as kilchoanite, these later being responsible for faster strength development. While on the other side, the simultaneous dissolution of all species in one-part mixes favorited formation of crystal phases such as hydrogranet, calcium hydroxide which inhibit compressive strength of mortar specimens.
Special mix design and procedure need to be developed to fit one-part mix. In addition, more research is required to improve the fresh properties of one-part AAM. An investigation of an optimum resting time, curing duration and temperature is needed to be conducted.
References
- E. Worrell, L. Price, N. Martin, C. Hendriks, and L. O. Meida, “CARBON DIOXIDE EMISSIONS FROM THE GLOBAL CEMENT INDUSTRY,” Annu. Rev. Energy Environ., vol. 26, no. 1, pp. 303–329, Nov. 2001.
- T. Bakharev, “Resistance of geopolymer materials to acid attack,” Cem. Concr. Res., vol. 35, pp. 658–670, 2005.
- P. K. Sarker and S. Mcbeath, “Fire endurance of steel reinforced fly ash geopolymer concrete elements,” Constr. Build. Mater., vol. 90, pp. 91–98, 2015.
- J. Davidovits, “Geopolymer chemistry and properties,” in Geopolymer, 1988, vol. 88, pp. 25–48.
- Palomo, M. W. Grutzeck, and M. T. Blanco, “Alkali-activated fly ashes: a cement for the future,” Cem. Concr. Res., vol. 29, pp. 1323–1329, 1999.
- P. De Silva, K. Sagoe-Crenstil, and V. Sirivivatnanon, “Kinetics of geopolymerization: role of Al2O3 and SiO2,” Cem. Concr. Res., vol. 37, pp. 512–518, 2007.
- J. L. Provis and S. A. Bernal, “Geopolymers and related alkali-activated materials,” Annu. Rev. Mater. Res., vol. 44, pp. 299–327, 2014.
- R. F. Heitzmann, M. Fitzgerald, and J. L. Sawyer, “Mineral binder and compositions employing the same.” Google Patents. 1987.
- J. Davidovits, “Method for obtaining a geopolymeric binder allowing to stabilize, solidify and consolidate toxic or waste materials.” Google Patents. 1994.
- P. Duxson and J. L. Provis, “Designing precursors for geopolymer cements,” J. Am. Ceram. Soc., vol. 91, pp. 3864–3869, 2008.
- A. Hajimohammadi and J. S. J. van Deventer, “Characterisation of one-part geopolymer binders made from fly ash,” Waste and Biomass Valorization, vol. 8, pp. 225–233, 2017.
- K.-H. Yang and J.-K. Song, “Workability loss and compressive strength development of cementless mortars activated by combination of sodium silicate and sodium hydroxide,” J. Mater. Civ. Eng., vol. 21, pp. 119–127, 2009.
- M. Askarian, Z. Tao, G. Adam, and B. Samali, “Mechanical properties of ambient cured one-part hybrid OPC-geopolymer concrete,” Constr. Build. Mater., vol. 186, pp. 330–337, 2018.
- E. Gomaa, S. Sargon, C. Kashosi, and M. ElGawady, “Fresh properties and compressive strength of high calcium alkali activated fly ash mortar,” J. King Saud Univ. - Eng. Sci., vol. 29, no. 4, 2017.
- S. P. Sargon, E. Y. Gomaa, C. Kashosi, A. A. Gheni, and F. Ash, “Effect of Curing Temperatures on Zero-Cement Alkali-Activated Mortars,” no. Icpic, 2018.
- A.-K. Maier, L. Dezmirean, J. Will, and P. Greil, “Three-dimensional printing of flash-setting calcium aluminate cement,” J. Mater. Sci., vol. 46, no. 9, pp. 2947–2954, 11. 20 May.
- K. Yip and J. S. J. Van Deventer, “Microanalysis of calcium silicate hydrate gel formed within a geopolymeric binder,” J. Mater. Sci., vol. 38, pp. 3851–3860, 2003.
- W. K. W. Lee and J. S. J. Van Deventer, “Structural reorganisation of class F fly ash in alkaline silicate solutions,” Colloids Surfaces A Physicochem. Eng. Asp., vol. 211, pp. 49–66, 2002.
- R. K. Iler, “Effect of adsorbed alumina on the solubility of amorphous silica in water,” J. Colloid Interface Sci., vol. 43, pp. 399–408, 1973.
- Panias, I. P. Giannopoulou, and T. Perraki, “Effect of synthesis parameters on the mechanical properties of fly ash-based geopolymers,” Colloids Surfaces A Physicochem. Eng. Asp., vol. 301, pp. 246–254, 2007.
- J. L. Provis and J. S. J. Van Deventer, “Geopolymerisation kinetics. 2. Reaction kinetic modelling,” Chem. Eng. Sci., vol. 62, pp. 2318–2329, 2007.
- X. Guo, H. Shi, and W. A. Dick, “Compressive strength and microstructural characteristics of class C fly ash geopolymer,” Cem. Concr. Compos., vol. 32, no. 2, pp. 142–147, 2010.
Figure 1.
Tests on fresh properties of zero-cement mortars. a) Flow test. b) Setting time test.
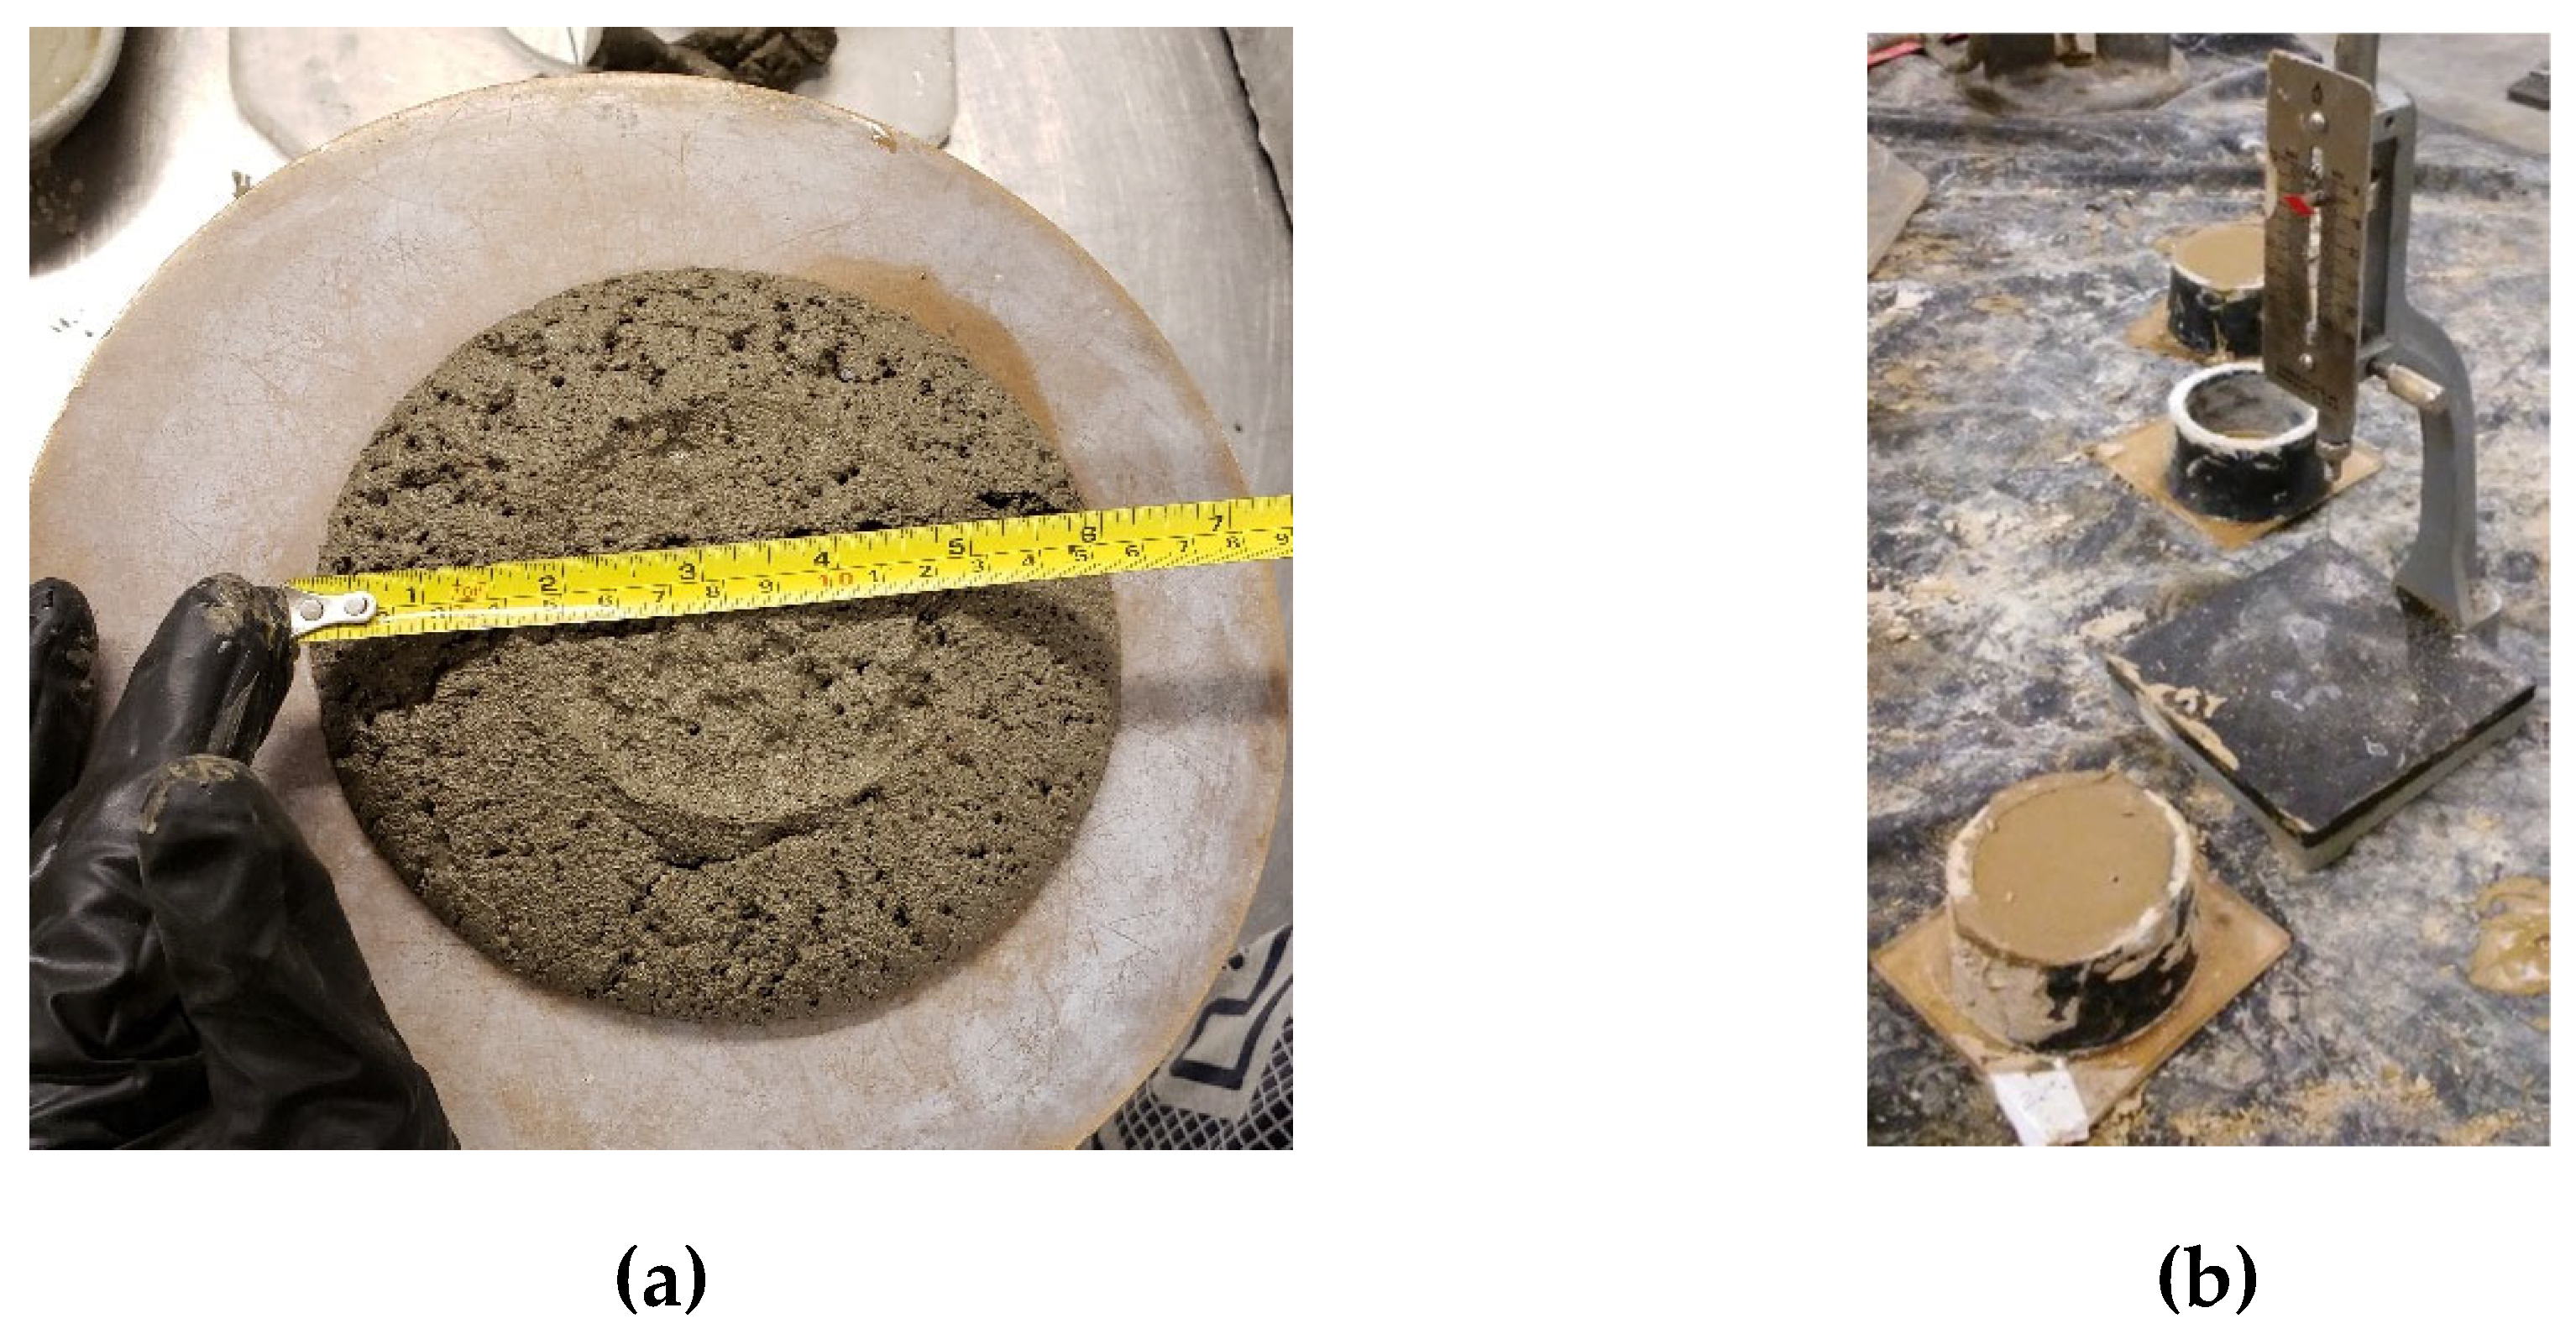
Figure 2.
Setting time results of AAM.
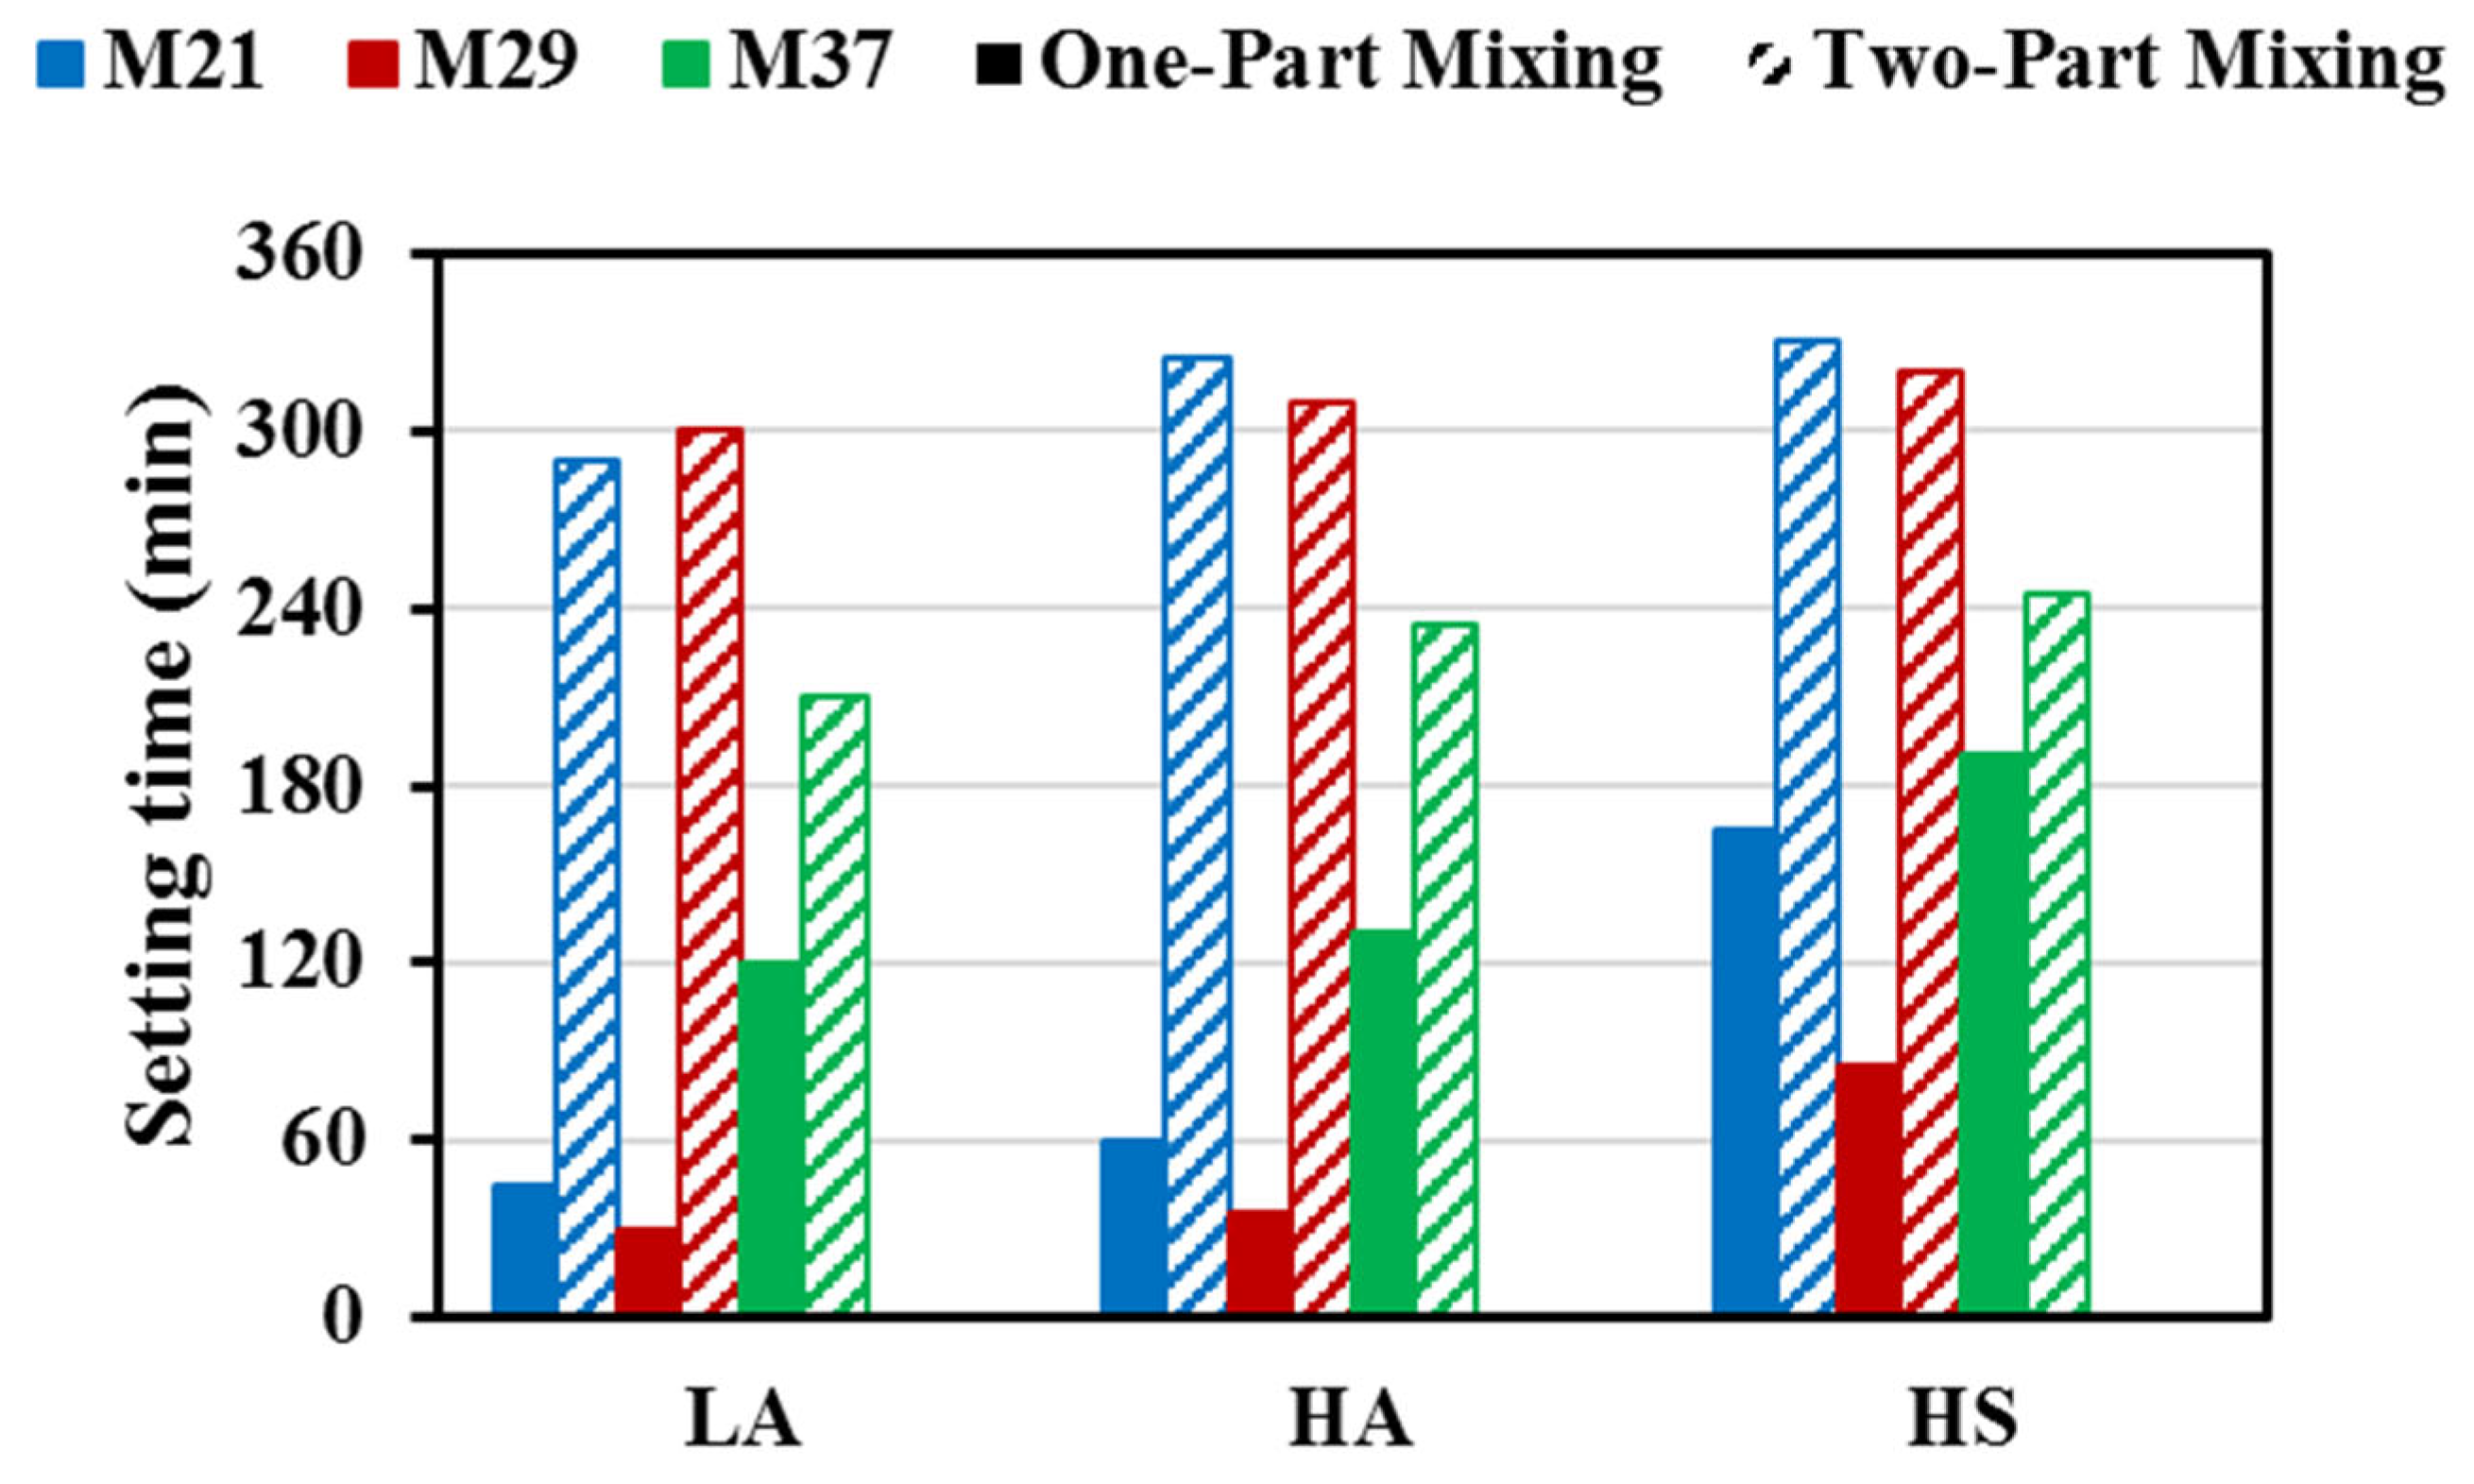
Figure 3.
Correlation between Si/Al and setting time of AAM: a) One-part mortar mixtures. b) Two-part mortar mixtures.
Figure 3.
Correlation between Si/Al and setting time of AAM: a) One-part mortar mixtures. b) Two-part mortar mixtures.
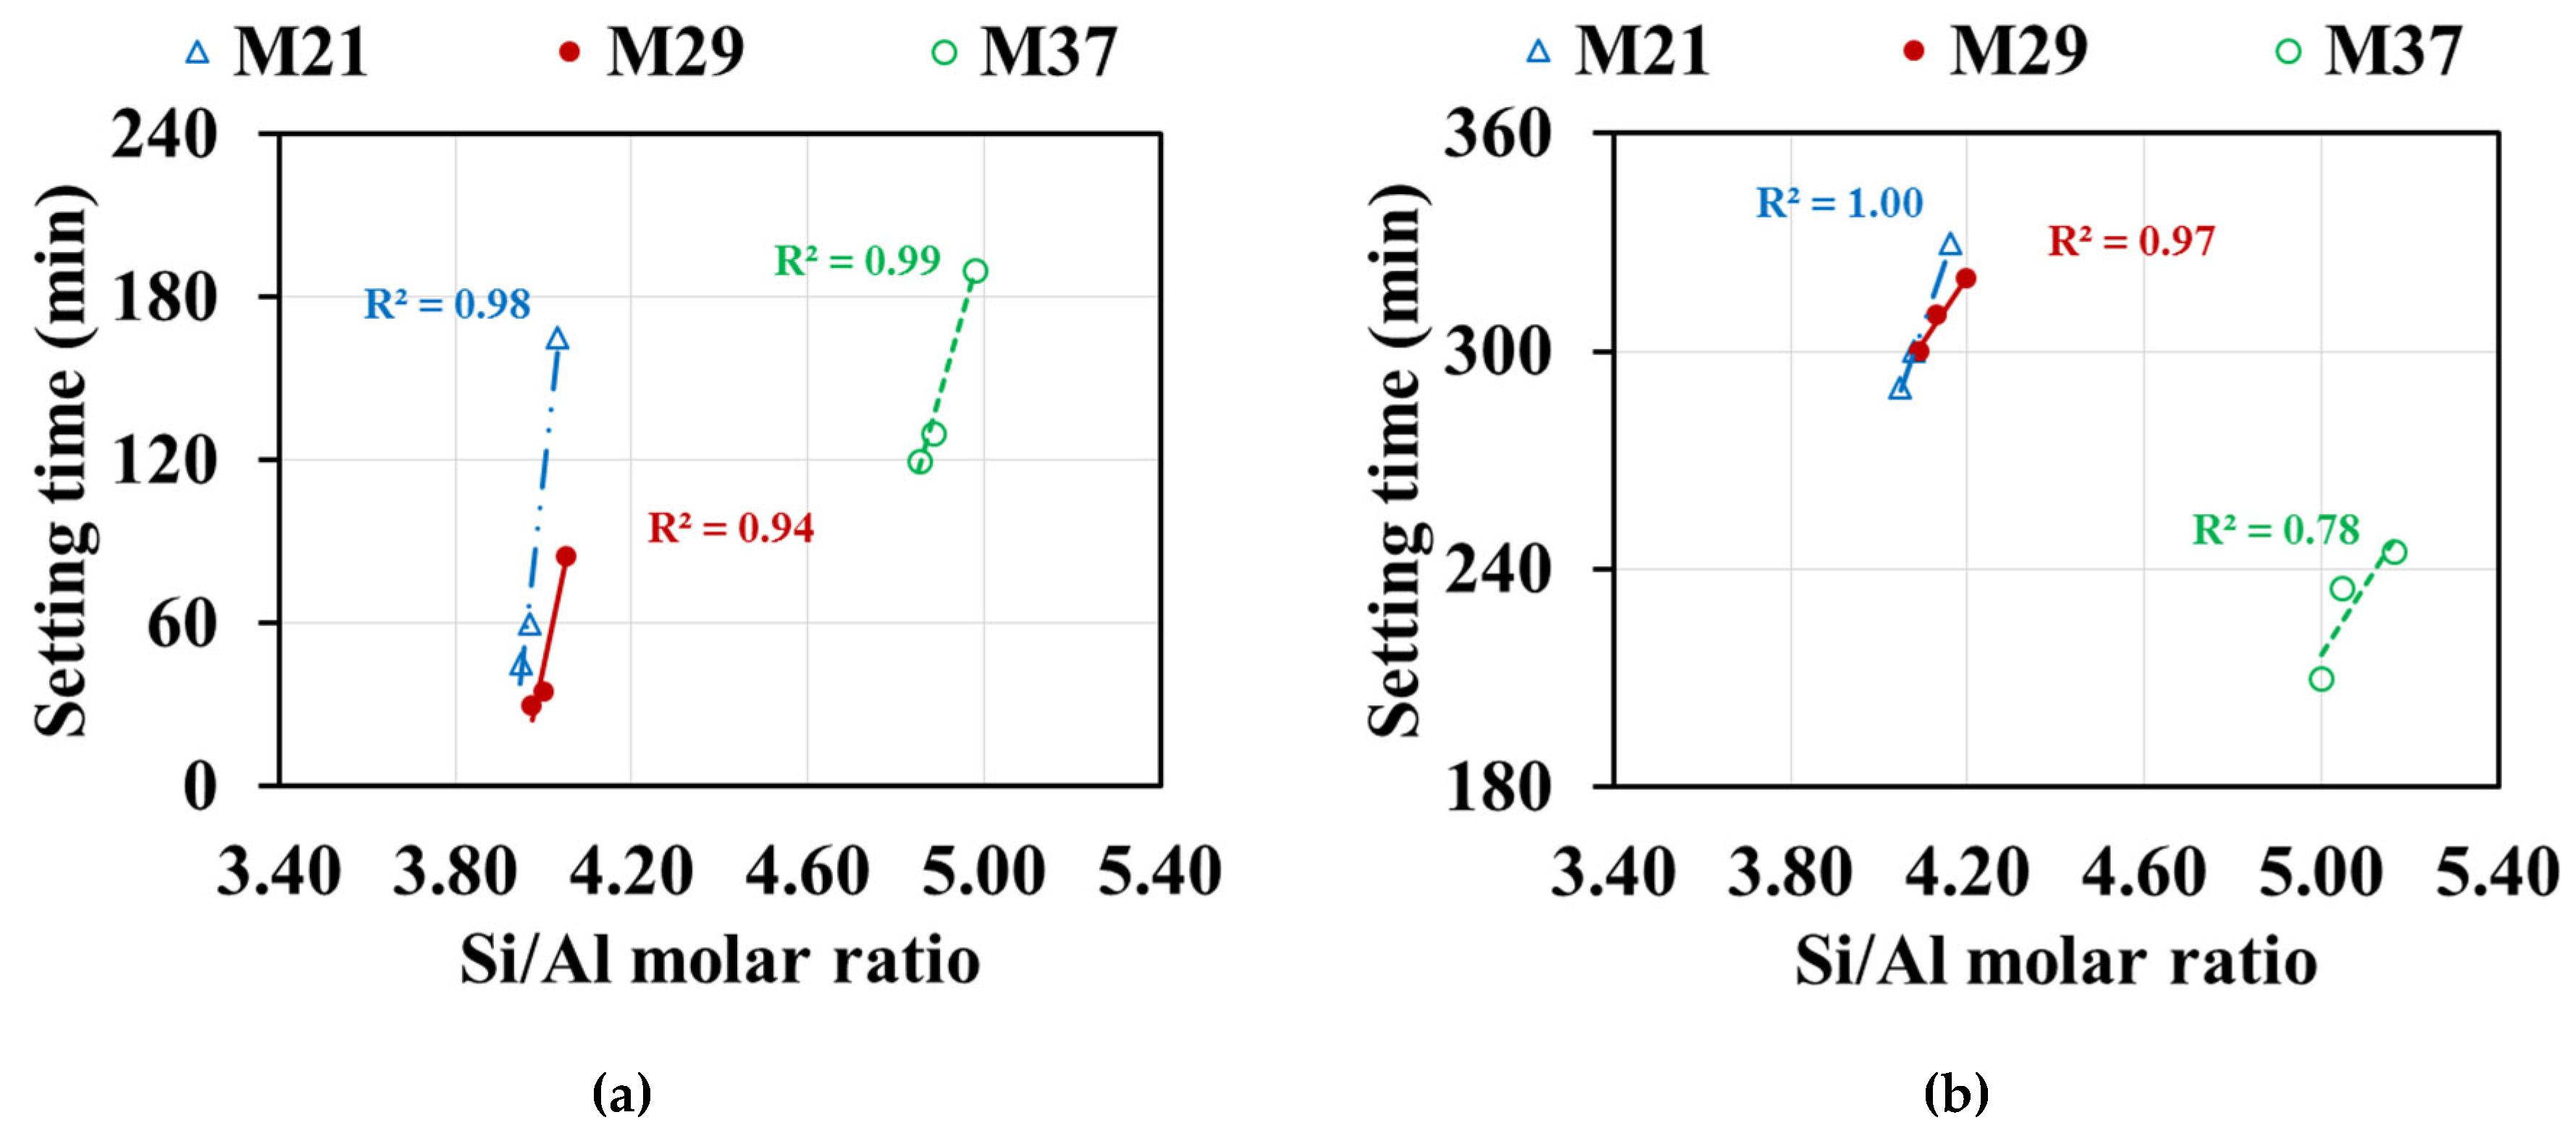
Figure 4.
Workability of AAM.
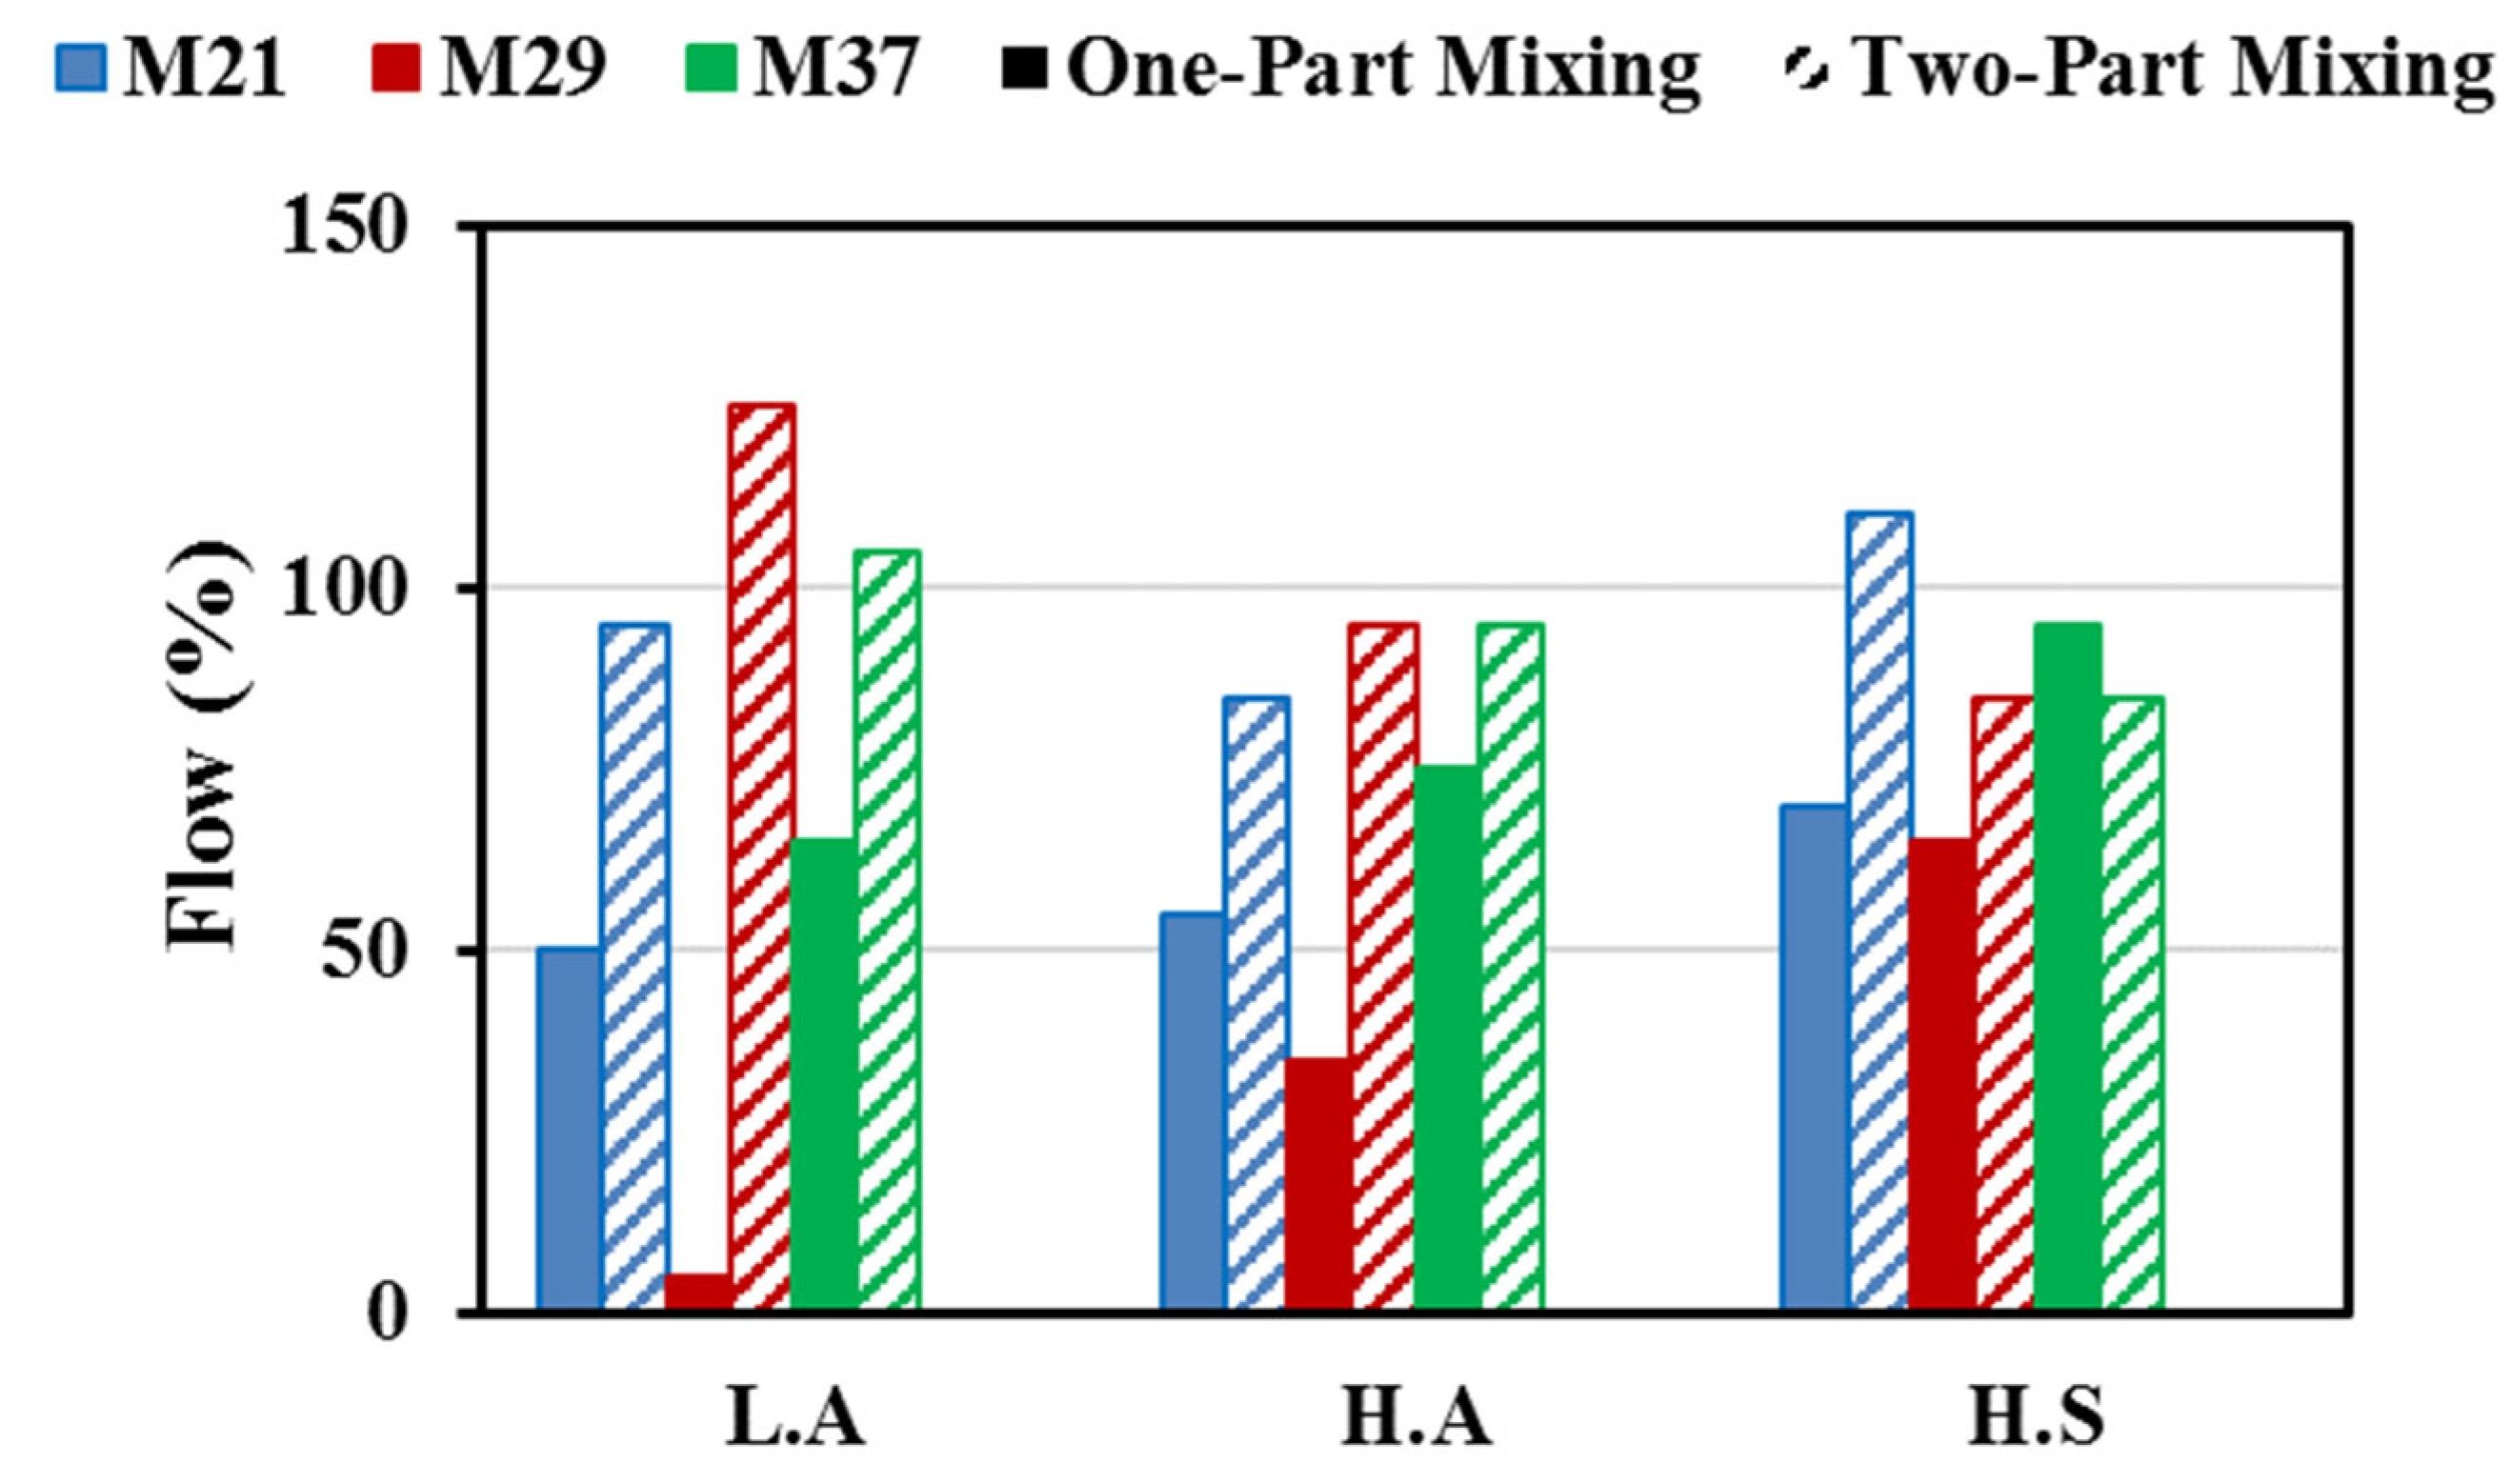
Figure 5.
Compressive strength of AAM cured at 30° C for 24 hours and 7 days: a) M29 mixtures. b) M21 mixtures. c) M37 mixtures.
Figure 5.
Compressive strength of AAM cured at 30° C for 24 hours and 7 days: a) M29 mixtures. b) M21 mixtures. c) M37 mixtures.
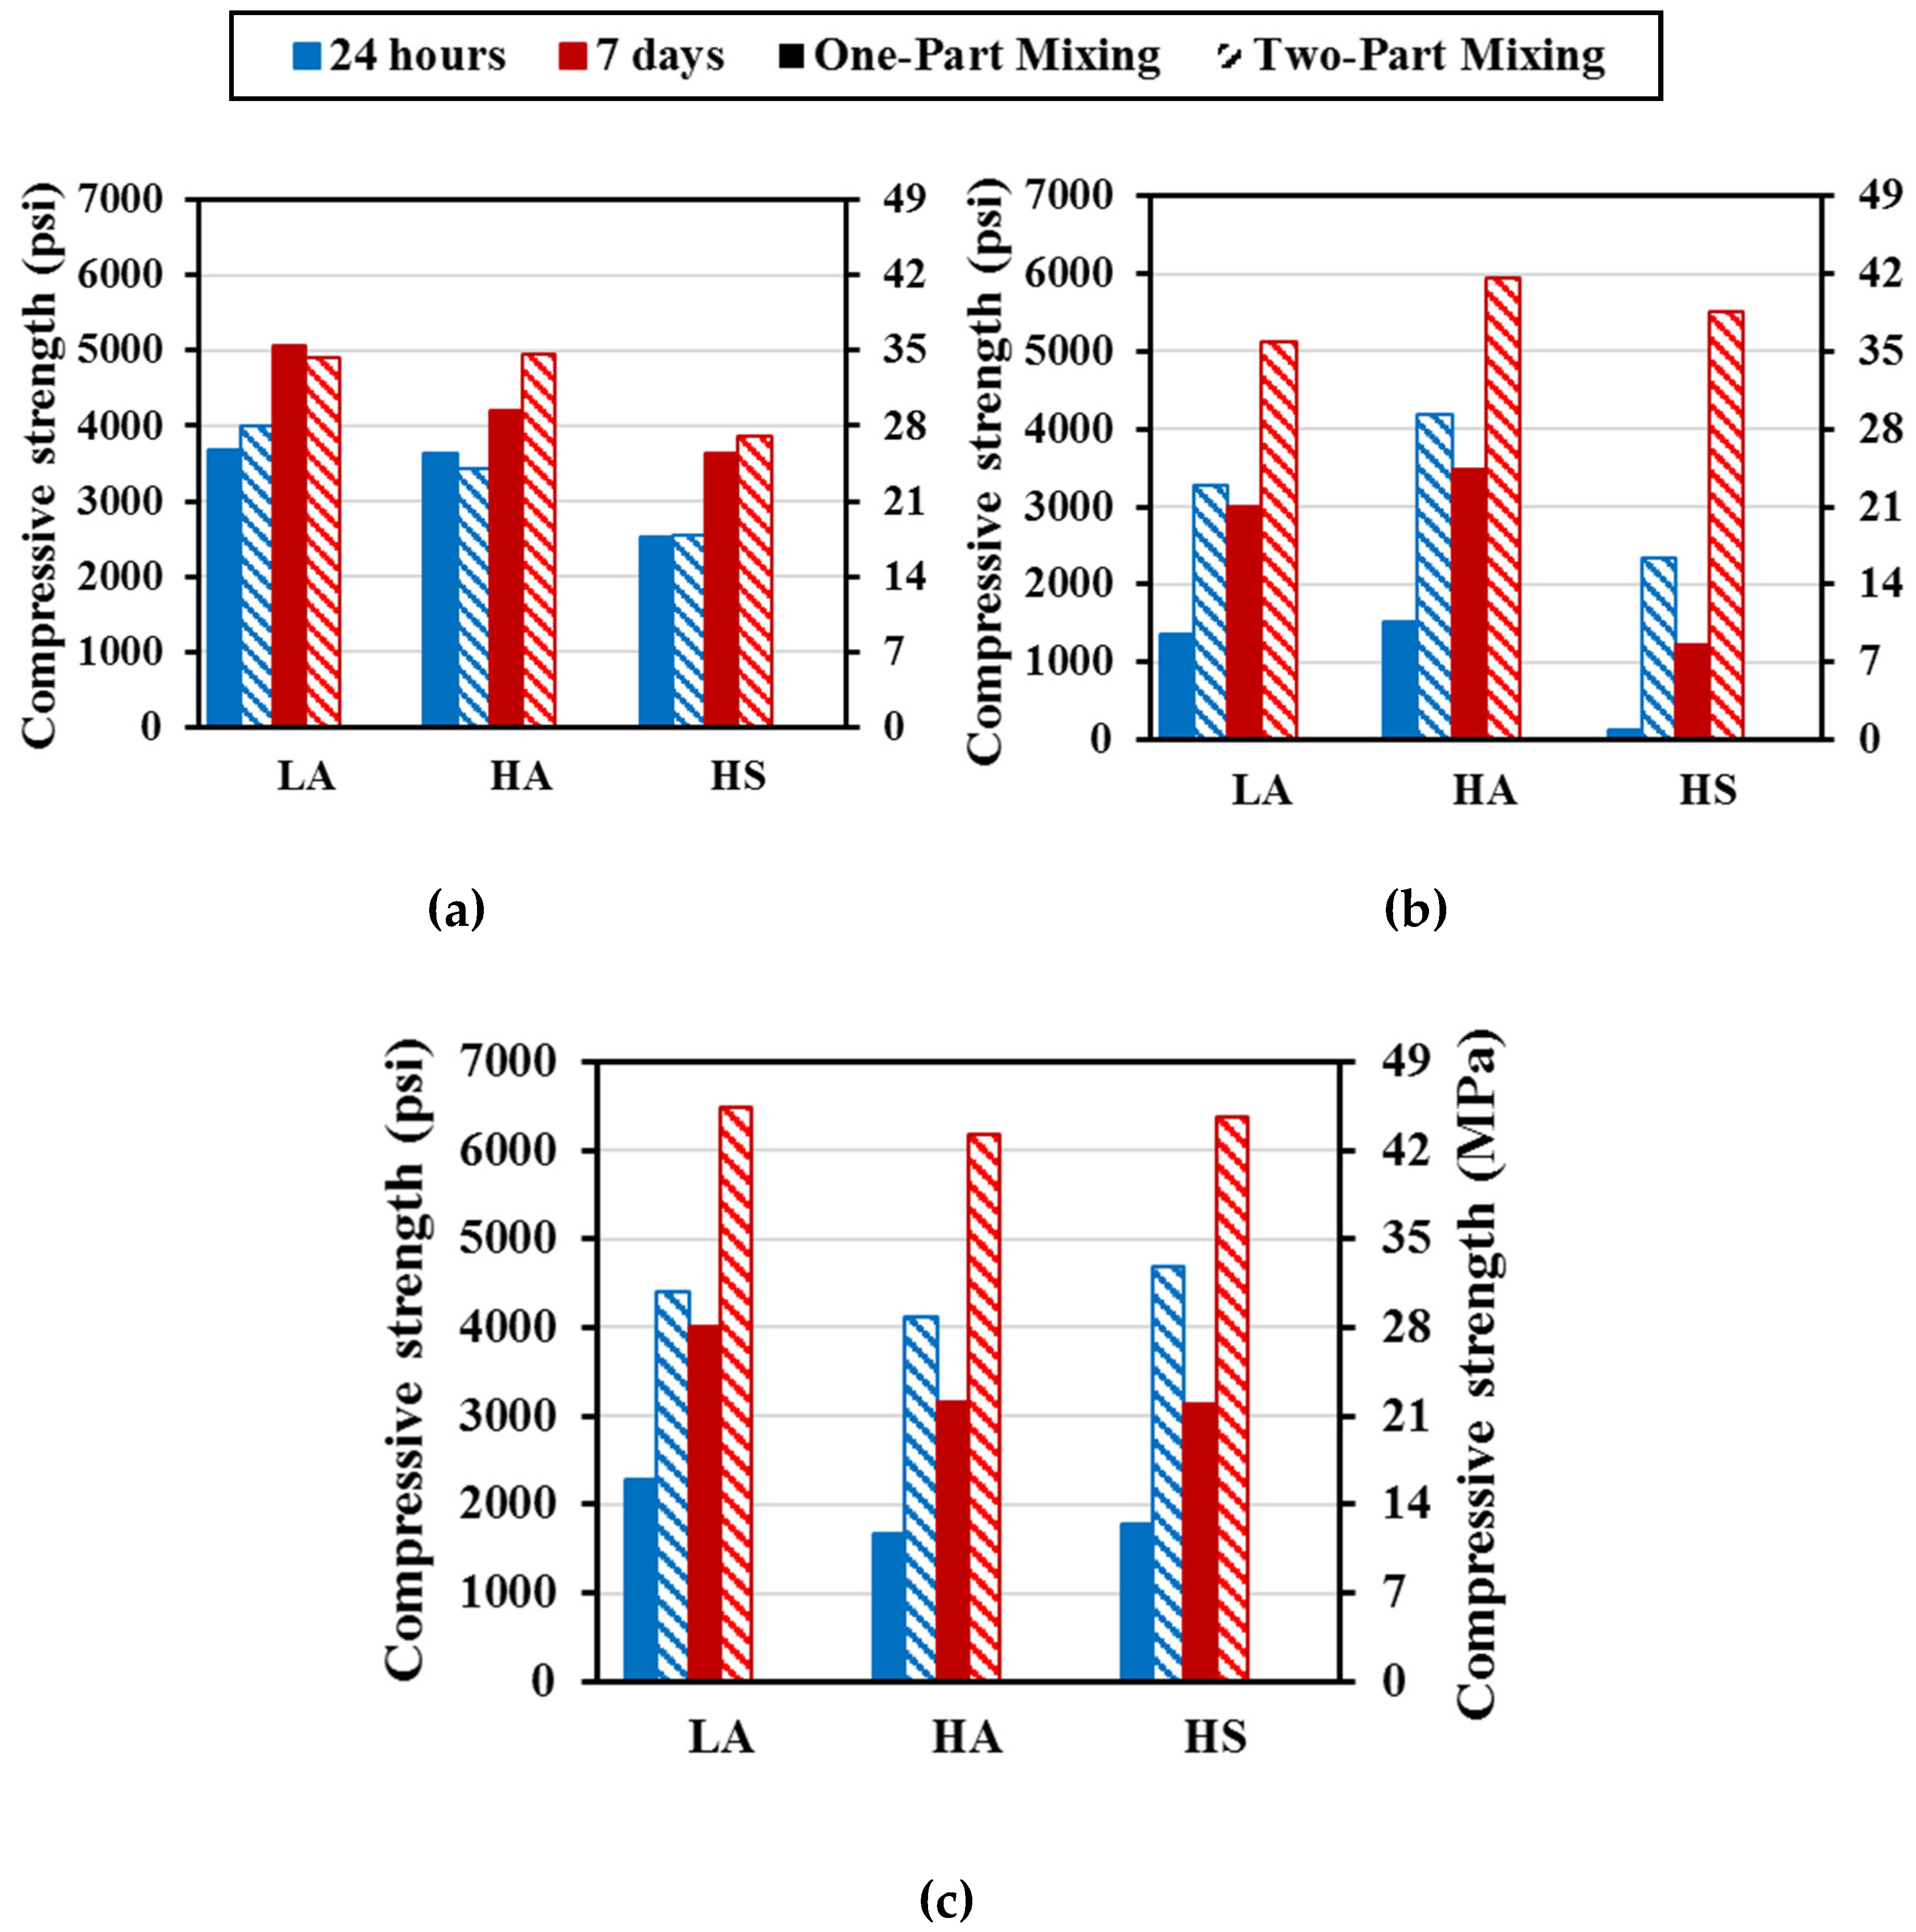
Figure 6.
Compressive strength of M29 mortar specimen’s oven cured at: a) 55° C (131° F), or b) 70° C (158° F).
Figure 6.
Compressive strength of M29 mortar specimen’s oven cured at: a) 55° C (131° F), or b) 70° C (158° F).
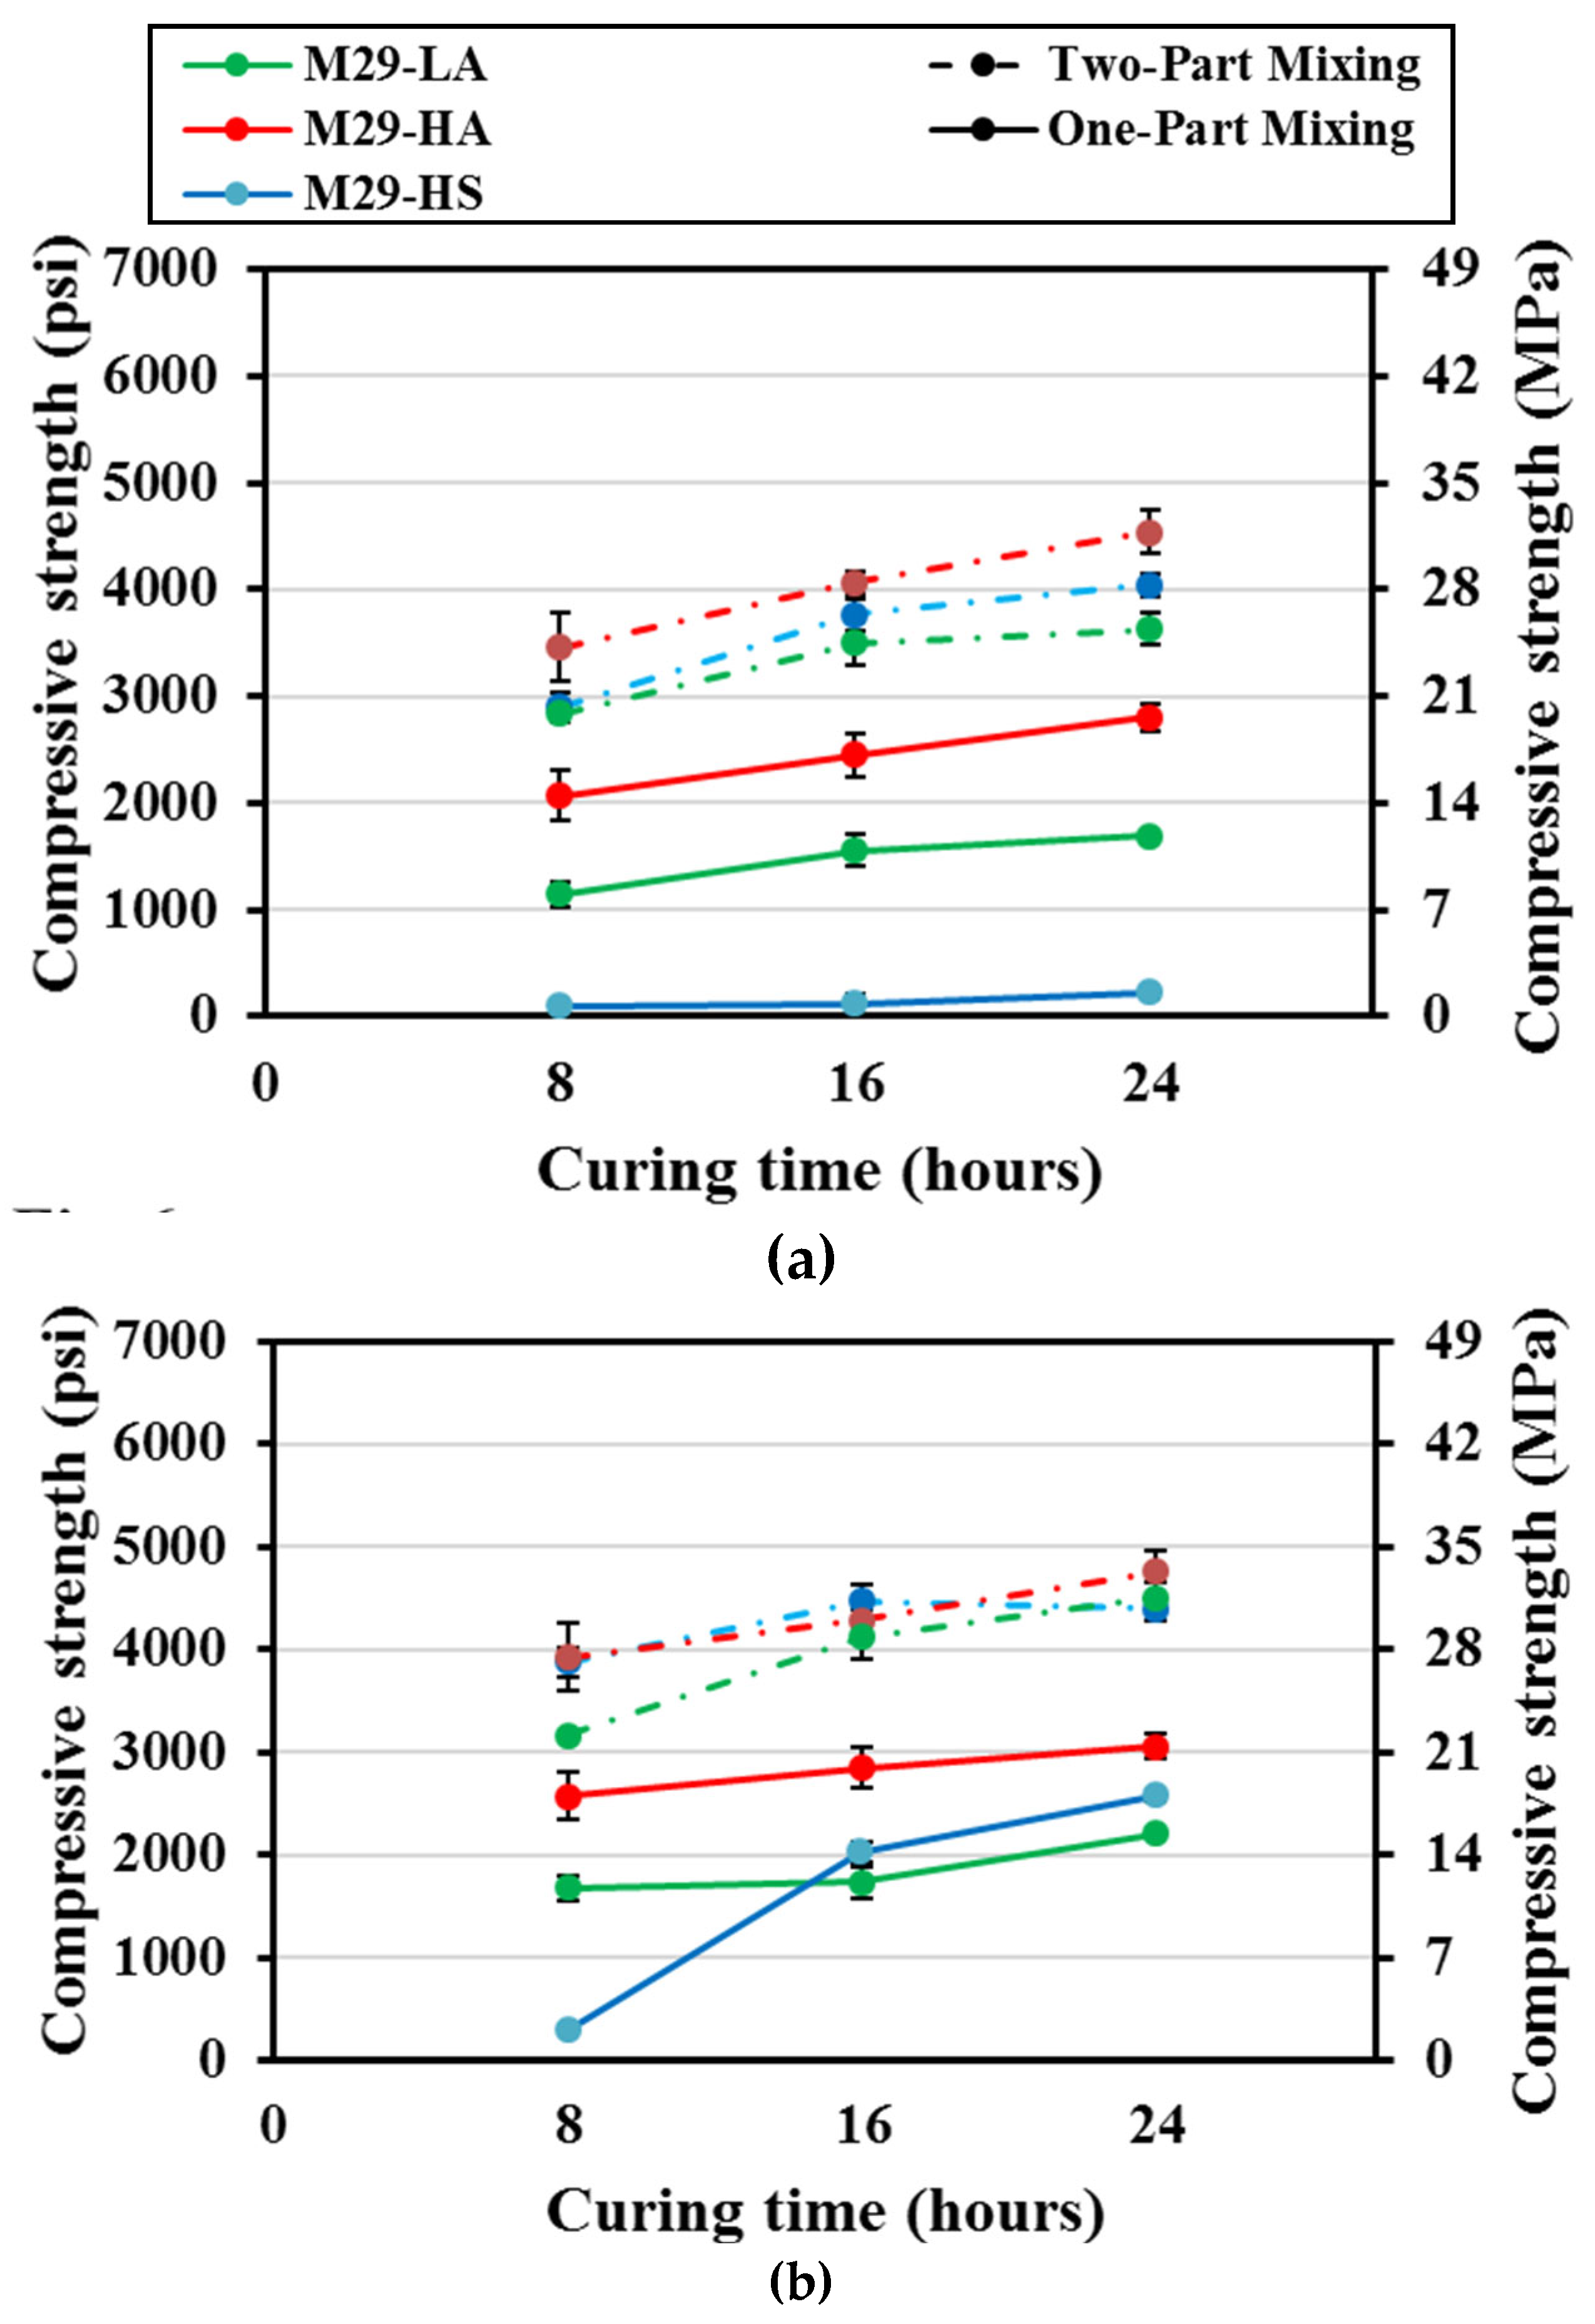
Figure 7.
Compressive strength of M21 mortar specimen’s oven cured at: a) 55° C (131° F), b) 70° C (158° F).
Figure 7.
Compressive strength of M21 mortar specimen’s oven cured at: a) 55° C (131° F), b) 70° C (158° F).
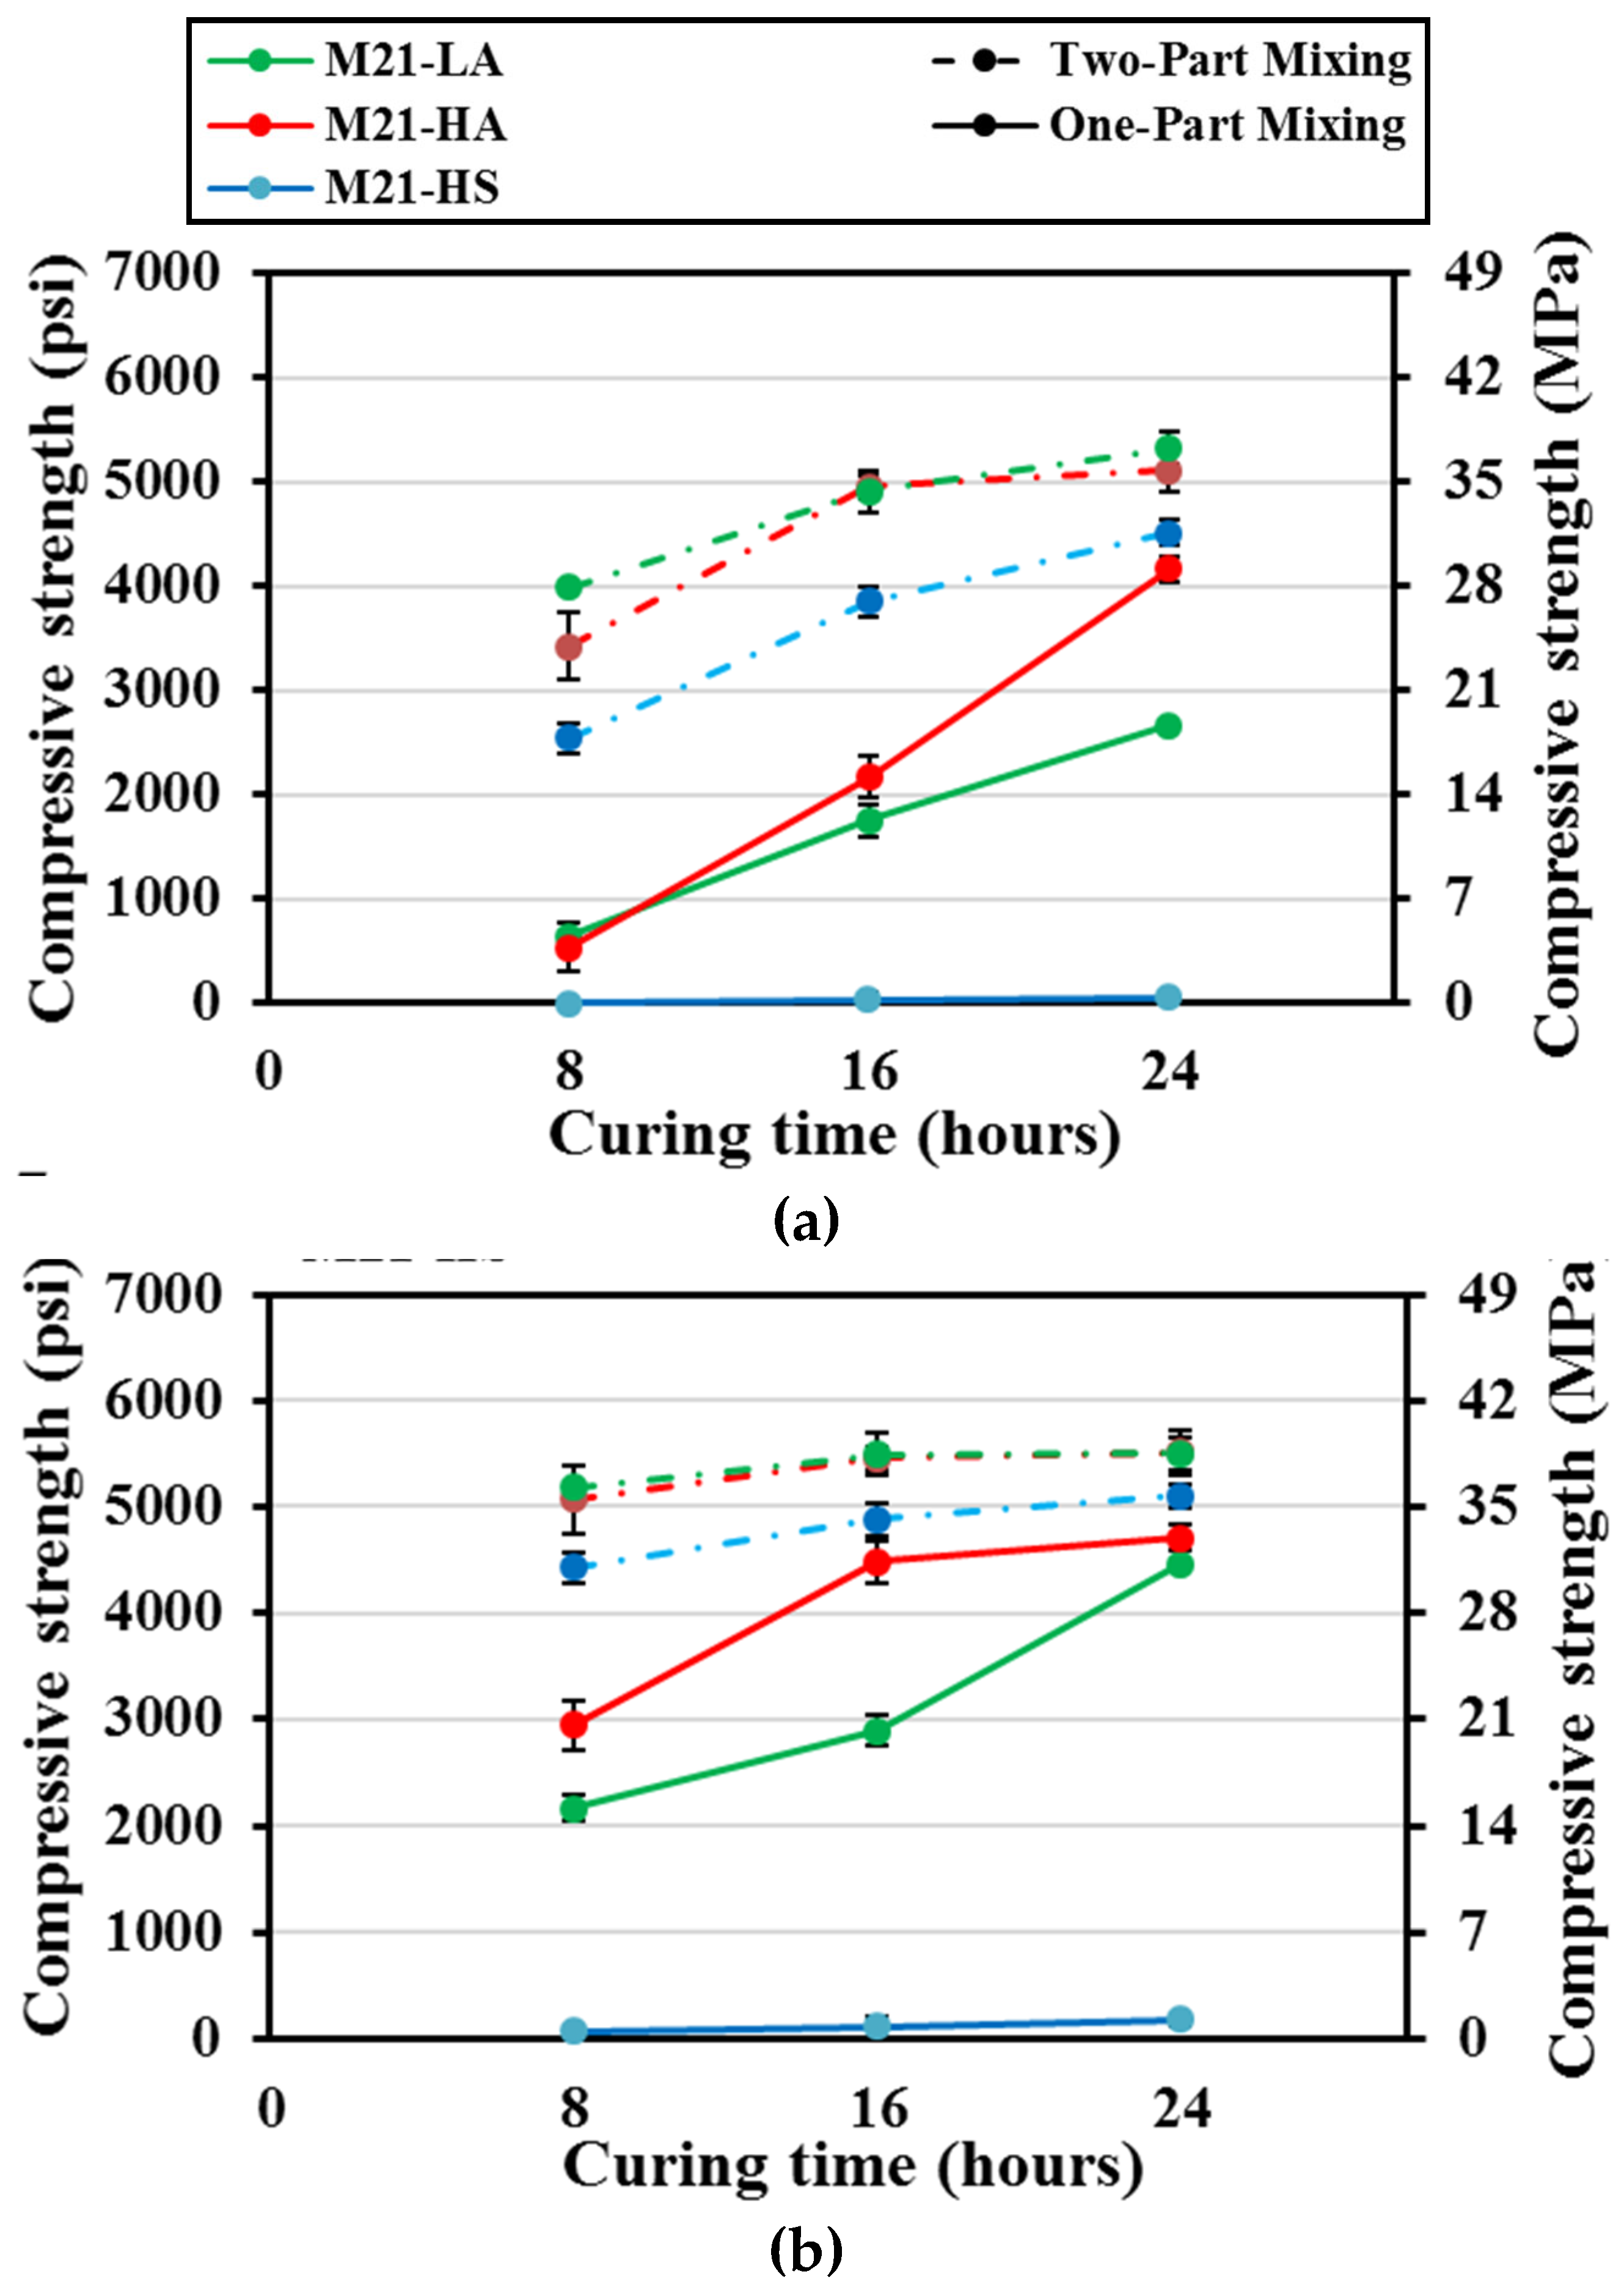
Figure 8.
Compressive strength of M37 mortar specimen’s oven cured at: a) 55° C (131° F), b) 70° C (158° F).
Figure 8.
Compressive strength of M37 mortar specimen’s oven cured at: a) 55° C (131° F), b) 70° C (158° F).
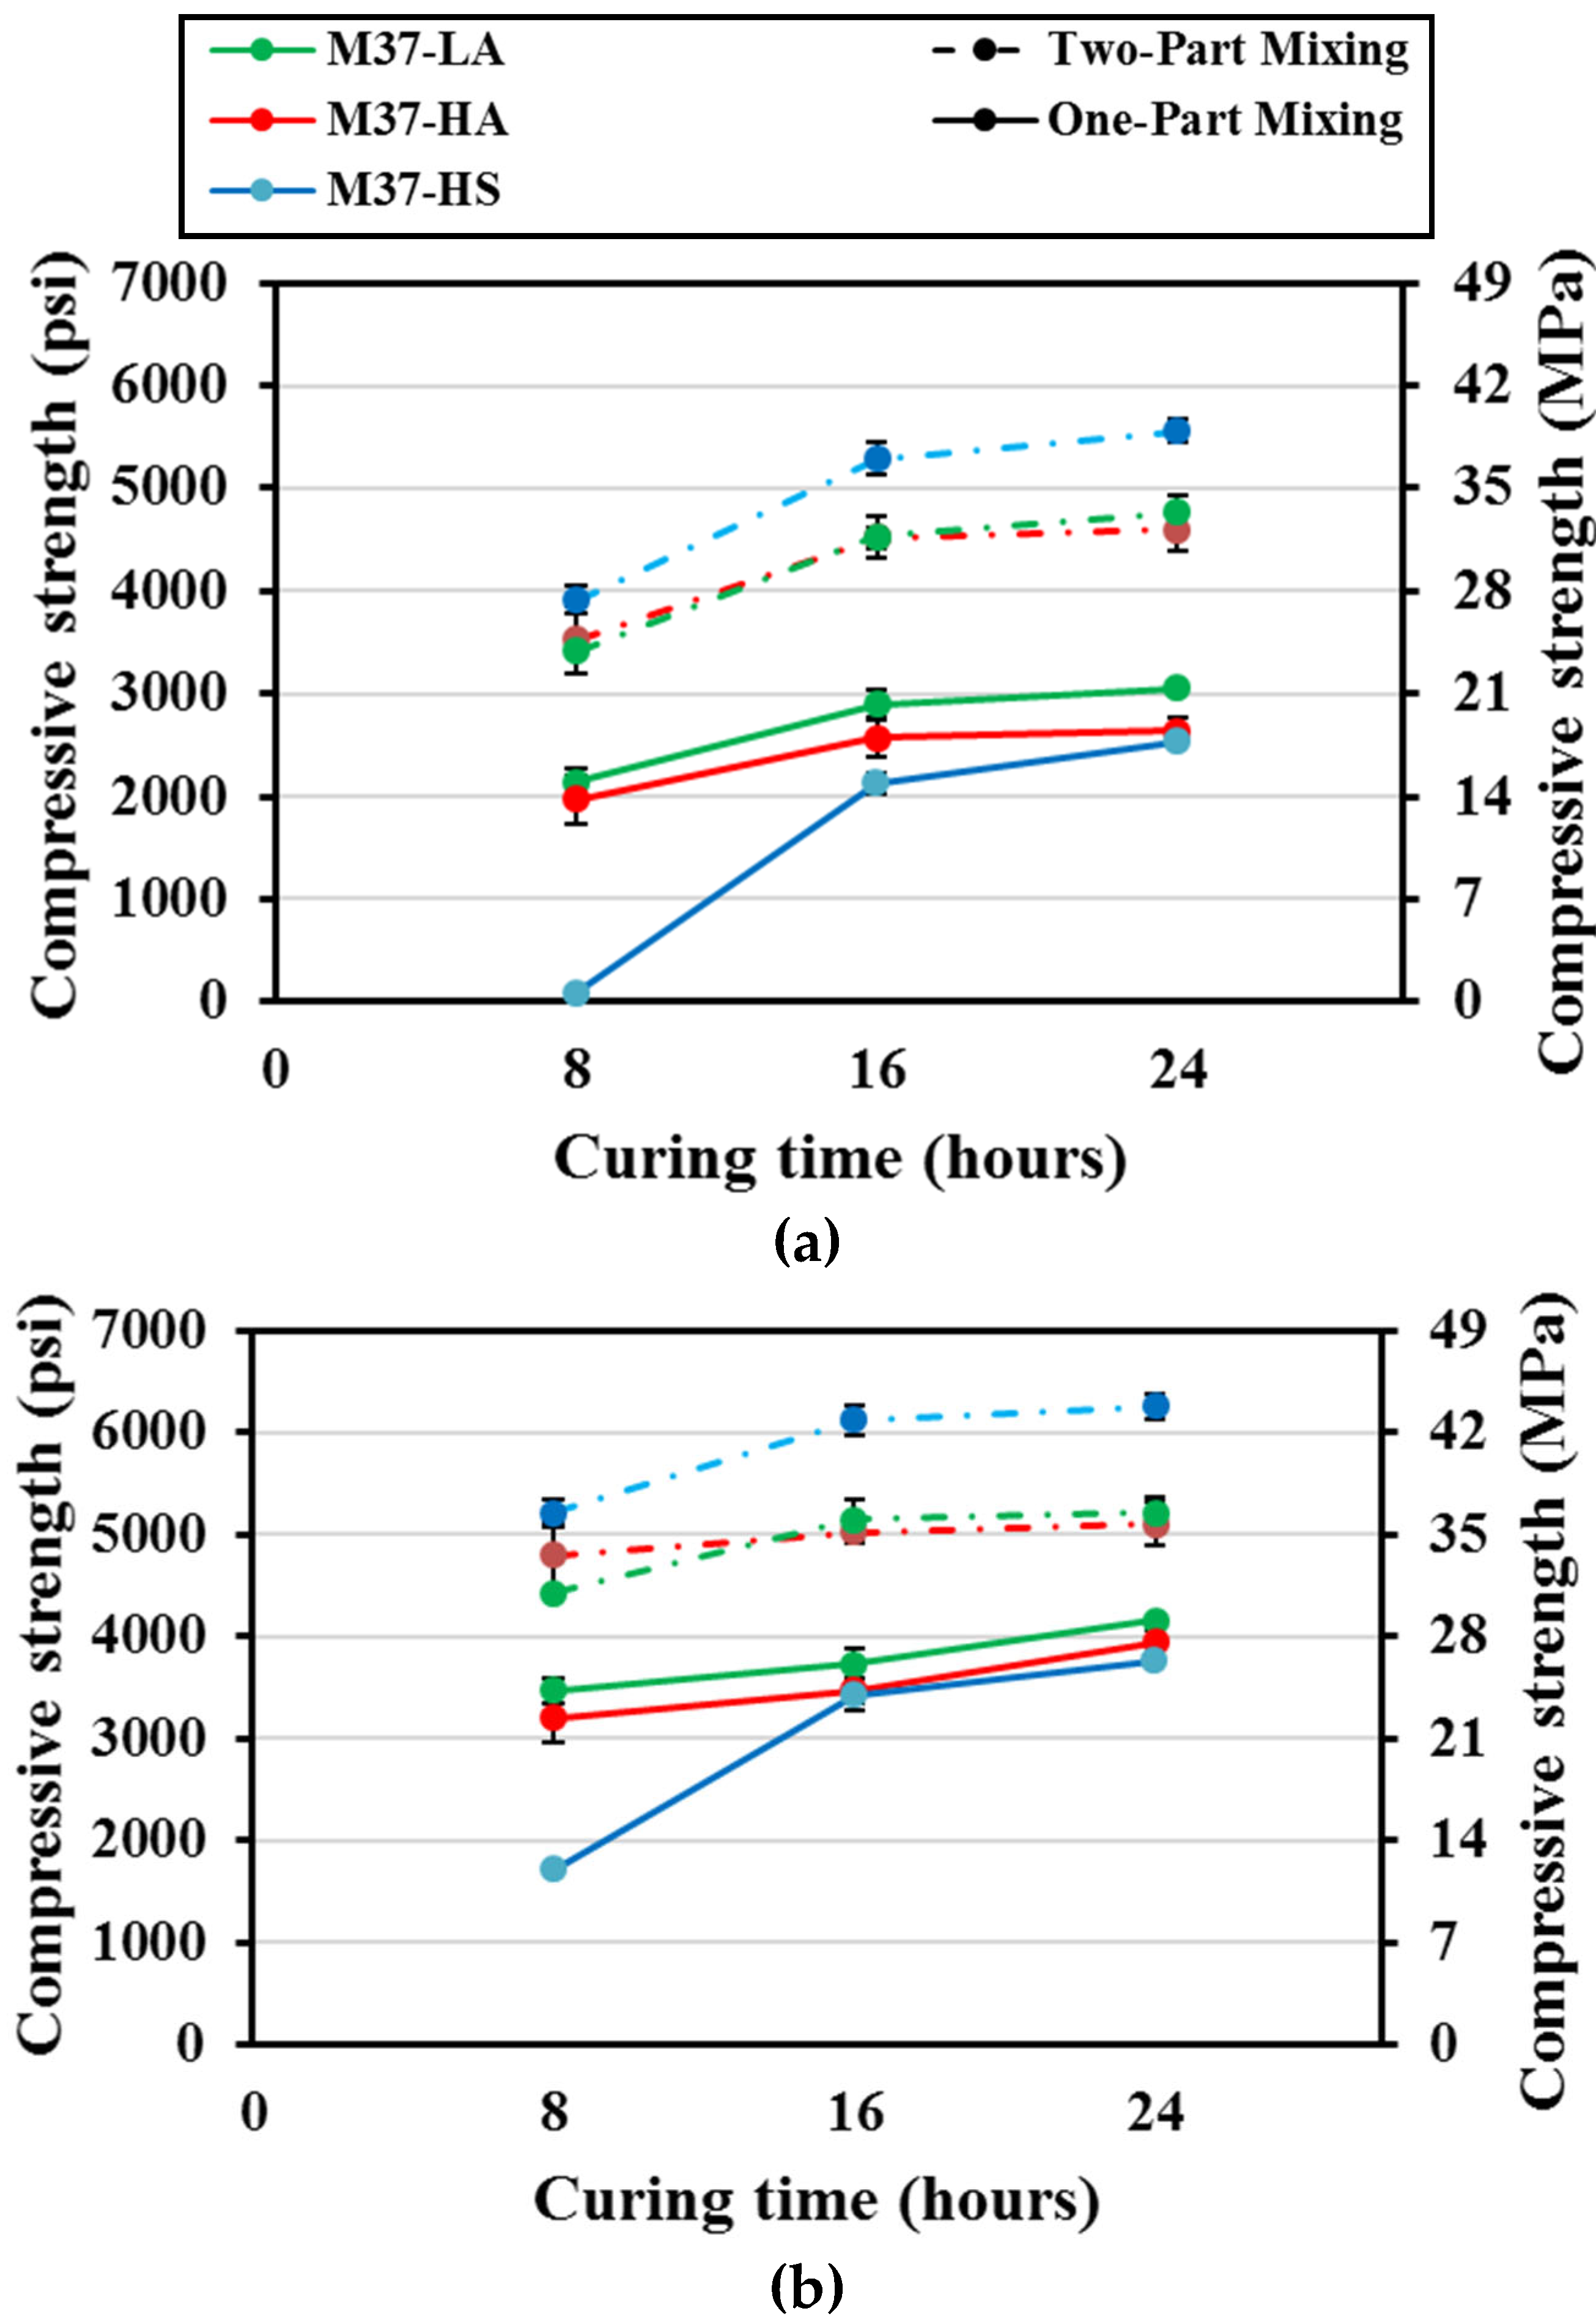
Figure 9.
XRD Results of M29 mixes ambient-cured. a) One-part mixes. b) two-part mixes.
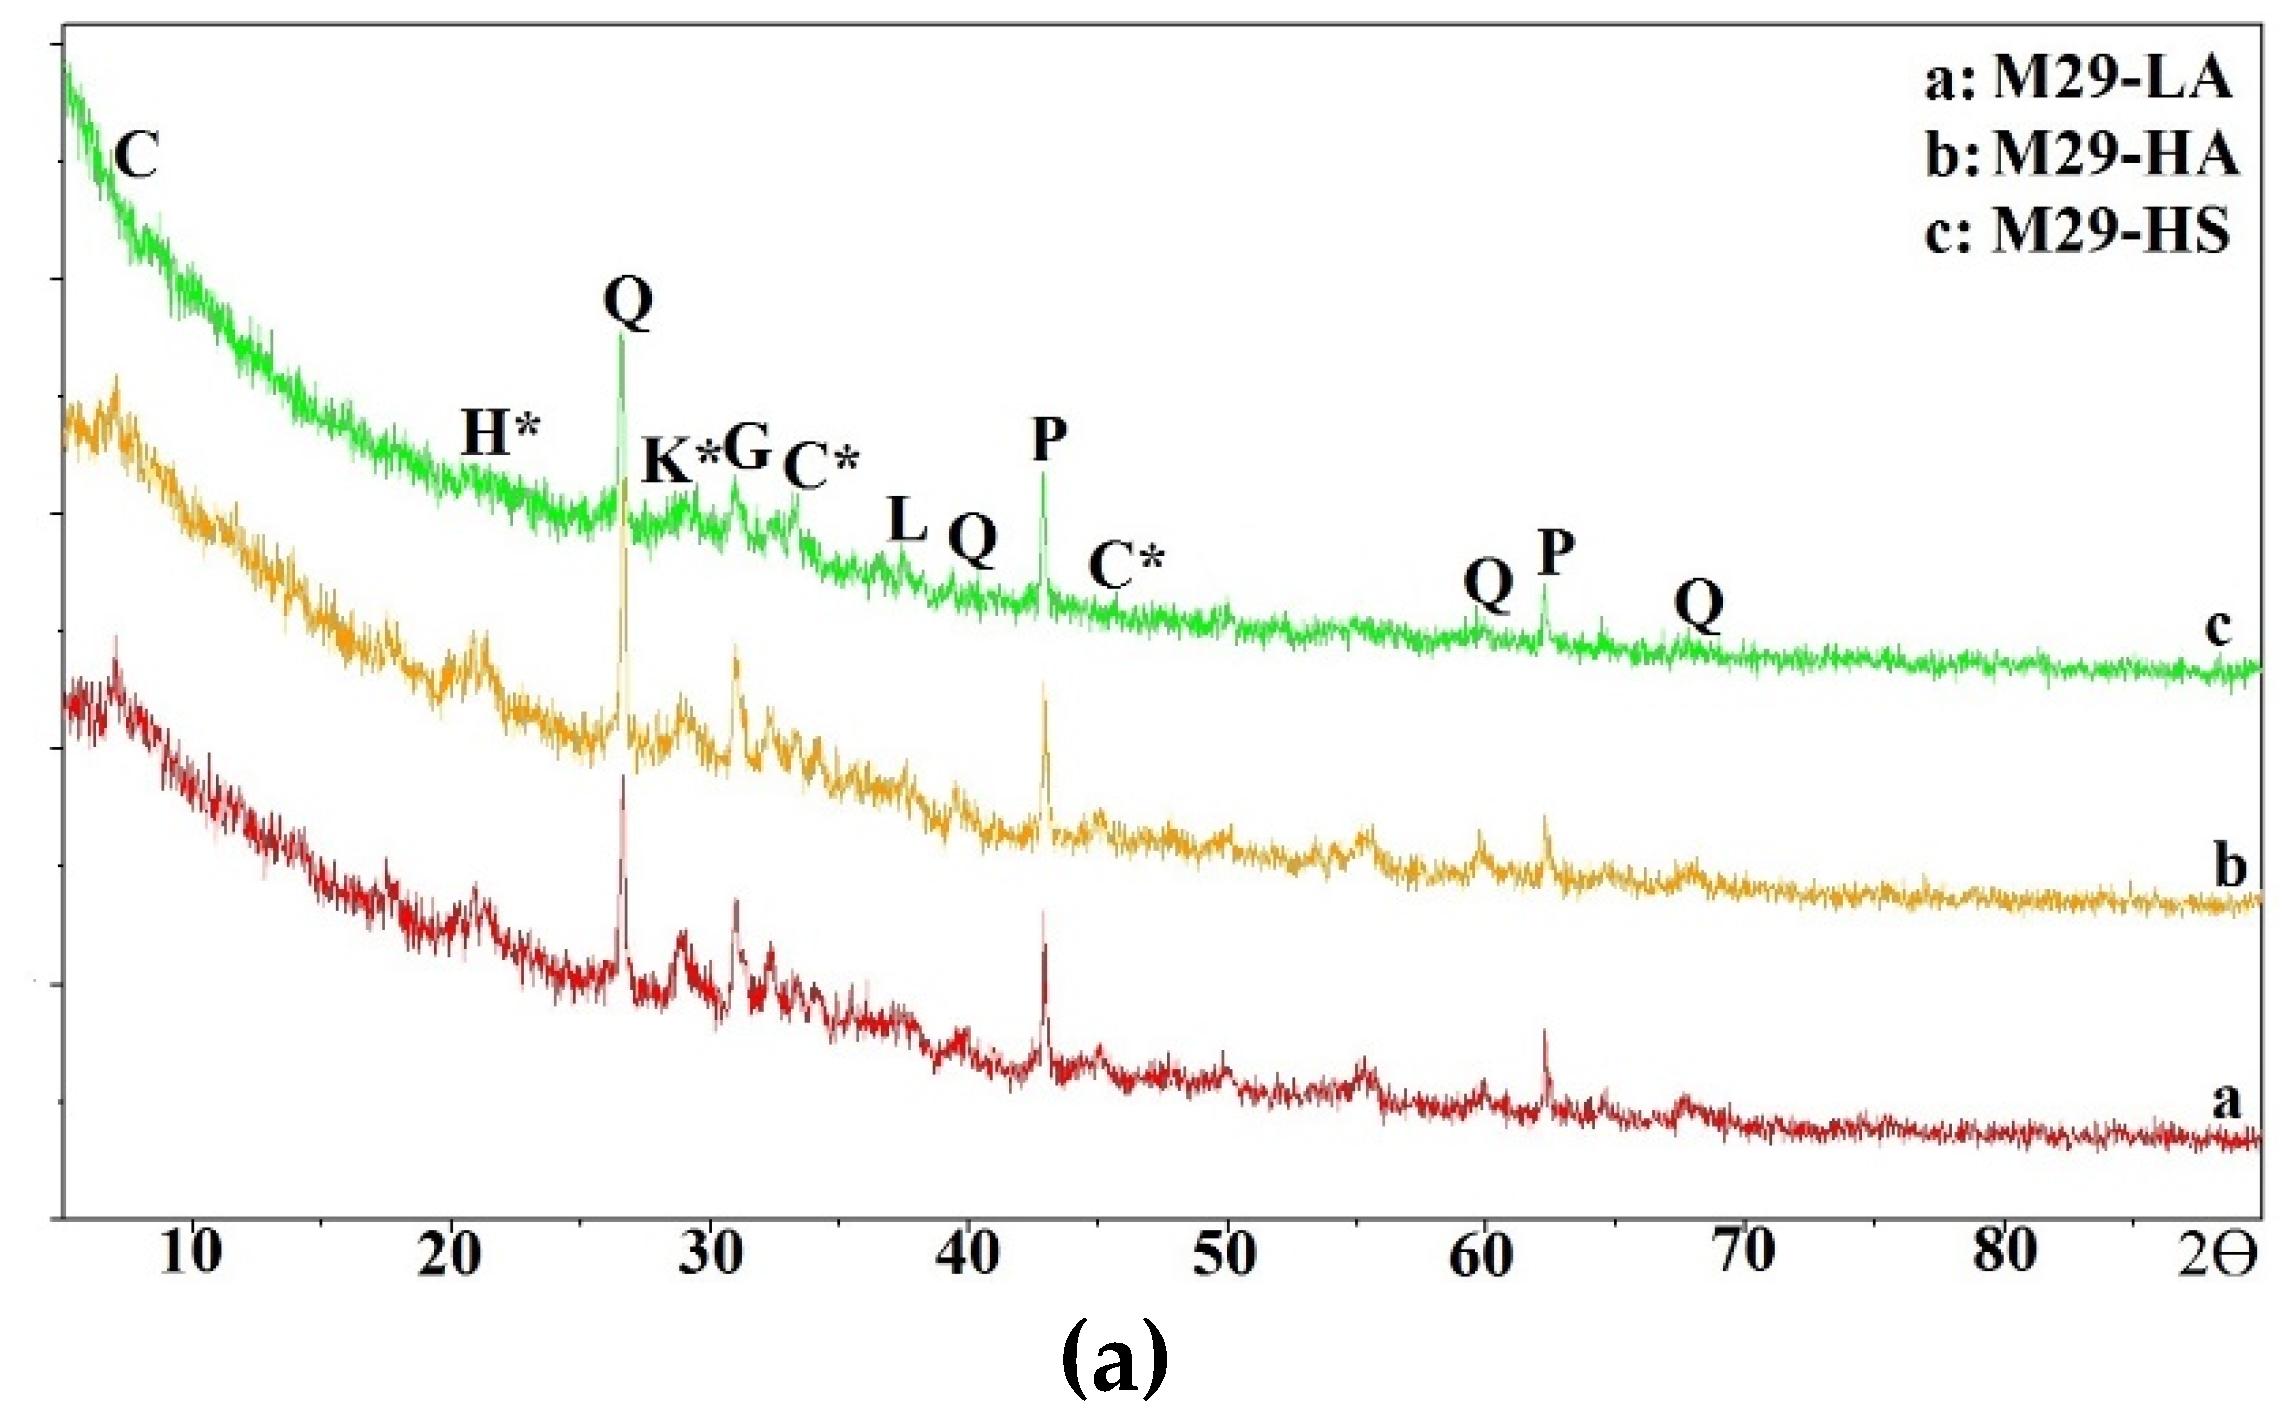
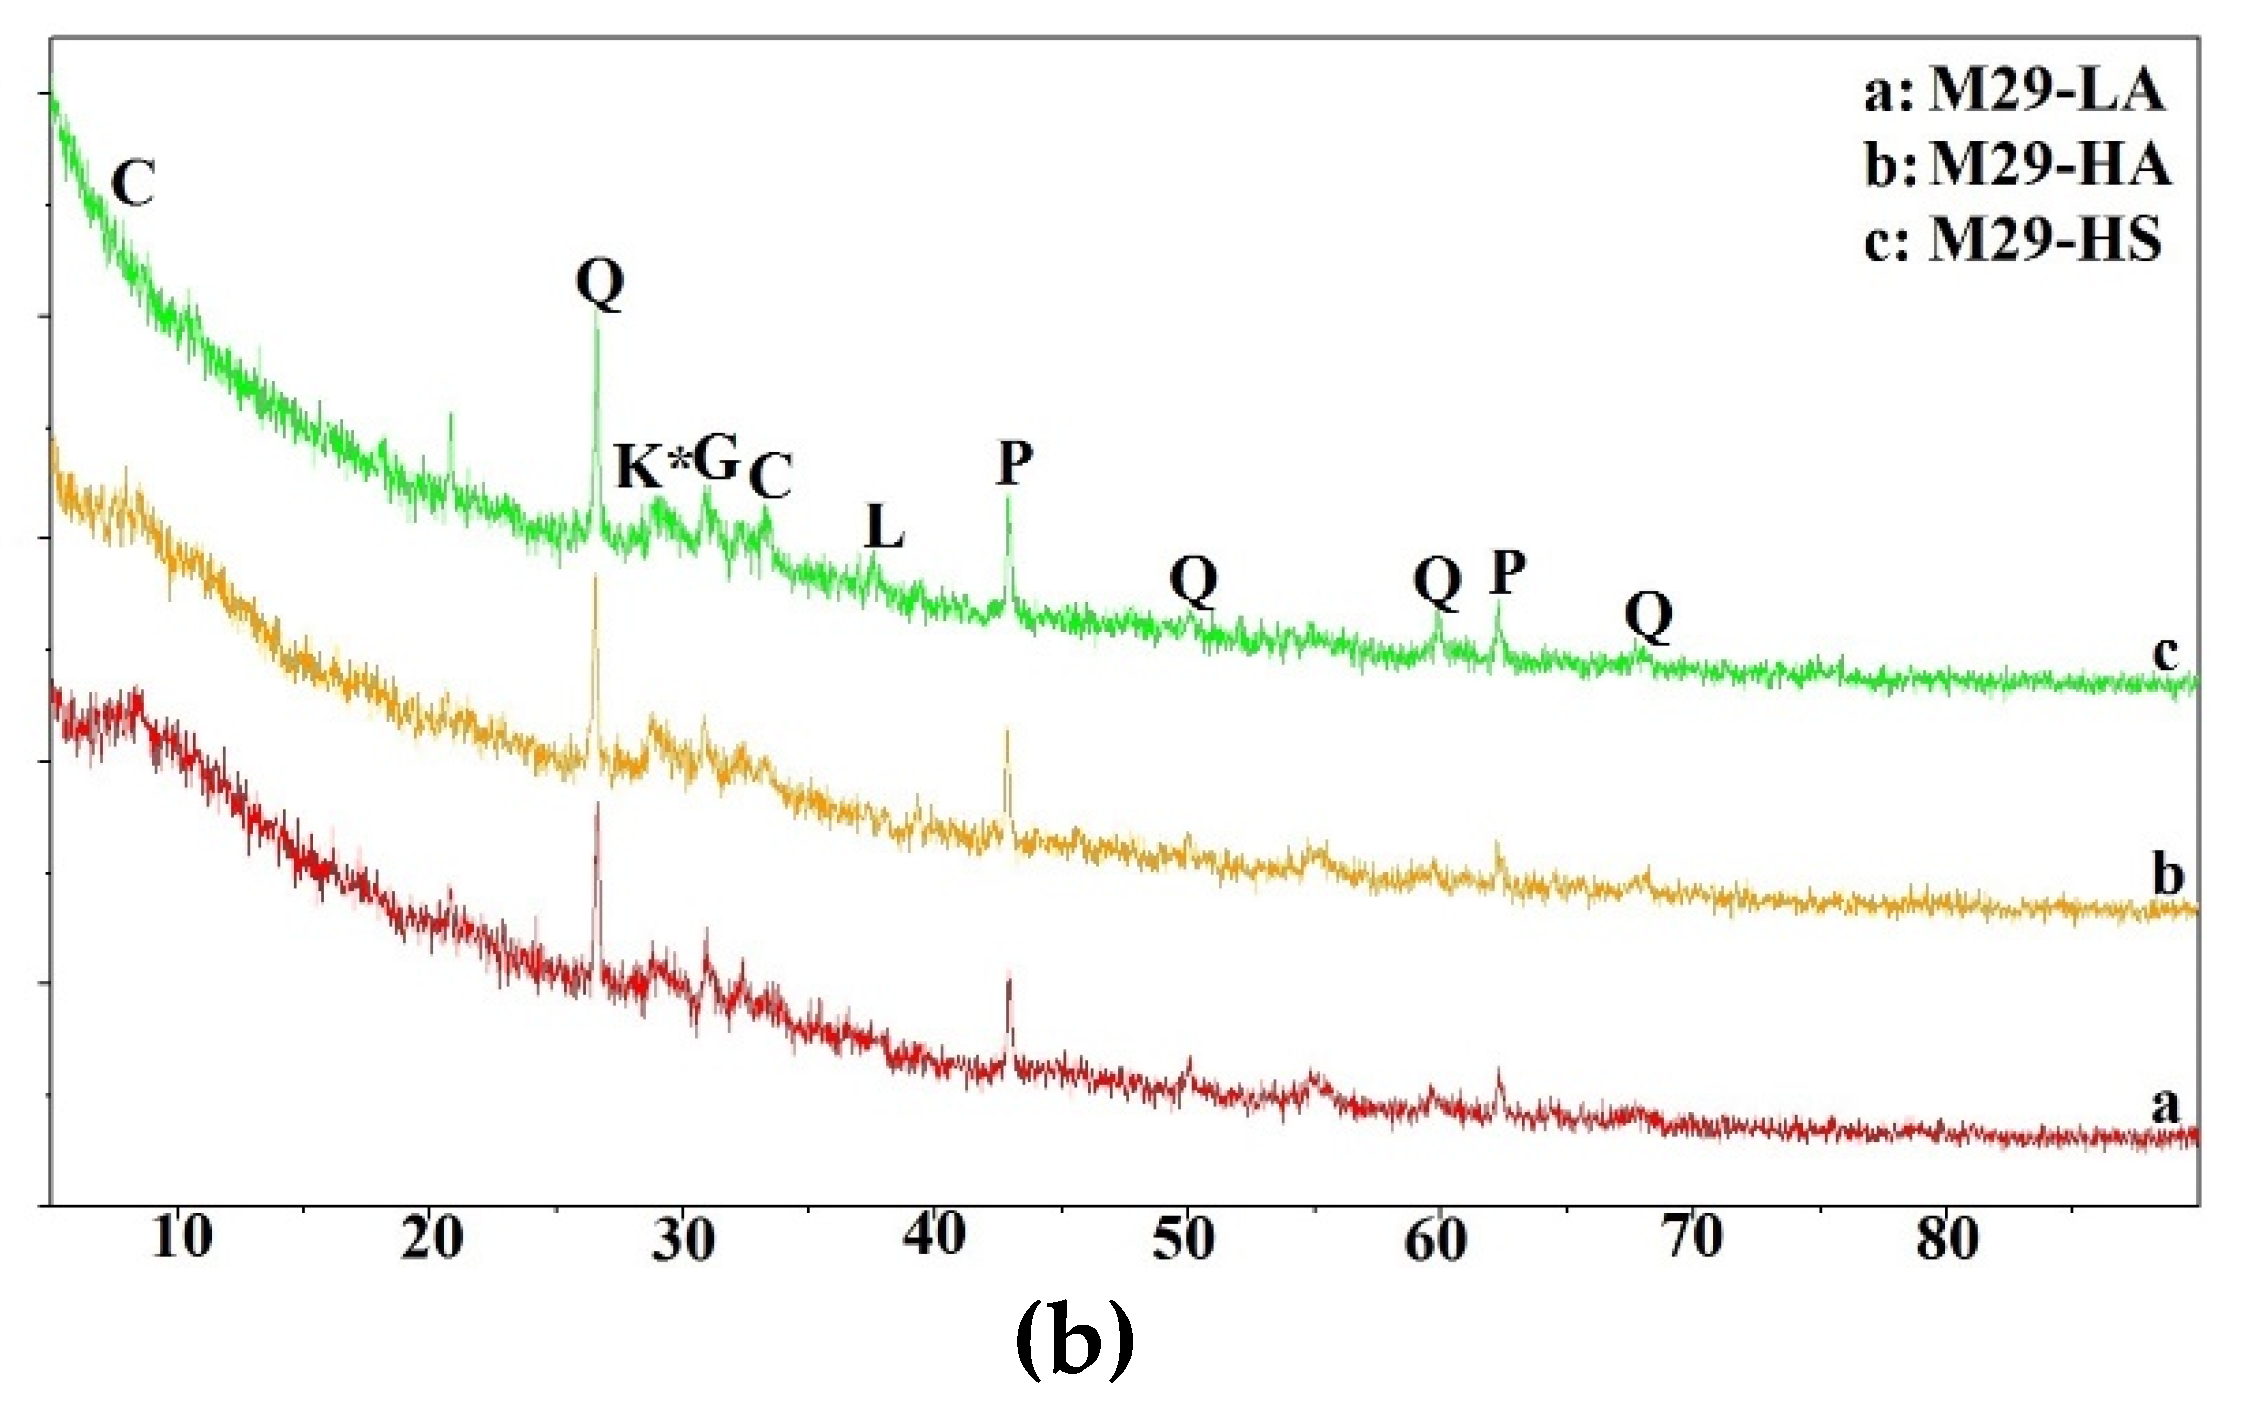
Figure 10.
XRD Results of M29 mixes oven-cured at 55º C (131º F). a) One-part mixes. b) two-part mixes.
Figure 10.
XRD Results of M29 mixes oven-cured at 55º C (131º F). a) One-part mixes. b) two-part mixes.
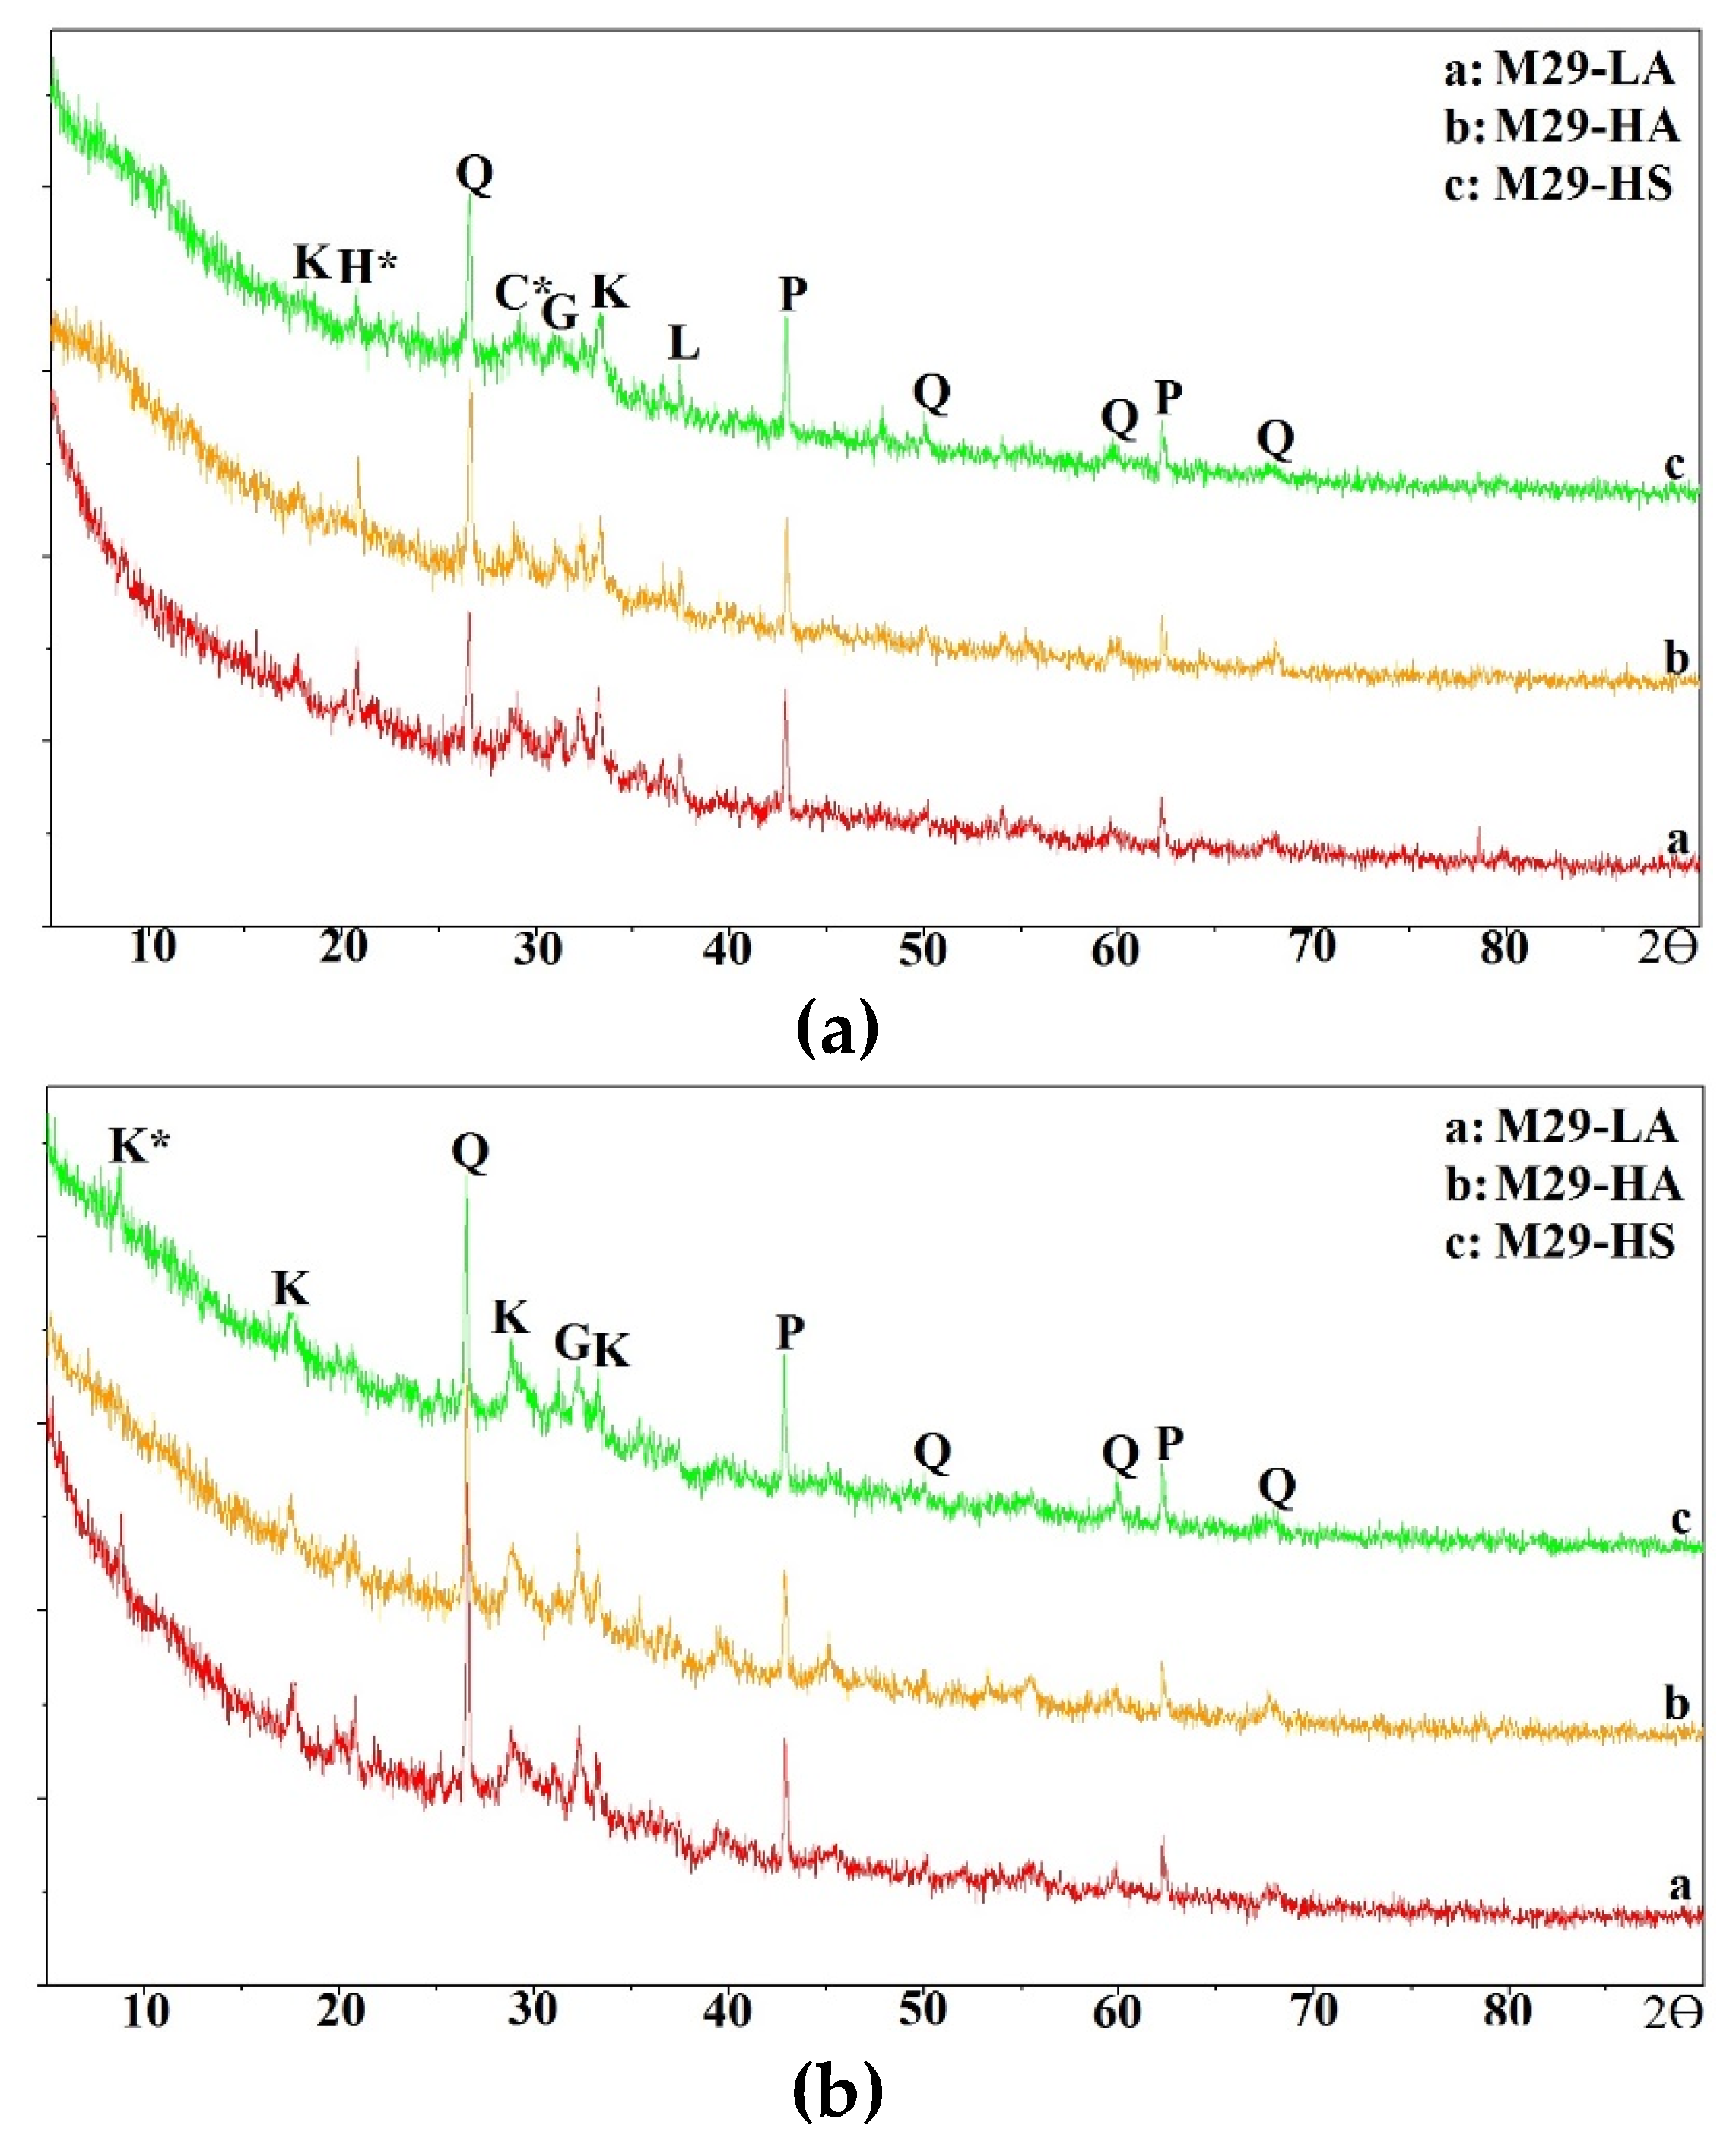
Figure 11.
XRD Results of M29 mixes oven-cured at 55º C (131º F). a) One-part mixes. b) two-part mixes.
Figure 11.
XRD Results of M29 mixes oven-cured at 55º C (131º F). a) One-part mixes. b) two-part mixes.
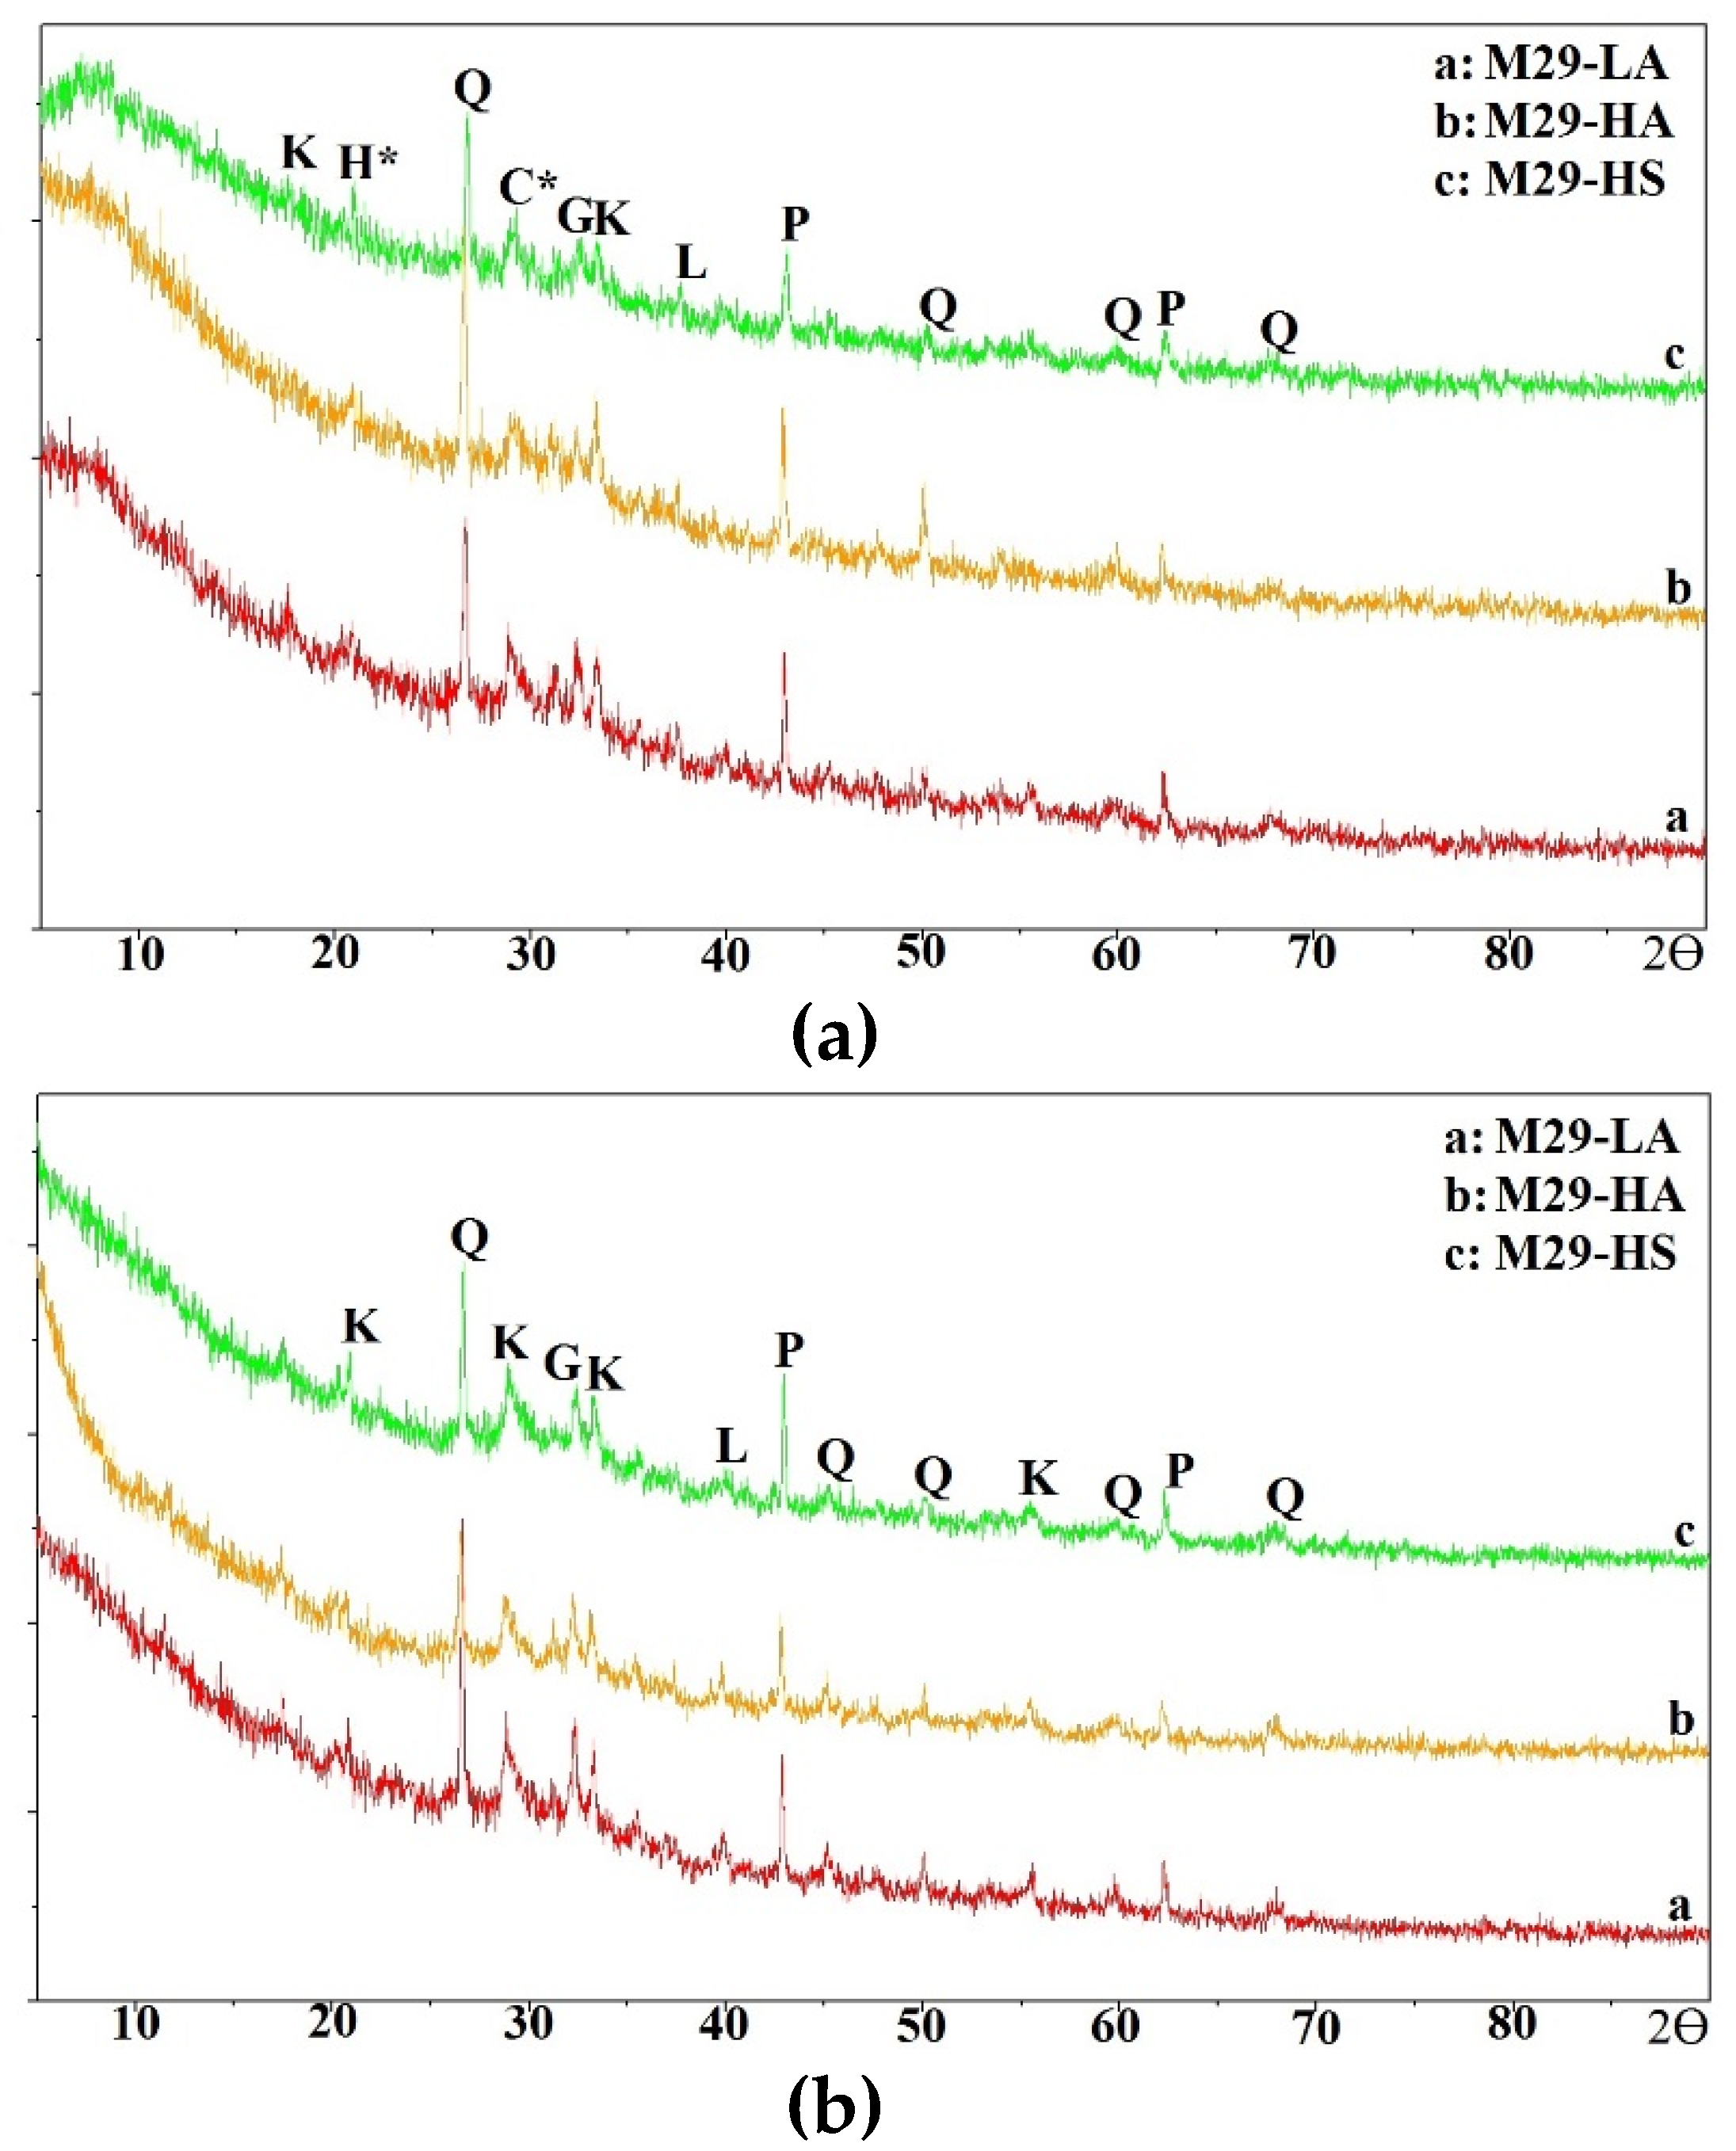
Figure 12.
XRD Results of M21 mixes ambient-cured. a) One-part mixes. b) Two-part mixes.
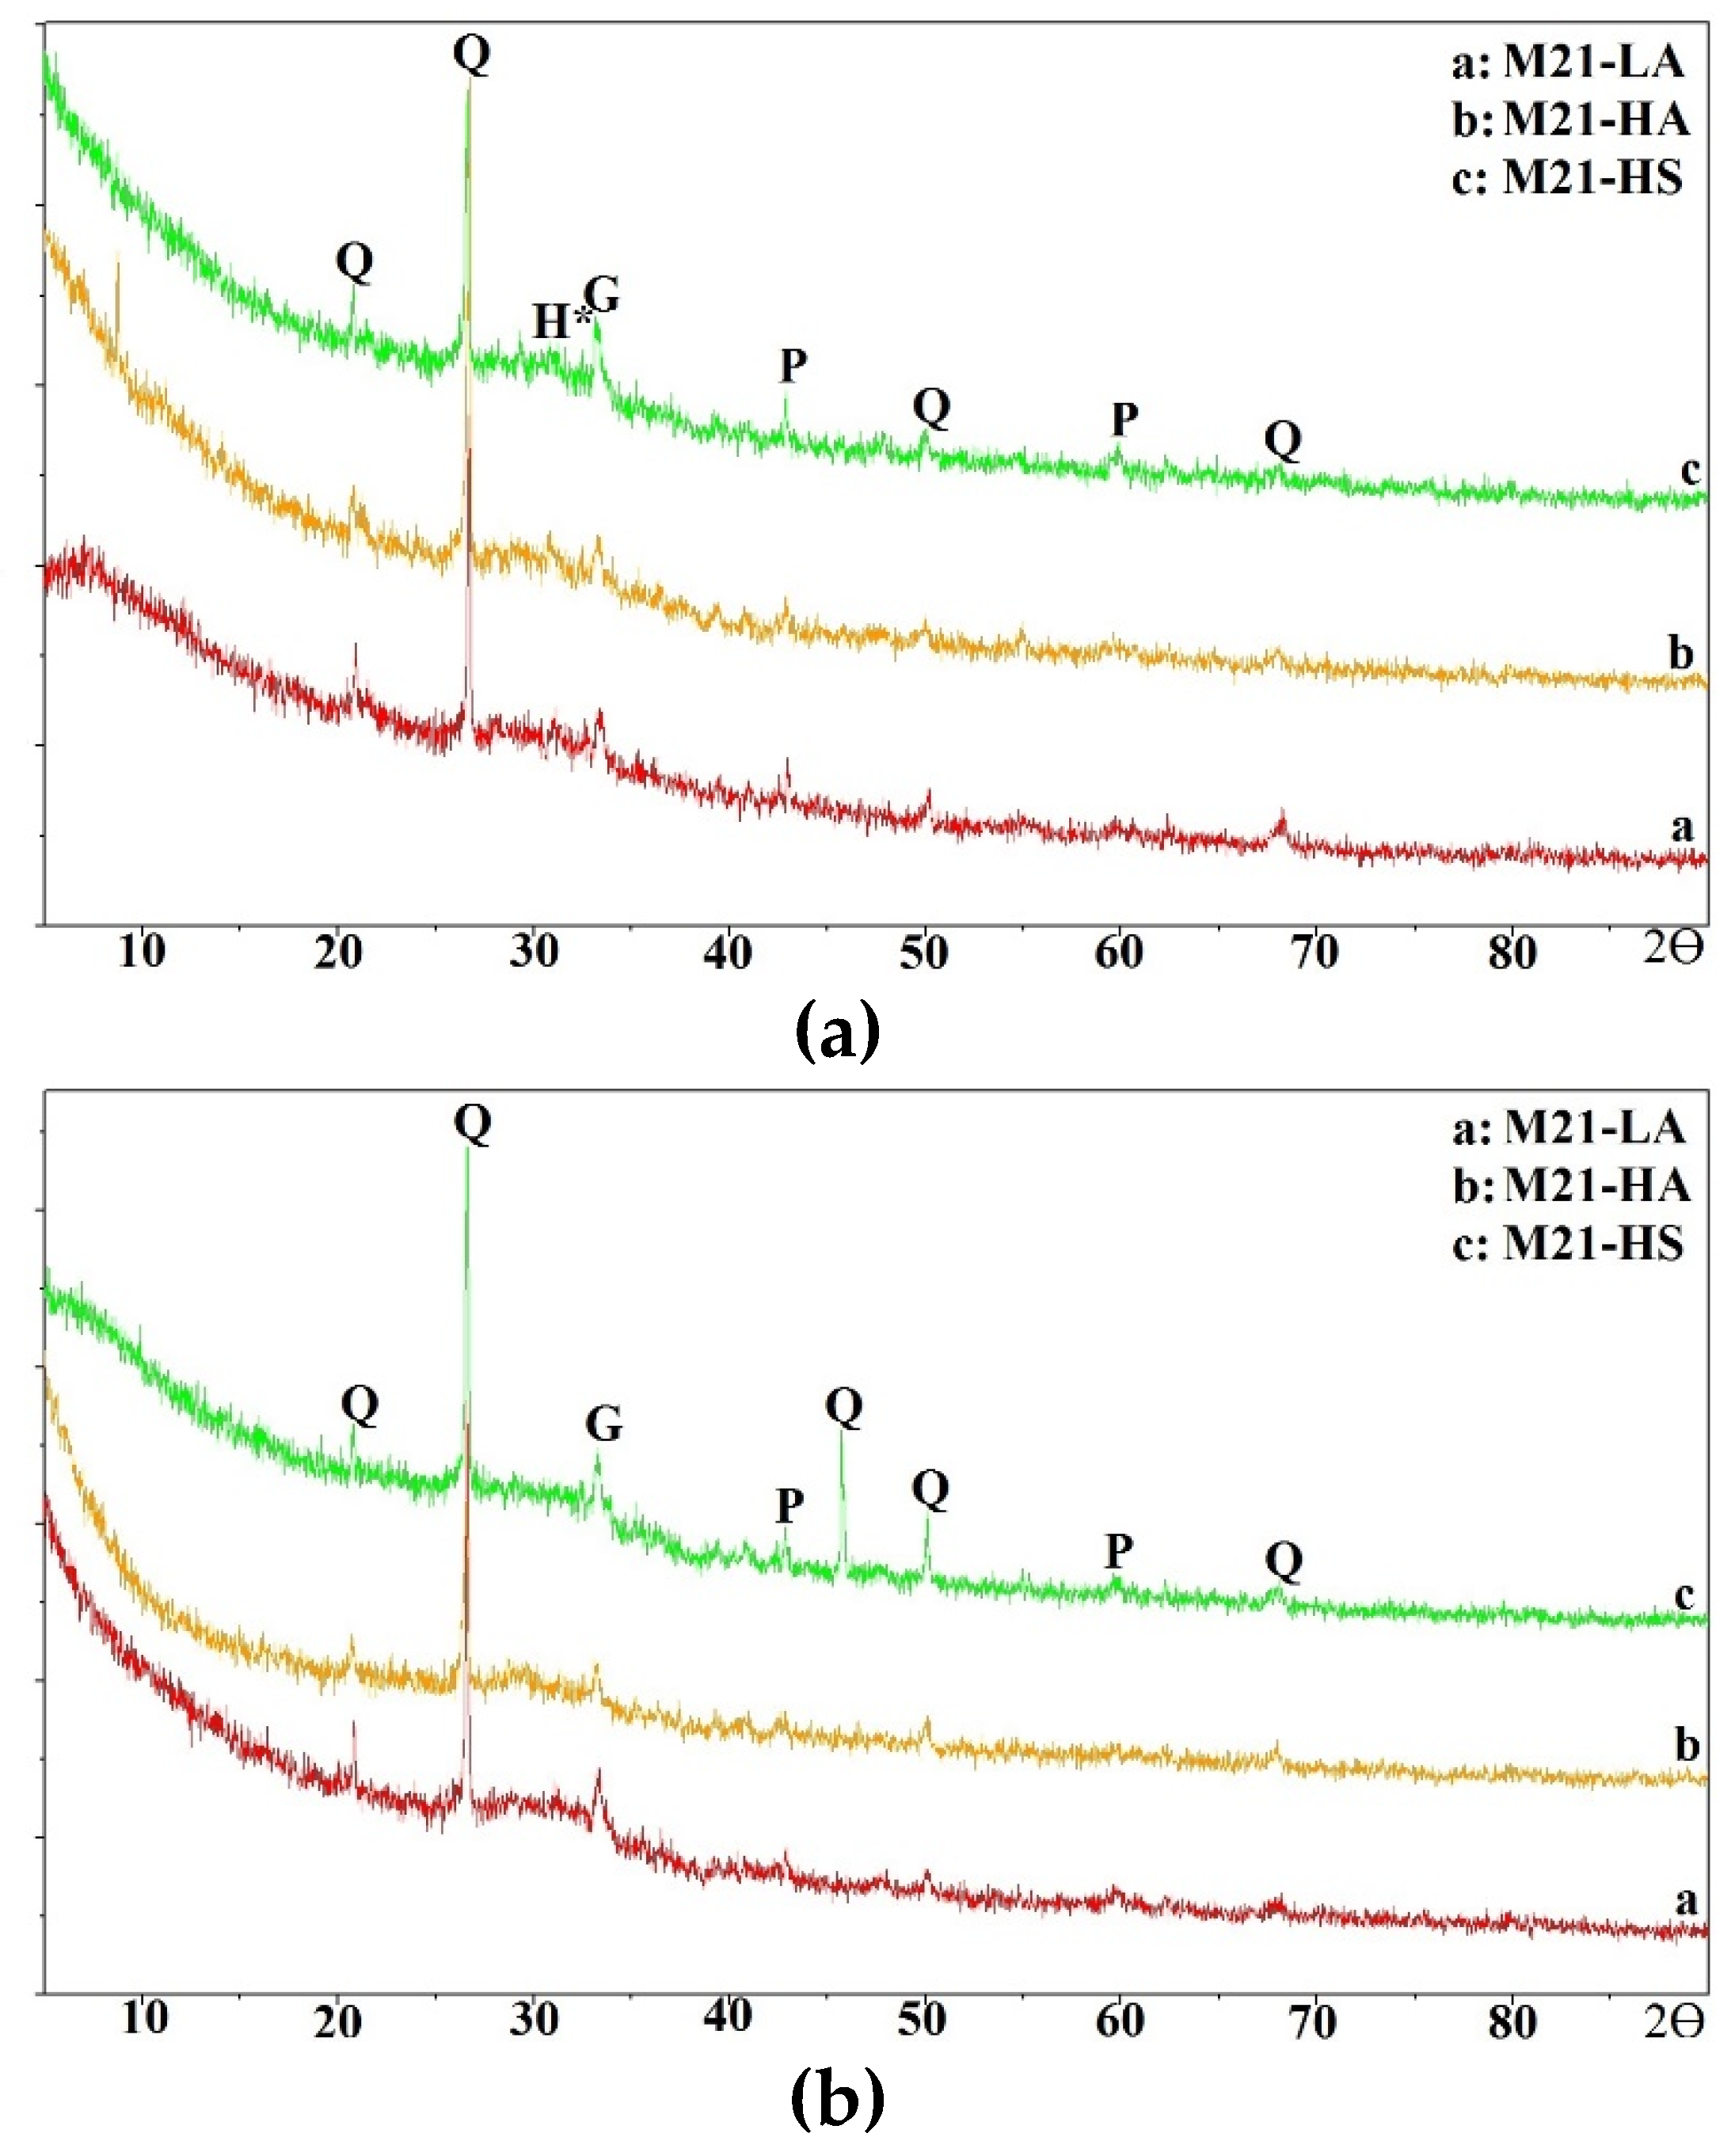
Figure 13.
XRD Results of M21 mixes oven-cured at 55º C (131º F). a) One-part mixes. b) Two-part mixes.
Figure 13.
XRD Results of M21 mixes oven-cured at 55º C (131º F). a) One-part mixes. b) Two-part mixes.
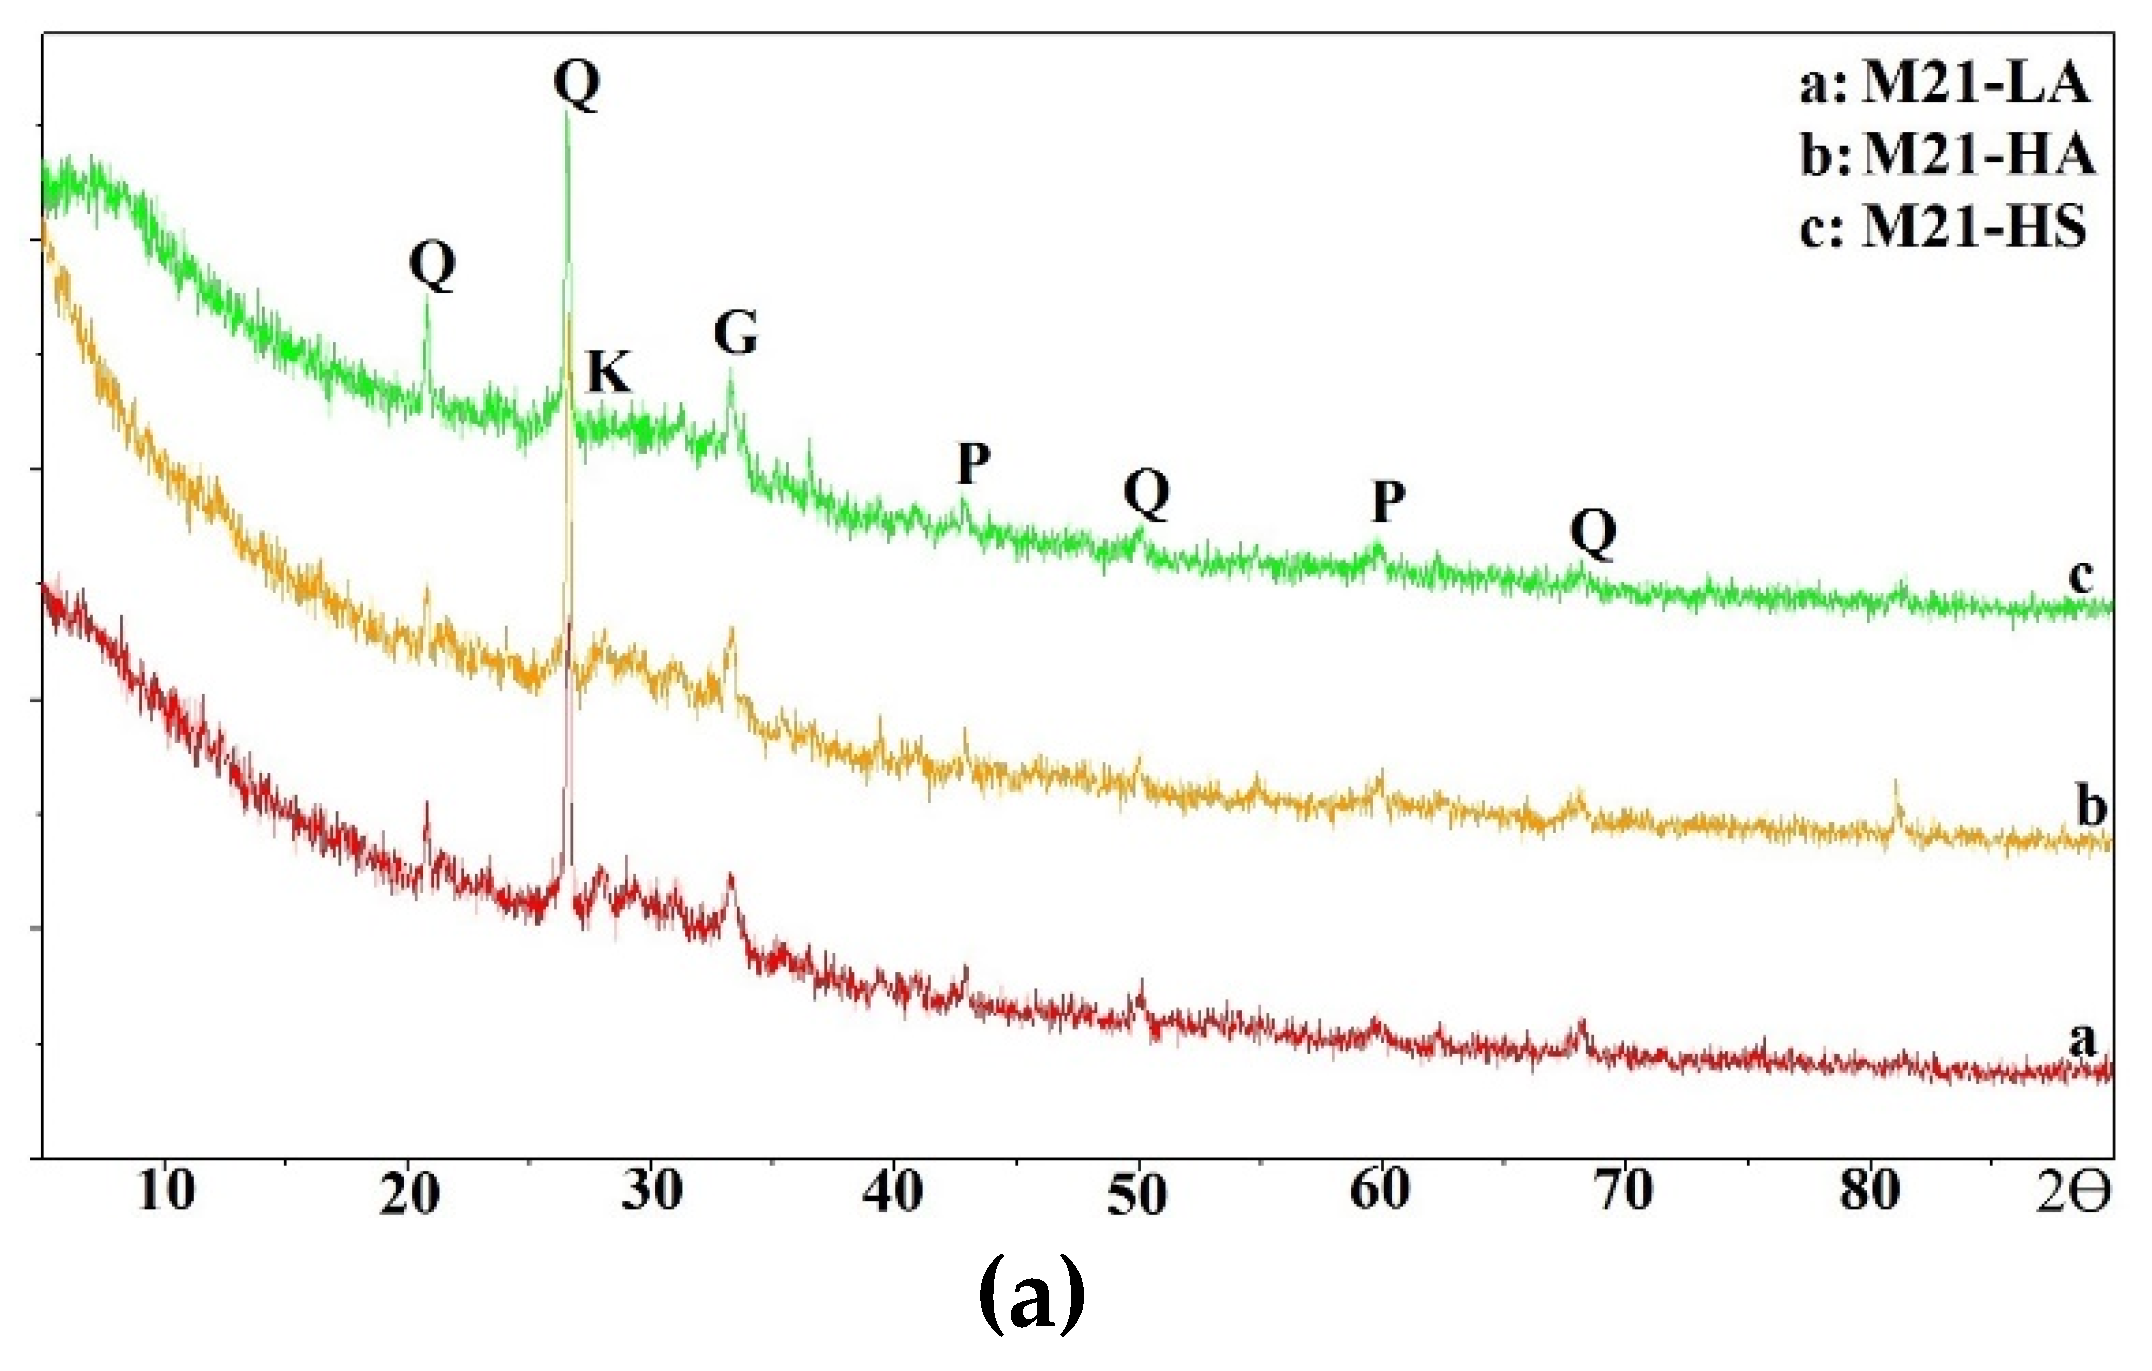
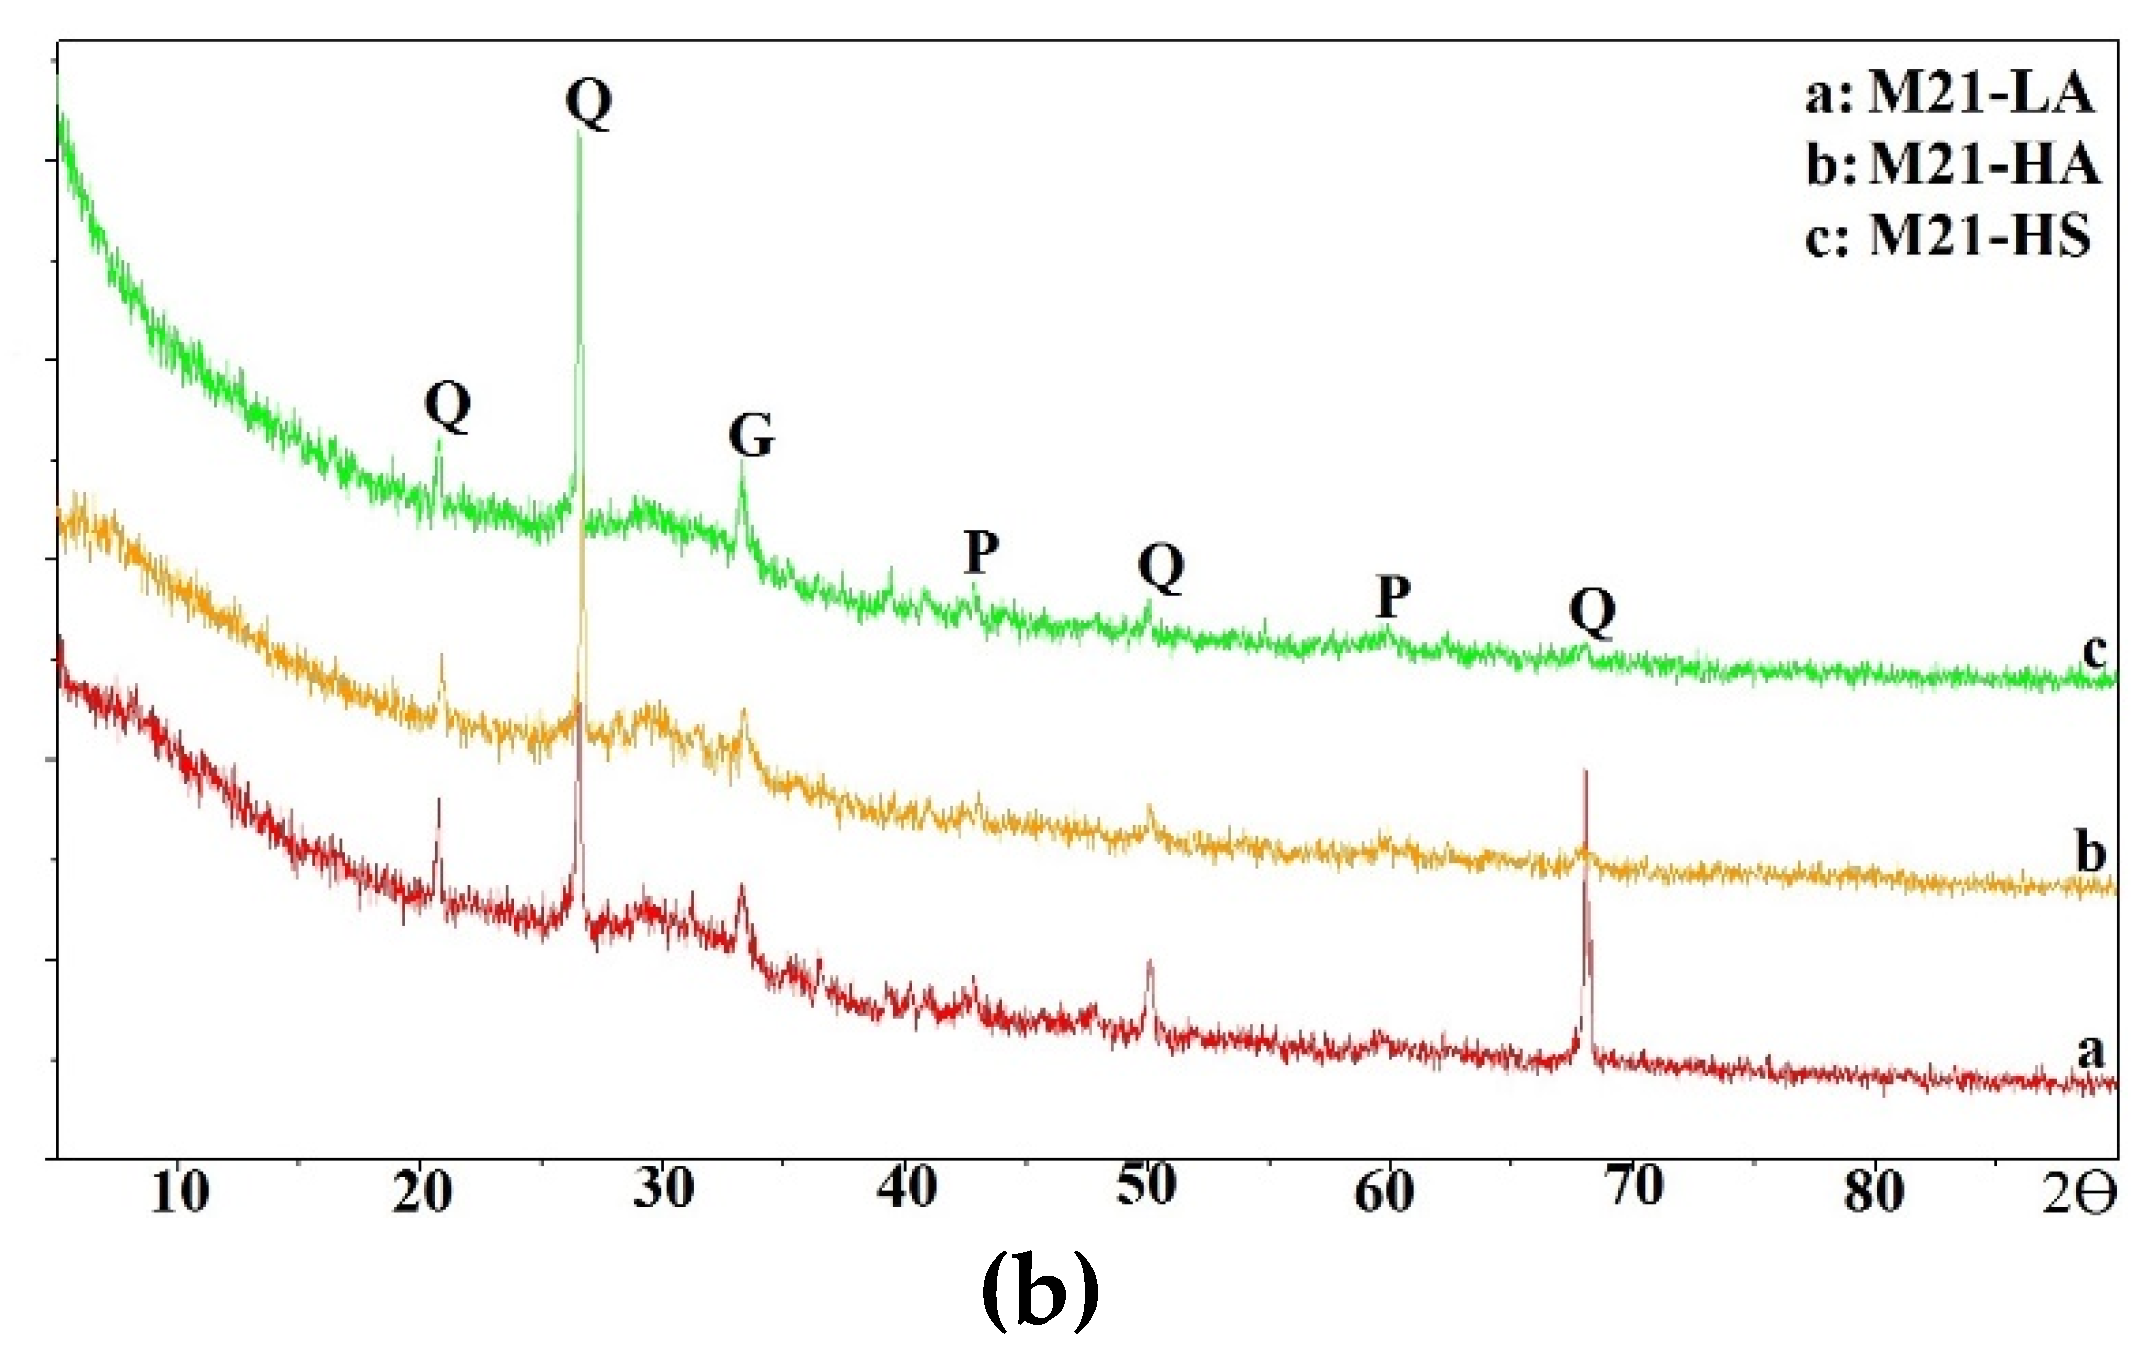
Figure 14.
XRD Results of M21 mixes oven-cured at 70º C (158º F). a) One-part mixes. b) Two-part mixes.
Figure 14.
XRD Results of M21 mixes oven-cured at 70º C (158º F). a) One-part mixes. b) Two-part mixes.
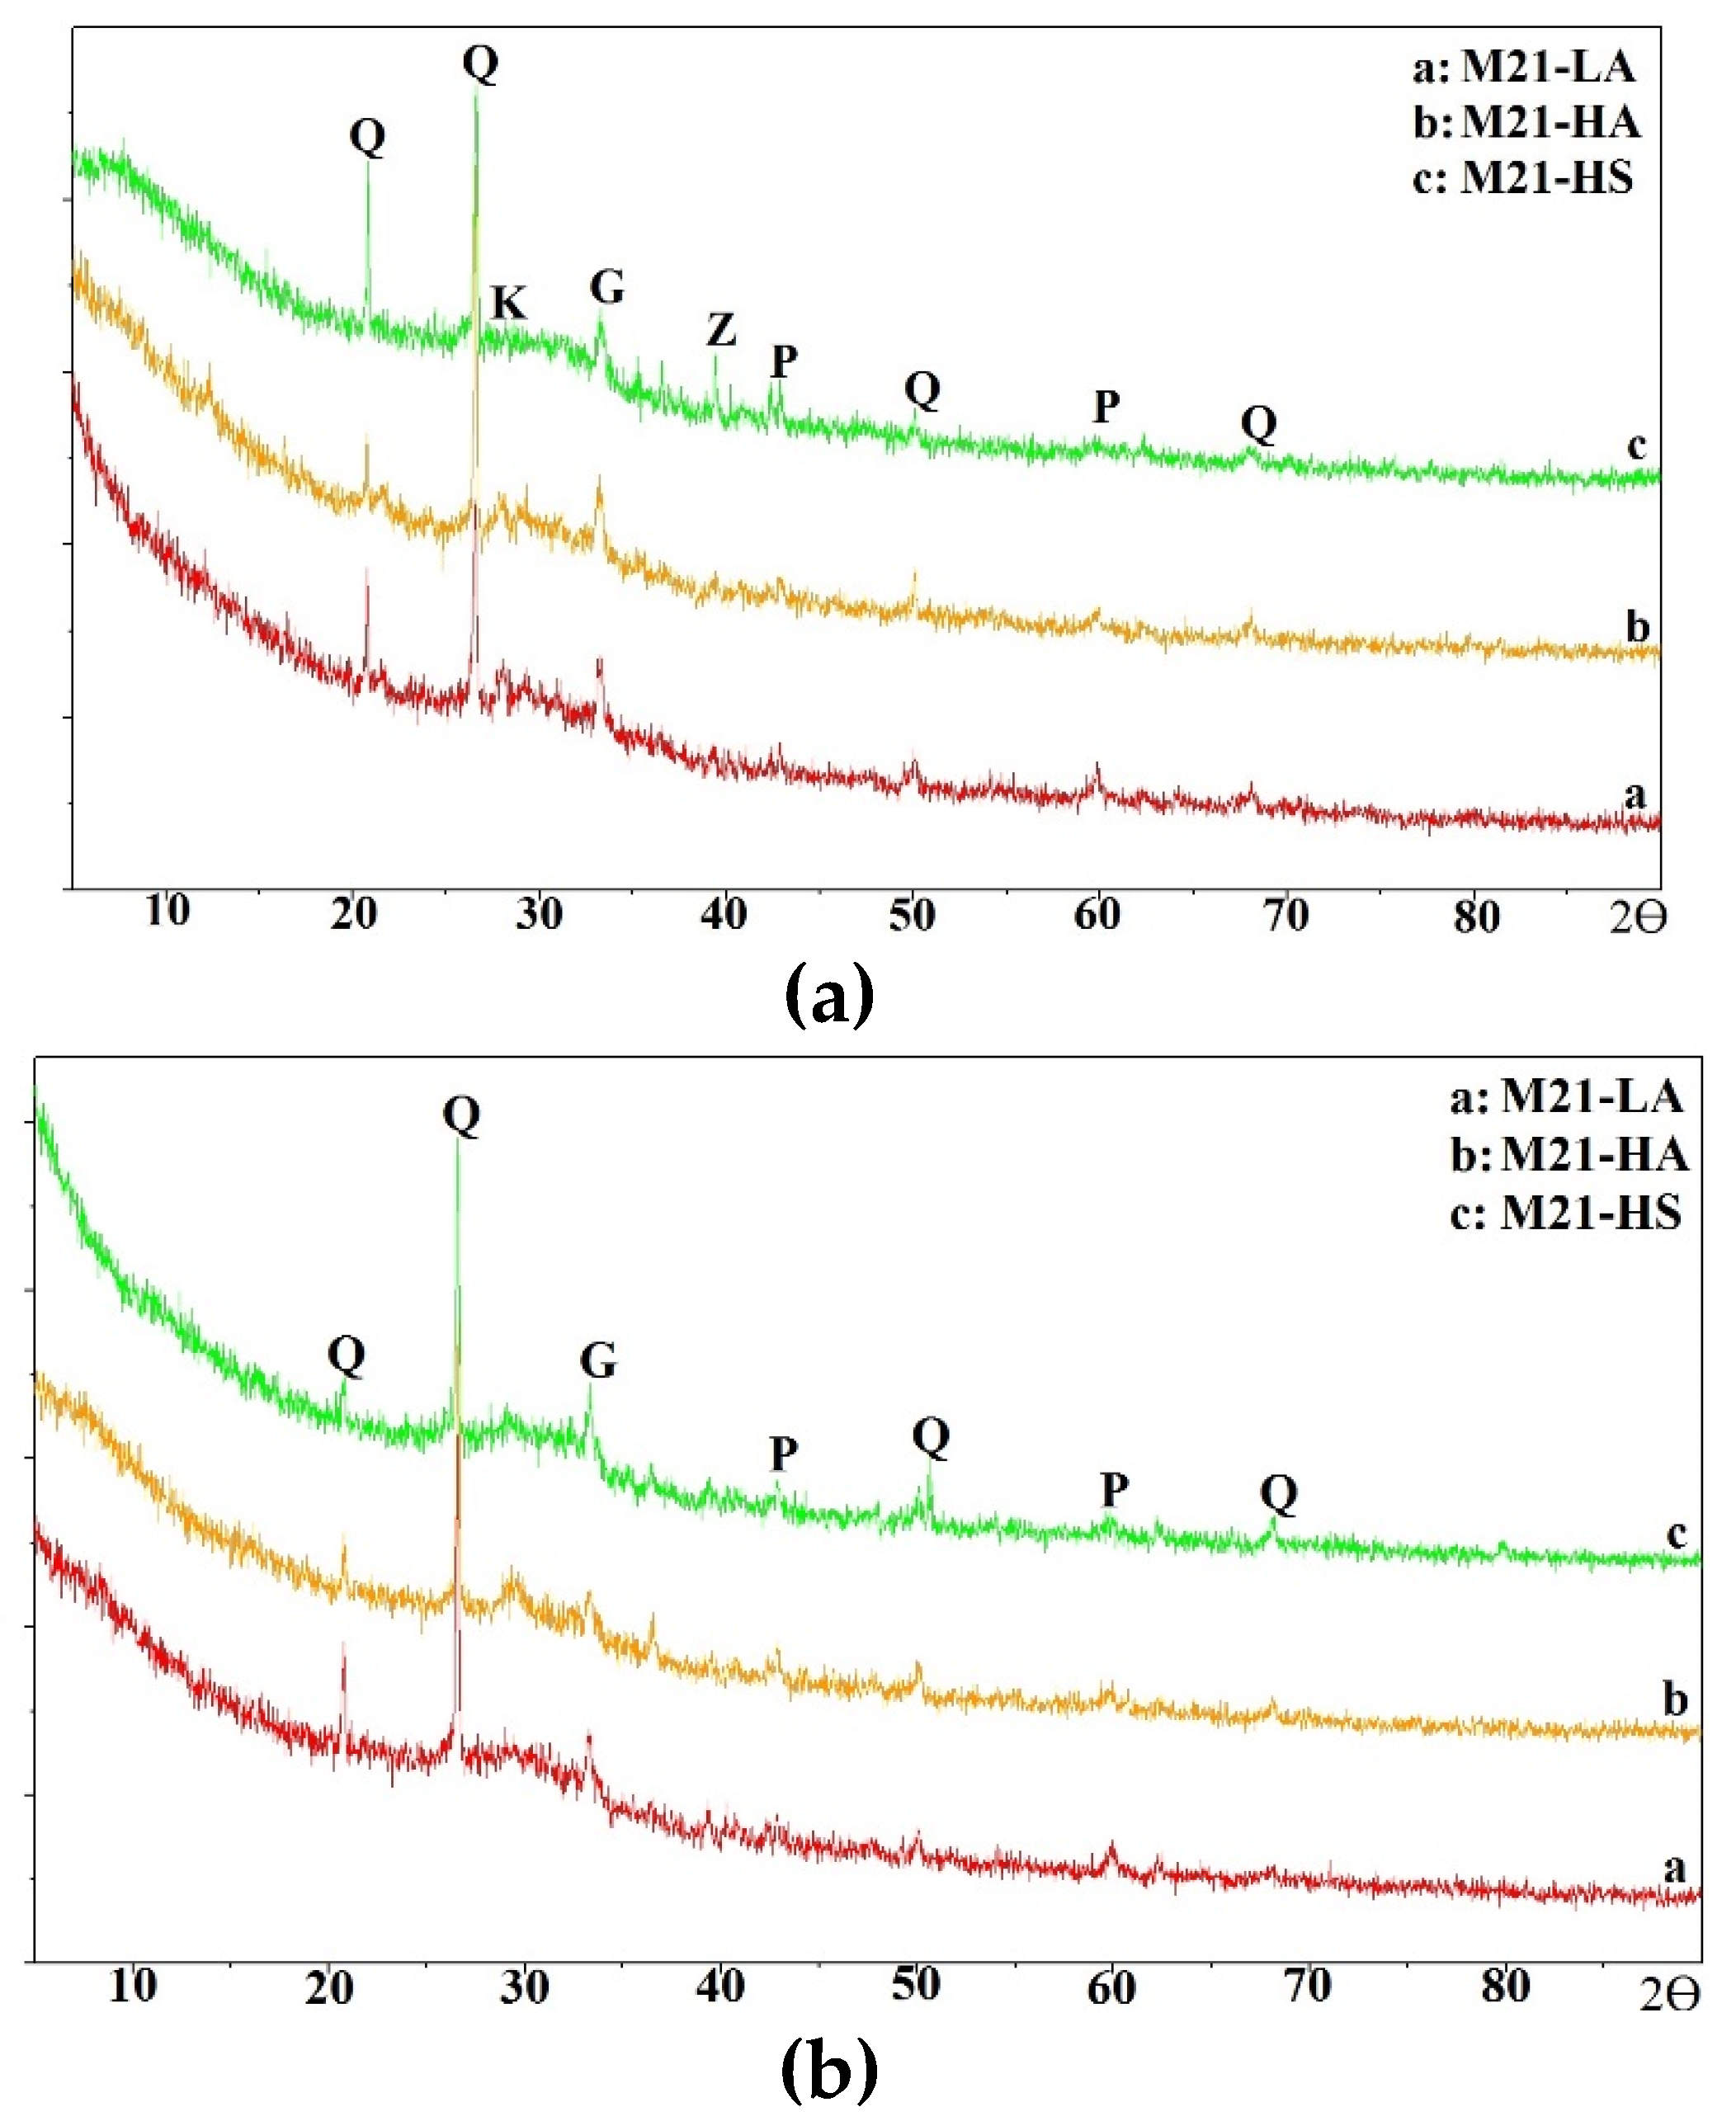
Figure 15.
XRD Results of M37 mixes ambient-cured. a) One-part mixes. b) two-part mixes.
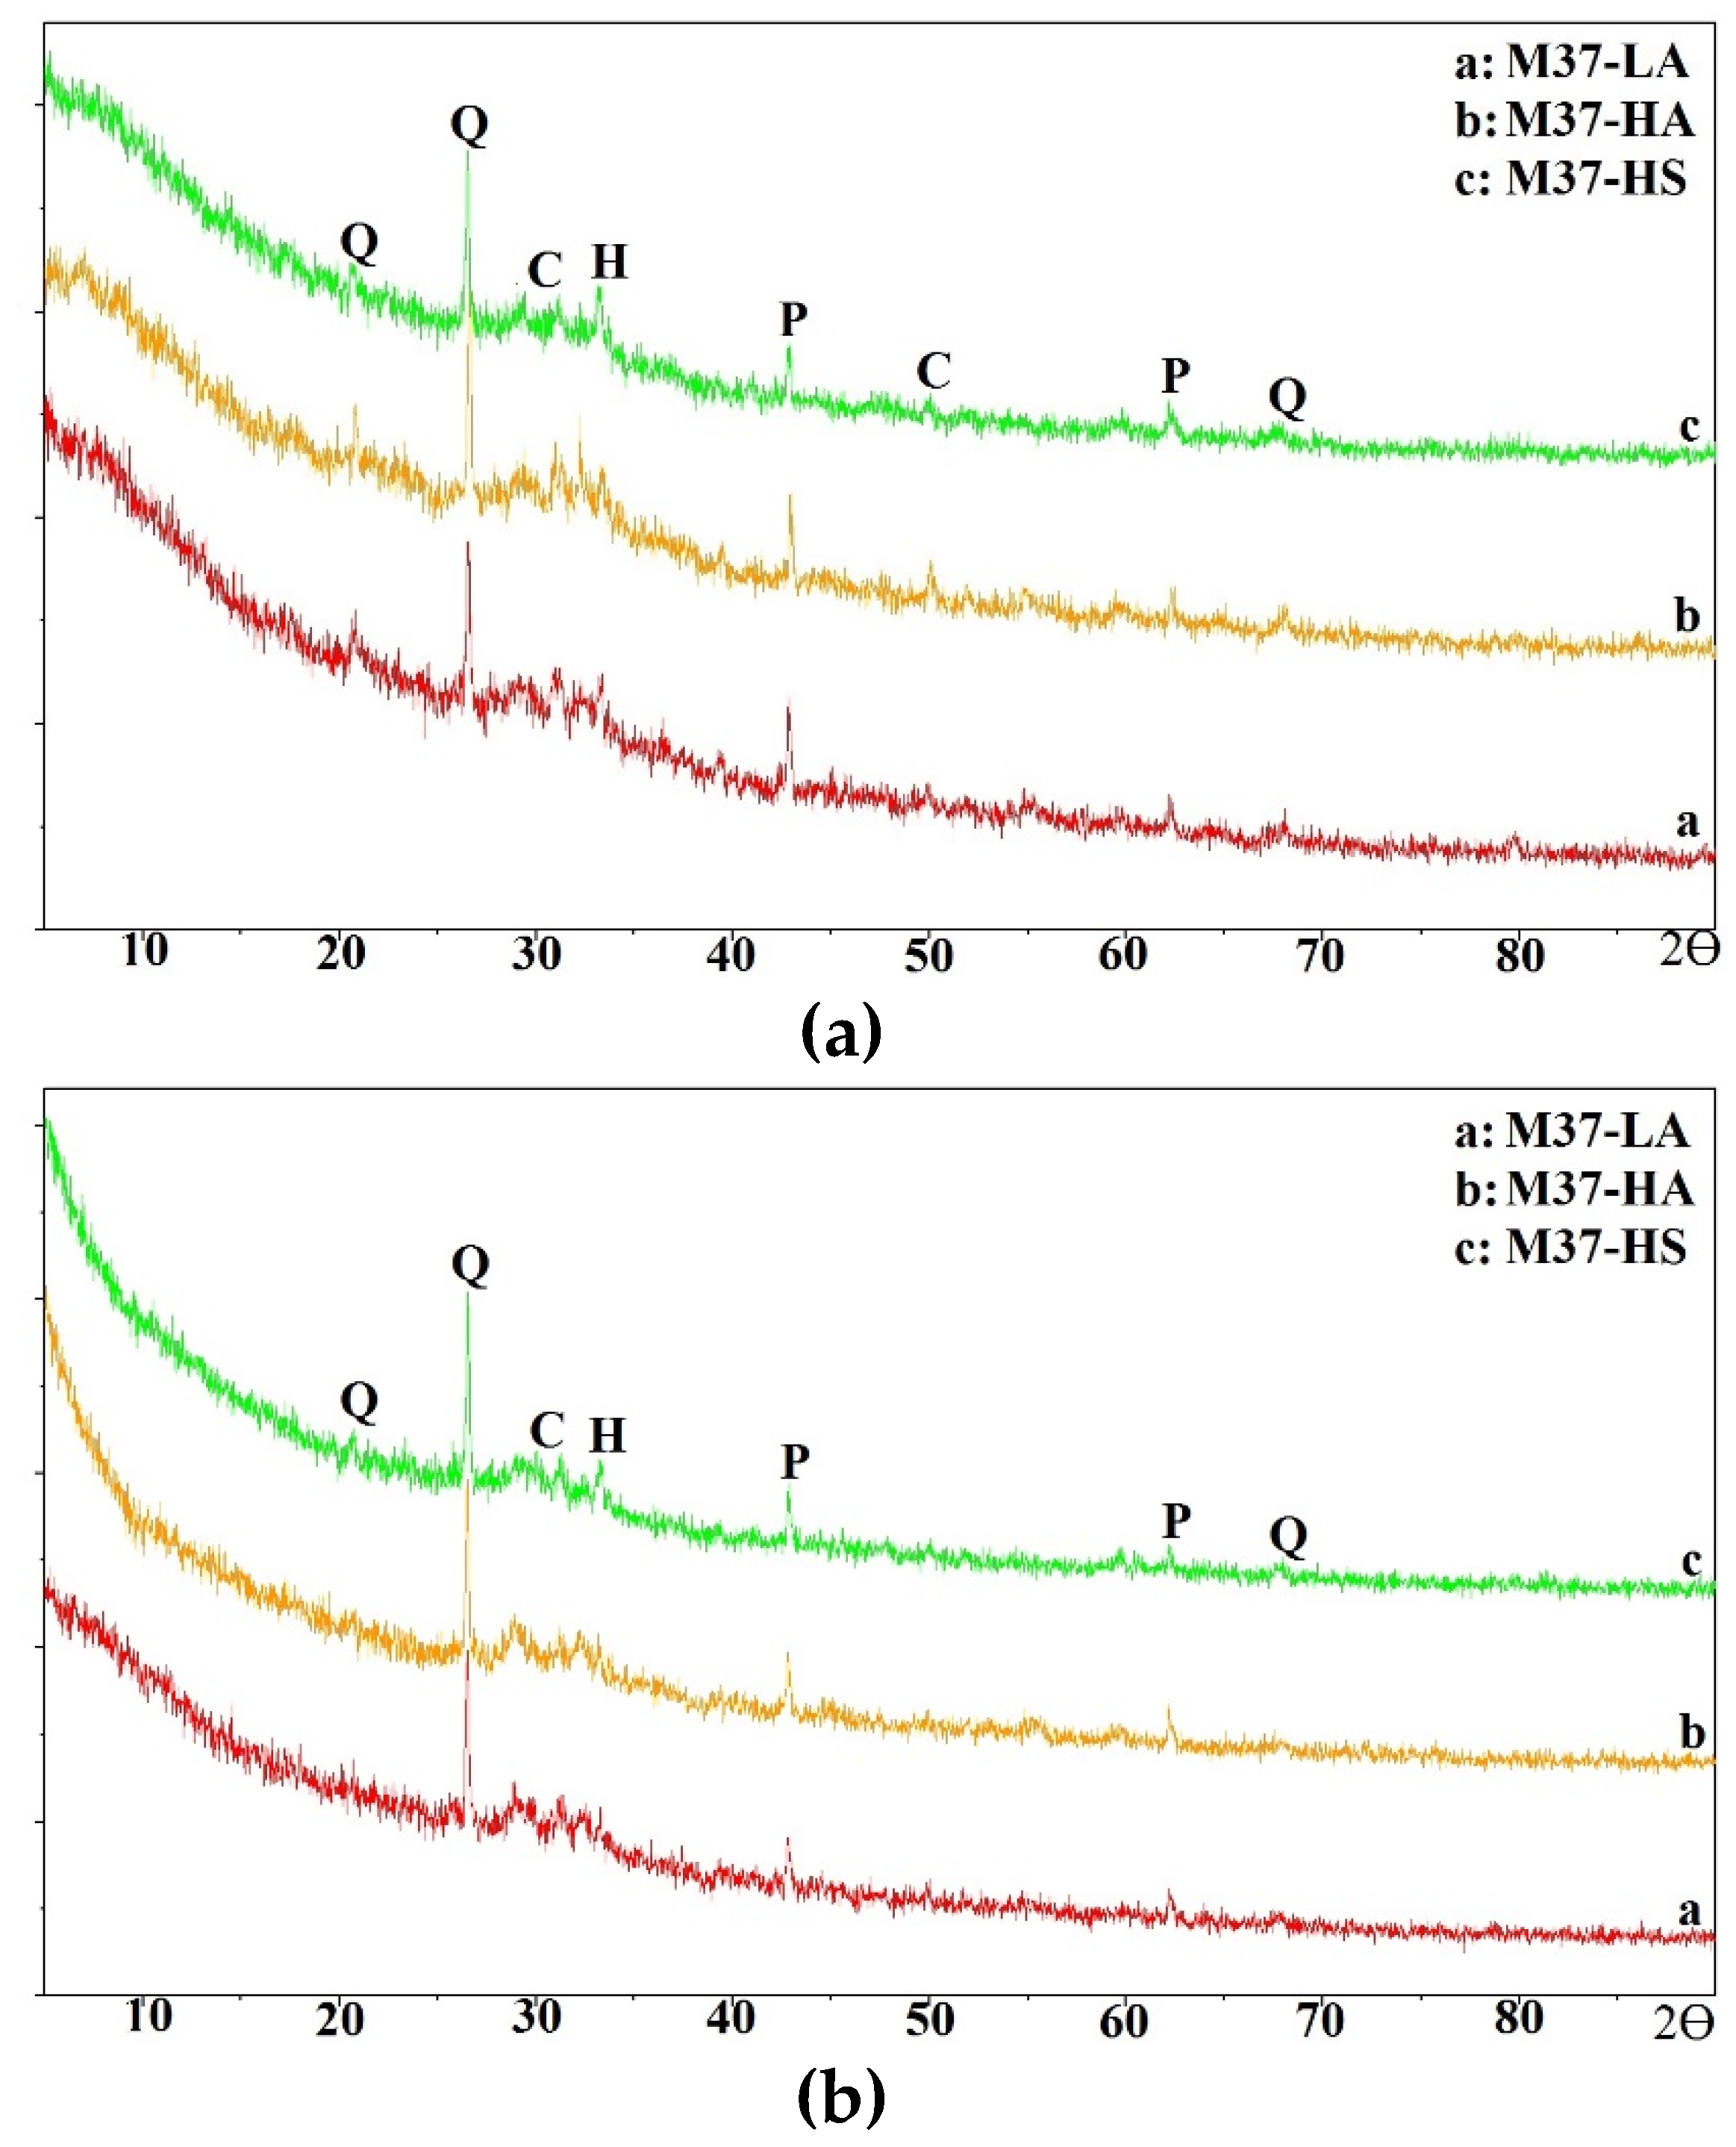
Figure 16.
XRD Results of M37 mixes oven-cured at 55º C (131º F). a) One-part mixes. b) Two-part mixes.
Figure 16.
XRD Results of M37 mixes oven-cured at 55º C (131º F). a) One-part mixes. b) Two-part mixes.
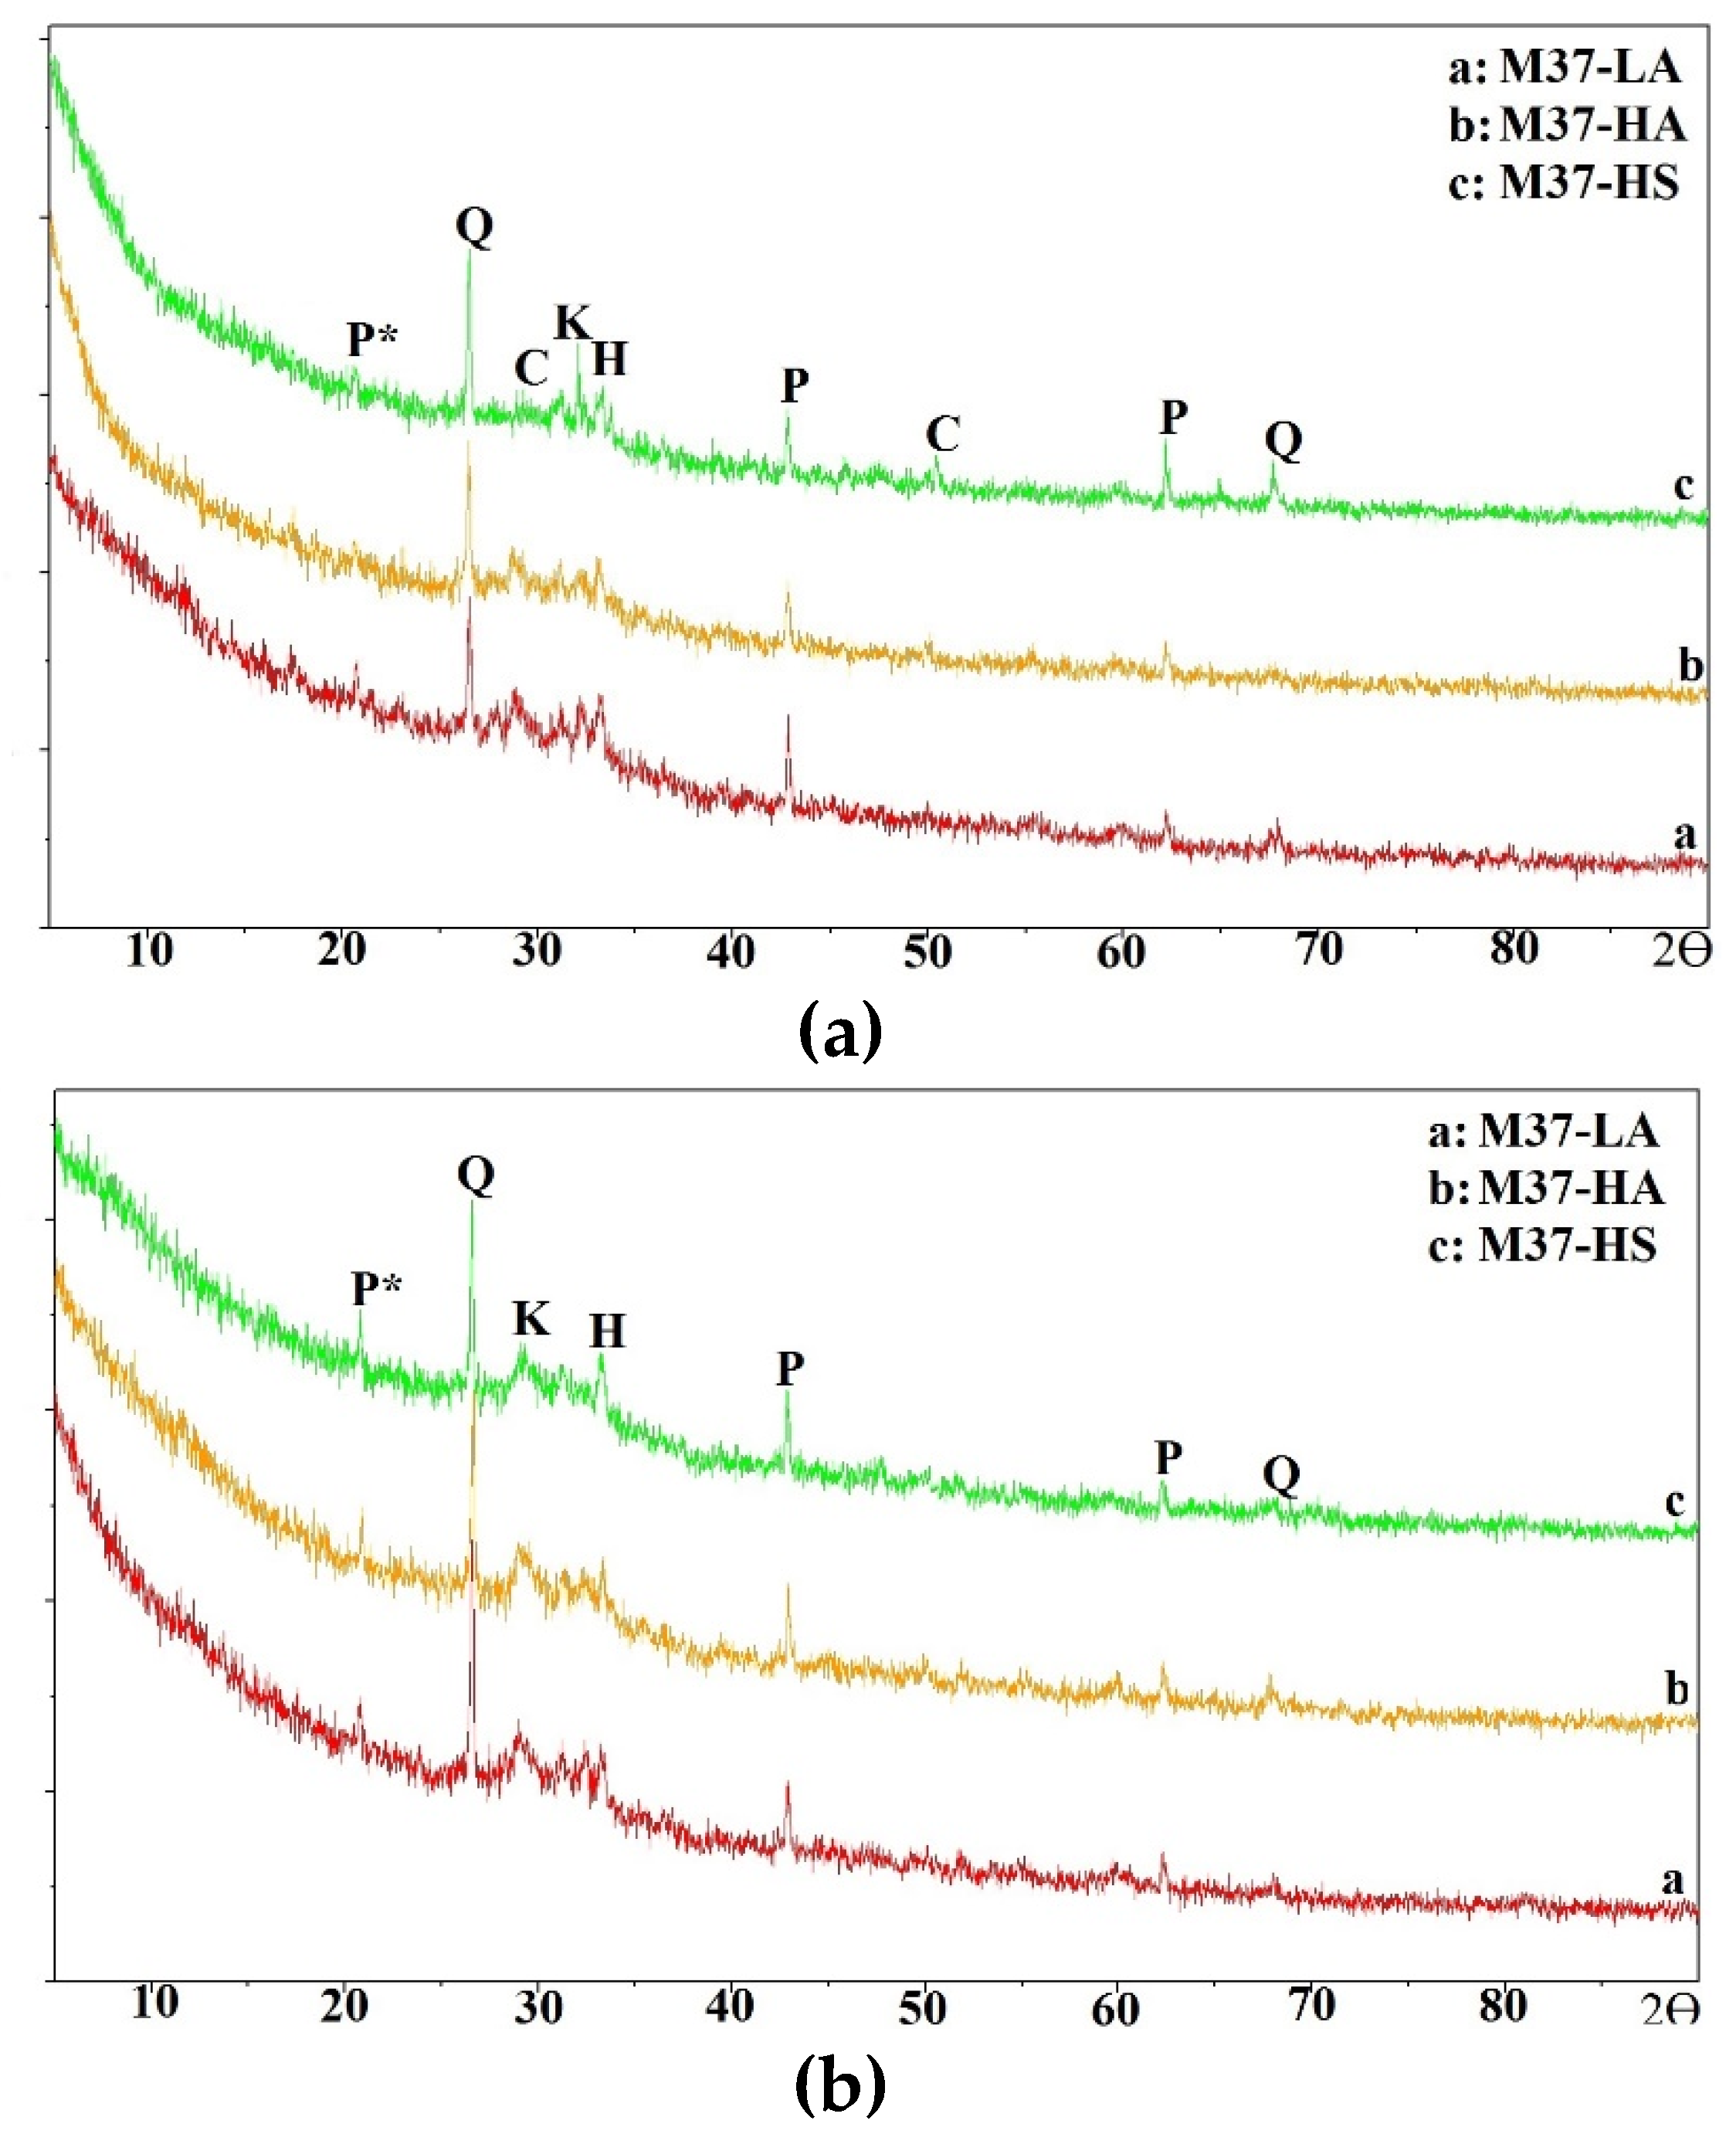
Figure 17.
XRD Results of M37 mixes oven-cured at 70º C (158º F). a) One-part mixes. b) Two-part mixes.
Figure 17.
XRD Results of M37 mixes oven-cured at 70º C (158º F). a) One-part mixes. b) Two-part mixes.
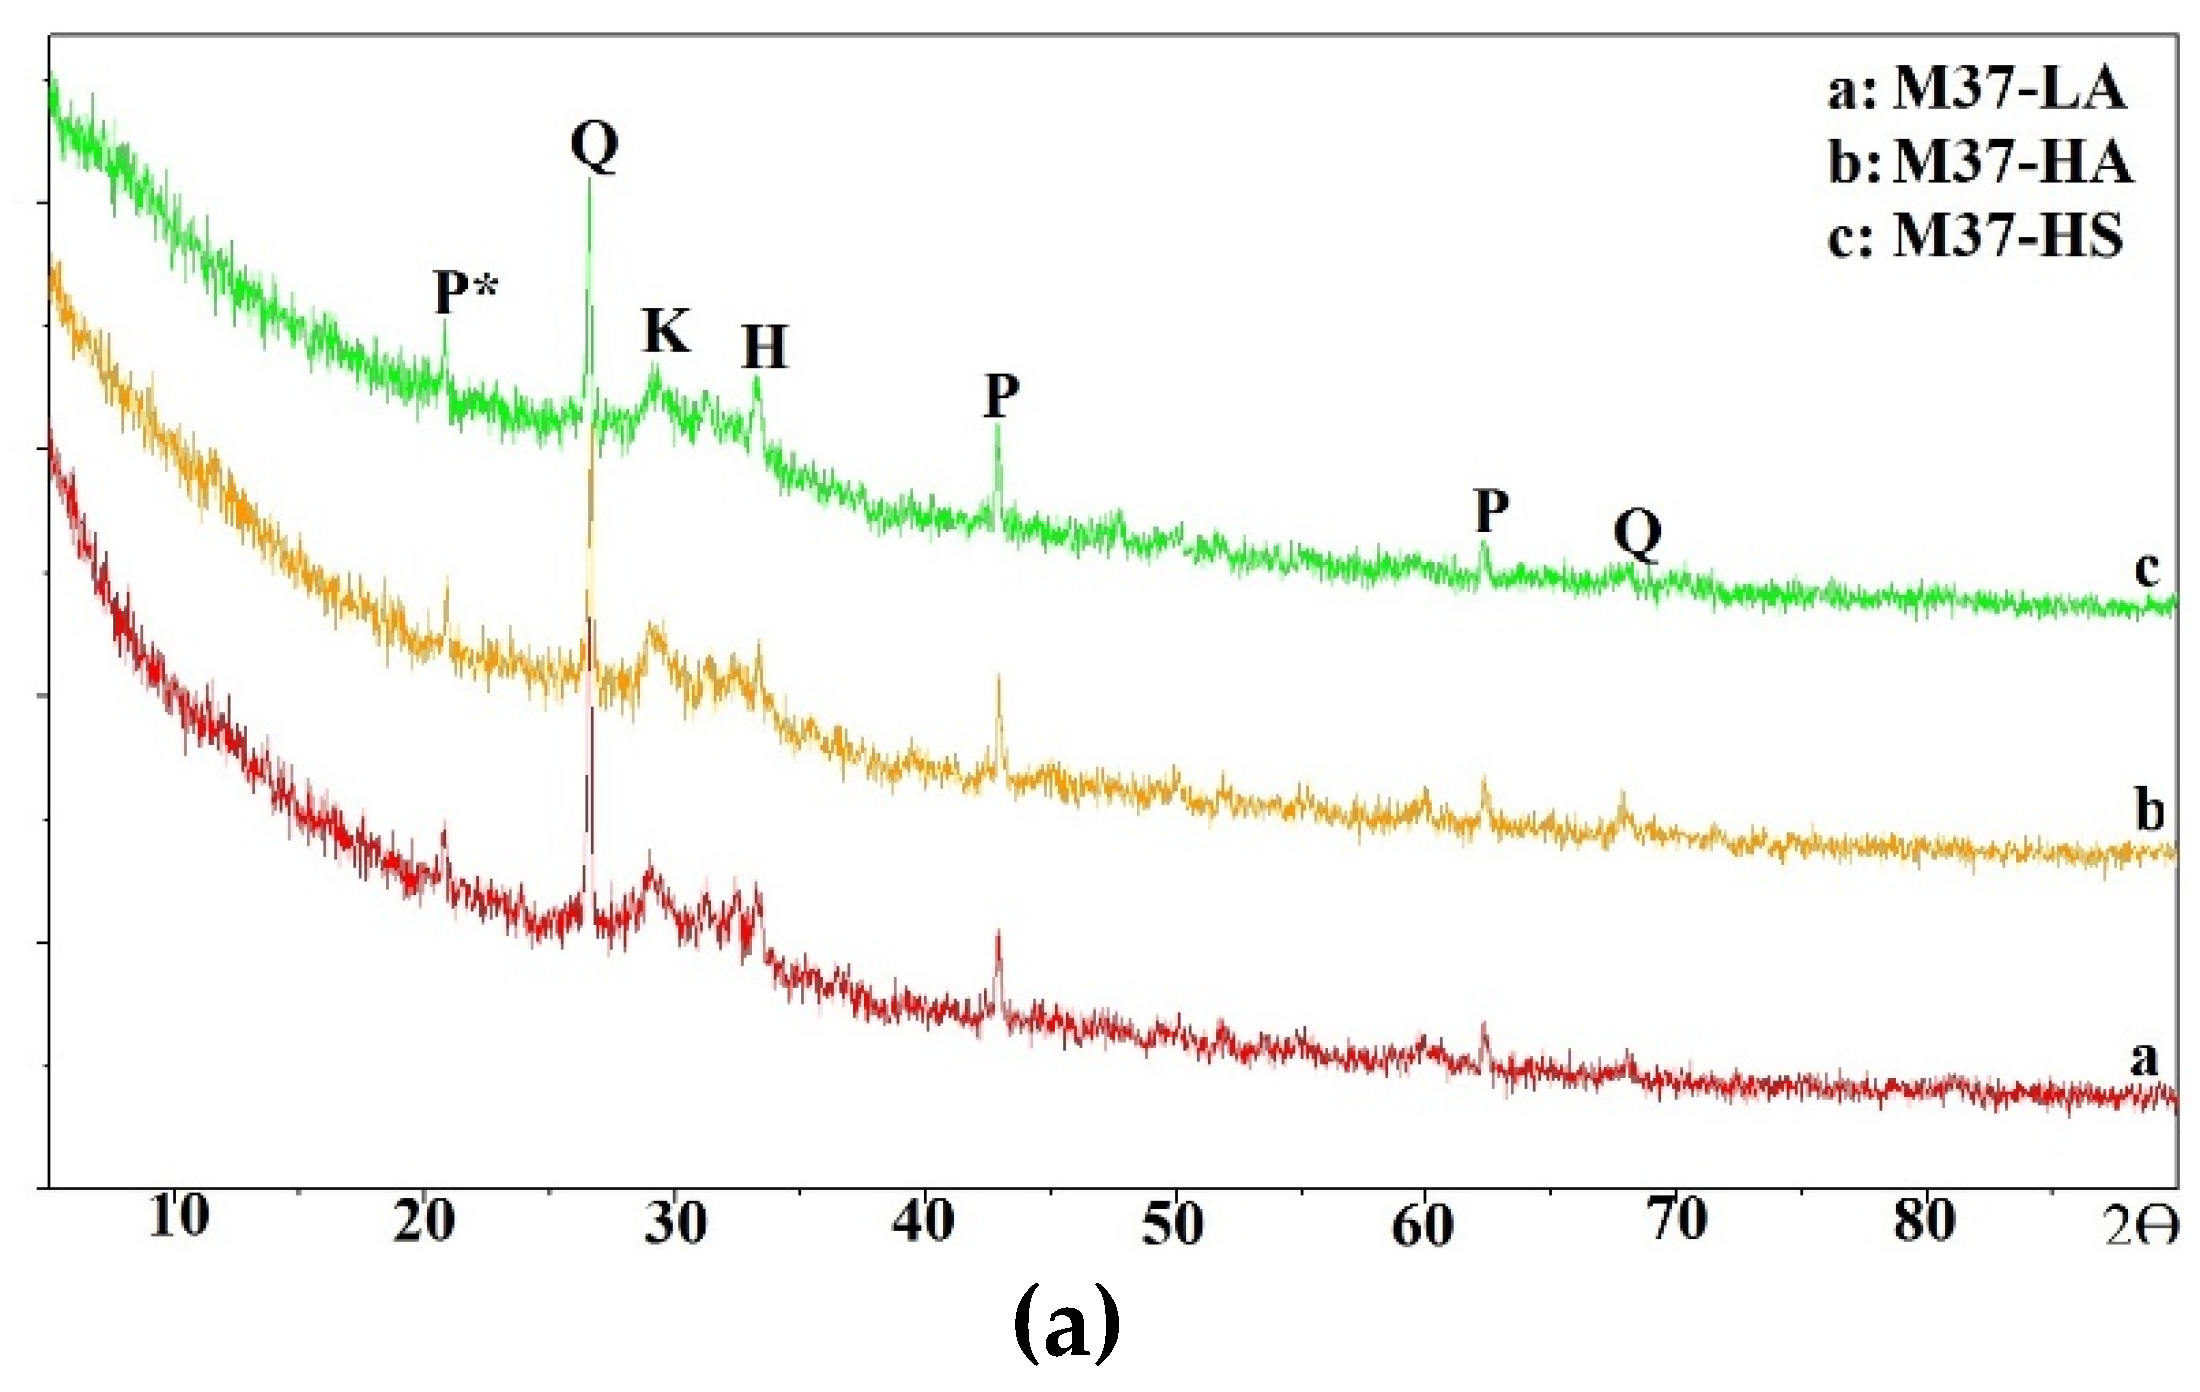
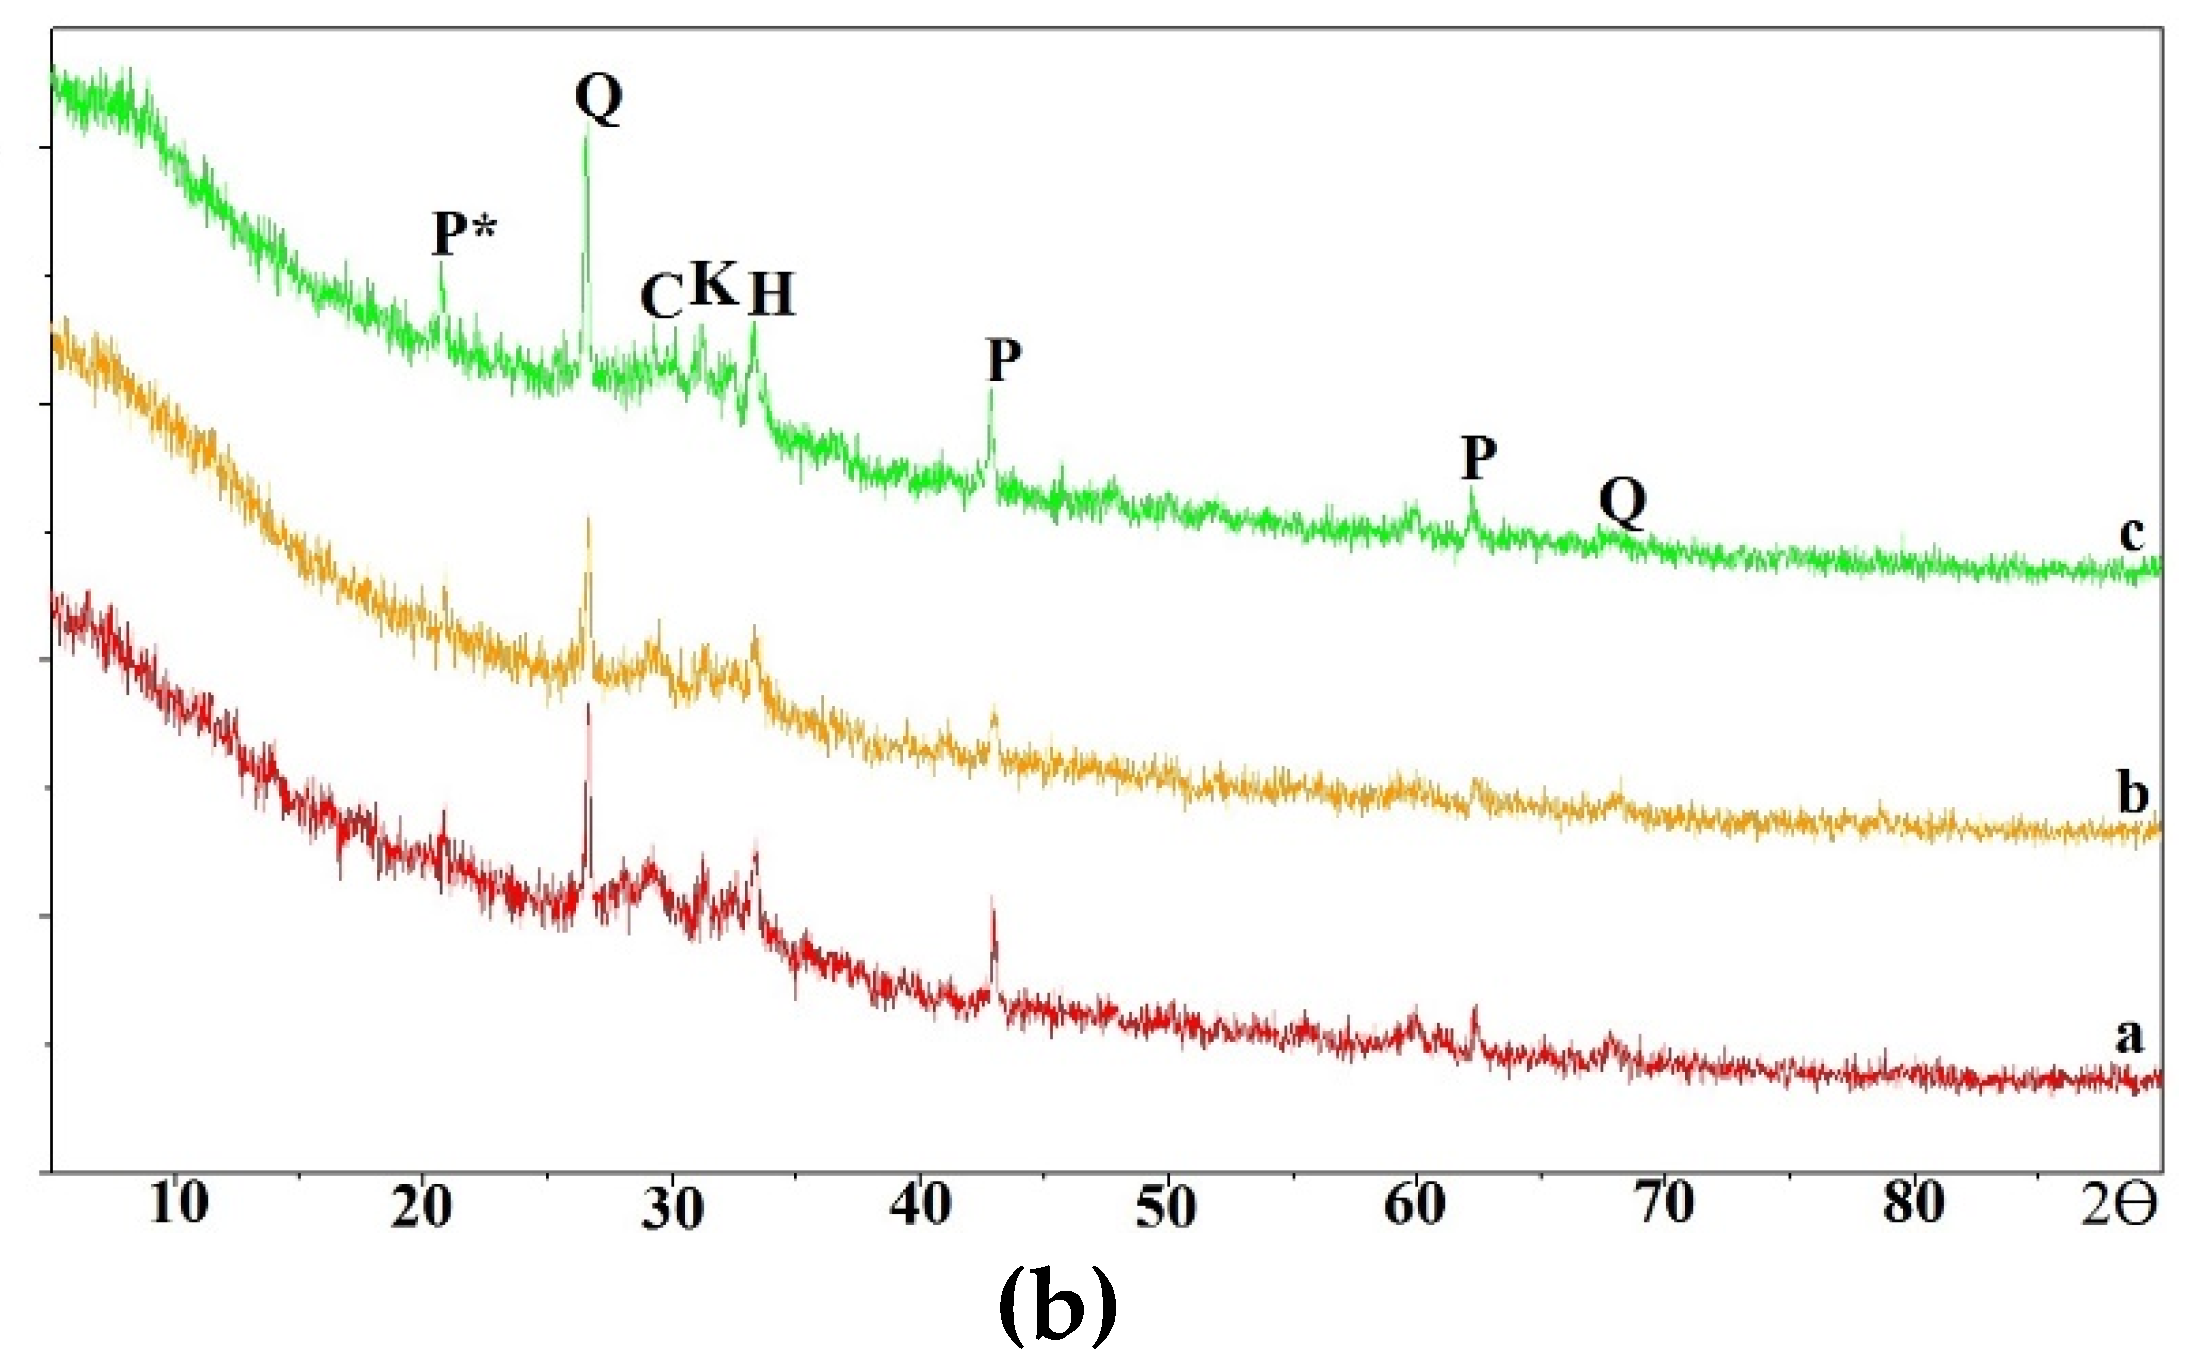

Table 1.
Characteristics of Fly ashes.
| Composition | Fly Ash (FA) Name | ||
| Oxides (%) | C21 | C29 | C37 |
| CaO | 21.2 | 28.8 | 36.9 |
| Al2O3 | 20.1 | 17.4 | 13.9 |
| SiO2 | 43.9 | 37.9 | 36.9 |
| Na2O | 2.87 | 1.85 | 1.62 |
| MgO | 4.29 | 8.00 | 4.80 |
| Fe2O3 | 4.96 | 3.67 | 3.52 |
| K2O | 0.70 | 0.39 | 0.62 |
| P2O5 | 0.51 | 0.71 | 0.70 |
| TiO2 | 1.36 | 1.17 | 0.87 |
| MnO | 0.05 | 0.04 | 0.03 |
| LOI | 0.40 | 0.82 | 0.50 |
| Si/Al ratio | 2.20 | 2.20 | 2.65 |
| Surface area (m2/Kg) | 2560 | 2921 | 3925 |
Table 2.
Mix design ratio.
| Mix design | Mixing | LA/FA | SA/FA | AC/FA | W*/FA | SS/SH |
| LA | Two-Part | 0.275 | -- | 0.105 | 0.380 | 1.000 |
| One-Part | -- | 0.105 | 0.105 | 0.380 | 1.375 | |
| HA | Two-Part | 0.301 | -- | 0.114 | 0.380 | 1.000 |
| One-Part | -- | 0.114 | 0.114 | 0.380 | 1.385 | |
| HS | Two-Part | 0.275 | -- | 0.108 | 0.400 | 2.000 |
| One-Part | -- | 0.108 | 0.108 | 0.400 | 3.143 |
LA: Liquid activator, SA: solid activator, AC/FA: Activator /Fly ash ratio; * Considering the water presented in both SS and SH solutions were considered.
Table 3.
Unit quantities of mix design Kg/m3 (lb/ft3).
| Mixing system | One Part Mixing | Two-Part Mixing | ||||
| Mix Name | LA | HA | HS | LA | HA | HS |
| Liquid SS | -- -- |
-- -- |
-- -- |
75 (4.68) |
82 (5.12) |
98 (6.12) |
| Solid SS | 33 (2.06) |
36 (2.25) |
44 (2.75) |
-- -- |
-- -- |
-- -- |
| Liquid SH | -- -- |
-- -- |
-- -- |
75 (4.68) |
82 (5.12) |
49 (3.06) |
| Solid SH | 24 (1.49) |
26 (1.62) |
14 (0.87) |
-- -- |
-- -- |
-- -- |
| Water | 207 (12.9) |
208 (13.0) |
214 (13.4) |
121 (7.55) |
113 (7.05) |
132 (8.24) |
| Sand | 1500 (93.6) |
1500 (93.6) |
1470 (91.7) |
1500 (93.6) |
1500 (93.6) |
1470 (91.7) |
| Fly ash | 545 (34.0) |
545 (34.0) |
535 (33.4) |
545 (34.0) |
545 (34.0) |
535 (33.4) |
Disclaimer/Publisher’s Note: The statements, opinions and data contained in all publications are solely those of the individual author(s) and contributor(s) and not of MDPI and/or the editor(s). MDPI and/or the editor(s) disclaim responsibility for any injury to people or property resulting from any ideas, methods, instructions or products referred to in the content. |
© 2025 by the authors. Licensee MDPI, Basel, Switzerland. This article is an open access article distributed under the terms and conditions of the Creative Commons Attribution (CC BY) license (http://creativecommons.org/licenses/by/4.0/).
Copyright: This open access article is published under a Creative Commons CC BY 4.0 license, which permit the free download, distribution, and reuse, provided that the author and preprint are cited in any reuse.


