Submitted:
22 November 2025
Posted:
24 November 2025
You are already at the latest version
Abstract
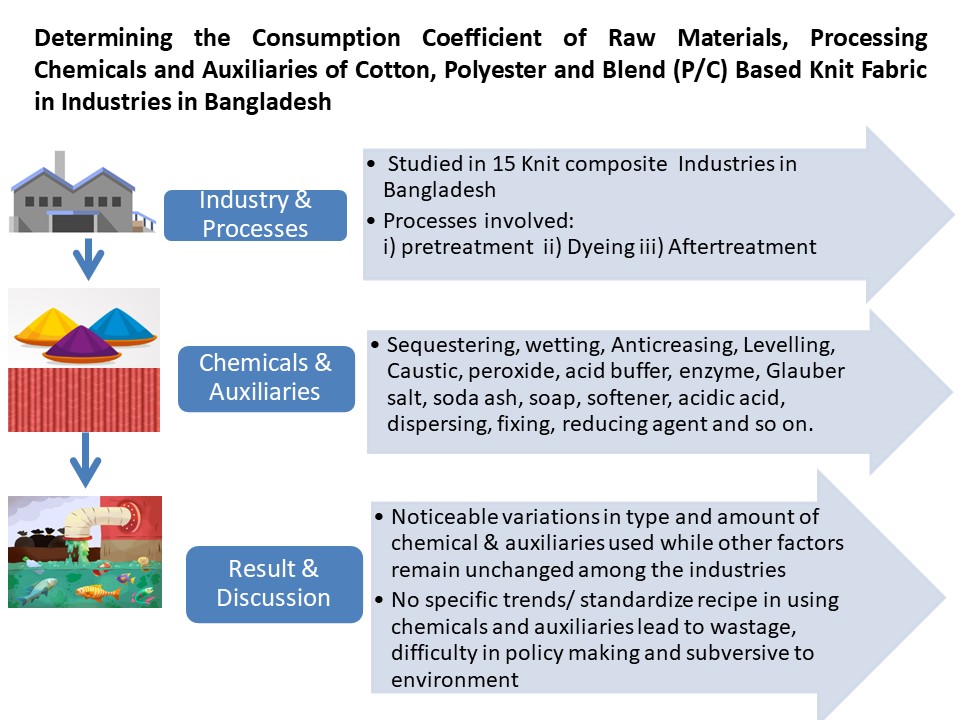
Bangladesh's textile sector, a major producer of knitwear, faces growing economic and environmental challenges due to its heavy reliance on chemicals and water. This study investigates chemical consumption during three key wet processing stages—pretreatment, dyeing, and finishing—across 15 knit factories processing cotton, polycotton, and polyester fabrics. The findings reveal significant variability in chemical usage among factories, with no consistent trends in quantity used. In some cases, the highest usage levels were several times greater than the lowest, highlighting inconsistency. These differences may be influenced by fabric type, variation in chemical types and grades, water quality, machinery condition, operational practices, buyer requirements, and the lack of standardized processes or sustainability strategies. Additionally, a persistent adherence to legacy practices and limited monitoring contribute to inefficiencies. The study underscores the pressing need for unified chemical management practices, process optimization, and transparent reporting to improve environmental outcomes. Policymakers and industry stakeholders can use these insights to promote more sustainable production practices within the textile sector. Establishing clear benchmarks for chemical use and encouraging continuous improvement efforts will be crucial in addressing the sector's environmental footprint. This research contributes to the limited body of data-driven analysis on chemical use in the knitwear industry of Bangladesh and provides actionable guidance for fostering sustainability in textile wet process.
Keywords:
chemical consumption
; knit fabric
; sustainability
; textile
; wet processing
1. Introduction
Knit dyeing, one of the major segments of textile dyeing, uses tons of dyes, chemicals, and auxiliaries per year. All the major global textile producers are facing issues with dealing with the chemicals and auxiliaries. Bangladesh, only second to China in textile production, is no exception (Islam et al., 2022; Haque et al., 2020). In one way, most of the chemicals and auxiliaries are considered hazardous. In addition, there are storage, processing, and effluent costs along with the price of the materials (Rosa et al., 2019; Roy Choudhury, 2013; Manickam and Vijay, 2021).
The global textile market size was valued at USD 1,837.27 billion in 2023 and is still growing. The cotton segment, the most popular natural fiber for textiles, accounted for over 38% of the overall revenue share in 2023. However, polyester, a synthetic fiber that is cheaper than cotton, has experienced significant growth over the years. The growing global polyester fiber market was valued at approximately $81.1 billion in 2022. A blend of polyester and cotton, aka polycotton or PC, is also getting popular (Grand View Research, 2025; Aizenshtein, 2017).
Bangladesh has nearly 4500 textile industries, out of which 2500 are knit-based (Textile Today, 2018). There are several factors that are to be considered while dyeing knit fabric, such as fiber type, fabric construction, machinery available, process, quality of water, dyes, chemicals, and auxiliaries (Singha et al., 2021; Uddin, 2021; Valko, 1972). Different factories appear to use different types, quantities, and concentrations of chemicals and auxiliaries (Ji et al., 2024). Dyes, chemicals, and auxiliaries are going through continuous research and development to improve the quality, efficacy, and minimize cost (Ortikmirzaevich, 2017). Factories source these from different vendors and adjust their recipe based on the technical instructions. Locality is another issue (Chowdhury and Pandit, 2022). For instance, areas prone to hard water need more sequestering agents and so on. However, there is a risk of overuse of chemicals and auxiliaries due to a lack of proper technical knowledge, supervision, and R&D, and indifference to changing the prolonged practice (IntechOpen, 2025). This would waste a lot of chemicals and cost a million (Ortikmirzaevich, 2017; Chowdhury and Pandit, 2022; IntechOpen, 2025).
Another issue is environmental concern. The use of synthetic dyes hurts all life forms. Despite a constant quest for efficient and commercially feasible new approaches to manage textile waste, until now, no efficient method has been found to remove both the color and the toxic properties of the dyes released into the environment (Straits Research, 2025; The Financial Express, 2025).
Although the textile industry in Bangladesh employs over 4.4 million people and accounts for 81.82% of the country's exports, its environmental impact is still a major worry (WFX Fashion & Apparel Blog, 2025; Fact. MR, 2025). Groundwater depletion and contamination of water bodies are hampering the ecology and human life alike (Islam et al., 2022; The Financial Express, 2025). Considering all these issues, there should be a comprehensive and comparative analysis of the usage of chemicals and auxiliaries in different areas in Bangladesh. This would help different industries to adjust their recipe to reduce unnecessary chemical use; hence, decrease the negative impact on the environment.
This study aims to assess the consumption coefficient, i.e., the amount of chemicals and auxiliaries used during cotton, polyester, and polycotton knit fabric pretreatment, dyeing, and finishing. It employs a comparative analysis of chemical usage data collected from multiple textile companies in Bangladesh. The data is sourced from production records and measured in kilograms per 100 kg of fabric for various chemicals, including wetting agents, softeners, enzyme treatments, soda ash, acid buffers, and so on. The research utilizes graphical representations to compare the chemical consumption patterns across companies. The study examines trends, peaks, and fluctuations in usage to determine potential inefficiencies and best practices. The findings are expected to aid in optimizing chemical applications in textile processing while minimizing environmental and economic costs.
2. Research Methodology
1.1. Study Setting
Data was collected from 15 knit composite industries clustered in Dhaka, Gazipur, Tangail, and Narayanganj, Bangladesh. Participating factories are provided with code names such as A, B, C, D, E, F, G, H, I, J, K, L, M, N, O to maintain confidentiality. Table 1 shows the location of the factories that participated in this study, along with the types of fiber they treat. Figure 1 shows the map of the location of the factories.
1.2. Data Collection
A group of three data collectors visited every production site. Each group observed at least one production cycle for each fiber type to delve into the entire coloration process, i.e., pretreatment, dyeing, finishing, and recorded the types and quantity of chemicals used. In conjunction, a structured questionnaire was provided to the manager and production officers of each of the facilities, as Table 2. Their feedback was noted by the data collection team. Also, a good number of industries volunteered to provide their standard process records and chemical lists to the data collectors. The data collection teams cross-check and verify each piece of information.
- Production metrics: Fiber composition (Cotton, Polyester, Polyester-Cotton blends)
- Chemical use: Kilograms to treat per 100 kg of fabric, categorized by process stage
- M: L ratios: Expressed as times, interpreted as liquid-to-material ratios (e.g., 1:6)
1.3. Sampling
Random sampling was adopted to recruit factories. The emphasis was on reputable and export-oriented ones. Despite reaching over 23 factories, only 15 of these agreed to volunteer. The data collectors are mostly senior year textile engineering students of undergraduate who have sufficient relevant knowledge and are trained to run the study.
3. Result and Discussion
Results
Sequestering Agent
There are considerable differences in how sequestering agents are used to treat cotton fabric by different factories (Figure 2). C and I had the highest and second to highest utilization, surpassing 2.7 and 2.4 kg respectively. H comes next with just over 1 kg, and A stays at a comparable level. B, D, E and G, on the other hand, have noticeably lower consumption levels.
In case of polycotton (PC) fabric, I used the highest, which is nearly 3.6 kg (Figure 3). Conversely, F used the lowest, nearly 0.6 kg; only one sixth of that of I. C and L consume moderate amount i.e. approximately 1.25 kg and 1 kg consecutively.
Wetting Agent
The use of wetting agents varies greatly among the factories. With 2.734 kg per 100 kg of cloth, Company A uses the most. The amount of wetting agent used by various firms, per 100 kg of cotton fabric, is shown in Figure 4. The consumption range of B, J and H are from 0.365 kg to 0.422 kg. I uses the least amount—just 0.12 kg. Again, only 5 out of 15 factories seem to use wetting agent to treat cotton. Furthermore, only 1 out of 8 factories; I, uses wetting agents to treat PCs as shown in Table 3. The amount is 0.36 kg.
Anticreasing Agent
Figure 5 depicts the amount of anti-creasing agent used per 100 kg of cotton fabric by various companies. The anti-creasing agent had been used in the range of 0.027kg to 2.6 kg. H uses the most, 2.6 kg. A uses the least, 0.27 kg. Most of the companies use an amount of 1.5 kg or less. Figure 6 illustrates the amount of anti-creasing agent used per 100 kg of polycotton fabric by different companies. I use the most, 4.8 kg. L uses the least, 0.55 kg. Most of the companies use an amount of 1.8 kg or less.
Leveling Agent
Figure 7 presents the amount of leveling agent used per 100 kg of cotton fabric by different companies. F uses the highest amount, which is 2.8 kg, followed by I (1.8 kg). D applies 1.212 kg. G consumes the least, which is 0.5 kg. Most of the companies use an amount of around or less than 1 kg. Figure 8 represents the amount of leveling agent used per 100 kg of PC fabric by different companies. I use the highest amount, which is 3.2 kg. G consumes the least, which is 0.5 kg. Most of the companies use an amount of around or less than 1 kg. Figure 9 depicts the amount of leveling agent used per 100 kg of polyester fabric by different companies. C uses the highest amount, which is 2.76 kg. G consumes the least, which is 0.5 kg. Most of the companies use an amount of around or less than 1 kg.
Caustic Soda
Figure 10 shows the amount of caustic soda used per 100 kg of cotton fabric by various companies. H uses the highest, which is 3.9 kg to treat per 100 kg of fabric. Conversely, F uses the least amount, which is 0.36 kg. The majority of the companies who participated in that survey use caustic soda in the range of around 1 kg to treat 100 kg of fabric.
Figure 11 shows the amount of caustic soda used per 100 kg of polycotton fabric by various companies. K uses the highest, which is 2.7 kg; whereas, C uses the least amount which is 0.147 kg.
Figure 12 shows the amount of caustic soda used per 100 kg of polyester fabric by various companies. C uses the highest, which is 3.33 kg; whereas, O uses the least amount which is 0.7 kg.
H2O2
Figure 13 displays the consumption of hydrogen peroxide (H₂O₂) per 100 kg of fabric by different companies. H has the highest usage at 5.72 kg, followed by C with 4.8 kg. D, F, G, and K have moderate usage between 2 and 2.4 kg. E and I use slightly less, around 1.75 to 1.8 units. B, A, and G have the lowest consumption, ranging from 1 to 1.225 kg.
Figure 14 displays the consumption of hydrogen peroxide (H₂O₂) per 100 kg of PC fabric by different companies. N has the highest usage at 4.2 kg, followed by I with 2.4 kg. C has the lowest consumption, which is 0.147 kg.
Acid Buffer
A bar chart of the consumption of acid buffers across different companies is shown in Figure 15. J uses the highest amount of acid buffer, which is 2.86 kg, while B uses the lowest amount, which is 0.67 kg only. Noticeably, the J uses over 4 times of acid buffer compared to that of B. Most of the companies use an amount of around or less than 1 kg.
A bar chart of the consumption of acid buffers to treat polycotton across different companies is shown in Figure 16. C uses the highest amount of acid buffer, which is 3.22 kg; while G uses the lowest amount, which is 0.7 kg only.
A bar chart of the consumption of acid buffer to treat polyester fabric across different companies is shown in Figure 17. C uses the highest amount of acid buffer, which is 2.2 kg, while O uses the lowest amount, which is 0.7 kg only.
Enzyme
The Figure 18 depicts enzyme usage across nine companies to treat cotton, measured as the amount of chemical per 100 kg of fabric. C uses the highest amount, 1.82 kg, while E uses the lowest, only 0.089 kg. Other companies show relatively lower and fluctuating usage. The total enzyme consumption had been in the range of 0.11225kg to 1.82kg per 100 kg of fabric. However, except for C and K, all other facilities use enzymes in amounts of less than 0.4 kg.
Figure 19 depicts enzyme usage across four companies to treat PC fabric. I use the highest amount, 0.66 kg, while F uses the lowest, only 0.15 kg.
Glauber Salt
The amount of Glauber salt used per 100 kg of cotton fabric across various companies is shown in Figure 20. With almost 80 kg used, H is the top in the list, followed by C and D, 48 kg and over 42 kg, respectively. All other facilities use amounts less than 20 kg.
Figure 21 shows the amount of Glauber salt used per 100 kg of PC fabric across various companies. With almost 39 kg used, F is the top in the list, and the lowest is for C; only 11.14 kg.
Soda Ash
Figure 22 illustrates how much soda ash is used by different companies to treat every 100 kg of cotton fabric. The amount of soda ash needed per 100 kg of fabric ranges from 0.42 kg to 17.09 kg. D has the highest usage, over 17 kg, whereas E has the lowest, 0.42 kg, which depicts an astonishing variation.
Figure 23 illustrates how much soda ash is used by different companies to treat every 100 kg of PC fabric. N has the highest usage, 12.6 kg, whereas C has the lowest, 0.326 kg, which depicts a surprising variation.
Soaping Agent
The graph in Figure 24 shows how much soaping agent is used per 100 kg of cotton fabric by different facilities. H has the highest usage, which is 2.6 kg, whereas B has the lowest, 0.15 kg, which varies greatly.
The graph in Figure 25 shows how much soaping agent is used per 100 kg of PC fabric by different facilities. K has the highest usage, which is 2.4 kg, whereas G has the lowest, 0.5 kg.
The graph in Figure 26 shows how much soaping agent is used per 100 kg of polyester fabric by two of the facilities. M uses 0.9 kg, whereas O has the lowest, 0.14 kg.
Softener
Figure 27 shows how much softener is used by various companies to treat 100 kg of cotton fabric. B uses the least amount of softener—only 0.125 kg—while G uses the most, 5 kg. J uses just over 1 kilogram, which puts it in the middle.
Figure 28 shows how much softener is used by various companies to treat 100 kg of PC fabric. G uses the least amount of softener—only 5 kg—while C uses the most, 0.41 kg.
Table 4 shows the amount of softener used to treat polyester. Only one factory, G, among the participants seems to use a softener. The amount is 6 kg.
Acetic Acid
Figure 29 shows how much acetic acid is used by various companies to treat 100 kg of cotton fabric. B uses the least amount of acetic acid—only .67 kg—while C uses the most, 2.1 kg.
Figure 30 shows how much acetic acid is used by various companies to treat 100 kg of PC fabric. I use the least amount of acetic acid—only 2.46 kg—while F uses the most, 0.32 kg.
Figure 31 shows how much acetic acid is used by two companies to treat 100 kg of polyester fabric. C uses 1.1 kg, while M uses 0.55 kg.
Dispersing Agent
Figure 32 shows how much dispersing agent is used by various companies to treat 100 kg of PC fabric. I use the most, 1.6 kg, while N uses the least, 0.35 kg.
Reducing Agent
Figure 33 shows the amount of reducing agent used by various companies to treat 100 kg of PC fabric. N uses the most, 1.5 kg, while L uses the least, 0.35 kg.
Figure 34 shows the amount of reducing agent used by two companies to treat 100 kg of polyester fabric. G uses the most, 1.5 kg, while O uses the least, 1.4 kg.
Fixing Agent
Others
Discussion
The study provides a thorough examination of chemical consumption trends in the knit manufacturing industries, with a particular emphasis on the pretreatment, dyeing, and finishing procedures adopted by 15 factories located in Gazipur, Tangail, Dhaka, and Narayanganj, Bangladesh who produce and dye knit fabrics made of cotton, polyester, and polycotton blends.
The results show notable differences in chemical and auxiliary usage among the factories, which may be impacted by various elements such as fabric types, variation in chemical types, processing techniques, water quality, and each facility's unique operational procedures. These variances make the need to standardize procedures, optimize processes, and embolden sustainability activities evident to decrease chemical and cost wastage, and lessen the impact on the environment.
For instance, sequestering agents, which are crucial for avoiding metal ions interfering in the dyeing process, show stark variations in the amount being used among factories. For cotton, C and I use much more sequestering chemicals than others. Industries like B, D, E, and G, on the other hand, utilize far smaller amounts, indicating more effective procedures or other approaches to get the same outcomes. Notably, C and I use sequestering agents during various operations, such as pretreatment (scouring and bleaching), dyeing, and soaping, which is not the case for other industries. Others use it mainly during the pretreatment process, except A, which uses it during leveling along with pretreatment. Moreover, the commercial names of sequestering agents vary from one company to another. That means the chemicals may differ in types, chemical composition, concentration, and efficacy. Furthermore, differences in chemical application may be impacted by processing methods, fabric types, and sustainability policies. For PC, while I retain the same status as with cotton but C consumes a moderate amount. In that case, it is important to delve into local water conditions and adjust chemical usage appropriately. For instance, areas with hard water may require more sequestering agents, while regions with softer water could reduce their dependence on these chemicals.
Another example can be wetting agents. There is significant diversity in the use of wetting agents, as only five of the fifteen companies use them. The fact that most people steer clear of wetting agents begs further inquiry. This variance points to different manufacturing strategies; certain companies may either use other chemicals and auxiliaries that offer the required wetting property, or their adopted techniques or machineries do not require wetting agents, or they are technically unaware, while others may rely on them for best outcomes. Noticeably, the commercial name of wetting agents varies from one company to another. Naturally, it is very likely that various producers may use different chemicals as wetting agents, which vary in price, efficacy, concentration, and amount to use. We noticed a similar trend for nearly all of the chemicals, including leveling agents, soda ash, Glauber salt, acid buffer, and soaping agent. One interesting fact is that nearly all of the industries seem to use Glauber salt instead of common salt.
The broad range of enzyme use emphasizes how standardizing enzyme application procedures can save money and have positive environmental effects. Enzymes are used in procedures like biopolishing and desizing, and using them excessively raises expenses and pollutes the environment.
Companies also differ greatly in the usage of acetic acid, H2O2, caustic soda, and soda ash. All of these chemicals have multipurpose uses in textile processing. However, the noticeable variation in the amounts is intriguing, and we need to look into whether it is happening due to the variance in concentration and grade of chemicals, differences in technical procedure, or whether the industries are wasting their resources. One interesting observation is that E claimed to use “Benlon 3151”, an alternative to soda ash, which may be the reason behind using such a low quantity compared to contemporaries.
The significance of softeners and anti-creasing compounds in fabric pretreatment and finishing is also emphasized by the study. While companies with reduced utilization might concentrate on sustainability and cost-cutting, companies with higher usage might place more importance on fabric softness and wrinkle resistance. Customer requirements may be another factor in the usage, especially for softening operations.
Some of the chemicals were only required while treating either polyester or polycotton blends, such as dispersing agent, reducing agent, and fixing agent. These chemicals also showed variation in usage among the industries. Several factors, such as fabric compositions, processing needs, prolonged practices, chemical grade, and operating methods, may be the root cause of it and need further investigation.
Some of the chemicals, such as stabilizers, emulsifiers, citric acid, antifoaming agent, peroxide killer, biopolish, reduction inhibitor, and peroxide killers, are used by only one factory, which is mentioned as specialty chemicals in this study. These chemicals also highlight variation in use. Differences in fabric composition, processing needs, and operating methods are reflected in these variables. Also, the variation of other chemicals may be influenced by the use of these chemicals. The usage of these specialty chemicals further demonstrates the intricacy of textile processing and the requirement for customized chemical applications.
4. Conclusion
The amount of chemicals and auxiliaries needed to pretreat, dye and finish cotton, polyester and polycotton knit fabric in 15 reputable, export-oriented factories in Dhaka, Gazipur, Tangail and Narayanganj area in Bangladesh were investigated. 11 of the sites are found to do cotton dyeing, 8 of these do polycotton blend dyeing and 5 of the sites do polyester dyeing. The chemical usages were represented in kg per 100 kg of fabric by each of the factories. Some of the chemicals were commonly used by all the participants. Some are only fiber-specific. Some chemicals are used by only one factory.
Noticeable variances were found among the factories in the chemical usage. This trend was the same among all three fabric types. The difference between the highest and lowest users of a particular chemical is too big, sometimes manifold. Also, there was no fixed trend among the industries, i.e., if any factory uses the highest or lowest amount of all the chemicals. The cause of the variation may be attributed to fabric type, variation in chemical types and grades, processing techniques, water quality, type and condition of the machinery used, each facility's unique operational procedures, indifference to change, prolonged practice, and absence of a continuous improvement plan, and may be due to buyers’ requirements. Location may be another issue. An area that has high hardness of water needs more sequestering agents. However, we didn’t find any locality-dependent trend in our study. Another thing to look at is the sourcing and storing policy of chemicals, as the efficacy of chemicals declines over time. However, this is outside of the scope of our study.
The study makes it evident that factories need to have standard operating procedures in R&D, production, storage, and logistics that need to be updated on a regular basis. Also, they should go through continuous improvement to minimize chemical wastage and save costs. Moreover, there should be an effective and up-to-date sustainability policy to lessen the impact on the environment caused by the overuse of chemicals and auxiliaries.
Funding Sources: This work was self-funded/ didn’t get any external fund.
Declaration of competing interests: Authors have declared “no conflict of interest”.
Acknowledgments
We acknowledge the hard work, enthusiasm, and promptness of all the surveyors who participated in this study. Moreover, we express our sincere gratitude to the textile industries that helped and accommodated our surveyors and provided all the confidential data for this work. Furthermore, thanks to the Bangladesh University of Textiles (BUTEX) for allowing us to carry on the study.
References
- Islam, Md.T. , Haque, F., Mahmud, K., Sultana, A., 2022. Sustainable Textile Industry: An Overview. Non-Metallic Materials Science. 4(2), 15–32. [CrossRef]
- Haque, F. , Khandaker, Md.M.R., Chakraborty, R., Khan, M.S., 2020. Identifying Practices and Prospects of Chemical Safety and Security in the Bangladesh Textiles Sector. Journal of Chemical Education. 97(7), 1747–1755. [CrossRef]
- Rosa, J.M. , Garcia, V.S.G., Boiani, N.F., Melo, C.G., Pereira, M.C.C., Borrely, S.I., 2019. Toxicity and environmental impacts approached in the dyeing of polyamide, polyester and cotton knits. Journal of Environmental Chemical Engineering. 7(2), 102973. [CrossRef]
- Roy Choudhury, A.K. , 2013. Green chemistry and the textile industry. Textile Progress. 45(1), 3–143. [CrossRef]
- Manickam, P. , Vijay, D., 2021. Chemical hazards in textiles. In: Chemical Management in Textiles and Fashion. Elsevier, pp. 19–52. [CrossRef]
- Grand View Research, 2025. Textile Market Size, Share & Growth Analysis Report, 2030. https://www.grandviewresearch.com/industry-analysis/textile-market (accessed ). 2 April.
- Aizenshtein, E.M. , 2017. Polyester Fibres: Today and Tomorrow. Fibre Chemistry. 49(4), 288–293. [CrossRef]
- Textile Today, 2018. Knit sector gains a great momentum in 2018. https://textiletoday.com.bd/knit-sector-gains-a-great-momentum-in-2018 (accessed ). 2 April.
- Singha, K. , Pandit, P., Maity, S., Sharma, S.R., 2021. Chapter 11 - Harmful environmental effects for textile chemical dyeing practice. In: Ibrahim, N., Hussain, C.M. (Eds.), Green Chemistry for Sustainable Textiles. Woodhead Publishing, pp. 153–164. [CrossRef]
- Uddin, F. , 2021. Environmental hazard in textile dyeing wastewater from local textile industry. Cellulose. 28(17), 10715–10739. [CrossRef]
- Valko, E.I. , 1972. Textile Auxiliaries in Dyeing. Review of Progress in Coloration and Related Topics. 3(1), 50–62. [CrossRef]
- Ji, Y. , Zhang, L., Kim, H., Wu, X., Qiu, Y., Liu, Y., 2024. Research Progress and Development Trend of Textile Auxiliaries. Fibers and Polymers. 25(5), 1569–1601. [CrossRef]
- Ortikmirzaevich, T.B. , 2017. Improving logistics as main factor in textile capacity usage. Zbornik Radova Departmana za Geografiju, Turizam i Hotelijerstvo. 46(2), 44–52.
- Chowdhury, M.A. , Pandit, P., 2022. Chemical processing of knitted fabrics. In: Advanced Knitting Technology. Elsevier, pp. 503–536. [CrossRef]
- IntechOpen, 2025. Textile Dyeing Wastewater Treatment. https://www.intechopen.com/chapters/22395 (accessed ). 2 April.
- Straits Research, 2025. Textile Dyes Market Size, Share | Growth Report 2033. https://straitsresearch.com/report/textile-dyes-market (accessed ). 2 April.
- The Financial Express, 2025. Women account for 55pc of garment workers. https://today.thefinancialexpress.com.bd/trade-market/women-account-for-55pc-of-garment-workers-1719244417 (accessed ). 3 April.
- WFX Fashion & Apparel Blog, 2025. 10 Stats on Bangladesh’s Growing Textile and Garment Industry. https://www.worldfashionexchange.com/blog/rise-of-bangladesh-textile-and-garment-industry/ (accessed ). 3 April.
- Fact.MR, 2025. Knitted Fabrics Market Trends, Demand & Growth Report 2023. https://www.factmr.com/report/2865/knitted-fabrics-market (accessed ). 2 April.
Figure 1.
Location Map of Participating Factory Sites [Source: https://www.google.com/maps].
Figure 1.
Location Map of Participating Factory Sites [Source: https://www.google.com/maps].
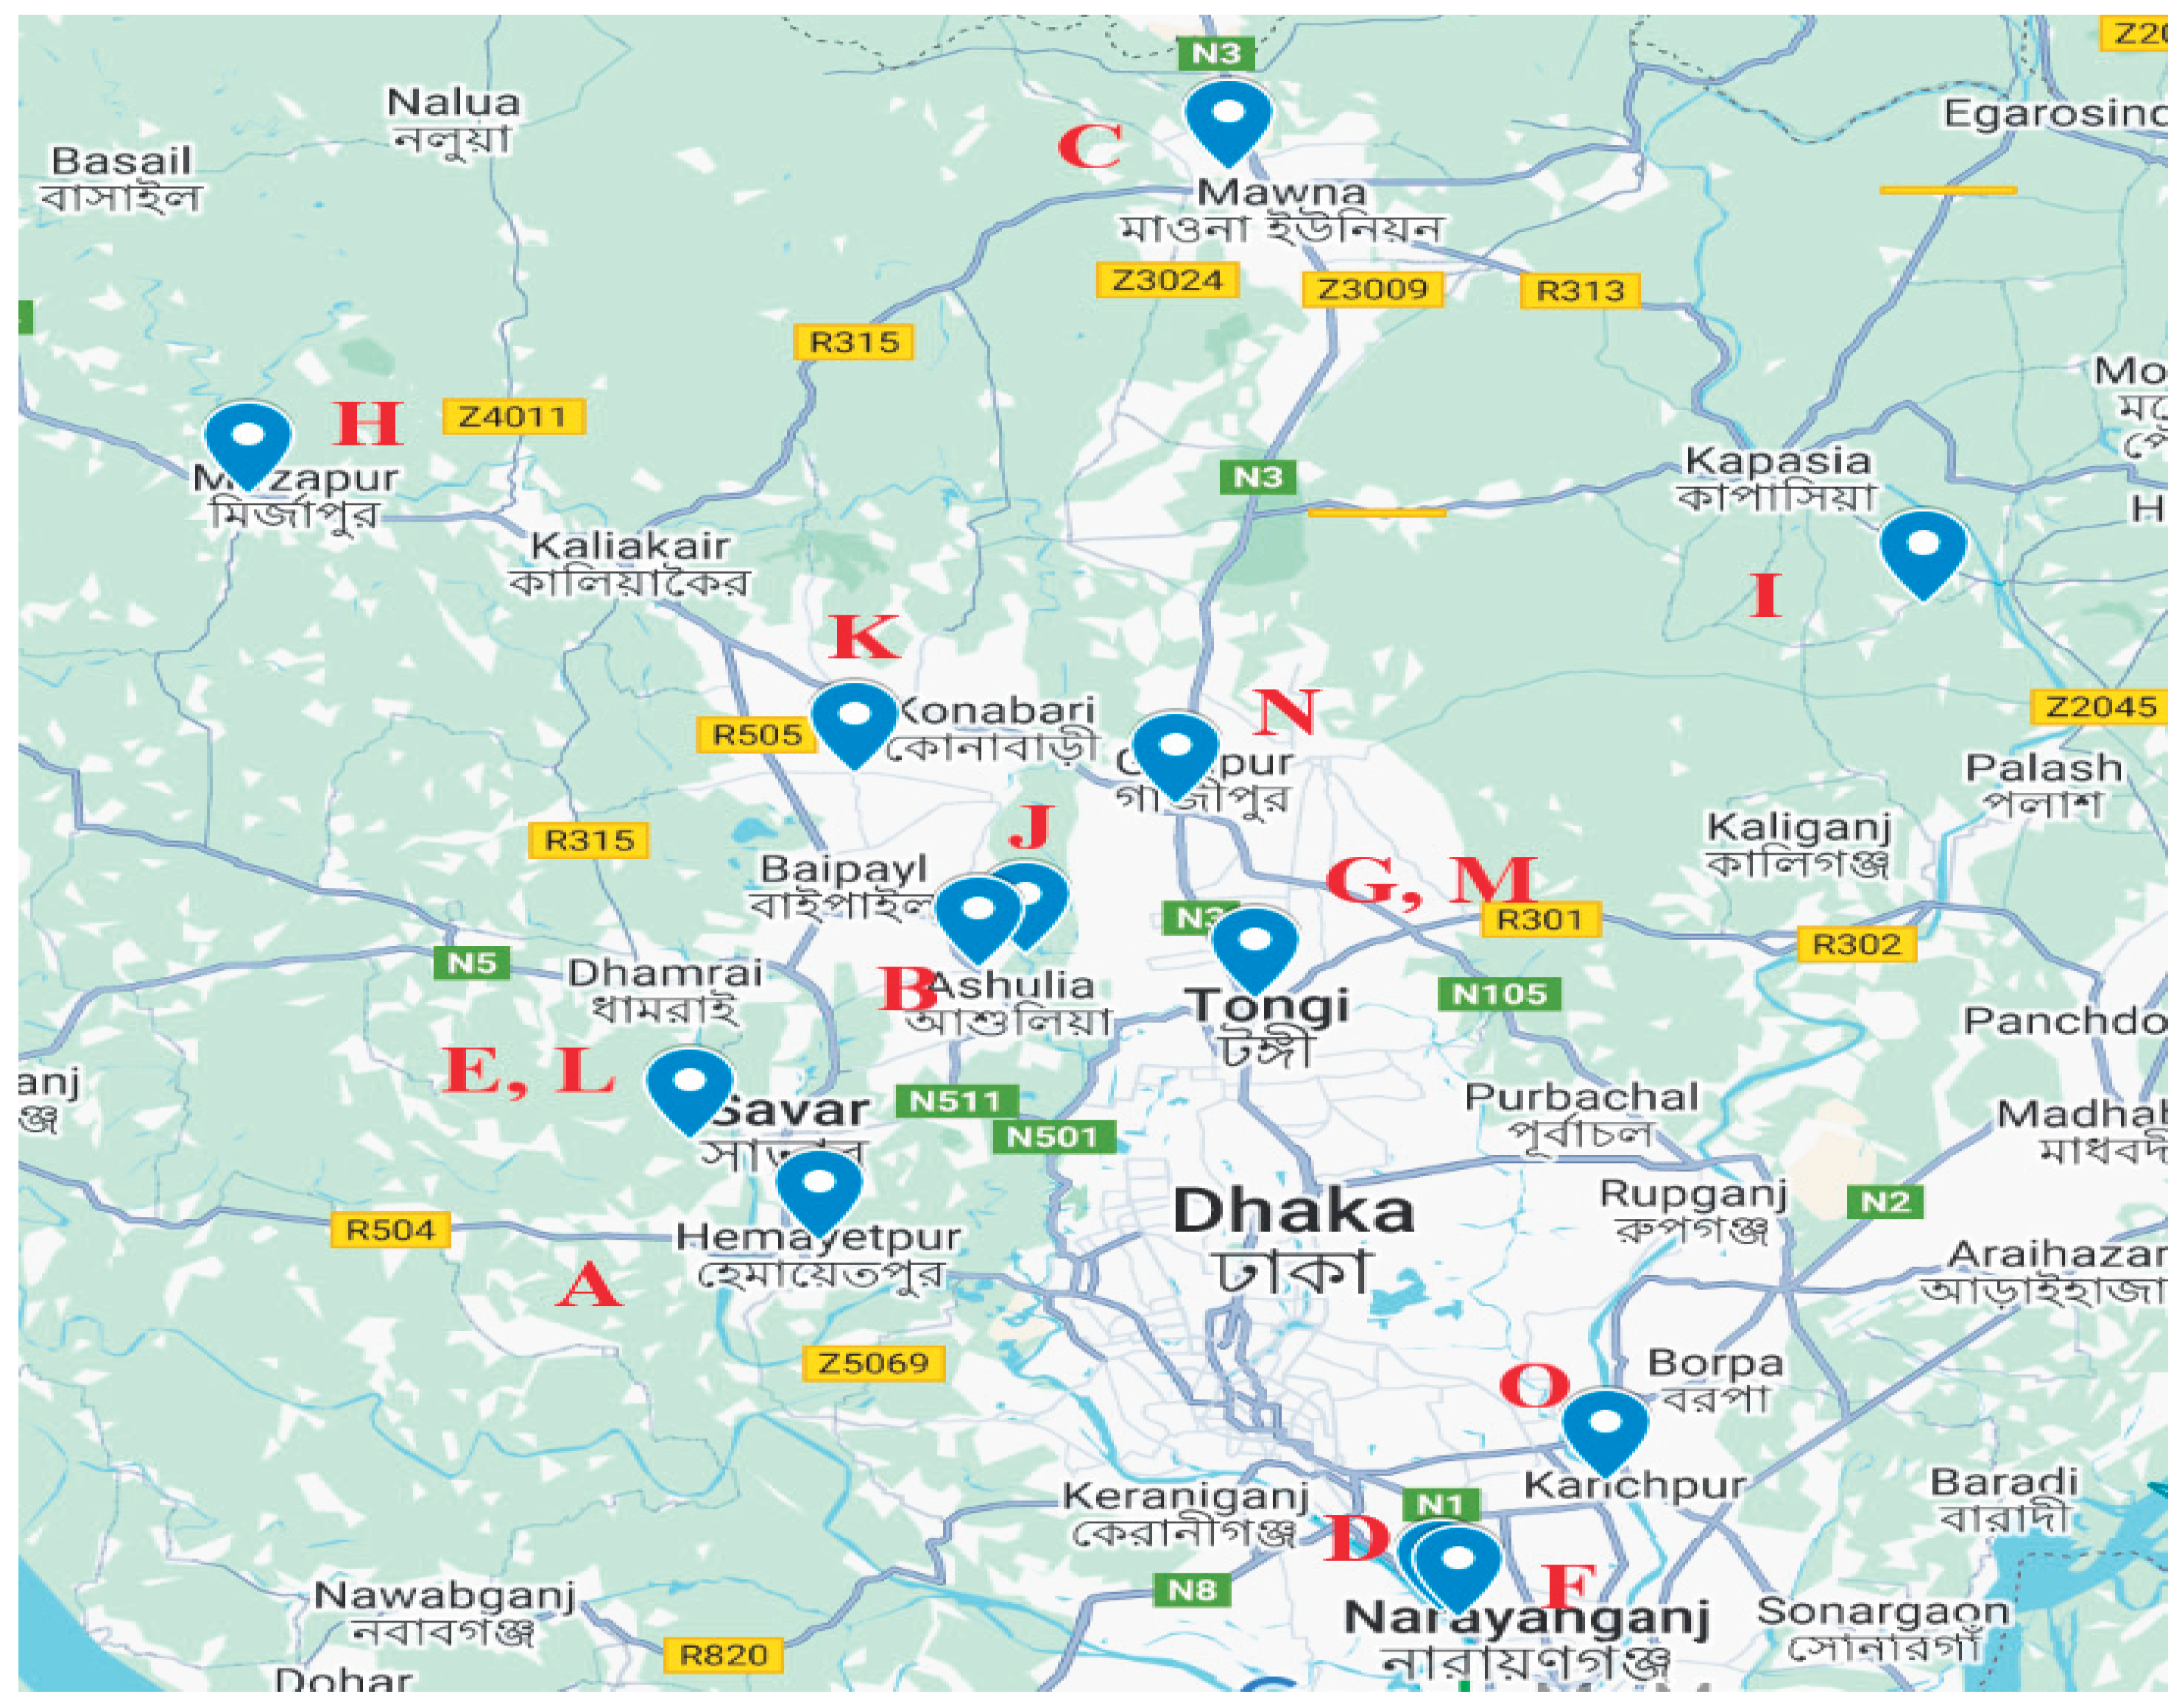
Figure 2.
The Amount of Sequestering Agent in kg is used per 100 kg of cotton fabrics by different companies.
Figure 2.
The Amount of Sequestering Agent in kg is used per 100 kg of cotton fabrics by different companies.
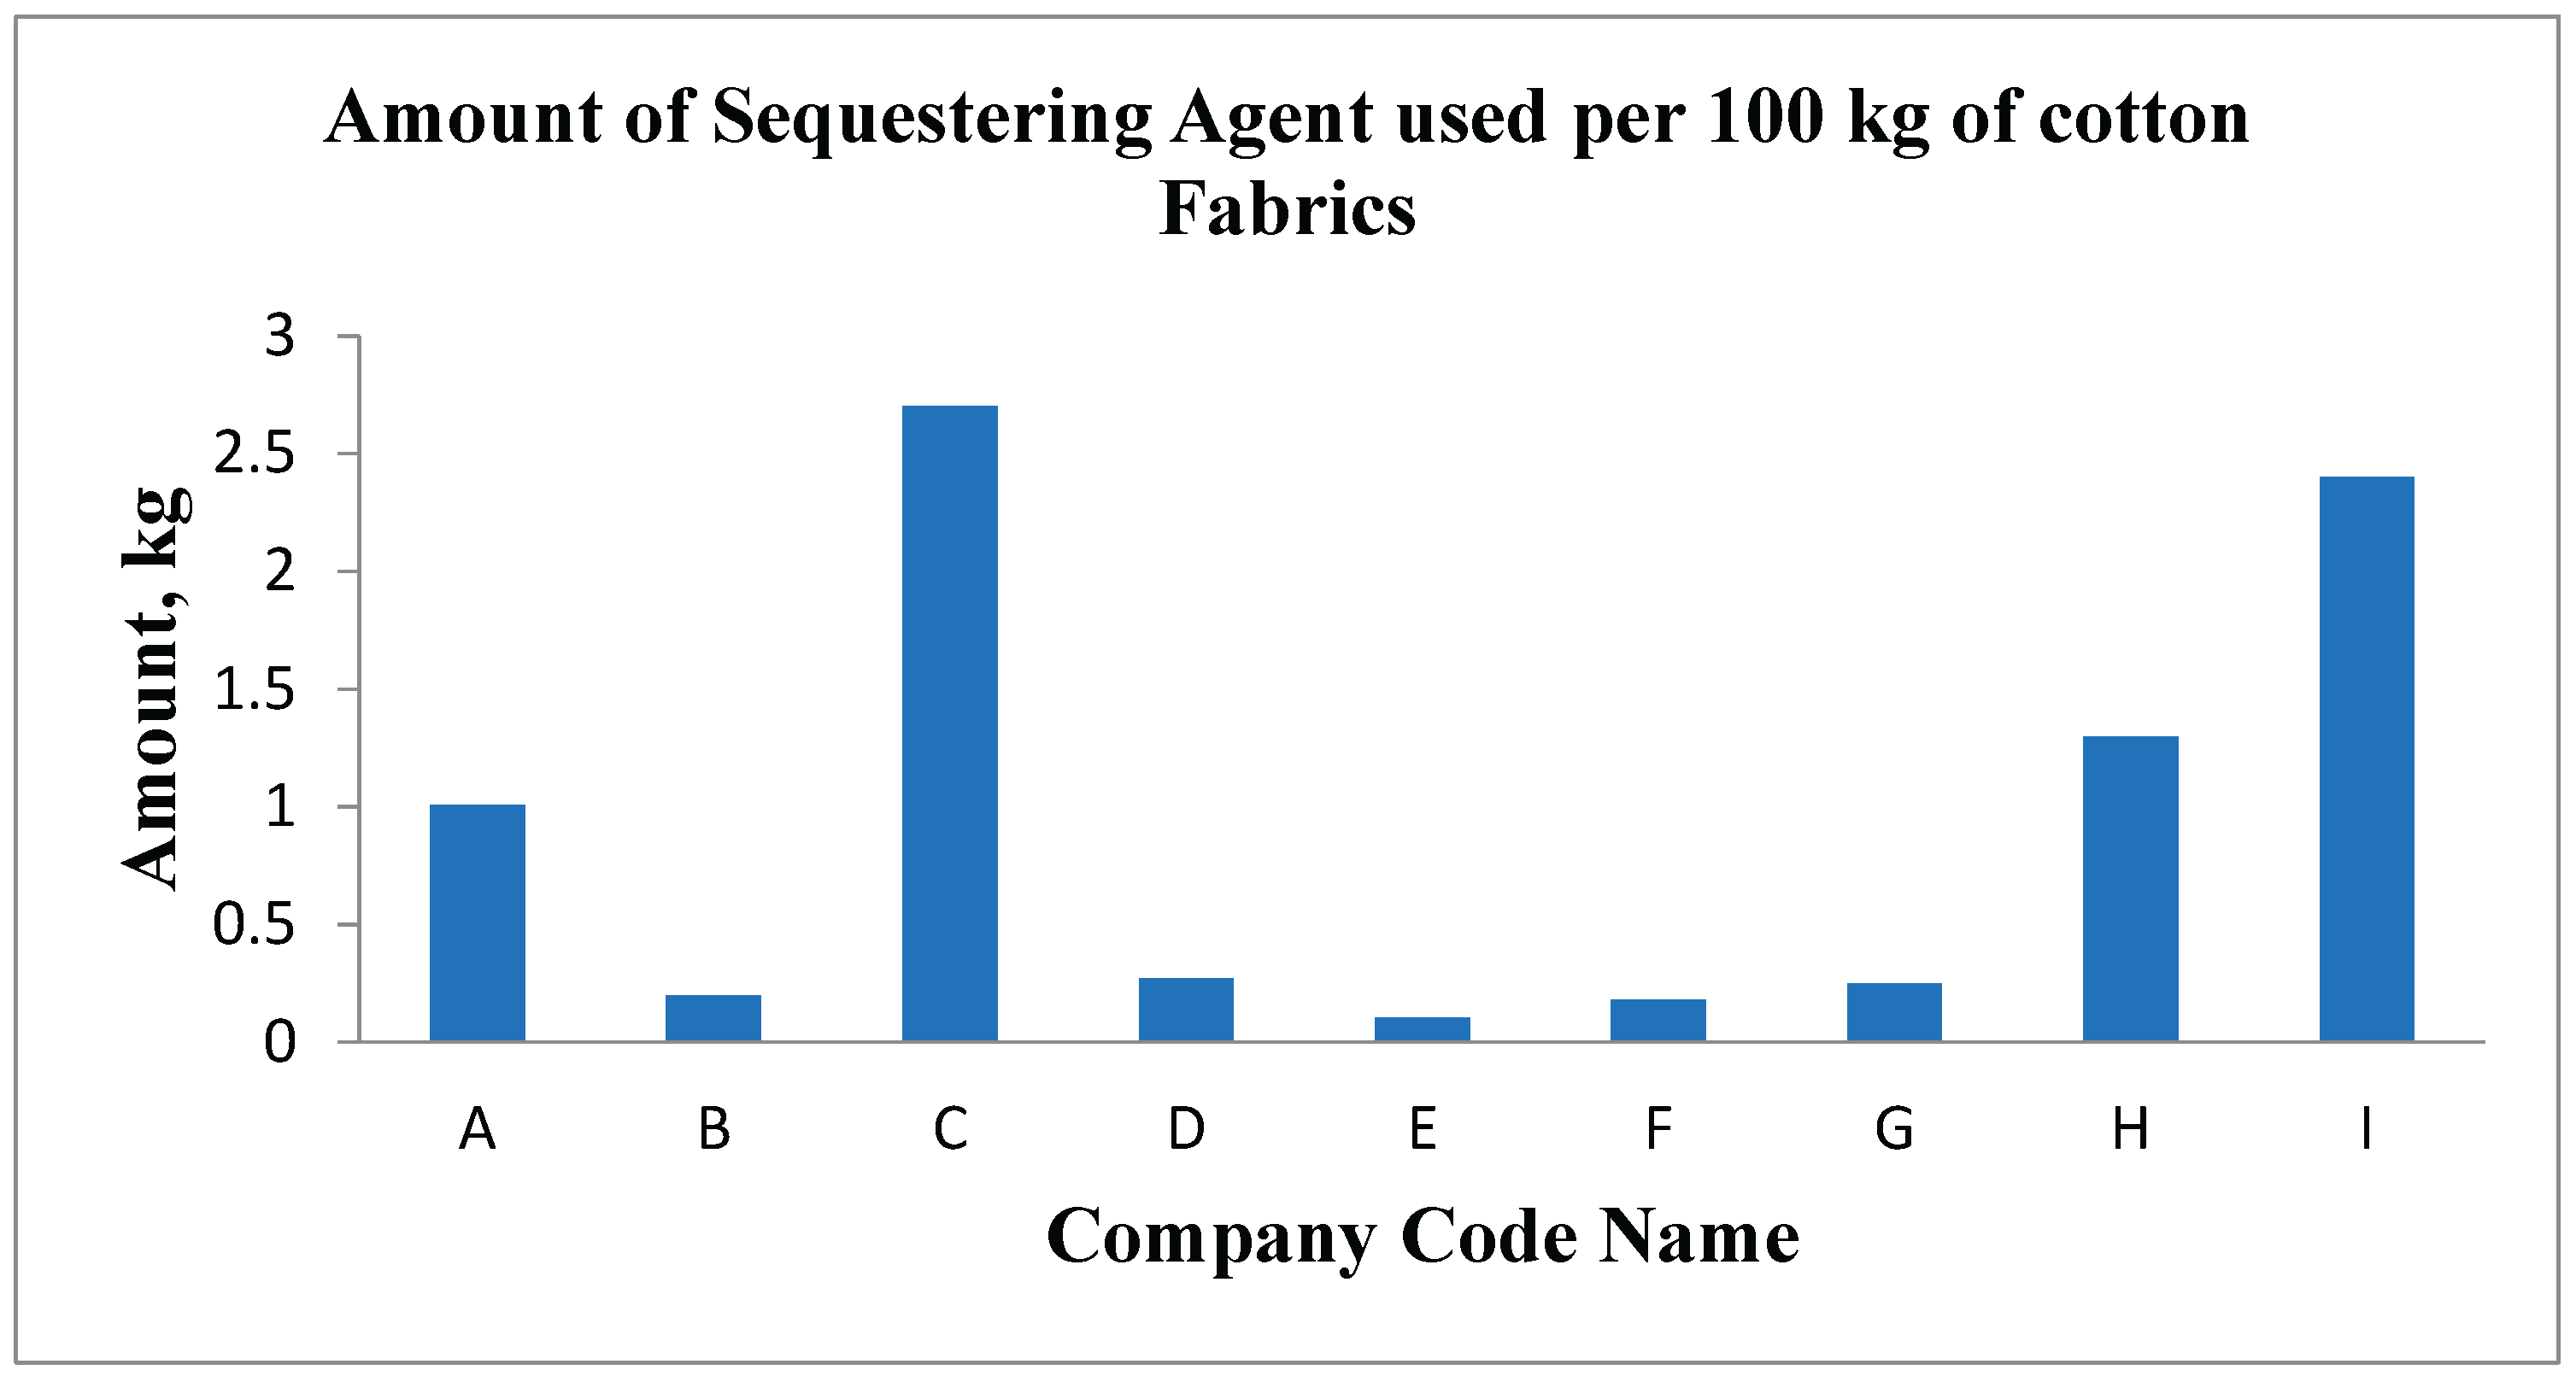
Figure 3.
The Amount of sequestering agent in kg is used per 100 kg of polycotton fabrics by different companies.
Figure 3.
The Amount of sequestering agent in kg is used per 100 kg of polycotton fabrics by different companies.
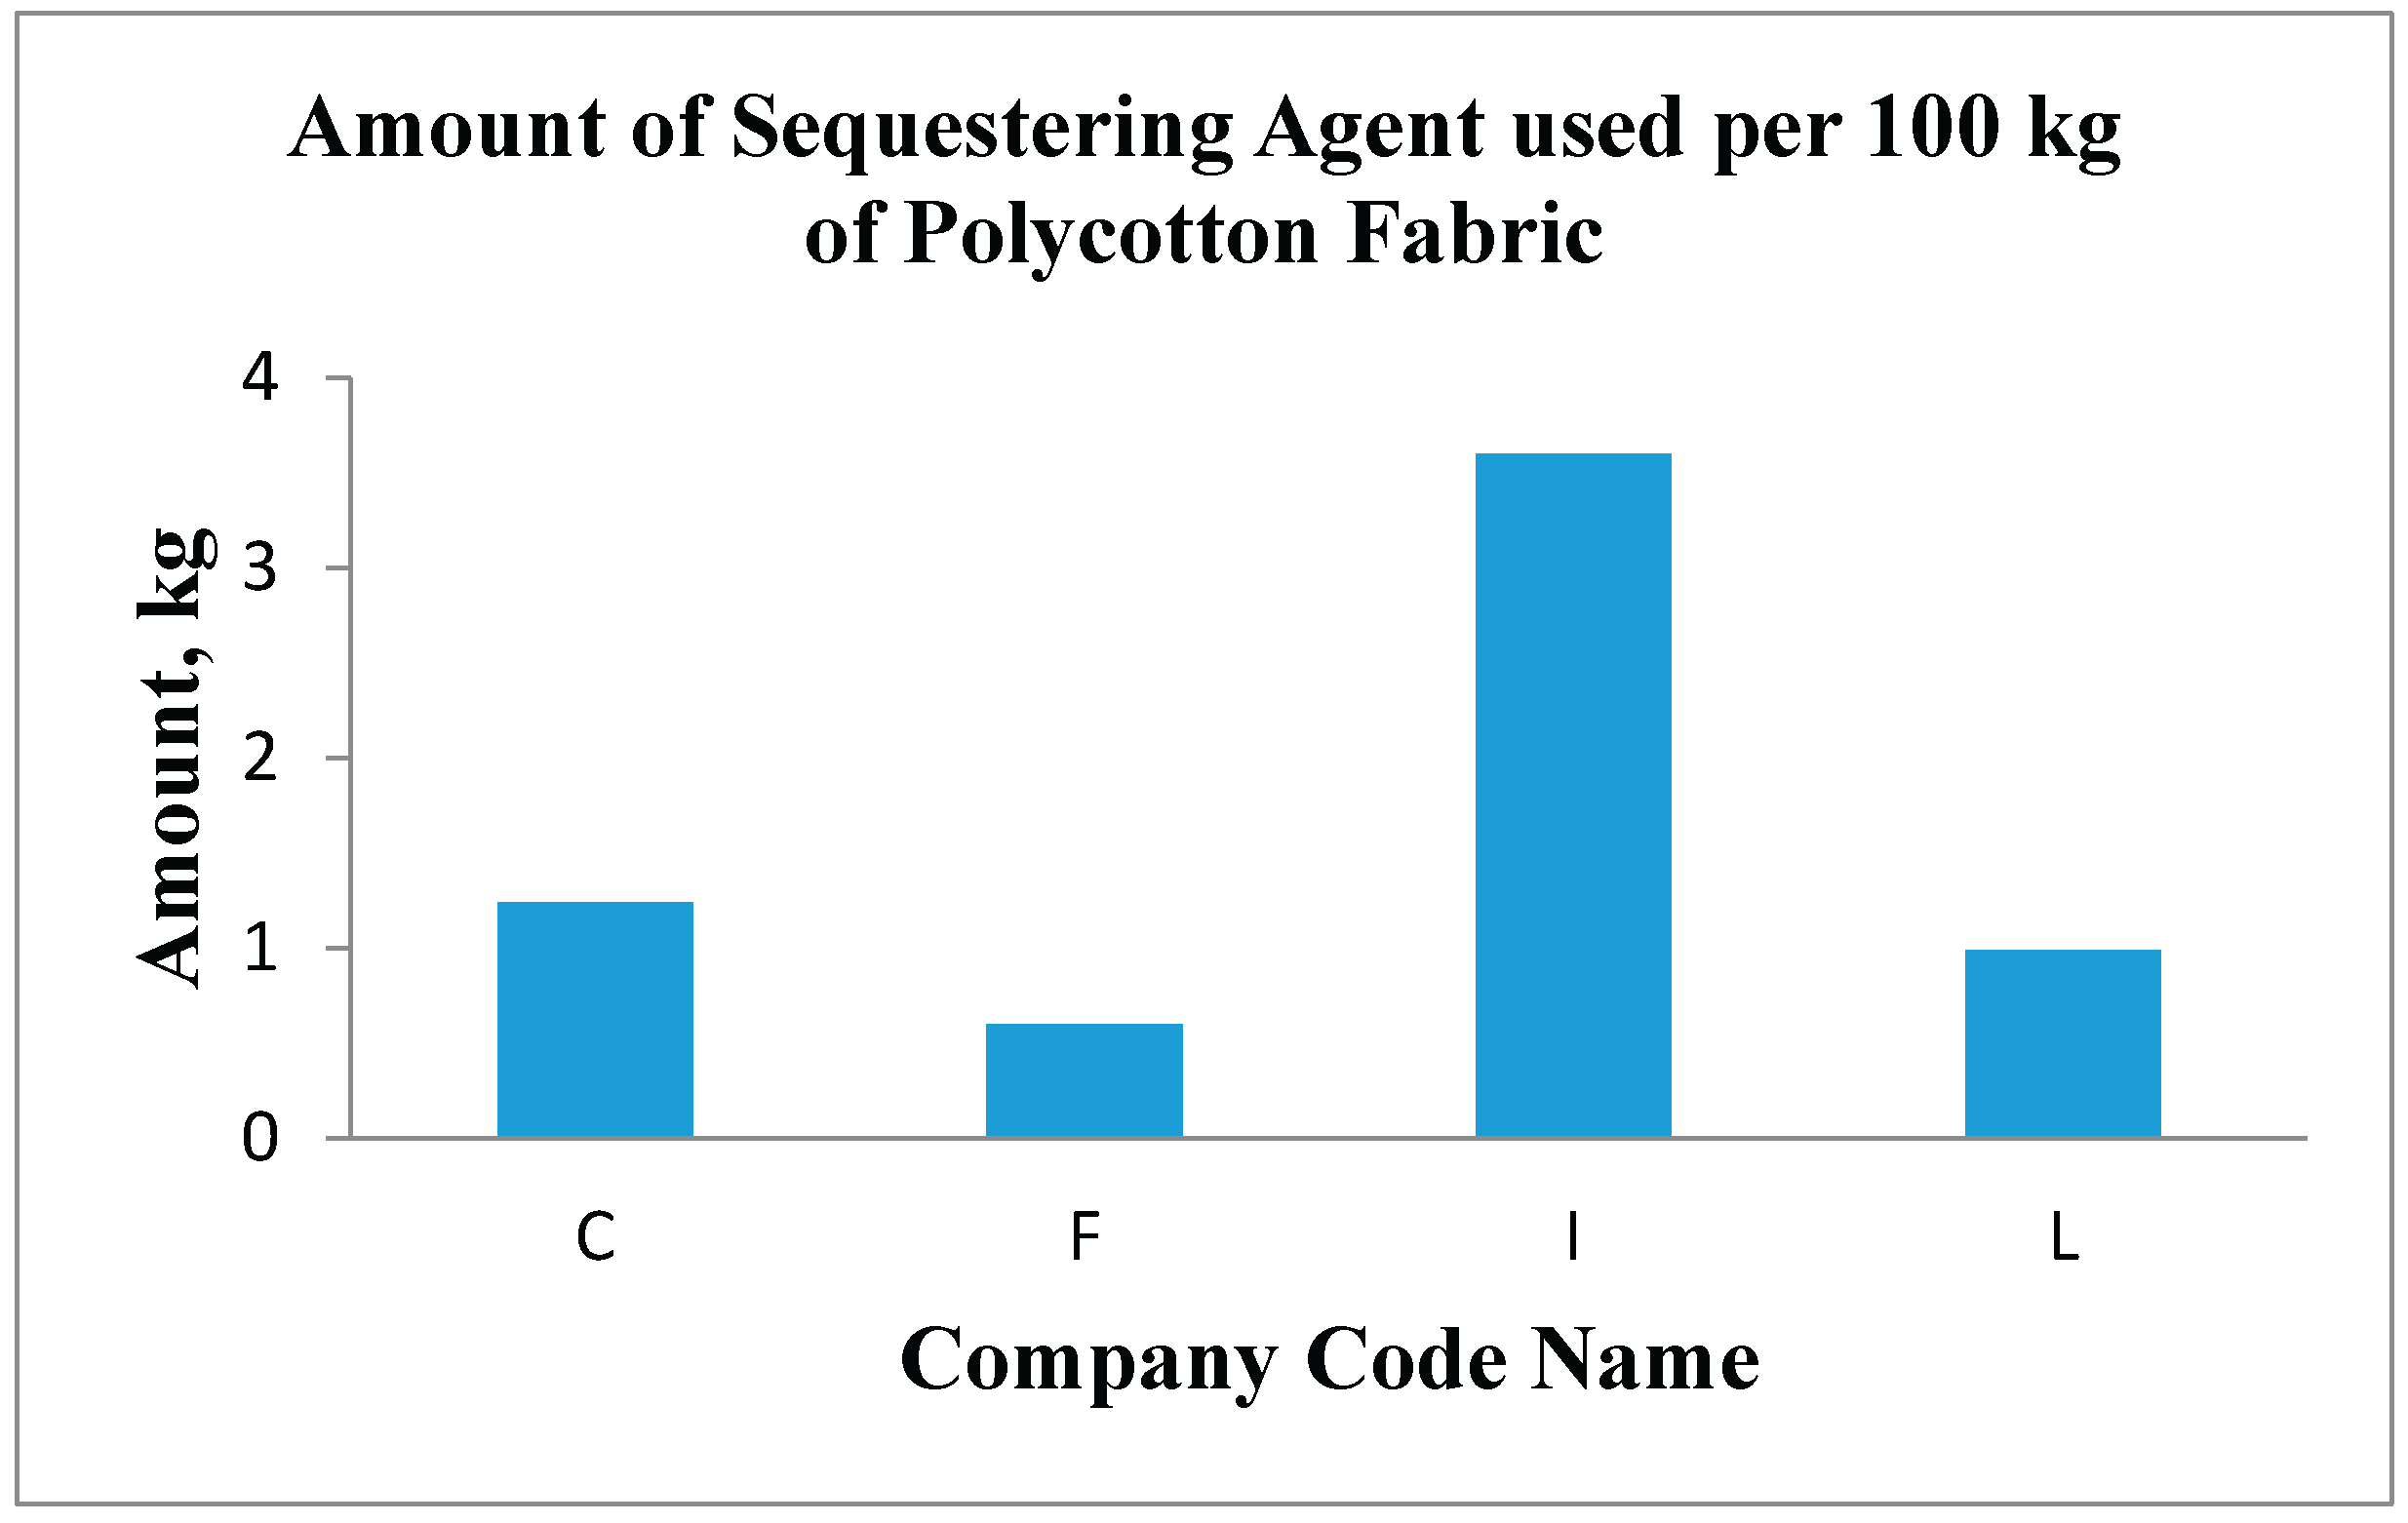
Figure 4.
The Amount of wetting agent used per 100 kg of cotton fabrics by different companies.
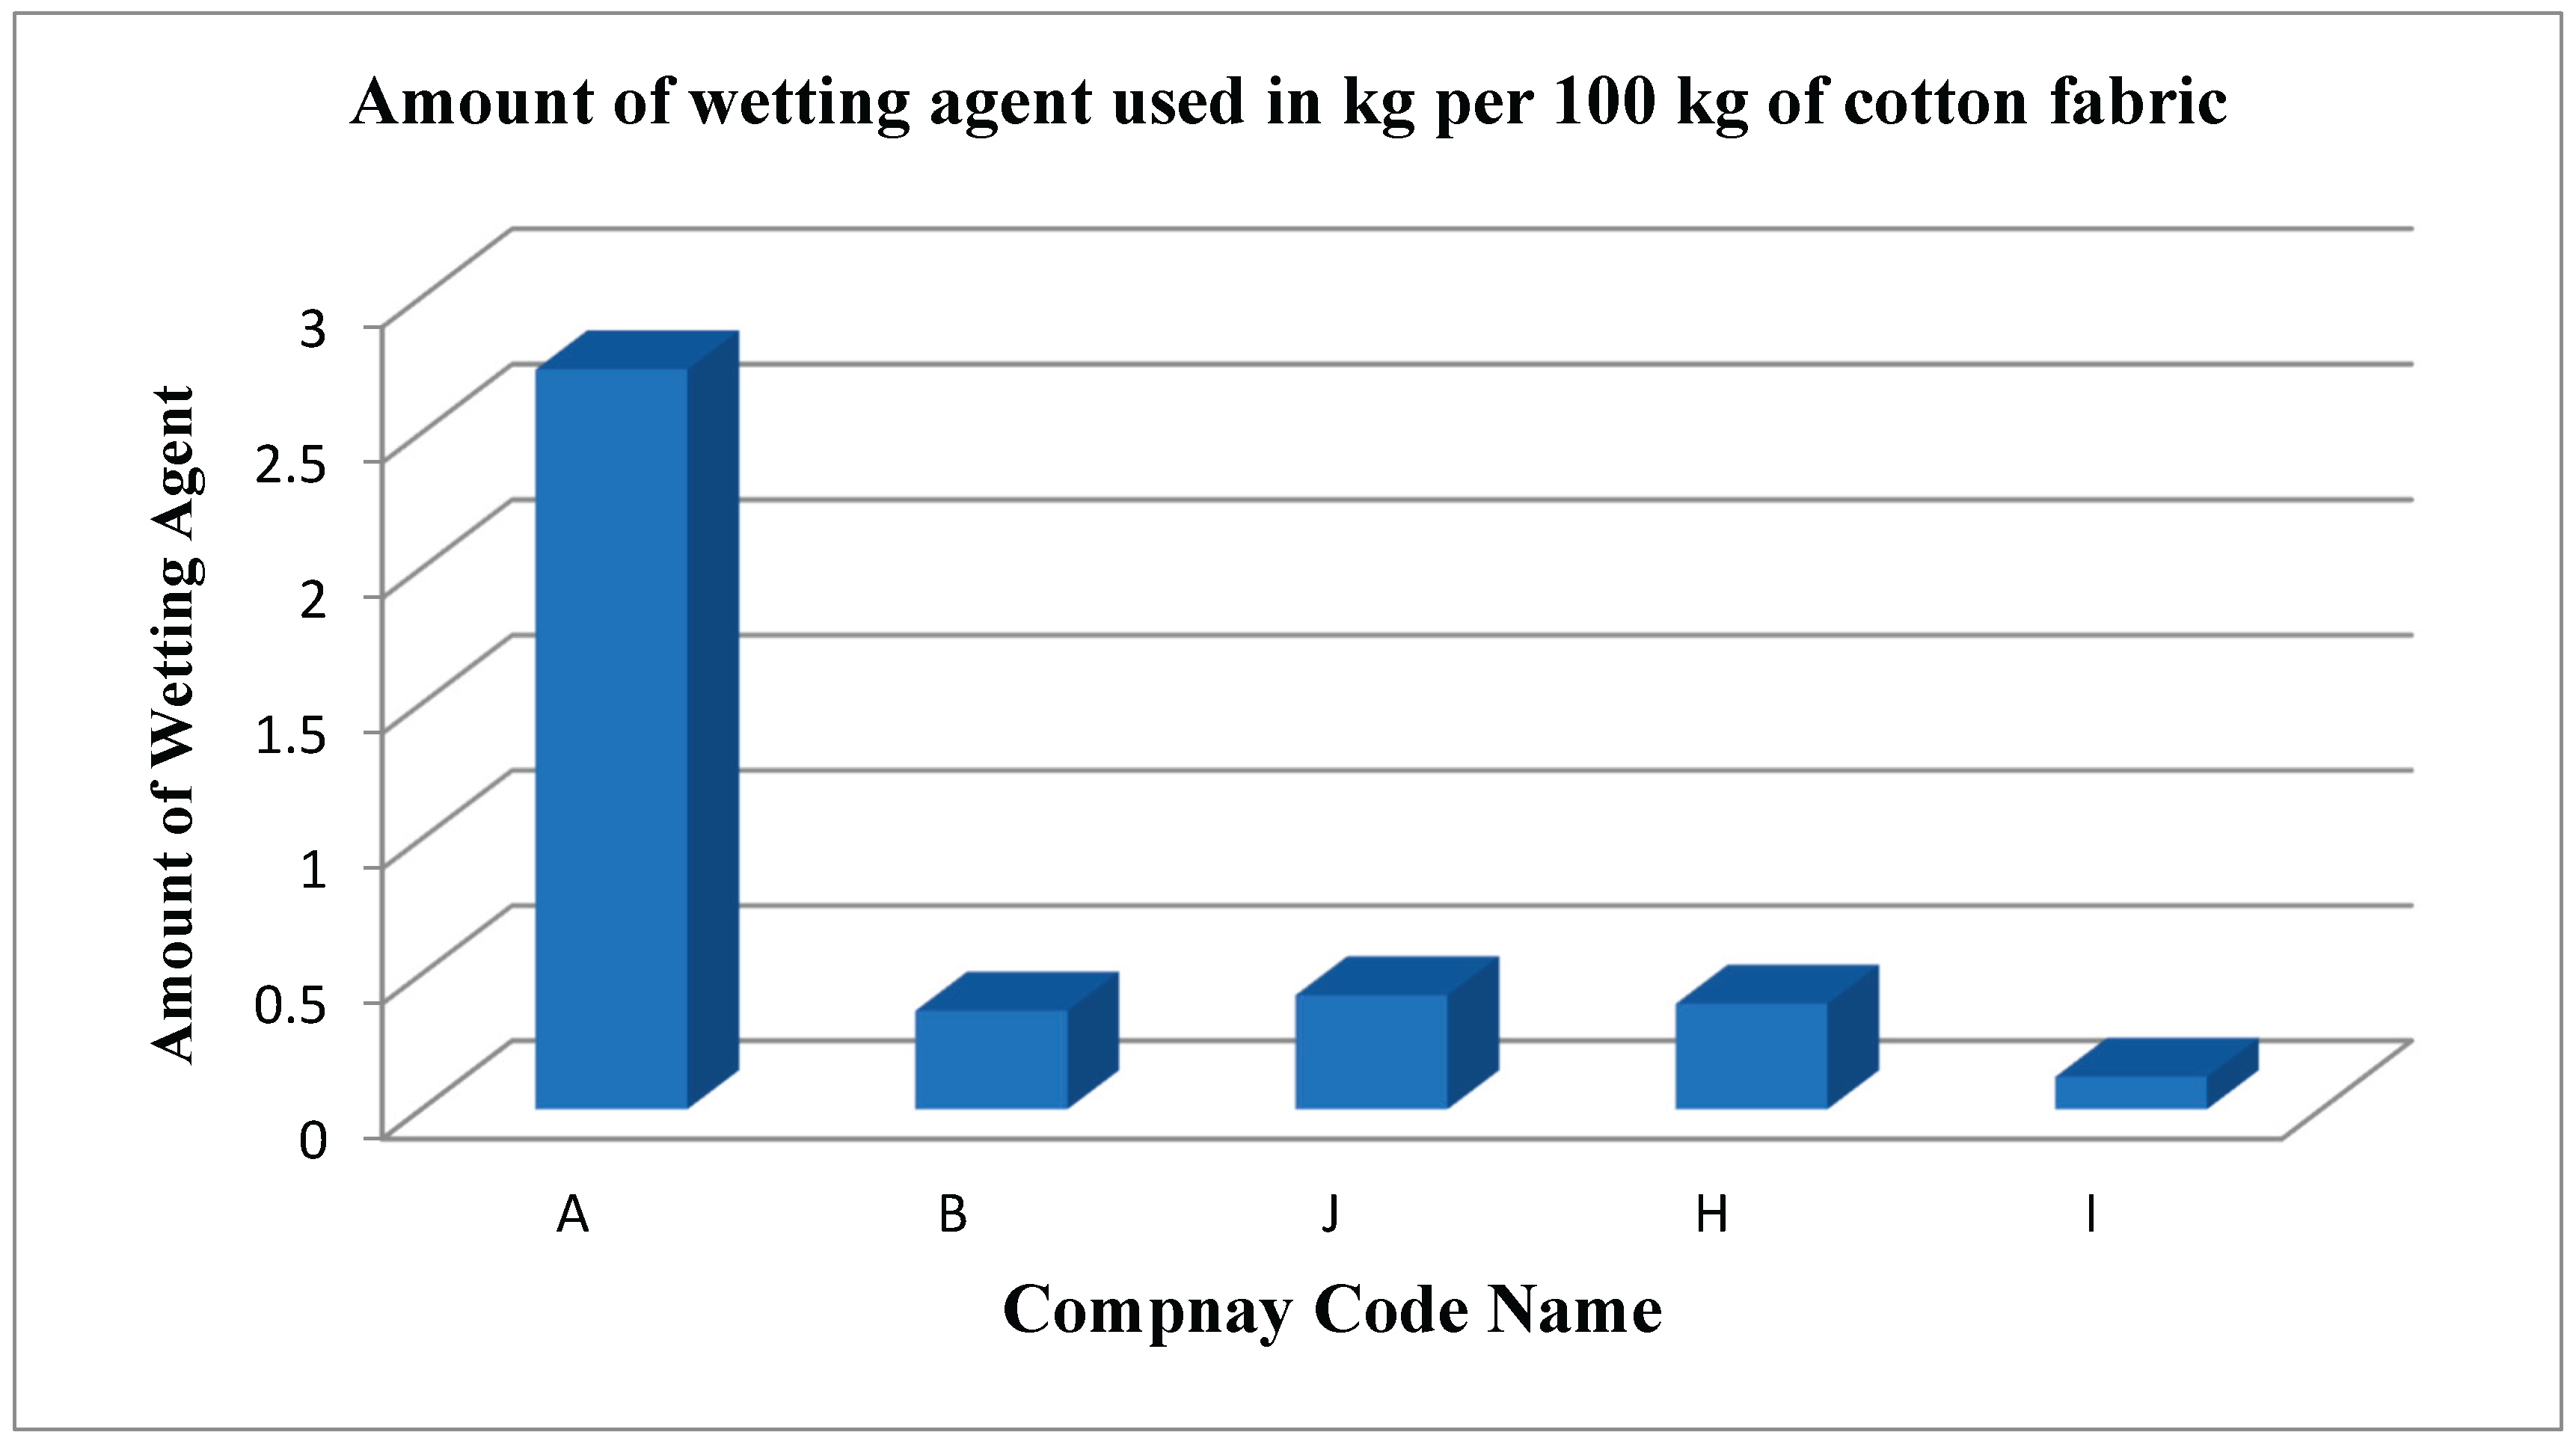
Figure 5.
The Amount of Anti-creasing Agent is used per 100 kg of cotton fabrics by different companies.
Figure 5.
The Amount of Anti-creasing Agent is used per 100 kg of cotton fabrics by different companies.
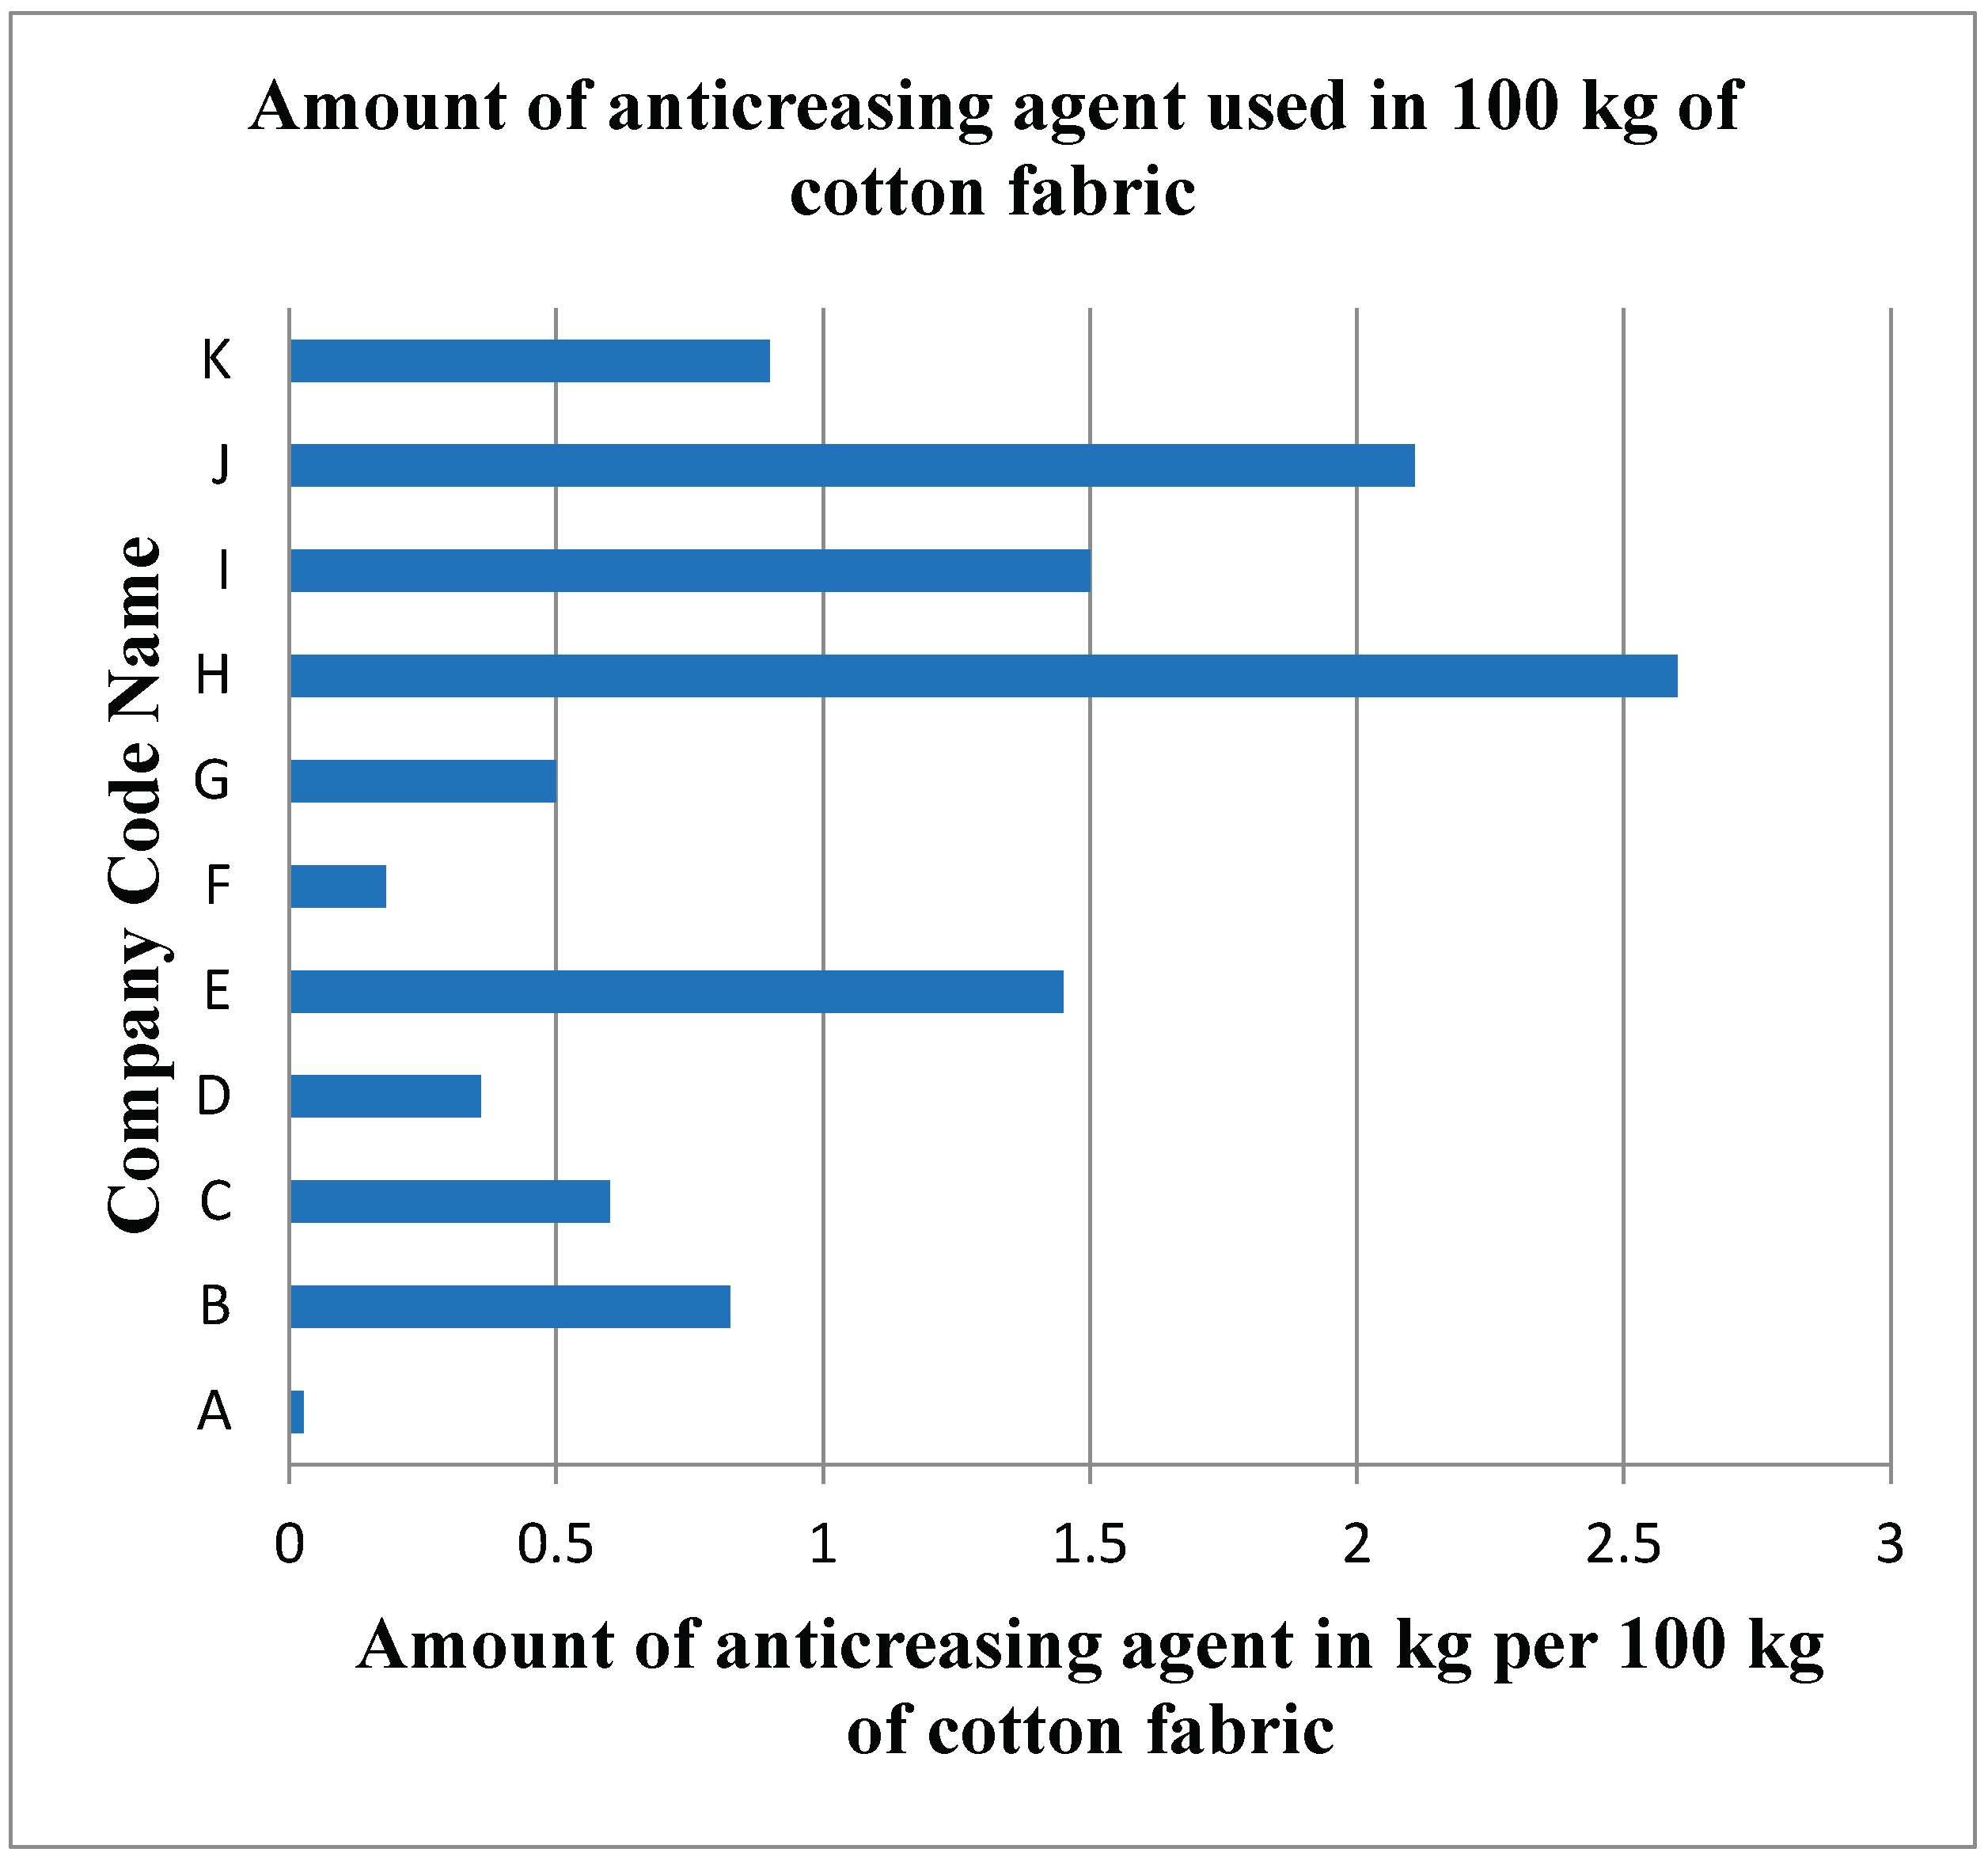
Figure 6.
Amount of Anti-creasing Agent used per 100 kg of polycotton fabric by different companies.
Figure 6.
Amount of Anti-creasing Agent used per 100 kg of polycotton fabric by different companies.
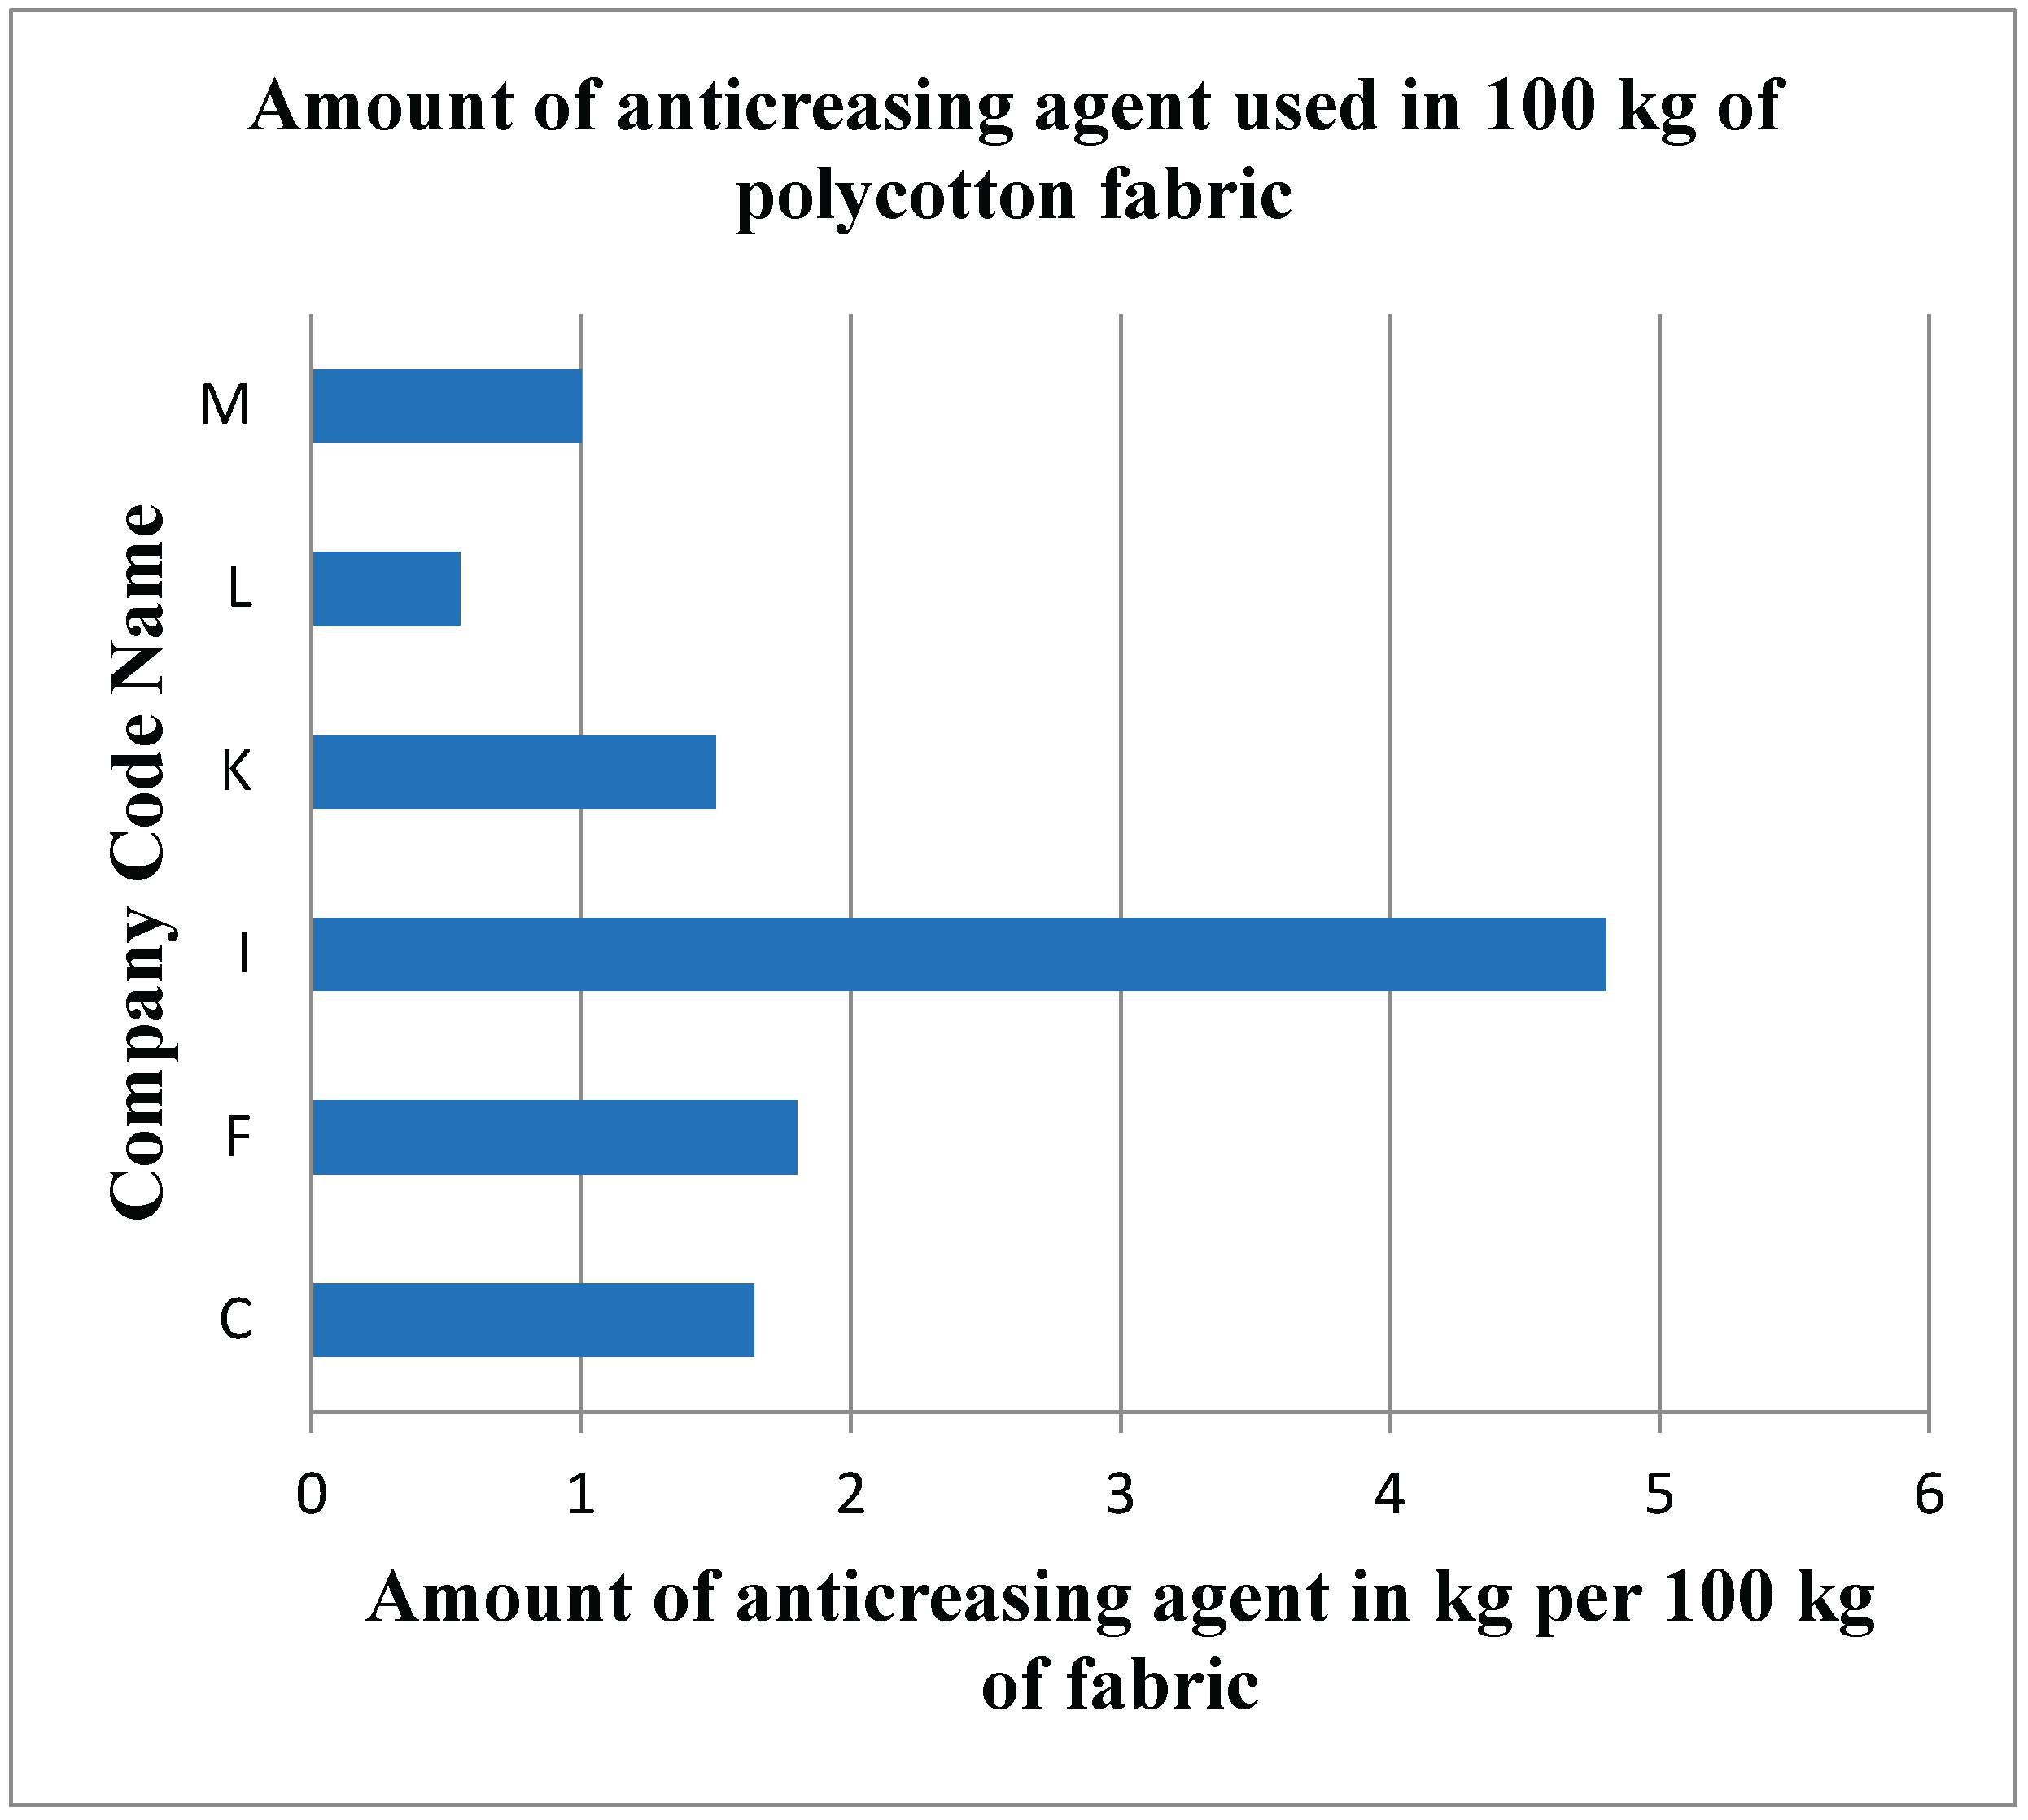
Figure 7.
Amount of Leveling Agent used per 100 kg of cotton fabrics by different companies.
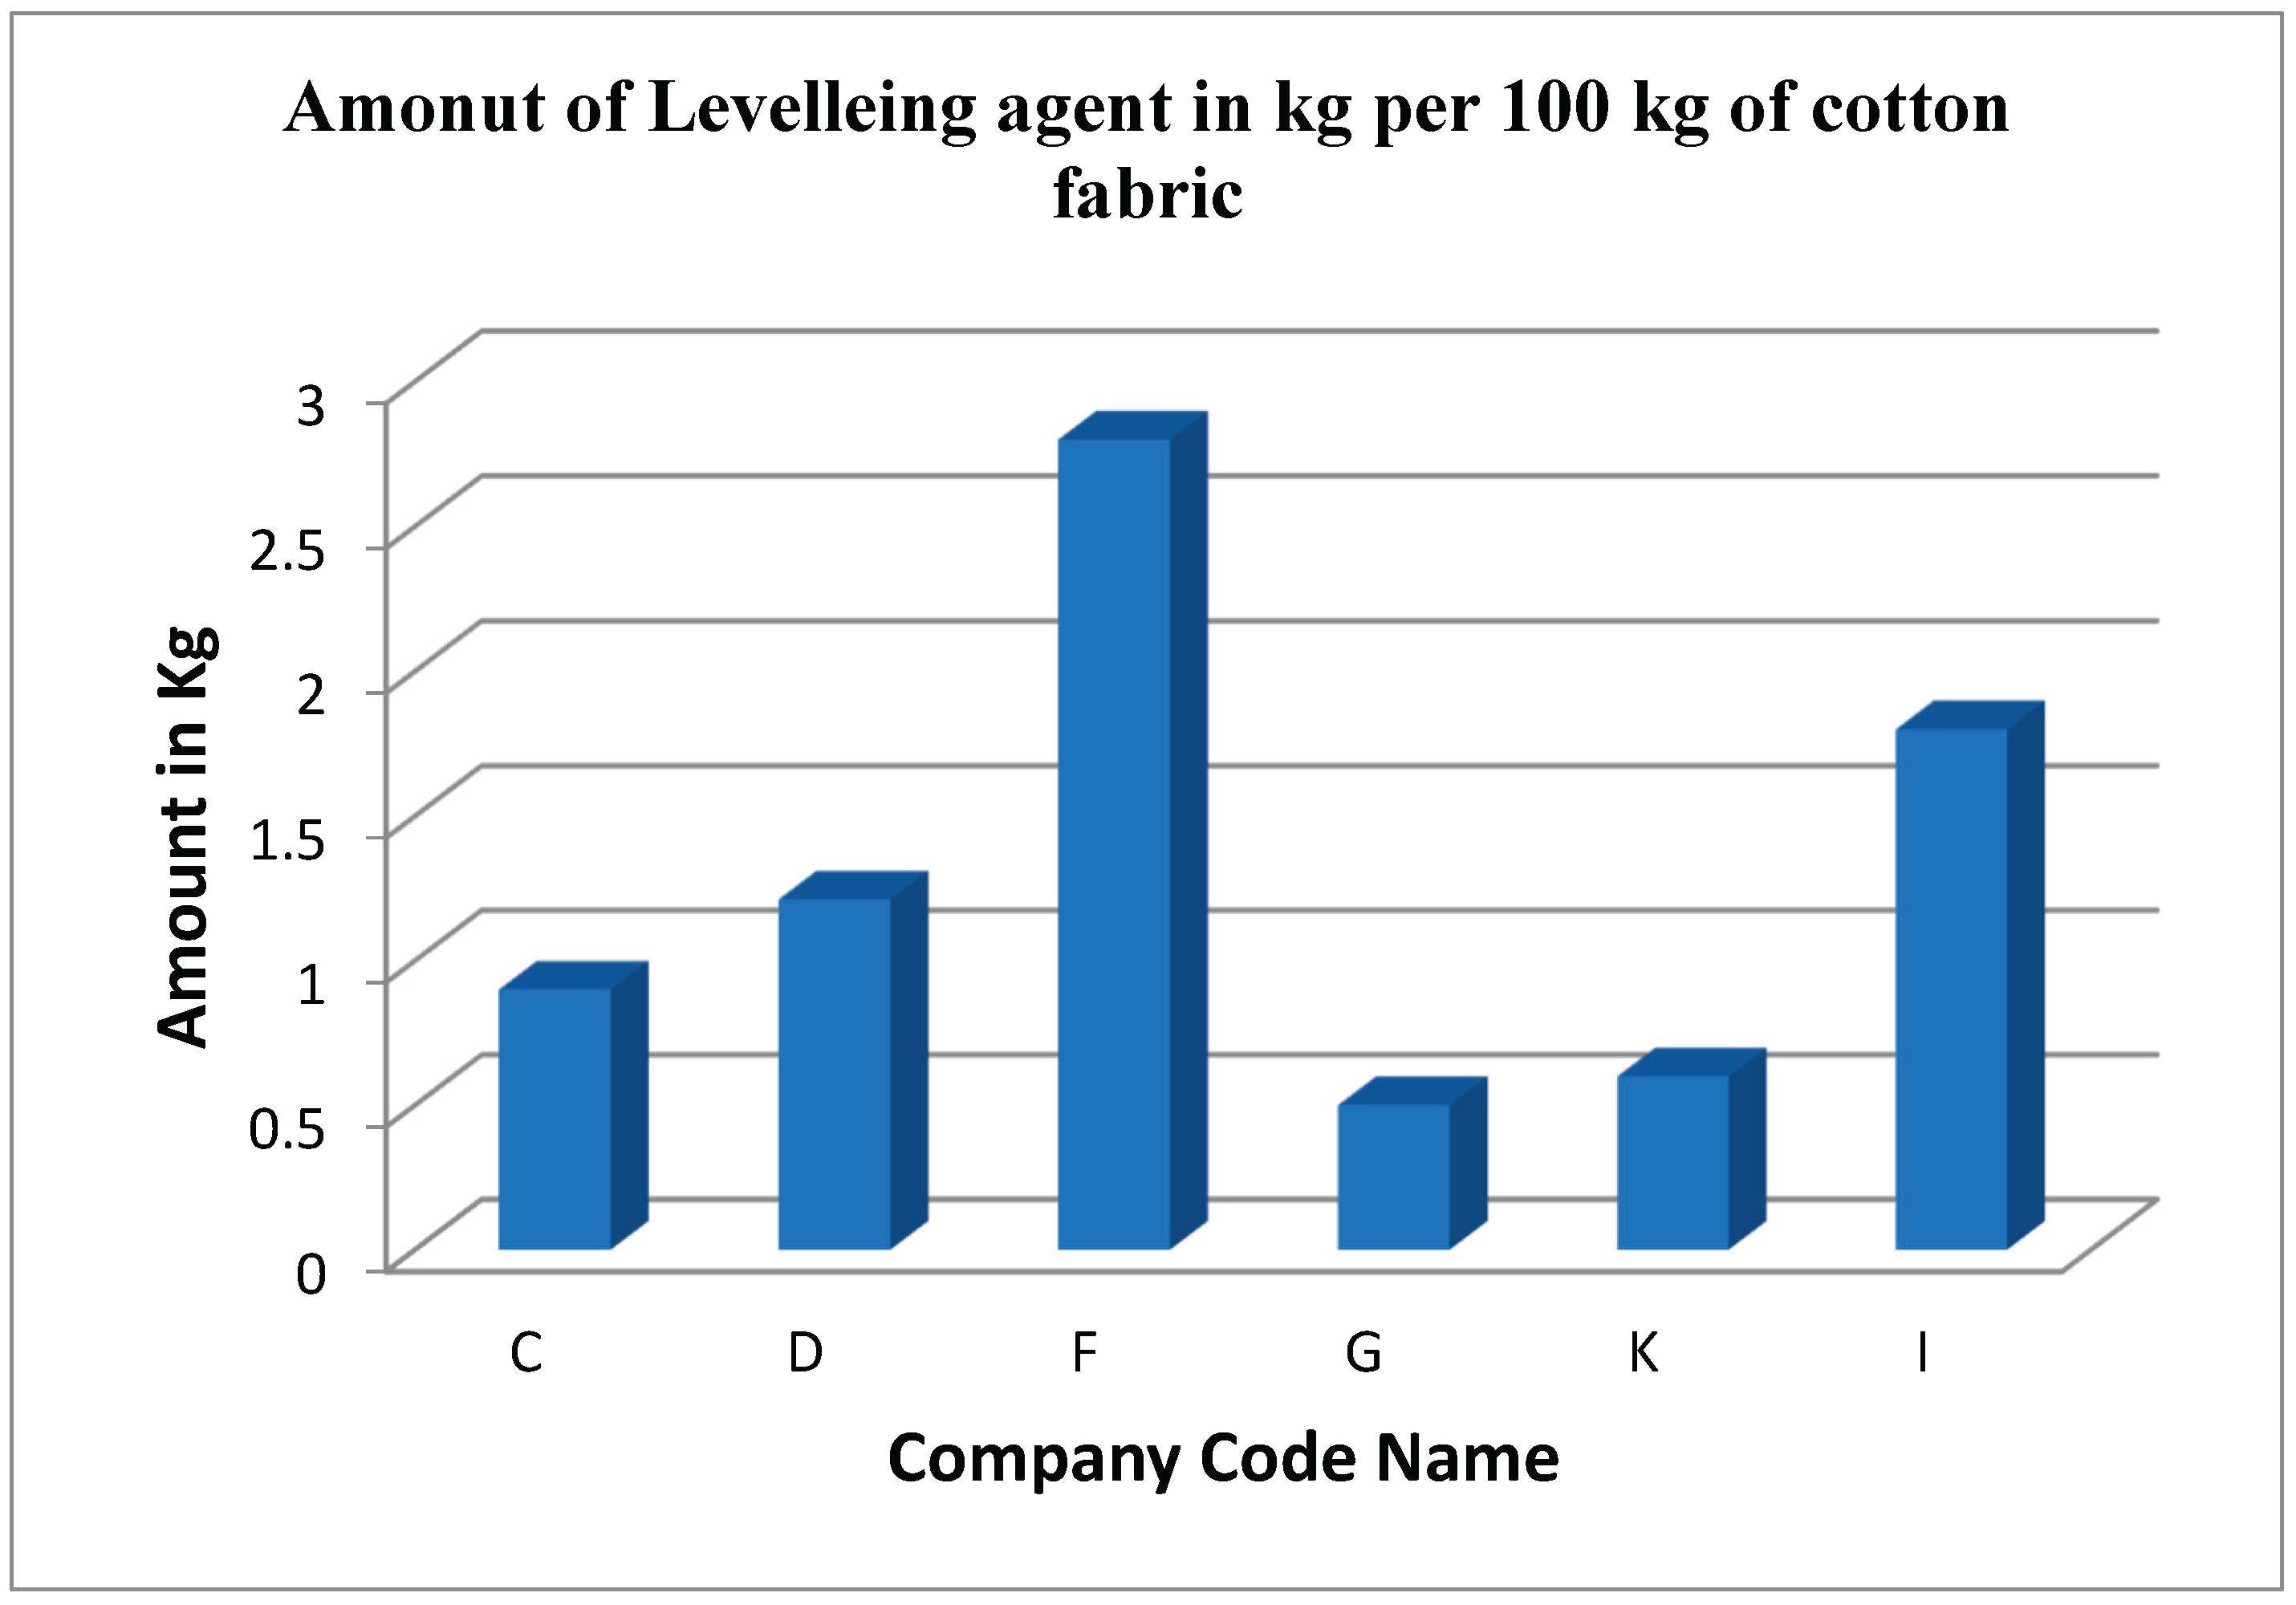
Figure 8.
Amount of Leveling-Agent used per 100 kg of polycotton fabric by different companies.
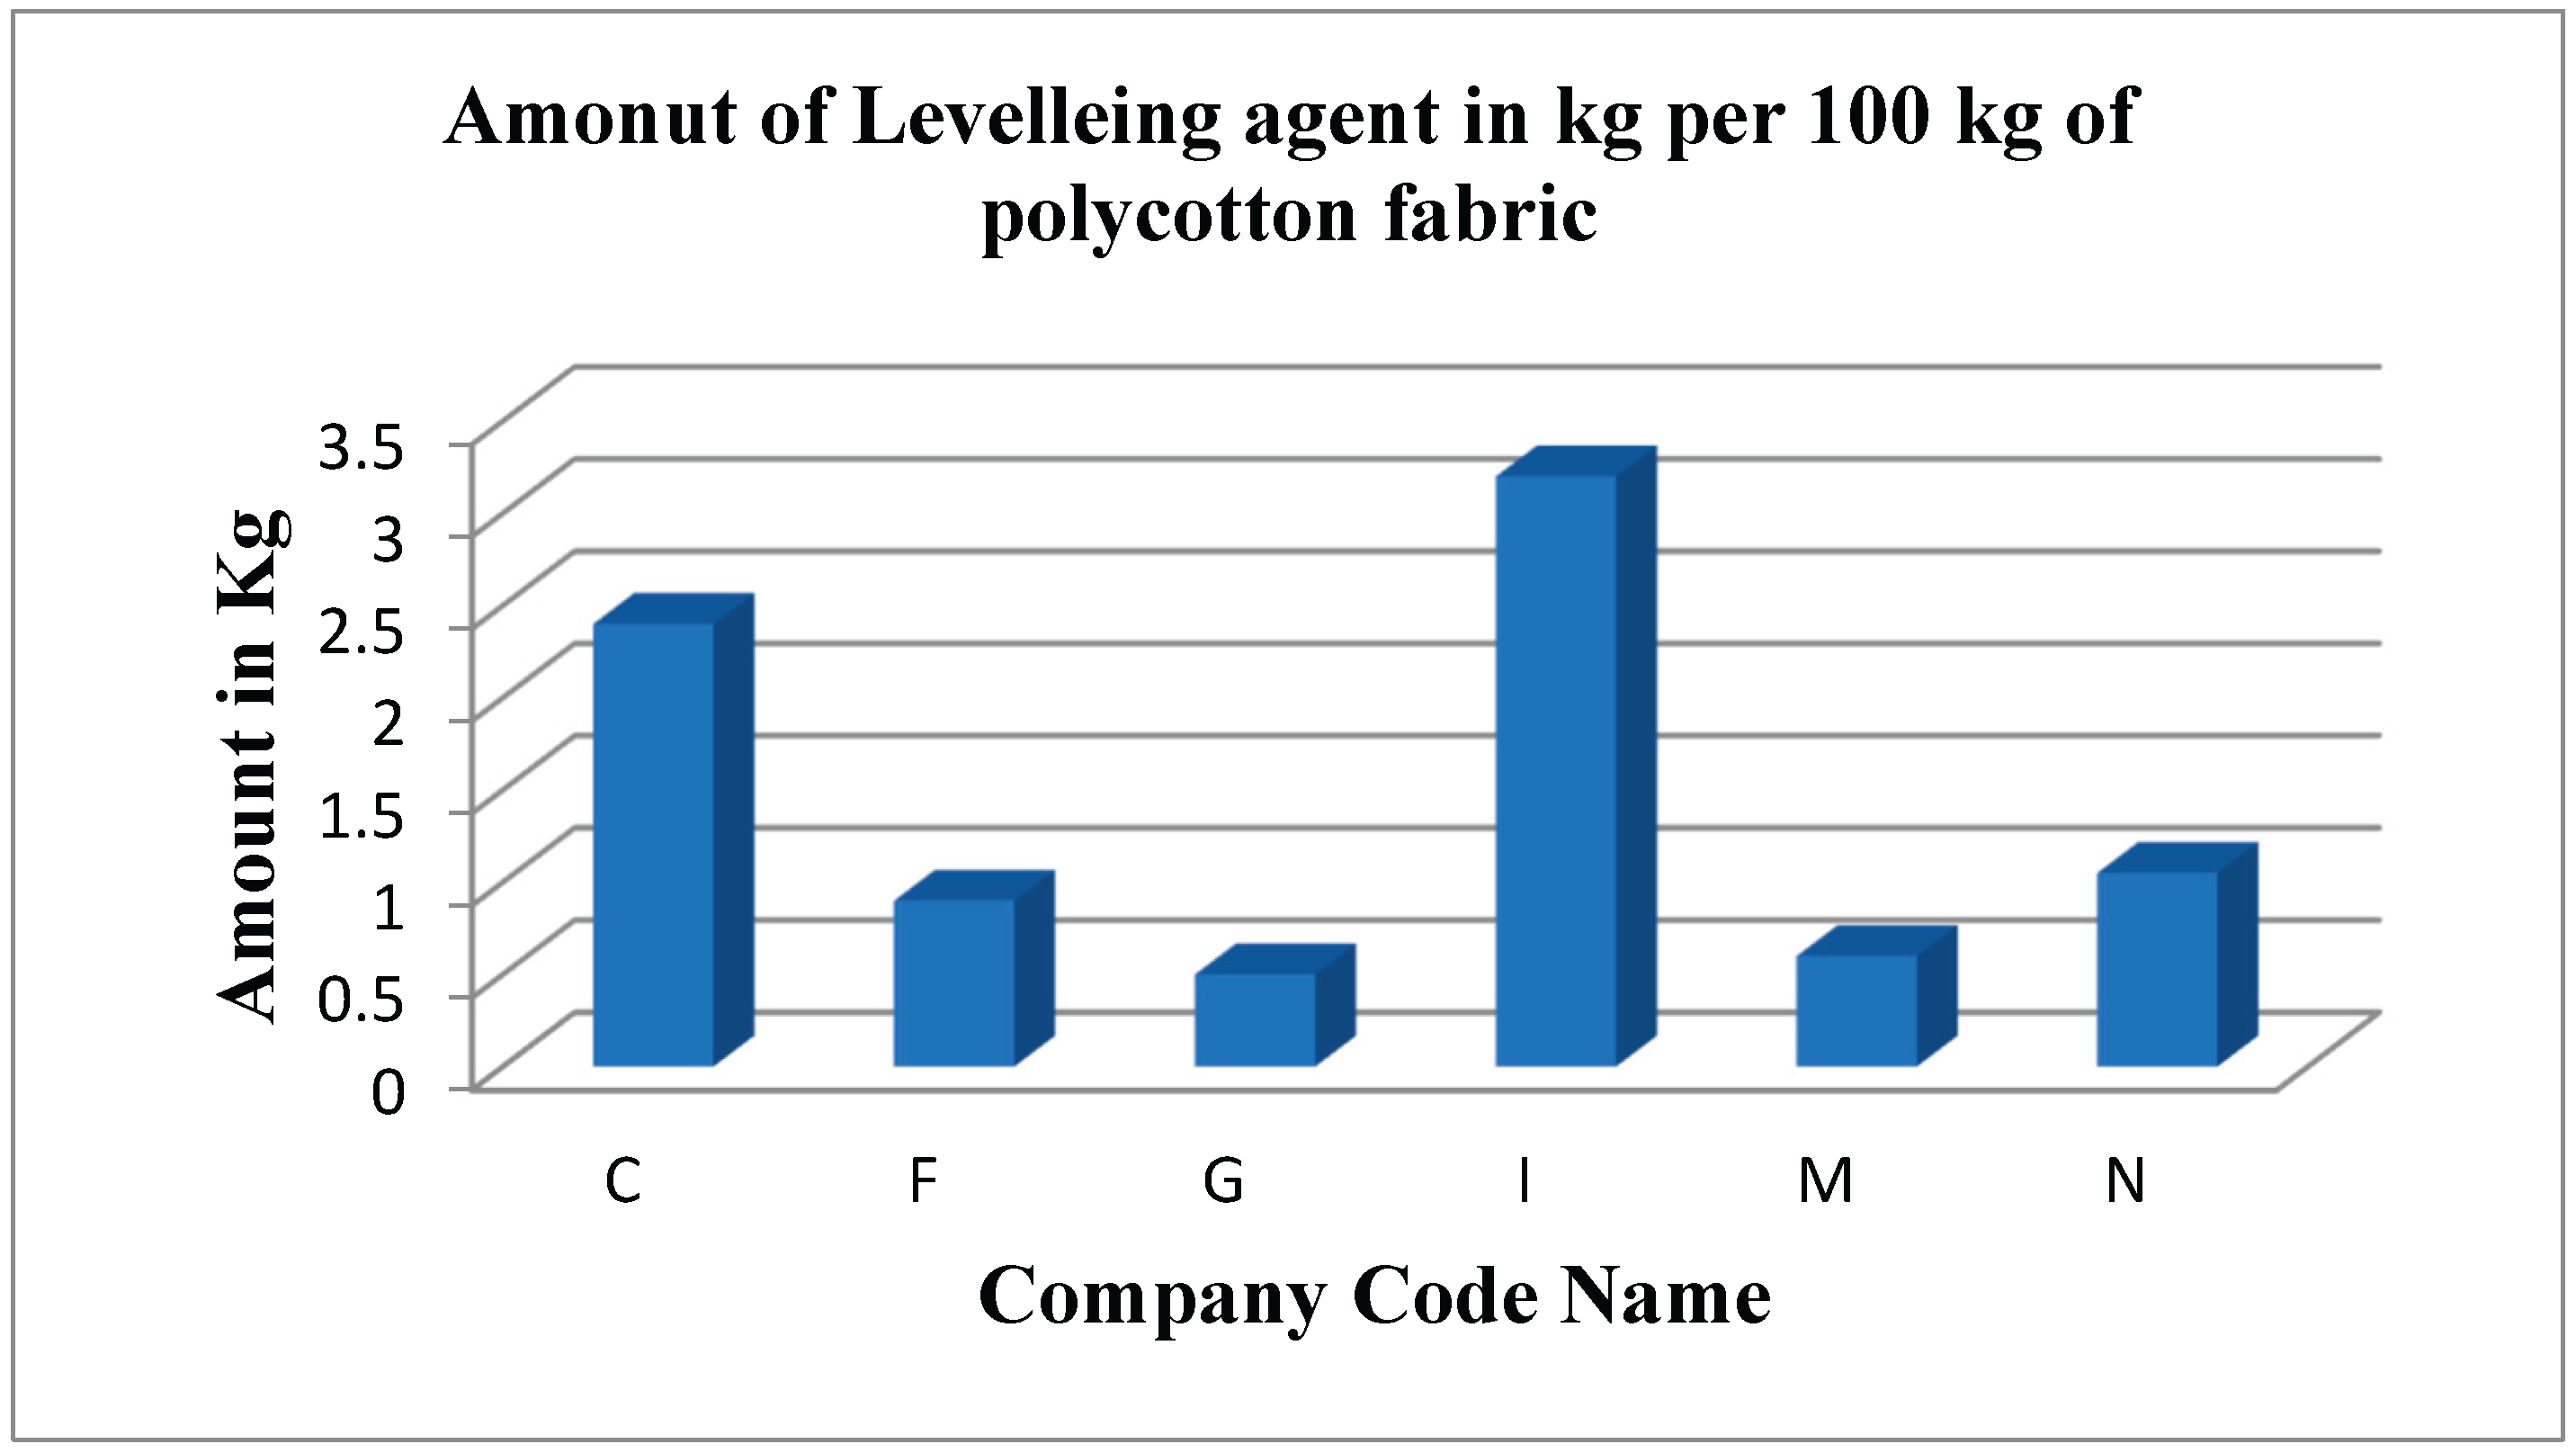
Figure 9.
Amount of Leveling Agent used per 100 kg of polyester fabric by different companies.
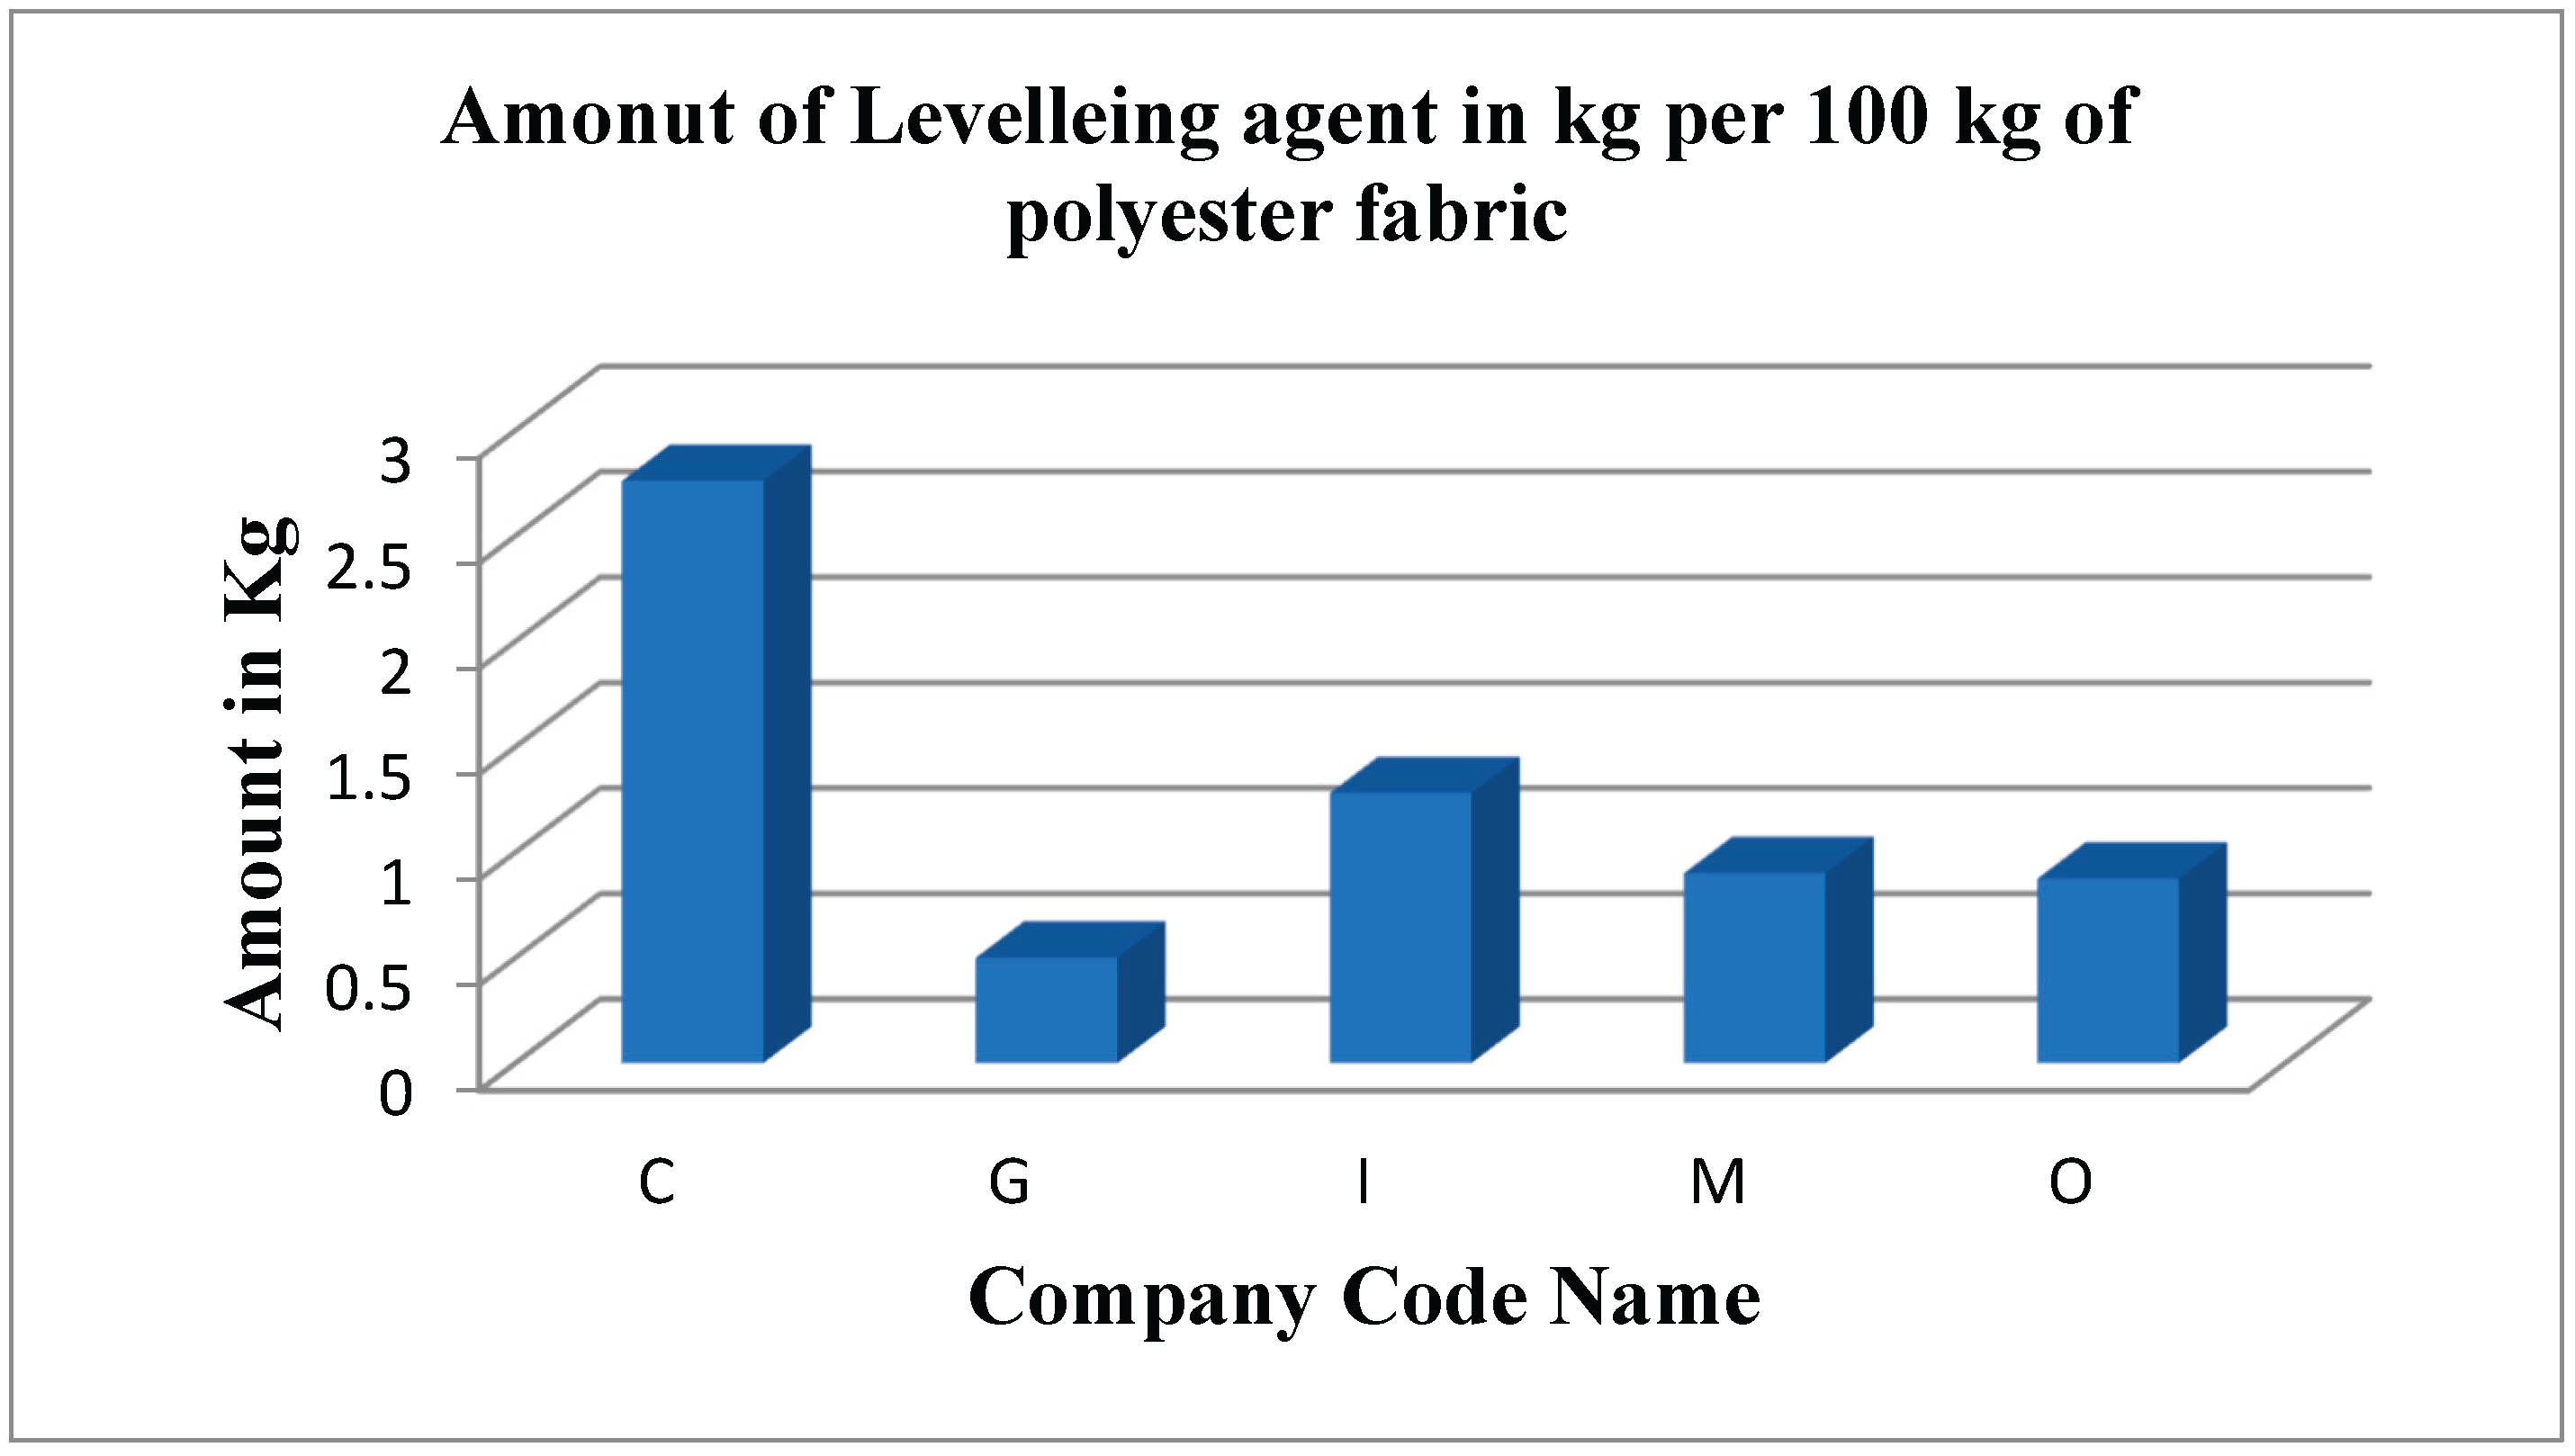
Figure 10.
Amount of caustic soda used per 100 kg of cotton fabric by different companies.
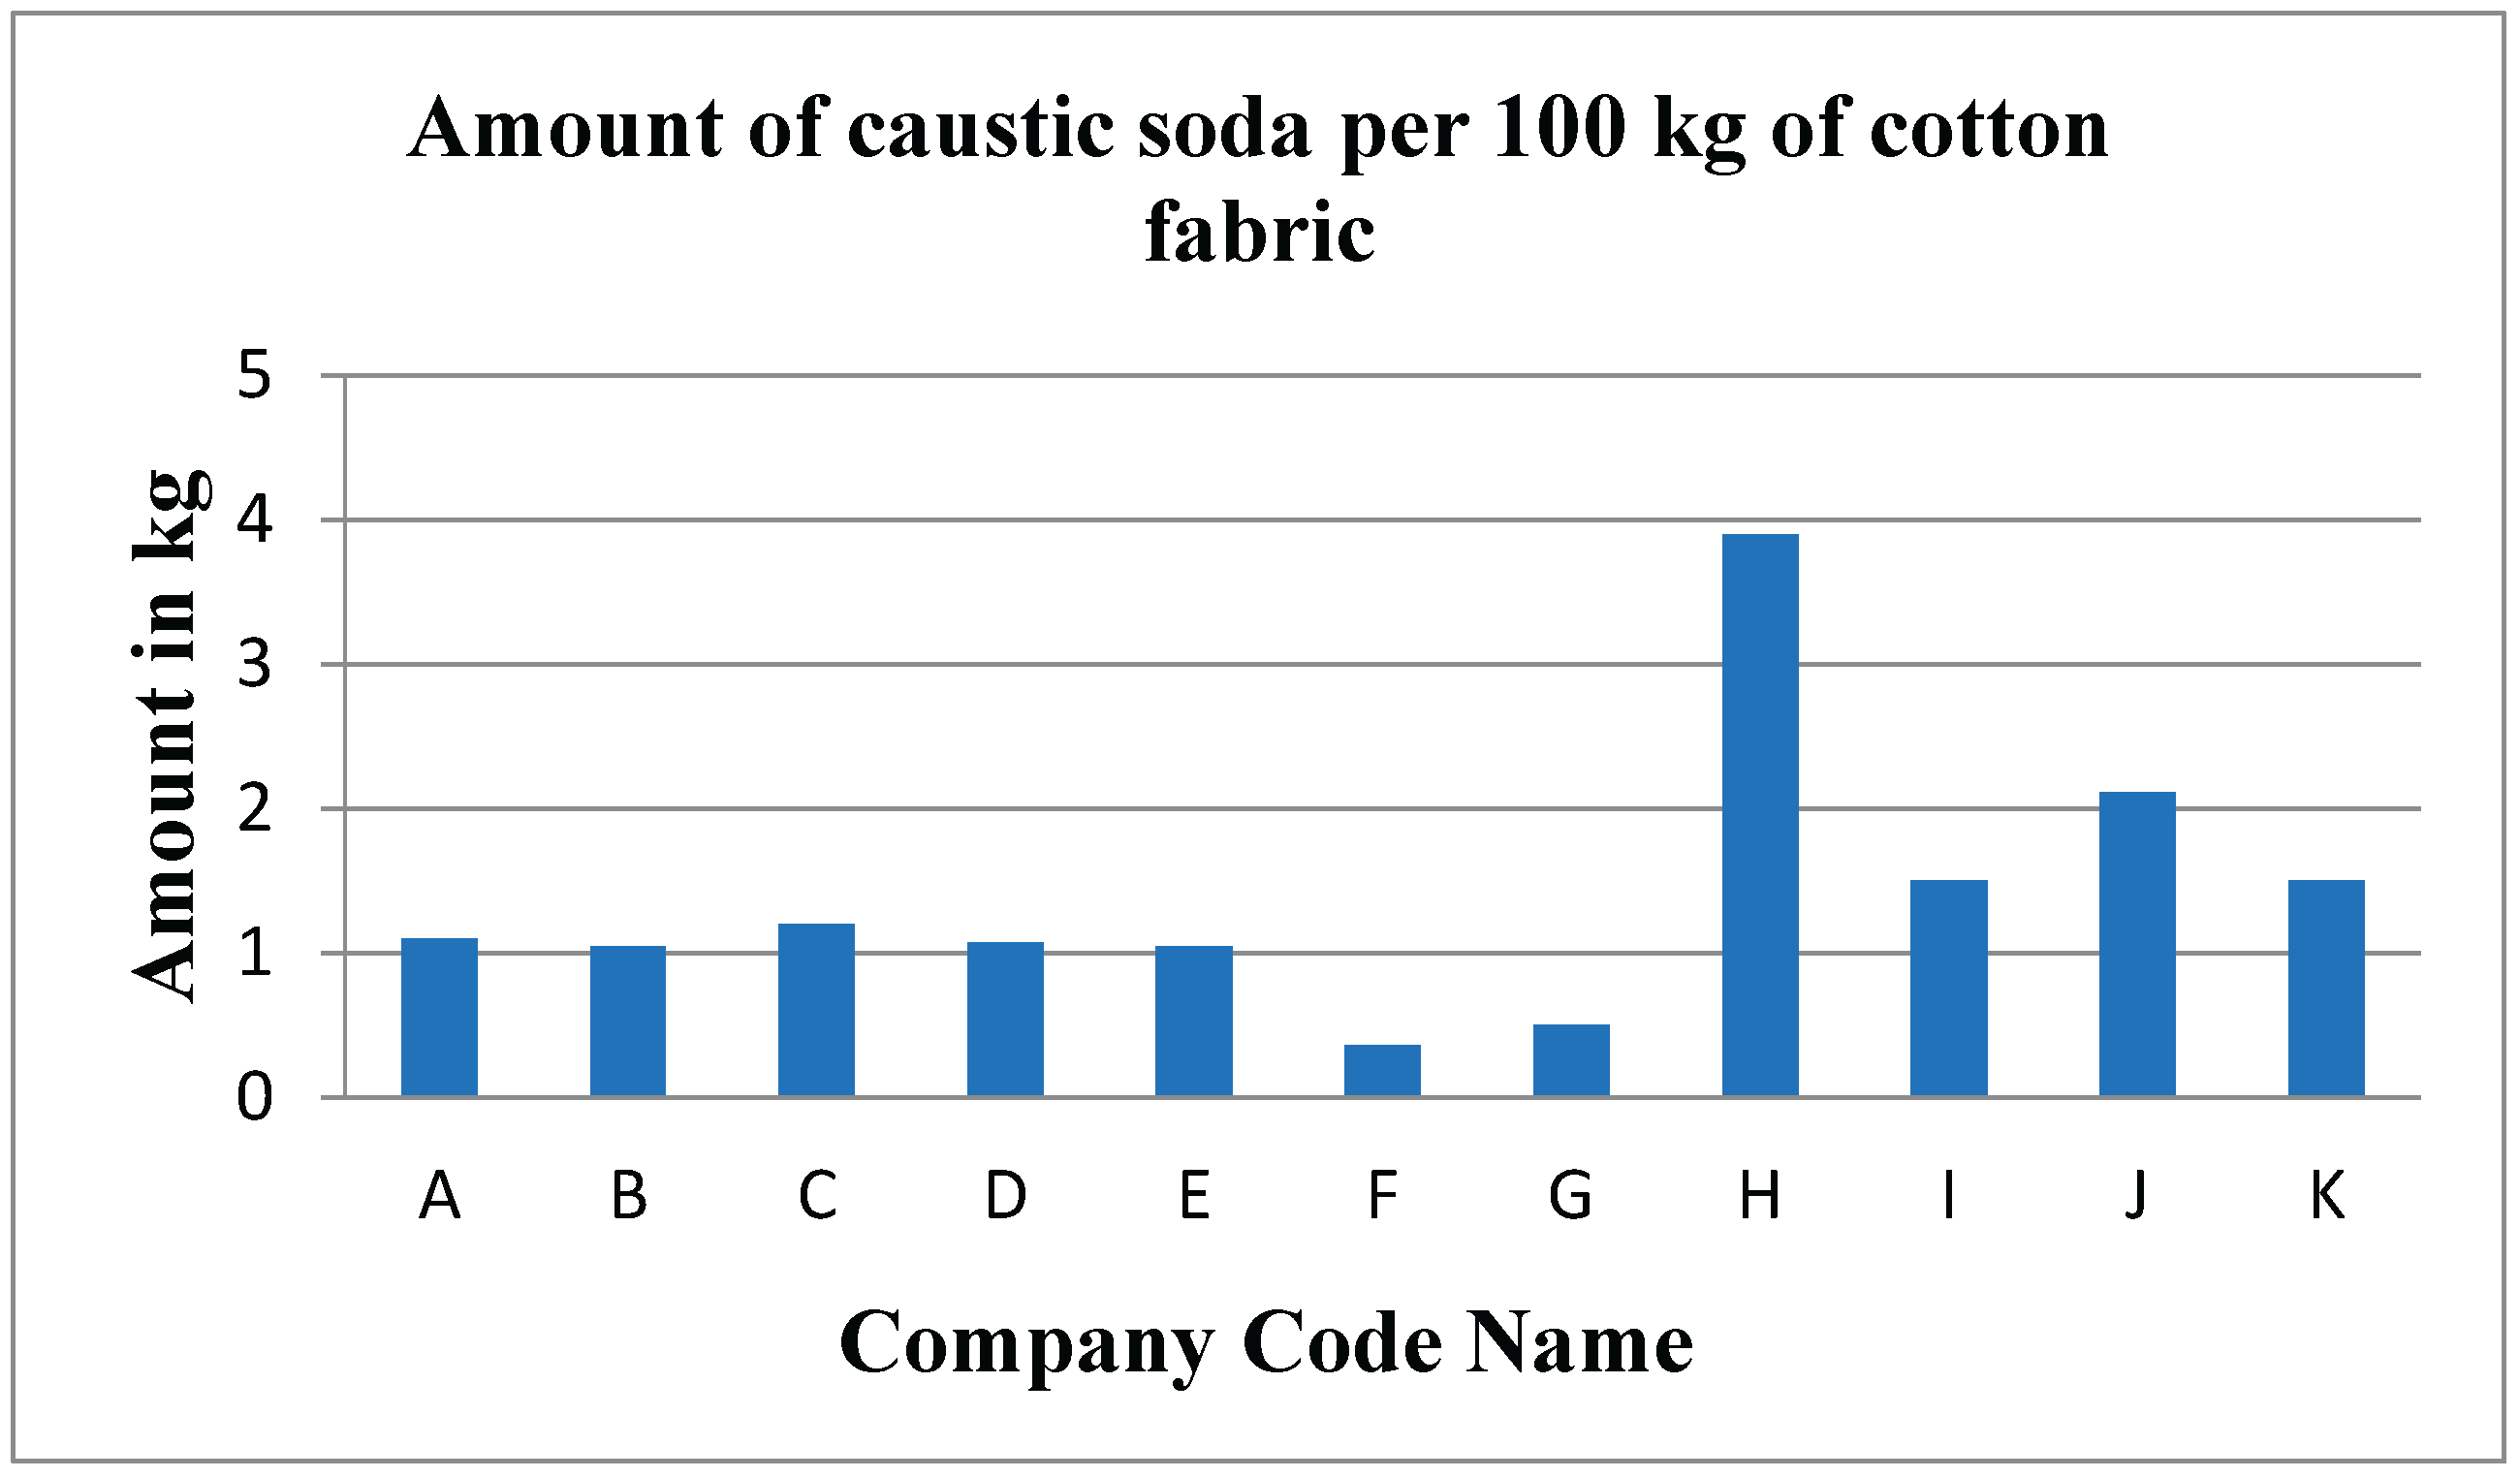
Figure 11.
Amount of caustic soda used per 100 kg of polycotton fabric by different companies.
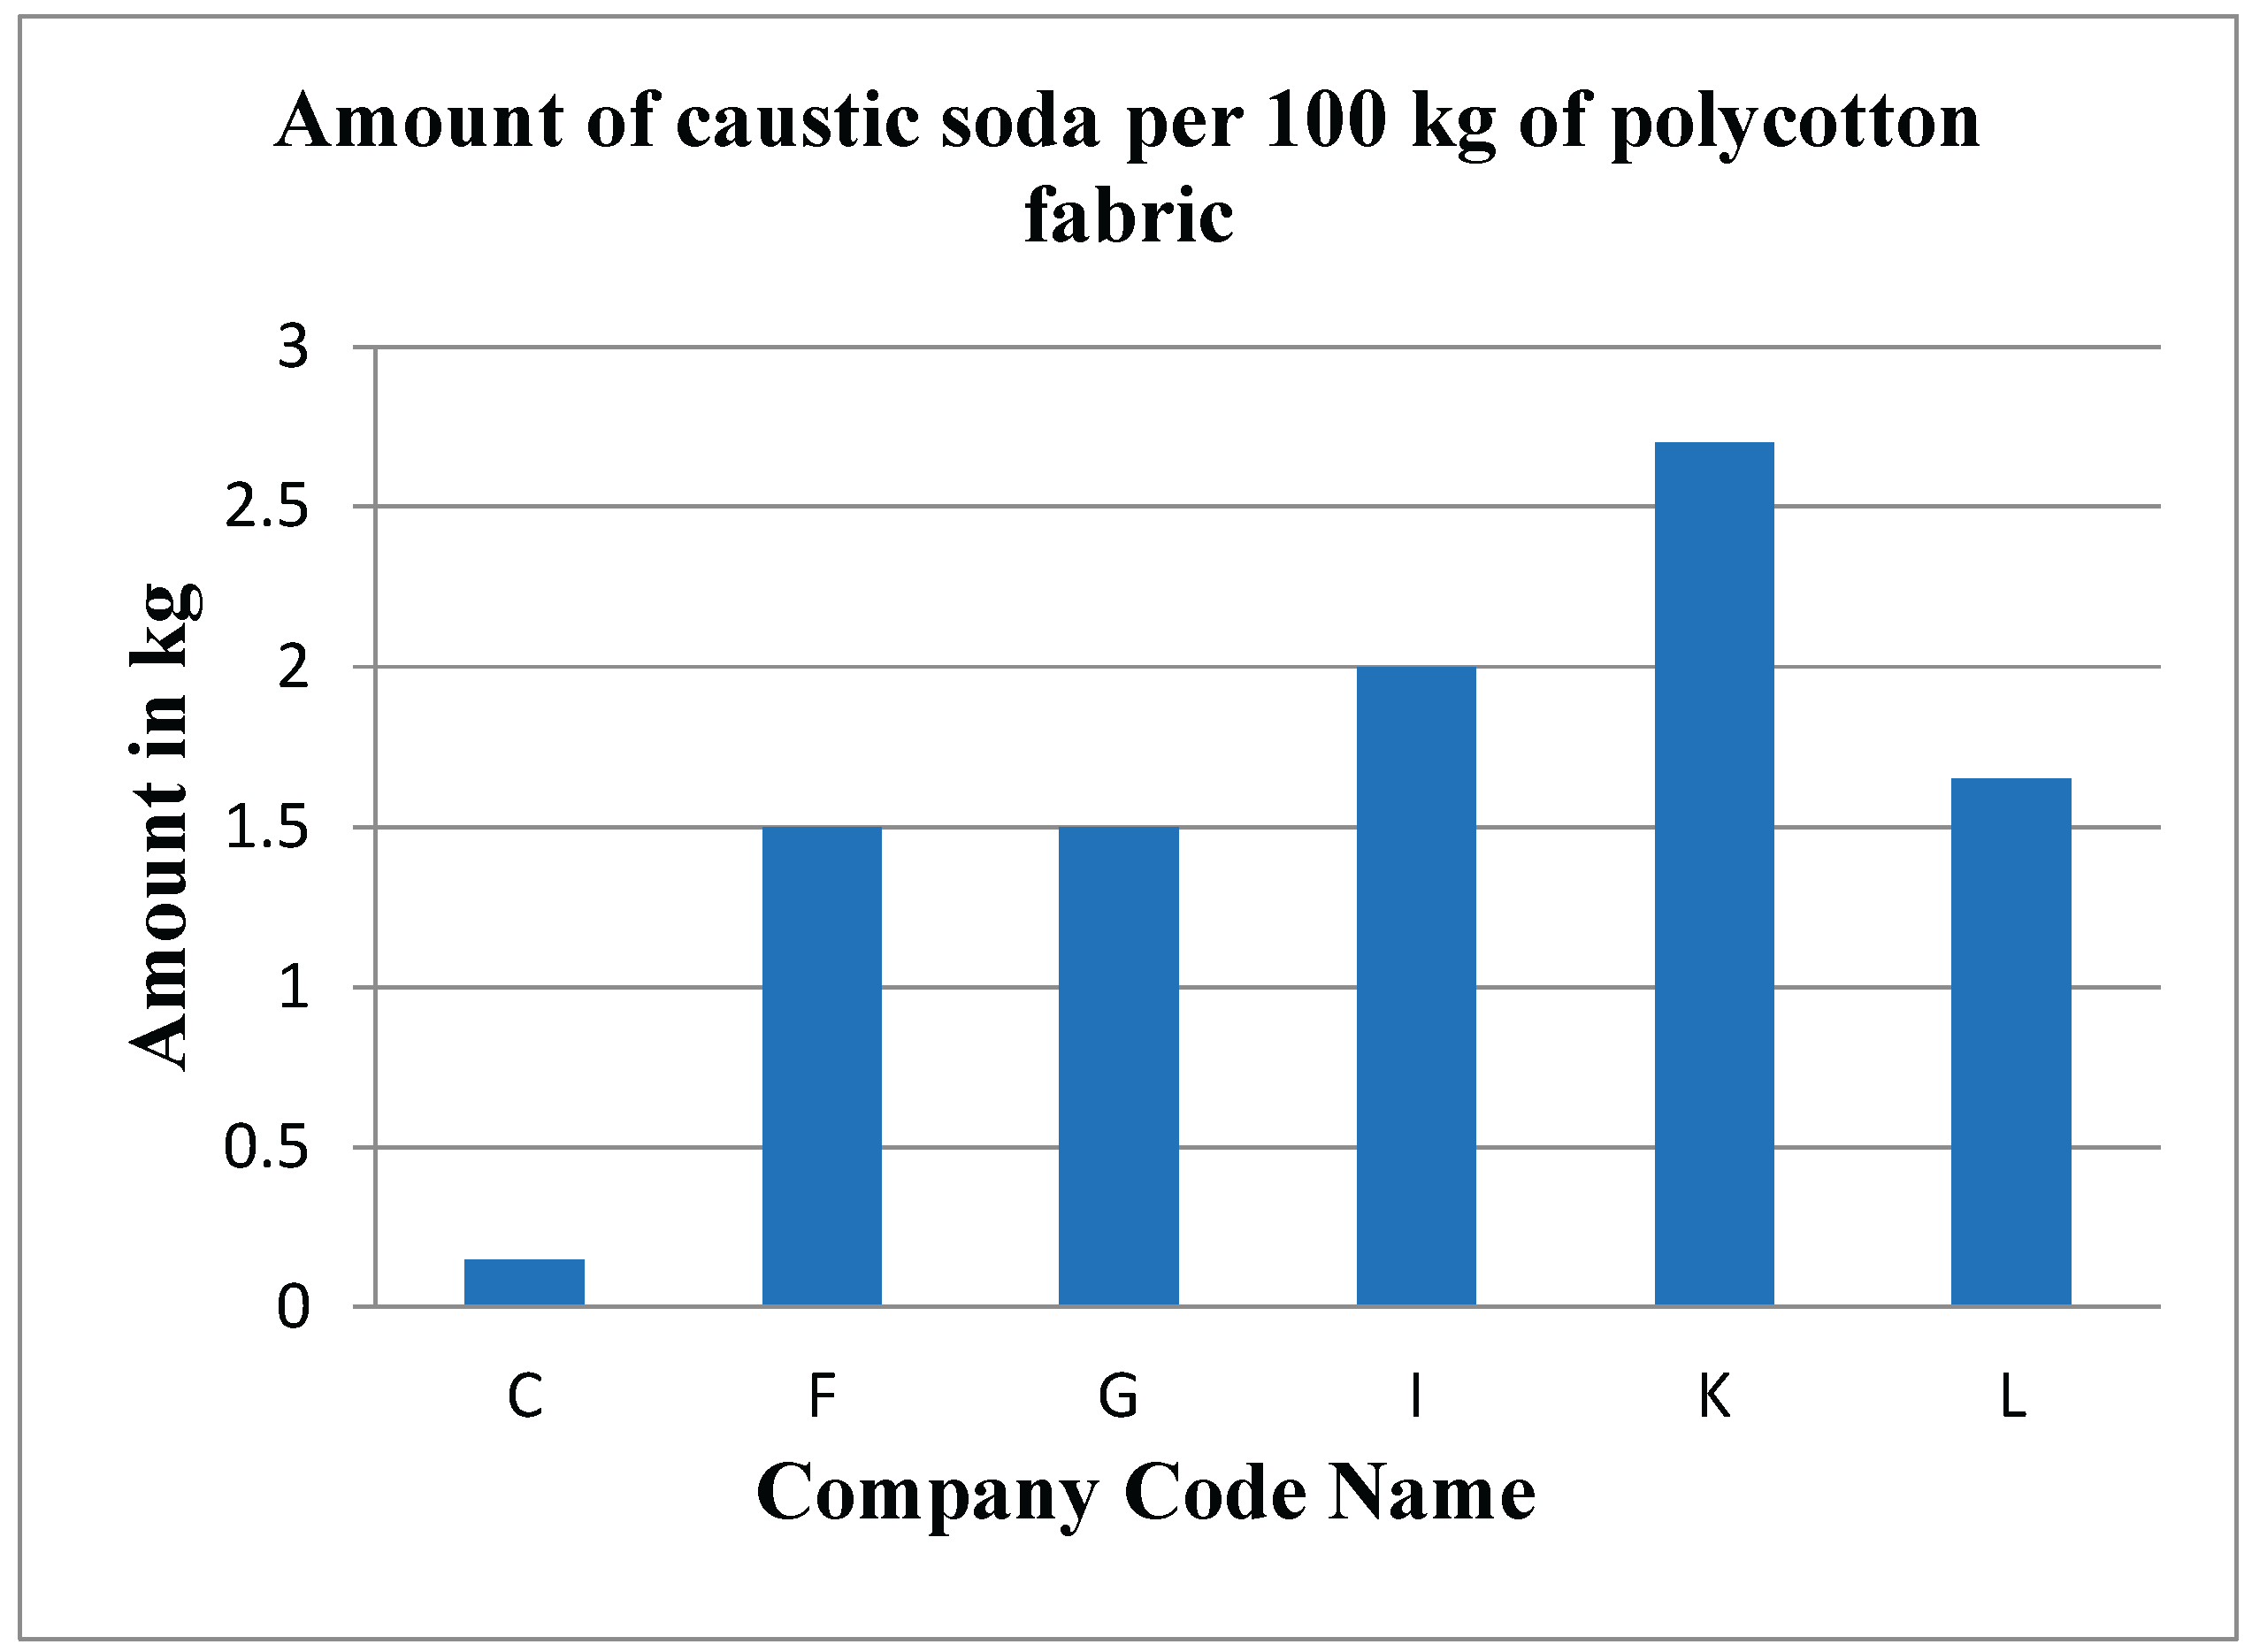
Figure 12.
Amount of Alkali used per 100 kg of polyester fabric by different companies.
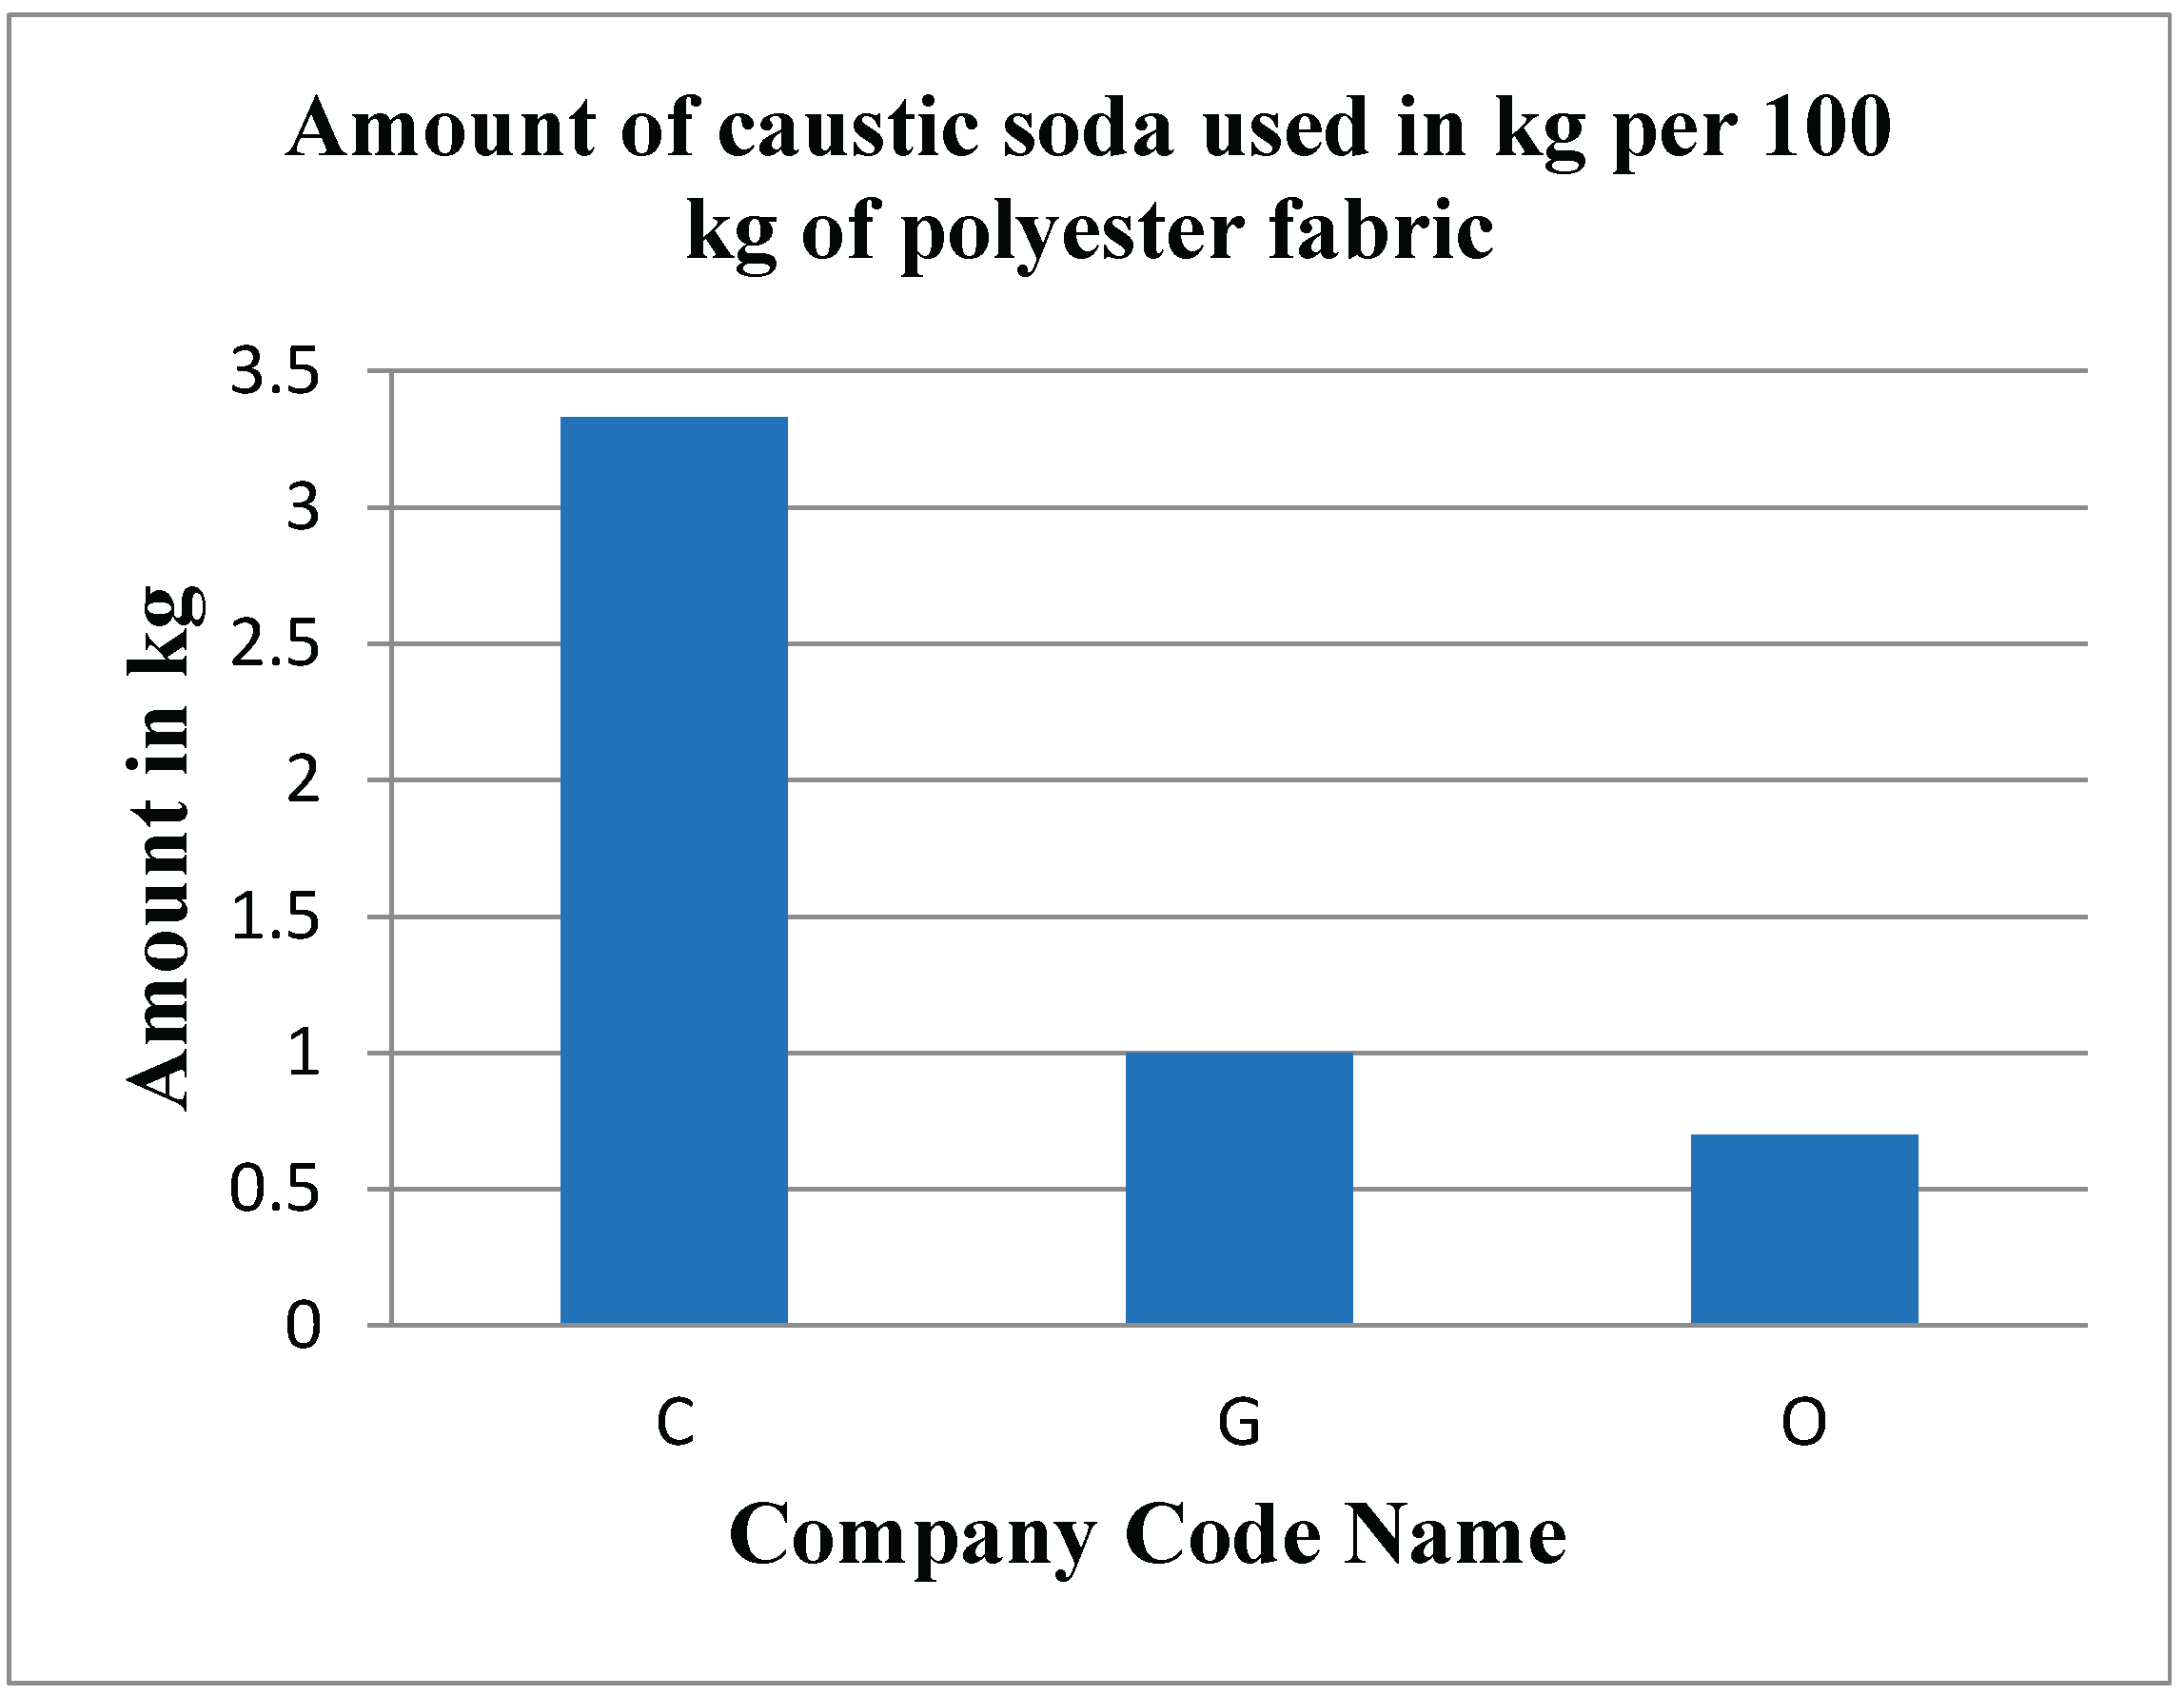
Figure 13.
Amount of H2O2 used per 100 kg of cotton fabric by different companies.
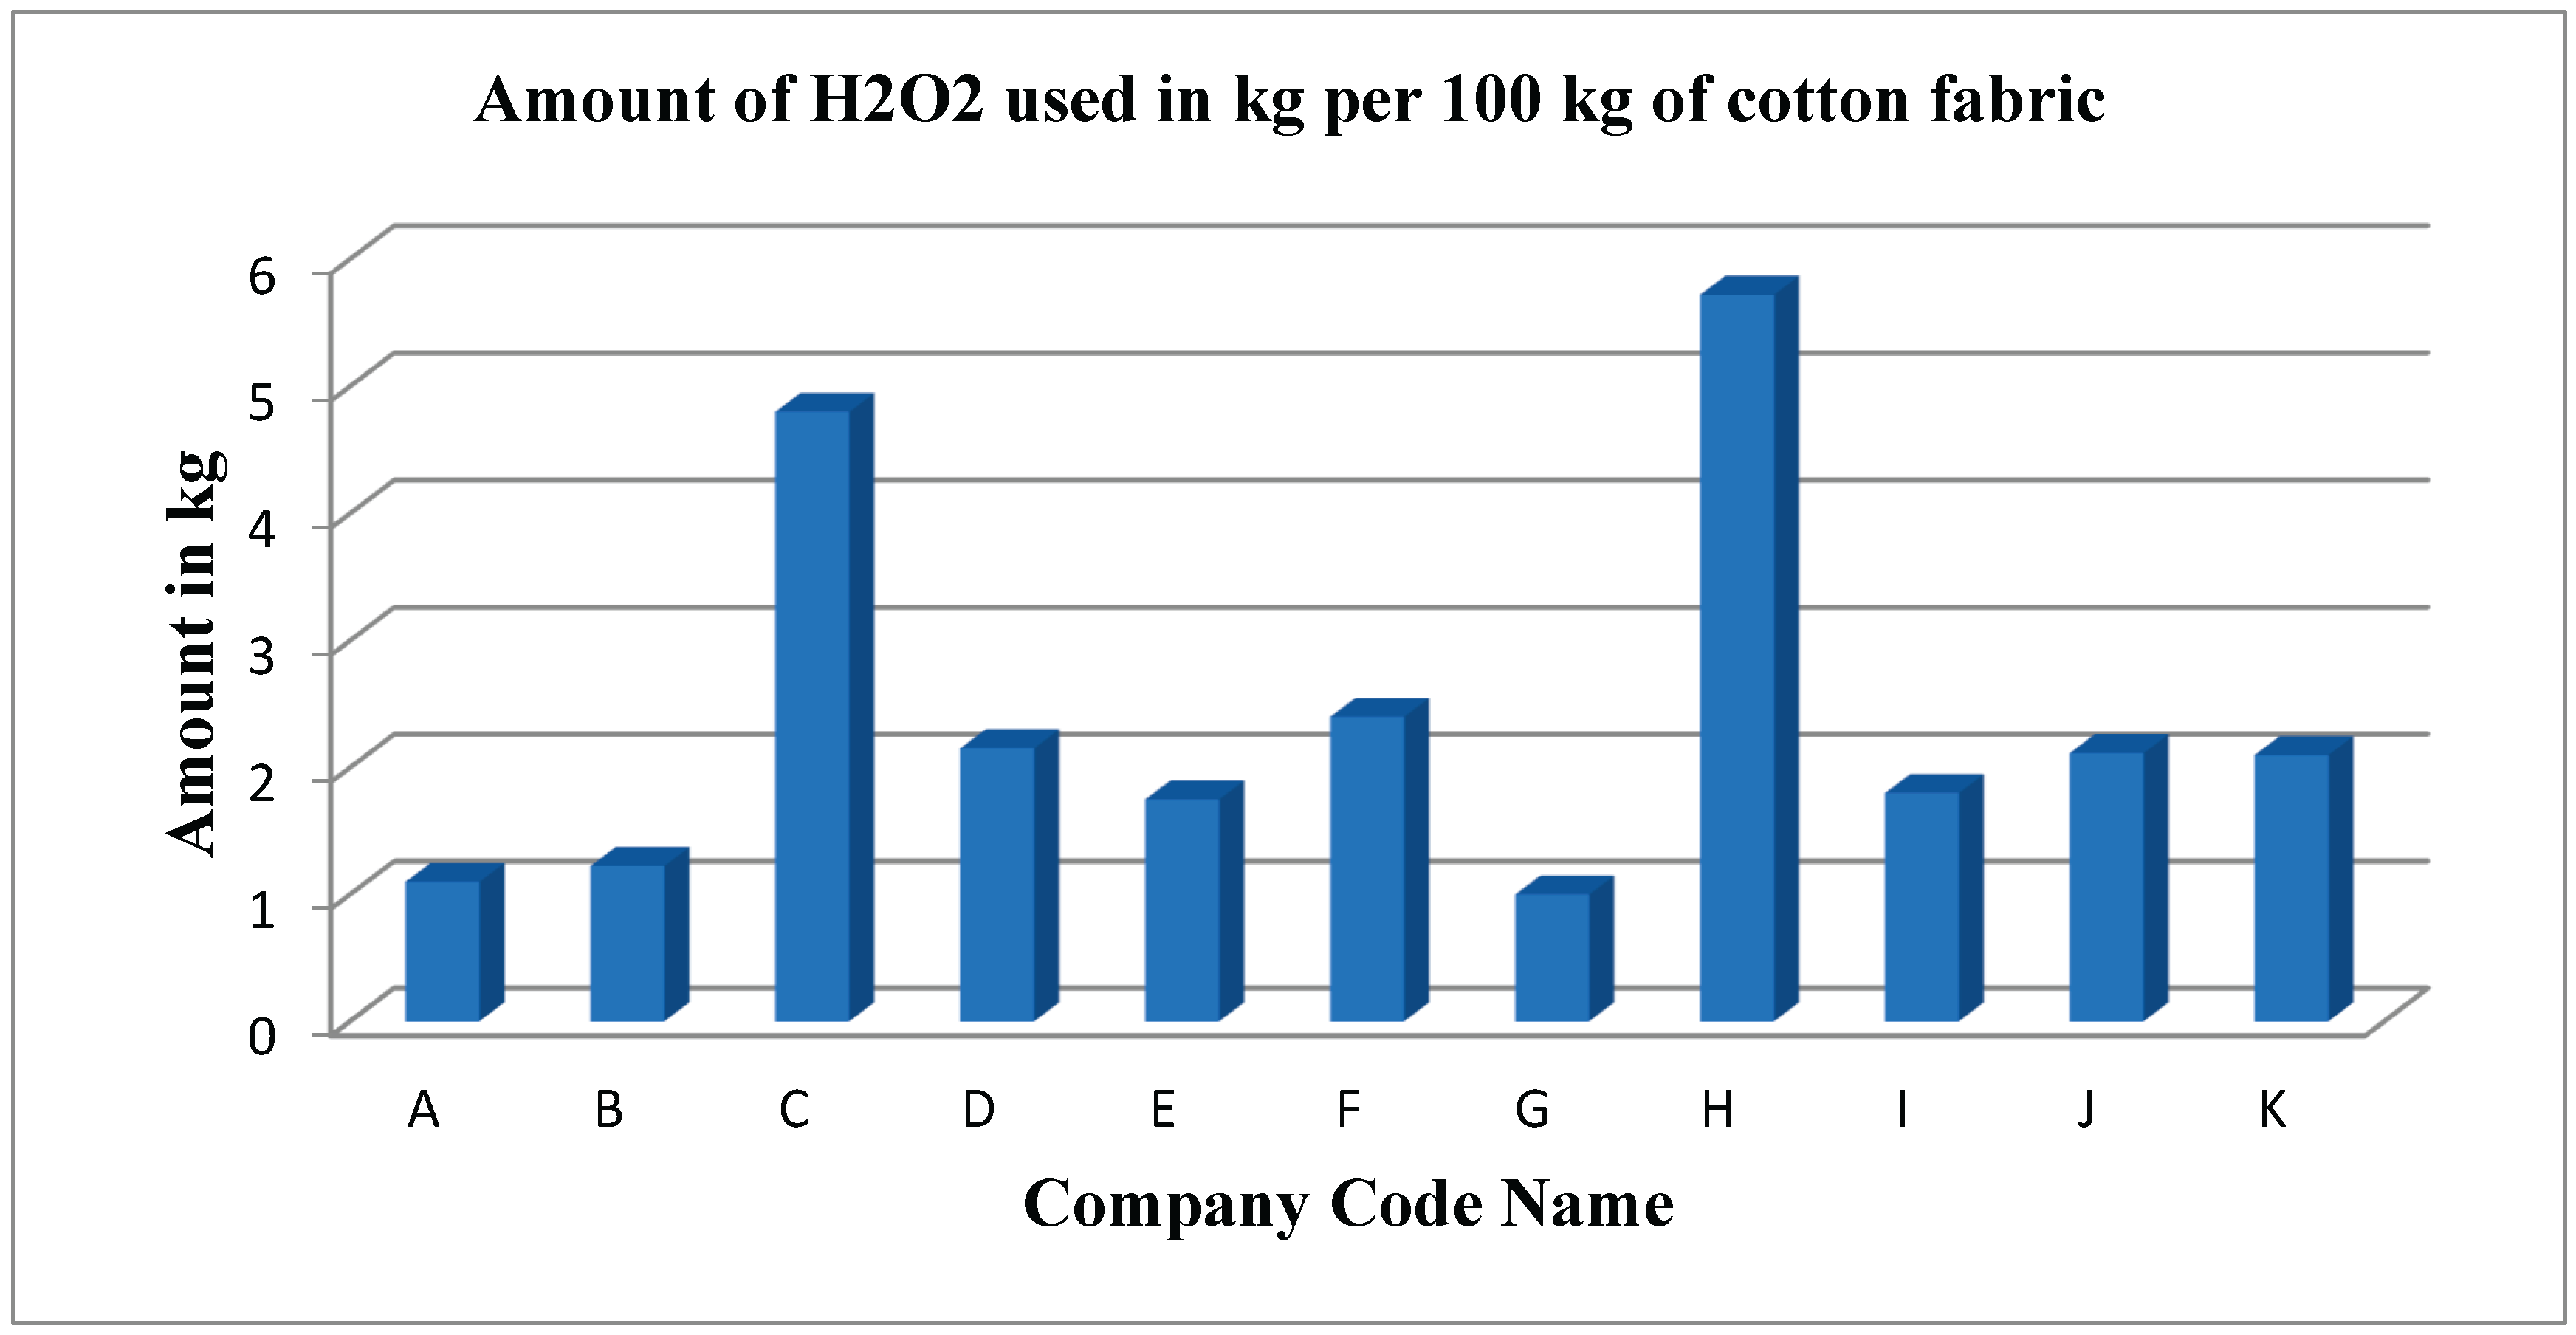
Figure 14.
Amount of H2O2 used per 100 kg of polycotton fabric by different companies.
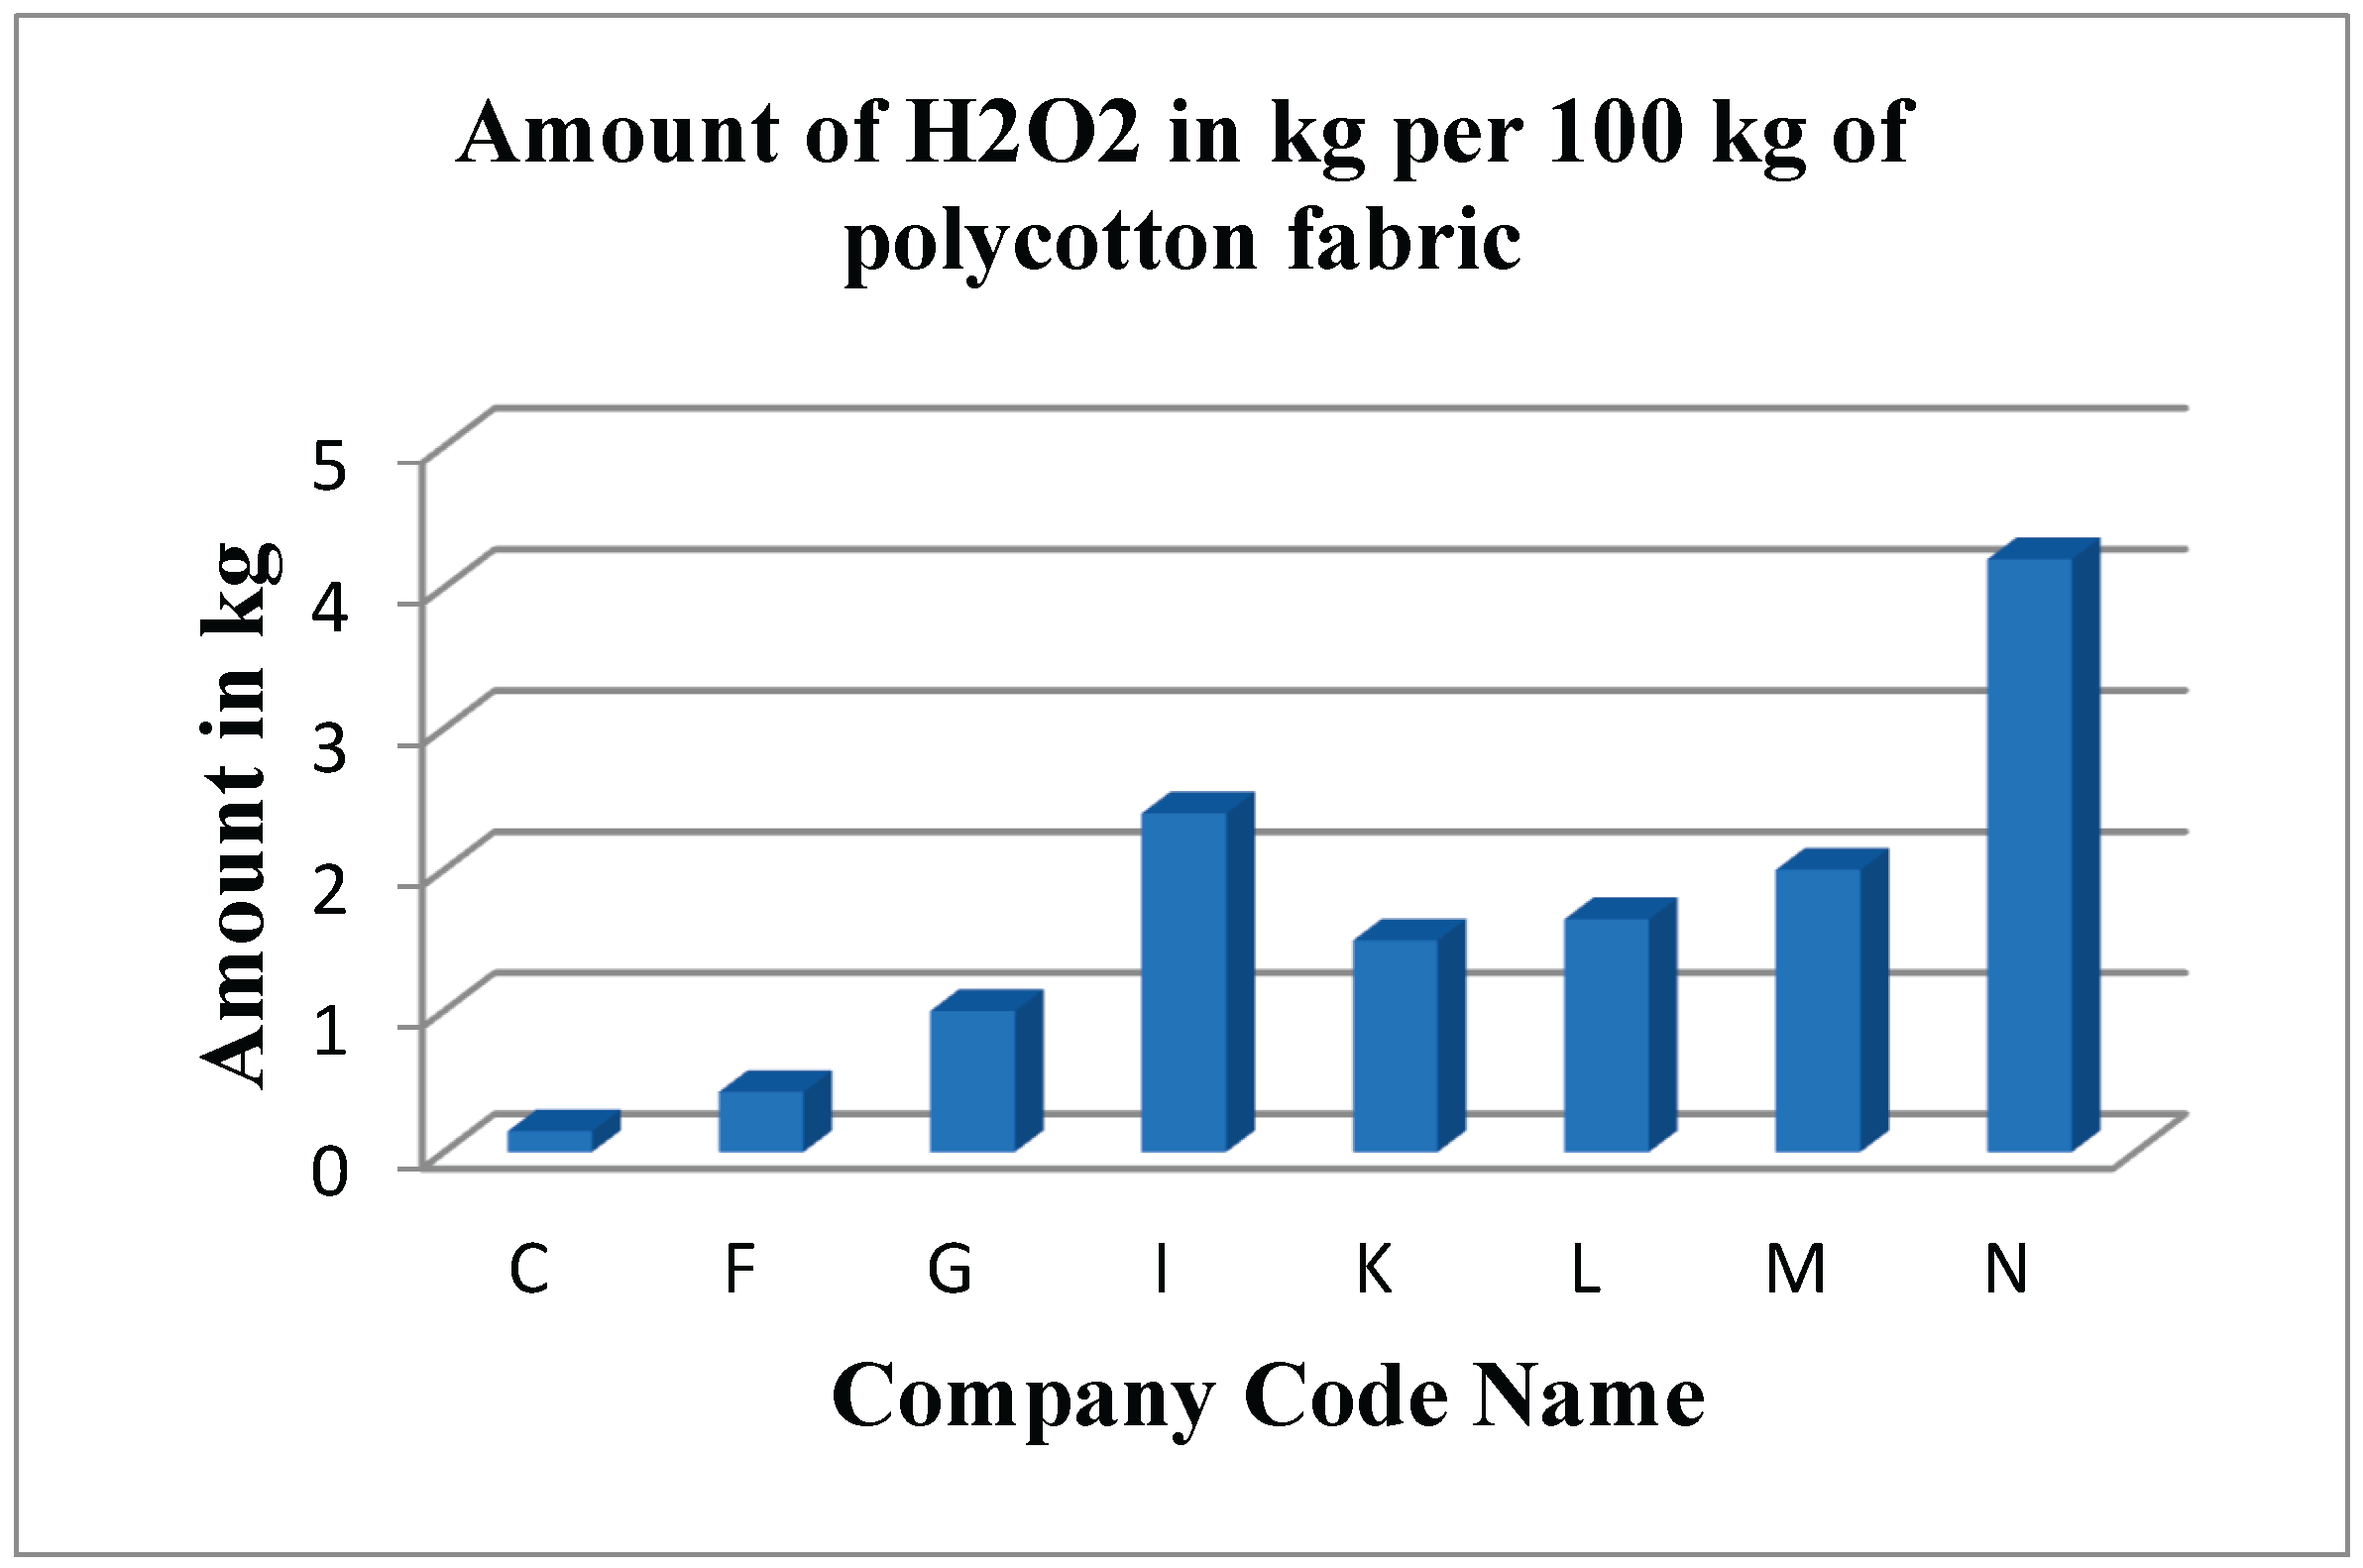
Figure 15.
Amount of Acid Buffer used per 100 kg of cotton fabrics in different companies.
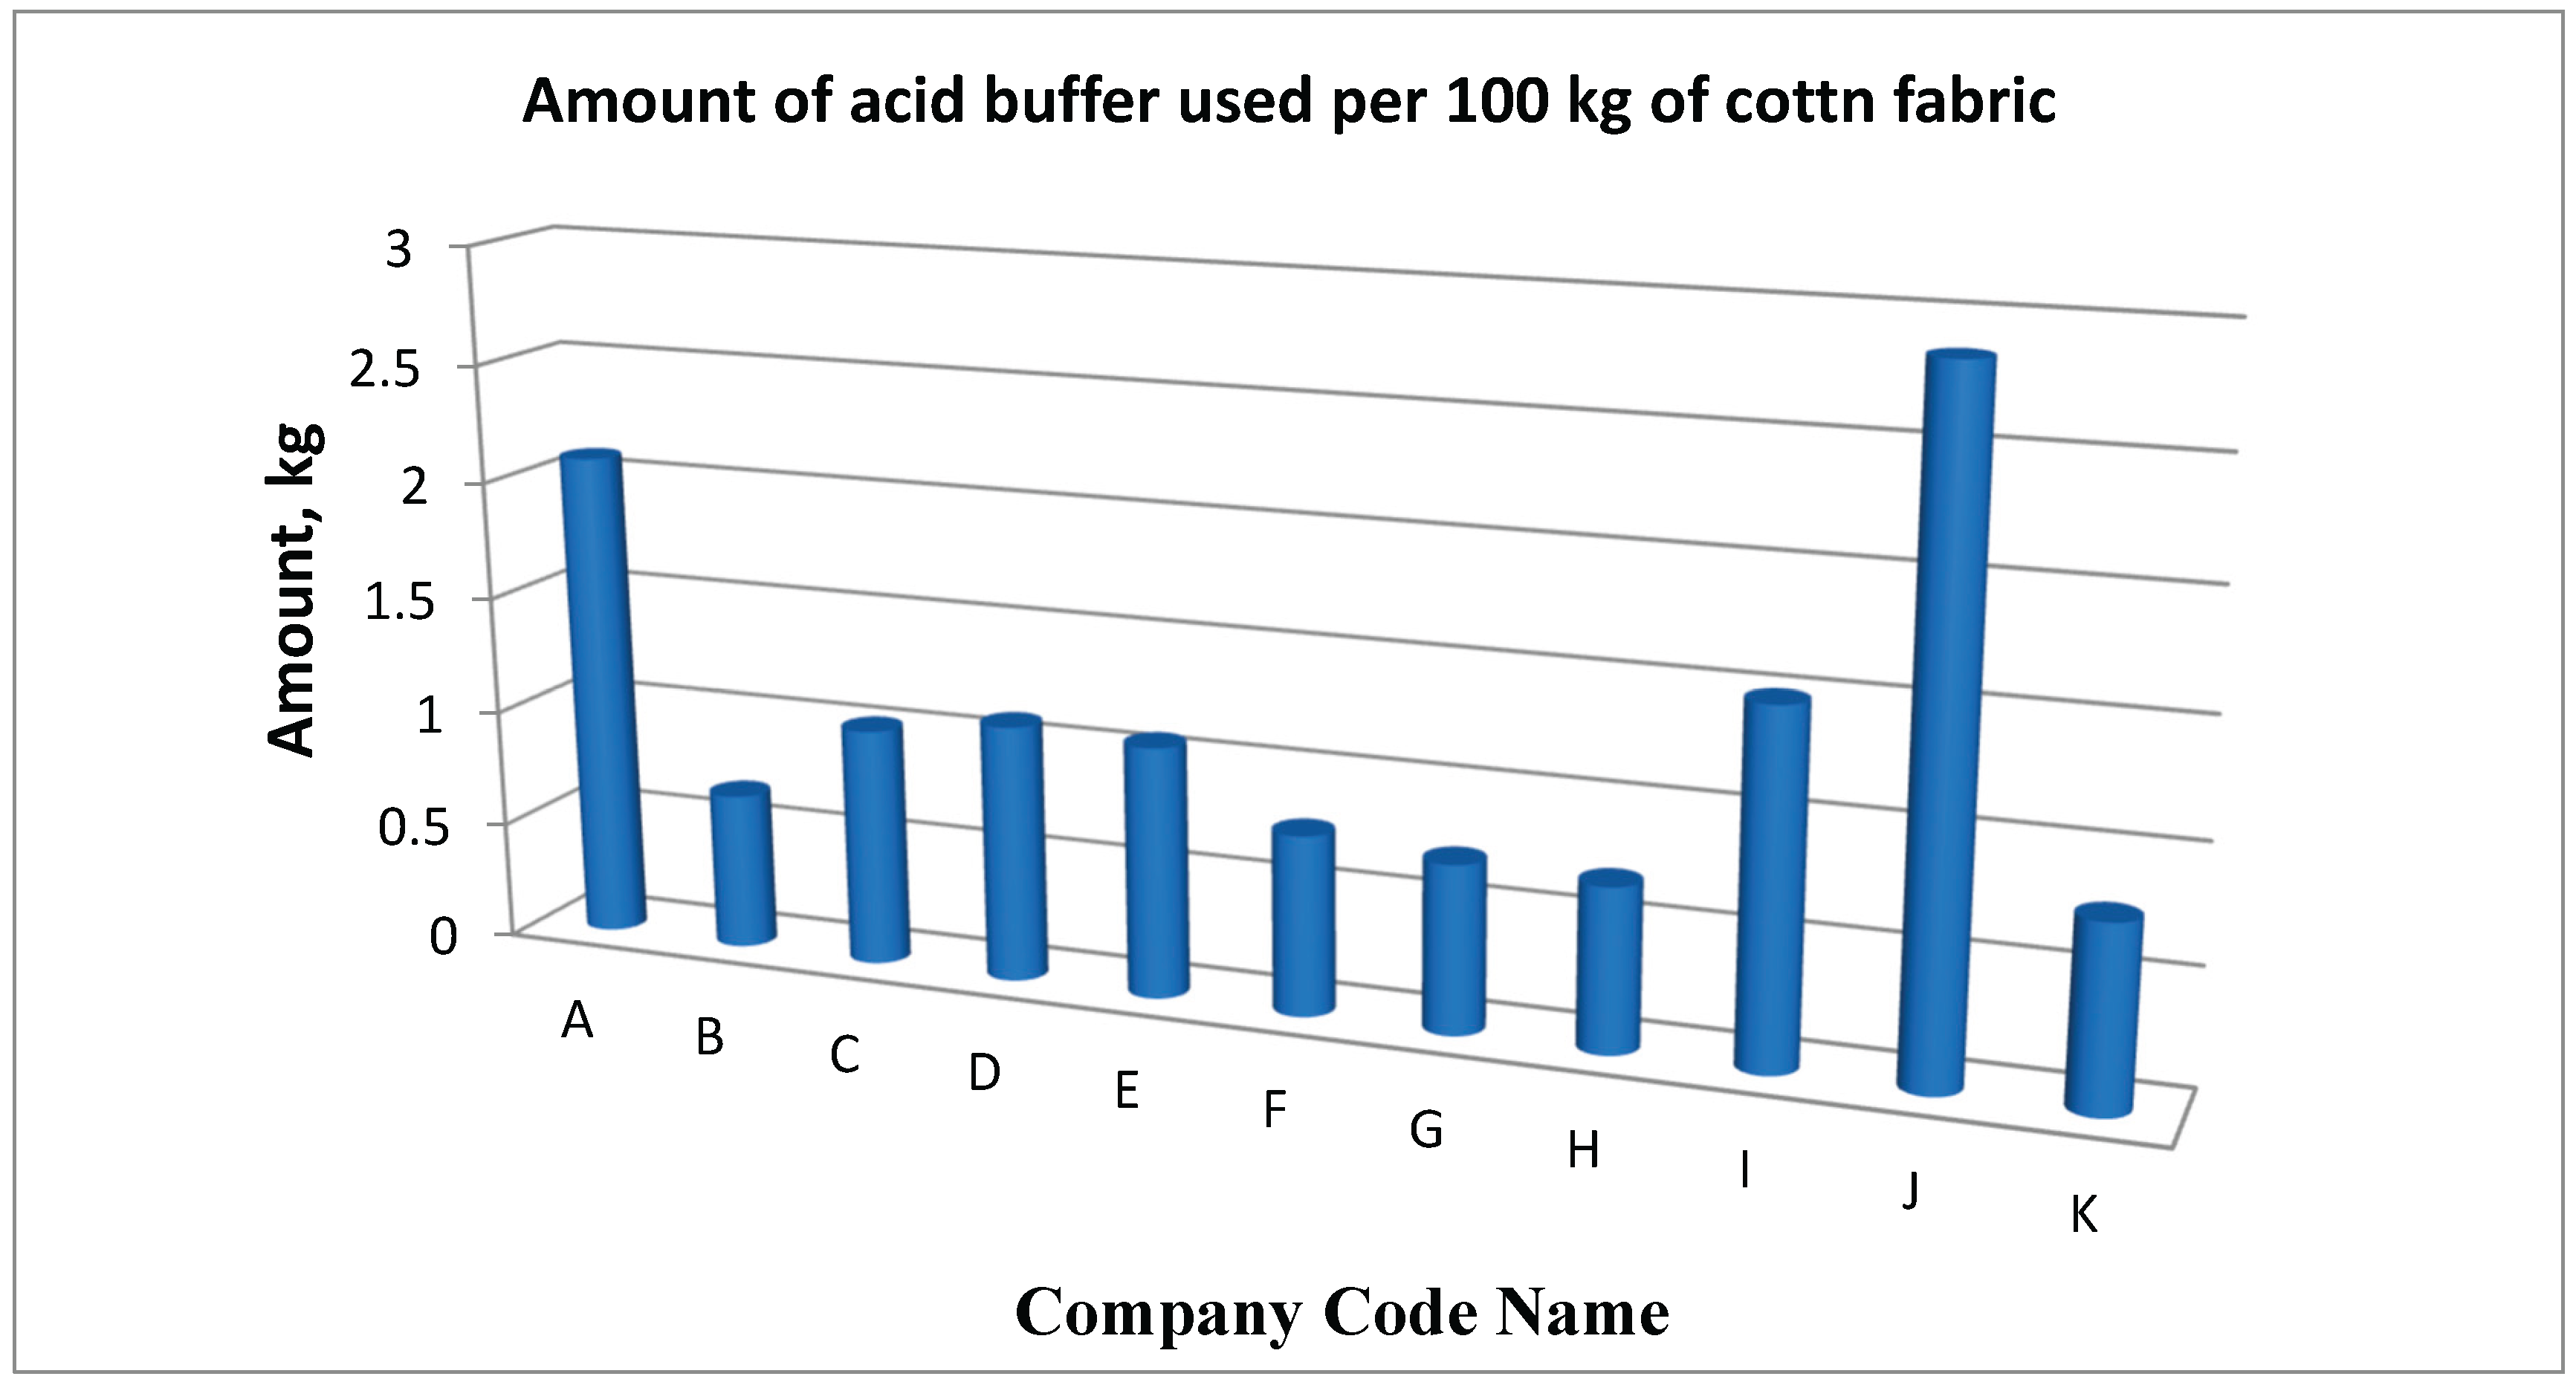
Figure 16.
Amount of Acid Buffer used per 100 kg of polycotton fabric in different companies.
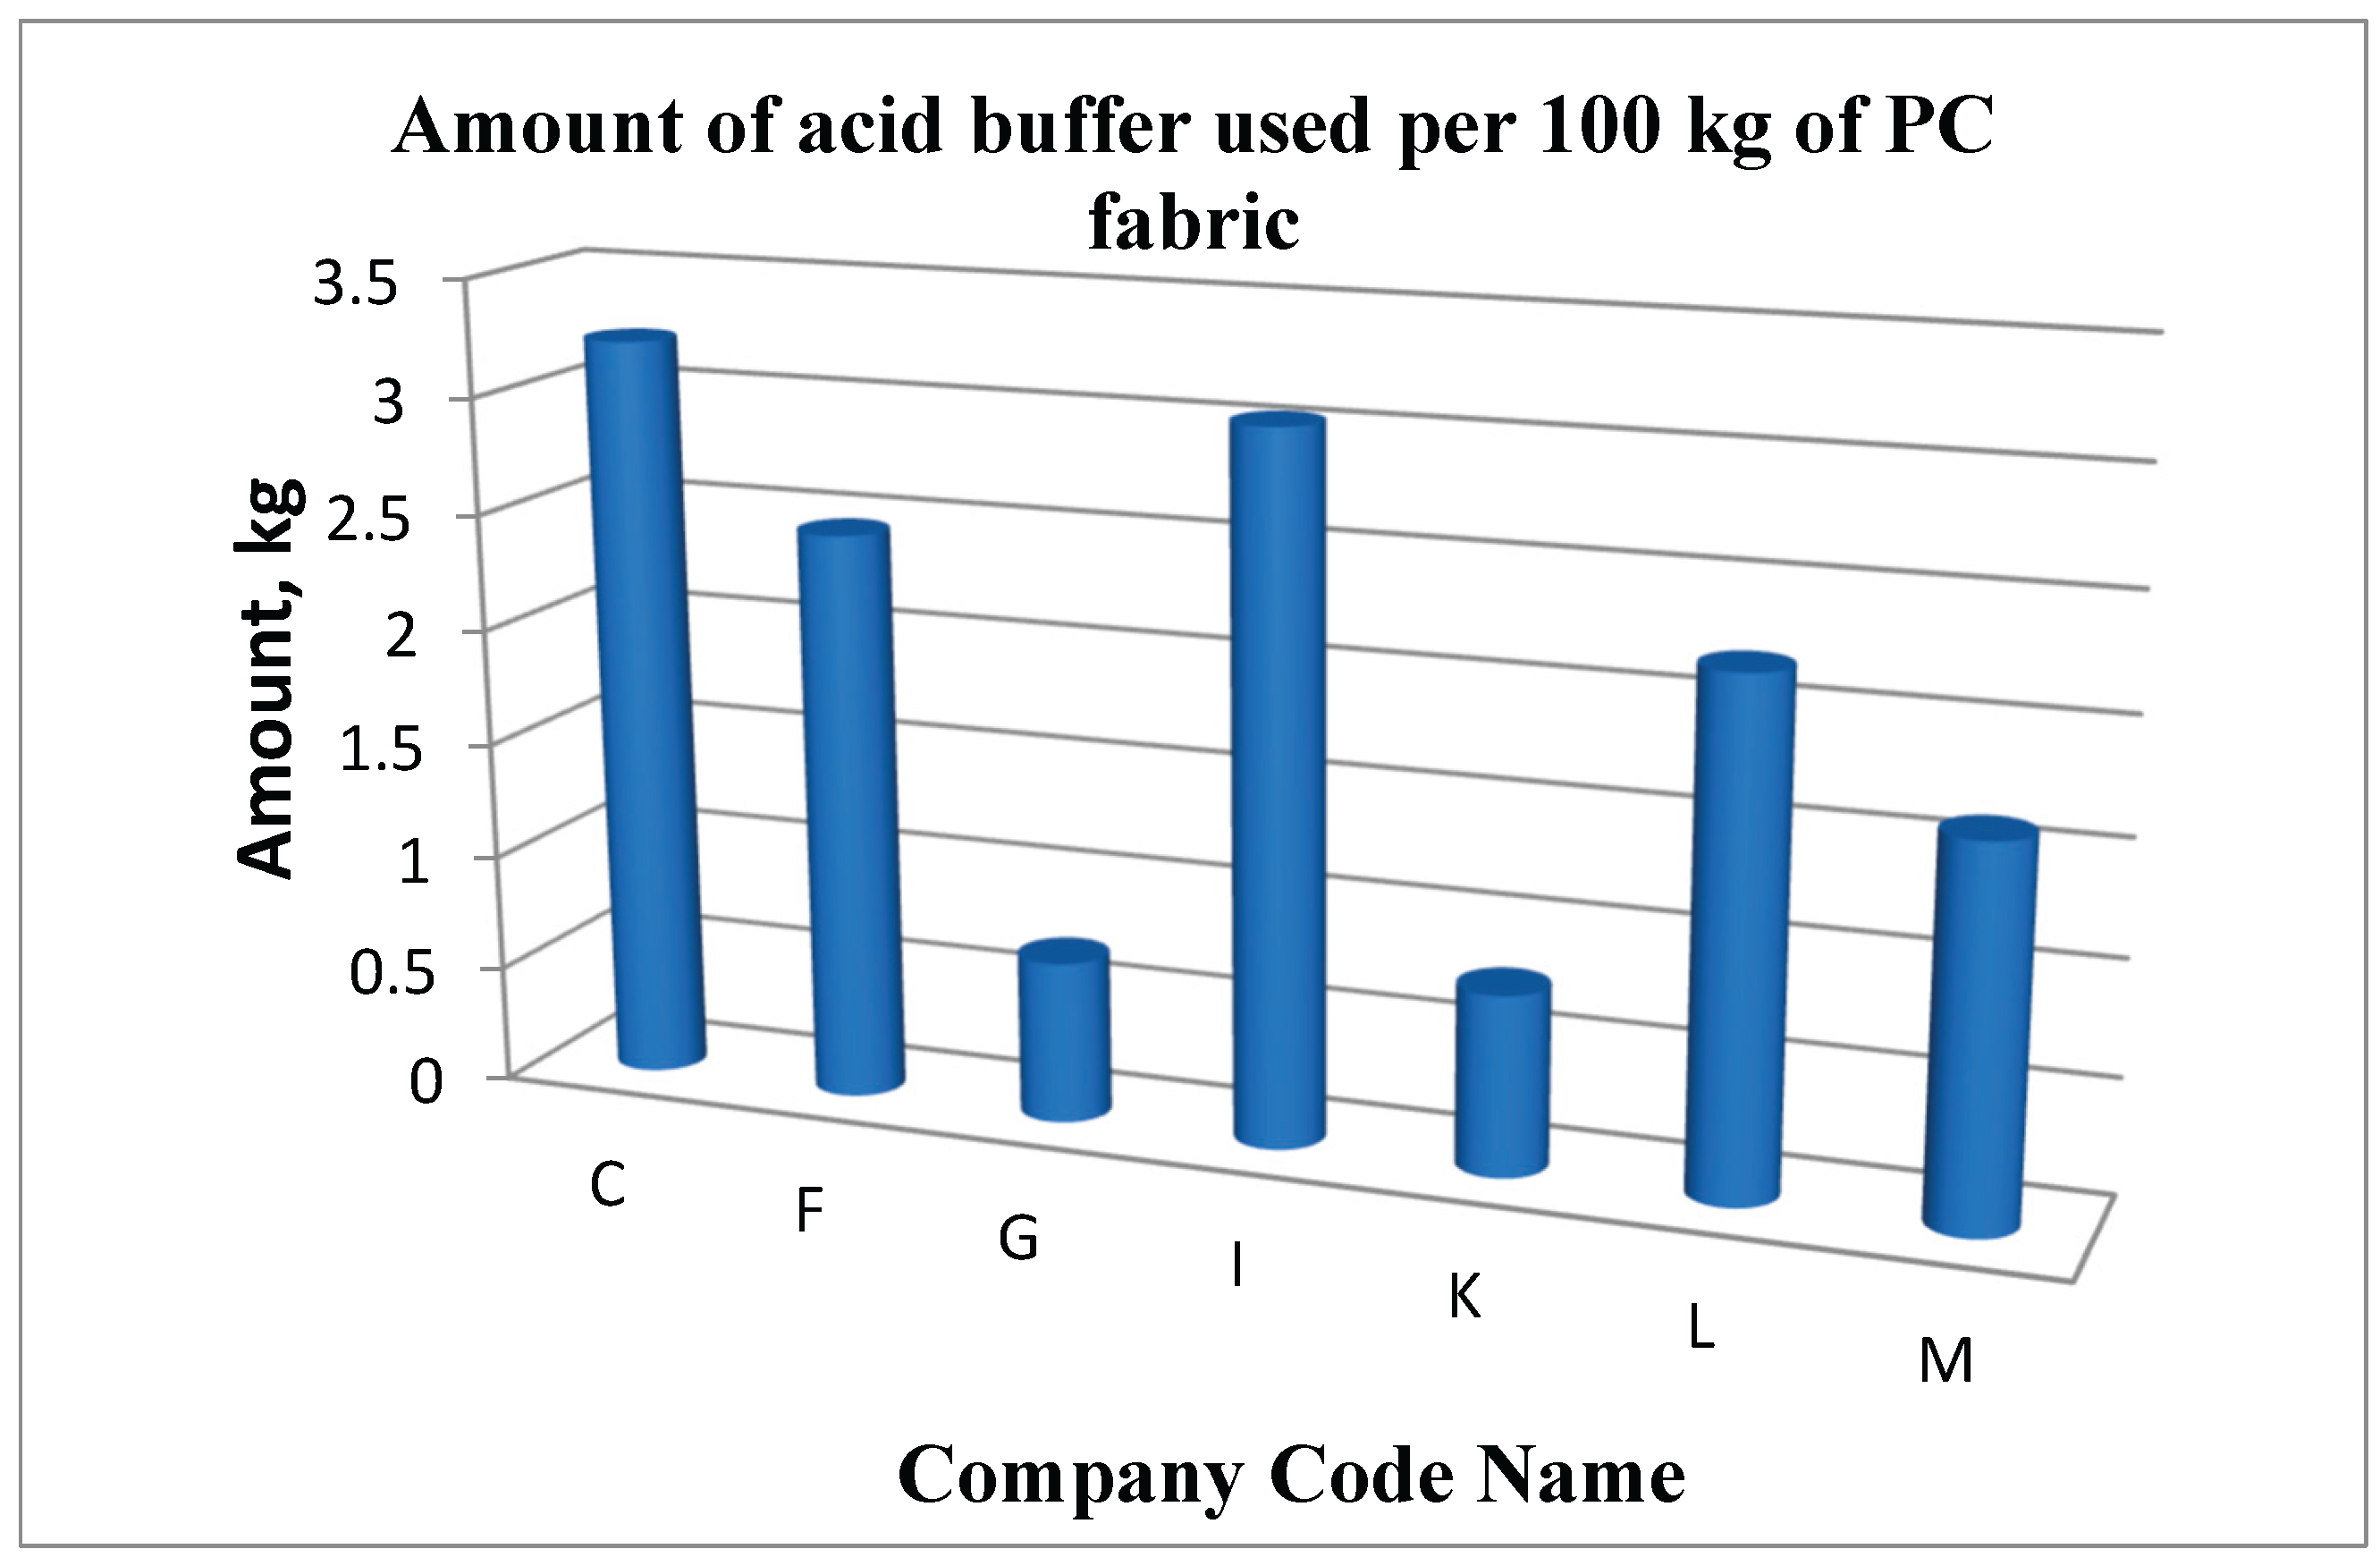
Figure 17.
Amount of Acid Buffer used per 100 kg of polyester fabric by different companies.
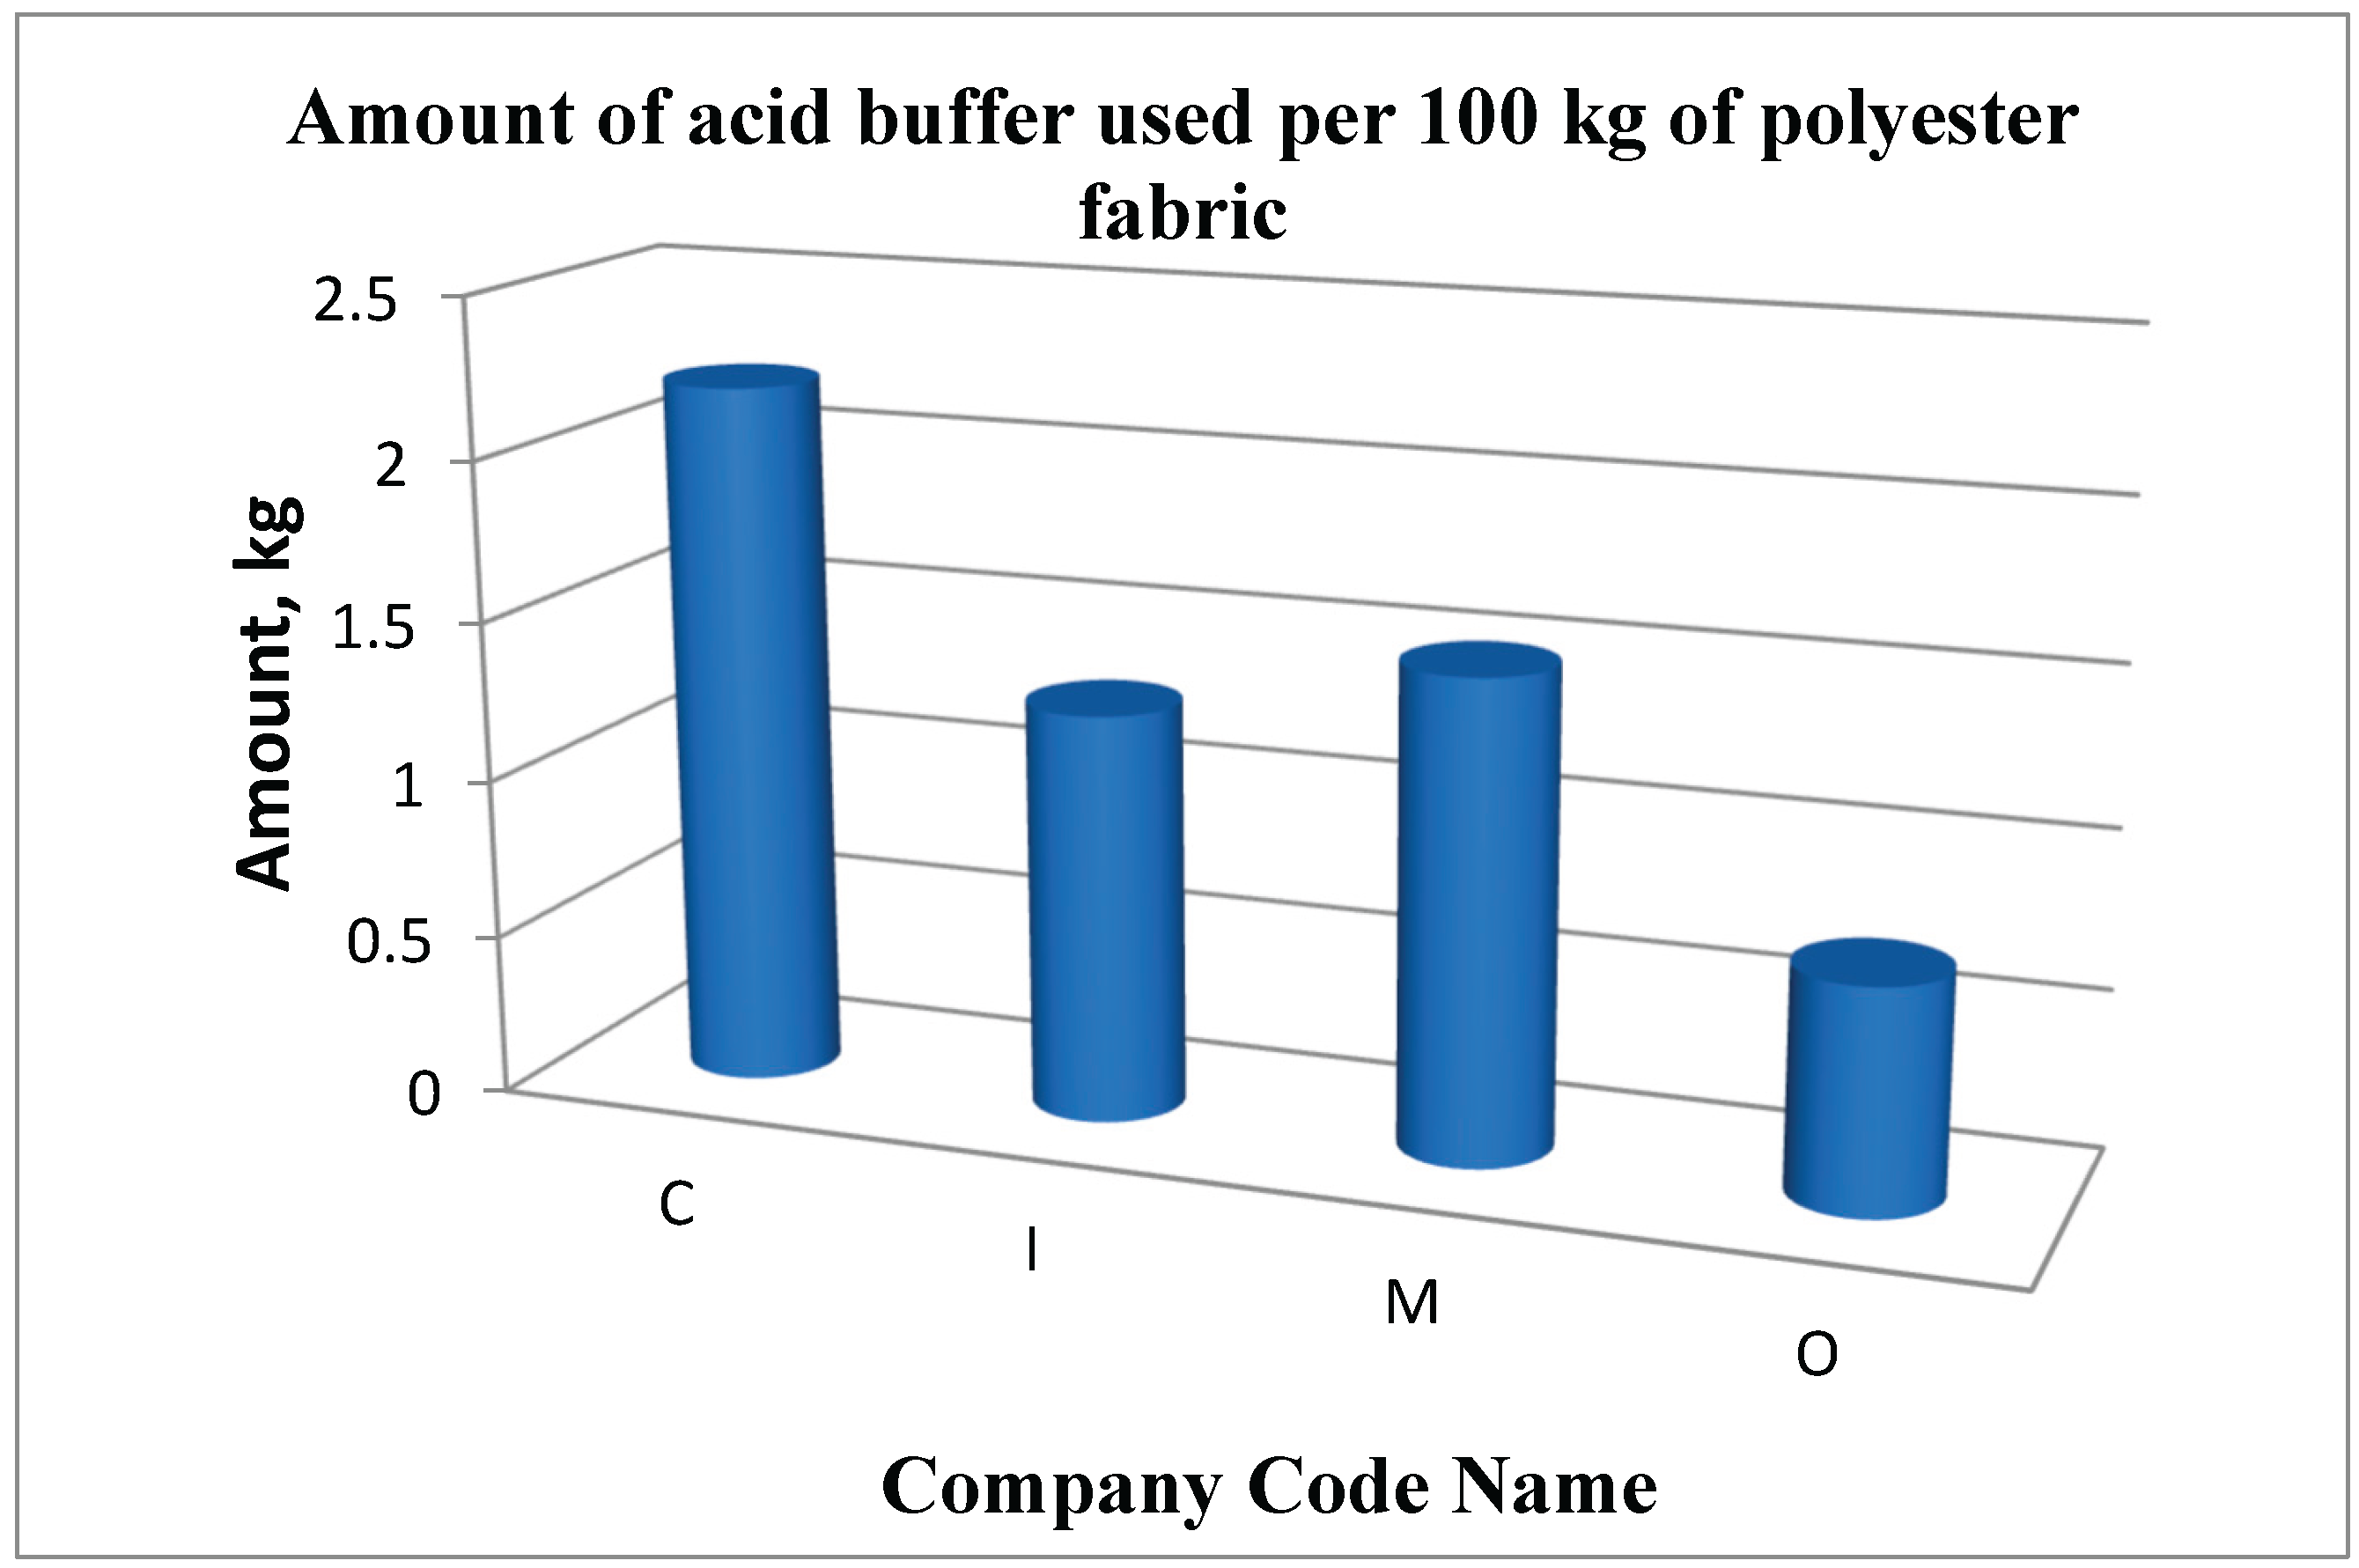
Figure 18.
Amount of Enzyme used per 100 kg of cotton fabric by different companies.
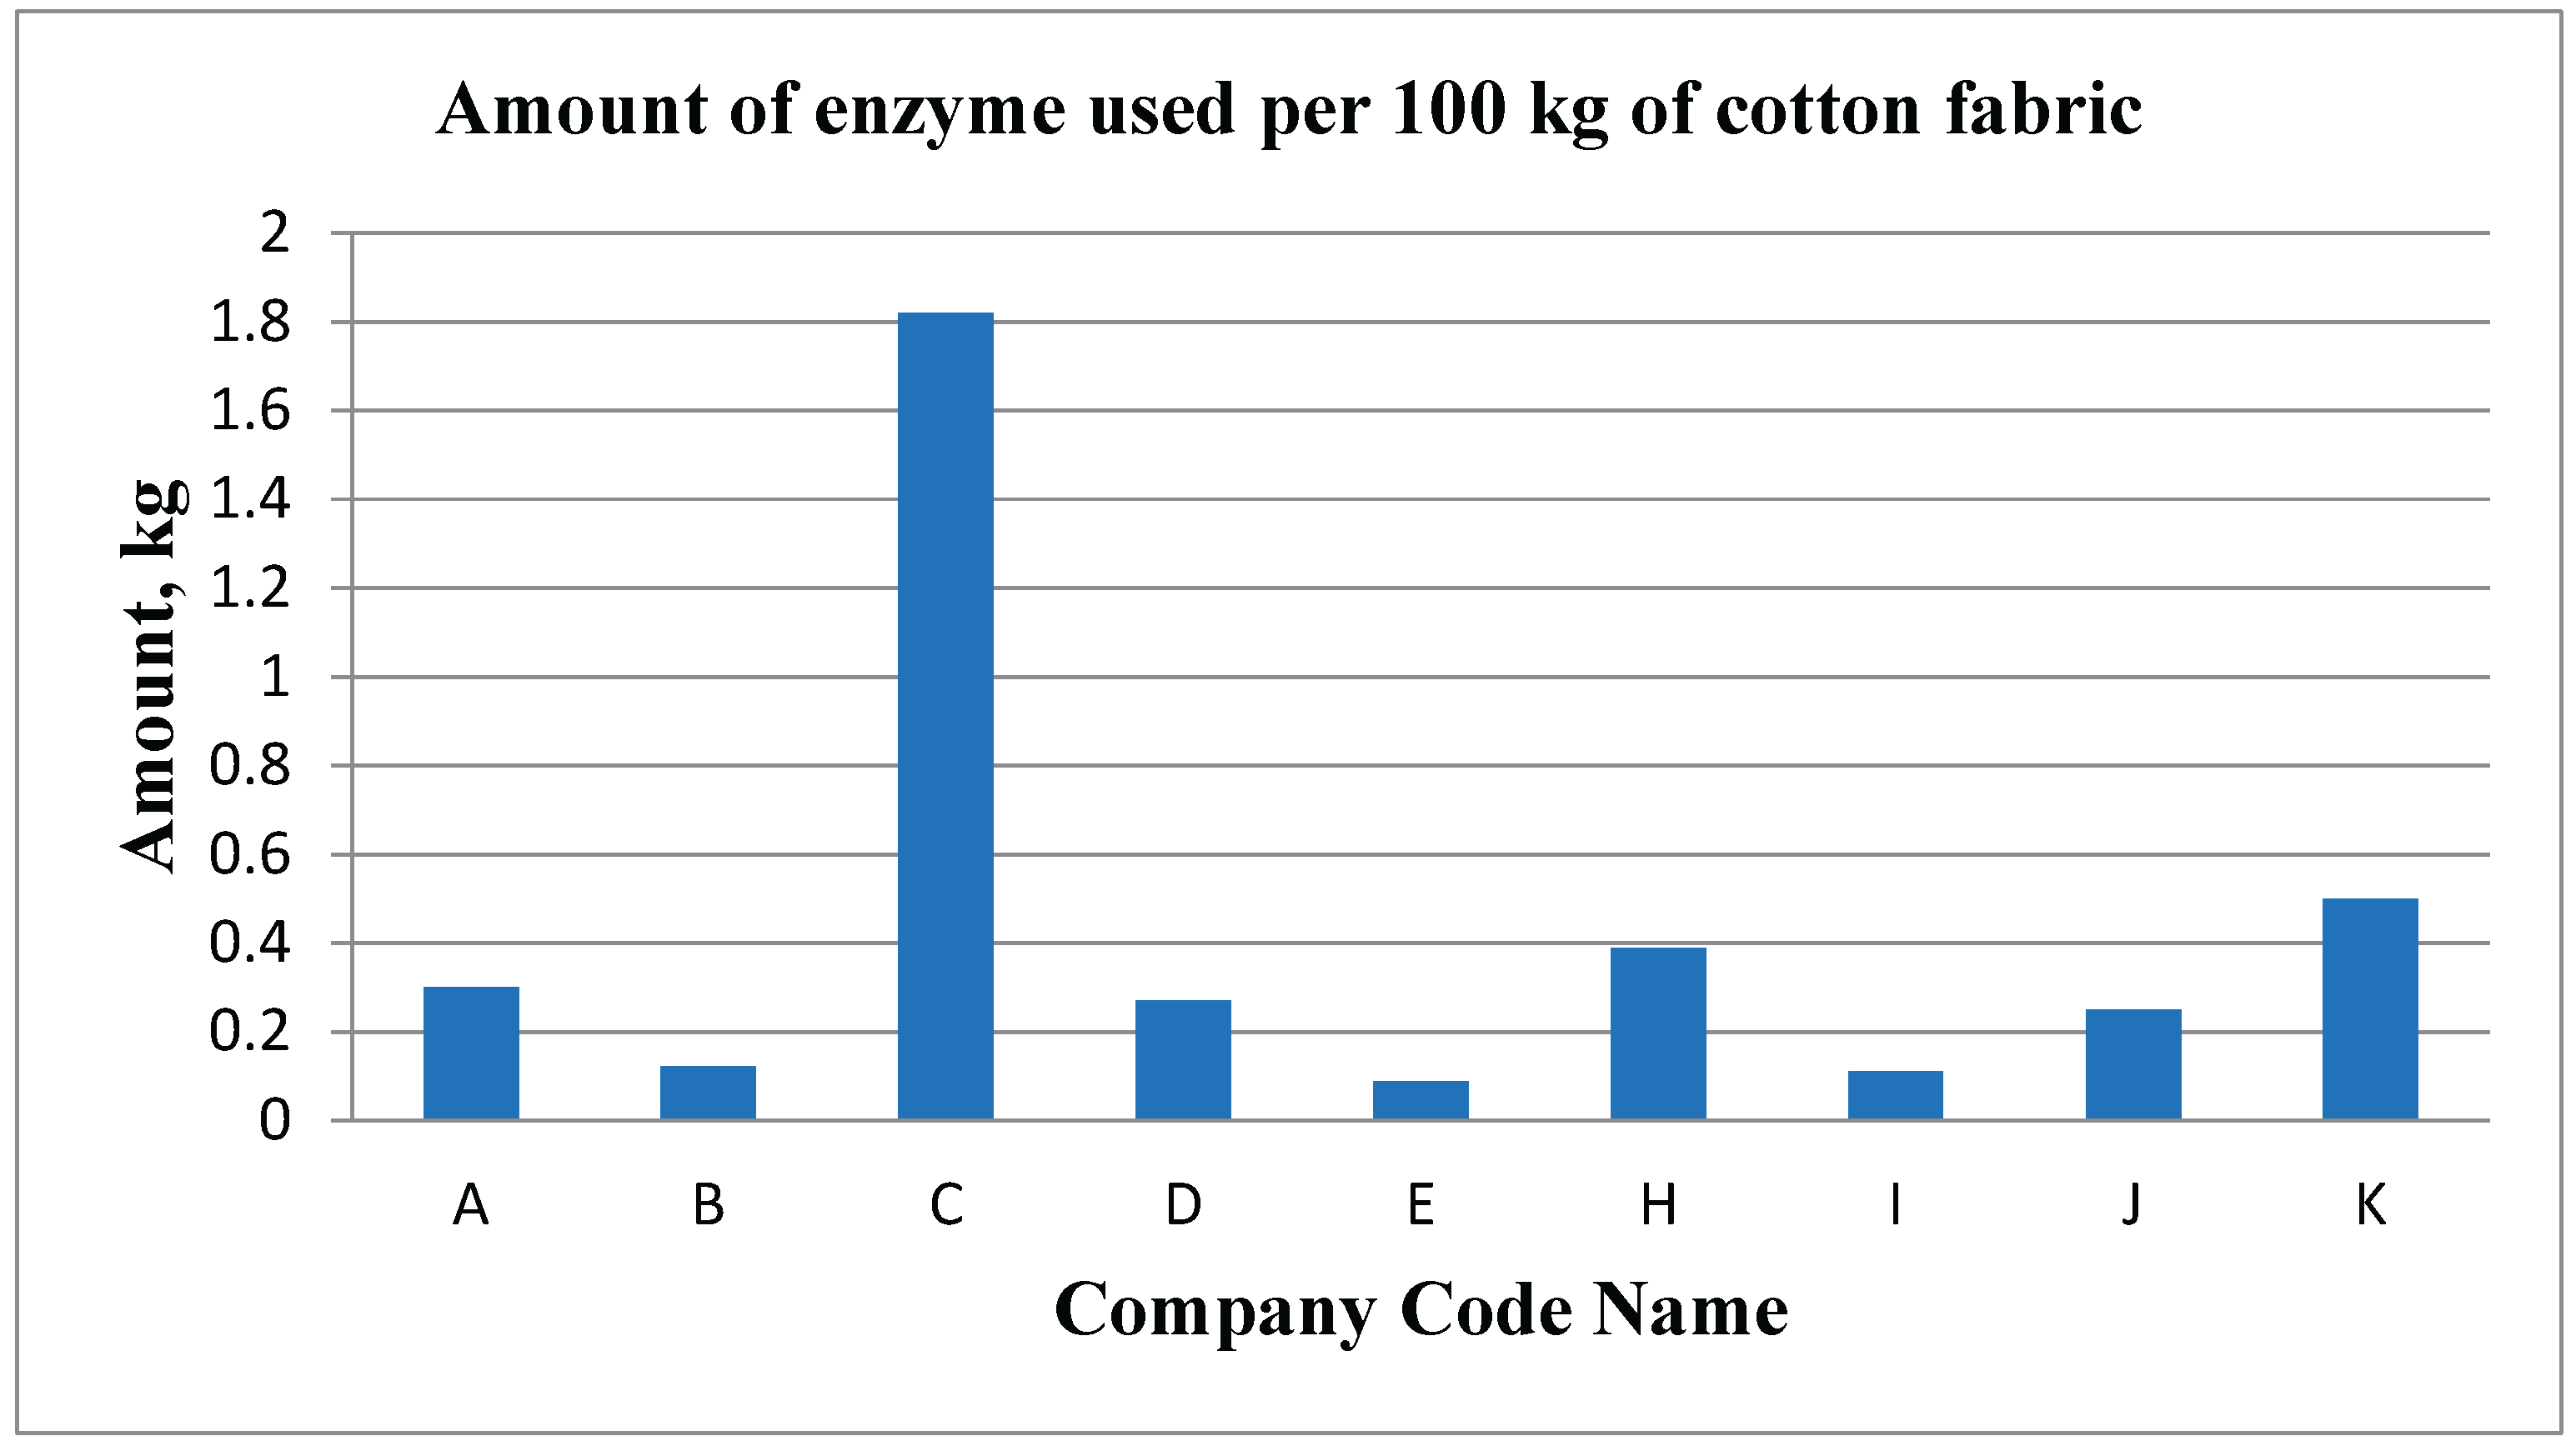
Figure 19.
Amount of Enzyme used per 100 kg of polycotton fabric by different companies.
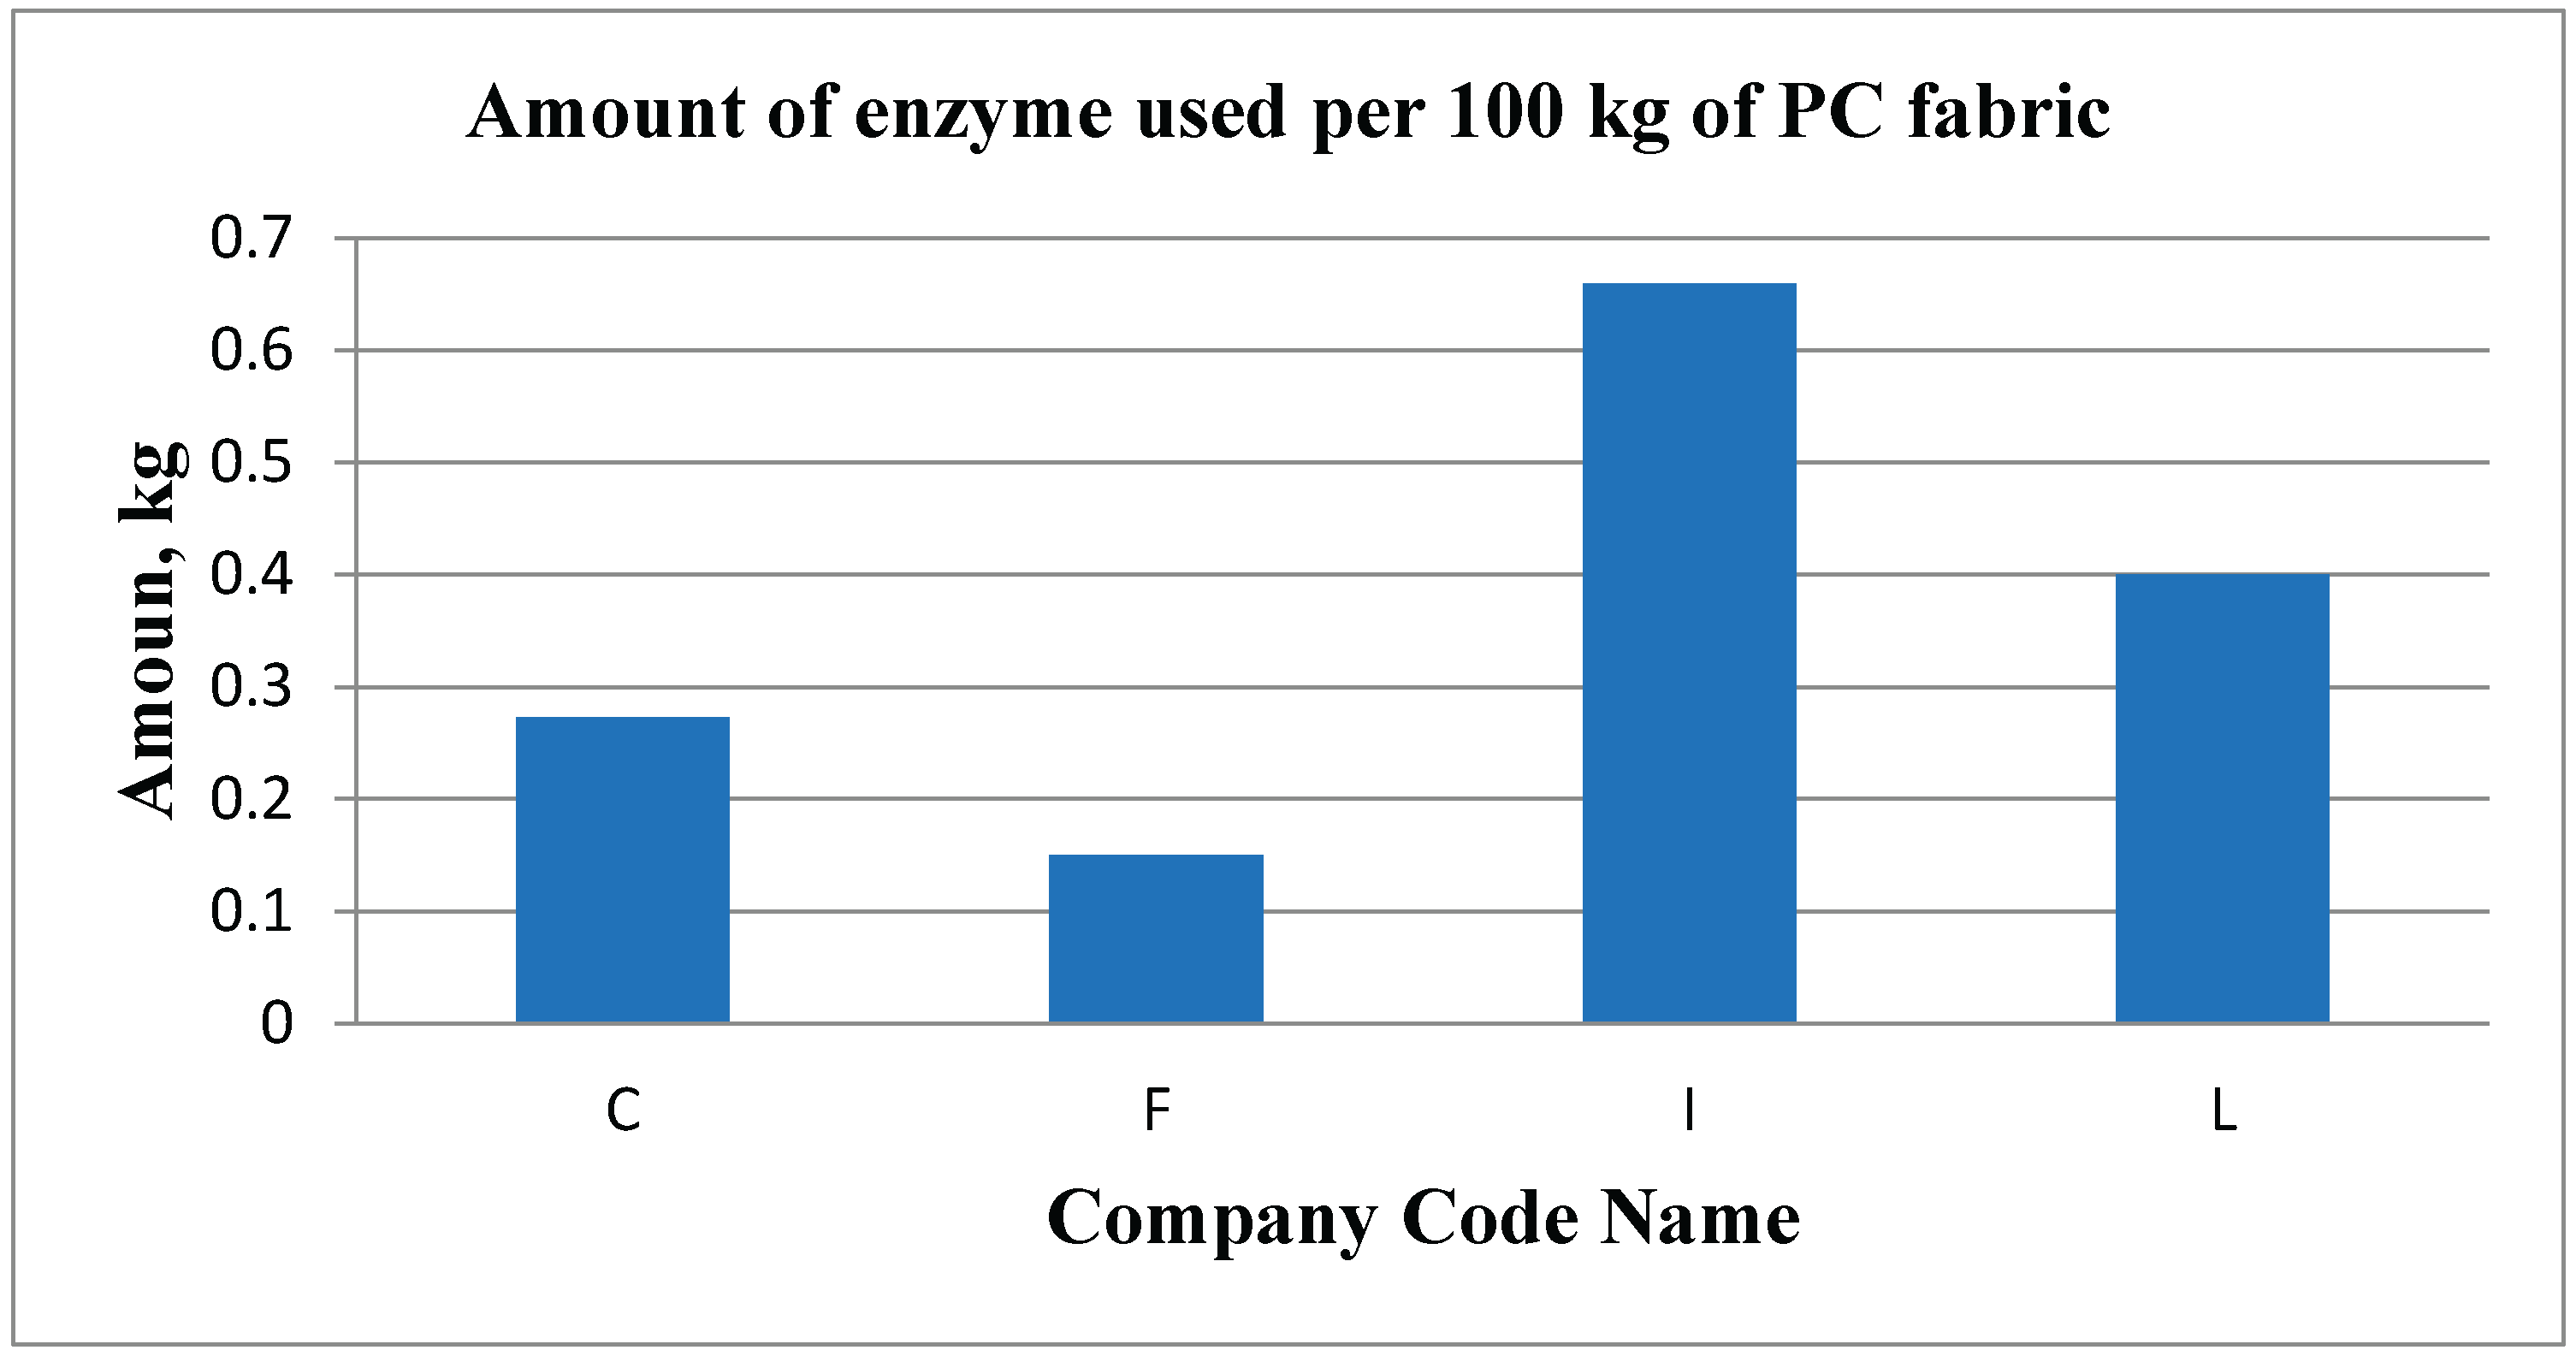
Figure 20.
The Amount of Glauber Salt used per 100 kg of cotton fabric by different companies.
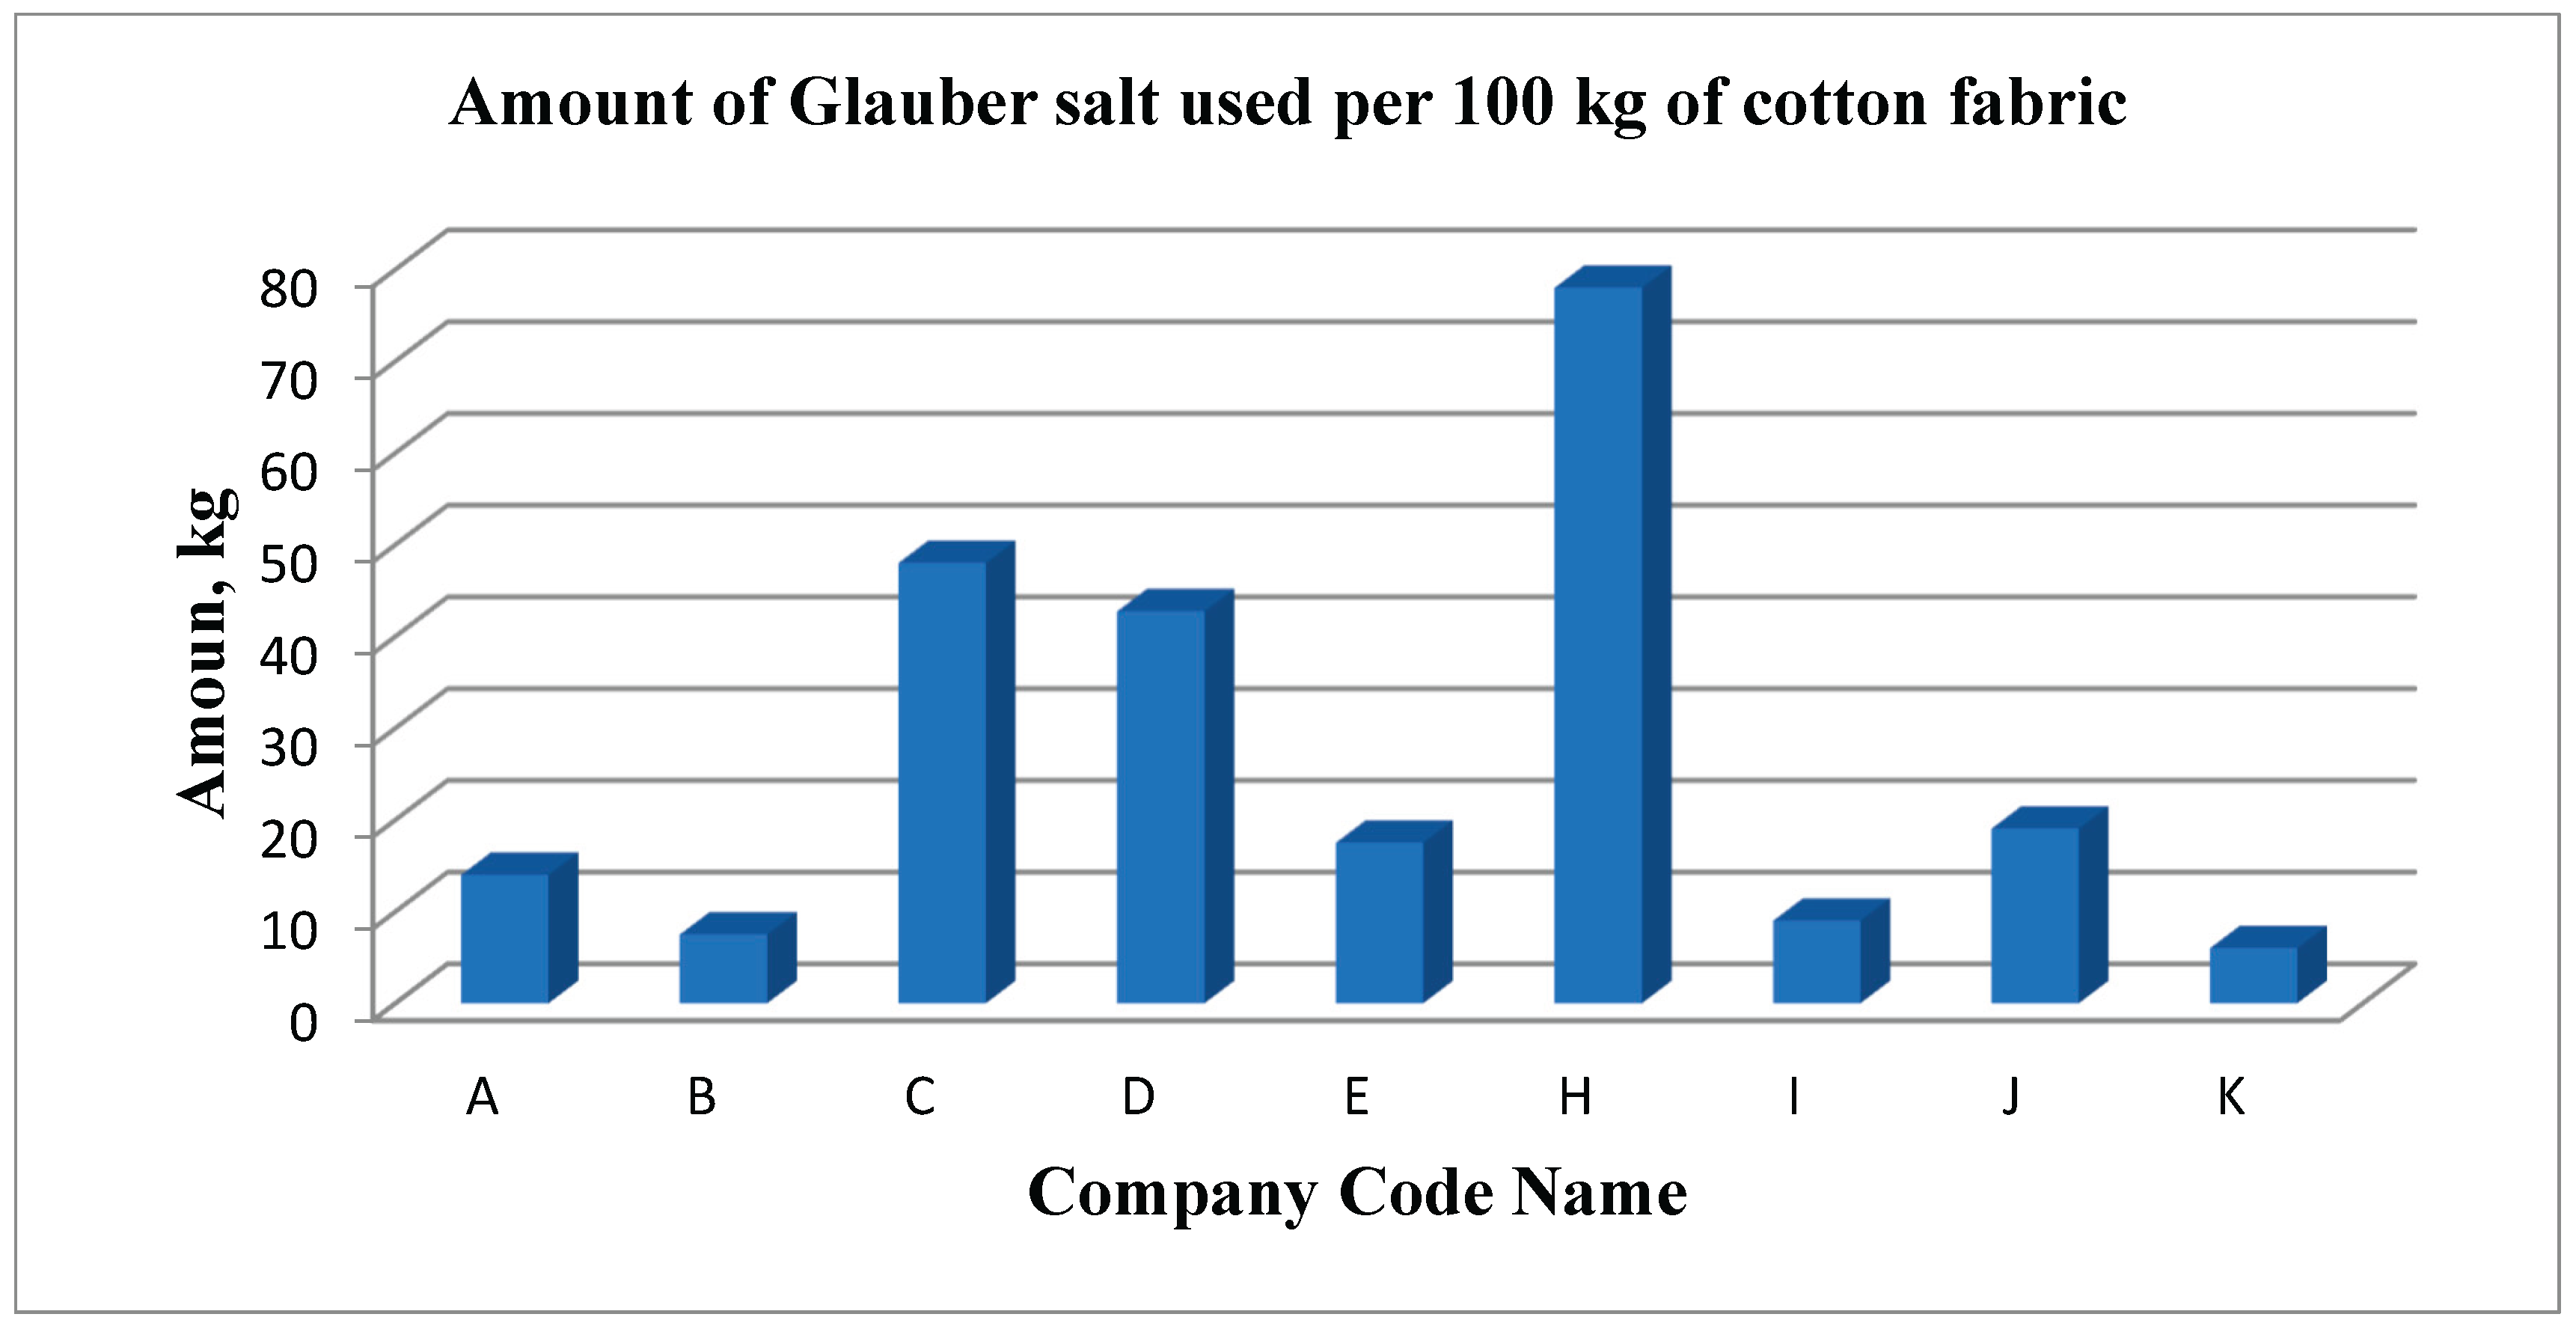
Figure 21.
The Amount of Glauber Salt used per 100 kg of polycotton fabric.
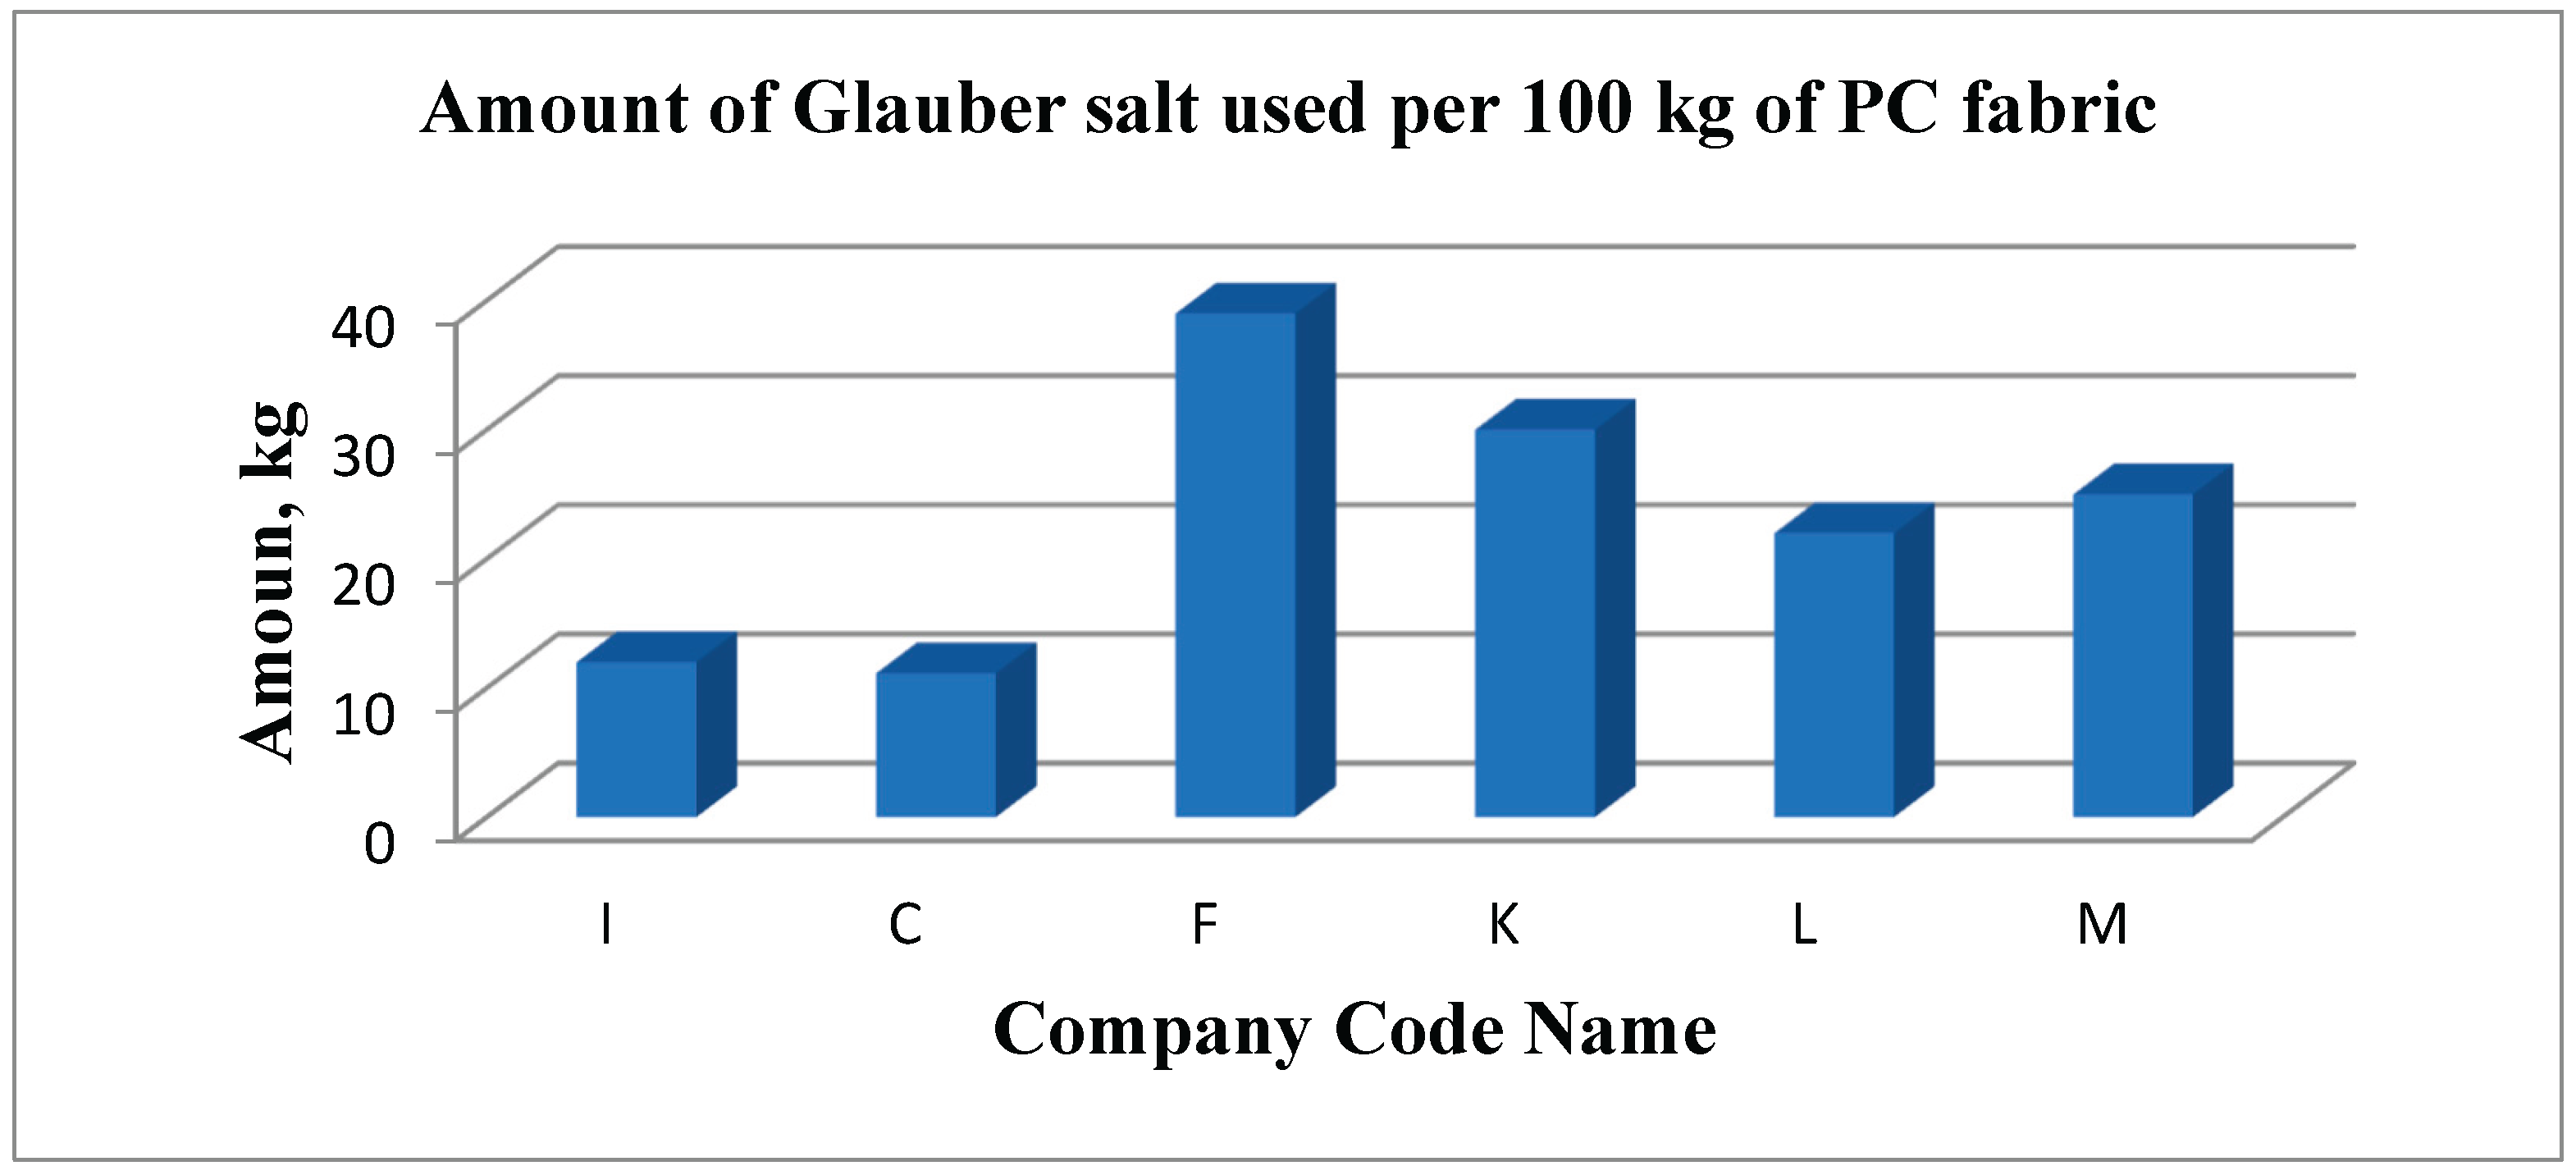
Figure 22.
The Amount of Soda Ash used per 100 kg of cotton fabrics by different companies.
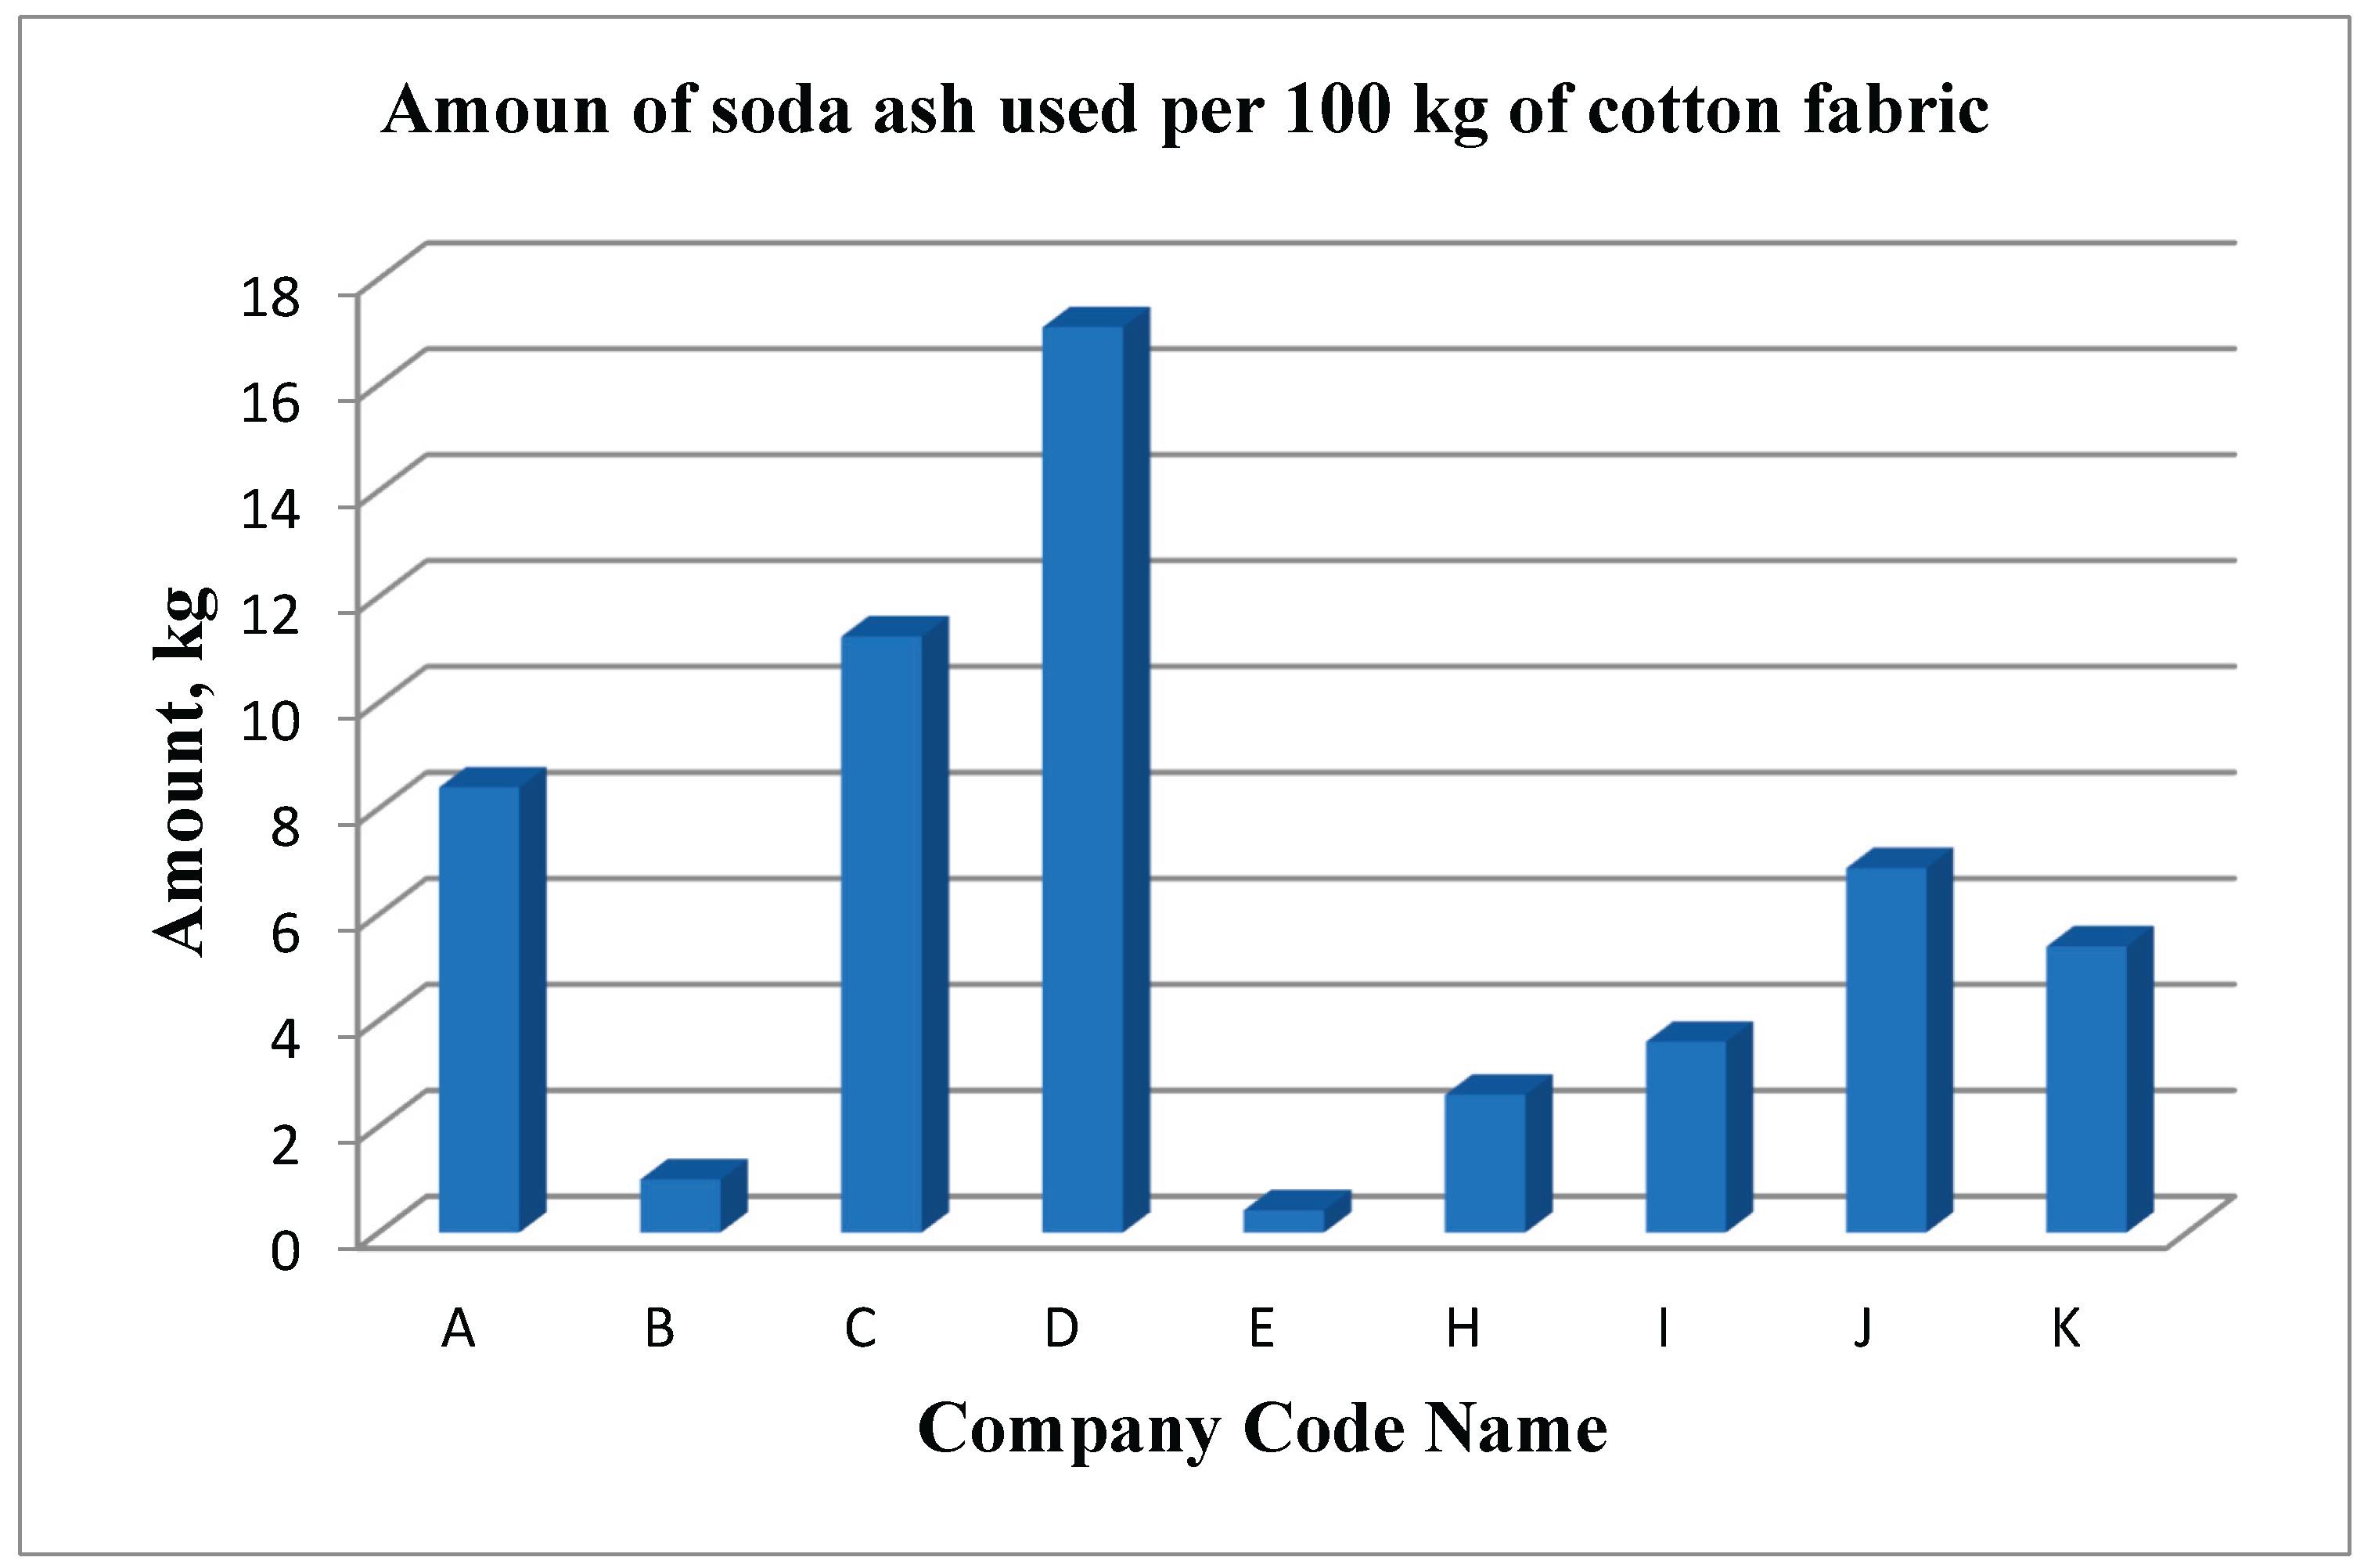
Figure 23.
The Amount of Soda Ash used per 100 kg of polycotton fabric.
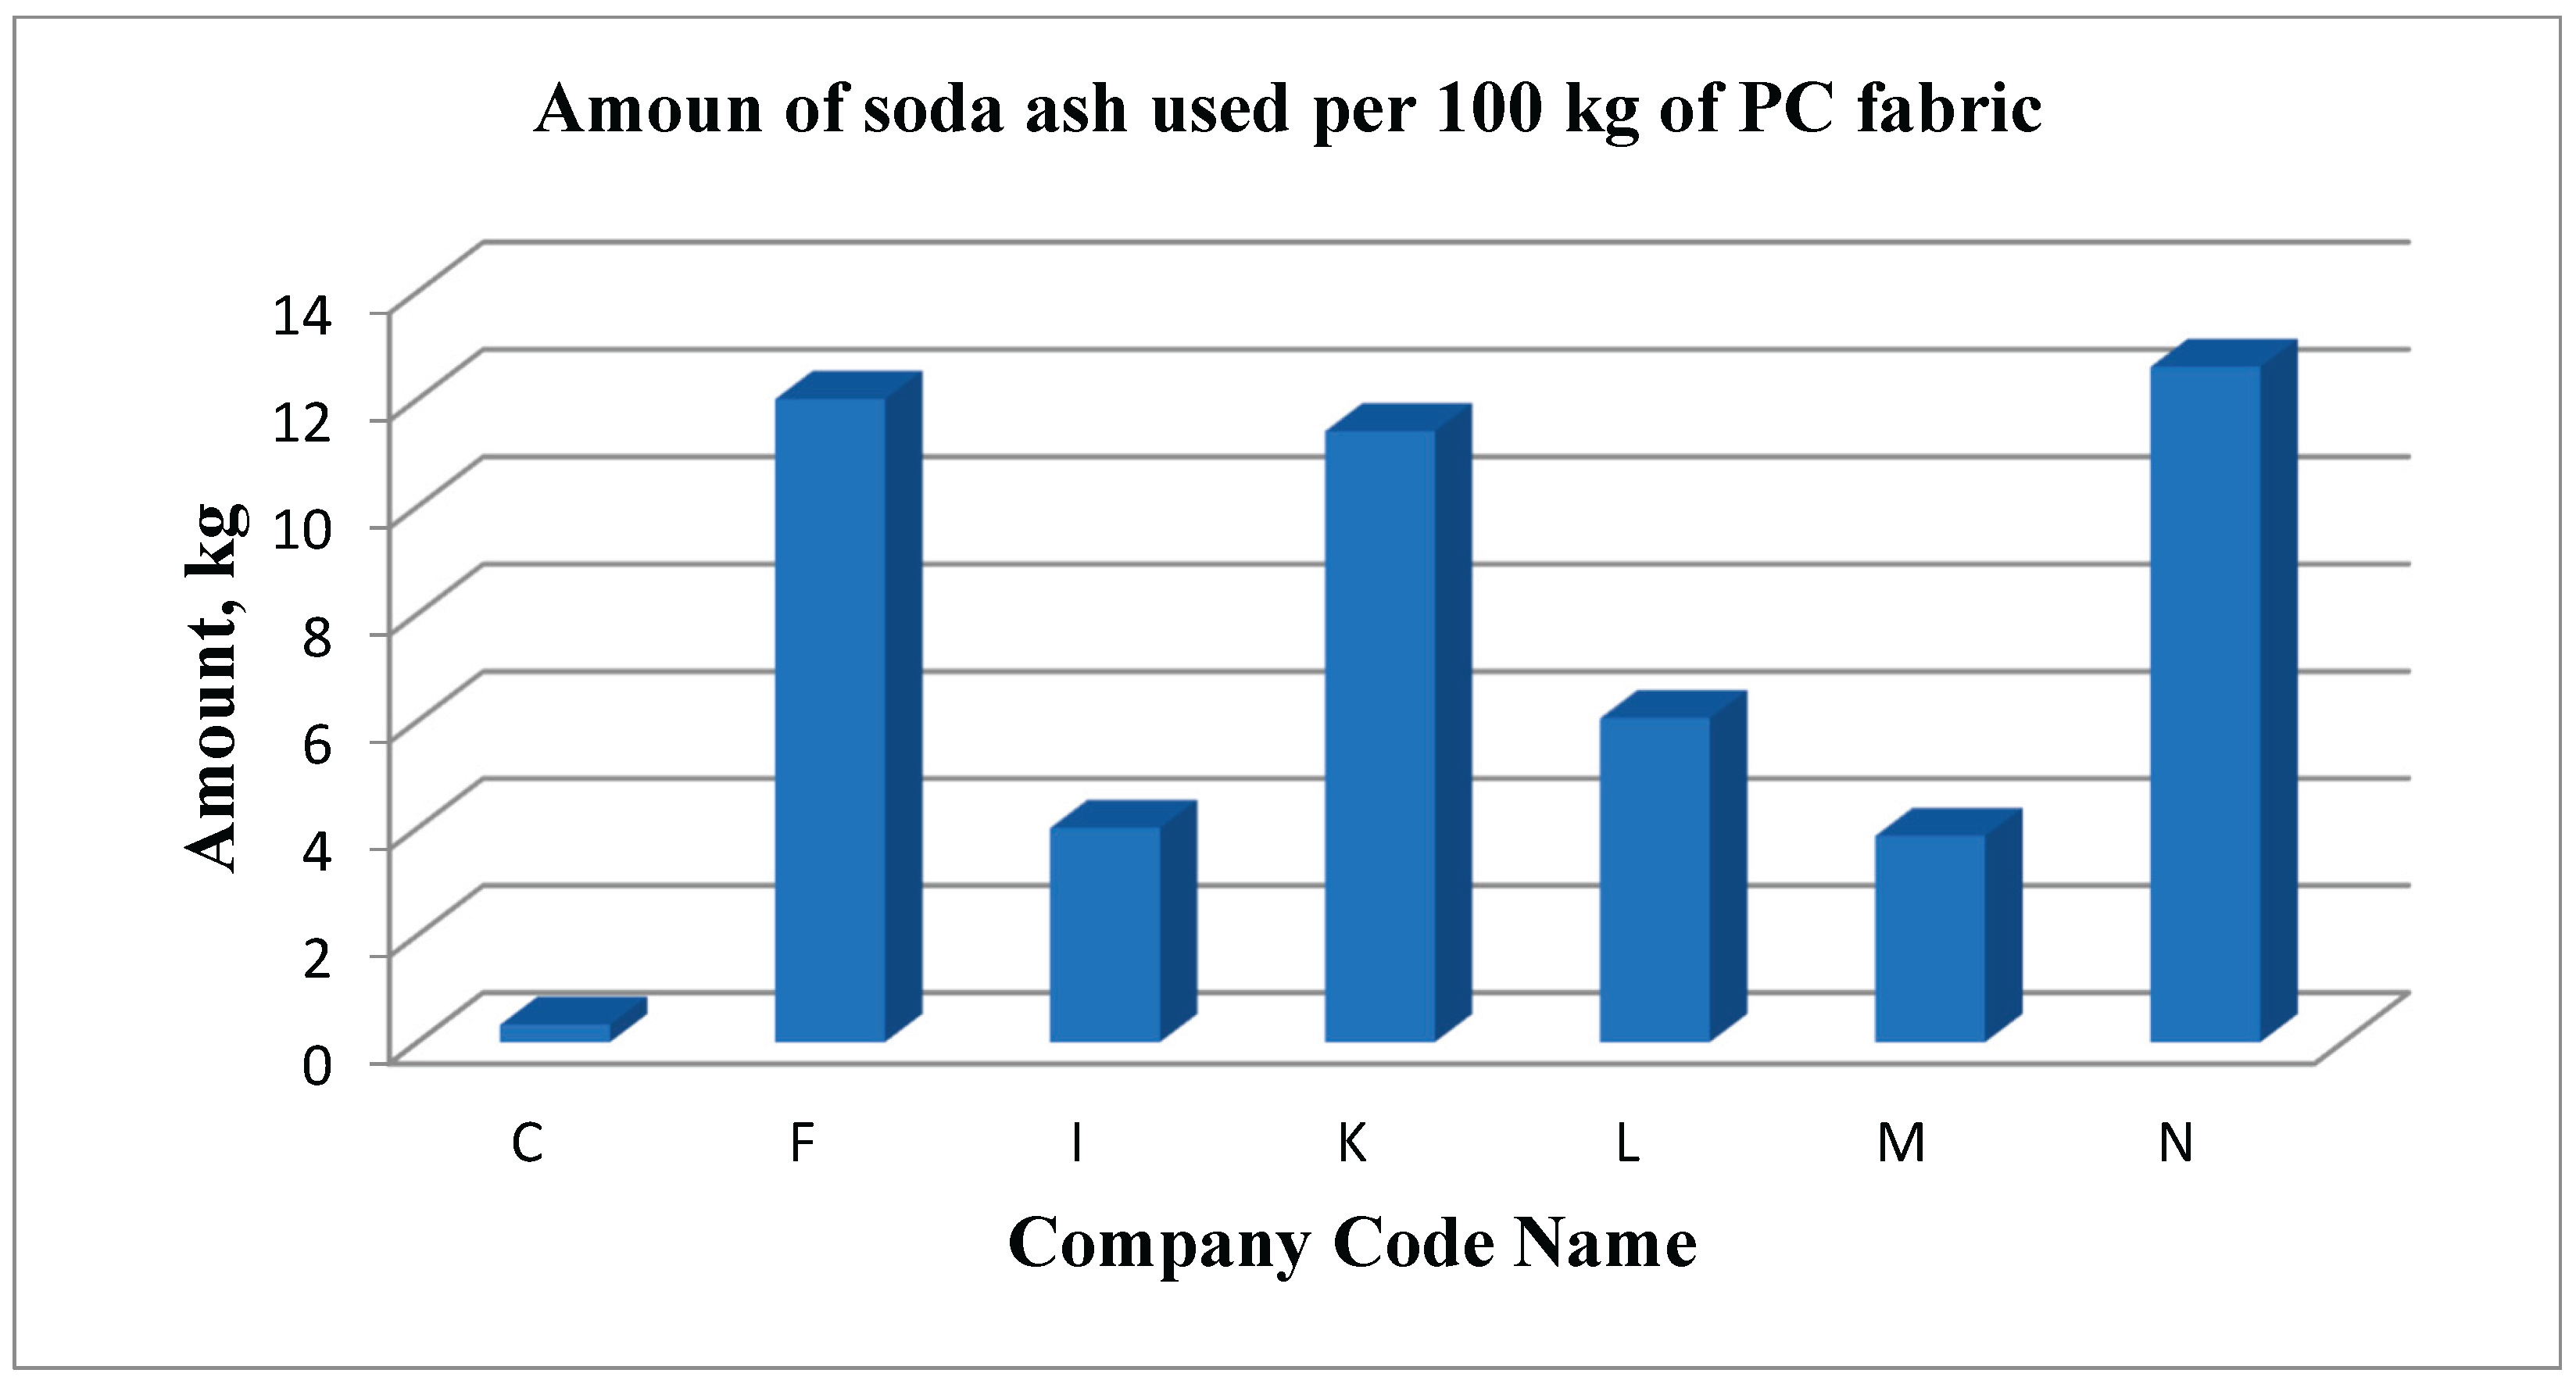
Figure 24.
Amount of Soaping Agent used per 100 kg of cotton fabrics by different companies.
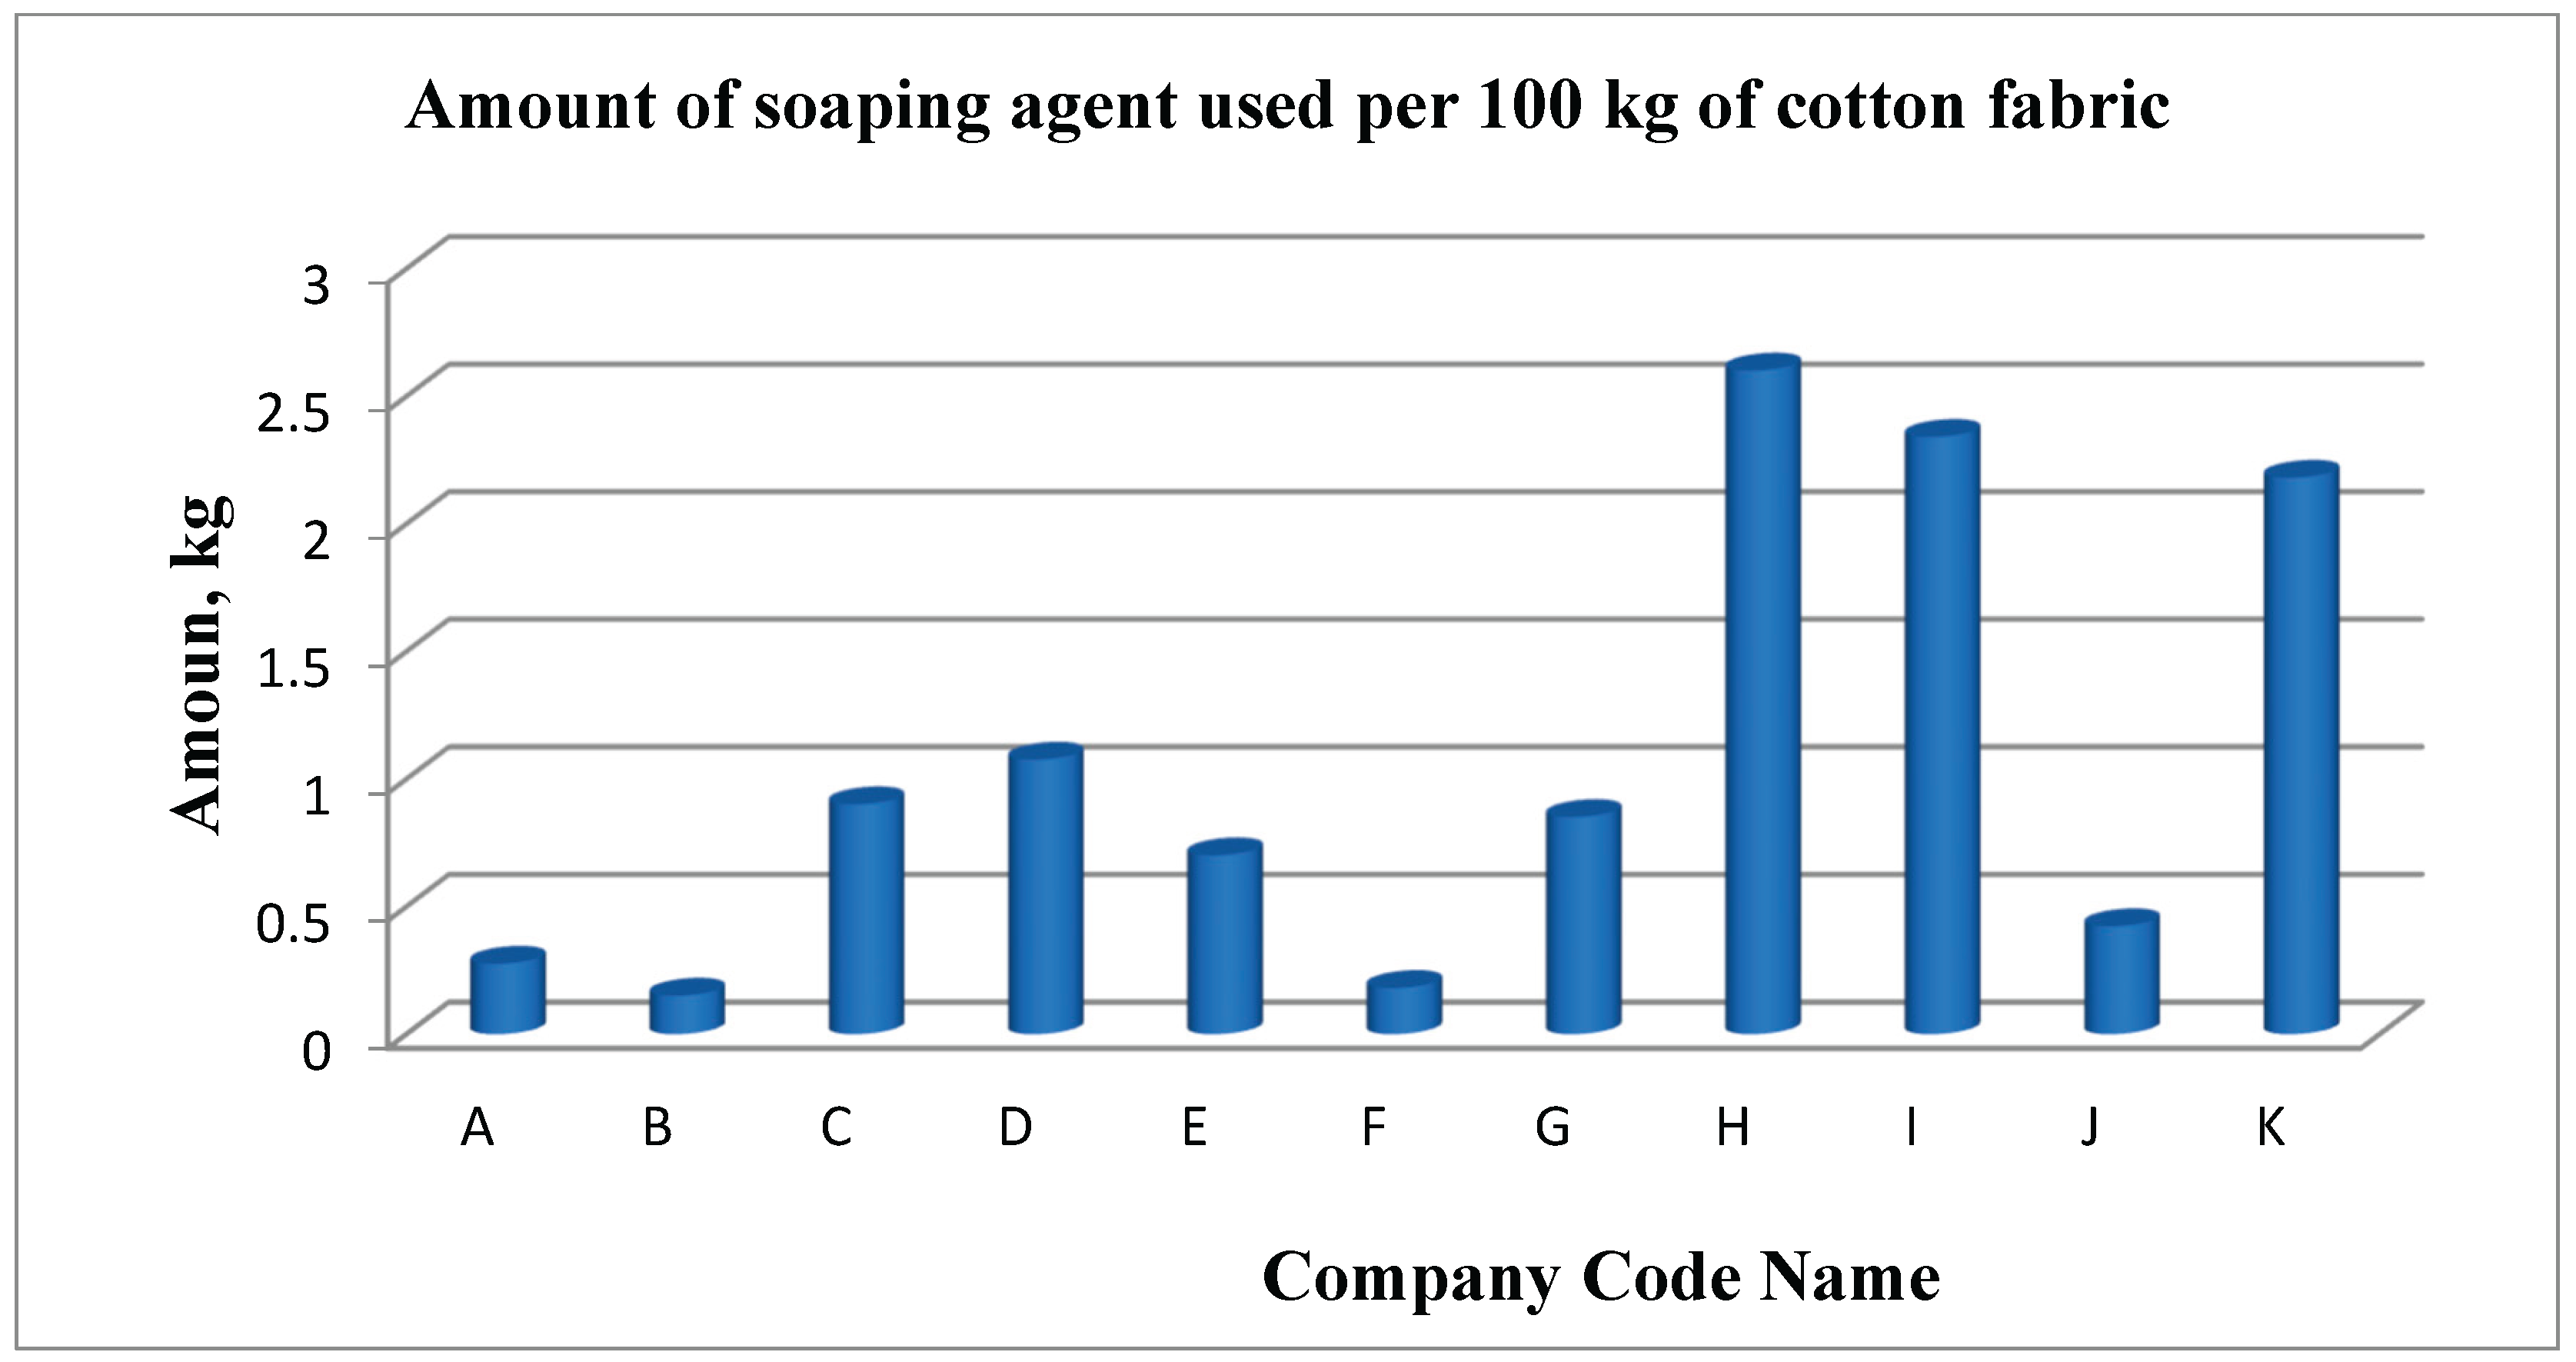
Figure 25.
Amount of Soaping Agent used per 100 kg of polycotton fabric by different companies.
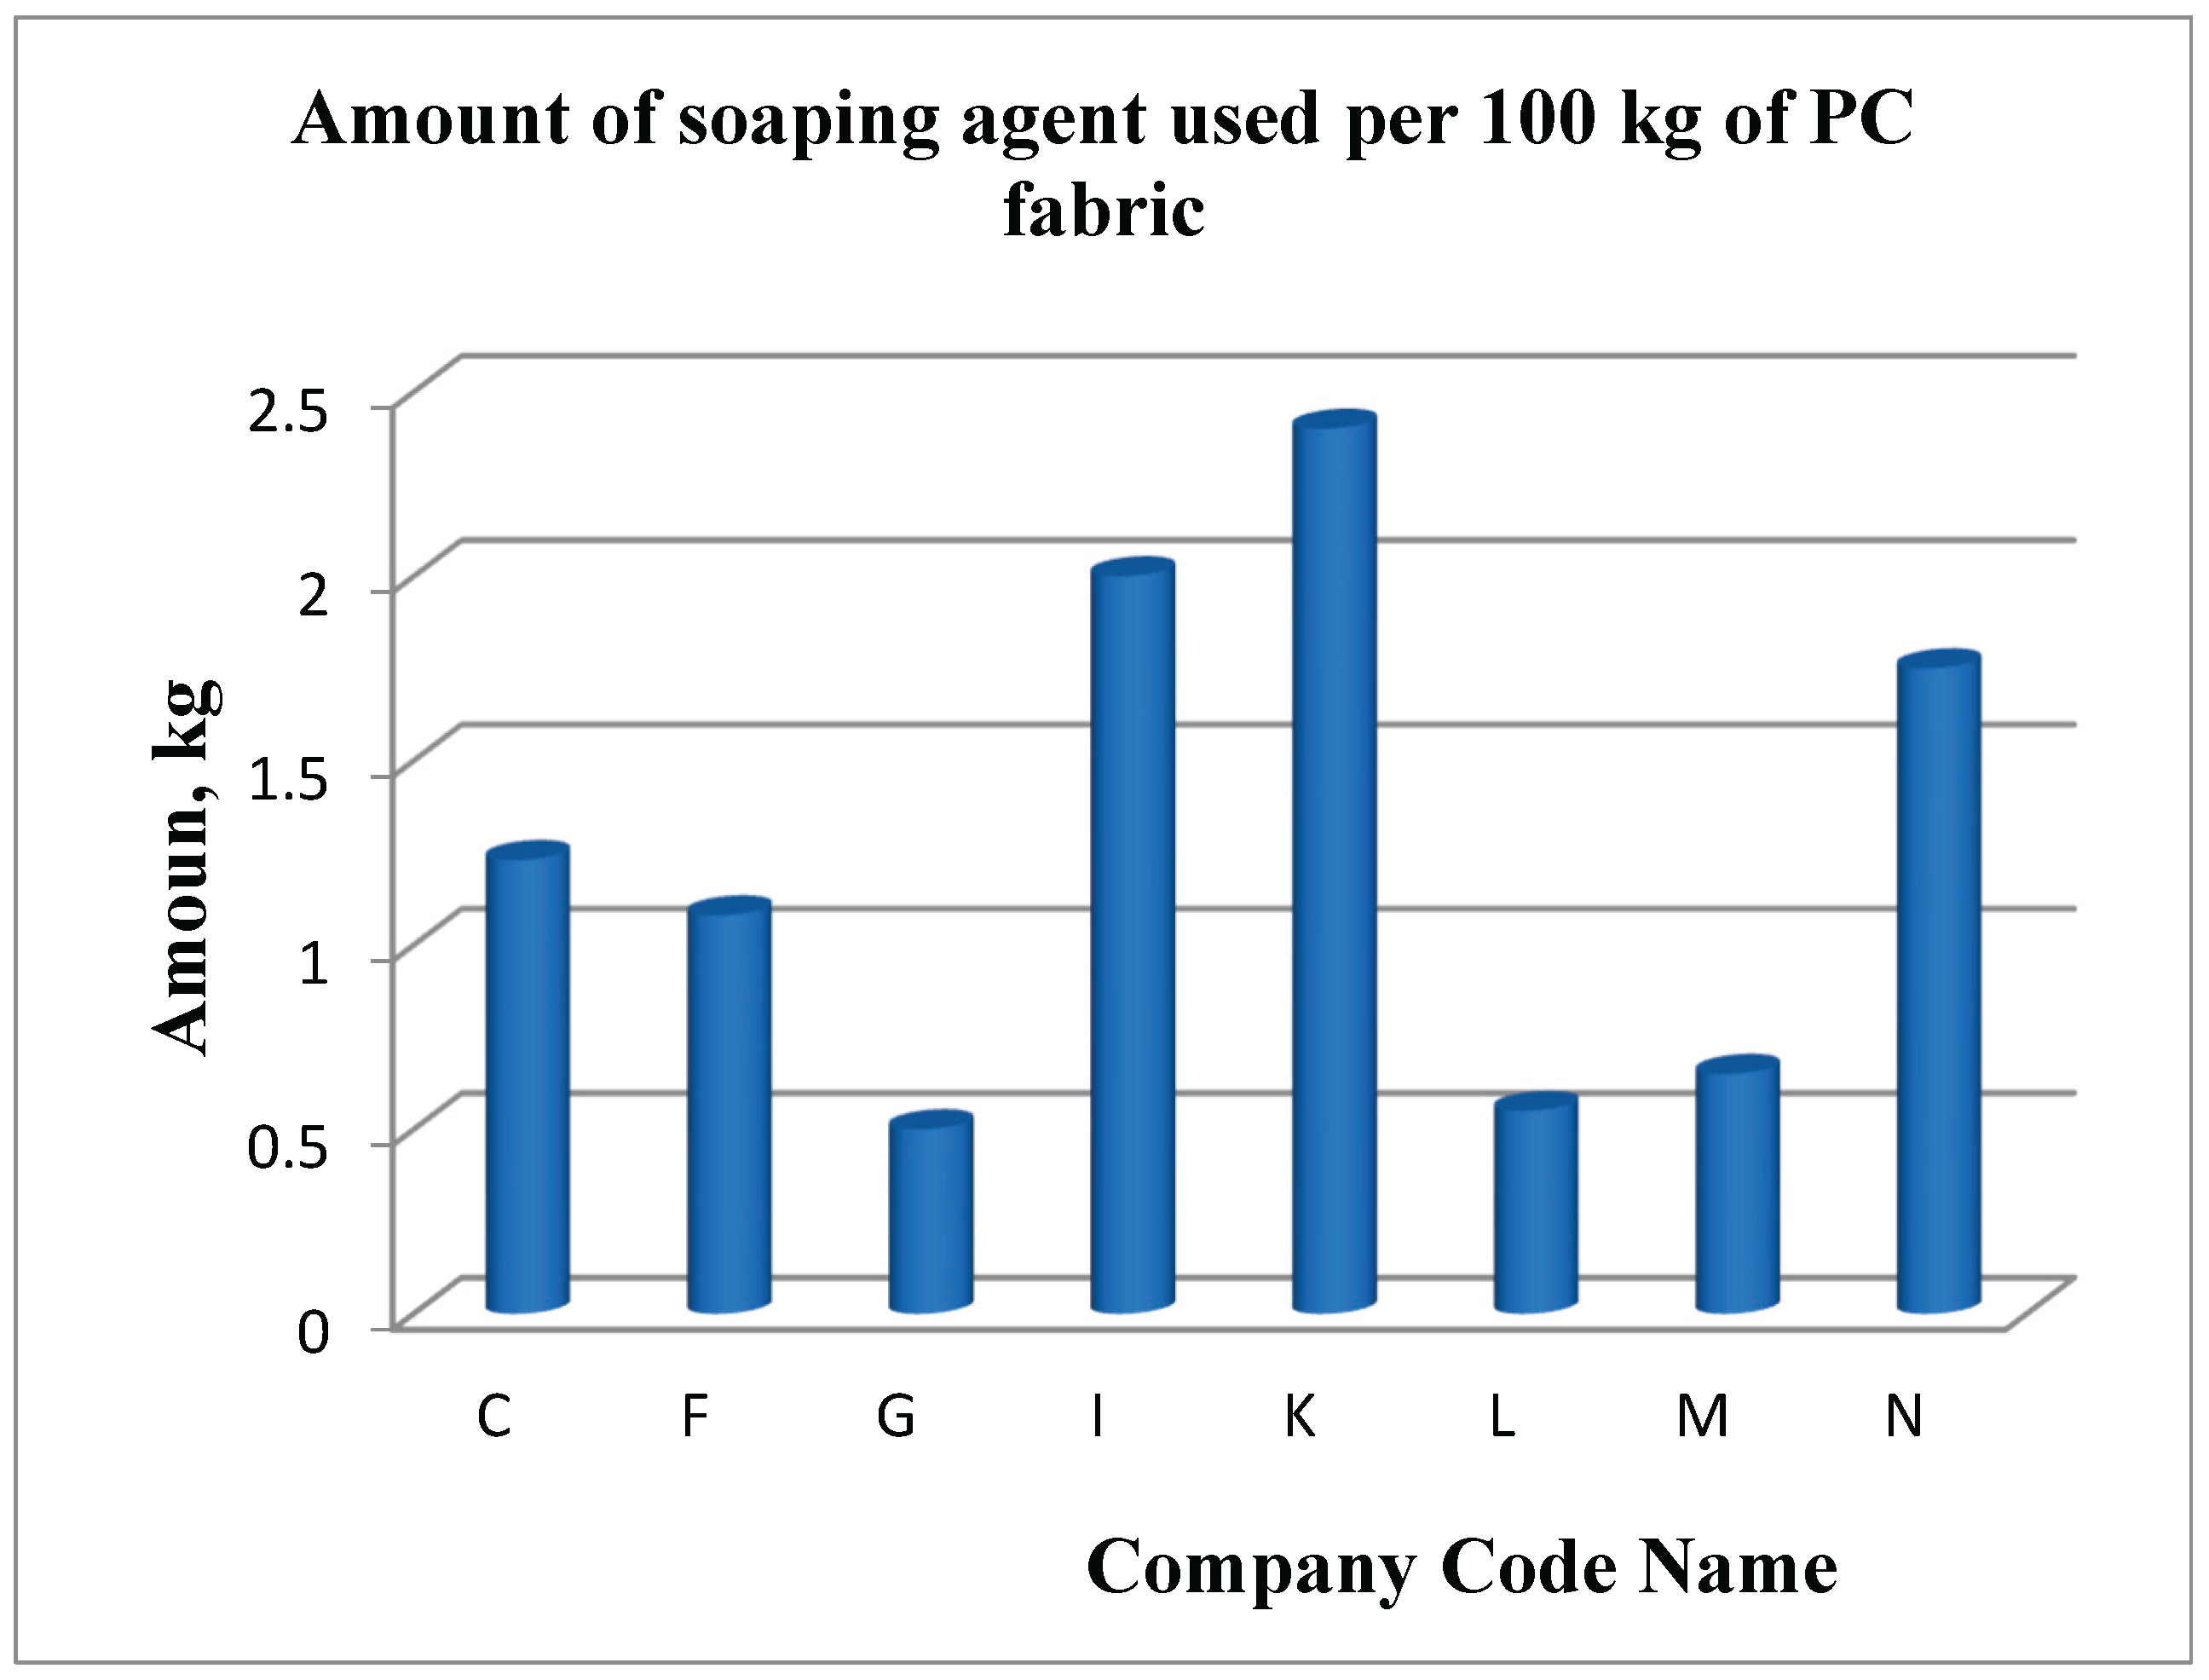
Figure 26.
Amount of Soaping Agent used per 100 kg of polyester fabric by different companies.
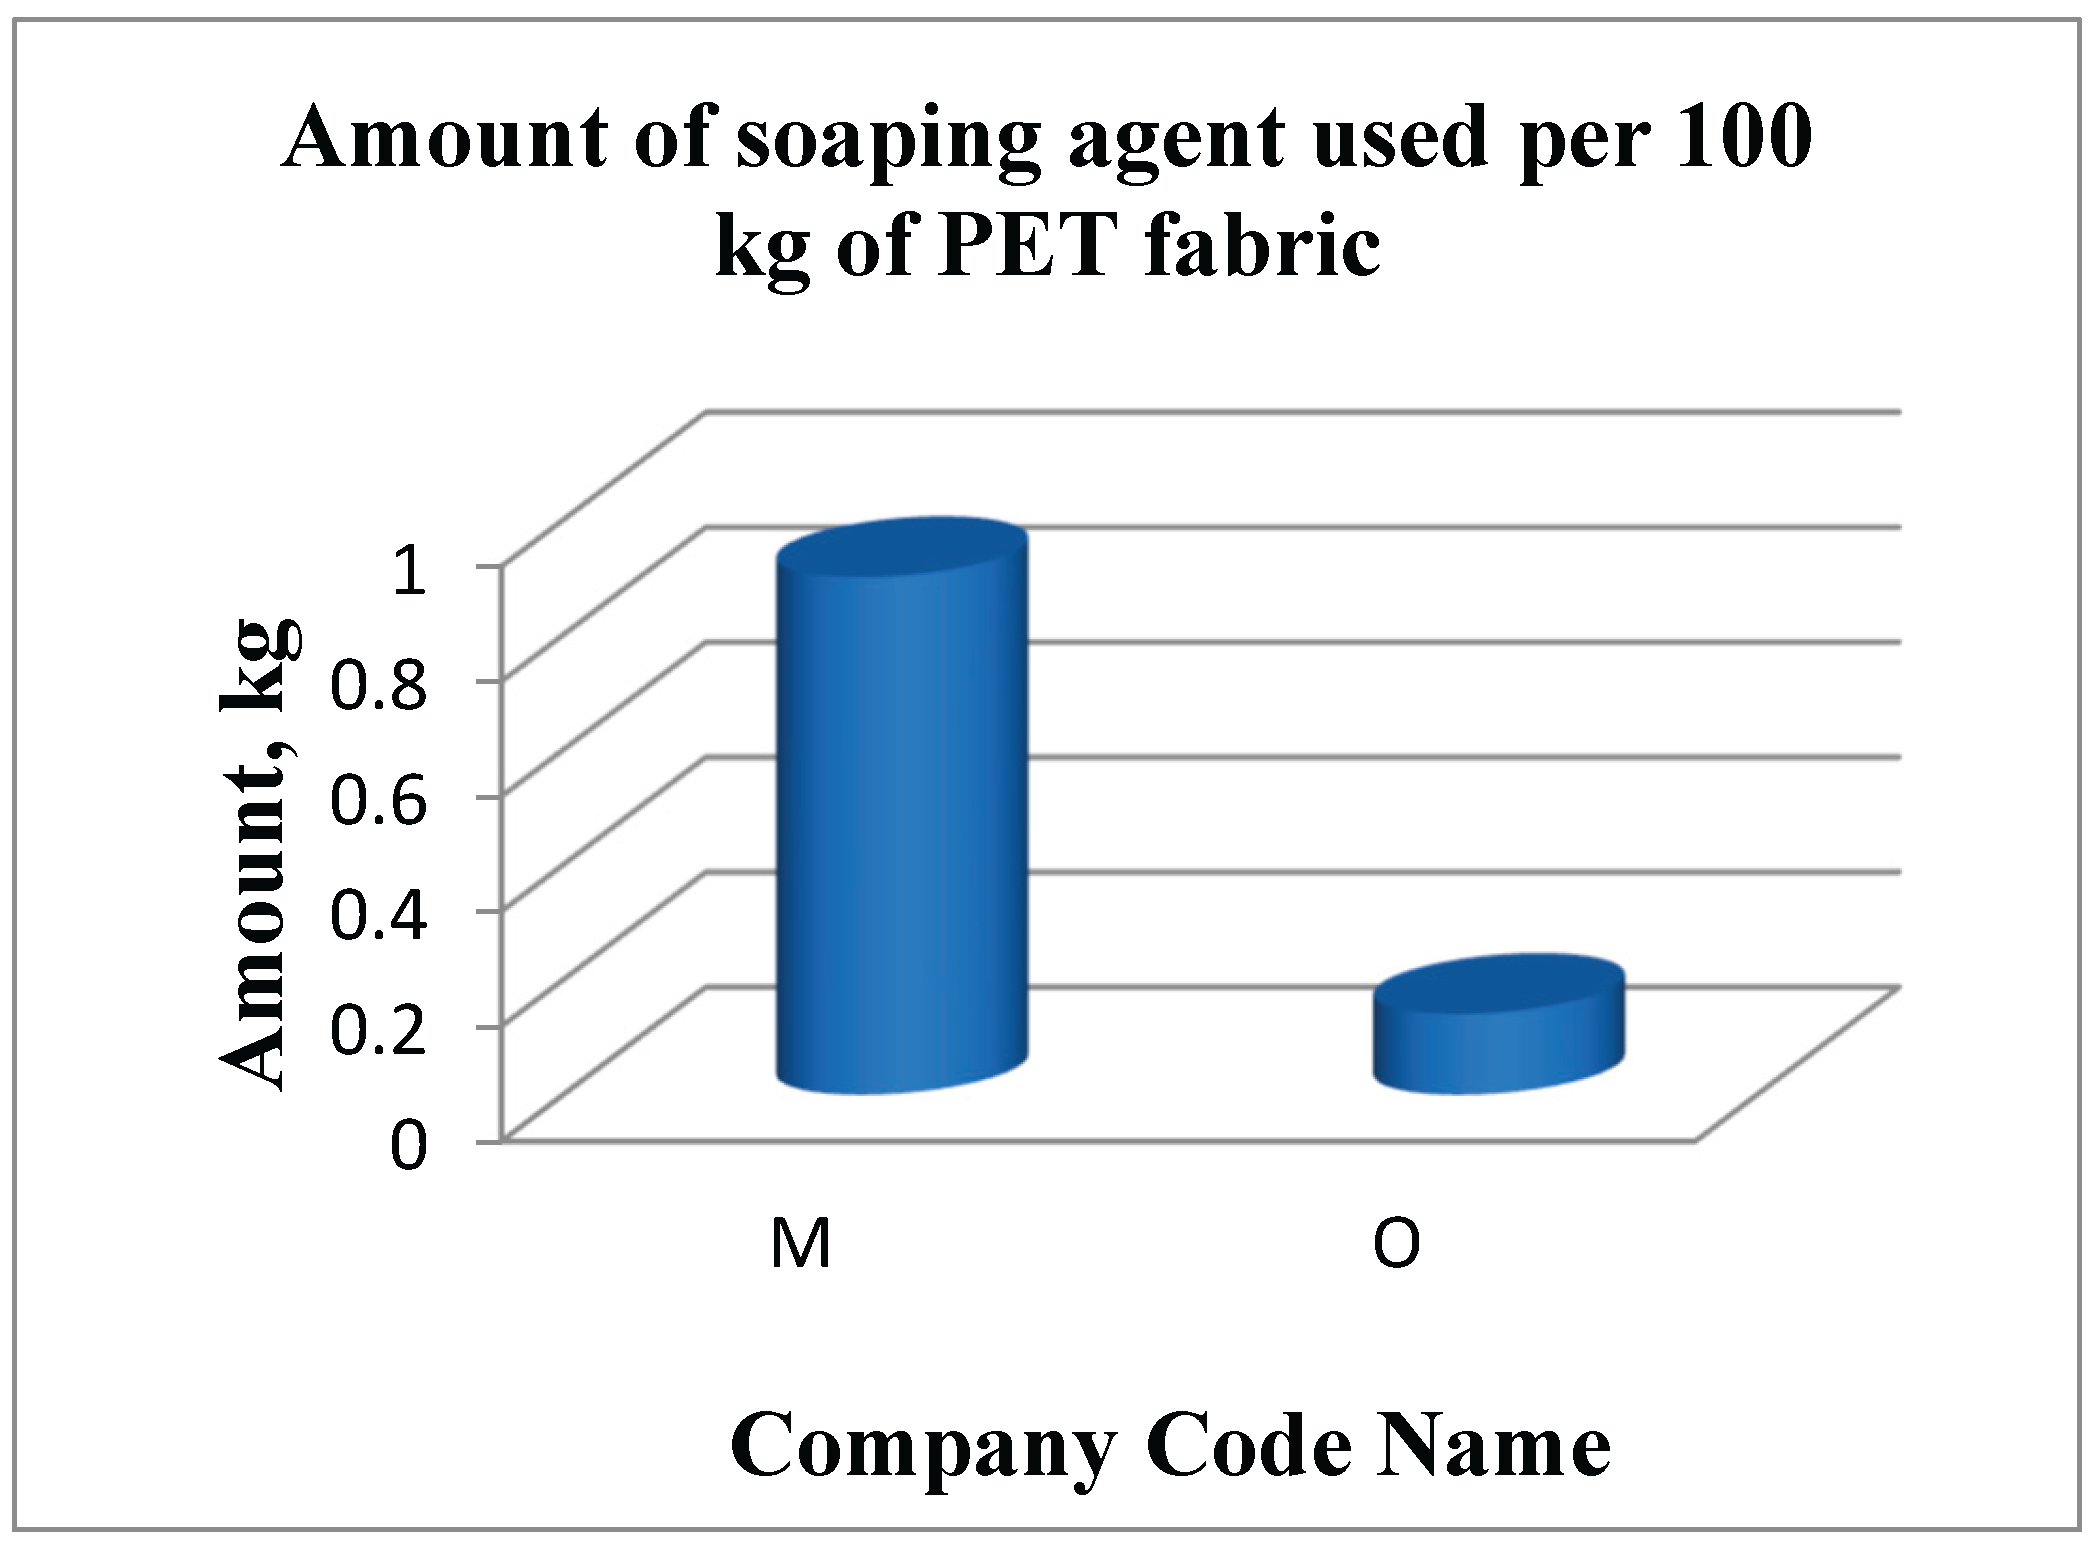
Figure 27.
Amount of Softener used per 100 kg of cotton fabric by different companies.
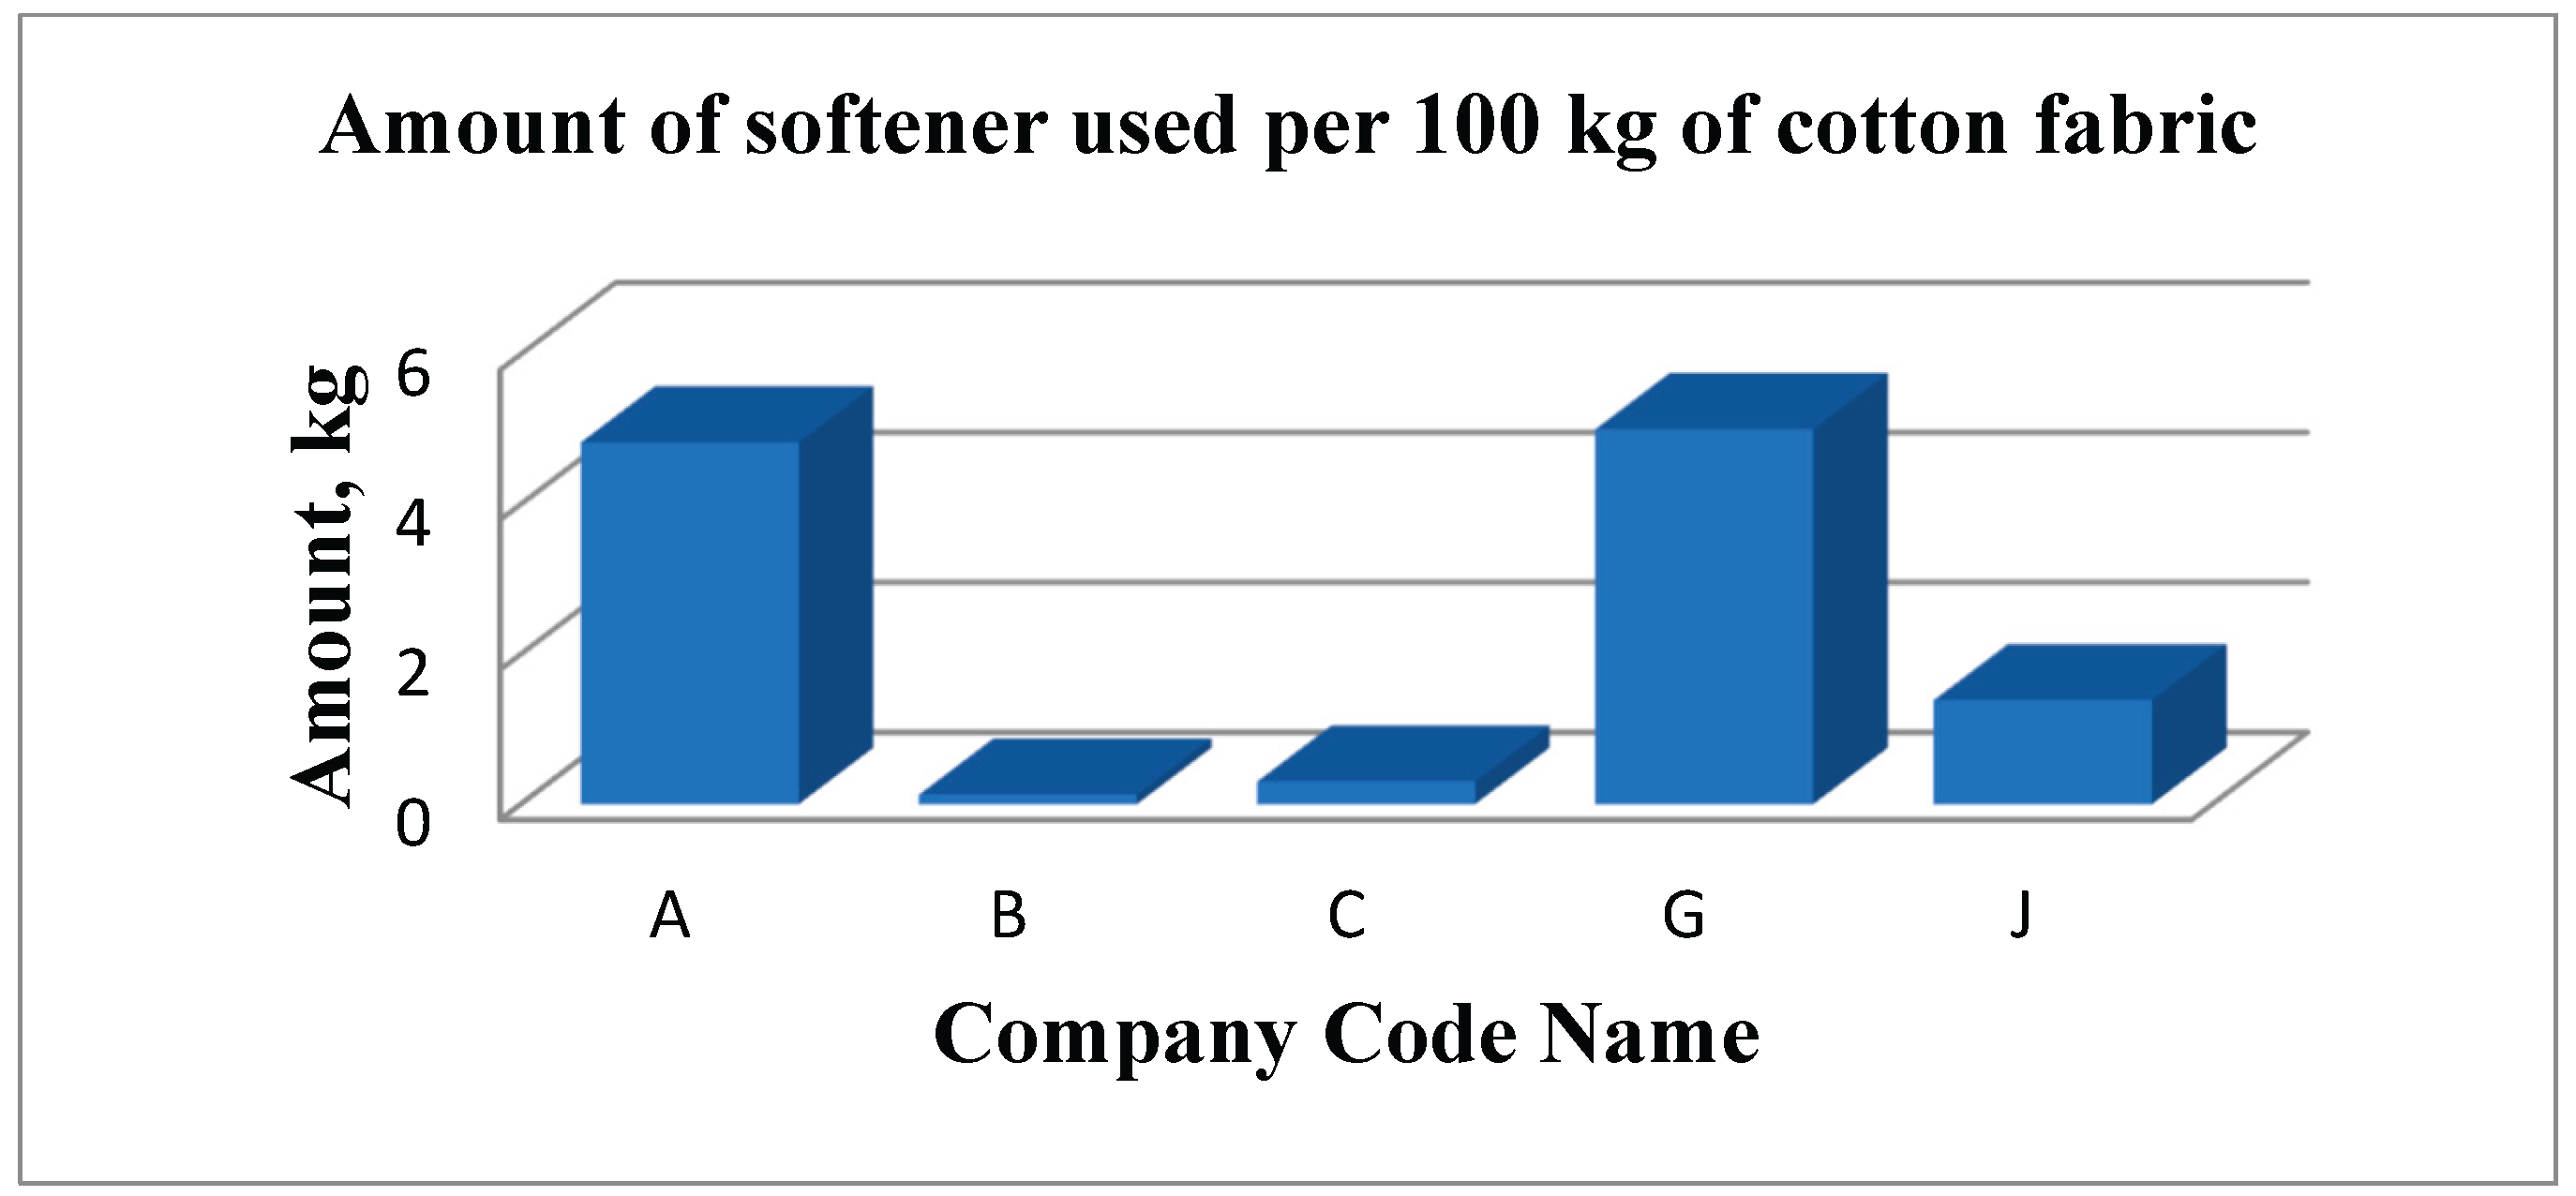
Figure 28.
Amount of Softener used per 100 kg of polycotton fabric by different companies.
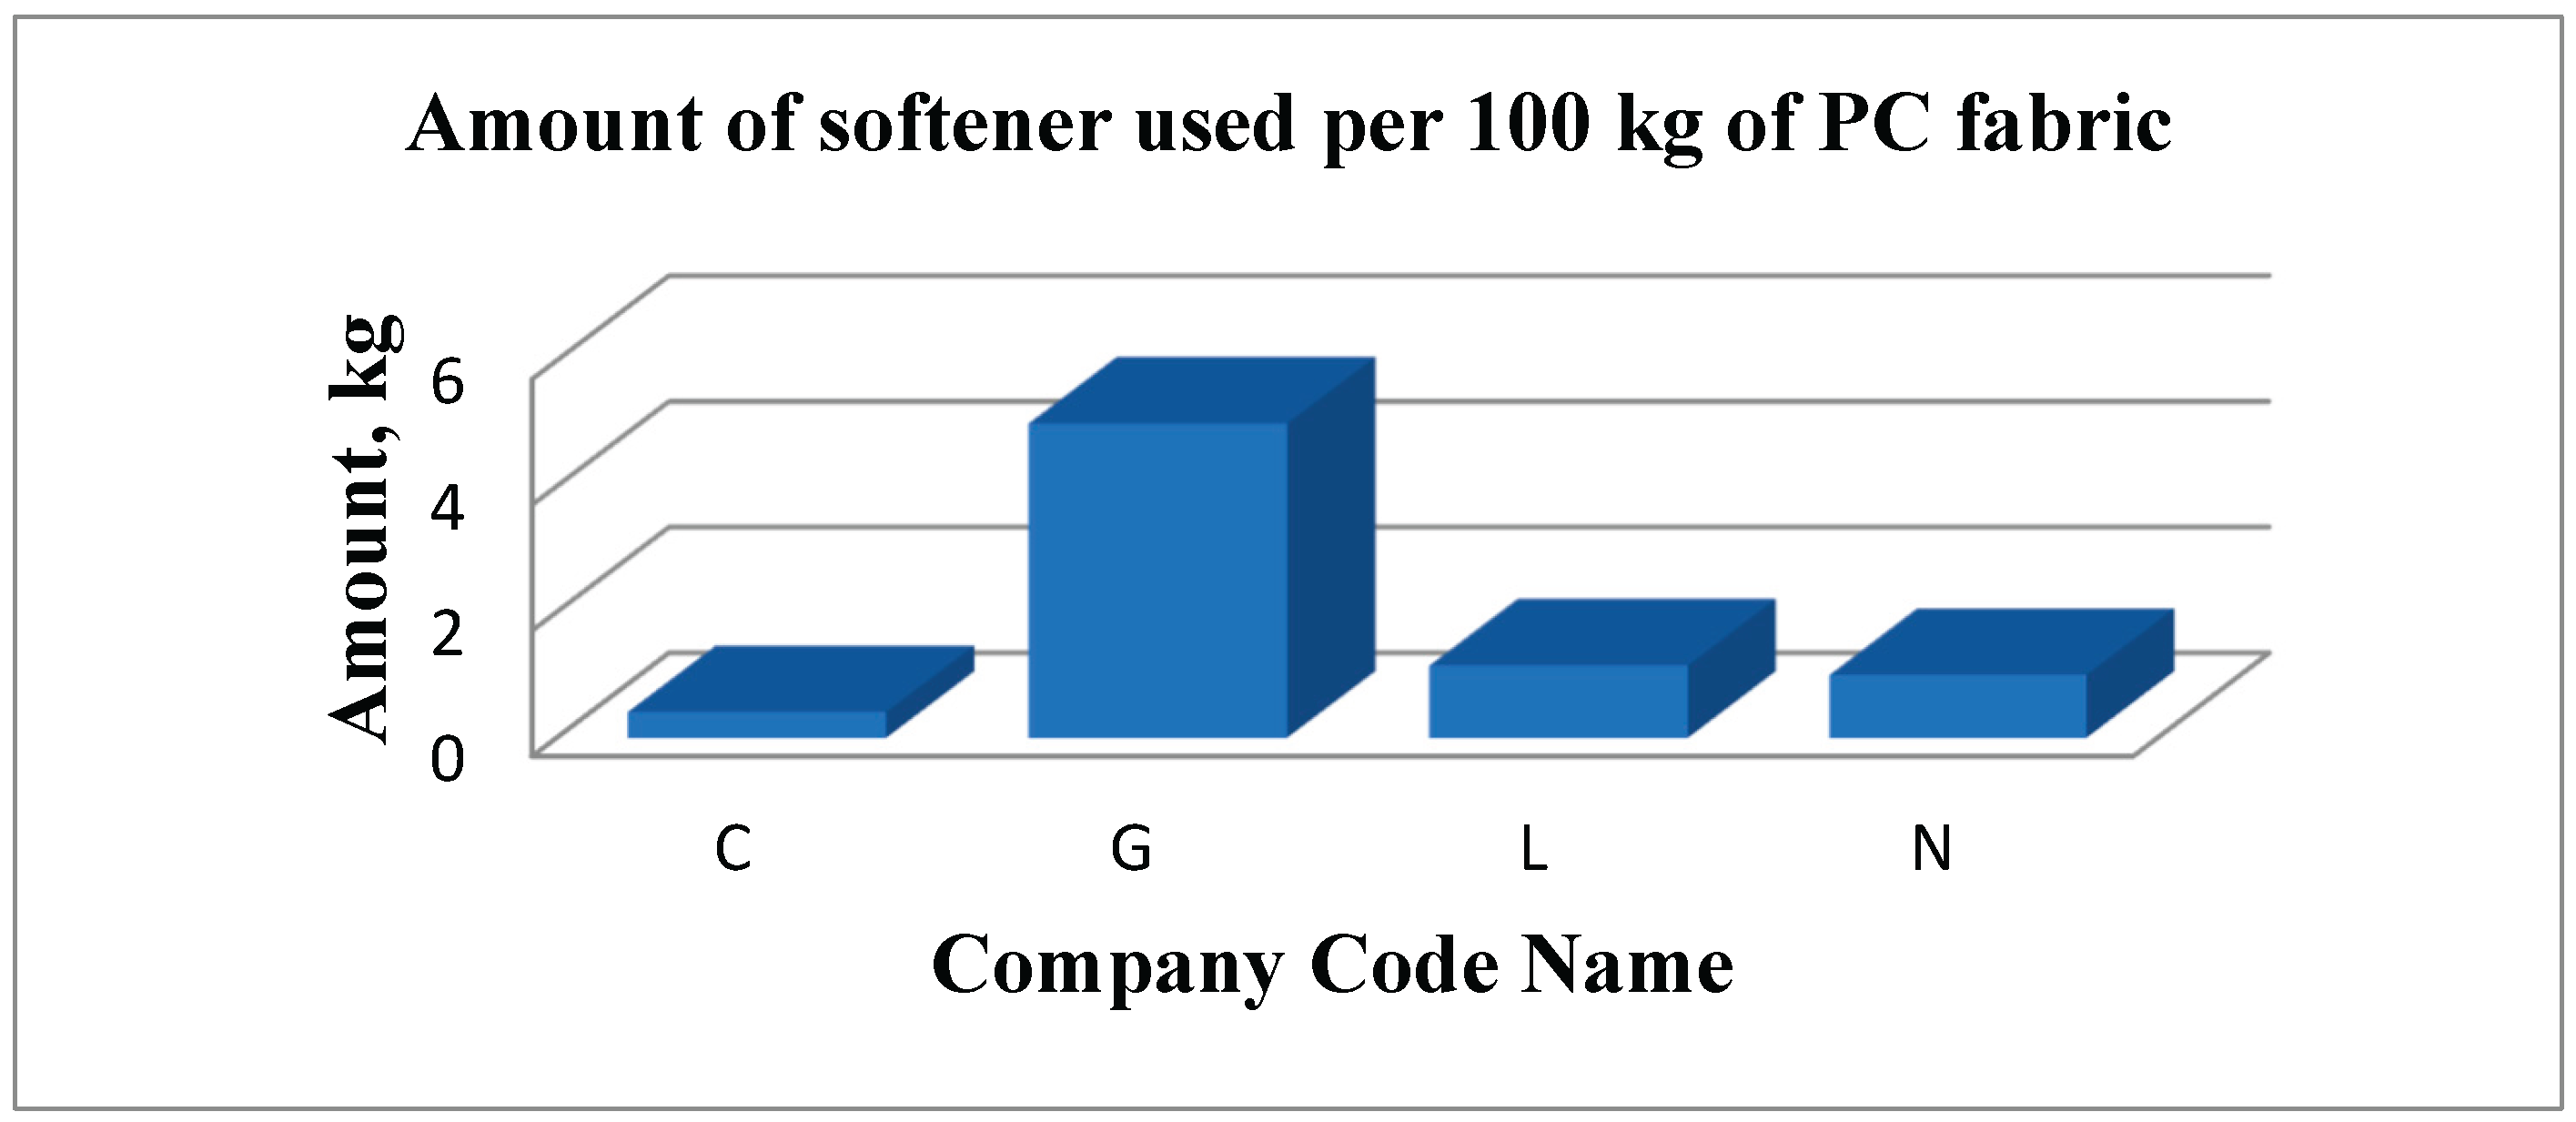
Figure 29.
Amount of acetic acid used per 100 kg of cotton fabric by different companies.
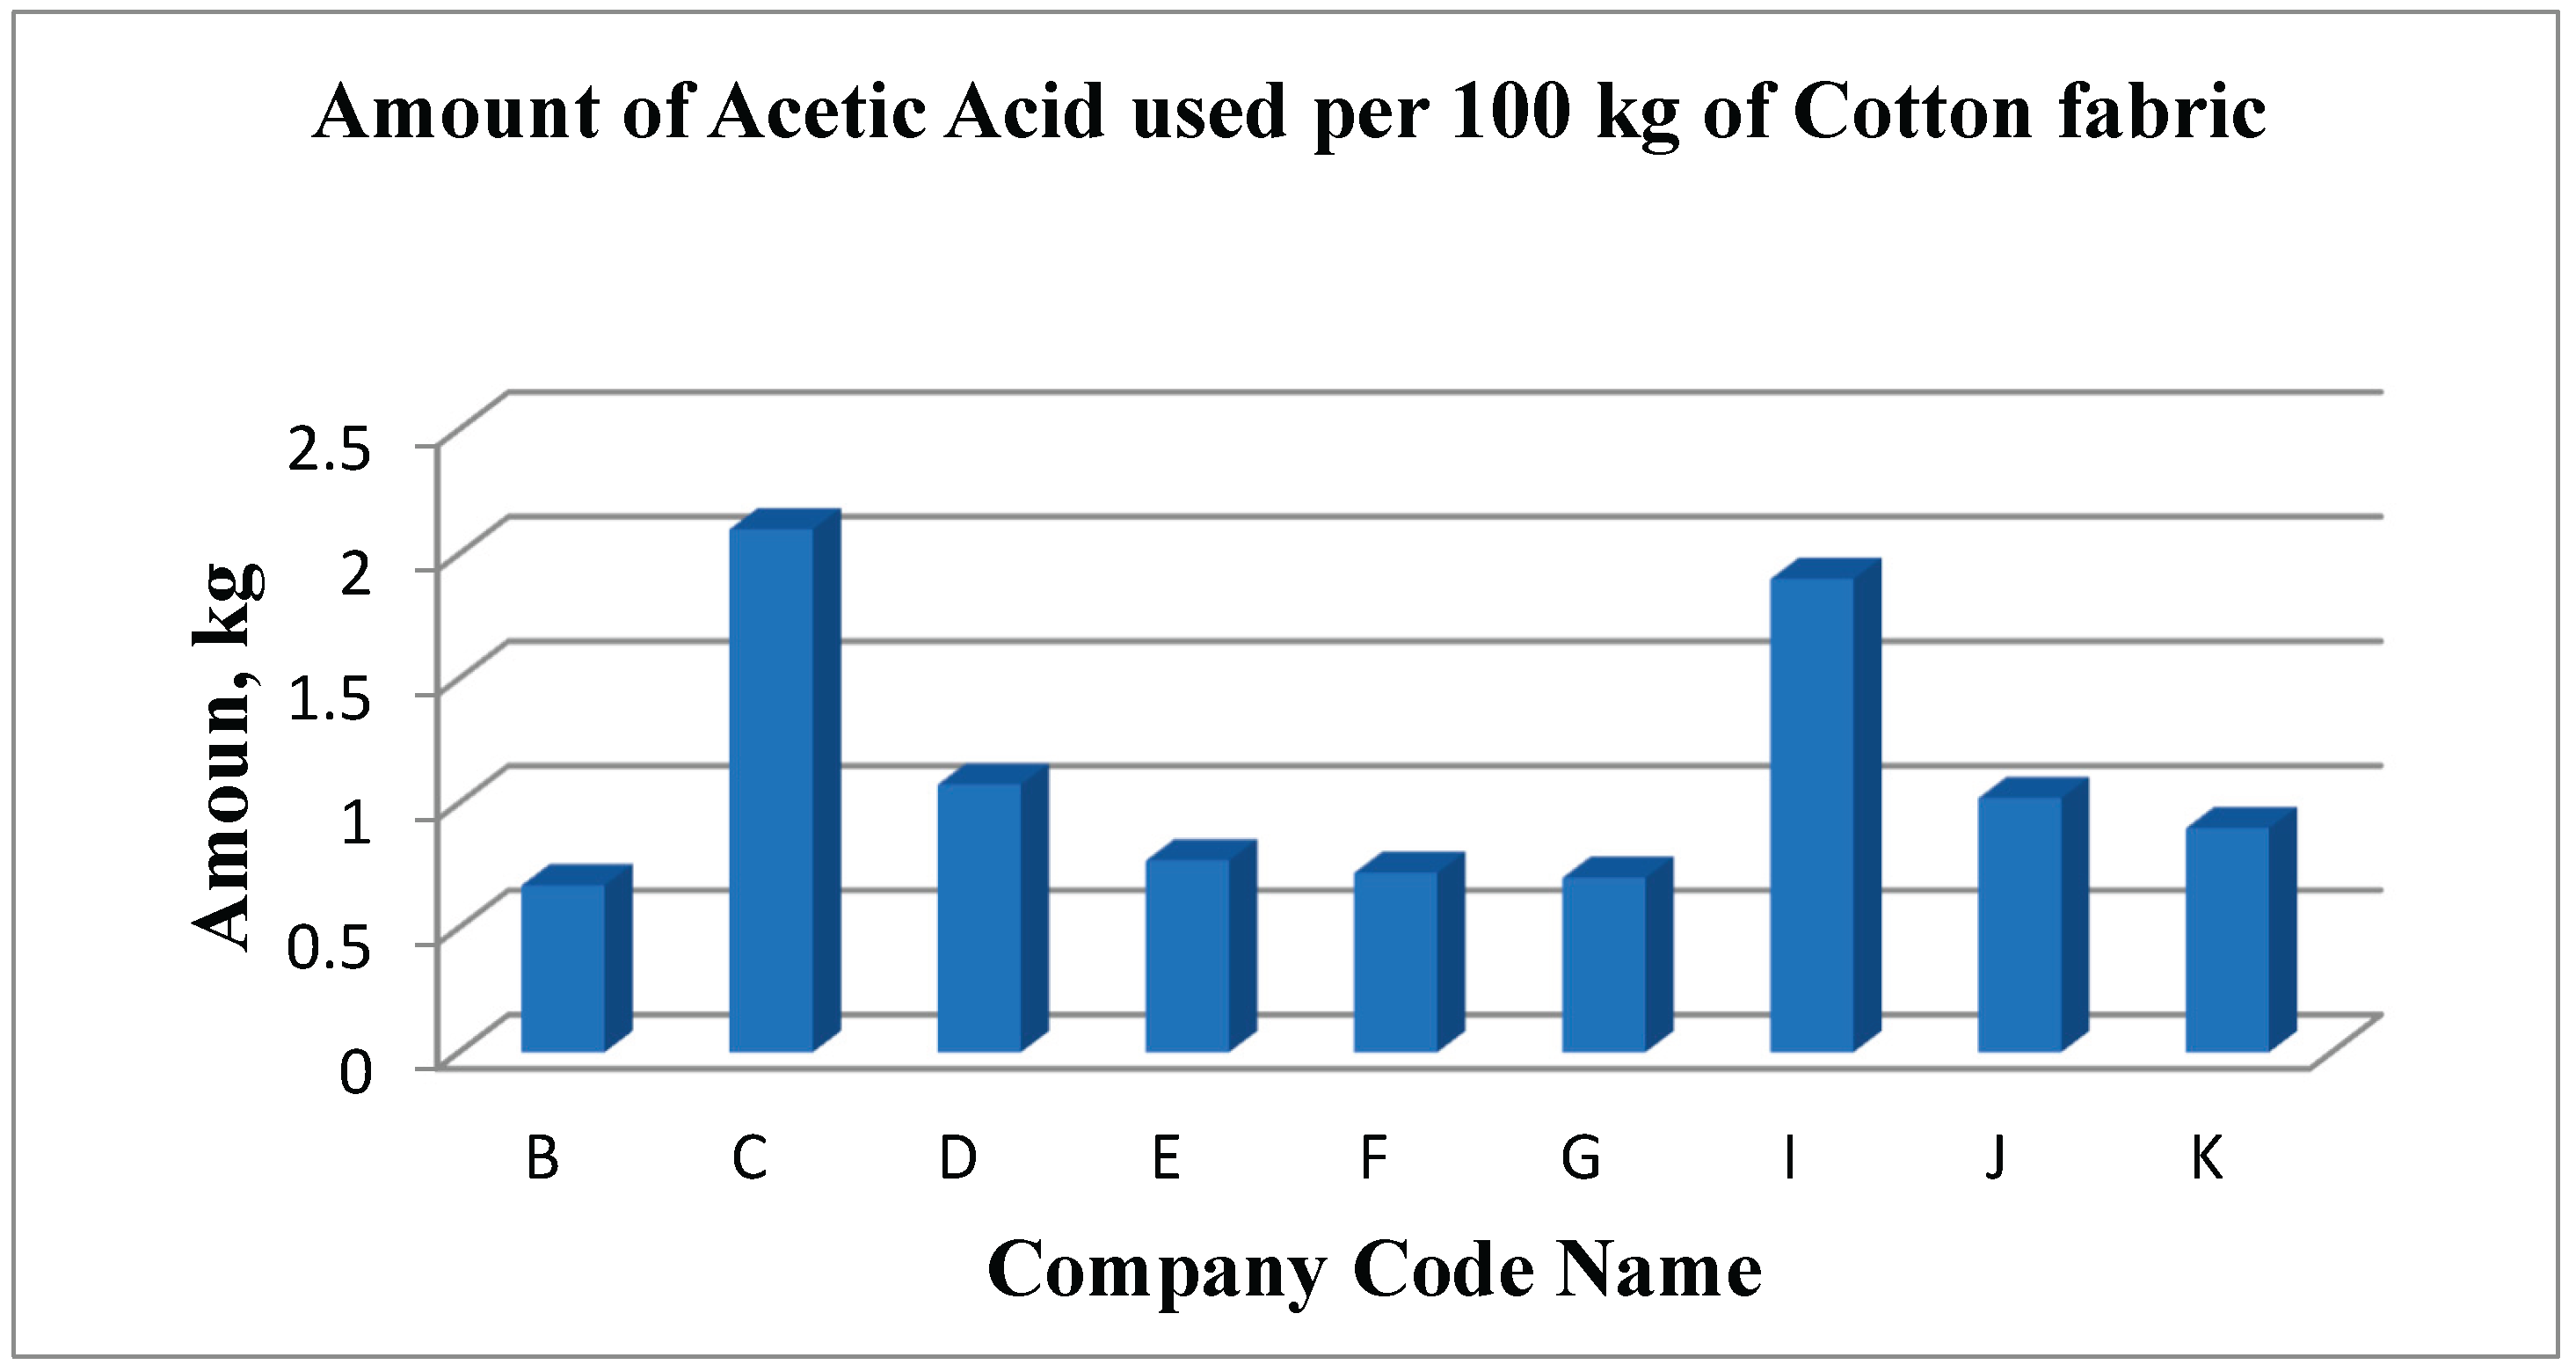
Figure 30.
Amount of acetic acid used per 100 kg of polycotton fabric by different companies.
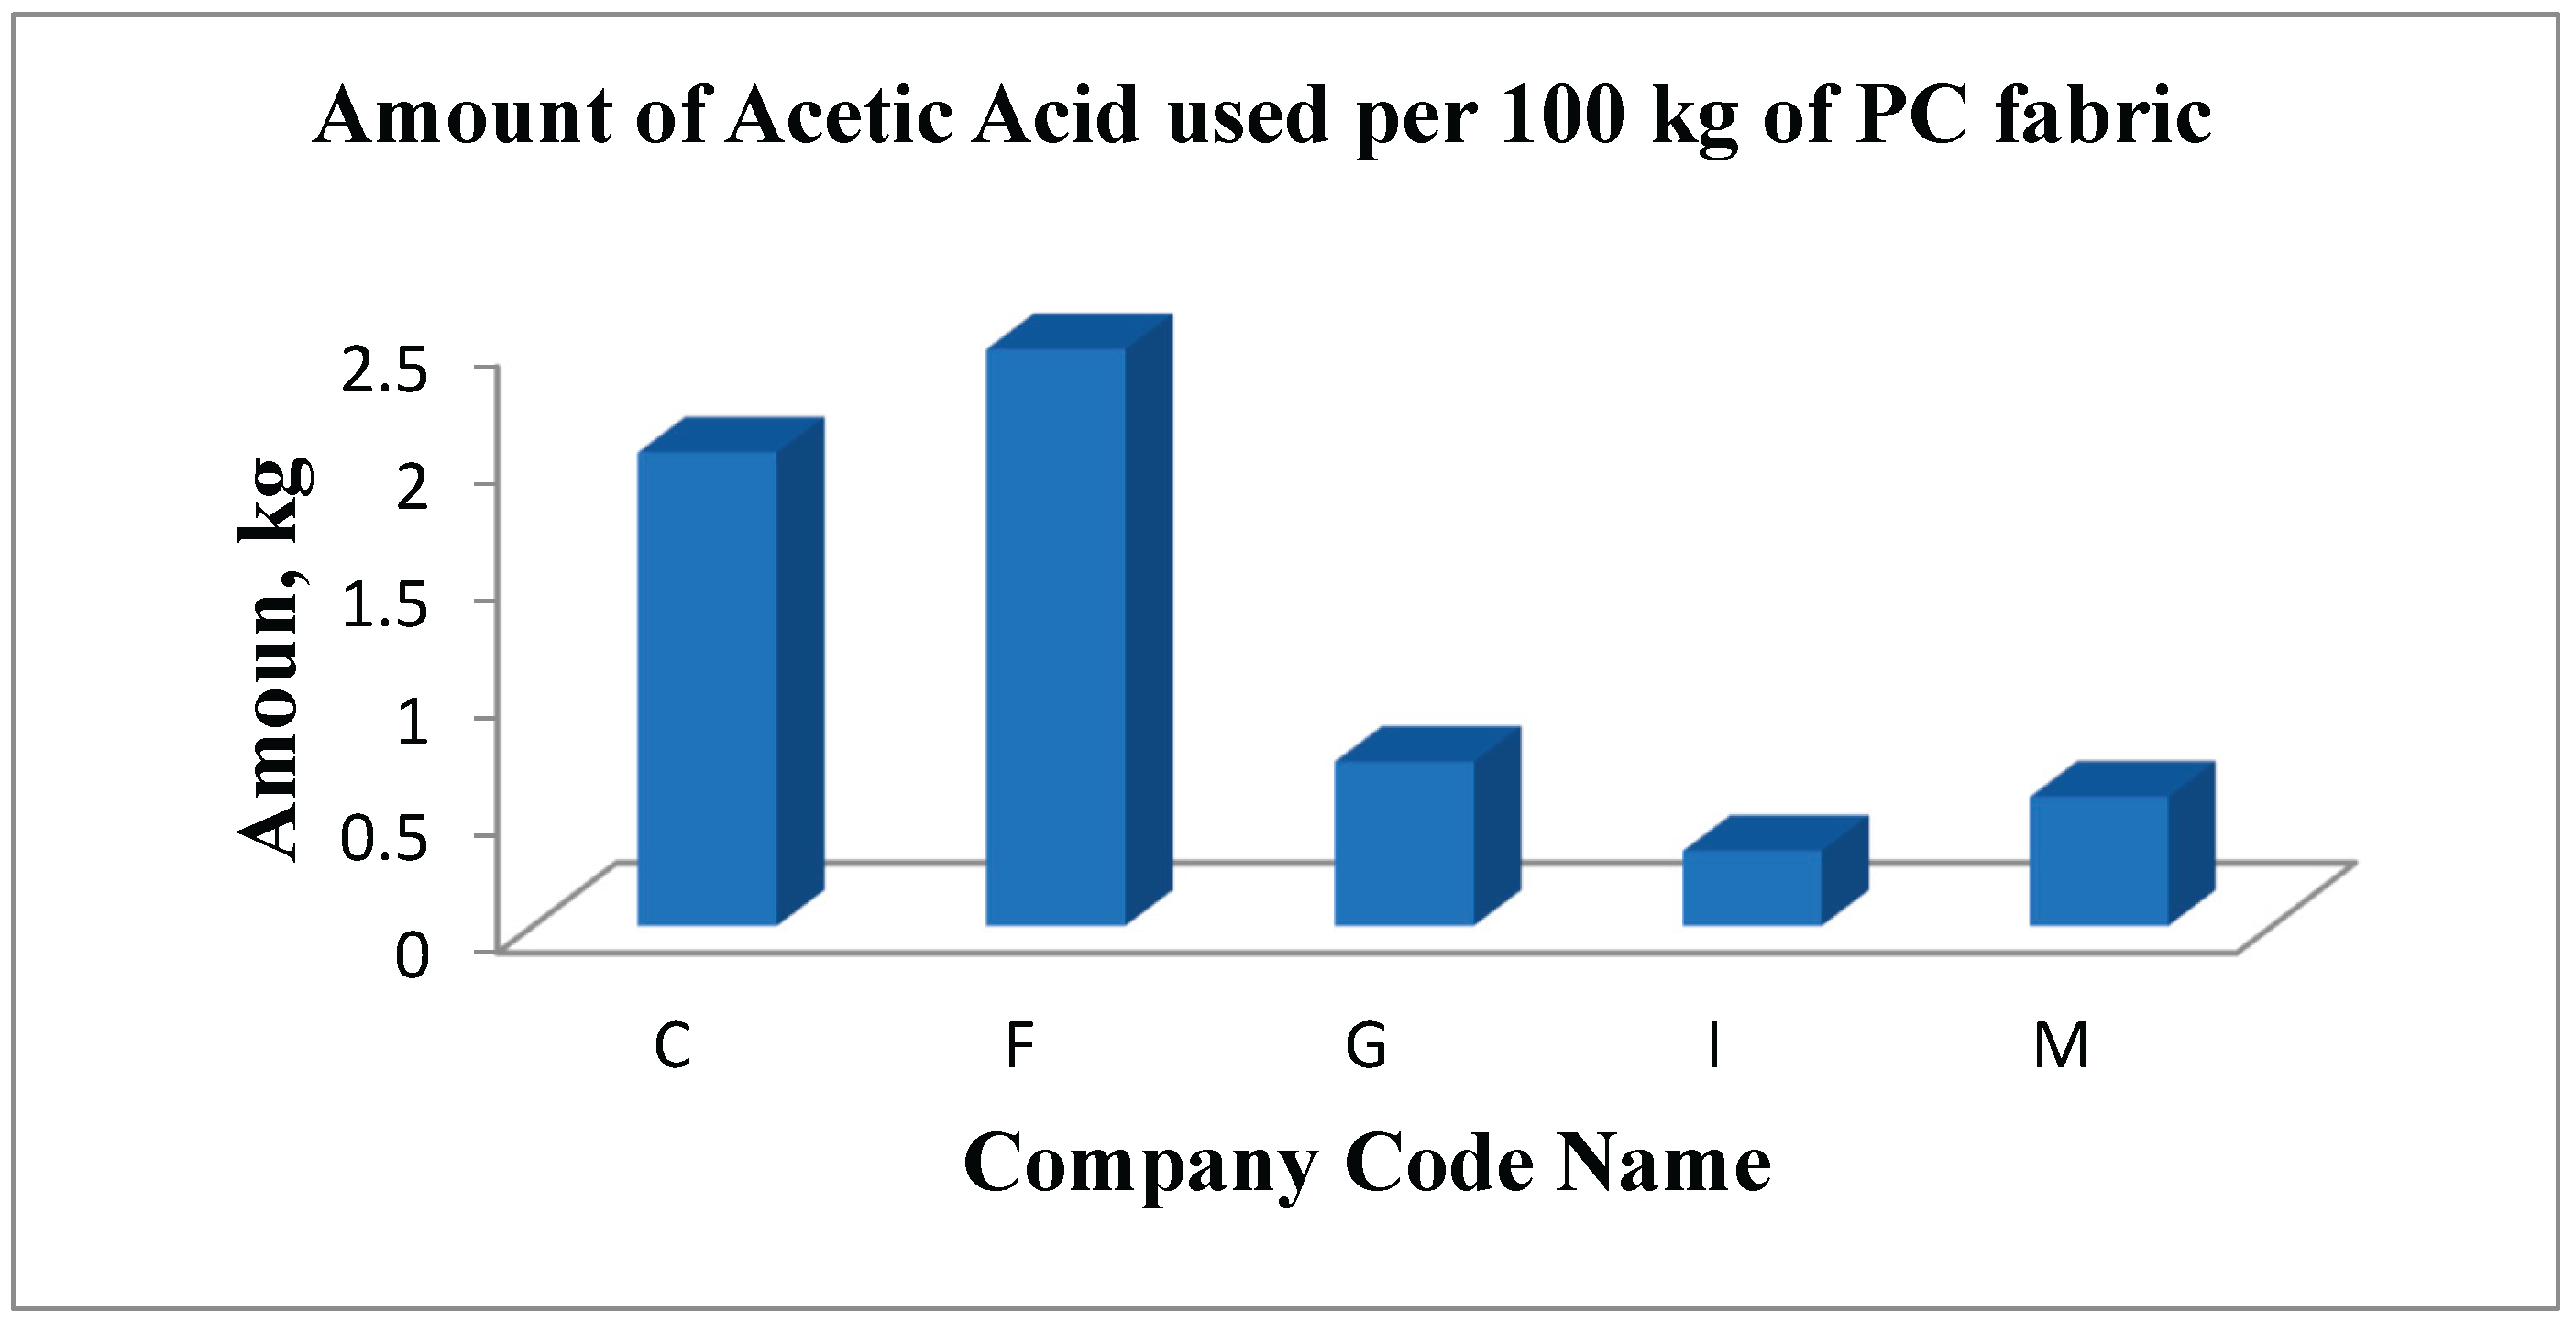
Figure 31.
Amount of acetic acid used per 100 kg of polyester fabric by different companies.
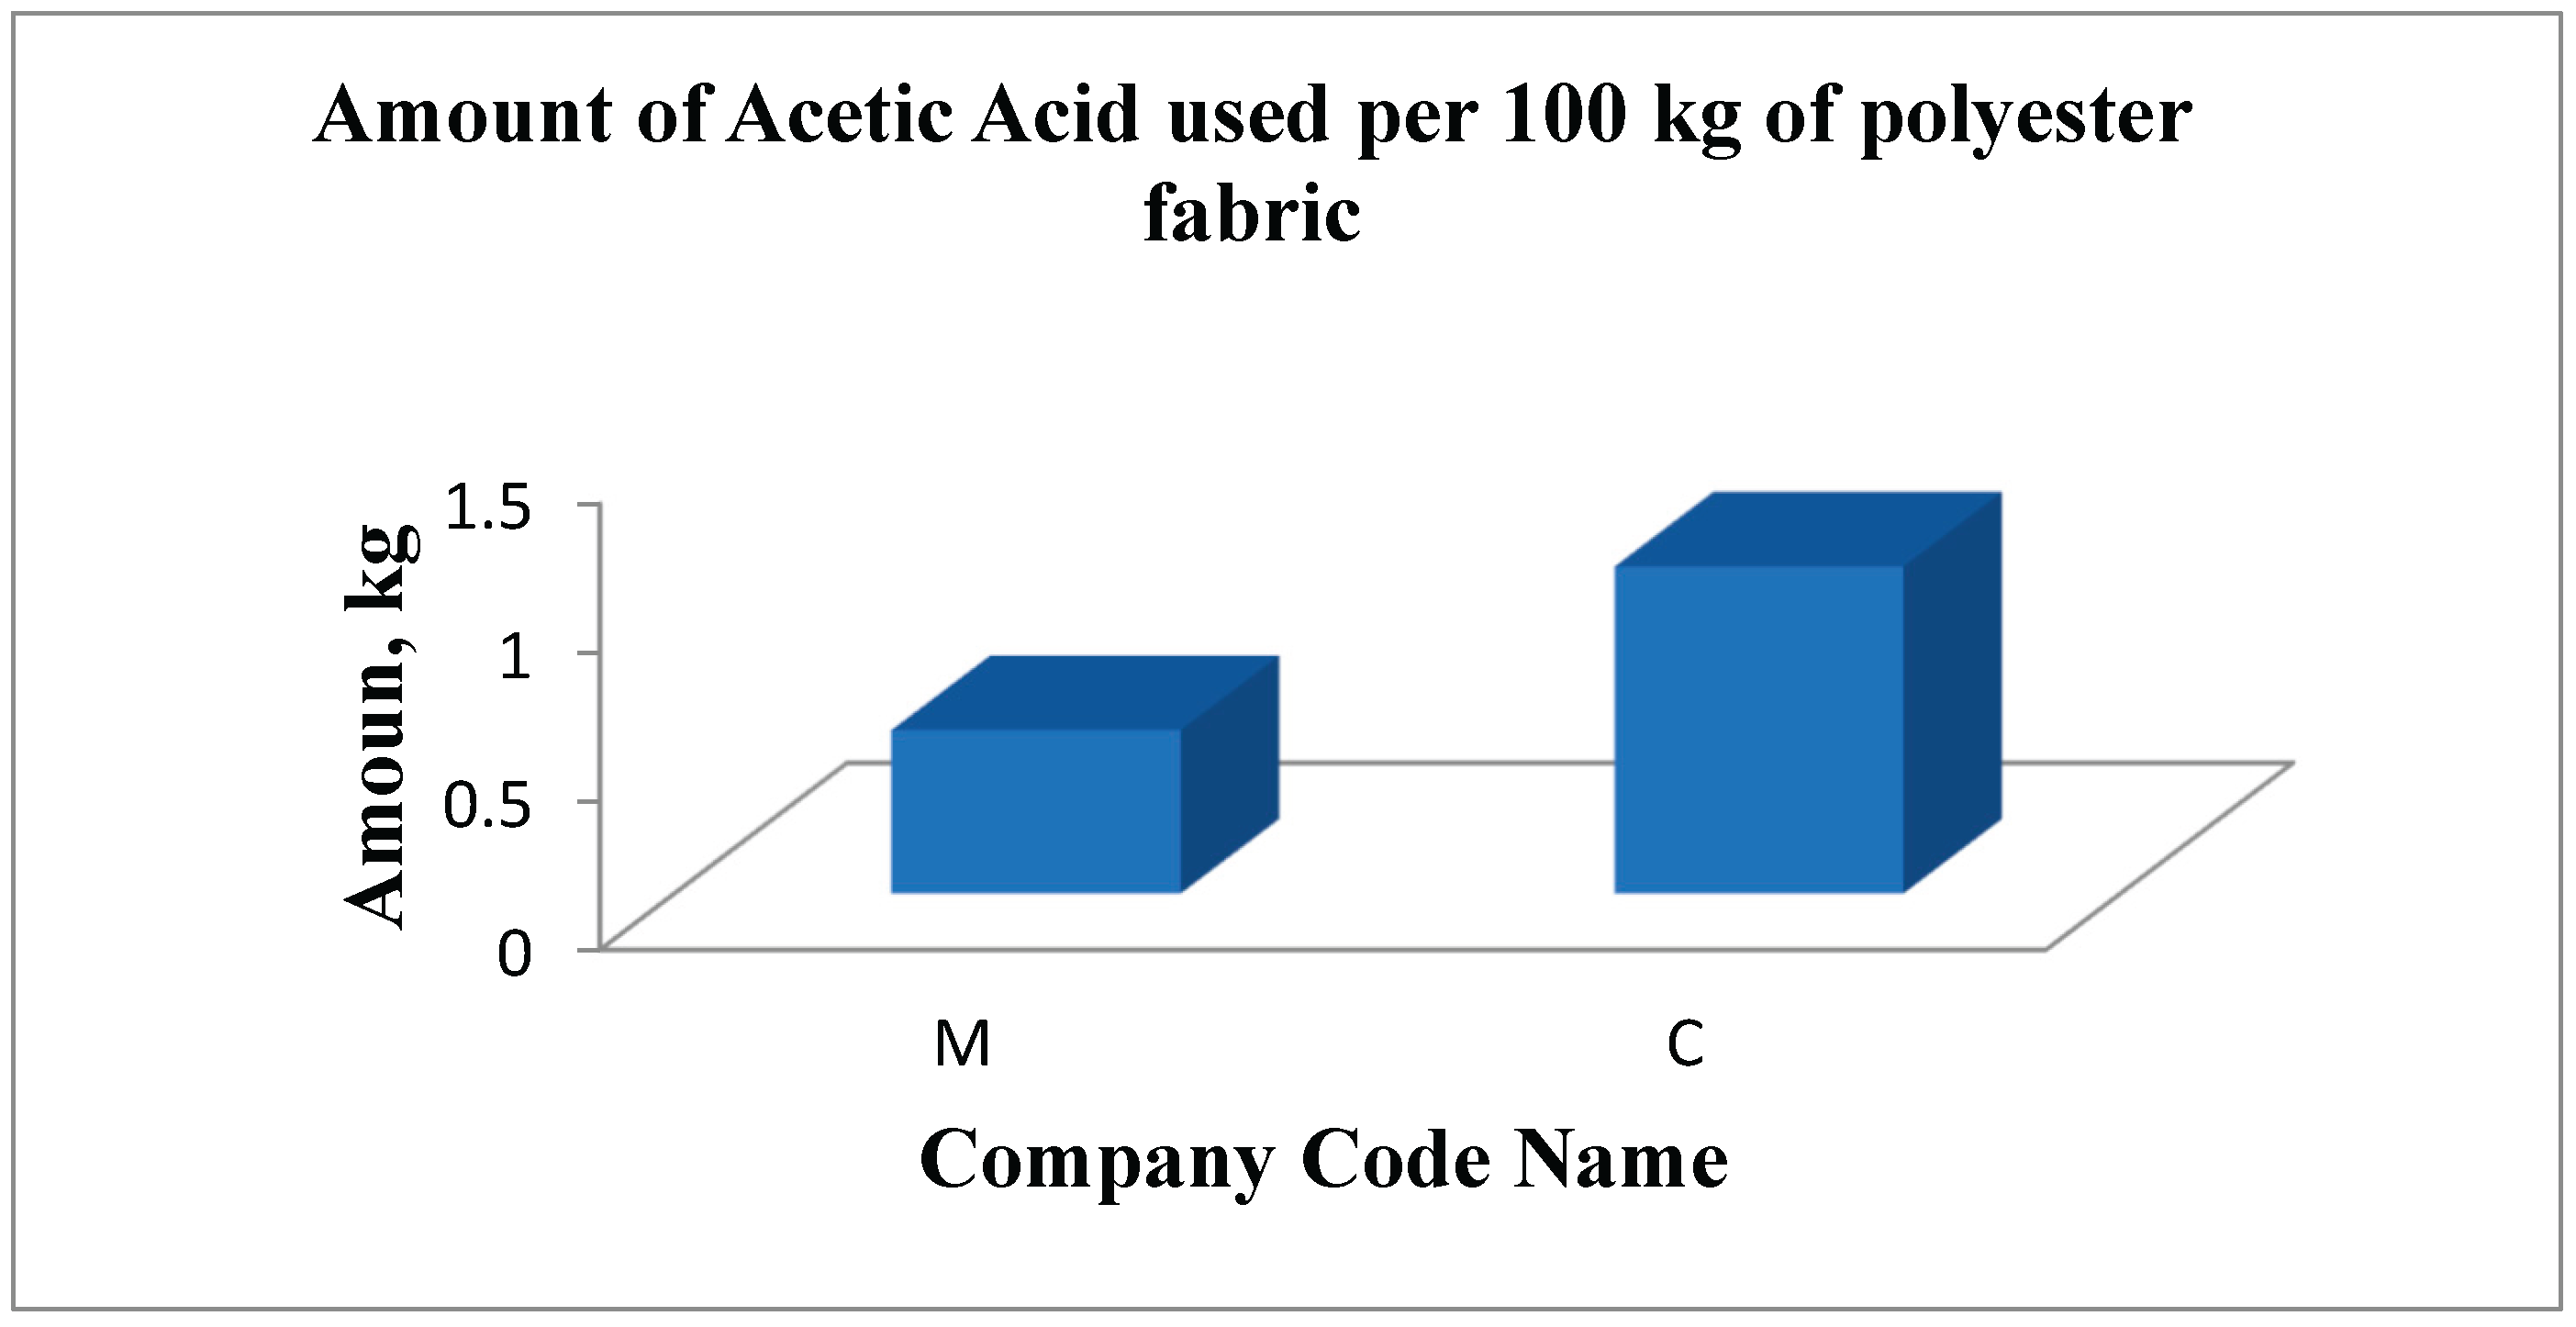
Figure 32.
Amount of dispersing agent used per 100 kg of polycotton fabric by different companies.
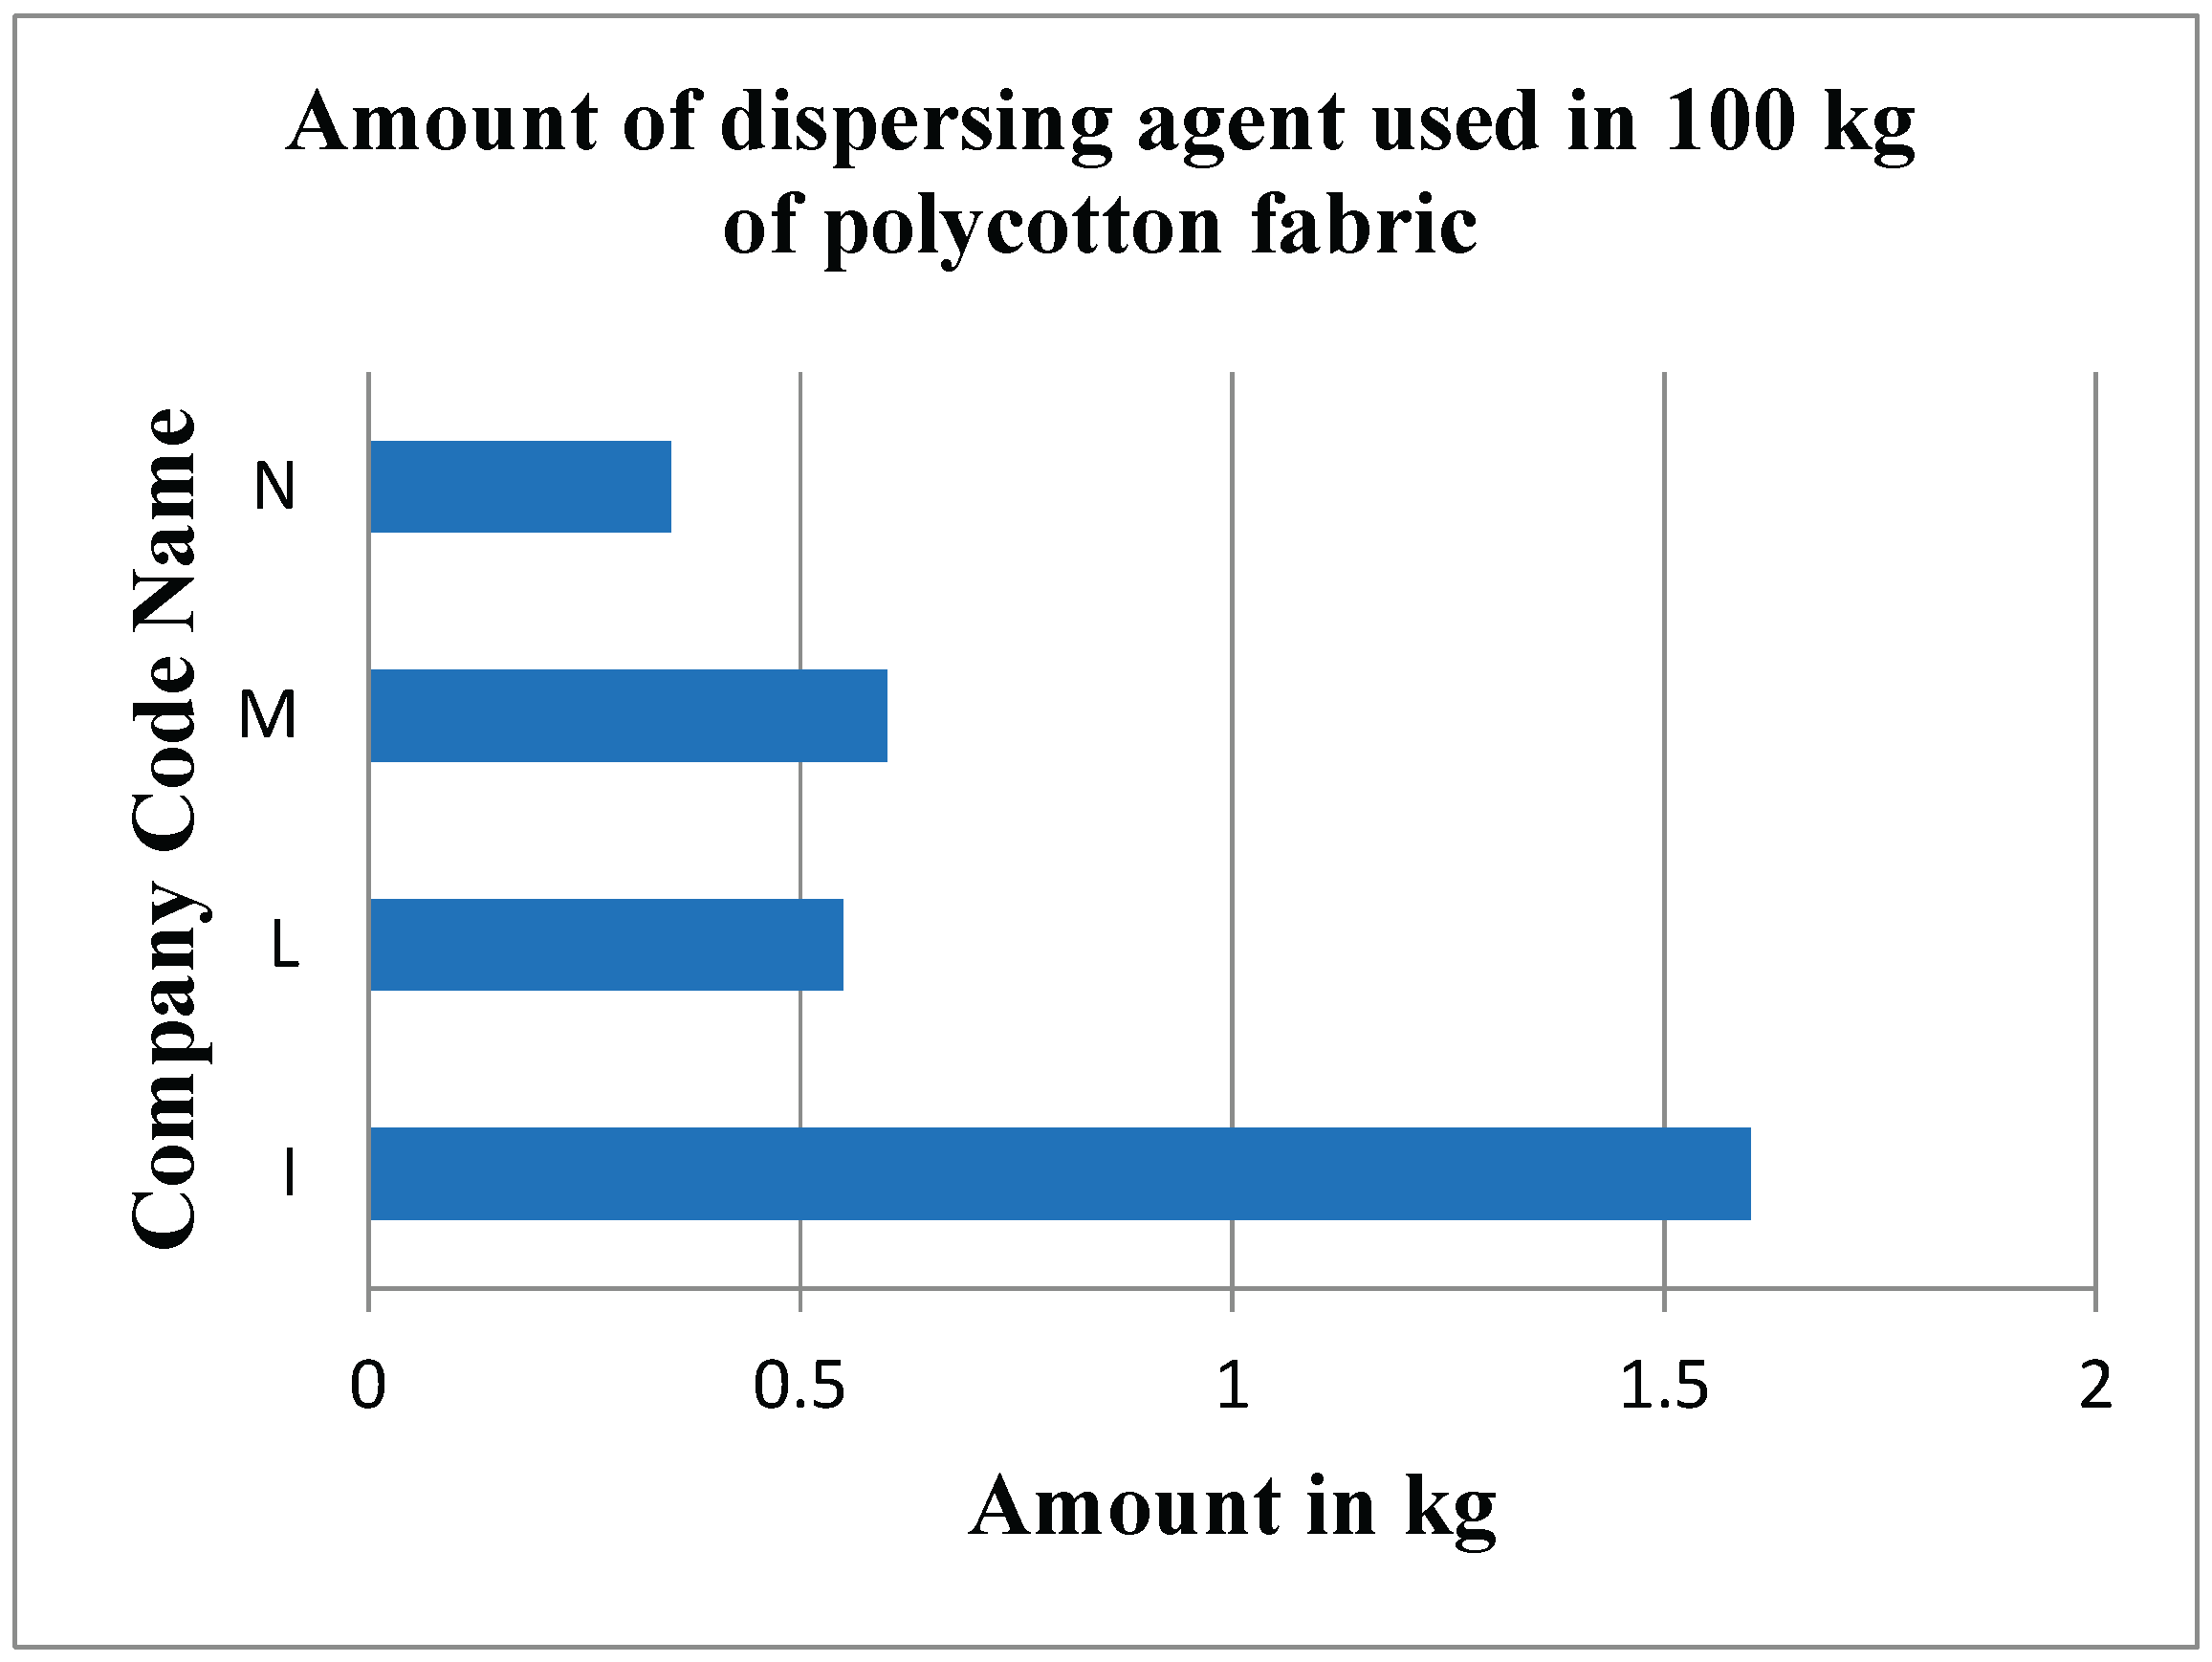
Figure 33.
Amount of reducing agent used per 100 kg of polycotton fabric by different companies.
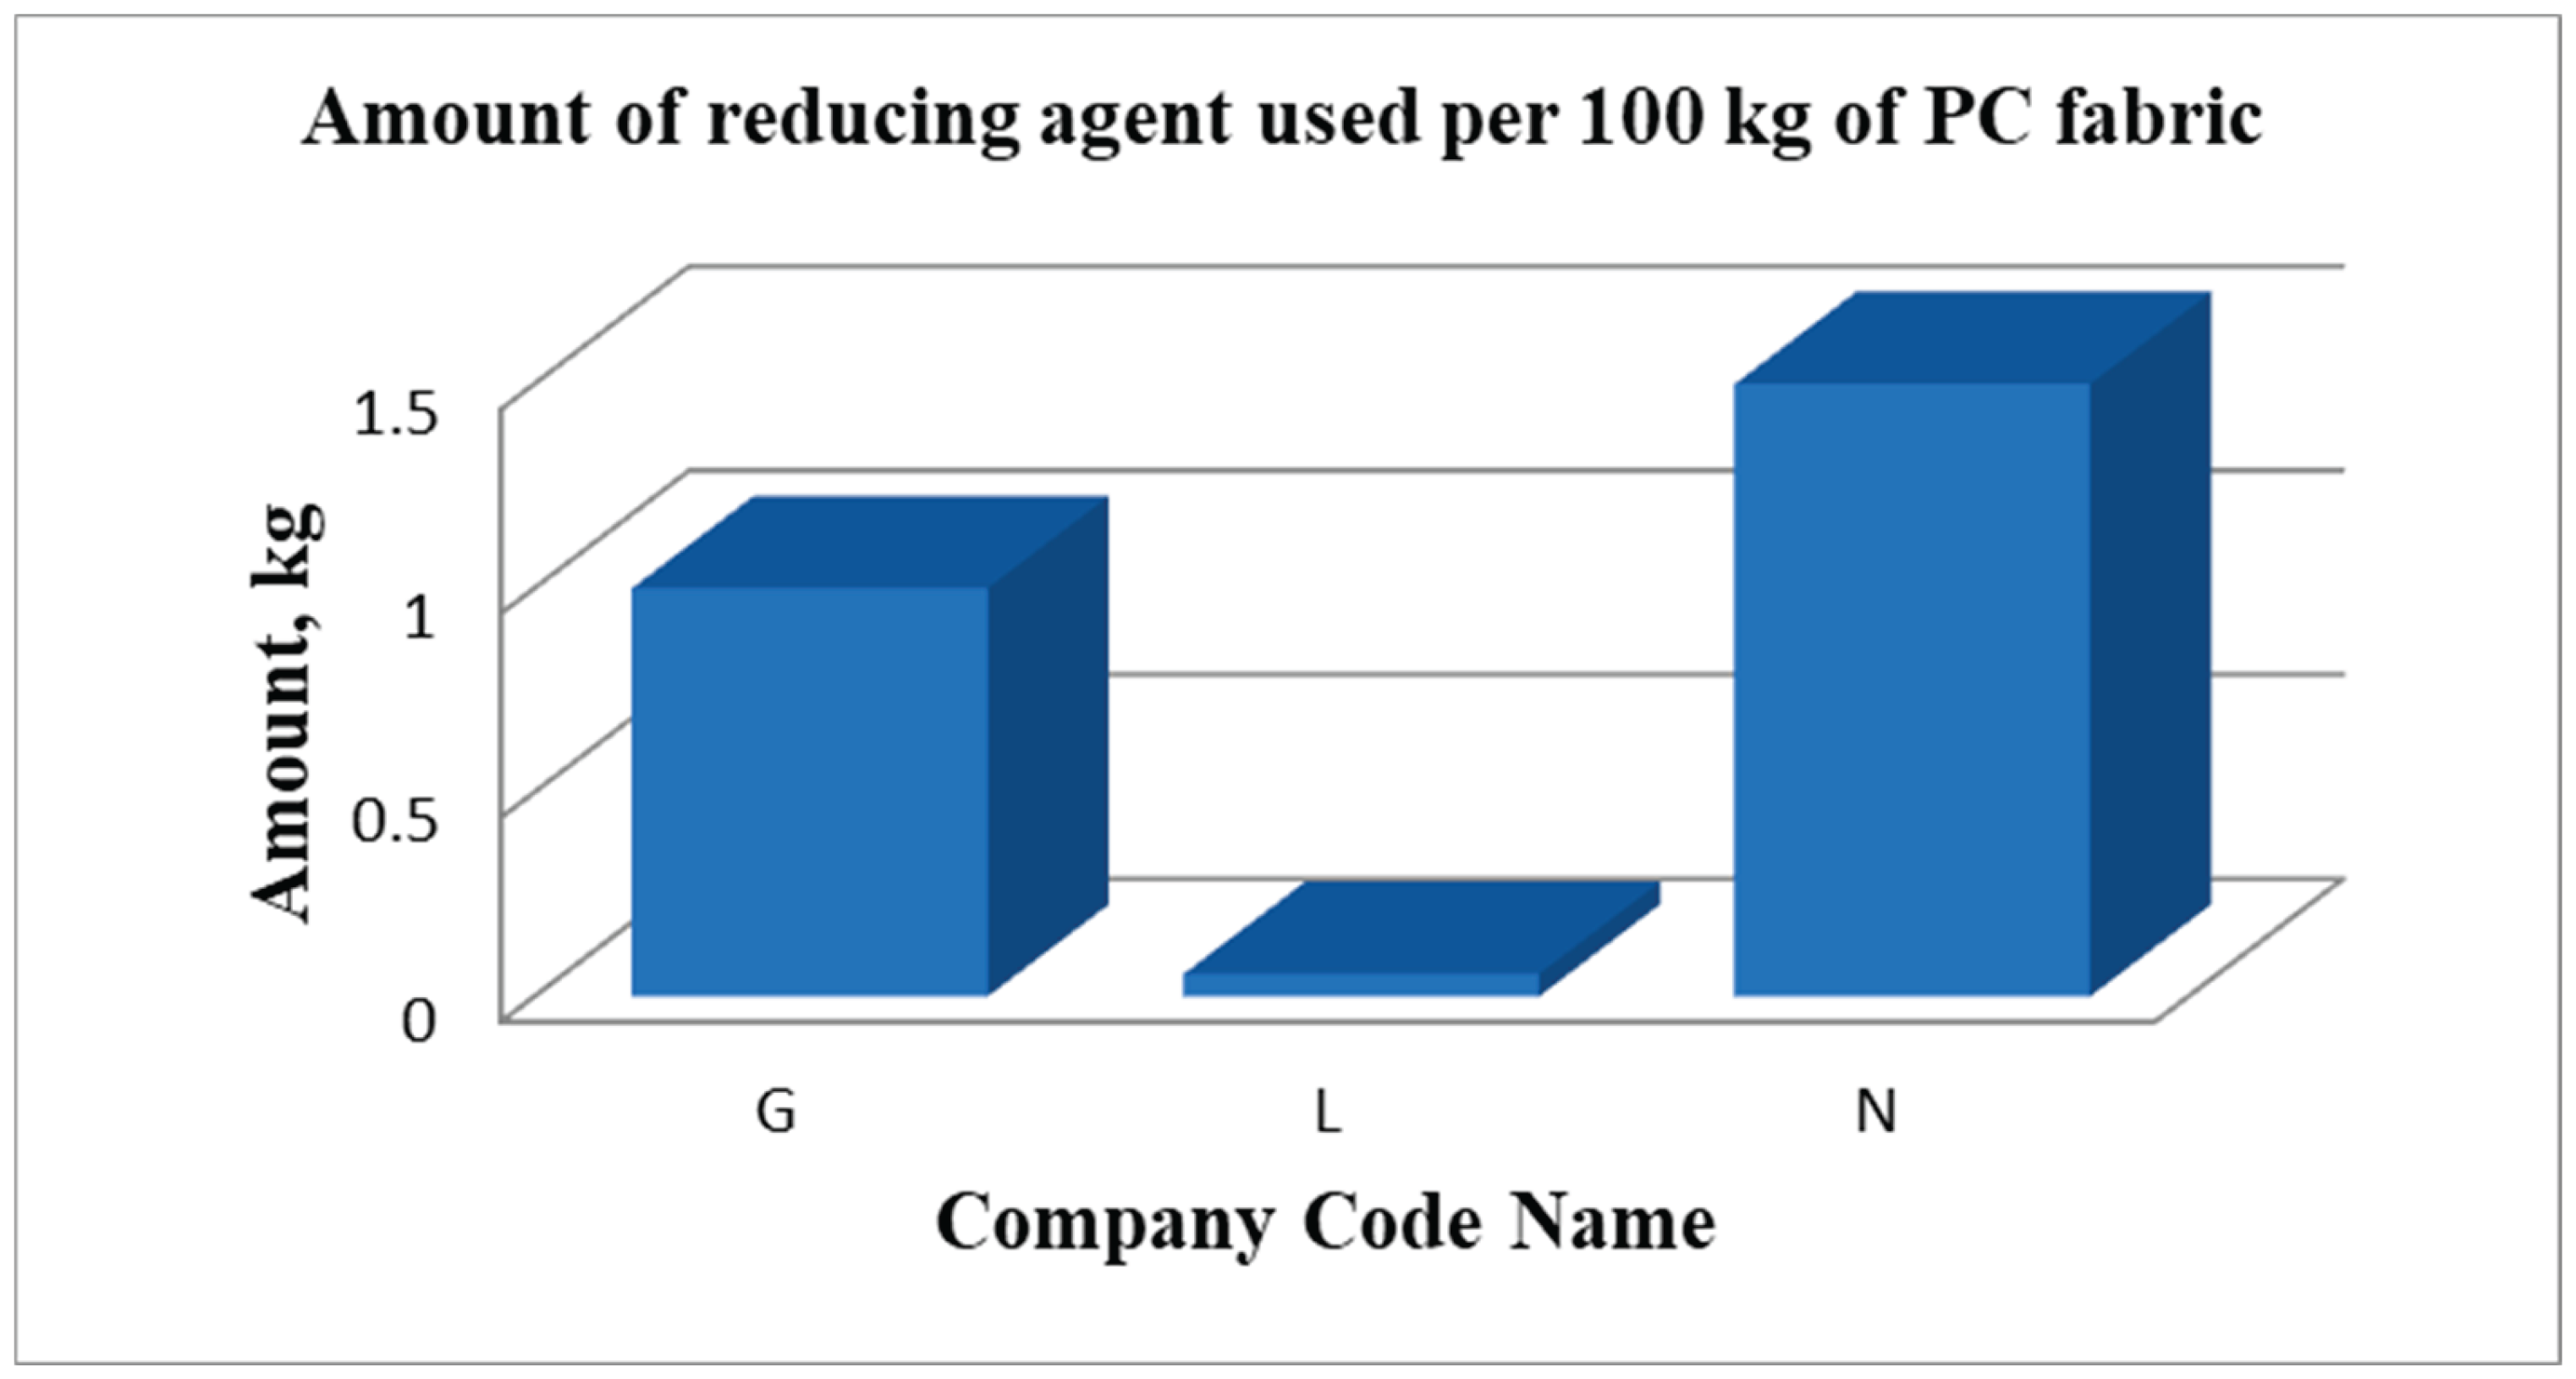
Figure 34.
Amount of reducing agent used per 100 kg of polyester fabric by two companies.
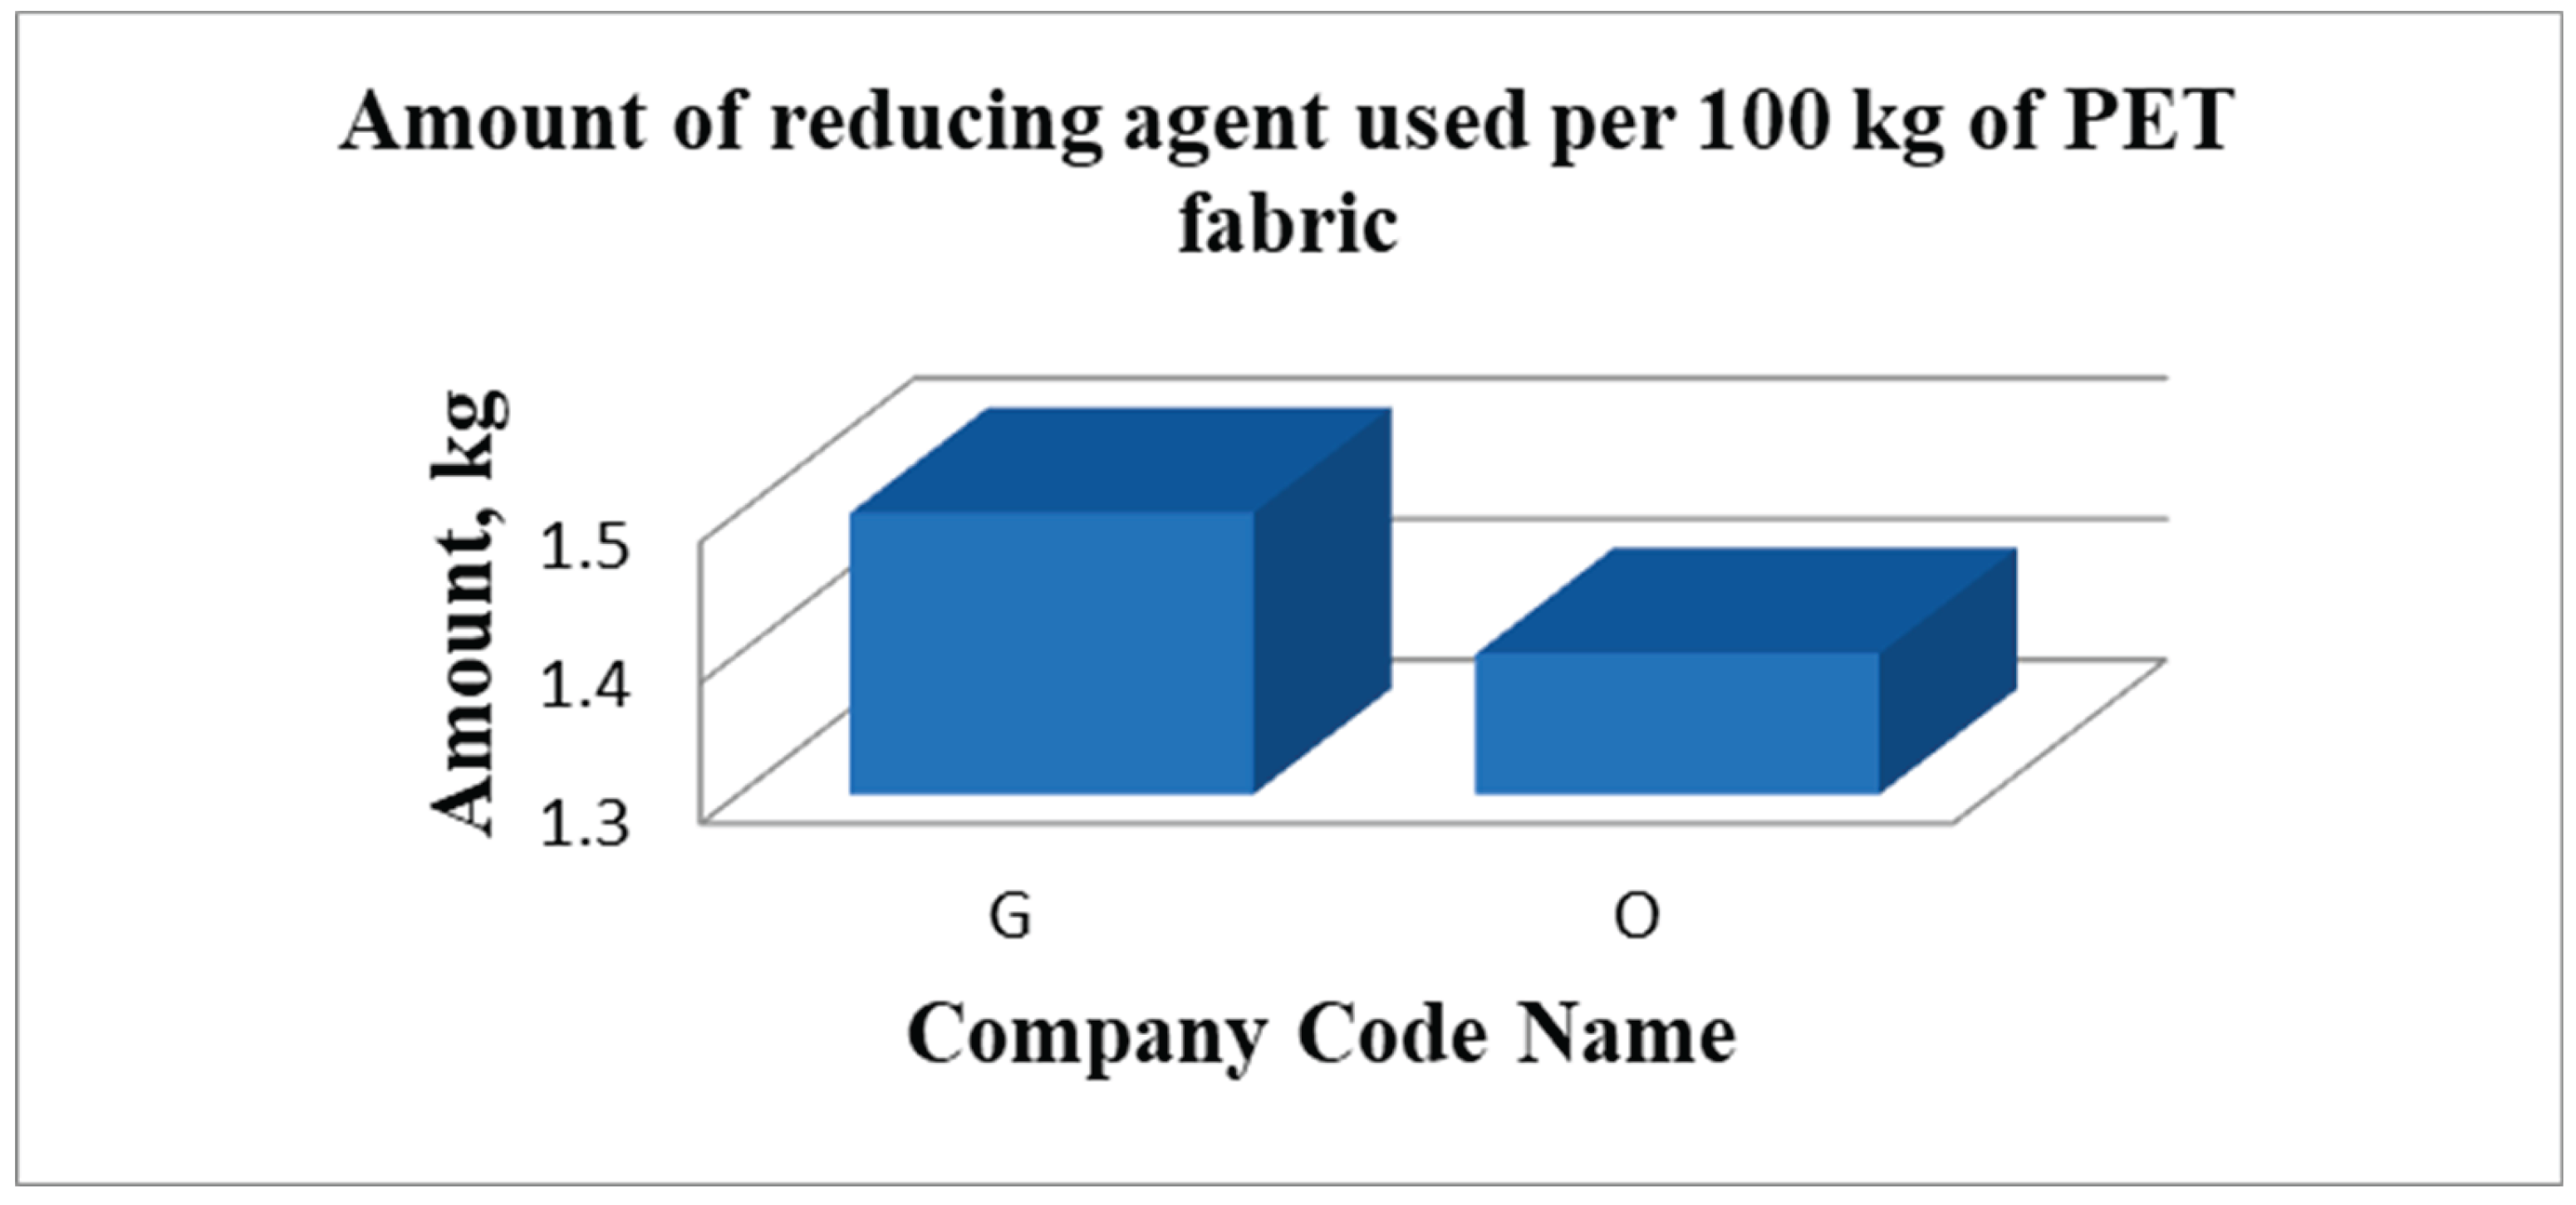
Figure 35.
Amount of fixing agent used per 100 kg of polycotton fabric by different companies.
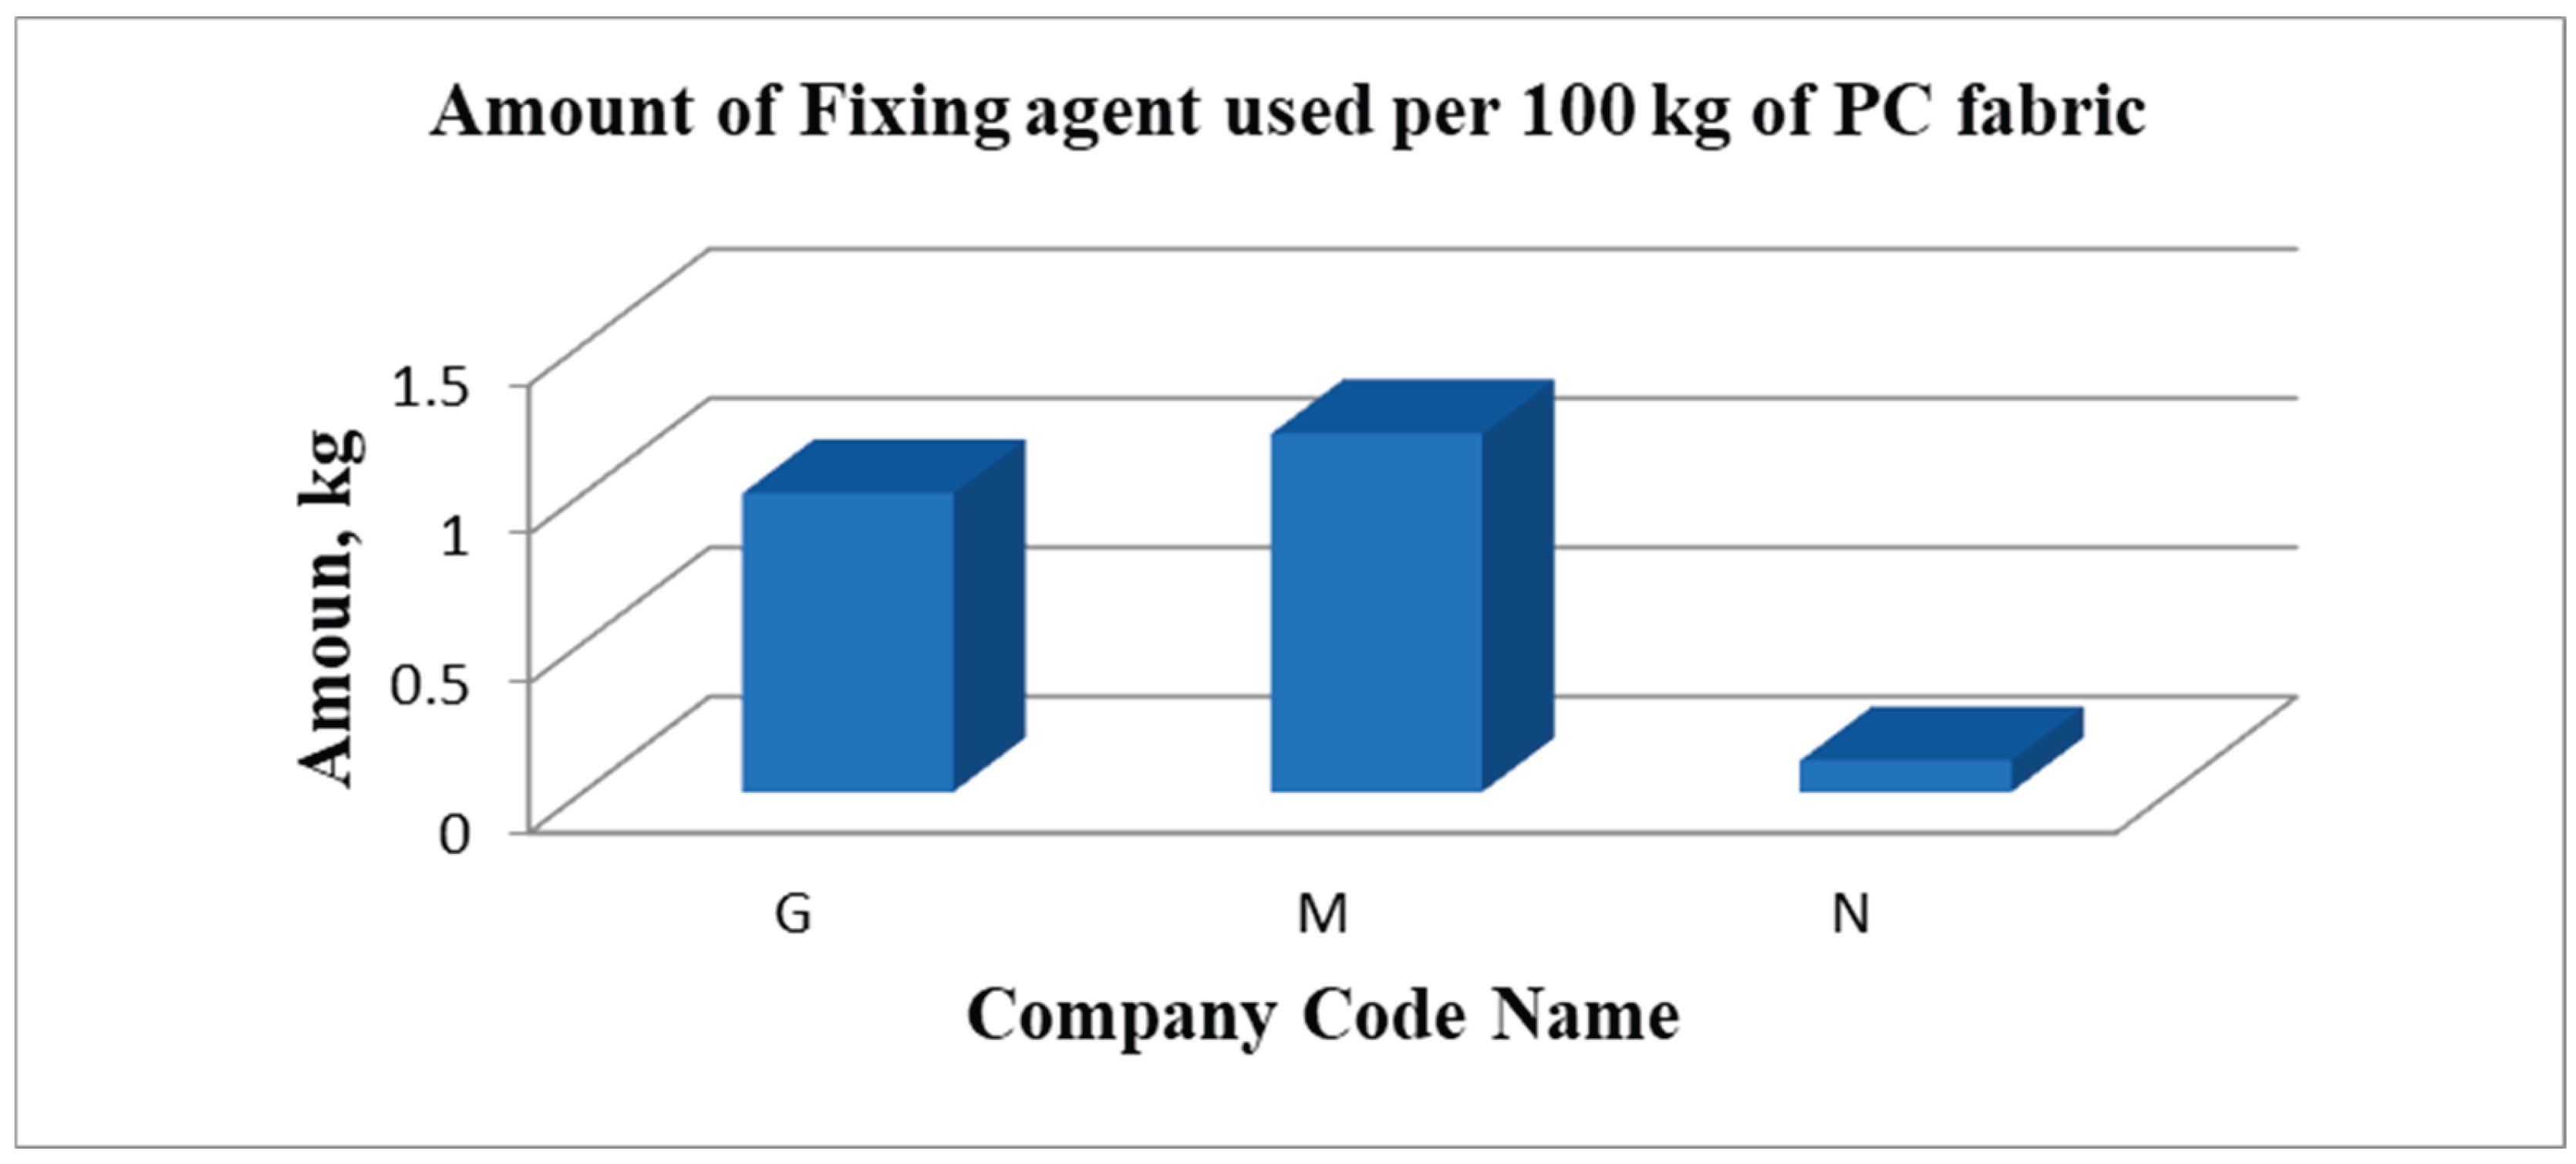

Table 1.
Location of factories participated in the study.
| Company Code Name | Company Type | Location | Types of fabric dyed | ||
| Cotton | Polycotton | Polyester | |||
| A | Knit Composite | Hemayetpur | ✔ | ||
| B | Knit Composite | Zirabo | ✔ | ||
| C | Knit Composite | Mawna | ✔ | ||
| D | Knit Composite | Narayanganj | ✔ | ✔ | ✔ |
| E | Knit Composite | Savar | ✔ | ||
| F | Knit Composite | Fatullah | ✔ | ✔ | |
| G | Knit Composite | Tongi | ✔ | ✔ | ✔ |
| H | Knit Composite | Mirzapur | ✔ | ||
| I | Knit Composite | Durgapur | ✔ | ✔ | ✔ |
| J | Knit Composite | Zirani Bazar | ✔ | ||
| K | Knit Composite | Bhabanipur | ✔ | ✔ | |
| L | Knit Composite | Savar | ✔ | ✔ | ✔ |
| M | Knit Composite | Tongi | ✔ | ||
| N | Knit Composite | Gazipur | ✔ | ||
| O | Knit Composite | Kanchpur | ✔ | ||
Table 2.
Questionnaire provided to the technical manager and production officers of the factories.
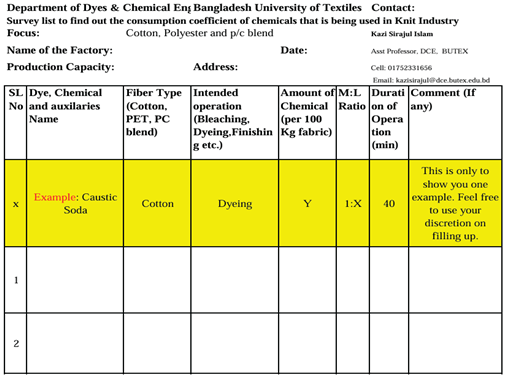 |
Table 3.
Amount of wetting agent used per 100 kg of polycotton fabrics.
| Company Code Name | Fiber Type | Fabric Type | Chemical Name | Process | Amount in kg | |
| 1 | I | polycotton | knit fabric | Wetting Agent | Pre-Treatment | 0.36 |
Table 4.
Amount of Softener used per 100 kg of polyester fabric.
| Company Code Name | Fiber Type | Fabric Type | Auxiliary Name | Process | Amount in Kg | |
| 1 | G | PET | knit fabric | Softener | After Treatment | 6 |
Table 5.
Amount of fixing agent used per 100 kg of polycotton fabric by M.
| Company Code Name | Types of Fiber Used | Types of Fabric | Chemicals Name | Operation | Amount In Kg | |
| 1 | M | polyester | Knit Fabric | Fixing Agent | After Treatment | 1.2 |
Table 6.
Specialized chemicals and auxiliaries used per 100 kg of polycotton fabric by different companies.
Table 6.
Specialized chemicals and auxiliaries used per 100 kg of polycotton fabric by different companies.
| Company Code Name |
Types of Fiber Used | Types of Fabric | Chemicals Name | Operation | Amount in Kg | |
| 1 | M | PC | Knit | Emulsifier | After Treatment | 0.5 |
| 2 | L | PC | Knit | Stabilizer | After Treatment | 0.165 |
| 3 | L | PC | Knit | Peroxide Killer | After Treatment | 0.15 |
| 4 | N | PC | Knit | Citric Acid | All Over | 3.29 |
| 5 | N | PC | Knit | Reduction Inhibitor | Pretreatment | 0.7 |
| 6 | N | PC | Knit | Surfactant And Solvent | Pretreatment | 1.7 |
| 7 | N | PC | Knit | Biopolish | Pre-Treatment | 0.15 |
| 8 | N | PC | Knit | Antifoaming | Pre-Treatment | 0.7 |
Table 7.
Amount of some specialized chemicals and auxiliaries used per 100 kg of polyester fabric by different companies.
Table 7.
Amount of some specialized chemicals and auxiliaries used per 100 kg of polyester fabric by different companies.
| Company Code Name | Types of Fiber Used | Types of Fabric | Chemicals Name | Operation | Amount In Kg | |
| 1 | O | PET | Knit | Solvent | Pre-Treatment | 0.315 |
| 2 | O | PET | Knit | Hydrose | Pre-Treatment | 0.7 |
Disclaimer/Publisher’s Note: The statements, opinions and data contained in all publications are solely those of the individual author(s) and contributor(s) and not of MDPI and/or the editor(s). MDPI and/or the editor(s) disclaim responsibility for any injury to people or property resulting from any ideas, methods, instructions or products referred to in the content. |
© 2025 by the authors. Licensee MDPI, Basel, Switzerland. This article is an open access article distributed under the terms and conditions of the Creative Commons Attribution (CC BY) license (http://creativecommons.org/licenses/by/4.0/).
Copyright: This open access article is published under a Creative Commons CC BY 4.0 license, which permit the free download, distribution, and reuse, provided that the author and preprint are cited in any reuse.


