Submitted:
23 November 2025
Posted:
24 November 2025
You are already at the latest version
Abstract
Volatility forecasting is important for intraday risk control and trade execution in fast-moving financial markets. This study builds a minute-level forecasting framework that combines LightGBM, XGBoost, and CatBoost with an adaptive sliding-window design. The approach is tested on one year of NASDAQ data from 150 active stocks. Realized volatility is computed from intraminute returns. Time-ordered evaluation is used to avoid the use of future information. The ensemble improves forecasting accuracy by 5.9% compared with the strongest single model. Median prediction time remains below 80 ms, which is suitable for real-time use. These results show that combining several boosting models and adjusting the window based on recent error helps follow short-term changes in market behavior. The framework can support intraday risk checks and execution decisions.
Keywords:
high‐frequency trading
; volatility prediction
; boosting models
; adaptive window
; NASDAQ
; minute‐level data
1. Introduction
Volatility forecasting plays an essential role in short-horizon risk management, high-frequency trade execution, and portfolio allocation in modern electronic markets [1]. Under high-frequency trading (HFT), order flow arrives at millisecond intervals, and market states fluctuate rapidly, making real-time volatility prediction both valuable and technically challenging. Recent studies show that data-driven approaches can improve short-term volatility forecasting by incorporating realized measures and microstructure variables extracted from quote and transaction streams [2]. Compared with traditional econometric models, these approaches capture short-run dynamics and nonlinear dependencies more effectively. A related line of research utilizes limit-order-book (LOB) information to estimate minute-level price or volatility movements, where convolution-based and Transformer-style architectures have demonstrated stronger performance in forecasting mid-price changes and realized volatility [3]. However, such models are often computationally expensive and may require frequent retraining, limiting their deployment in real-time environments with strict latency budgets typical of HFT systems. Tree-based boosting models—including LightGBM, XGBoost, and CatBoost—provide an alternative with favorable predictive efficiency. These methods support heterogeneous tabular features, incremental updates, and interpretable feature importance, making them well suited for short-horizon financial prediction [4]. Empirical evidence from equity and commodity markets suggests that boosting-based approaches can match or even outperform neural models in short-term volatility forecasting, and ensembles of boosting models can yield further performance gains [5]. In particular, recent work employing LightGBM for volatility modeling shows that boosting techniques outperform conventional econometric baselines when applied to informative short-horizon features [6], reinforcing their suitability for real-time decision support. However, research specifically evaluating ensemble boosting architectures for high-frequency realized-volatility prediction in U.S. equity markets remains limited.
Despite meaningful progress, several challenges persist. First, market regimes change frequently, and the predictive reliability of static models may deteriorate when structural breaks occur; yet many studies do not explicitly evaluate performance under regime shifts [7]. Second, real-time feasibility is underexplored. Many existing works rely on periodic retraining or very large models whose computational overhead can exceed the sub-100-ms latency constraints commonly encountered in HFT operations [8]. Third, label construction and feature-window design must be handled carefully. Some studies rely on realized measures that may lose intraday variation, while others use fixed windows that risk introducing forward-looking information or ignoring rapidly changing market conditions [9]. These issues highlight the need for models that adapt to evolving market dynamics while maintaining predictable latency for continuous trading environments.
This study proposes an ensemble framework that integrates LightGBM, XGBoost, and CatBoost with an adaptive sliding-window mechanism. The window size dynamically adjusts to recent forecasting errors: when market conditions are stable, the window expands to incorporate richer historical information; when model error increases, the window contracts to emphasize more recent signals. This design enables fast adaptation to regime changes while avoiding full retraining, supporting continuous low-latency operation. The framework is evaluated on minute-level NASDAQ data. Results show that the system satisfies real-time constraints, achieving median prediction latency below 80 ms. Prediction accuracy improves by 5.9% relative to strong single-model baselines. Overall, the findings demonstrate that combining boosting models with adaptive feature-window control yields robust high-frequency volatility forecasts and offers practical value for real-time risk monitoring, execution strategies, and short-horizon portfolio allocation.
2. Materials and Methods
2.1. Study Sample and Data Description
This study uses minute-level transaction and quote data for 150 actively traded NASDAQ stocks. The sample covers a wide range of sectors and market sizes. The observation period lasts for 12 months, which allows the data to capture periods of both calm and active trading. Each minute record contains trade price, best bid–ask quotes, trading volume, and order-book imbalance. Realized volatility is calculated from intraminute price changes. All records are aligned to a common time scale. Days with trading halts, abnormal price gaps, or incomplete records are removed to ensure consistent data quality.
2.2. Experimental Design and Benchmark Comparison
The experiment follows a time-forward design to mimic real-time forecasting. The proposed ensemble serves as the main test model. Three individual boosting models—LightGBM, XGBoost, and CatBoost—are used as benchmarks. All models use the same feature set so that performance differences can be compared fairly. A sliding-window update is used for model input. For the baseline models, the window length is fixed. In contrast, the proposed framework adjusts the window size based on recent forecasting error. Training and evaluation follow the natural time order to avoid using future information. Early data are used for model training, while later data are used for validation.
2.3. Measurement Procedures and Quality Control
Realized volatility is computed from minute-by-minute price changes. When more than one trade occurs within a minute, prices are placed in time order and squared returns are summed. Trades with extreme prices or abnormally small volume are removed to reduce reporting noise. Quote data are matched to trade data using nearest timestamps. Data completeness is checked daily. Days with more than 5% missing information are excluded. All models are trained and tested on the same filtered sample. Model settings are tuned using rolling validation. All timing tests are performed under the same computing environment to ensure comparable latency results.
2.4. Data Processing and Mathematical Formulation
Trade prices are converted to log-returns, and moving statistics are computed over several look-back windows. Order imbalance is measured as the relative difference between buy and sell volume. The response variable is minute-level realized volatility, given by [10]:
where is the intraminute log-return and is the number of trades within minute . Forecast performance is evaluated using root-mean-square error (RMSE) [11]:
Here, and are the observed and predicted volatility at time . All variables are processed in time order to prevent the use of future information.
2.5. Adaptive Sliding-Window Framework
To adjust to changing market conditions, the window size is updated using recent forecast error. When errors remain small, the window increases to include more past data. When errors rise, the window decreases to focus on recent changes. The window is reviewed every five minutes. The updated feature set is then passed to the ensemble model to produce predictions at the next time step. All updates are completed in time order to reflect real-time use.
3. Results and Discussion
3.1. Overall Accuracy and Latency
The boosting ensemble improved minute-level volatility prediction by 5.9% compared with the strongest single boosting model. Accuracy was measured by RMSE under a time-forward evaluation. Median end-to-end prediction time, including feature update and model call, remained under 80 ms. Figure 1 summarizes the accuracy–latency relationship. The ensemble reached lower RMSE than LightGBM, XGBoost, or CatBoost alone while keeping latency within real-time limits. The improvement was more visible during active trading days when price changes were frequent. During calm periods, the advantage was smaller but still positive. This suggests that combining boosting models reduces individual model error without adding notable delay [12].
3.2. Performance Under Different Market and Sector Conditions
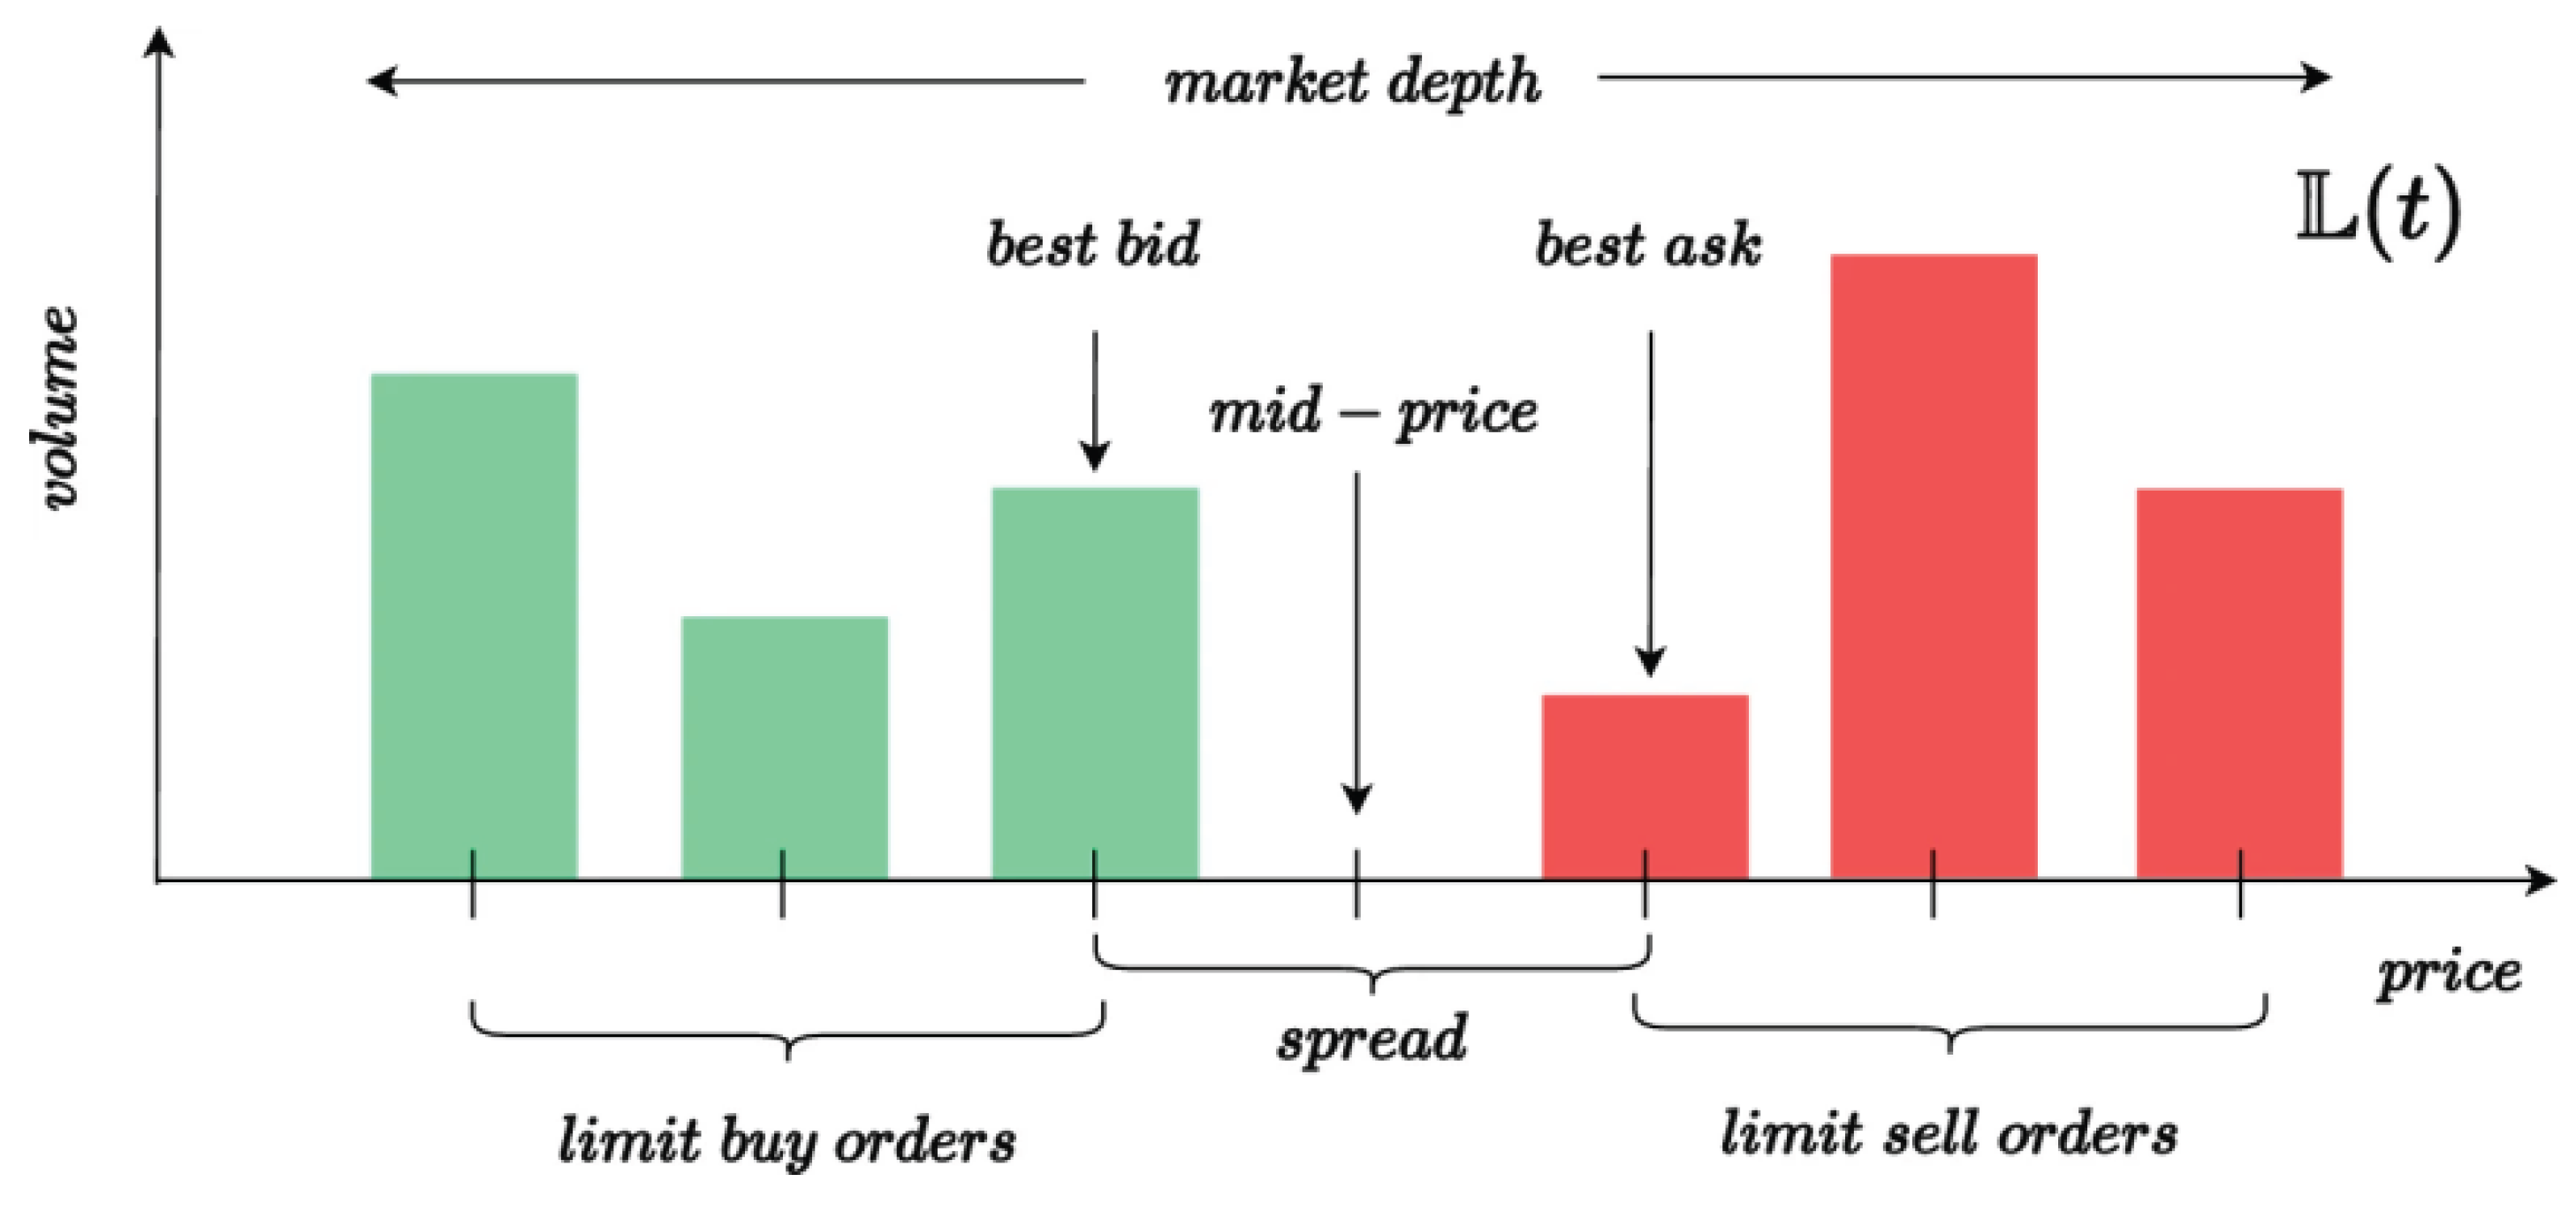
To study performance under different environments, days were grouped into calm, normal, and stressed periods based on intraday volatility and cross-section price variation. The ensemble remained the top model in all three groups. The largest relative gain appeared during stressed periods, when market conditions changed more quickly. Sector analysis showed similar results. Technology, finance, and industrial stocks recorded the strongest benefit, likely because these groups show more frequent short-term price changes. Some recent studies report higher accuracy using deep limit-order-book (LOB) networks, but these models usually require larger computing resources or repeated re-training [13,14]. This increases the cost of real-time use. Our approach provides lower resource cost and predictable run-time, which makes it more suitable for real-time workflows. Figure 2 gives an example reference for LOB-based forecasting.
3.3. Effect of the Adaptive Sliding Window
The adaptive window reduced error when market behavior changed. When recent errors increased beyond a set threshold, the window shortened [15]. This placed more weight on recent data and helped control drift. During more stable periods, the window expanded. This increased the history available to the model and improved stability. Ablation tests showed that the adaptive window accounted for roughly 40–55% of the total error reduction compared with fixed-window designs. The remainder came from combining several boosting models. Because only feature windows were updated, no full re-training was required [16]. Prediction time stayed under 80 ms in all cases, which is suitable for real-time trading systems.
3.4. Comparison with Earlier Studies and Applications
Earlier works using deep LOB models often report strong accuracy [17]. However, these approaches usually need powerful hardware or repeated training. This limits their use in live systems where timing is strict. In contrast, the present framework uses simple feature updates and stable processing time. It reaches accuracy close to heavier models, while keeping prediction time within real-time limits. This balance is important for uses such as intraday risk checks, margin control, and execution scheduling. In practice, the approach is useful when market behavior changes quickly. The adaptive window allows the model to shift focus to recent data without major overhead. Future work may test whether adding selected LOB variables can further improve accuracy under stressed liquidity while keeping latency low.
4. Conclusions
This study evaluated minute-level volatility forecasting using an ensemble of LightGBM, XGBoost, and CatBoost together with an adaptive sliding-window approach. Based on one year of NASDAQ data, the ensemble improved forecasting accuracy by 5.9% over the strongest single model. Median prediction time stayed below 80 ms, indicating that the method can meet real-time needs. These findings show that combining several boosting models and adjusting the feature window can help track short-term changes in market behavior. The approach offers a practical balance between accuracy and computing cost and can support intraday risk checks, execution decisions, and margin control. The current design uses minute-level variables and simple order-flow measures. It does not include detailed order-book depth or related signals, which may limit performance during periods of tight liquidity. Future work may add selected order-book features or light-weight embeddings to improve forecasting under stressed conditions. Extension to multi-asset settings and regime-dependent rules is also of interest. These steps may further strengthen real-time forecasting in changing market environments.
References
- Mettu, V. A. (2025). Finance Trading Algorithms in High-Frequency Markets: Predictive Modeling, Reinforcement Learning, and Real Time Anomaly Detection. International Journal of Computer Technology and Electronics Communication, 8(5), 11335-11347.
- Zhu, W., & Yang, J. (2025). Causal Assessment of Cross-Border Project Risk Governance and Financial Compliance: A Hierarchical Panel and Survival Analysis Approach Based on H Company's Overseas Projects. [CrossRef]
- Mirza, F. K., Pekcan, Ö., Hekimoğlu, M., & Baykaş, T. (2025). Stock price forecasting through symbolic dynamics and state transition graphs with a convolutional recurrent neural network architecture. Neural Computing and Applications, 1-36. [CrossRef]
- Wang, J., & Xiao, Y. (2025). Assessing the Spillover Effects of Marketing Promotions on Credit Risk in Consumer Finance: An Empirical Study Based on AB Testing and Causal Inference. [CrossRef]
- Hasan, M., Abedin, M. Z., Hajek, P., Coussement, K., Sultan, M. N., & Lucey, B. (2024). A blending ensemble learning model for crude oil price forecasting. Annals of Operations Research, 1-31. [CrossRef]
- Liu, Z. (2022, January). Stock volatility prediction using LightGBM based algorithm. In 2022 International Conference on Big Data, Information and Computer Network (BDICN) (pp. 283-286). IEEE. [CrossRef]
- Li, T., Liu, S., Hong, E., & Xia, J. (2025). Human Resource Optimization in the Hospitality Industry Big Data Forecasting and Cross-Cultural Engagement. [CrossRef]
- Kundu, S., & Ghosh, U. (2025). Future Trends in Artificial Intelligence-Driven Information Systems. In Next-Generation Computational Intelligence: Trends and Technologies (pp. 17-49). Cham: Springer Nature Switzerland. [CrossRef]
- Li, S. (2025). Momentum, volume and investor sentiment study for us technology sector stocks—A hidden markov model based principal component analysis. PLoS One, 20(9), e0331658. [CrossRef]
- Corvers, X. (2025). Enhancing Trustworthiness in Algorithmic Stock Forecasting using Multi-Model Machine Learning and Historical Similarity.
- Hu, Q., Li, X., Li, Z., & Zhang, Y. (2025). Generative AI of Pinecone Vector Retrieval and Retrieval-Augmented Generation Architecture: Financial Data-Driven Intelligent Customer Recommendation System.
- Stuart-Smith, R., Studebaker, R., Yuan, M., Houser, N., & Liao, J. (2022). Viscera/L: Speculations on an Embodied, Additive and Subtractive Manufactured Architecture. Traits of Postdigital Neobaroque: Pre-Proceedings (PDNB), edited by Marjan Colletti and Laura Winterberg. Innsbruck: Universitat Innsbruck.
- Yang, J., Li, Y., Harper, D., Clarke, I., & Li, J. (2025). Macro Financial Prediction of Cross Border Real Estate Returns Using XGBoost LSTM Models. Journal of Artificial Intelligence and Information, 2, 113-118.
- Mettu, V. A. (2025). Finance Trading Algorithms in High-Frequency Markets: Predictive Modeling, Reinforcement Learning, and Real Time Anomaly Detection. International Journal of Computer Technology and Electronics Communication, 8(5), 11335-11347.
- Whitmore, J., Mehra, P., Yang, J., & Linford, E. (2025). Privacy Preserving Risk Modeling Across Financial Institutions via Federated Learning with Adaptive Optimization. Frontiers in Artificial Intelligence Research, 2(1), 35-43. [CrossRef]
- Tanaka, T., Nambu, I., & Wada, Y. (2025). Mitigating the Impact of Electrode Shift on Classification Performance in Electromyography Applications Using Sliding-Window Normalization. Sensors, 25(13), 4119. [CrossRef]
- Prata, M., Masi, G., Berti, L., Arrigoni, V., Coletta, A., Cannistraci, I., ... & Bartolini, N. (2024). Lob-based deep learning models for stock price trend prediction: a benchmark study. Artificial Intelligence Review, 57(5), 116. [CrossRef]
Figure 1.
Minute-level volatility prediction results showing accuracy and latency for single boosting models and the proposed ensemble.
Figure 1.
Minute-level volatility prediction results showing accuracy and latency for single boosting models and the proposed ensemble.
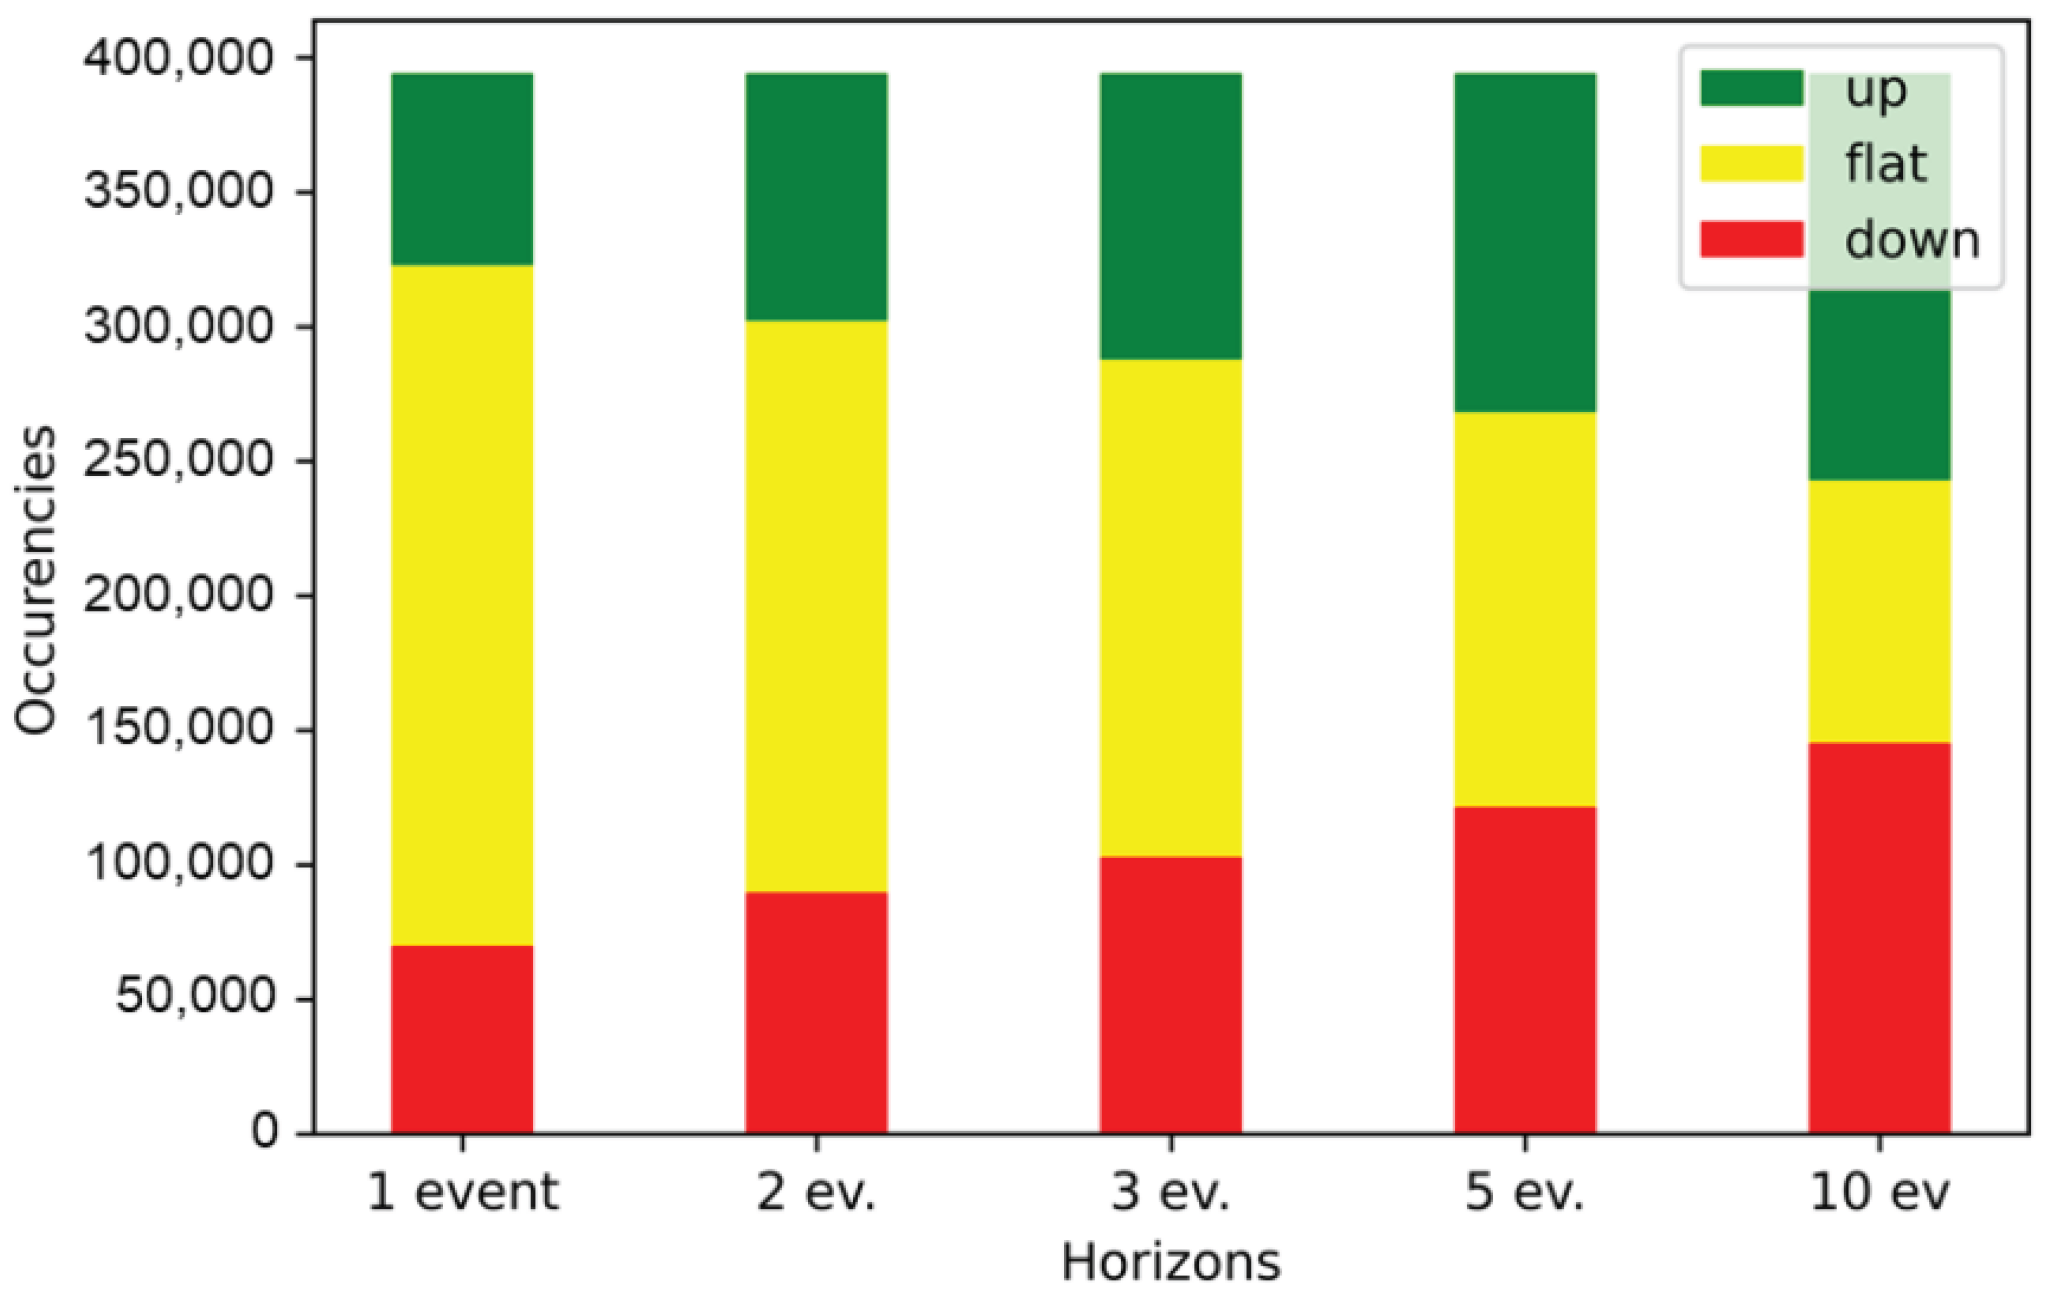
Figure 2.
Overview of a short-horizon forecasting workflow based on limit-order-book inputs.
Disclaimer/Publisher’s Note: The statements, opinions and data contained in all publications are solely those of the individual author(s) and contributor(s) and not of MDPI and/or the editor(s). MDPI and/or the editor(s) disclaim responsibility for any injury to people or property resulting from any ideas, methods, instructions or products referred to in the content. |
© 2025 by the authors. Licensee MDPI, Basel, Switzerland. This article is an open access article distributed under the terms and conditions of the Creative Commons Attribution (CC BY) license (http://creativecommons.org/licenses/by/4.0/).
Copyright: This open access article is published under a Creative Commons CC BY 4.0 license, which permit the free download, distribution, and reuse, provided that the author and preprint are cited in any reuse.


