
Submitted:
21 November 2025
Posted:
25 November 2025
You are already at the latest version
Abstract
Background: Macrophage migration inhibitory factor (MIF) shapes the tumor immune microen-vironment and has been implicated in head and neck squamous cell carcinoma (HNSCC), but its behavior may differ by HPV status. We evaluated whether dynamic changes in circulating MIF (ΔMIF) track disease severity and treatment response in HPV-positive (+) versus HPV-negative (-) HNSCC.
Methods: In this single-center cohort study (n=27, 96 serial serum samples), clinical data were collected from diagnosis through therapy, remission, and relapse. MIF was quantified by ELISA and HPV status was assigned using p16 IHC, HPV DNA, and/or anti-E7 IgG. Associations with stage, treatment. and outcomes were analyzed using non-parametric/Fisher’s exact tests where appropriate.
Results: At baseline (all patients), MIF did not correlate with clinical stage (p=0.63). Stratified analyses revealed heterogeneity: in HPV(+) patients (n=18 analyzable), 56% showed a direct cor-relation between high MIF levels and advanced stage disease, whereas HPV(−) patients (n=5) largely did not. Following concurrent cisplatin/radiation, HPV(−) patients demonstrated a consistent post-treatment decline in MIF (mean ΔMIF −1.23; p=0.031) and all achieved “no evidence of disease” status without recurrence. In contrast, HPV(+) patients showed mixed post-treatment MIF trajec-tories (mean ΔMIF +0.21; p=0.94). Over the full disease course, ΔMIF differed by HPV status (HPV(+) mean of +0.06 vs HPV(-) mean of −1.62; p=0.009.
Conclusions: In HPV(-) HNSCC, post-treatment MIF decline strongly associates with effective response and remission, supporting MIF as a therapy-monitoring biomarker. In HPV(+) disease, baseline MIF may reflect severity, but post-treatment trajectories are heterogeneous and can decrease during active disease/relapse.
Keywords:
MIF
; HPV
; biomarker
1. Introduction
Head and neck squamous cell carcinoma (HNSCC) was previously considered a heterogeneous group of malignancies with complex etiologies primarily linked to smoking and alcohol consumption [1]. A crucial paradigm shift in understanding HNSCC has been its recognition as two biologically and clinically distinct disease entities based on Human Papillomavirus (HPV) status [2,3]. HPV-positive HNSCC, which predominantly affects the oropharynx, generally has a better prognosis and shows superior response to standard concurrent chemoradiotherapy compared to HPV-negative HNSCC [4,5]. These clinical differences stem from disparities in fundamental molecular carcinogenesis mechanisms, gene profiles, and the tumor immune microenvironment (TME) [6,7,8].
HPV positivity can facilitate the streamlining of specific treatment strategies, particularly given the existence of several T-cell-specific therapies developed to specifically target HPV-positive HNSCC [9]. In HPV-positive HNSCC patients, the presence of p16 correlates with the presence of oncogenic HPV DNA and has been commonly used as a surrogate marker for HPV positivity [10]. Similarly, serum antibody levels generated against E7 (one of the HPV-derived oncoproteins) can also serve as a surrogate marker to indicate disease progression or regression during treatment [9]. Identifying biomarkers that accurately reflect these underlying biological differences and can guide personalized treatment strategies remains a significant clinical challenge [6].
Macrophage Migration Inhibitory Factor (MIF) was originally characterized as an immune-promoting lymphokine discovered in the 1960s, secreted by activated T cells [12]. It acts as a crucial regulator of T cell activation, promoting T cell proliferation and the production of key cytokines such as IL-2 and IFN-gamma. MIF's action is evidenced by studies showing that inhibiting its activity suppresses T-cell activation and antibody production. MIF is also secreted by innate immune cells, macrophages and monocytes, supporting the function of Antigen-Presenting Cells (APC) and orchestrating the overall immune response [12].
However, MIF is now widely recognized as a key driver of cancer progression in several malignancies, including HNSCC [13]. Overexpression of MIF, which is primarily derived from macrophages and monocytes, is closely associated with poor prognosis in various solid tumors. This cytokine plays a critical role in TME maintenance, aiding cancer cell survival by regulating apoptosis through p53 suppression. Moreover, MIF establishes a potent immunosuppressive environment within the TME. Specifically, it supports the development of pro-tumorigenic M2 macrophages, inhibits T-cell activation, and promotes the recruitment and function of Myeloid-Derived Suppressor Cells (MDSC) and CD4+ T-regulatory cells [13,14]. Through these complex actions, MIF contributes to cell proliferation, angiogenesis, invasion, and tumor immune evasion, thereby increasing the cancer's aggressiveness [13].
While MIF's involvement in tumor biology is established, its specific regulation and effects within the context of viral carcinogenesis, such as with HPV, are complex and conflicting [13]. Generally, MIF overexpression has been reported in HPV-related malignancies like invasive cervical cancer, but the literature concerning HNSCC is less clear. Some studies suggest MIF levels are higher in HPV-negative patients, while contrasting in vitro studies found higher MIF secretion in HPV-positive HNSCC cell lines. This higher secretion was linked to the stimulation of Warburg effect-related enzymes by the HPV oncoproteins E6 and E7, which in turn promotes the production of lactate and Hypoxia-Inducible Factor 1 alpha (HIF-1 alpha), leading to MIF secretion [13,15]. This conflicting data highlights a significant gap in understanding how HPV infection modulates MIF expression and its subsequent biological function in HNSCC [13].
The single, static measurement of circulating factors like MIF at the time of diagnosis may be limited by the inherent variability and fluctuation of cytokine levels during the dynamic processes of cancer progression and treatment [15]. Therefore, to overcome these limitations and fully capture the prognostic or predictive potential of MIF, a dynamic analysis measuring the change in MIF (Delta MIF) across various clinical phases, including diagnosis, chemotherapy, remission, and recurrence, is essential.
The standard treatment for locally advanced HNSCC often involves Cisplatin and concurrent radiation therapy [16,17]. Cisplatin, a platinum-based chemotherapeutic agent, is known to induce apoptosis and reduce tumor burden. Cisplatin has been reported in the literature to reduce MIF levels in various tumor types [18], presumably due to the reduction of tumor mass and associated pro-tumorigenic TME components like MDSCs [19]. Given the distinct clinical outcomes and molecular profiles of HPV-positive and HPV-negative HNSCC, investigating the effect of Cisplatin-based concurrent treatment on MIF dynamics in a manner stratified by HPV status is crucial [4,19]. This analysis can illuminate a direct link between changes in MIF levels and a patient's treatment response [19].
Considering the divergent clinical courses of HPV-related HNSCC and the ambiguous role of MIF in this setting, the present study aims to conduct a dynamic analysis of serum MIF levels [13]. By tracking MIF expression patterns throughout the entire clinical course -from diagnosis to treatment, remission, and recurrence - and stratifying the results by HPV status, we seek to:
(1) Clarify the relationship between MIF expression and cancer severity in both HPV-positive and HPV-negative disease.
(2) Evaluate MIF's potential for monitoring response to Cisplatin and concurrent radiation therapy.
(3) Propose hypotheses regarding the distinct biological functions and roles of MIF within the TME of each HPV subgroup [15].
2. Materials and Methods
2.1. Study Cohort and Data Collection
The study was reviewed and approved by the University of Louisville Institutional Review Board (IRB# 08.0388, 15.0582). Anonymized patient serum and clinical information were obtained from the Brown Cancer Center Biorepository from patients diagnosed with Head and Neck Squamous Cell Carcinoma (HNSCC) in 2022. Blood for serum analysis was initially drawn for disease diagnosis and subsequently, if necessary, when the patient visited the hospital for treatment, follow-up, and other purposes. All serum specimens were processed by collecting blood into additive-free vacuum tubes, allowing it to clot for 30 minutes, centrifuging it, aliquoting it, and storing it at -80°C until analysis.
A total of 27 HNSCC patients were included in this study. Information on age, sex, stage, and tumor location was collected for all patients (Table 1). The moment the first biopsy for diagnosis was performed on each patient was designated as the 1st visit. Subsequent procedures, such as tumor resection, therapeutic drug administration, radiation therapy, follow-up blood tests, follow-up examinations, recurrence checks, and immunotherapy, were designated as the next visits, in order. Therefore, after the 1st visit, all patients had results for p16 expression (a surrogate marker for HPV-positivity) or HPV DNA testing.
During the data collection process, p16 results were missing for two of the 27 patients. Furthermore, HPV DNA testing was performed at the patient's discretion, so only 7 of the 27 patients had HPV DNA results. The study obtained a total of 96 serum samples for analysis: 2 serum samples from 6 patients, 3 samples from 10 patients, 4 samples from 6 patients, 5 samples from 4 patients, and 6 samples from 1 patient. These 27 patients were classified as having initial HPV positive (+) or HPV negative (-) cancer based on their p16 expression and HPV DNA test results, as well as their Anti-E7 antibody levels.
2.2. Measurement of Serum MIF Levels
Serum MIF levels were measured using a sandwich ELISA method. A 96-well high-binding polystyrene ELISA microplate kit (Human MIF ELISA Kit – Quantikine) was purchased from R&D Systems. The assay was performed according to the manufacturer's instructions. The total of 27 patient samples was analyzed across two separate ELISA plates (Plate 1 and Plate 2). Plate 1 contained 12 patient samples, and Plate 2 contained 16 patient samples. Each patient sample was measured in duplicate on the plate. Due to limited space on Plate 1 to accommodate all samples from Patient 12, Patient 12 was re-labeled as Patient 16 and re-analyzed on Plate 2
The ELISA assay was read using a Synergy HT (BioTek) instrument at 30-minute and 60-minute intervals, at wavelengths of 450 nm and 540 nm. The data from the 60-minute interval was used for the analysis. For accurate concentration values, the 540 nm reading was subtracted from the 450 nm reading. This final concentration was calculated as the average of the duplicate measurements for each patient to yield the final patient concentration.
2.3. Anti-E7 Antibody ELISA Measurement Method
The HPV E7 oncoprotein was generated through bacterial cell culture using a viral plasmid (pQE30) purchased from the manufacturer (Qiagen). E7 oncoprotein production was confirmed via gel electrophoresis and Western Blot. This identical procedure for E7 antigen generation is described in more detail in our previously published paper [Rf-6, 7]. ELISA 96-well plates (Immulon 2HB, Thermo Sci) were coated with the E7 oncoprotein, diluted 1:200 in PBS, for 1 hour, followed by three washes. Patient serum, diluted 1:50 in PBS, was added to the ELISA trays overnight. The following morning, the trays were washed three times. An alkaline phosphatase-conjugated secondary mouse anti-human antibody (Sigma) was added at a 1:2000 dilution and allowed to react for 1 hour, followed by three washes. Alkaline phosphatase substrate was added to express the signal on the ELISA trays, according to the ELISA manufacturer's instructions. The ELISA assay was read using a Synergy HT (BioTek) instrument at 30, 50, and 70-minute intervals. The data from the 30-minute interval was used as the reported data because it provided the clearest signal differentiation between the test and control groups.
2.4. Correlation Analysis
Data were analyzed utilizing the Microsoft Excel, Prism, and MedCalc statistical software. The analysis of significance was done via FISHER's exact testing of contingency tables as the cohort was too small for a chi-square (χ2) analysis to be accurate. For contingency tables larger than 2×2, a Freeman-Halton extension was added to the FISHER's exact test.
2.4.1. Correlation Analysis with Initial Diagnosis Stage
The correlation between MIF levels and the initial diagnosis stage was analyzed. The distance between the stage and the MIF level was analyzed, and if this distance was less than or equal to 1, the correlation was defined as very high. If the distance was greater than 2, it was analyzed as having an inverse correlation.
2.4.2. ΔMIF Analysis
To measure the pattern of increase or decrease in MIF levels during the patient's treatment and disease progression, Delta MIF (ΔMIF) was calculated for each patient. Delta MIF was determined by subtracting the MIF value of the initial visit from the MIF value of the subsequent visit. Therefore, a ΔMIF value greater than 0 indicated an increase, less than 0 indicated a decrease, and equal to 0 indicated no change. The overall MIF pattern for each patient was determined by summing the ΔMIF values across all stages to obtain a final ΔMIF value.
2.4.3. Correlation Analysis with Anti-E7 Antibody
The correlation between the Anti-E7 antibody positive/negative status and MIF levels was analyzed. An Anti-E7 antibody titer (optical density) of 0.25 O.D. or higher was defined as positive, and less than 0.25 O.D. was defined as negative. If the distance between the MIF level and the Anti-E7 antibody positive/negative status was less than or equal to 1, a very high correlation was considered, and if the distance was greater than 2, an inverse correlation was analyzed.
3. Results
3.1. Demographic, Clinical, and HPV Status in Head and Neck Squamous Cell Carcinoma Patients
The average age of 27 Head and Neck Squamous Cell Carcinoma (HNSCC) patients was approximately 60 years (Table 1). The cohort consisted of 19 Caucasian males, 4 Caucasian females, and 4 African American males. The primary tumor location was mainly the tonsil, but some patients had tumors in various oropharyngeal sites. Five patients were diagnosed with Stage IV disease, 13 with Stage III, 7 with Stage II, and 1 patient with Stage I disease.

Table 1.
Demographic, Clinical, and HPV Status in Head and Neck Squamous Cell Carcinoma Patients. This table presents the demographic data as well as further information regarding the disease classification and course per each patient.
Table 1.
Demographic, Clinical, and HPV Status in Head and Neck Squamous Cell Carcinoma Patients. This table presents the demographic data as well as further information regarding the disease classification and course per each patient.
| Patient # |
Age | Race/ Gender |
Stage | Tumor Location |
P16 IHC |
HPV DNA |
Anti-HPV16 E7 IgG |
HPV Group |
1st Outcome1 |
Relapse |
| 1 | 51 | W/M | 2 | T | POS | POS | POS | (+) | NED | METs |
| 2 | 60 | W/M | 4 | S | POS | NR | NEG | (+) | NED | |
| 3 | 78 | W/F | 3 | FM | NR | POS | NEG | (+) | NED | |
| 4 | 54 | W/M | 1 | L | POS | NR | POS | (+) | NED | |
| 5 | 64 | W/M | 3 | T | POS | POS | NEG | (+) | NED | |
| 6 | 62 | W/M | 3 | T | POS | NR | NEG | (+) | NED | |
| 7 | 62 | W/F | 4 | O | NEG | NR | NEG | (-) | NED | |
| 8 | 65 | B/M | 3 | BT | NEG | NR | NEG | (-) | NED | |
| 9 | 54 | W/M | 2 | T | POS | POS | NEG | (+) | NED | |
| 10 | 48 | W/M | 3 | T | NR | NEG | NEG | (-) | NED | |
| 11 | 43 | B/M | 3 | T | POS | NR | POS | (+) | NED | |
| 13 | 55 | W/F | 3 | O | NEG | NR | NEG | (-) | NED | |
| 14 | 55 | W/M | 2 | T | NEG | NR | POS | (+) | Stablea | |
| 15 | 37 | W/M | 2 | O | POS | NR | POS | (+) | NED | |
| 16 | 58 | W/M | 3 | BT | POS | NR | NEG | (+) | NED | |
| 17 | 61 | W/M | 2 | BT | POS | NR | NEG | (+) | Stable | |
| 18 | 51 | W/M | 4 | T | POS | NR | NEG | (+) | NED | |
| 19 | 60 | B/M | 3 | T | POS | NR | NEG | (+) | NED | |
| 20 | 63 | W/M | 3 | BT | POS | NR | POS | (+) | IND | PRG |
| 21 | 88 | W/M | 4 | T | NEG | NR | NEG | (-) | IND | |
| 22 | 65 | W/M | 2 | LO | POS | NR | NEG | (+) | Stable | |
| 23 | 55 | W/F | 3 | T | POS | NR | POS | (+) | NED | |
| 24 | 54 | W/M | - | L | POS | NR | POS | (+) | NED | |
| 25 | 47 | W/M | 3 | T | POS | POS | POS | (+) | NED | PRG |
| 26 | 49 | B/M | 4 | T | POS | NR | NEG | (+) | NED | |
| 27 | 57 | W/M | 3 | T | POS | NR | NEG | (+) | NED | |
| 28 | 70 | W/M | 2 | TP | POS | POS | NEG | (+) | Stableb |
1Within 60 days of completing the first treatment (Tx) Stablea: Outcome at 55 days of completing the first treatment, but the outcome changed to NED at Day 315 post-Tx. Stableb: Outcome 69 days of completing the first treatment, but the outcome changed to NED at Day 192 post-Tx.
p16 expression was confirmed in 20 of the 27 patients, while 5 showed no p16 expression. HPV DNA testing was conducted on only 7 patients: one tested negative, while the other 6 tested positive for HPV DNA. Based on these results, patients were categorized into the HPV-positive (+) HNSCC group (22 patients, 18 of which had analyzable data) and the HPV-negative (-) HNSCC group (5 patients). Among the HPV(+) patients, Patient-14 tested negative for p16 expression and lacked HPV DNA test results; however, they were ultimately included in the HPV(+) group due to the detection of the HPV16 E7 antibody. While only 60% of HPV(+) patients showed advanced disease (Stage III or IV), all HPV (-) patients were diagnosed with Stage III or IV HNSCC.
The majority of patients received concurrent chemoradiation (Cisplatin and radiation) therapy as their primary treatment. Eight of these patients also received targeted therapy or immunotherapy concurrently with Cisplatin and radiation therapy. The primary treatment was successful for all patients, with the exception of three individuals who were either still undergoing the primary treatment or had received treatment within the preceding three months. Thus, these 24 patients were diagnosed with NED after their primary treatment. Unfortunately, after considerable time following the NED diagnosis for primary cancer, three of these 24 patients (Patient-1, 20, 25) were found to have metastasis of the primary tumor, development of a secondary tumor, or progression of the primary disease. Notably, all three patients with recurrence or disease metastasis were HPV (+). Two of the patients later died, and the remaining patient (Patient-1) was still receiving immunotherapy for lung metastasis at the time of the last visit. This study lacks information regarding surgical resection.
3.2. Disease Severity, Locations and MIF Levels
An analysis was conducted to determine whether MIF levels reflected the severity of the initially diagnosed disease stage. Across the whole cohort, initial diagnostic MIF levels did not show a consistently increasing pattern with Stages I, II, III, and IV, nor did the non-parametric test indicate a statistically significant correlation (Kruskal-Wallis p=0.63) (Fig. 1A). Stage 1 disease was excluded from this analysis because there was only one patient in this group. Patients in Stage II exhibited the highest average MIF levels, and the mean MIF level showed a slight decrease as disease severity increased. Since this change was not statistically significant, MIF levels can be considered stable regardless of severity. Additionally, no correlation was found when analyzing median values either.
Figure 1.
Association of Macrophage Migration Inhibitory Factor (MIF) Levels with Initial Disease Stage. (A) Analysis of whether MIF levels reflect the severity of the initially diagnosed disease stage across the whole patient cohort. A total of 27 HNSCC patients were diagnosed with disease severity (Stage I-IV) at their first clinical visit (Table 1). Plasma MIF concentrations (ng/mL) were quantified at the same time point using an ELISA assay, and the results are displayed as box-and-whisker plots by clinical stage (I-IV). The results of statistical analysis using the non-parametric Kruskal-Wallis test are shown (p=0.63). Boxes indicate medians and interquartile ranges. (B) Relationship between baseline MIF concentration and disease stage in HPV-positive HNSCC patients. Serum MIF concentrations (ng/mL) obtained at the first clinical visit for HPV-positive HNSCC patients (n=18) were plotted according to diagnostic tumor stage (I-IV). Patients who showed elevated MIF levels corresponding to higher stages are indicated by blue markers, while those who did not display the corresponding pattern are indicated in gray. The increasing trendline of MIF for patients showing the corresponding pattern is indicated by a dashed line. (C) Baseline serum MIF concentrations were plotted according to diagnostic tumor stage (I-IV) for HPV-negative HNSCC patients (n=5). Each marker represents an individual patient; squares indicate patients showing a significant association between MIF and disease severity, while circles represent patients with no such relationship. Only one patient (Patient 13, stage III) exhibited elevated MIF levels consistent with greater disease severity, whereas the remaining four (80%) showed no apparent relationship between stage and MIF concentration.
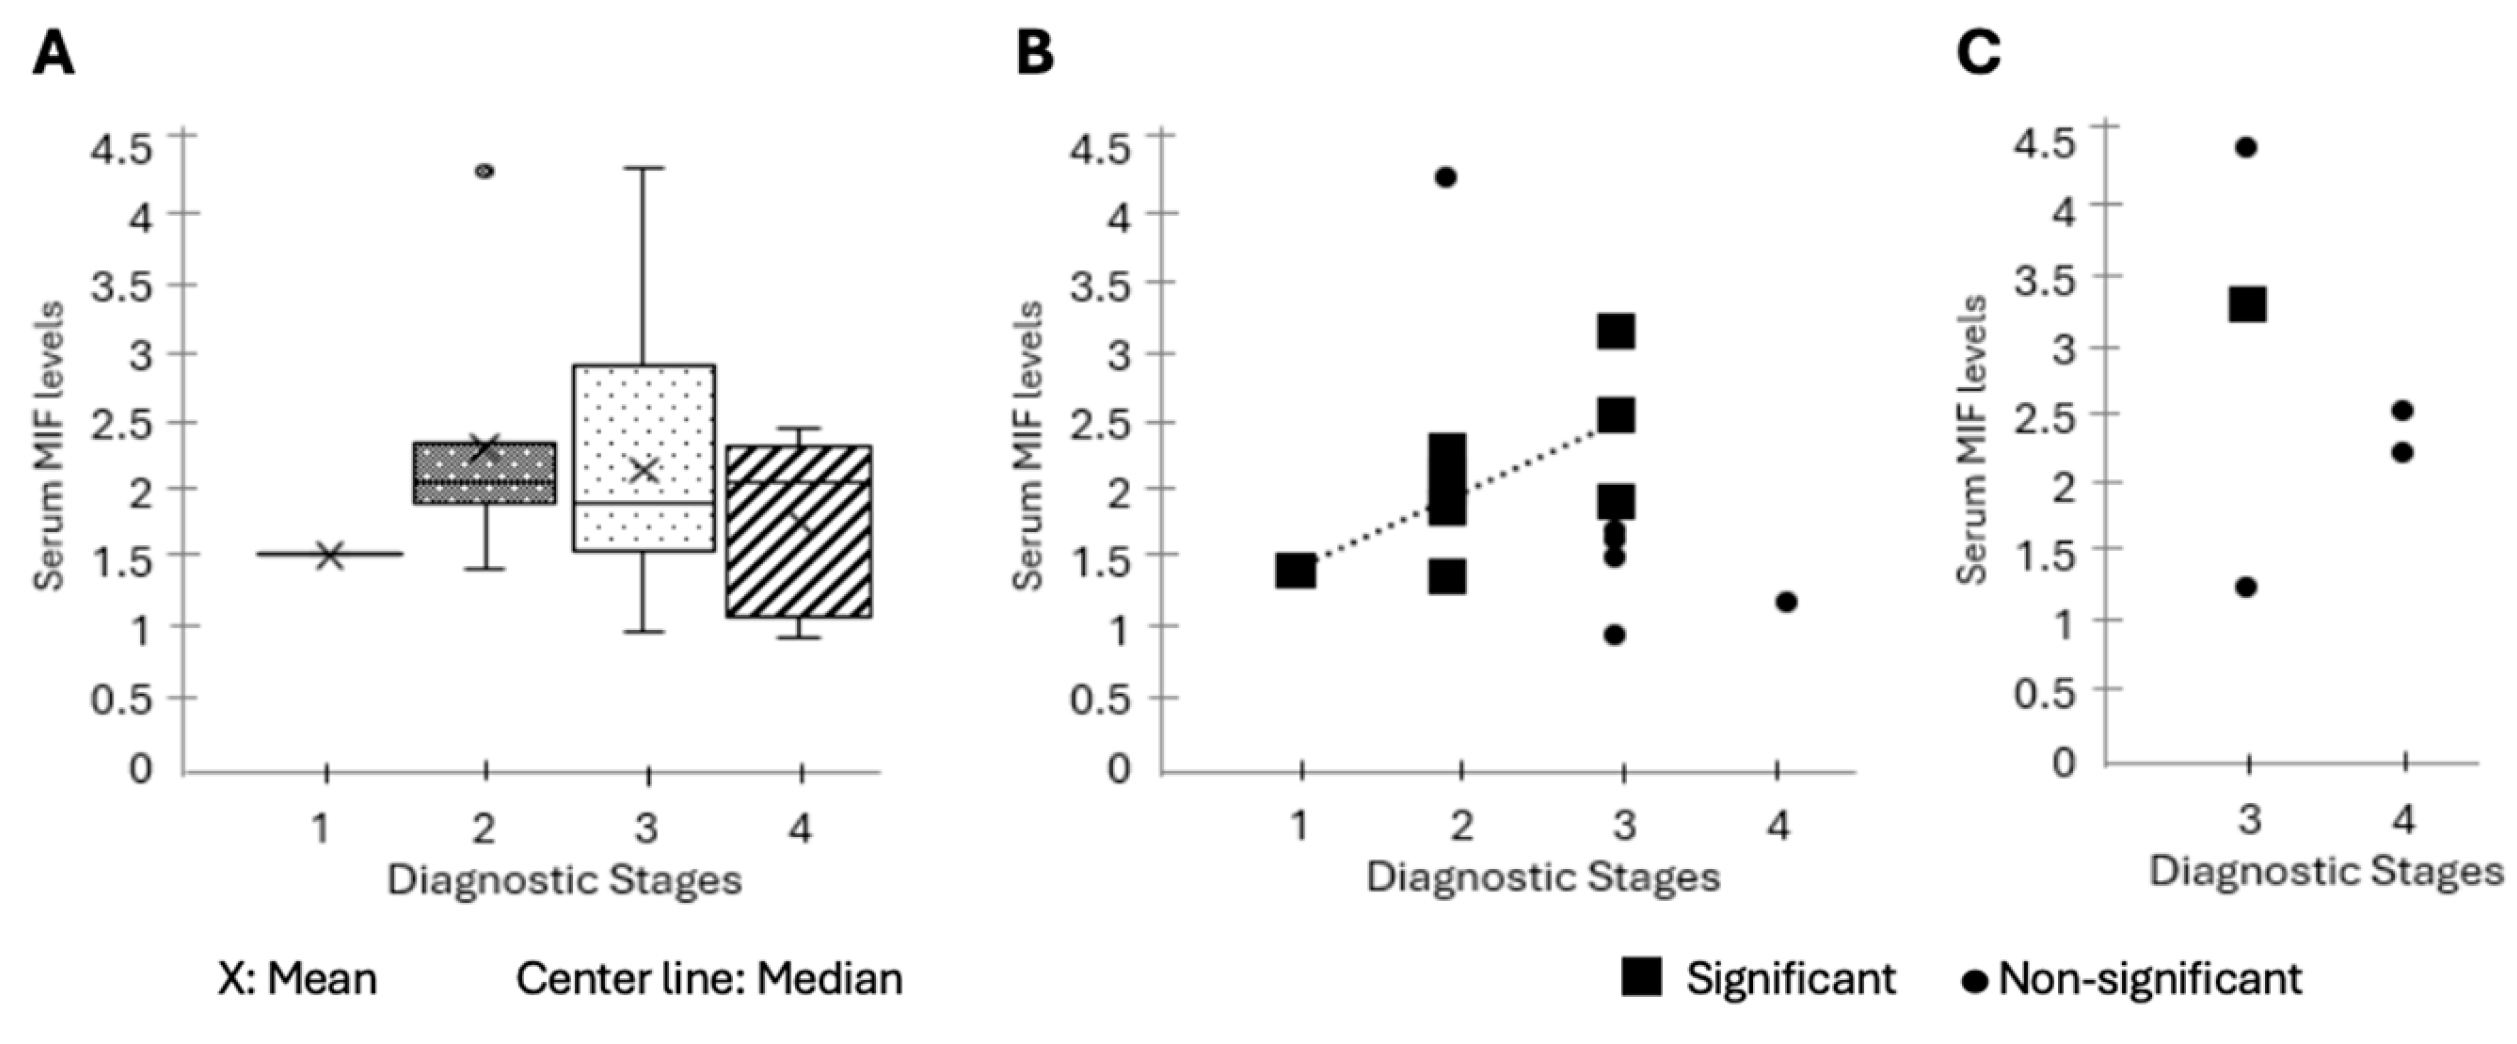
The investigation of the relationship between severity and MIF levels through the classification of patients into HPV-positive and HPV-negative groups yielded markedly distinct results. Within the cohort of HPV-positive individuals (n=18), a significant correlation between elevated MIF levels and disease stage was identified in 10 patients (56%) (Patient-1, 3, 4, 9, 11, 14, 15, 17, 27, 28) (Fig. 1B). Specifically, one patient with a supraglottic tumor (Patient-1, 5.6%) exhibited significantly elevated MIF levels despite being at a lower stage, whereas another patient with a tumor in the lateral OP region (Patient-22) displayed a low MIF level in spite of a higher stage. No other statistical correlation between severity and MIF was found in the remaining HPV (+) patients.
Unlike the HPV(+) group, only one patient (Patient-13) in the HPV(-) cohort (n=5) showed a correlation between disease severity and elevated initial MIF levels, while the remaining 4 patients (80%) showed no statistically significant relationship (Fig. 1C).
When patients were categorized based on tumor location, MIF levels exhibited considerable variability among patients with tumors located in different areas. Only patients with an unknown primary tumor location (LN, n=2) exhibited comparatively lower MIF levels. Although no statistically significant difference was observed in ΔMIF values based on tumor location, all four patients with tumors situated at the base of the tongue demonstrated a decrease in MIF levels, with an average ΔMIF of -0.66 (Table S1). No additional statistically significant correlations were identified between tumor location, disease resolution, and MIF levels.
3.3. MIF Levels and Concurrent Cisplatin and Radiation Treatment
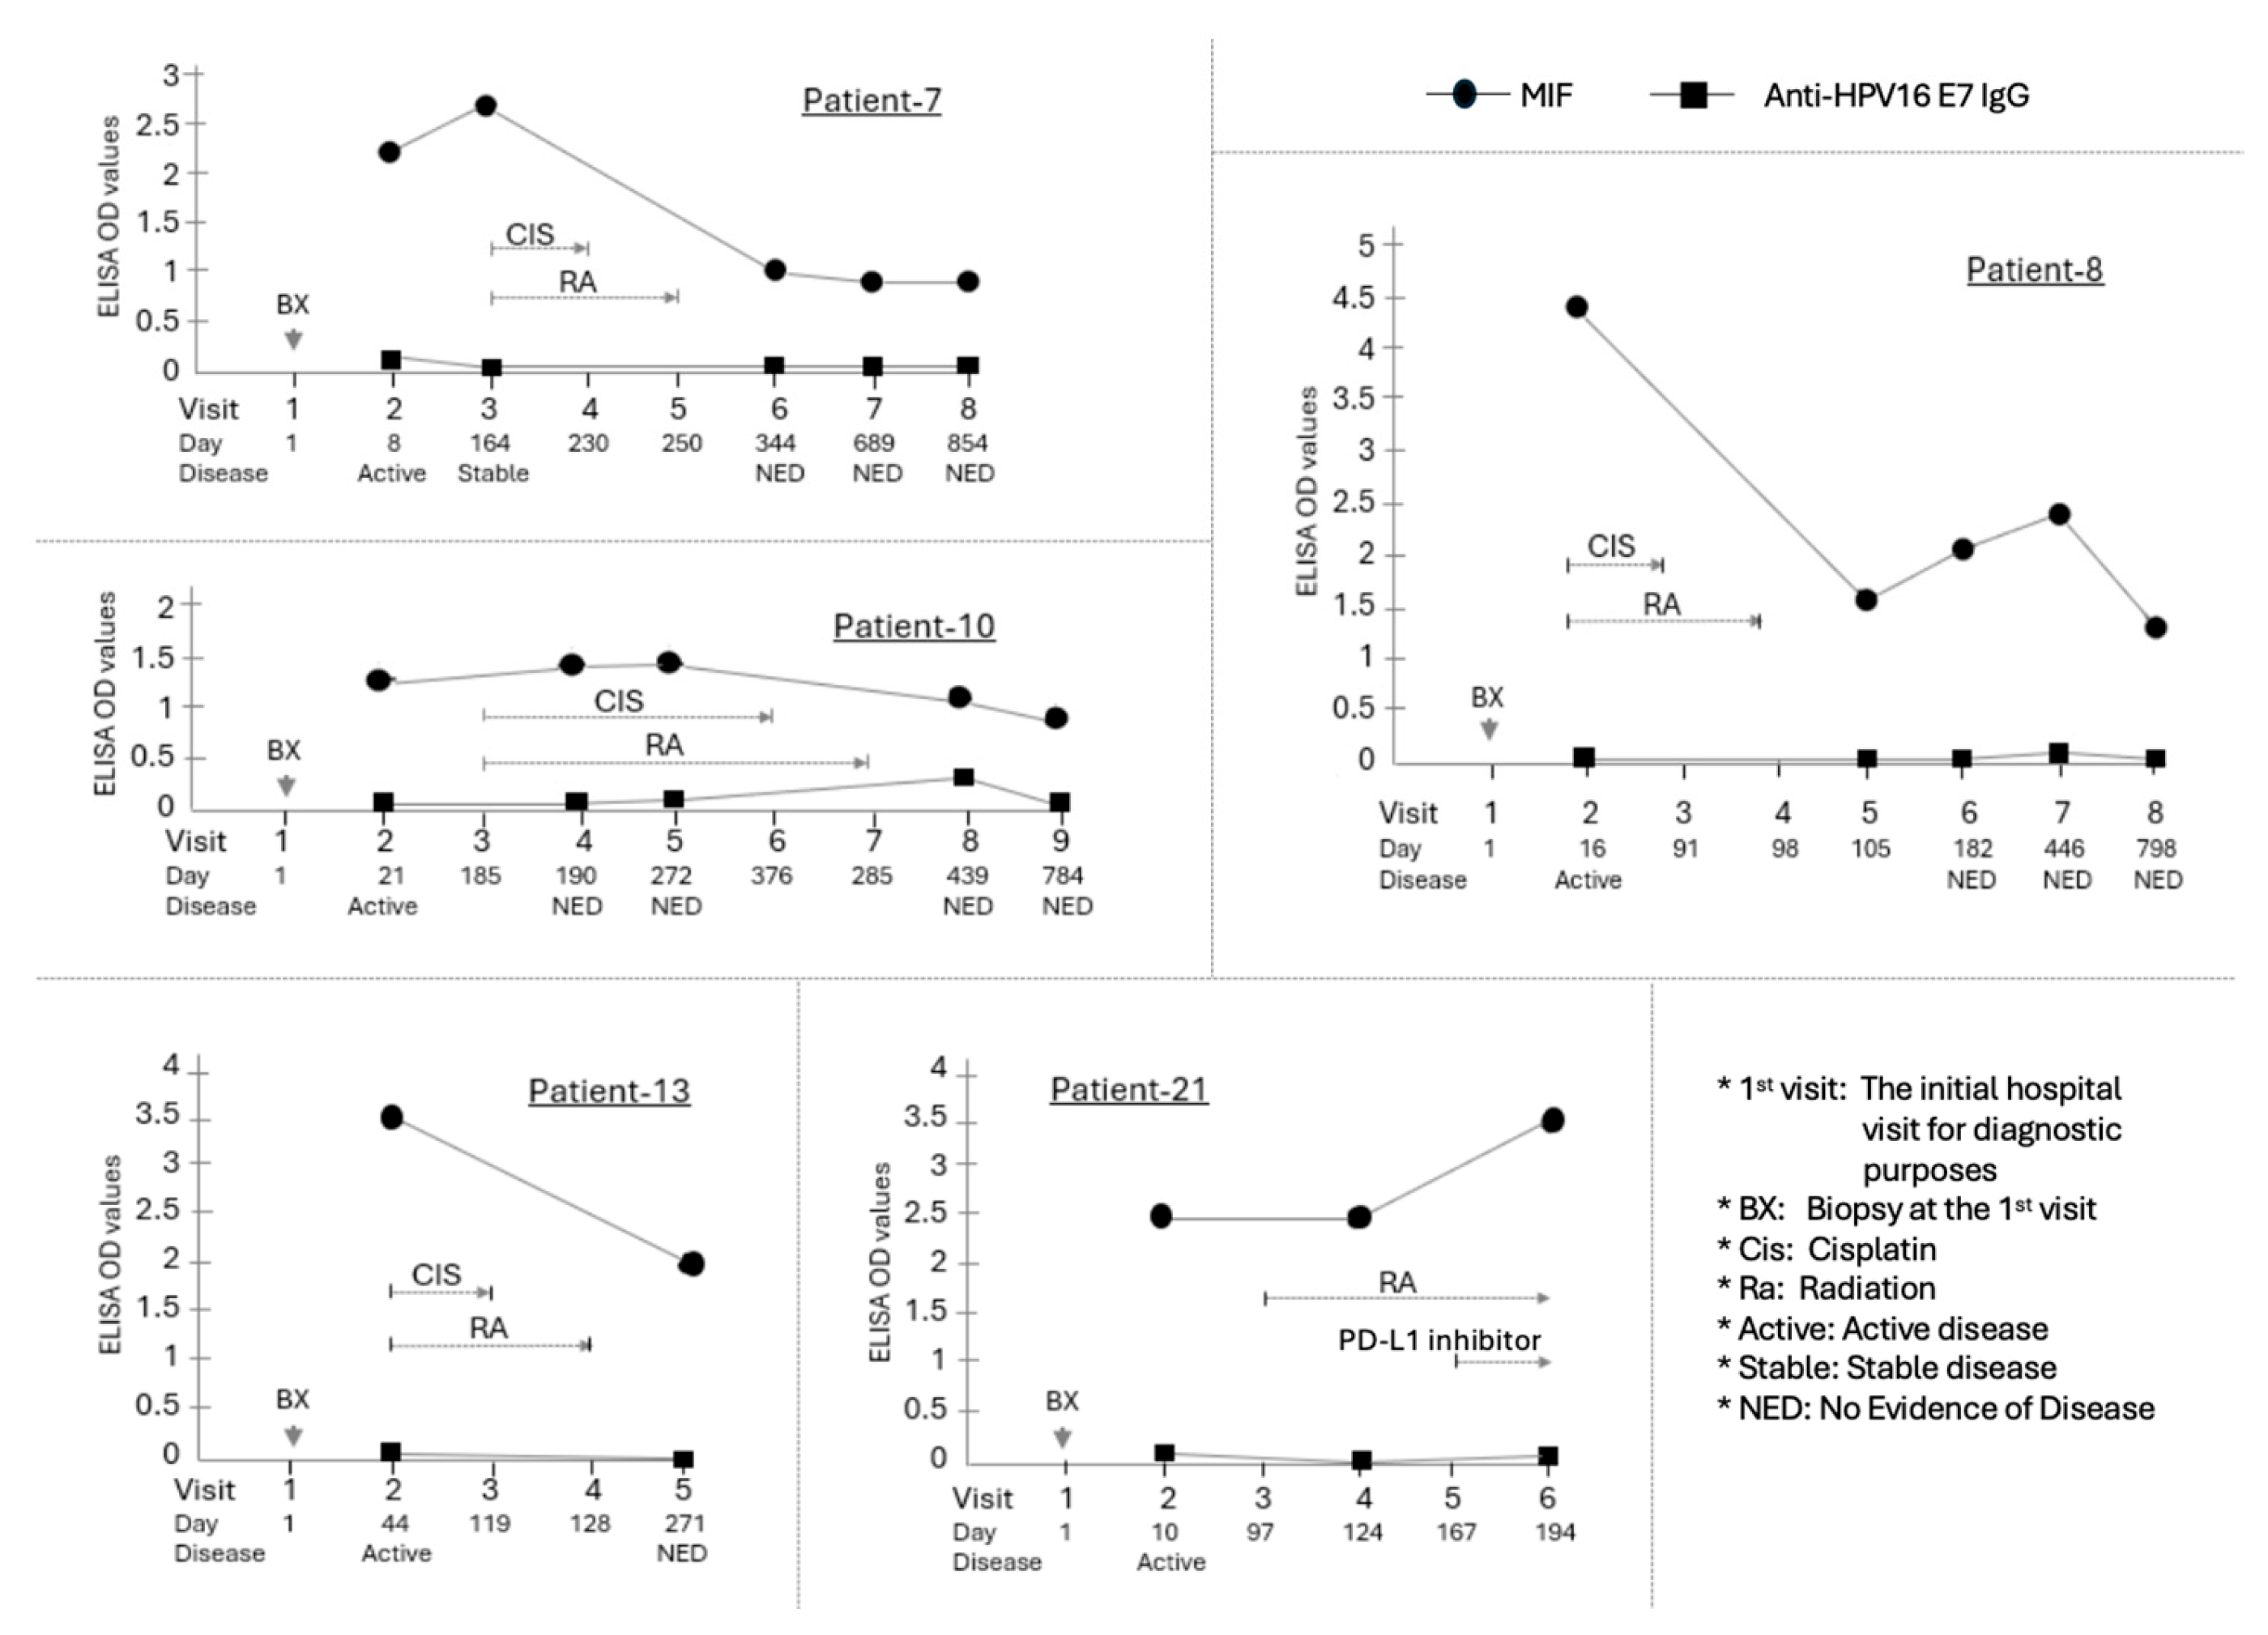
Concurrent cisplatin and radiation therapy served as the primary treatment modality for patients with OPSCC. The initial assessment of MIF levels was conducted between 7 and 150 days following the completion of primary therapy in the majority of cases. An analysis examining the relationship between MIF levels and this chemoradiation treatment revealed that in the HPV(-) group (Patients-7, 8, 10, 13, 21), MIF levels were significantly reduced post-treatment, with an average ΔMIF of -1.23 (p=0.031, Wilcoxon test) (Fig. 2, Table S1).
Figure 2.
Longitudinal assessment of MIF levels in HPV(-) OPSCC patients. The HPV-negative cohort (n=5) was defined by lack of p16 expression and/or negative HPV DNA testing. Critically, all patients in this group were diagnosed with advanced disease (Stage III or IV HNSCC) and received concurrent Cisplatin and Radiation therapy as their primary treatment. MIF concentrations (measured in ELISA) were evaluated at multiple critical time points. The line graph illustrates the individual change in MIF levels for each HPV-negative patient (n=5, Patients 7, 8, 10, 13, 21) across these stages. Individual graphs show the time course of MIF (circle) and Anti-HPV16 E7 IgG (square) ELISA OD values for these patients. The X-axis indicates the Visit number and the Day relative to the initial hospital visit (Day 1). Below the X-axis, the Disease status at each visit is indicated. The Primary chemoradiotherapy (CIS/RA) course is shown with brackets above the data points. Arrows indicate specific clinical procedures or events. A significant reduction in MIF levels was observed post-treatment compared to the diagnosis time point, with an average ΔMIF of -1.23 (p=0.031, Wilcoxon matched-pairs signed-rank test). The dotted line represents the mean MIF level at each time point. Expression of anti-HPV16 E7 IgG was examined in these patients. Four of the patients remained negative throughout the entire process. However, one patient (Patient-10) showed a low-level increase in the antibody 15 months after the initial diagnosis, though the concentration remained very low.
In contrast, among the 14 analyzed HPV(+) patients, four exhibited an increase in MIF levels subsequent to chemoradiation therapy, four demonstrated a decrease, and five maintained their levels without significant variation. The overall mean ΔMIF for the HPV(+) cohort was +0.21, indicating no statistically significant alteration in MIF levels (p = 0.94, Wilcoxon). Of these, four HPV(+) patients received a combination therapy of Paclitaxel and Carboplatin in addition to Cisplatin and radiation therapy for their primary tumor. Notwithstanding this, MIF levels remained predominantly unchanged in all such patients.
3.4. Disease Outcome and MIF Levels
The change in MIF (ΔMIF) throughout the entire disease and treatment course was found to be significantly different between the HPV(+) and HPV(-) groups; the HPV(+) group exhibited an average ΔMIF of +0.06, whereas the HPV-negative group demonstrated an average ΔMIF of -1.62 (p = 0.009, Kruskal-Wallis) (Table S1). While each patient exhibited highly variable patterns at different stages and time points, the overall trend for HPV(+) patients was an increase in MIF expression, whereas for HPV(-) patients, a decrease (p<0.01, Fisher’s exact).
Excluding three patients who experienced active diseases for more than six months following initial chemoradiation, all remaining patients were diagnosed with no evidence of disease (Primary NED) within a minimum of one week and a maximum of six months subsequent to the conclusion of chemotherapy. When comparing MIF levels at initial diagnosis with those at the NED state post-chemotherapy, seven patients (33.3%) exhibited comparable MIF levels, four patients (19%) demonstrated an increase, and ten patients (47.6%) displayed a decrease. Throughout this entire cohort, the comparison of first disease outcome and MIF levels using ΔMIF revealed that the average ΔMIF at the time of first NED diagnosis was -0.36, suggesting a slight downward trend in MIF levels relative to the initial diagnosis period (Table S1). Nonetheless, no statistically significant correlation was identified between ΔMIF and the first NED outcome within the total cohort (p = 0.186, Kruskal-Wallis test). Notably, all four analyzable HPV(-) patients (Patient-7, 8, 10, and 13) exhibited a reduction in MIF levels at the first NED diagnosis compared to their initial diagnosis (Fig. 2).
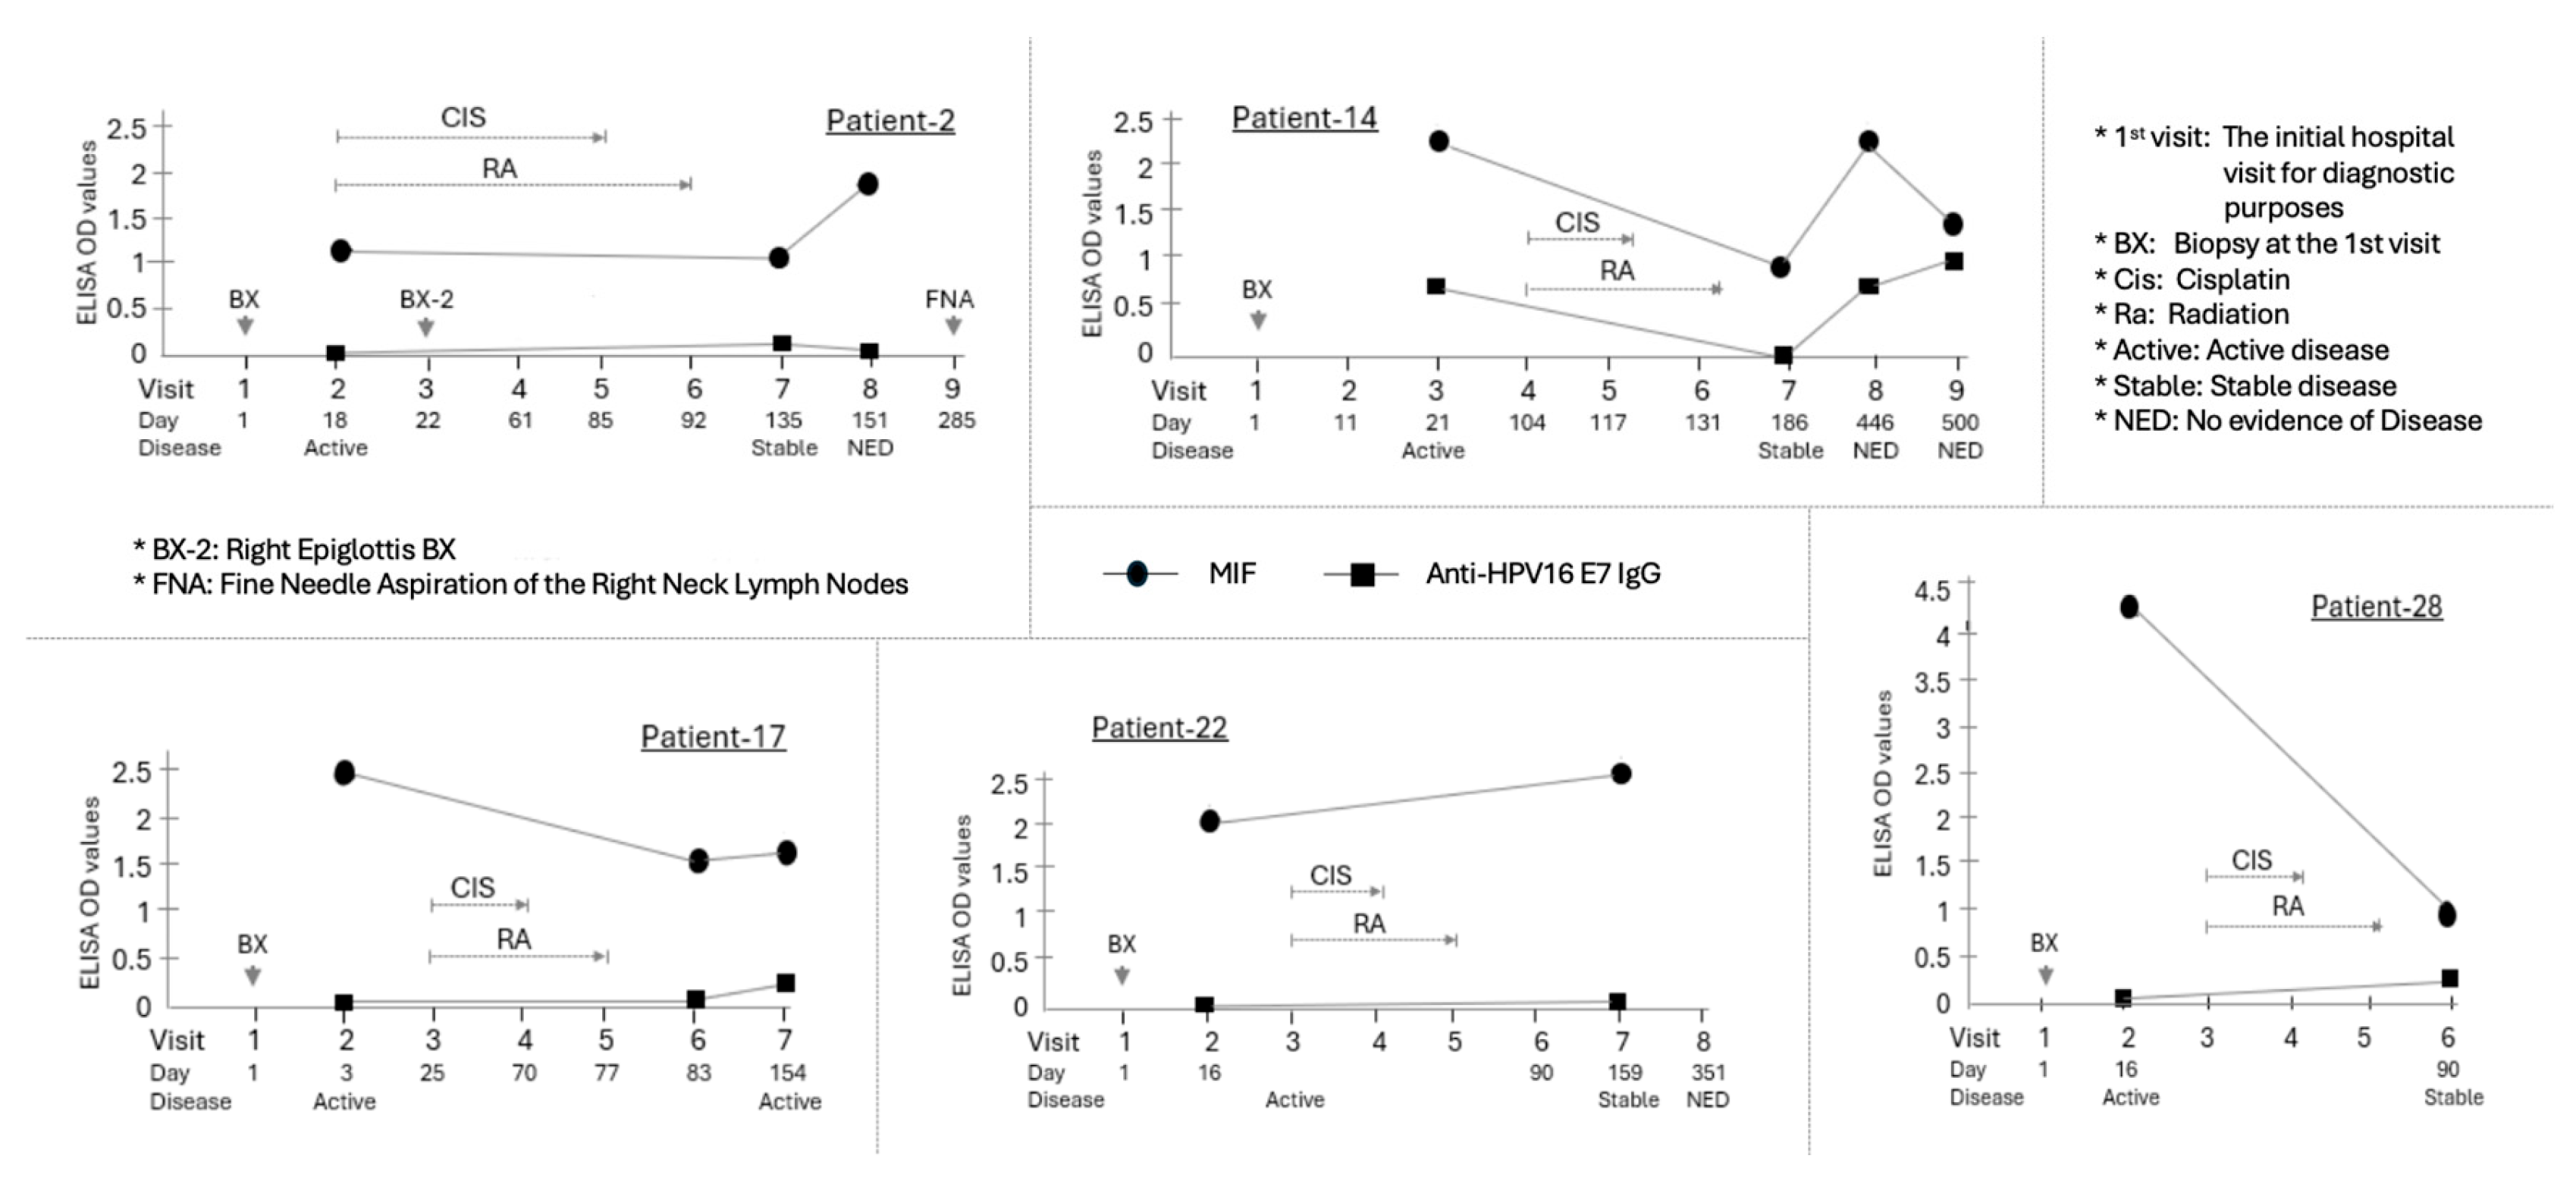
A total of five patients continued to exhibit active disease following the primary chemoradiation therapy within a six-month period, with Patients-17 and 22 demonstrating transient active disease prior to being subsequently diagnosed with NED and Patients-2, 14, and 28 demonstrating NED immediately after the primary therapy (Fig. 3). Notably, all these patients were HPV-positive. We examined the variations in MIF levels during the period of active disease post-treatment. Compared to one patient whose MIF level remained consistent with the initial diagnosis, the MIF levels decreased in the remaining four patients (80%) during the active disease phase. The mean change in MIF levels (ΔMIF) in patients with active disease following primary treatment was -1.55. The sole patient within this cohort who did not exhibit a decline in MIF levels during the active disease state (Patient-28) presented a ΔMIF of +0.86. Two of these patients (Patient-2 and 14) were ultimately diagnosed with NED at 59 and 315 days post-treatment, respectively. During the active tumor phase, their MIF levels, which had initially decreased, increased to levels equal to or exceeding the initial diagnosis levels at the time of NED diagnosis.
Figure 3.
Longitudinal assessment of MIF levels in five HPV(+) OPSCC patients who developed active or stable disease within six months of primary chemoradiotherapy. Among the patients confirmed to be HPV(+) by p16 expression and HPV DNA testing, five patients (Patient-2, -14, -17, -22, and -28) showed Active or Stable disease within six months of chemoradiotherapy. The average change in MIF (Delta MIF) for these patients was -1.55. Individual graphs show the time course of MIF (circle) and Anti-HPV16 E7 IgG (square) ELISA OD values for five patients. The X-axis indicates the Visit number and the Day relative to the initial hospital visit (Day 1). Below the X-axis, the Disease status at each visit is indicated. The Primary chemoradiotherapy (CIS/RA) course is shown with brackets above the data points. Arrows indicate specific clinical procedures or events. Compared to the two patients (Patient-2 and -22) whose MIF levels did not change significantly, the remaining three patients (60%) experienced a decrease in MIF levels during the period of active disease following the initial chemoradiotherapy. Two of these patients (Patient-2 and -14) showed an increase in MIF levels to or above the initial diagnostic levels at the moment of disease clearance. Notably, Patient 14 was the sole case in which the MIF expression pattern closely resembled the Anti-E7 IgG pattern across all four measurements.
3.5. Metastasis, Relapse, and MIF Levels
Out of the total of 27 patients, three patients (Patient-1, 20, and 25) experienced disease relapse (Fig. 4). Notably, all of these patients were HPV-positive. Two of them died less than two years after their initial visit. For Patient-25, initial visit samples were unavailable; therefore, only MIF levels at the times of the first and second NED diagnoses following initial treatment, as well as at the relapse diagnosis approximately one year later, were compared. This patient's MIF levels gradually decreased over approximately six months during the initial treatment but increased again at the moment of relapse. Another patient who died post-relapse, Patient-20, exhibited a pattern where MIF levels remained relatively unchanged from the initial diagnosis to the end of primary treatment. However, MIF expression at the time of relapse could not be analyzed due to the unavailability of samples during the subsequent treatment phase.
Figure 4.
Longitudinal assessment of MIF levels in HPV(+) OPSCC patients who experienced disease relapse. Three HPV(+) patients (Patient-1, -20, and -25) experienced disease relapse following the clearance of their primary disease. While sufficient results could not be obtained for Patient-20 and Patient-25 due to lack of sample availability throughout the entire course, Patient-1 was studied with samples secured across the entire course, from the primary disease to metastasis and the subsequent treatment of the secondary disease. Individual graphs show the time course of Serum MIF levels (circle) and Anti-HPV16 E7 IgG (square) for three HPV-positive patients. The X-axis indicates the Visit number and the Day relative to the initial hospital visit (Day 1). Below the X-axis, the Disease status at each visit is indicated. The Primary chemoradiotherapy (CIS/RA) course and subsequent treatments are shown with brackets and labels above the data points. Patient-1, who was diagnosed with distant metastatic disease to the lung after treatment for the primary disease, received combined cytotoxic chemotherapy following the diagnosis of metastasis. Despite these therapeutic interventions, the patient continued to exhibit active disease three years after the initial presentation. This patient's MIF level significantly increased after primary treatment, but at the time of relapse approximately 23 months later, the MIF level was observed to have decreased to a value comparable to that at the initial diagnosis of the primary tumor. Subsequently, a reduction in the MIF level was noted following the administration of immunotherapy.
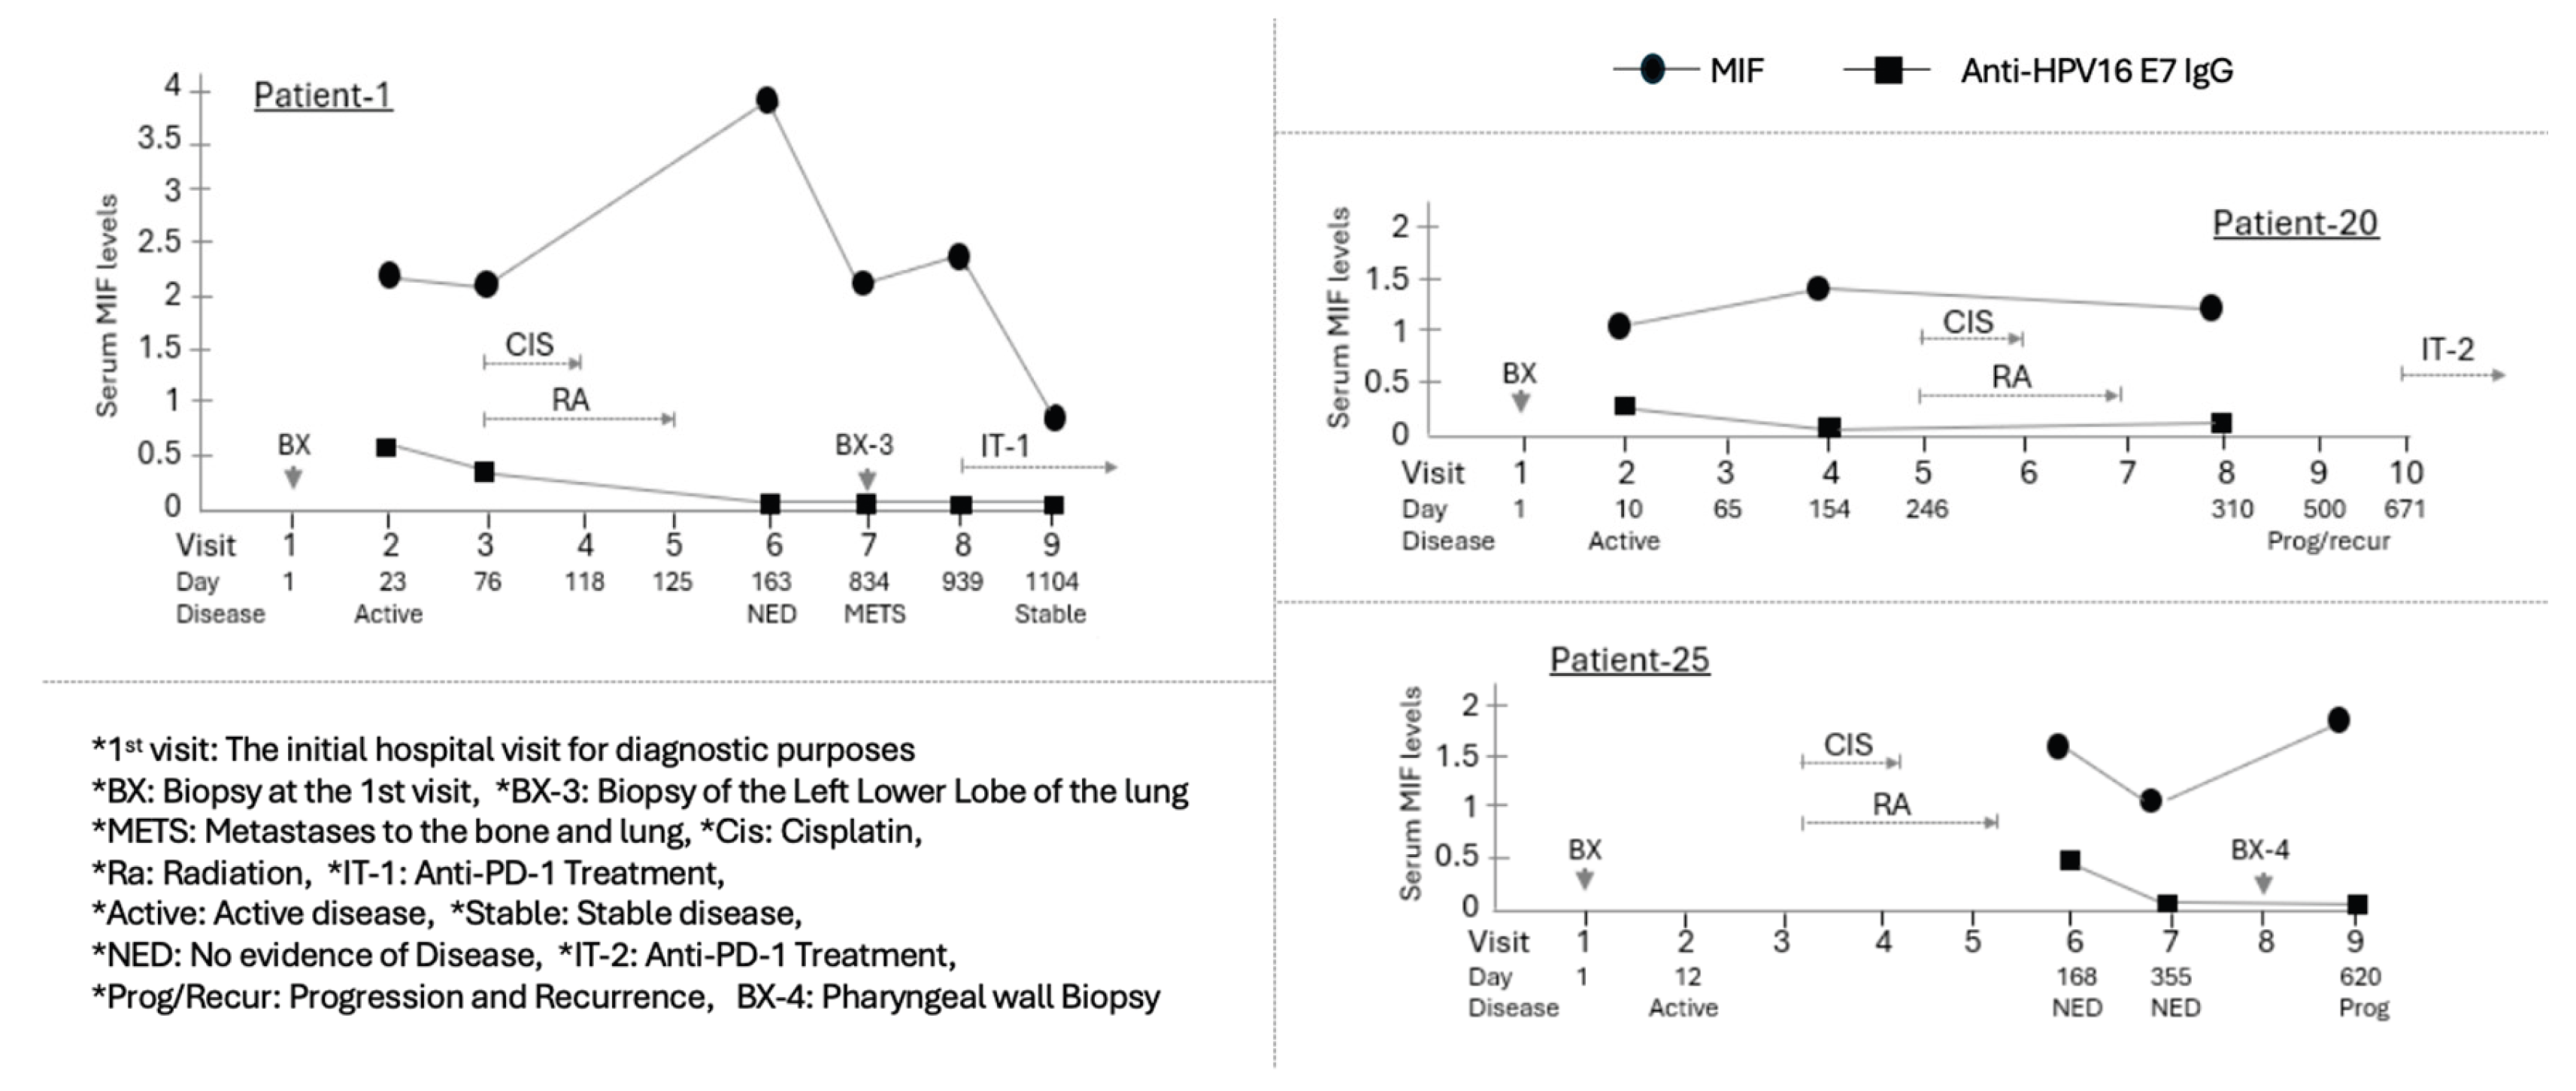
One of the relapsed patients, Patient-1, was diagnosed with distant metastatic disease to the lung 671 days after the primary disease had reached NED. Following the diagnosis of metastasis, the patient received palliative cytotoxic chemotherapy. Despite these therapeutic interventions, the patient continued to exhibit active disease three years after the initial presentation. Notably, this patient's MIF level significantly increased at the NED time point, 163 days following primary treatment. (Fig. 4) However, at the time of relapse, approximately 23 months later, the MIF level was observed to have decreased to a value comparable to that at the initial diagnosis of the primary tumor. Subsequently, a reduction in the MIF level was noted following the administration of immunotherapy.
3.6. Anti-HPV16 E7 IgG and MIF
The expression of HPV E7 protein was confirmed in only 9 (41%) of the 22 HPV(+) patients. Six of these patients demonstrated E7 protein expression at the initial diagnosis, which then gradually diminished and disappeared during the course of primary treatment. Conversely, E7 expression was observed to emerge after primary therapy in Patients-10, 14, and 23. Five patients (Patients-4, 11, 14, 24, 25) exhibited similar variations in Anti-E7 IgG and MIF levels throughout cancer treatment and disease progression, with these changes reaching statistical significance. Notably, Patient 14 was the sole case in which the MIF expression pattern closely resembled the Anti-E7 IgG pattern across all four measurements (Fig.3). The expression levels decreased following primary treatment, became undetectable when the patient exhibited temporary active disease 55 days later, and increased to the level observed at initial diagnosis upon diagnosis of NED 8.5 months thereafter. Additionally, Anti-E7 levels dropped below the detection limit for patients with metastasis or progressive disease.
There was no significant correlation between Anti-E7 IgG levels and the diagnosis and treatment course of the disease. Only four patients (Patients-17, 22, 2, 28) from the cohort of five patients who exhibited stable disease following treatment demonstrated a slight increase in Anti-E7 IgG levels, specifically at the time when stable disease was diagnosed, although the antibody was undetectable at other intervals. Nevertheless, the detection level remained close to the threshold of detection.
Similar to Patient-14, three patients who experienced metastasis and relapse (Patients-1, 20, and 25) commonly exhibited detectable anti-E7 IgG at the time of primary tumor diagnosis; however, the presence of anti-E7 IgG varies (Fig.4).
4. Discussion
MIF variability may differ depending on the patient’s HPV status. In the case of cervical cancer, an HPV-related malignancy, MIF overexpression has been observed in invasive cervical cancer samples, often at higher levels than in dysplastic tissue [20]. In the context of HNSCC, however, studies have been inconsistent. Some studies have shown higher levels of MIF release in HPV-negative patients compared to HPV-positive patients, whereas others have demonstrated the opposite pattern, with HPV-positive human HNSCC cell lines secreting higher levels of this pro-inflammatory cytokine compared to HPV-negative cell lines [21,22,23,24]. These conflicting results suggest that while a clear relationship between MIF levels and HPV-related HNSCC has not yet been established, HPV may significantly modulate MIF levels.
Analysis of the overall patient cohort showed that baseline MIF levels at the time of initial diagnosis did not reliably correspond to disease severity, limiting its utility as an independent prognostic marker. However, this pattern differed by HPV status: among HPV (+) patients, serum MIF levels demonstrated a significant correlation with disease severity, whereas no such association was observed in HPV (-) patients. These findings suggest that MIF may have potential as a biomarker for stratifying disease severity, specifically in HPV-positive disease.
Analysis of ΔMIF (change in MIF) further highlighted the difference between the two groups, with a statistically significant overall increase observed in the HPV-positive cohort. This finding suggests that HPV positivity may influence MIF expression and release, resulting in greater variability during the course of disease and treatment. Further support for this observation comes from prior studies demonstrating that HPV oncoproteins E6 and E7 stimulate enzymes that increase lactate production and activate hypoxia-inducible factor 1α (HIF-1α), thereby promoting elevated MIF secretion [13].
Serum levels of MIF exhibit considerable fluctuations within individual patients, contingent upon the stage of disease diagnosis and treatment. Consequently, comparing a single measurement at a specific point in time across different patients may introduce significant error. To address this limitation, our study examined the dynamic variation of serum MIF levels throughout the entire course, from initial diagnosis through anti-cancer therapy, remission, and relapse. By analyzing MIF expression patterns at various clinical stages and comparing these patterns among patients, we established that MIF is differentially expressed in distinct clinical states. This longitudinal, dynamic approach enabled us to more accurately predict the biological function and role of MIF.
Variation in plasma MIF levels during treatment may provide insight into therapeutic mechanisms and response. Among HPV-negative patients, a consistent decline in post-treatment MIF was observed in all four individuals who received concurrent cisplatin and radiation as their primary therapy. Cisplatin has been shown to reduce MIF expression across multiple tumor types by promoting apoptosis and inducing the release of damage-associated molecular patterns (DAMPs), thereby enhancing antitumor immune recognition [16]. This reduction in MIF likely reflects both decreased tumor burden and disruption of the tumor-supportive microenvironment. Notably, all four patients achieved and have maintained NED following treatment, without recurrence or metastasis. These findings suggest that concurrent cisplatin and radiation elicit a robust therapeutic response in HPV-negative disease and highlight MIF as a potential biomarker of treatment efficacy.
One of these four patients (Patient-8) exhibited a slight increase in MIF levels following the achievement of the NED state; however, the other three patients demonstrated a consistent pattern of ongoing MIF reduction throughout the phases of diagnosis, treatment, and remission. These definitive findings provide compelling evidence that MIF possesses significant potential to be developed as a biomarker for monitoring therapeutic progress and remission in HPV (-) OPSCC patients. Furthermore, it is plausible to hypothesize that the concurrent therapy involving Cisplatin and radiation exerts a specific effect on the mechanism of MIF expression or its intracellular function.
The observed decline in MIF levels with disease resolution supports the hypothesis that MIF exerts protumorigenic effects within the HPV-negative tumor microenvironment (TME) [25]. Prior studies have shown that MIF-deficient (MIF⁻/⁻) mice harbor significantly fewer tumor-associated CD4⁺ regulatory T cells compared to wild-type (MIF⁺/⁺) mice [28]. This suggests that one mechanism by which MIF promotes tumor progression in HPV-negative patients may involve the recruitment or maintenance of regulatory T cells. However, it is also possible that MIF plays a dual role by initially recruiting T-regulatory cells as part of the host immune response, which may later contribute to modulation of antitumor immunity during disease progression.
In non-cancerous contexts, MIF participates in the initial immune response by inducing pro-inflammatory cytokines such as TNF-α, IL-1β, and IFN-γ in reaction to infection or other immunological stressors [26]. It additionally facilitates T-cell activation and augments the functionality of Antigen-Presenting Cells (APCs) [27]. Consequently, this suggests the hypothesis that, in Head and Neck Cancer (HNC), particularly among HPV (+) patients, immune priming by MIF may play a role prior to tumor formation and progression.
In contrast to the HPV (-) group, we observed that the MIF expression pattern in the HPV (+) group patients varied significantly during diagnosis, treatment, and remission. Firstly, post-primary treatment (Cisplatin and radiation concurrent therapy), the MIF levels in HPV (+) patients were inconsistent, with levels either increasing, decreasing, or being maintained. This suggests lower efficacy and specificity of this anti-cancer treatment compared to HPV (-) patients. Indeed, all five patients who showed active disease for even a short period after treatment, and all three patients who experienced metastasis and recurrence after complete remission, were in the HPV (+) group.
Notably, six HPV-positive patients (excluding two whose analysis was unfeasible) consistently exhibited lower MIF levels during the active disease phase or at the point of metastasis/recurrence compared to their levels prior to treatment or when in the NED state. This observation indicates the potential utility of low MIF levels as a marker for incomplete treatment in HPV-positive patients. Moreover, the findings imply that, contrary to the anticipated pro-tumoric role of MIF in the HPV-negative cohort, MIF may exert an anti-cancer effect within the HPV-positive Tumor Microenvironment (TME).
In contrast to previous investigations, levels of anti-HPV16 E7 IgG were notably minimal in the majority of patients within this study. This significantly impeded the capacity for correlation analysis concerning disease stages, including diagnosis, treatment, and remission, as well as its association with MIF. However, a measurable level of anti-HPV16 E7 IgG was observed in merely one patient (Patient-14), whose IgG expression profile throughout the disease progression closely resembled the MIF expression pattern. The causative factors behind the decline in IgG levels in this patient, whether attributable to active disease or the primary therapeutic intervention, remain uncertain. Although the analytical reliability is constrained by the exceedingly low IgG concentrations, a consistent pattern of decreasing IgG levels was identified in two patients who experienced metastasis and recurrence (Patient-1 and Patient-20): initial IgG levels diminished concomitant with the presence of active cancer post-treatment. This pattern of expression in metastatic or recurrent cases indicates a potential utility in distinguishing scenarios where the primary HPV (+) disease coincides with HPV-negative secondary tumors.
However, among patients who exhibited stable disease following treatment, some instances were observed where anti-E7 IgG levels unexpectedly increased. Consequently, additional validation studies employing a larger sample size are imperative to substantiate these findings and assess their potential clinical utility.
5. Conclusions
This study investigated the dynamic changes in serum MIF levels throughout the clinical course of HNSCC patients, demonstrating that its clinical role and utility are significantly dependent on the patient's HPV status. In the HPV-negative group, a consistent decrease in MIF levels post-primary treatment (Cisplatin and radiation concurrent therapy) strongly reflected a favorable therapeutic response and remission (NED), suggesting that MIF has high potential as a treatment monitoring marker for this patient cohort. In contrast, the HPV-positive group showed a significant correlation between baseline MIF levels and cancer severity, and post-treatment levels were inconsistent. Notably, these patients often displayed lower MIF levels during periods of active disease or recurrence, suggesting that MIF may exert an anti-cancer effect within the HPV-positive TME and that low MIF levels could potentially indicate incomplete treatment. In conclusion, while not a standalone diagnostic marker, MIF holds great promise for development as a personalized biomarker for both severity prediction (HPV-positive) and treatment monitoring (HPV-negative) in HNSCC.
Author Contributions
Conceptualization, J.N., J.J., S.W., B.X., and S.T. ; methodology, J.N. and J.J.; software, J.N. and J.J.; validation, J.N., J.J. H.S., and S.D.; formal analysis, J.N.; investigation, J.N., J.J., and I.K.; resources, L.J. and J.S.; data curation, J.N. and J.J.; writing—original draft preparation, J.N., J.J., and I.K.; writing—review and editing, J.N, J.J., I.K., S.W., B.X., S.T., L.J., H.S., J.S., S.D., R.M., and R.R.; visualization, J.N.; supervision, J.J.; project administration, H.S., S.D., R.M., and R.R. All authors have read and agreed to the published version of the manuscript.
Funding
This research received no external funding.
Institutional Review Board Statement
The study was conducted in accordance with the Declaration of Helsinki and approved by the Institutional Review Board (or Ethics Committee) of the University of Louisville (protocol code: 08.0388 and 15.0582; date of approval: 2022).”.
Informed Consent Statement
Informed consent was obtained from all subjects involved in the study.
Data Availability Statement
The original contributions presented in this study are included in the article/supplementary material. Further inquiries can be directed to the corresponding author(s).
Acknowledgments
The authors have reviewed and edited the output and take full responsibility for the content of this publication.
Conflicts of Interest
The authors declare no conflicts of interest.
Abbreviations
The following abbreviations are used in this manuscript:
| HPV | Human Papillomavirus |
| T | Tonsil |
| O | Oropharynx (unspecified) |
| BT | Base of Tongue |
| LO | Lateral wall of oropharynx |
| Tp | Tonsillar Pillars |
| S | Supraglottis (Larynx) |
| FM | Floor of Mouth (Oral Cavity) |
| L | Lymph Nodes (Unknown Primary) |
| POS | Positive |
| NEG | Negative |
| NR | No Results |
| NED | No Evidence of Disease |
| IND | Indeterminate |
| PRG | Progression |
References
- Cancers (Basel). 2022 Dec 10;14(24):6079. Current Insights and Progress in the Clinical Management of Head and Neck Cancer. Mariana Neves Amaral 1,2, Pedro Faísca 3, Hugo Alexandre Ferreira 2, Maria Manuela Gaspar 1,*, Catarina Pinto Reis 1,2,*. [CrossRef]
- J Natl Cancer Inst. 2008 Mar 19;100(6):407-20. doi: 10.1093/jnci/djn025. Epub 2008 Mar 11. Distinct risk factor profiles for human papillomavirus type 16-positive and human papillomavirus type 16-negative head and neck cancers. Maura L Gillison 1, Gypsyamber D'Souza, William Westra, Elizabeth Sugar, Weihong Xiao, Shahnaz Begum, Raphael Viscidi.
- Nat Rev Cancer. 2018 May;18(5):269-282. doi: 10.1038/nrc.2018.11. Epub 2018 Mar 2. The molecular landscape of head and neck cancer. C René Leemans 1, Peter J F Snijders 2, Ruud H Brakenhoff 1.
- N Engl J Med. 2010 Jul 1;363(1):24-35. doi: 10.1056/NEJMoa0912217. Epub 2010 Jun 7. Human papillomavirus and survival of patients with oropharyngeal cancer. K Kian Ang 1, Jonathan Harris, Richard Wheeler, Randal Weber, David I Rosenthal, Phuc Felix Nguyen-Tân, William H Westra, Christine H Chung, Richard C Jordan, Charles Lu, Harold Kim, Rita Axelrod, C Craig Silverman, Kevin P Redmond, Maura L Gillison.
- Cancers (Basel). 2022 Aug 22;14(16):4061. doi: 10.3390/cancers14164061. Human Papillomavirus-Associated Oropharyngeal Squamous Cell Carcinoma: A Systematic Review and Meta-Analysis of Clinical Trial Demographics. Tamar M Gordis 1, Joshua L Cagle 1, Shaun A Nguyen 1,*, Jason G Newman 1.
- Microbes Infect. Author manuscript; available in PMC: 2018 Sep 1. Published in final edited form as: Microbes Infect. 2017 Jun 12;19(9-10):464–475. doi: 10.1016/j.micinf.2017.06.001. Molecular mechanisms of human papillomavirus-related carcinogenesis in head and neck cancer. Farhoud Faraji 1,*, Munfarid Zaidi 1,*, Carole Fakhry 1, Daria A Gaykalova 1.
- Clin Cancer Res. 2015 Feb 1;21(3):632-41. doi: 10.1158/1078-0432.CCR-13-3310. Epub 2014 Jul 23. Integrative and comparative genomic analysis of HPV-positive and HPV-negative head and neck squamous cell carcinomas. Tanguy Y Seiwert 1, Zhixiang Zuo 2, Michaela K Keck 2, Arun Khattri 2, Chandra S Pedamallu 3, Thomas Stricker 4, Christopher Brown 5, Trevor J Pugh 3, Petar Stojanov 6, Juok Cho 6, Michael S Lawrence 6, Gad Getz 6, Johannes Brägelmann 2, Rebecca DeBoer 2, Ralph R Weichselbaum 7, Alexander Langerman 8, Louis Portugal 8, Elizabeth Blair 8, Kerstin Stenson 8, Mark W Lingen 9, Ezra E W Cohen 10, Everett E Vokes 10, Kevin P White 11, Peter S Hammerman 3.
- Front Cell Infect Microbiol. 2022 Nov 8:12:1007950. doi: 10.3389/fcimb.2022.1007950. eCollection 2022. Bioinformatic analysis identifies HPV-related tumor microenvironment remodeling prognostic biomarkers in head and neck squamous cell carcinoma. Qimin Zhou 1, Ouyang Yuan 2, Hongtu Cui 3, Tao Hu 3, Gary Guishan Xiao 4, Jiao Wei 1, Honglei Zhang 5, Chengjun Wu 1.
- Clin Cancer Res. 2017 Jun 1;23(11):2723-2729. doi: 10.1158/1078-0432.CCR-16-1617. Epub 2016 Nov 21. E6 and E7 Antibody Levels Are Potential Biomarkers of Recurrence in Patients with Advanced-Stage Human Papillomavirus-Positive Oropharyngeal Squamous Cell Carcinoma. Matthew E Spector 1, Assuntina G Sacco 2, Emily Bellile 3, Jeremy M G Taylor 3, Tamara Jones 3, Kan Sun 3, William C Brown 4, Andrew C Birkeland 3, Carol R Bradford 3, Gregory T Wolf 3, Mark E Prince 3, Jeffrey S Moyer 3, Kelly Malloy 3, Paul Swiecicki 3, Avraham Eisbruch 3, Jonathan B McHugh 3, Douglas B Chepeha 3 5, Laura Rozek 3, Francis P Worden 3.
- Head Neck. 2012 Apr;34(4):459-61. doi: 10.1002/hed.21974. Epub 2011 Dec 16. p16 expression as a surrogate marker for HPV-related oropharyngeal carcinoma: a guide for interpretative relevance and consistency. Adel K El-Naggar 1, William H Westra.
- [29][Rf-19] Transl Oncol. 2019 Aug;12(8):1108-1112. doi: 10.1016/j.tranon.2019.05.009. Epub 2019 Jun 6. HPV and Oropharyngeal Cancer in the Eighth Edition of the TNM Classification: Pitfalls in Practice. Markus Hoffmann 1, Silke Tribius 2. PMID: 31176088 PMCID: PMC6556492. [CrossRef]
- J Immunol. Author manuscript; available in PMC: 2013 Dec 15. Published in final edited form as: J Immunol. 2012 Nov 2;189(12):5533–5540. doi: 10.4049/jimmunol.1201161. Macrophage Migration Inhibitory Factor promotes tumor growth and metastasis by inducing Myeloid Derived Suppressor Cells in the tumor microenvironment. Kendra D Simpson 1, Dennis J Templeton 1, Janet V Cross 1,*.
- J Clin Med. 2019 Jan 10;8(1):75. doi: 10.3390/jcm8010075. Involvement of HPV Infection in the Release of Macrophage Migration Inhibitory Factor in Head and Neck Squamous Cell Carcinoma. Nadège Kindt 1, Géraldine Descamps 1, Jérôme R Lechien 2, Myriam Remmelink 3, Jean-Marie Colet 4, Ruddy Wattiez 5, Guy Berchem 6, Fabrice Journe 1,7, Sven Saussez 1,2,*.
- JCI Insight. 2016 Oct 20;1(17):e89829. doi: 10.1172/jci.insight.89829. The head and neck cancer immune landscape and its immunotherapeutic implications. Rajarsi Mandal 1 2 3, Yasin Şenbabaoğlu 4, Alexis Desrichard 1 3, Jonathan J Havel 1 3, Martin G Dalin 1 3, Nadeem Riaz 3 5, Ken-Wing Lee 1 3, Ian Ganly 2, A Ari Hakimi 6, Timothy A Chan 1 3 5, Luc Gt Morris 1 2 3.
- Neoplasia. 2014 Feb;16(2):168-79. doi: 10.1593/neo.132034. HIF-α/MIF and NF-κB/IL-6 axes contribute to the recruitment of CD11b+Gr-1+ myeloid cells in hypoxic microenvironment of HNSCC. Guiquan Zhu 1, Yaling Tang 2, Ning Geng 2, Min Zheng 2, Jian Jiang 2, Ling Li 1, Kaide Li 2, Zhengge Lei 2, Wei Chen 2, Yunlong Fan 2, Xiangrui Ma 2, Longjiang Li 2, Xiaoyi Wang 2, Xinhua Liang 3.
- Eur J Pharmacol. Author manuscript; available in PMC: 2015 Oct 5. Published in final edited form as: Eur J Pharmacol. 2014 Jul 21;740:364–378. [CrossRef]
- Cisplatin: mode of cytotoxic action and molecular basis of resistance. Zahid H Siddik. Oncogene volume 22, pages7265–7279 (2003).
- Ann Med. 2025 Dec;57(1):2447403. doi: 10.1080/07853890.2024.2447403. Epub 2025 Jan 6. The role of cisplatin in modulating the tumor immune microenvironment and its combination therapy strategies: a new approach to enhance anti-tumor efficacy. Guandu Li 1, Xiangyu Che 1, Shijin Wang 1, Dequan Liu 1, Deqian Xie 1, Bowen Jiang 1, Zunwen Zheng 1, Xu Zheng 2, Guangzhen Wu 1.
- Oncoimmunology. 2021 Jun 27;10(1):1935557. doi: 10.1080/2162402X.2021.1935557. Cisplatin inhibits frequency and suppressive activity of monocytic myeloid-derived suppressor cells in cancer patients. Glenn F Van Wigcheren a,b, Nienke De Haas a, Tom A Mulder a,c, Sophie K Horrevorts a, Martine Bloemendal a,d, Simone Hins-Debree a, Yumeng Mao c,e, Rolf Kiessling c, Carla ML van Herpen d, Georgina Flórez-Grau a,*, Stanleyson V Hato a,*, I Jolanda M De Vries a,✉,*.
- J Cancer Res Clin Oncol. 2010 May;136(5):651-7. doi: 10.1007/s00432-009-0702-5. Epub 2009 Nov 14. Macrophage migration inhibitory factor expression in cervical cancer. Mathias Krockenberger 1, Jörg B Engel, Julia Kolb, Yvonne Dombrowsky, Sebastian F M Häusler, Nico Kohrenhagen, Johannes Dietl, Jörg Wischhusen, Arnd Honig. PMID: 19915866 PMCID: PMC11827952 DOI: 10.1007/s00432-009-0702-5.
- QJM. 2018 Nov 1;111(11):769-778. doi: 10.1093/qjmed/hcy163. Oral squamous carcinoma cells promote macrophage polarization in an MIF-dependent manner. M Barbosa de Souza Rizzo 1 2 3, M Brasilino de Carvalho 1 2, E J Kim 3, B E Rendon 3, J T Noe 3 4, A Darlene Wise 3 5, R A Mitchell 3 4 5 6. PMID: 30016493 PMCID: PMC6217709. [CrossRef]
- J Oncol. 2022 Sep 26:2022:3107990. doi: 10.1155/2022/3107990. eCollection 2022. Trending Anti-E7 Serology Predicts Mortality and Recurrence of HPV-Associated Cancers of the Oropharynx. Luke Johnson 1, Dat T Ha 2, Melissa B Hall 2, Gregory Shoemaker 1, Paul A Bevins 1, John Strickley 3, Shadmehr Demehri 4 5, Rebecca A Redman 1 2, Joongho Joh 1 2. PMID: 36199787 PMCID: PMC9529406. [CrossRef]
- Storey R., Joh J., Jenson A. B., Ghim S., and Kloecker G. H., Detection of immunoglobulin G against E7 of human papillomavirus in non-small cell lung cancer, Journal of Oncology. (2013) 2013, 5, 240164, https://doi.org/10.1155/2013/240164, 2-s2.0-84875500511, 23533408, PMC3603668.
- J Exp Clin Cancer Res. 2022 Sep 20;41(1):279. doi: 10.1186/s13046-022-02481-4. The immune microenvironment of HPV-positive and HPV-negative oropharyngeal squamous cell carcinoma: a multiparametric quantitative and spatial analysis unveils a rationale to target treatment-naïve tumors with immune checkpoint inhibitors. Anna Tosi # 1, Beatrice Parisatto # 2, Anna Menegaldo 3, Giacomo Spinato 4, Maria Guido 3, Annarosa Del Mistro 1, Rossana Bussani 5, Fabrizio Zanconati 5, Margherita Tofanelli 6, Giancarlo Tirelli 6, Paolo Boscolo-Rizzo # 3 6, Antonio Rosato # 7 8. PMID: 36123711 PMCID: PMC9487049 DOI: 10.1186/s13046-022-02481-4.
- Pharmacol Ther. 2022 May:233:108024. doi: 10.1016/j.pharmthera.2021.108024. Epub 2021 Oct 19. Macrophage migration inhibitory factor (MIF): A multifaceted cytokine regulated by genetic and physiological strategies. Krishnamoorthi Sumaiya 1, Dianne Langford 2, Kalimuthusamy Natarajaseenivasan 3, Santhanam Shanmughapriya 4. PMID: 34673115. [CrossRef]
- Front Immunol. 2022 Apr 7:13:865395. doi: 10.3389/fimmu.2022.865395. eCollection 2022. The Role of MIF and IL-10 as Molecular Yin-Yang in the Modulation of the Host Immune Microenvironment During Infections: African Trypanosome Infections as a Paradigm. Benoit Stijlemans 1 2, Maxime Schoovaerts 1, Patrick De Baetselier 1 2, Stefan Magez 1 3, Carl De Trez 1. PMID: 35464430 PMCID: PMC9022210. [CrossRef]
- Nat Rev Immunol. 2003 Oct;3(10):791-800. doi: 10.1038/nri1200. Macrophage migration inhibitory factor: a regulator of innate immunity. Thierry Calandra 1, Thierry Roger. PMID: 14502271 PMCID: PMC7097468 DOI: 10.1038/nri1200. [CrossRef]
- J Immunol. 2012 Oct 15;189(8):3905-13. doi: 10.4049/jimmunol.1102152. Epub 2012 Sep 12. Role of macrophage migration inhibitory factor in the regulatory T cell response of tumor-bearing mice. Susanna Choi 1, Hang-Rae Kim, Lin Leng, Insoo Kang, William L Jorgensen, Chul-Soo Cho, Richard Bucala, Wan-Uk Kim. PMID: 22972922 PMCID: PMC3466372. [CrossRef]
Disclaimer/Publisher’s Note: The statements, opinions and data contained in all publications are solely those of the individual author(s) and contributor(s) and not of MDPI and/or the editor(s). MDPI and/or the editor(s) disclaim responsibility for any injury to people or property resulting from any ideas, methods, instructions or products referred to in the content. |
© 2025 by the authors. Licensee MDPI, Basel, Switzerland. This article is an open access article distributed under the terms and conditions of the Creative Commons Attribution (CC BY) license (http://creativecommons.org/licenses/by/4.0/).
Copyright: This open access article is published under a Creative Commons CC BY 4.0 license, which permit the free download, distribution, and reuse, provided that the author and preprint are cited in any reuse.


