
Submitted:
21 November 2025
Posted:
24 November 2025
You are already at the latest version
Abstract
The northern Brazilian Amazon has ecological transition ecosystems with high diversity and endemism of tree species and few botanical collections. We evaluated the phytosociology between Dense Ombrophilous Forest (Ds) and Forested Campinarana (Ld) within the Anauá National Forest (Flona) in Roraima, Brazil. A total of 14,730 trees with a DBH > 10 cm were inventoried across 30 hectares (ha), distributed among 55 botanical families, 183 genera, 386 species, and 123 undetermined trees. Ten hyperdominant tree families accounted for 69% of the sampled trees and 65% of the stored forest carbon (102.9 ± 5.0 Mg ha-1), like Arecaceae (2,555), Fabaceae (1,738) and Sapotaceae (1,311). Ten hyperdominant species accounted for 32% of the sampled individuals and 32% of the stored forest carbon (46.3 ± 3.8 Mg ha-1), like Euterpe precatoria (1,151), Pouteria macrophylla (561) and Inga alba (574). The Anauá National Forest has great potential for sustainable multiple-use forest management through forest concessions; however, tree mortality due to natural causes and anthropogenic actions (deforestation, illegal selective logging, and forest fires) was considered high (7%) for tropical forests in the Amazon. We recommend further studies to broaden the understanding of tree diversity and forest structure present in ecological transition ecosystems in the Brazilian Amazon.
Keywords:
Amazon
; tree diversity
; timber species
; forest structure
; endemic species
1. Introduction
Phytosociology evaluates the behavior of density, dominance, frequency, phytosanitary status, economic potential, biomass, carbon, and spatial distribution of tree species in the forest structure throughout the natural landscape, using both qualitative and quantitative approaches [1,2]. Metrics obtained through forest inventories can be considered good indicators of environmental quality in natural ecological systems [3] and are extremely important for assessing the degree of impact of climate change caused by natural events and human actions. Thus, changes in floristic composition and forest structure in tropical ecosystems can be detected by assessing the richness and abundance of species that have undergone reduction, increase and extinction because of natural processes, anomalies and anthropogenic actions [4].
Sustainable forest management (SFM) in the Amazon enables the orderly and rational exploitation of timber and non-timber forest products in a selective and legal manner, aiming to combine socioeconomic benefits and environmental sustainability [5]. In contrast, predatory logging is advancing in the Amazon in a selective and illegal manner, generally associated with criminal forest fires, resulting in significant losses of forest carbon, reduced diversity, changes in forest structure and high tree mortality [6,7]. These changes have contributed to the reduction and disabling of vital interactive ecological processes between flora and fauna, such as pollination, natural regeneration, production of wood, fruits, latex, among others [8]. Mortality in tropical trees can also be associated with different factors, such as growth rate, size (DBH), wood density, loss of photosynthetic efficiency, low resilience and climatic adaptation to natural or anthropogenic disturbances [9].
The conversion of tropical forests into deforested areas in the Amazon [10], mainly to supply the export of valuable timber and agricultural use of international commodities such as meat and soy [11,12], has jeopardized the survival of endemic plant species in ecologically transitional ecosystems. Tropical forests and savannas of the Amazon River Basin and the Guiana Shield, in the Amazon Biome, have the greatest biodiversity on Earth, with an estimated 1,300 species of birds, 427 species of mammals and 50,000 species of seed plants [13,14,15]. These are natural landscapes marked by the influence of environmental gradients, such as variations in altitude, soil texture and composition, hydromorphic processes, precipitation, and temperature. This mosaic of natural ecosystems is characterized by a highly endemic and diverse floristic composition and forest structure [15,16,17,18], with a limited number of botanical collections. Such knowledge is fundamental for the development of conservation strategies, sustainable use of timber and non-timber resources, and mitigation of climate change on Earth.
The central objective of this research was to evaluate the phytosociology of transitional ecosystems in the Anauá National Forest, in southern Roraima, Brazil. The main questions addressed in this study were: (i) Which forest species can be considered hyperdominant and endemic (locally rare)? (ii) What is the potential of timber and non-timber species and their implications for a future scenario of forest management through forest concessions, also aiming at mitigating climate change? (iii) What is the impact of anthropogenic actions on tree species diversity and remaining forest structure?
2. Materials and Methods
2.1. Study Area and Data Collection
The Anauá National Forest (Flona) is a protected area in the far north of the Brazilian Amazon, located in the south of the state of Roraima, Brazil. It is a federal conservation unit administered by the Chico Mendes Institute for Biodiversity (ICMBio/RR) and covers approximately 2,600 km² [19]. Created in 2005, its management plan was approved in 2022 [18,20]. It is part of the white sand ecosystems of the Brazilian Amazon and is considered a region with a high degree of flora endemism and little recorded in botanical collections [17,18,21,22]. It is characterized by seasonal hydrological influences with varying degrees of hydromorphism [22,23]. This area is considered vulnerable to increasing atmospheric carbon emissions caused by human actions associated with deforestation for extensive livestock farming, forest degradation, selective illegal logging, and forest fires [4,7,24].
The forest inventory (FI) of the Anauá National Forest was carried out in 2015, measuring all trees with DBH (diameter at breast height) > 10 cm within 120 rectangular plots of 2500 m² (0.25 ha each), randomly distributed, totaling 30 hectares. Ecological transition ecosystems between Dense Ombrophilous Forest (Ds) and Forested Campinarana (Ld), as defined by the Brazilian Institute of Geography and Statistics (IBGE), were discussed [25].
2.2. Botanical Identification and Taxonomy
The collection and botanical identification of forest species measured in the field during the FI was carried out respecting the Normative Instruction of the Brazilian Institute of Environment and Renewable Natural Resources (IBAMA) No. 154/2007, which establishes the rules for conducting scientific research activities in areas of federal conservation units in Brazil. The team consisted of parabotanists, botanists, and forestry engineers from the Forest Management Laboratory (LMF) and the INPA Herbarium in Manaus. One specimen of each taxon was collected (triplicate). The taxonomy of the biological material was carried out at the INPA Herbarium, consisting of the steps of checking, validating the botanical nomenclature, cataloging and depositing fertile samples, which have reproductive structures. The samples were subjected to drying in an oven (60 °C) for 48 hours and freezing at 0 °C for 48 hours, as described in the INCT Herbaria Procedures Manual [26]. The botanical nomenclature was also checked in virtual herbaria [27,28,29]. The species were classified by the system proposed by the Angiosperm Phylogeny Group [30,31].
2.3. Phytosociological and Data Analyses
The estimation of tree species diversity in the Anauá National Forest was carried out using the Shannon-Wiener index (H), on a natural logarithmic basis [32] and Fisher's alpha (α) [33]. The species abundance ranking was calculated for both forest types (Ds and Ld) using the R software [34].
The assessment of forest structure was carried out using qualitative and quantitative approaches, calculated in Microsoft 365 software (Excel), as follows: a) horizontal structure (density, dominance, frequency, coverage value and ecological importance by species and family) [35]; b) Vertical structure divided into three total height strata (TH): lower stratum ₋ trees with TH < (x − 1σ); middle stratum ₋ trees with (x − 1σ) ≤ TH < (x +1σ) and upper stratum ₋ trees with TH ≥ (x +1σ), where x is the mean and σ is the standard deviation of the total heights [1,2]; c) parametric structure (mean, standard deviation and confidence interval - 95% CI), see Supplementary Material - List S1) of diameter (DBH), basal area (BA), total height (TH), commercial timber volume (V), dry biomass (aboveground = AGB; belowground = BGB; total biomass = B) and forest carbon (aboveground = AGC; belowground = BGC; total carbon = C) [2]; d) Internal or phytosanitary structure: fallen live tree (C), live tree damaged by natural causes (D), dead tree fallen due to natural causes (MC), tree killed by illegal selective logging (ME), standing dead tree due to natural causes (MP), tree killed by forest fire (MQ), normal live tree (N), live tree partially burned by forest fire (Q), live tree without crown (SC) and leaning live tree (T) [1,2,4,7].
2.4. Estimates of Total Height, Commercial Volume, Biomass, and Forest Carbon
The development of allometric models for estimating total height (TH) and commercial volume (V) was carried out using rigorous cubing of 171 trees with DBH > 10 cm of wood that had fallen naturally in the forest, recently illegally logged, and partially burned within and around the Anauá National Forest; see details in [7]. Authorization for scientific activities was obtained from ICMBio No. 45470-2, renewed annually (2014 to 2017) through the submission of reports to the Biodiversity Authorization and Information System - SISBio [36]. In the rigorous timber volume measurement stage, only trees in good phytosanitary condition were selected in terms of trunk and crown quality, regarding timber yield (50, 75 and 100%).
The estimation of biomass stock stored by trees with DBH > 10 cm in the Anauá National Forest was carried out at three levels using allometric models developed for Dense Ombrophilous Forest (Ds) [37] and Forested Campinarana (Ld) [38,39]. The estimation of forest carbon stock (C) stored by trees was carried out in three stages. Initially, fresh biomass was estimated from the allometric models, using a correction factor (1.098023) for the average dominant height (Hdom. = 33.2 meters) of 20% of the trees with the largest diameters in the Anauá National Forest in relation to the dominant height (Hdom. = 30.2 meters) of ZF-2 in Manaus-AM [7]. In the second stage, dry biomass was estimated using a correction factor (0.582) based on the water content of the trees, corresponding to the average of the factors developed for Ds [37] and Ld [39]. In the third stage, forest carbon was estimated based on the specific carbon content of the wood, applying a factor (0.480) corresponding to the average of the factors developed for Ds and Ld mentioned above. The total area of each forest physiognomy (stratum) referring to Ds and Ld was estimated by means of supervised pixel-by-pixel classification using the Maximum Likelihood algorithm on the R(5), G(4), B(3) composition of digital images from the OLI remote sensor of the Landsat-8 platform, in ArcGIS 10.3 software, by detailed method [7].
2.5. Estimation of Tree Mortality from Natural and Anthropogenic Causes
The estimation of tree mortality due to natural and anthropogenic causes was carried out from visual observations in the field during the FI of the Anauá National Forest and, subsequently, by analyzing the FI database. The difference between dead trees that died from natural processes (natural falls, mortality due to drought, pathogens, among others) and dead trees affected by human processes (deforestation, illegal logging and affected by forest fires), excluding live trees, was evaluated by a detailed method [7]. In this study, we assume that the reduction of forest carbon stocks resulting from natural processes alters the gas exchange of the forest ecosystem in the medium to long term. Dead trees that have fallen naturally will retain their stored carbon for a long time, without significant losses to the forest. Trees that have fallen naturally are generally not removed from the forest by loggers because they have low commercial value due to their advanced state of decomposition. In contrast, trees affected by illegal selective logging result in a more pronounced loss of forest carbon stock in the short term, as they are immediately extracted and processed in local sawmills. Forest fires alter the gas exchange of the forest ecosystem in the short term, reducing the forest carbon stock to varying degrees, depending on the incidence and severity of the fires [7,40,41,42].
3. Results
3.1. Forest Inventory, Taxonomy and Forest Structure
The forest inventory (FI) of the Anauá National Forest demonstrated the existence of a highly endemic and diverse flora in southern Roraima, Brazil. Thirty hectares were inventoried in ecosystems of ecological transition between Dense Ombrophilous Forest (Ds) and Forested Campinarana (Ld), with 14,730 trees with DBH > 10 cm measured, distributed among 55 botanical families, 182 genera, 385 species or morphospecies, and 123 trees of undetermined species (Table 1). The complete botanical list can be viewed in Supplementary Material (Table S2). The species that are endemic or locally rare, that is, with less than 1 individual per hectare, totaled 305 (79% of the total sampled).
The 10 tree families with the highest family importance values (FIVi%) considered hyperdominant in the Anauá National Forest were Fabaceae (1,738), Arecaceae (2,555), Sapotaceae (1,311), Lecythidaceae (906), Annonaceae (1,006), Vochysiaceae (372), Moraceae (453), Chrysobalanaceae (611), Burseraceae (649), and Lauraceae (515), representing 69% of the total individuals sampled and 65% of the stored forest carbon (102,9 ± 5,0 Mg ha-1) (Table 2).
The 10 forest species with the highest importance values (IVi%) considered hyperdominant in the Anauá National Forest were Euterpe precatoria (1,151), Pouteria macrophylla (561), Inga alba (574), Brosimum acutifolium (358), Protium rubrum (504), Sapium glandulosum (267), Attalea maripa (409), Astrocaryum murumuru (536), Manilkara huberi (145) e Qualea paraensis (194), representing 32% of the total individuals sampled and 32% of the stored forest carbon (46.3 ± 3.8 Mg ha-1) (Table 3).
The abundance ranking by species highlighted the hyperdominance of palm trees such as E. precatoria, A. maripa, O. bacaba, among others, for both forest types (Ds and Ld). This fact demonstrates the great potential for exploitation of non-timber forest products (NTFPs) originating from the Arecaceae family (Figure 1). Dead trees were represented in this study as a single species, aiming to assess their representativeness, showing high abundance (7%; 1,033; 34 trees ha-1) for tropical forests of the Brazilian Amazon, denoting signs of environmental disturbance.
In forest inventory (FI) of the Anauá National Forest (Flona), higher diversity values were observed for Dense Ombrophilous Forest - Ds (H’ = 4.43; α = 75.27) compared to Forested Campinarana - Ld (H’ = 4.26; α = 57.23), values considered intermediate in relation to studies carried out in the Brazilian Amazon (Table 4).
The vertical structure of the Anauá National Forest was represented by three well-defined vertical strata, with higher tree frequencies observed in the middle and upper strata in both forest types (Ds and Ld) (Figure 2).
3.2. Timber and Non-Timber Potential in a Future Scenario of MFS Through Forest Concessions
The assessment of the internal or phytosanitary structure of the Anauá National Forest, carried out on the 30 hectares of the FI (14,730 trees), found that most trees were considered normal without any apparent damage (N: 90%; 13,198 trees; 440 trees ha-1). This demonstrates that the forest is in good condition, especially in the Western Region, which is further away from human occupation. Mortality associated with natural causes, such as trees that died due to natural causes (MC: 1.2%; 180 trees; 6 trees ha-1) and standing dead trees due to natural causes (MP: 3.1%; 458 trees; 15 trees ha-1), totaled 4.3% of the total number of trees in the FI. Mortality associated with anthropogenic causes, such as deforestation, forest degradation, and forest fires, totaled 3.9%, comprising trees killed by selective illegal logging (ME: 0.2%, 26 trees; 0.9 trees ha-1), and trees killed by forest fires (MQ: 3.7%, 549 trees; 18.3 trees ha-1). Live trees that had suffered some type of stress, mainly due to forest degradation from selective illegal logging, totaled 0.04%, consisting of live trees without crowns (SC: 0.03%, 5 trees; 0.2 trees ha-1) and live trees partially burned by forest fire (Q: 0.01%, 1 tree; 0.03 trees ha-1). The minority (2.2%) corresponded to fallen trees (C: 0.1%; 12 trees; 0.4 trees ha-1), crooked trees (T: 2%; 292 trees; 9.7 trees ha-1) and trees damaged by natural causes (D: 0.1%; 9 trees; 0.3 trees ha-1) (Figure 3).
The Anauá National Forest presented a frequency of trees by diameter that was quite similar in Dense Ombrophilous Forest (Ds) and Forested Campinarana (Ld) ecosystems (Figure 4). Initially, this fact may raise doubts about the accuracy of supervised digital image classification (Maximum Likelihood) by forest types, considering the concept of the predominance of thicker trees in Ds environments compared to Ld. However, it should be noted that of the 30 hectares sampled in the FI of the Anauá National Forest, half were classified as Ds (15) and the other half as Ld (15 ha), due to the fact that the total area or the majority of the plot area (area 0.25 ha) overlapped the respective forest physiognomy. Regions of ecological transition or contact between Campinarana and Dense Ombrophilous Forest (LOt) totaled 67 of the 120 sampled plots (56%), thus the decision criterion was defined based on the largest area occupied in relation to Ds and Ld per plot.
The basal area stock per hectare (m² ha-1) in Dense Ombrophilous Forest (Ds) and Forested Campinararana (Ld) was considered similar (ANOVA, pvalue = 0,2530) (Table 5). Regarding the commercial volume of timber stock (m³ ha-1), there is strong evidence of a difference between forest physiognomies (ANOVA, pvalue < 0,0001), on average the timber volume production per hectare is higher in Ds compared to Ld. However, when we consider the areas mapped by forest physiognomy, that is, the size per stratum within the Anauá National Forest, the basal area and commercial volume stocks in Campinarana Florestada (116,907 ha) were higher compared to the Dense Ombrophilous Forest (71,161 ha).
Aboveground dry biomass (AGB), belowground dry biomass (BGB), and total biomass (B) stocks per hectare were higher in Ds compared to Ld (ANOVA, p-value < 0.0001) (Table 6). Aboveground forest carbon (AGC), belowground forest carbon (BGC), and total carbon (C) stocks per hectare were also higher in Ds compared to Ld (ANOVA, pvalue < 0,0001).
The spatial distribution map of forest phytophysiognomies (Ds and Ld) with the average carbon stock and uncertainty (95% CI) per hectare can be seen in Figure 5.
It was estimated that dense ombrophilous forest (Ds) has a higher potential for timber harvesting compared to forested savanna (Ld), considering the parameters of trees per hectare (Trees per hectare: ANOVA, pvalue < 0,0001) and commercial timber volume (V: ANOVA, pvalue < 0,003), specifically for trees with a DBH > 50 cm, which theoretically would be suitable for commercial exploitation (Table 7). However, it should be noted that not all trees with a DBH > 50 cm can be harvested, according to current forestry legislation specific to SFM in the Brazilian Amazon [5,43,44]. The potential for exploitation of non-timber forest products (NTFPs) was estimated, considering only individuals of the Arecaceae family, in Ds of 88,9 ± 14,9 palm trees ha-1 (21%) and stratum (6,3 ± 0,1 x 10⁶ palm trees) and in Ld of 80,4 ± 14,7 palm trees ha-1 (19%) and stratum (9,4 ± 1,2 x 10⁶ palm trees).
3.3. Impact of Anthropogenic Actions on Tree Species Diversity and Remaining Forest Structure
The impact of anthropogenic actions on tree species diversity and forest structure was associated with deforestation, forest degradation, and forest fires, totaling 3.9% of total mortality, comprised of trees killed by illegal selective logging (ME: 0.2%, 26 trees; 0.9 trees ha-1) and trees killed by forest fire (MQ: 3.7%, 549 trees; 18.3 trees ha-1). In situ evidence was observed that these practices related to deforestation, forest degradation, and forest fires can considerably reduce the diversity of flora and fauna species, emit large quantities of greenhouse gases (GHG) into the atmosphere, and significantly reduce the stocks of forest volume, biomass, and carbon within and around the Anauá National Forest (Figure 6).
During the period from October 2015 to January 2017, there were major changes in land use and land cover within and around the Anauá National Forest (Flona) associated with deforestation, forest degradation and forest fires (Figure 7).
4. Discussion
The Brazilian government, to contain or "shield" the advance of predatory exploitation of natural resources in public areas, created Conservation Units (UCs), in accordance with Law No. 9,985/2000 [45]. The National Forest (Flona) aims for the sustainable multiple use of forest resources and scientific research, emphasizing sustainable forest management (SFM). However, currently, most of the National Forests in Brazil are under some type of human pressure (e.g., Tapajós National Forest, Jamari National Forest, among others) and overlap with economically viable areas for logging [46,47]. Created in 2005, the Anauá National Forest only had its Management Plan (MP) approved in 2022 [48], and before that it was extremely vulnerable to human activity through deforestation, forest degradation and criminal forest fires for several years [7].
Our results demonstrated that the Anauá National Forest has great potential for the exploitation of timber forest products (TFP) and non-timber forest products (NTFPs), however, it must be conducted within the context of MFS through forest concessions [5,43,45], mainly due to the endemic biodiversity of the arboreal flora present in the ecological transition ecosystems of white sand in southern Roraima [49]. The commercial volume stock of timber present in large trees (DBH > 50 cm) suitable for MFS is around 5.2 ± 0.1 million m³ of timber in Dense Ombrophilous Forest (Ds) and 5.3 ± 0.8 million m³ of timber in Forested Campinarana (Ld), taking into account the legal limits for cutting volume per hectare and the rarity criterion of species (Table 7).
The three timber species with the highest commercial volumes and forest carbon stocks per hectare were Manilkara huberi (8.5 m³ ha-1; 5.8 Mg ha-1), Qualea paraensis (6.9 m³ ha-1; 5.1 Mg ha-1), and Goupia glabra (4.3 m³ ha-1; 2.9 Mg ha-1), and are currently among the most exploited timber species in Roraima [1,50]. However, it should be noted that the majority of the timber volume and forest carbon stock is present in endemic or locally rare species, with less than one individual per hectare (79% of the total sampled). The potential for NTFPs is also high, given the high density of palm species, allowing for the extraction of fruits, seeds, leaves, oils, etc., mainly from the hyperdominant species E. precatoria (15.8 palms ha-1).
The use and conservation of ecosystem services provided by tropical forests must be linked to the sustainable exploitation of multiple timber and non-timber products in the Amazon, enabling economic profitability and generating benefits for society [51]. Strengthening environmental education through public policies aimed at society is the path to respect for nature, because we can only value and conserve what we know. Sustainable Forest Management (SFM), when implemented rationally, can be considered land use that allows for the exploitation of forest resources combined with their perpetuation for future generations, as it utilizes a series of premises such as reduced-impact logging and chain-of-custody monitoring [4,52,53,54], physical security and guarantee of social rights at work, respect for current law [55,56], adding value to forest products through forest certification [57], opportunity to trade credits in the global carbon market [58], regulation of ecosystem services and quantification of environmental services in the Amazon [59,60]. Unfortunately, in the state of Roraima, SFM is still considered incipient, being largely surpassed by the conversion of native forests aimed at expanding agriculture [61].
Analysis of the vertical structure of the Anauá National Forest revealed the superiority of trees per hectare occupying the middle stratum (12.6 < TH < 19.1 m) in Ds (75%) and Ld (93%), similar to several studies carried out in Roraima [1,62] (Figure 2). In comparison with Ds of Caracaraí-RR [1], the Anauá National Forest obtained similar values in relation to the lower stratum (TH < 12.4 m; TH < 12.6 m) and distinct values for the middle stratum (12.4 < TH < 26.5 m; 12.6 < TH < 19.1 m) and upper stratum (TH > 26.5; TH > 19.1 m), respectively, demonstrating a predominance of trees with greater total heights in Caracaraí than Rorainópolis, both in the south of Roraima. This fact may be related to the predominance of clayey soils rather than sandy soils in Caracaraí compared to Rorainópolis.
Tropical rainforests represent enormous stocks of biomass and forest carbon, and are considered vital for the Earth's climate balance. It is essential to understand how stored forest carbon is associated with the richness and diversity of tropical flora species, requiring the development of conservation and sustainable use strategies for natural resources in harmony with the preservation of endemic or rare species. In the Anauá National Forest, aboveground dry biomass stocks (AGB), belowground dry biomass stocks (BGB), and total biomass (B) per hectare were higher in Ds compared to Ld (ANOVA, pvalue < 0,0001) (Table 4). Consequently, aboveground, belowground, and total forest carbon stocks per hectare were also higher in Ds compared to Ld (ANOVA, pvalue < 0,0001), corroborating with other studies carried out in the Amazon [39,40,41,42]. Just ten hyperdominant tree families accounted for 69% of the total individuals sampled and 65% of the forest carbon (102,9 ± 5,0 Mg ha-1). However, most of the diversity of forest species can be considered endemic or rare locally, resulting in a higher concentration of stored forest carbon (68%) (110,1 ± 5,2 Mg ha-1), indicating a high degree of need for further botanical and taxonomic studies to promote knowledge and appreciation of the intrinsic arboreal biodiversity of the Brazilian Amazon.
Due to the accelerated pace of deforestation, forest degradation, and forest fires driven mainly by agriculture, a large part of the biodiversity of the endemic flora of southern Roraima is being lost without even being scientifically known. The potential of timber and non-timber resources is being extracted legally and illegally, through fraudulent mechanisms [63], failing to generate financial resources for the federal government through forest concessions by SFM [6]. However, monitoring and enforcement activities are considered weak elements in Brazilian forest concessions, and actions are needed to ensure the sustainability of forests considering the increasing illegal logging [64]. In the state of Roraima, selective illegal logging is associated with a complex network of illegal logging and trade, with ramifications in politics and various state and federal agencies, as reported by the Federal Police in operations “Salmo 96” in 2012 [65] “Xilófagos” in 2014 [66]. The low representation of parliamentarians (deputies and senators) committed to the development and strengthening of SFM in the Amazon also contributes to the expansion of public policies focused solely on the growth of agribusiness, under the traditional model of land use in the Amazon, associated with deforestation, forest degradation, and uncontrolled burning for land clearing, facilitating the occurrence and spread of large forest fires, especially in years of severe drought influenced by the El Niño climate phenomenon.
We recommend conducting further botanical and taxonomic studies in ecological transition ecosystems between savanna and forest in the Brazilian Amazon, aiming to expand knowledge of the associated flora and fauna. It is essential to carry out forest inventories encompassing information on flora biodiversity, carbon stock, and ecosystem services, in order to support the development of public policies for strengthening sustainable forest management in the Amazon, under the sustainable use of natural resources in harmony with socioeconomic development in the Northern Region of Brazil.
5. Conclusions
The Anauá National Forest has great potential for implementing sustainable forest management (SFM) for multiple uses, due to its extensive coverage of Dense Ombrophilous Forest (Ds) and Forested Campinarana (Ld), associated with commercially valuable timber species such as Manilkara huberi, and high density and dominance of palm trees, such as the hyperdominant Euterpe precatoria. However, both forest physiognomies have unique ecological characteristics and different potentials for the exploitation of timber and non-timber forest products that should be considered for future multiple-use forest management through forest concessions.
The recently approved Management Plan for the Anauá National Forest is the first step towards mitigating the growing impact of human activities related to deforestation, forest degradation, and forest fires in southern Roraima. However, it is vital to implement inspection, environmental monitoring, and forest concessions in this conservation unit, aiming to contribute to generating revenue for the federal government through the sustainable exploitation of timber and non-timber forest products by SFM. The absence of public power facilitates the perpetuation of activities that degrade the environment, contributing to the reduction of timber, biomass, and forest carbon stocks, causing the mortality of endemic and rare tree species in southern Roraima.
Supplementary Materials
The following supporting information can be downloaded at the website of this paper posted on Preprints.org, List S1: Stratified Random Sampling (SRS) was calculated using the following mathematical expressions [2]. Where: N = total number of sample units in the population; = total number of strata; = total number of sample units in each j-th stratum, j = 1, 2,..., M; n = number of sample units cast in all strata; = number of sample units cast in each j-th stratum; = estimated mean of the variable Y in each j-th stratum; = quantity of the variable Y in the i-th sample unit, of the j-th stratum; = stratified mean or weighted mean; = proportion of the total area of each stratum in relation to the total area; = estimated total value of Y for the population; = estimated total value of Y for each j-th stratum; = estimated variance of Y in each j-th stratum; = standard deviation in each j-th stratum; = estimated variance of the stratified mean for a finite population; = standard error of the estimated mean; = sample size to obtain a given precision; = sampling error in percentage (%); = sampling error in absolute; = confidence interval per hectare; = confidence interval per stratum; = confidence interval for the overall population; Table S1: Floristic composition, taxonomy and forest structure of Flona de Anauá, in southern Roraima, Brazil. * Where: Treesi = total number of individuals per species in the 30 hectares of the forest inventory (FI); D = density of individuals per species per hectare, Trees ha-1; DBH = mean and standard deviation of diameter at breast height, in cm; TH = mean and standard deviation of total height, in meters; BA = basal area per species per hectare, in m² ha-1; V = commercial timber volume per species per hectare, in m3 ha-1; AGB = aboveground dry biomass per species, in Mg ha-1; BGB = belowground dry biomass per species, in Mg ha-1; B = total dry biomass per species, in Mg ha-1; Carbon: AGC = aboveground carbon per species, in Mg ha-1; BGC = belowground carbon per species, in Mg ha-1; C = total carbon per species, in Mg ha-1.
Author Contributions
All authors participated equally in the experimental design, data analysis, and manuscript preparation. All authors have read and agreed to the submitted version of the manuscript.
Funding
Coordenação de Aperfeiçoamento de Pessoal de Nível Superior (CAPES): 1451925.
Institutional Review Board Statement
Not applicable.
Informed Consent Statement
Not applicable.
Data Availability Statement
The datasets generated and/or analyzed during this exploratory study are available from the corresponding author. Data will be shared upon reasonable request.
Acknowledgments
This contribution is part of my doctor’s thesis at the Institute of Amazonian Research (INPA), which was supported by a fellowship from the Coordination for the Improvement of Higher Education Personnel (CAPES). The INCT-Madeiras da Amazônia Project provided financial support. We thank the professionals from LMF/INPA, especially Raquel Fernandes de Araujo and Carlos Henrique Souza Celes. We thank the professionals from ICMBio in Roraima, especially Nilton Barth Filho and Geomar da Silva Carneiro. We thank the students and professionals of the State University of Roraima (UERR) who supported our efforts. We thank the professionals from Herbarium (INPA), especially Michael John Gilbert Hopkins and Nory Daniel de Carvalho Erazo. We dedicate this work to the parabotanists “Cuiú” and “Caroço” from INPA (in memoriam), for their invaluable support during the botanical identification of the trees in the field.
Conflicts of Interest
The authors declare no conflict of interest.
References
- Condé, T.M.; Tonini, H. Fitossociologia de uma Floresta Ombrófila Densa na Amazônia Setentrional, Roraima, Brasil. Acta Amaz. 2013, 43, 247–260. [Google Scholar] [CrossRef]
- Souza, A.L.; Soares, C.P.B. Florestas Nativas: estrutura, dinâmica e manejo, Editora UFV: Viçosa, Brazil, 2013, ISBN 978-85-7269-463-6.
- Magurran, A.E. Ecological Diversity and Its Measurement, 1rd ed.; Chapman & Hall: University College of North Wales, Bangor, UK, 1988. [Google Scholar] [CrossRef]
- Condé, T.M.; Tonini, H.; Higuchi, N.; Higuchi, F.G.; Lima, A.J.N.; Barbosa, R.I.; Pereira, T.S.; Haas, M.A. Effects of sustainable forest management on tree diversity, timber volumes, and carbon stocks in an ecotone forest in the northern Brazilian Amazon. Land Use Policy, 1061. [Google Scholar] [CrossRef]
- BRASIL, 2006. Available online: http://www.planalto.gov.br/ccivil_03/_Ato2004–2006/2006/Lei/L11284. htm (accessed on 01 February 2025).
- Vidal, E.; Viana, V.M.; Batista, J.L.F. Crescimento de floresta tropical três anos após colheita de madeira com e sem manejo florestal na Amazônia Oriental. Sci. For. 2002, 61, 133–143. [Google Scholar]
- Condé, T.M.; Higuchi, N.; Lima, A.J.N. Illegal selective logging and forest fires in the Northern Brazilian Amazon. Forests 2019, 10, 61. [Google Scholar] [CrossRef]
- Francez, L.M.B.; Carvalho, J.O.P.; Jardim, F.C.S. Mudanças ocorridas na composição florística em decorrência da exploração florestal em uma área de floresta de Terra Firme na região de Paragominas, PA. Acta Amaz. 2007, 37(2), 219–228. [Google Scholar] [CrossRef]
- Esquivel-Muelbert, A.; Phillips, O.L.; Brienenand, R.J.W.; Fauset, S.; Sullivan, M.J.P.; Baker, T.R.; Chao, K.J.; Feldpausch, T.R.; Gloor, E.; Higuchi, N.; and, *!!! REPLACE !!!*; et al. Tree mode of death and mortality risk factors across Amazon forests. Nature Com. 5515. [Google Scholar] [CrossRef]
- Asner, G.P.; Knapp, D.E.; Broadbent, E.N.; Oliveira, P.J.C.; Keller, M.; Silva, J.N.M. Selective Logging in the Brazilian Amazon. Science 2005, 310, 480–482. [Google Scholar] [CrossRef]
- Nepstad, D.; McGrath, D.; Stickler, C.; Alencar, A.; Azevedo, A.; Swette, B.; Bezerra, T.; DiGiano, M.; Shimada, J.; Motta, R.S.; and, *!!! REPLACE !!!*; et al. Slowing Amazon deforestation through public policy and interventions in beef and soy supply chains. Science 2014, 344, 1118–1123. [Google Scholar] [CrossRef]
- Rajão, R.; Soares-Filho, B.; Nunes, F.; Börner, J.; Machado, L.; Assis, D.; Oliveira, A.; Pinto, L.; Ribeiro, V.; Rausch, L.; and, *!!! REPLACE !!!*; et al. The rotten apples of Brazil’s agribusiness. Science 2020, 369, 246–248. [Google Scholar] [CrossRef]
- Silva, J.M.C.; Rylands, A.B.; Fonseca, G.A.B. The fate of the Amazonian areas of endemism. Conserv. Biol. 2005, 19(3), 689–694. [Google Scholar] [CrossRef]
- Lewinsohn, T.M.; Prado, P.I. How many species are there in Brazil? Cons. Biol. 2005, 19(3), 619–624. [Google Scholar] [CrossRef]
- ter Steege, H.; Vaessen, R.W.I; Cárdenas-López, D.; Sabatier, D.; Antonelli, A.; Oliveira, S.M.; Pitman, N.; Jørgensen, P.M.; Salomão, R.P.; Gomes, V.H.F.; and, *!!! REPLACE !!!*; et al. The discovery of the Amazonian tree flora with an updated checklist of all known tree taxa. Bol. Mus. Para. Emílio Goeldi. [CrossRef]
- ter Steege, H.; Pitman, N.C.A.; Amaral, I.L.; Coelho, L.S.; Matos, F.D.A.; Lima Filho, D.A.; Salomão, R.P.; Wittmann, F.; Castilho, C.V.; Guevara, J.E.; and, *!!! REPLACE !!!*; et al. Mapping density, diversity and species-richness of the Amazon tree flora. Comm. Biol. 1130. [Google Scholar] [CrossRef]
- Thaise, E.; Nelson, B.W.; Schietti, J.; Desmoulière, S.J.-M.; Espírito Santo, H.M.V.; Costa, F.R.C. Assessing the relationship between forest types and canopy tree beta diversity in Amazonia. Ecography 2010, 33(110), 1–10. [Google Scholar] [CrossRef]
- Hopkins, M.J.G. Modelling the known and unknown plant biodiversity of the Amazon basin. J. of Biogeog. 2007, 34(8), 1400–1411. [Google Scholar] [CrossRef]
- Condé, T.M.; Higuchi, N.; Lima, A.J.N.; Campos, M.A.A.; Condé, J.D.; Oliveira, A.C.; Miranda, D.L.C. Spectral Patterns of Pixels and Objects of the Forest Phytophysiognomies in the Anauá National Forest, Roraima State, Brazil. Ecologies 2023, 4, 686–703. [Google Scholar] [CrossRef]
- ICMBio. Chico Mendes Institute of Biodiversity. PAN Portaria nº 457. Plano de Manejo da Floresta Nacional de Anauá. 2022. Available online: https://www.gov.br/icmbio/pt-br/assuntos/biodiversidade/unidade-de-conservacao/unidades-de-biomas/amazonia/lista-de-ucs/flona-de-anaua/arquivos/pm_flona_anaua_consolidado_vs-10.pdf (accessed on 27 September 2024).
- Barbosa, R.I.; Lima, C.G.B. Notas sobre a Diversidade de Plantas e fitofisionomias em Roraima através do Banco de Dados do Herbário Inpa. Amazônia: Ci. & Desenv. 2008, 4(7), 131-154.
- Alemán, L.A.B; Barbosa, R.I.; Fernández, I.M.; Carvalho, L.C.S; Barni, P.E.; Oliveira, R.L.C.; Vale Jr., J. F.; Maldonado, S.A.S.; Pérez, N.E.A. Edaphic Factors and Flooding Periodicity Determining Forest Types in a Topographic Gradient in the Northern Brazilian Amazonia. Int. J. of Plant & Soil Science. [CrossRef]
- Anderson, A.B. White-sand vegetation of Brazilian Amazonia. Biotropica 1981, 13(3), 199–210. [Google Scholar] [CrossRef]
- Davidson, E.A.; Araújo, A.C.; Artaxo, P.; Balch, J.K.; Brown, I.F.; Bustamante, M.M.C.; Coe, M.T.; DeFries, R.S.; Keller, M.; Longo, M.; and, *!!! REPLACE !!!*; et al. The Amazon basin in transition. Nature 2012, 411, 321–328. [Google Scholar] [CrossRef]
- IBGE. Brazilian Institute of Geography and Statistics. Manual Técnico da Vegetação Brasileira. Available online: https://biblioteca.ibge.gov.br/index.php/biblioteca-catalogo?view=detalhes&id=263011 (accessed on 1 March 2024).
- INCT. Herbário Virtual da Flora e dos Fungos. Available online: http://inct.florabrasil.net/ (accessed on 1 March 2021).
- TROPICOS. Missouri Botanical Garden. Available online: https://tropicos.org (accessed on 1 Oct 2025).
- REFLORA. Available online: http://reflora.jbrj.gov.br/ (accessed on 1 Oct 2025).
- FLORA BRASILIENSIS. Centro de Referência em Informação Ambiental. Available online: https://florabrasiliensis.cria.org.br/opus (accessed on 1 Oct 2025).
- APG III. An update of the Angiosperm Phylogeny Group classification for the orders and families of flowering plants: APG III. Bot. J. of the Linnean Soc. [CrossRef]
- APG, IV. An update of the Angiosperm Phylogeny Group classification for the orders and families of flowering plants: APG IV. Bot. J. of the Linnean Soc. [CrossRef]
- Zar, J.H. Biostatistical Analysis, 5nd ed. Prentice Hall: New Jersey, EUA, 2010, ISBN 978-0-13-100846-5.
- ter Steege, H.; Pitman, N.C.A.; Sabatier, D.; Baraloto, C.; Salomão, R.P.; Guevara, J.E.; Oliver, L. Phillips, Castilho, C.V.; Magnusson, W.E.; Molinoet, J.F; and et al. Hyperdominance in the Amazonian Tree Flora. Science 2013, 342. [Google Scholar] [CrossRef]
- R Development Core Team. R: A Language and Environment for Statistical Computing. Available online: http://www.R-project.org (accessed on 1 July 2024).
- Müller-Dombois, D.; Ellemberg, H. Aims and methods for vegetation ecology, John Wiley & Sons: New York, EUA, 1974, ISBN 9781930665736.
- SISBIO. Autorização de Pesquisa nas Unidades de Conservação Federal (UC´s). Available online: https://www.gov.br/icmbio/pt-br/servicos/servicos-do-icmbio-no-gov.br/autorizacoes/pesquisa-nas-ucs-sisbio (accessed on 1 July 2017).
- Silva, R.P. Alometria, estoque e dinâmica da biomassa de florestas primárias e secundárias na região de Manaus (AM). Ph.D. Thesis, Instituto Nacional de Pesquisas da Amazônia/Universidade Federal do Amazonas, Manaus, AM, Brazil, 2007. [Google Scholar]
- Woortmann, C.P.I.B. Equações Alométricas, Estoque de Biomassa e Teores de Carbono e Nitrogênio de Campinaranas da Amazônia Central. Master’s Thesis, Instituto Nacional de Pesquisas da Amazônia, Manaus, AM, Brazil, 2010. [Google Scholar]
- Lima, A.J.N.; Suwa, R.; Ribeiro, G.H.P.M.; Kajimoto, T.; Santos, J.; Silva, R.P.; Souza, C.; Barros, A.S.; Noguchi, P.C., H. , Ishizuka, M., Higuchi, N. Allometric models for estimating above- and below-ground biomass in Amazonian forests at São Gabriel da Cachoeira in the upper Rio Negro, Brazil. For. Ecol. Manag. 2012, 277, 163–172. [Google Scholar] [CrossRef]
- Chambers, J.Q.; Artaxo, P. Biosphere-atmosphere interactions: Deforestation size influences rainfall. Nat. Clim. Chang. 2017, 7, 175–176. [Google Scholar] [CrossRef]
- Artaxo, P.; Gatti, L.V.; Leal, A.M.C.; Longo, K.M.; Freitas, S.R.; Lara, L.L.; Pauliquevis, T.M.; Procópio, A.S.; Rizzo, L.V. Química atmosférica na Amazônia: A floresta e as emissões de queimadas controlando a composição da atmosfera amazônica. Acta Amazonica 2005, 35(2), 185–196. [Google Scholar] [CrossRef]
- Fearnside, P.M.; Barbosa, R.I.; Pereira, V.B. Emissões de gases do efeito estufa por desmatamento e incêndios florestais em Roraima: fontes e sumidouros. Revista Agro@mbiente On-line. [CrossRef]
- BRASIL. Presidência da República. Lei nº 12.651, de 25 de maio de 2012. Available online: http://www.planalto.gov.br/ccivil_03/_Ato2011–2014/2012/Lei/L12651.htm (accessed on 07 February 2015).
- CONAMA. Conselho Nacional do Meio Ambiente. Resolução nº 406, de 02 de fevereiro de 2009. Available online: https://conama.mma.gov.br/?option=com_sisconama&task=arquivo.download&id=578 (accessed on 07 February 2025).
- BRASIL. Presidência da República. Lei nº 9.985, de 18 de julho de 2000. Available online: https://www.planalto.gov.br/ccivil_03/LEIS/L9985.htm (accessed on 07 February 2015).
- Fearnside, P.M. A floresta Amazônica nas mudanças globais, INPA: Manaus, Brasil, 2003.
- Barreto, P.; Souza Jr., C.; Noguerón, R.; Anderson, A.; Salomão, R. Pressão humana na floresta amazônica brasileira. Imazon: Belém, Brasil, 2005.
- ICMBio. Chico Mendes Institute of Biodiversity. Portaria nº 457. Plano de Manejo da Floresta Nacional de Anauá. 2022. Available online: https://www.gov.br/icmbio/pt-br/assuntos/biodiversidade/unidade-de-conservacao/unidades-de-biomas/amazonia/lista-de-ucs/flona-de-anaua/arquivos/pm_flona_anaua_consolidado_vs-10.pdf (accessed on 27 September 2023).
- Adeney, J.M.; Christensen, N.L.; Vicentini, A.; Cohn-Haft, M. White-sand Ecosystems in Amazonia. Biotropica 2016, 48, 7–23. [Google Scholar] [CrossRef]
- Crivelli, B.R.S.; Gomes, J.P.; Morais, W.W.C.; Condé, T.M.; Santos, R.L.; Bonfim Filho, O.S. Caracterização do setor madeireiro de Rorainópolis, sul de Roraima. Ciência da Madeira. [CrossRef]
- BRASIL. Presidência da República. Lei nº 14.119, de 13 de janeiro de 2021. Available online: https://www.planalto.gov.br/ccivil_03/_Ato2019-2022/2021/Lei/L14119.htm (accessed on 07 February 2023).
- Putz, F.E.; Sist, P.; Fredericksen, T.; Dykstra, D. Reduced-impact logging: challenges and opportunities. For. Ecol. Manag. 2008, 256, 1427–1433. [Google Scholar] [CrossRef]
- Pereira, R.; Zweede, J.; Asner, G.P.; Keller, M. Forest canopy damage and recovery in reduced-impact and conventional selective logging in eastern Para, Brazil. For. Ecol. Manag. 2002, 168, 77–89. [Google Scholar] [CrossRef]
- Figueiredo, E.O.; Braz, E.M.; Oiveira, M.V.N. Manejo de Precisão em Florestas Tropicais: Modelo Digital de Exploração Florestal. Embrapa Acre/Embrapa Florestas: Rio Branco, Brasil, 2007.
- Amaral, P.; Veríssimo, A.; Barreto, P.; Vidal, E. Floresta para Sempre: um Manual para Produção de Madeira na Amazônia, 1ed., Imazon: Belém, Brazil, 1998.
- Braz, E.M. Subsídios para o planejamento do manejo de florestas tropicais da Amazônia. Tese de Doutorado, Universidade Federal de Santa Maria, Curitiba, Paraná, 2010.
- FSC. Forest Stewardship Council. Forest Management Certification. FSC Document reference code: FSC-STD-01–001 V5–2 EN. Bonn, Germany, 2015.
- REDD. Redução de Emissões por Desmatamento e Degradação Florestal. REDD no Brasil: um enfoque amazônico - Fundamentos, critérios e estruturas institucionais para um regime nacional de Redução de Emissões por Desmatamento e Degradação Florestal - Edição revista e atualizada. Centro de Gestão e Estudos Estratégicos/Instituto de Pesquisa Ambiental da Amazônia/Secretaria de Assuntos Estratégicos da Presidência da República, 2011.
- Fearnside, P.M. Quantificação do serviço ambiental do carbono nas florestas amazônicas brasileiras. Oecologia Brasiliensis 2008, 12(4), 743–756. [Google Scholar] [CrossRef]
- Higuchi, N. O papel da floresta amazônica como mitigadora dos efeitos da mudança climática global pretérita. Available online: https://florestal.revistaopinioes.com.br/pt-br/revista/detalhes/7-floresta-amazonica-r-mudancas-climaticas/ (accessed on 27 September 2023).
- Lapola, D.M.; Pinho, P.; Barlow, J.; Aragão, L.E.O.C.; Berenguer, E.; Carmenta, R.; Liddy, H.M.; Seixas, H.; Silva, C.V.J.; Silva-Junior, C.H.L.; and, *!!! REPLACE !!!*; et al. The drivers and impacts of Amazon forest degradation. Science 2023, 379, 1–11. [Google Scholar] [CrossRef]
- Gimenez, B.O.; Danielli, F.E.; Oliveira, C.K.A.; Santos, J.; Higuchi, N. Equações volumétricas para espécies comerciais madeireiras do sul do estado de Roraima. Scientia Forestalis 2015, 43(106), 291–301. [Google Scholar]
- Brancalion, P.H.S.; de Almeida, D.R.A.; Vidal, E.; Molin, P.G.V.; Sontag, E.; Souza, S.E.X.F.; Schulze, M.D. Fake legal logging in the Brazilian Amazon. Sci. Adv. 1192. [Google Scholar] [CrossRef]
- Rodrigues, M.I; Souza, A.N.; Joaquim, M.S.; Júnior, I.M.L.; Pereira, R.S. Concessão florestal na Amazônia brasileira. Ci. Fl. 2020, 30(4), 1299–1308. [Google Scholar] [CrossRef]
- PF. Polícia Federal. Operação Salmo 96:12 prende servidores federais. Available online: https://www.jusbrasil.com.br/noticias/mpf-rr-e-policia-federal-deflagram-operacao-de-combate-a-grilagem-e-desmatamento-ilegal/3128405?msockid=27ed666b8f7d60991be3704e8ecc61bb (accessed on 23 April 2025).
- PF. Polícia Federal. Operação Xilófagos combate o avanço do desmatamento na Amazônia Legal. Available online: https://www.ecoamazonia.org.br/2014/12/policia-federal-deflagra-operacao-coibir-desmatamento-ilegal-rr/ (accessed on 25 May 2025).
Figure 1.
Ranking of tree species abundance and stored forest carbon in the Anauá National Forest, southern Roraima, Brazil.
Figure 1.
Ranking of tree species abundance and stored forest carbon in the Anauá National Forest, southern Roraima, Brazil.
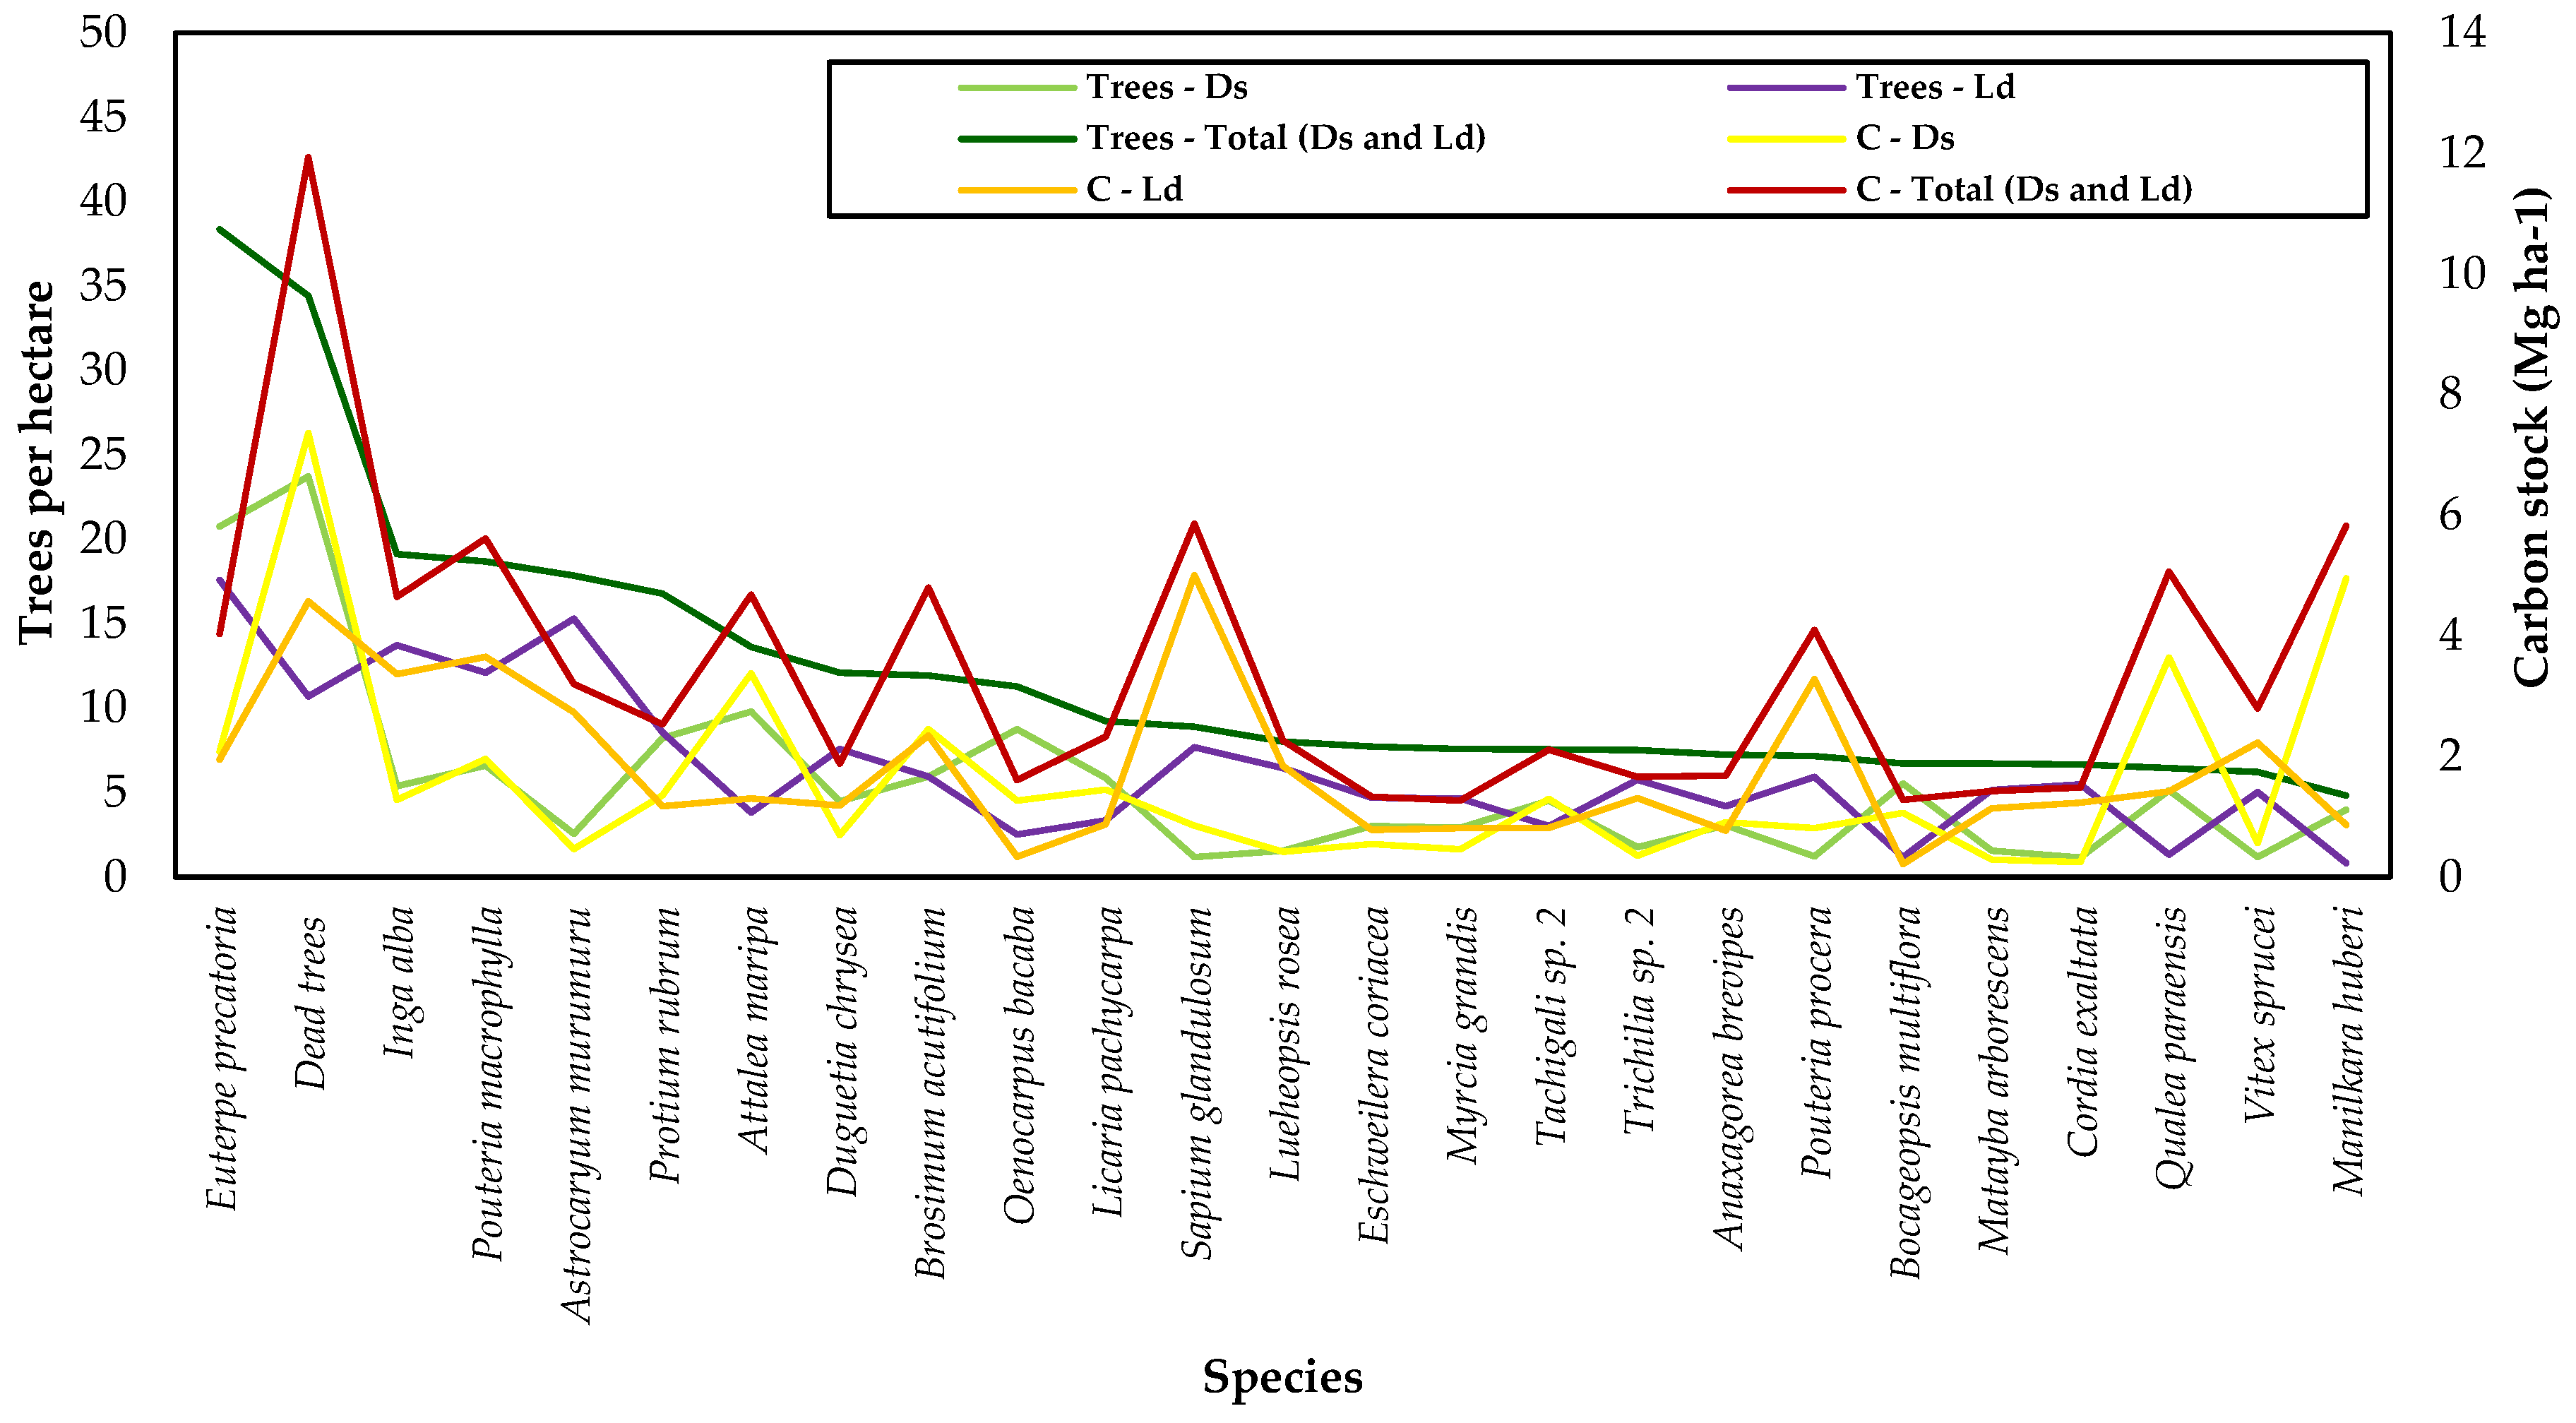
Figure 2.
Frequency of trees per hectare by vertical stratum in the phytophysiognomies of Dense Ombrophilous Forest (Ds) and Forested Campinarana (Ld) and Total (Ds and Ld) of the Anauá National Flona. Where: EI = lower stratum (TH < 12.6 m); EM = middle stratum (12.6 < TH < 19.1 m); ES = upper stratum (TH > 19.1 m); x = 15.9 m; σ = 3.3 m.
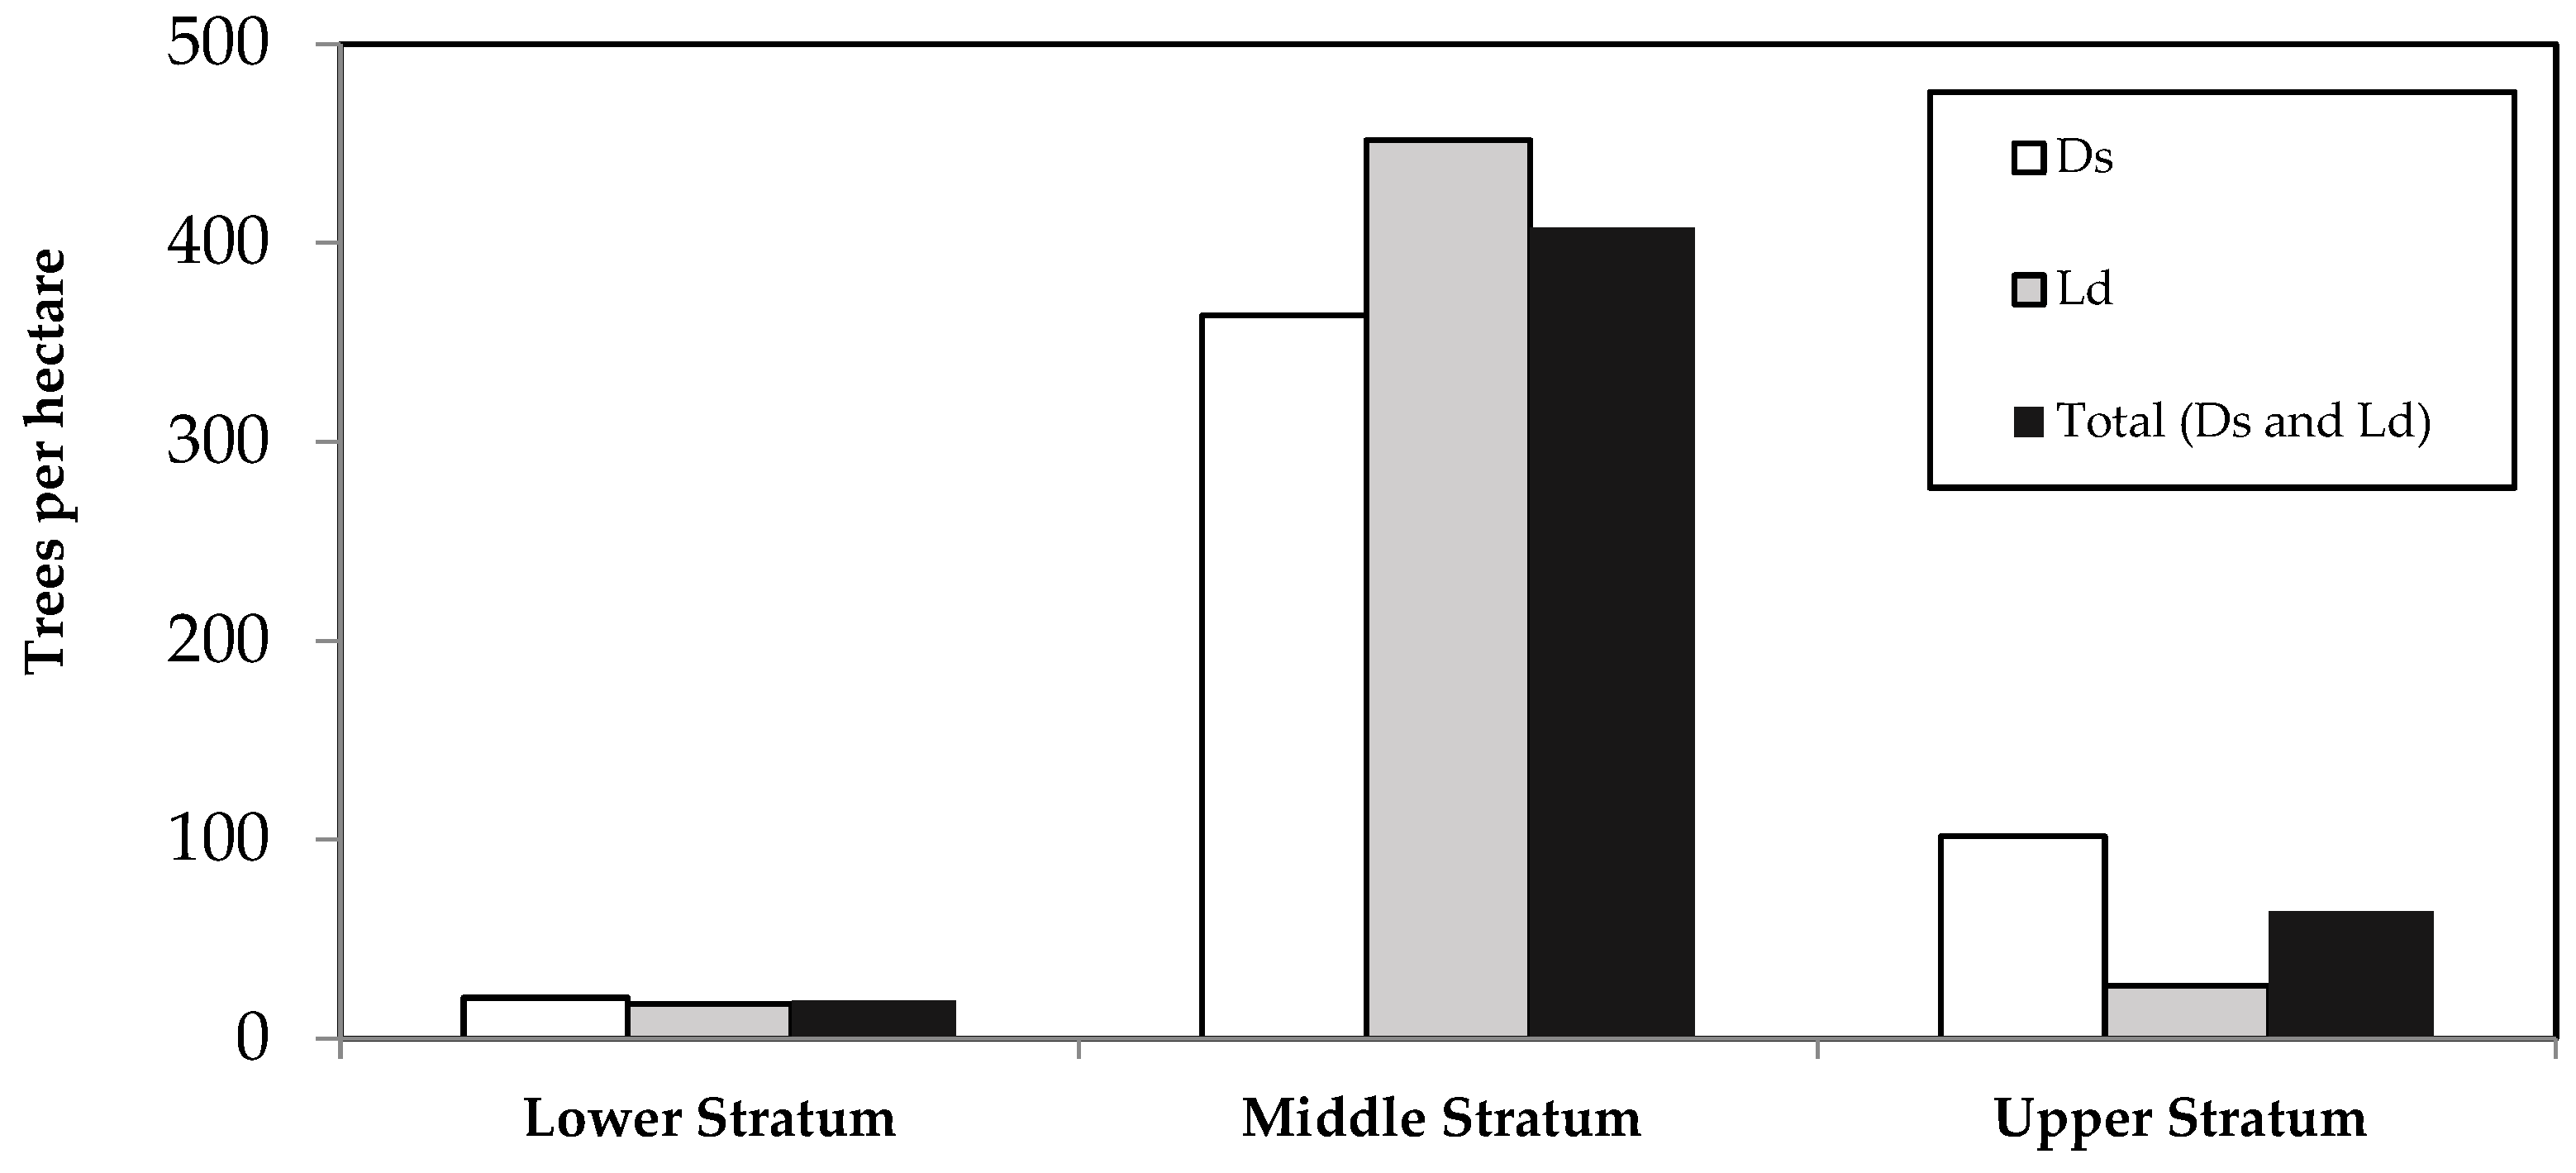
Figure 3.
Evaluation of the internal or phytosanitary structure of trees with DBH > 10 cm per hectare in the Anauá National Forest, in southern Roraima, Brazil. Where: C = fallen live tree; D = live tree damaged by natural causes; MC = dead tree fallen due to natural causes; ME = tree killed by illegal selective logging; MP = standing dead tree due to natural causes; MQ = dead tree burned by forest fire; N = normal live tree; Q = live tree partially burned by forest fire; SC = live tree without crown; T = crooked live tree.
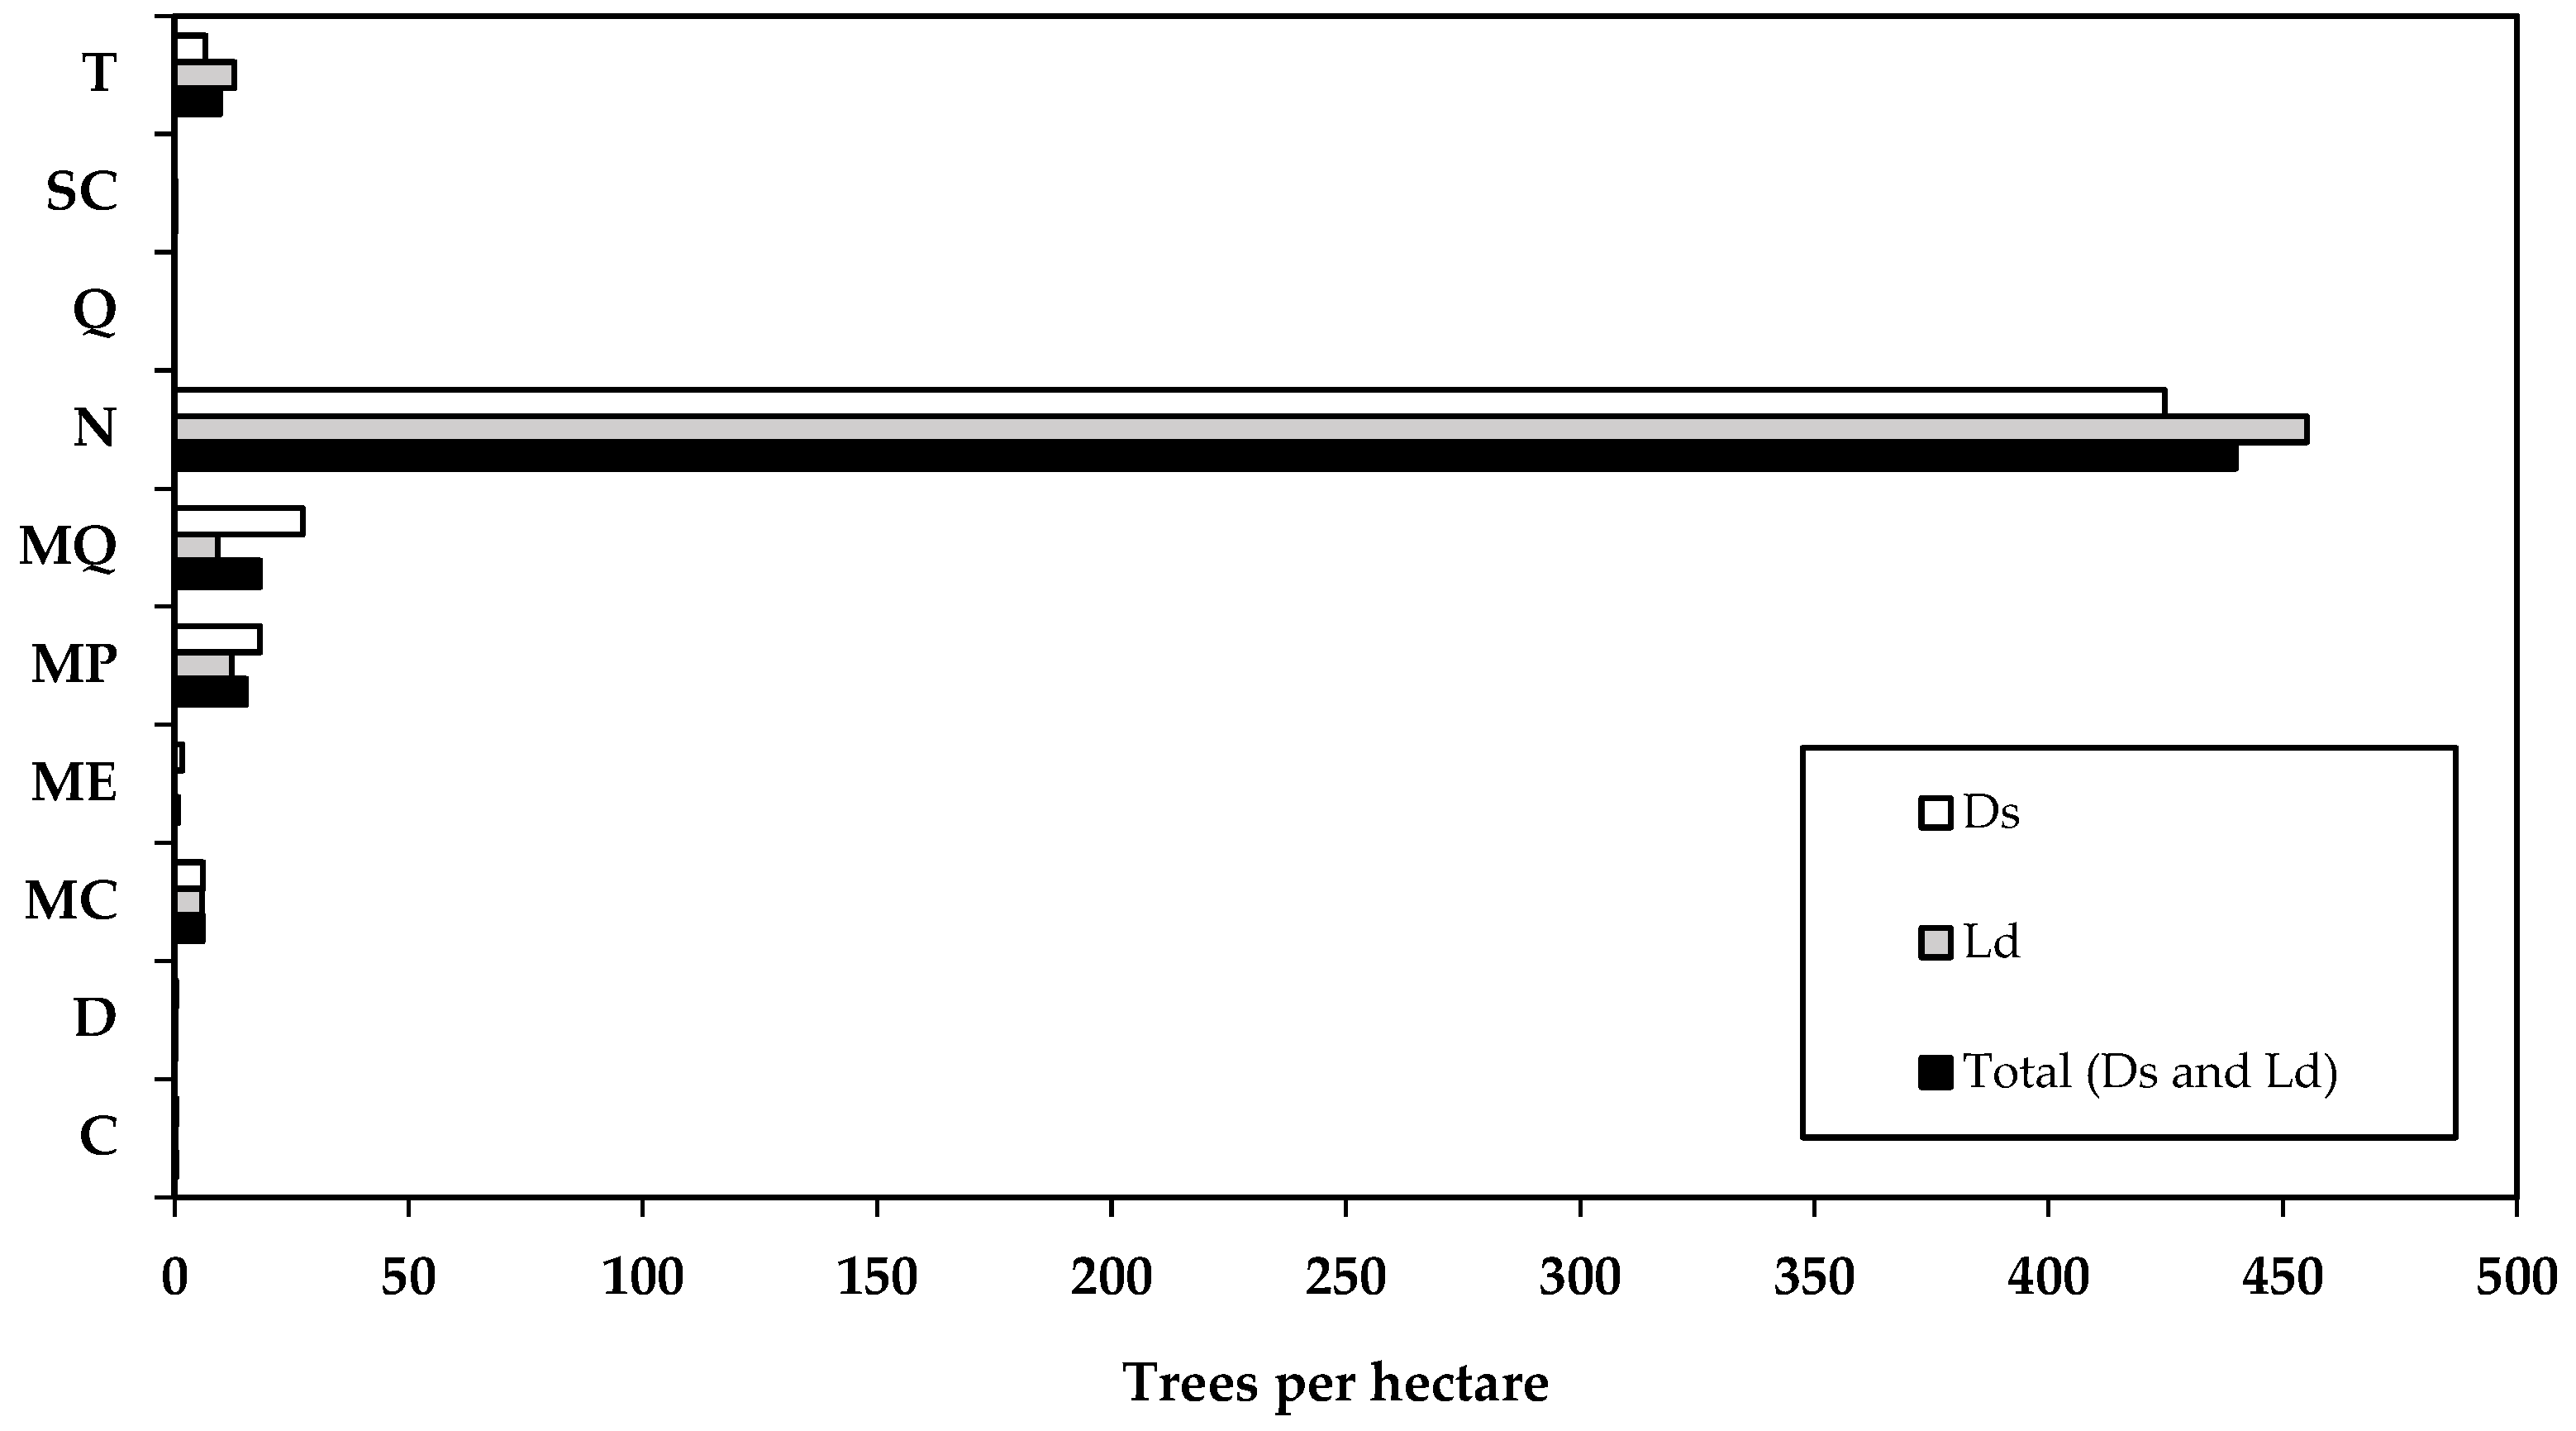
Figure 4.
Frequency of trees by diameter, total height and forest typology of the Anauá National Forest, in southern Roraima, Brazil.
Figure 4.
Frequency of trees by diameter, total height and forest typology of the Anauá National Forest, in southern Roraima, Brazil.
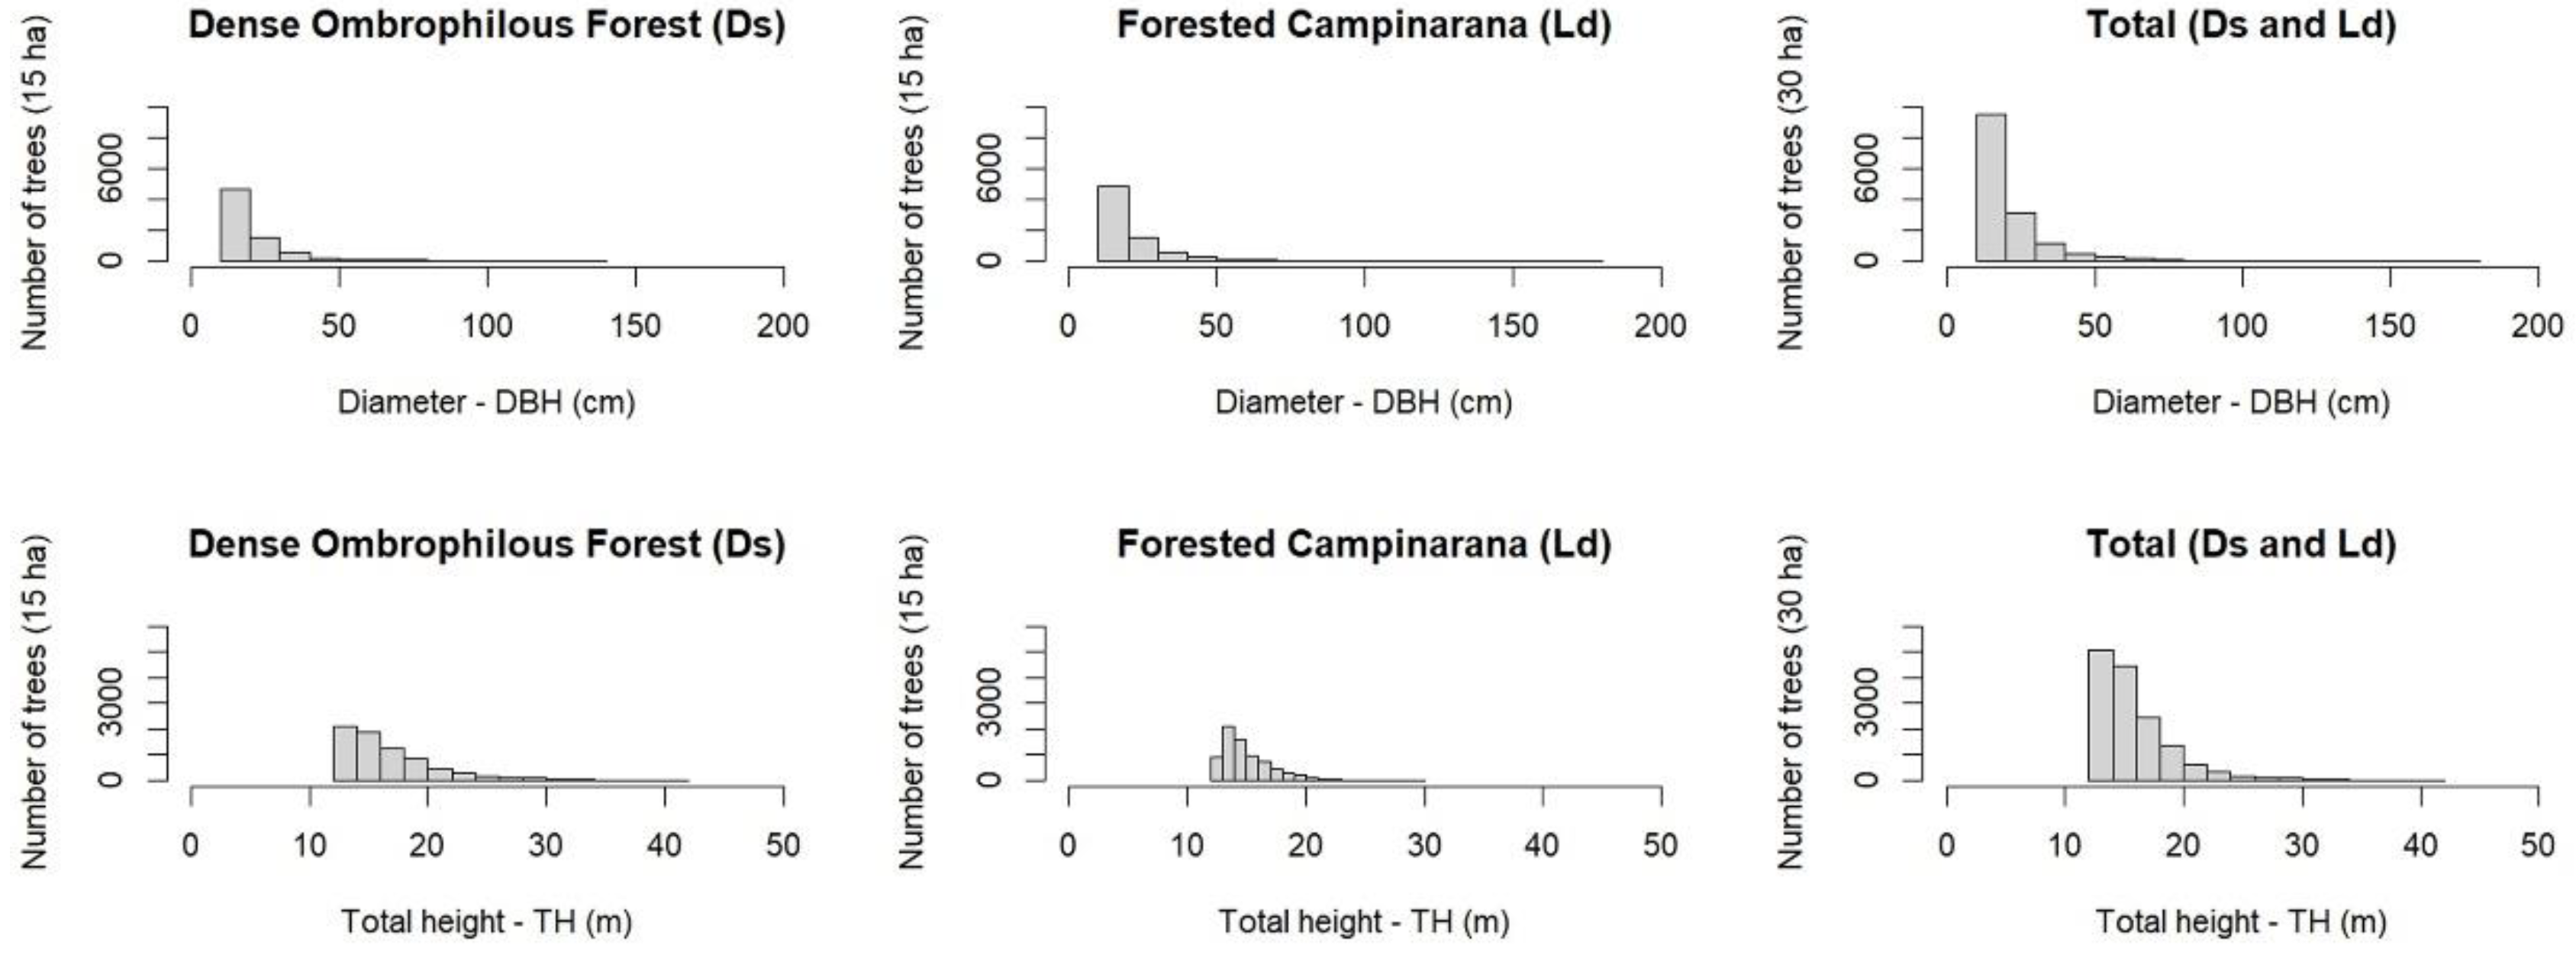
Figure 5.
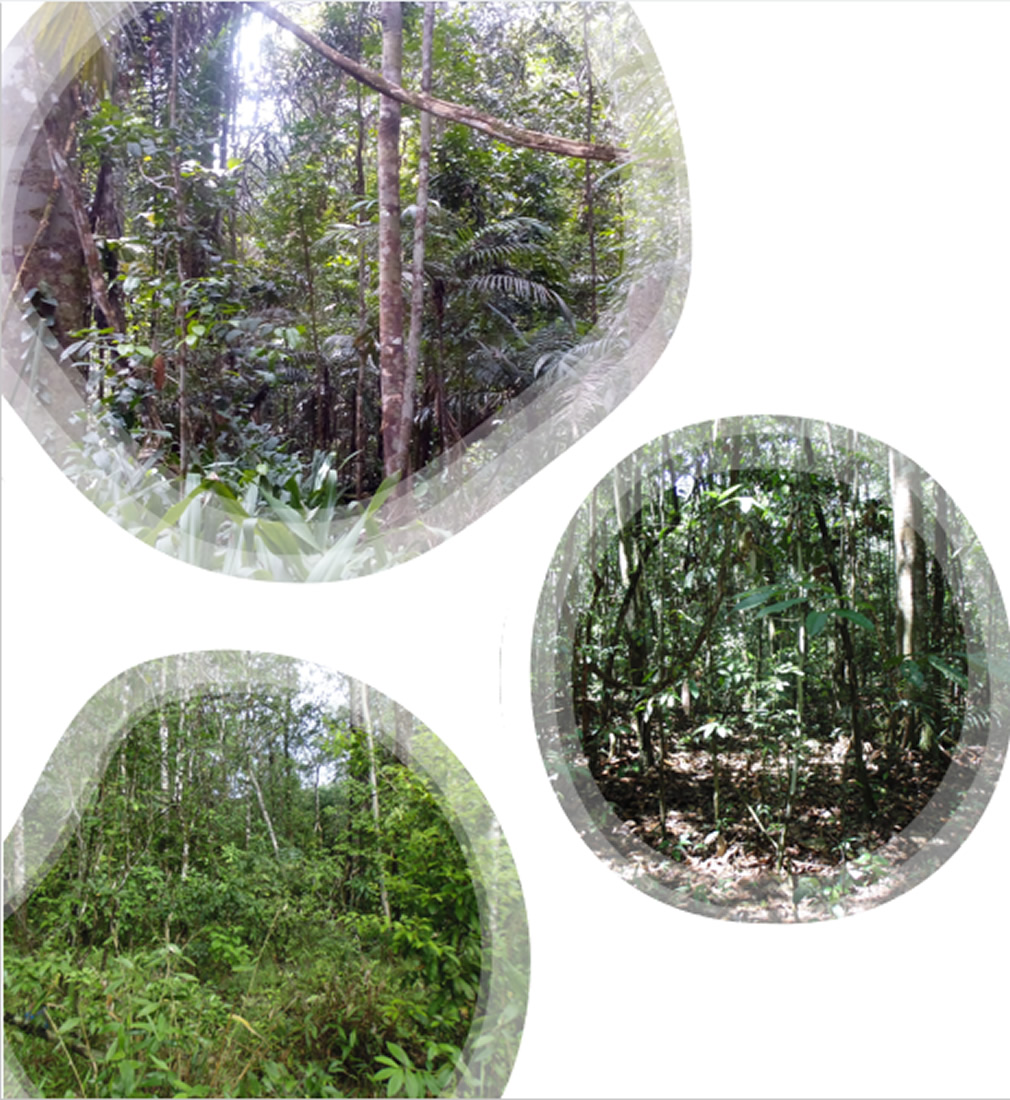
Forest physiognomies and average forest carbon stock per hectare in the Anauá National Forest, southern Roraima, Brazil. Where: Area mapped by supervised pixel-by-pixel classification (Maximum Likelihood) in the R(5), G(4), B(3) composition of the OLI remote sensor of the Landsat-8 platform; Photo 1 = Forested Campinararana (Ld); Photo 2 = ecological transition ecosystem (Ecotone) between Ds and Ld (LOt); Photo 3 = Dense Ombrophilous Forest (Ds).
Figure 5.
Forest physiognomies and average forest carbon stock per hectare in the Anauá National Forest, southern Roraima, Brazil. Where: Area mapped by supervised pixel-by-pixel classification (Maximum Likelihood) in the R(5), G(4), B(3) composition of the OLI remote sensor of the Landsat-8 platform; Photo 1 = Forested Campinararana (Ld); Photo 2 = ecological transition ecosystem (Ecotone) between Ds and Ld (LOt); Photo 3 = Dense Ombrophilous Forest (Ds).
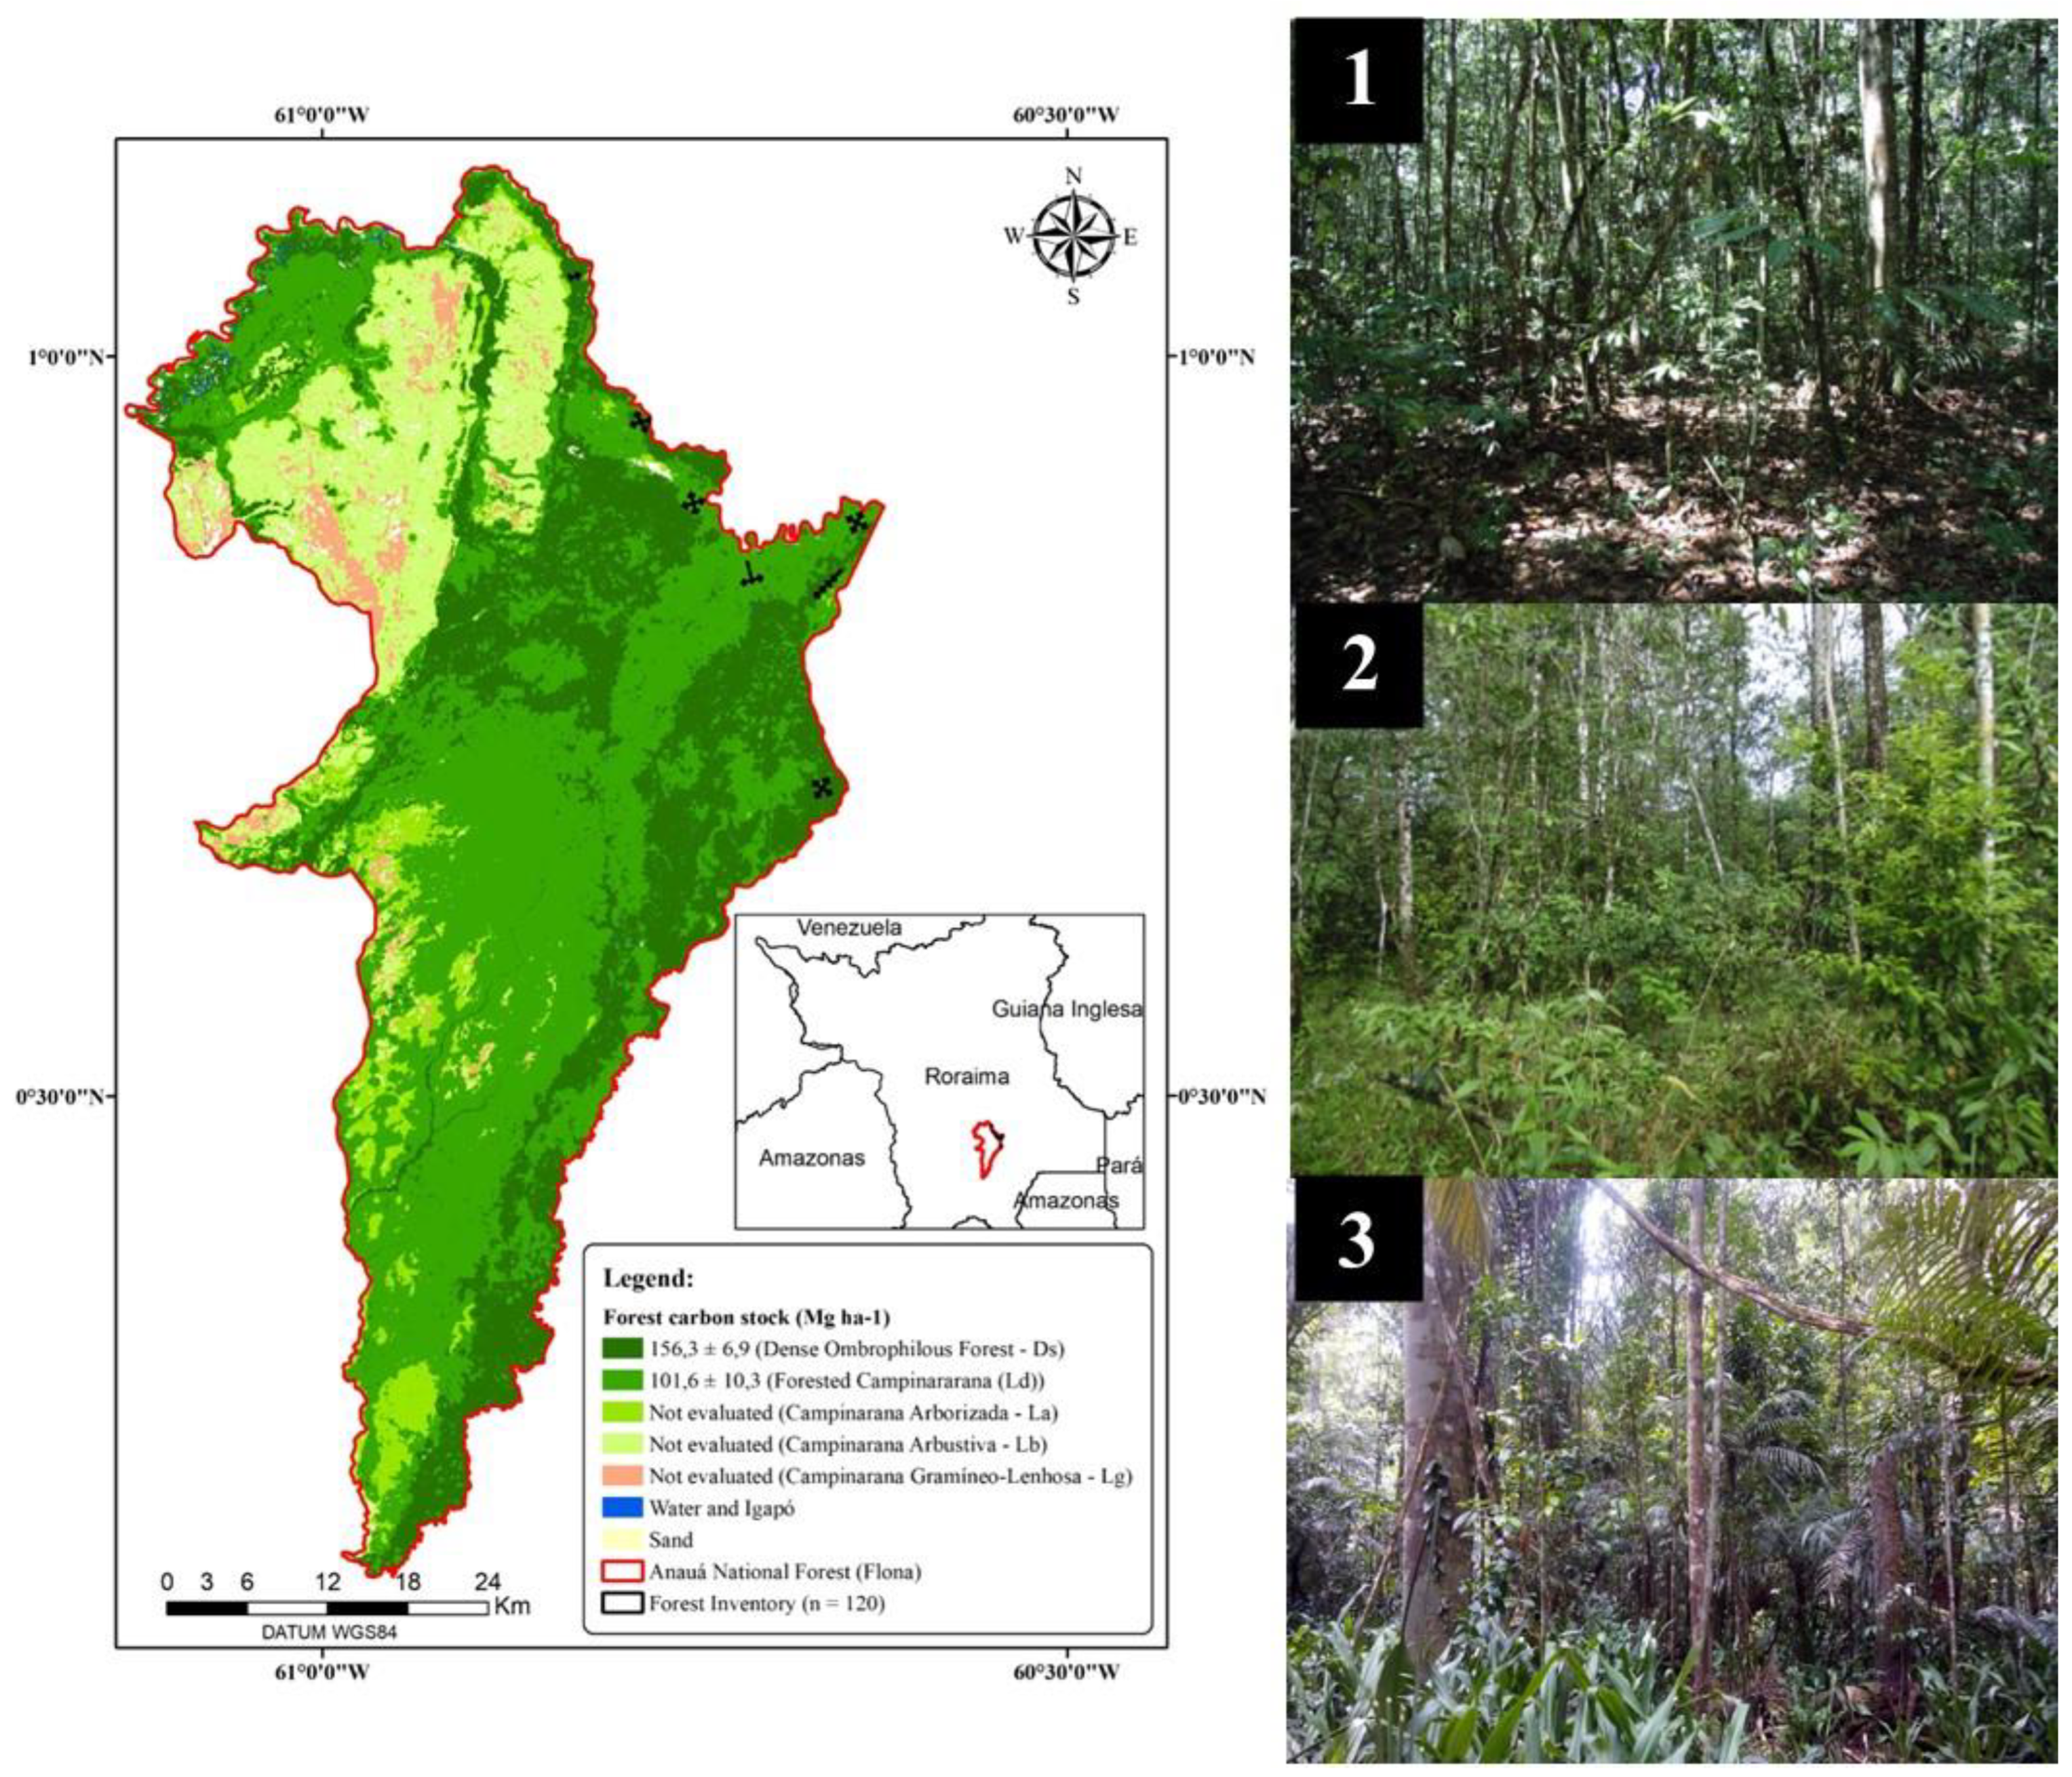
Figure 6.
In situ evidence of anthropogenic activities related to deforestation, forest degradation, and forest fires within and around the Anauá National Forest, in southern Roraima, Brazil. Where: 1) Pollution of nature by petroleum derivatives used in chainsaws for illegal selective logging at the entrance to the Anauá National Forest; 2) Scars from forest fires in Campinarana Gramíneo-Lenhosa (Lg) environments surrounding the Anauá National Forest; 3) Mortality of wildlife due to forest fires in January 2017; 4) Forest degradation and forced burying of the Jaburu River for the implementation of an illegal timber haulage branch within the Anauá National Forest; 5) Truck carrying illegally extracted timber from within the Anauá National Forest by "middlemen" to a sawmill; 6) Haulage branch built within the National Forest to exploit illegal timber with a high level of forest degradation; 7) Image from the Landsat 8 remote sensing system (OLI) showing smoke at two main points in rural areas of Rorainópolis-RR and Caracaraí-RR, associated with more than 500 fire outbreaks monitored by INPE (http://www.inpe.br/queimadas) during the period from January to February 2017; 8) Illegal timber storage yard inside the Anauá National Forest; 9) Severe forest degradation associated with selective illegal logging and forest fires within the Anauá National Forest, causing significant soil exposure.
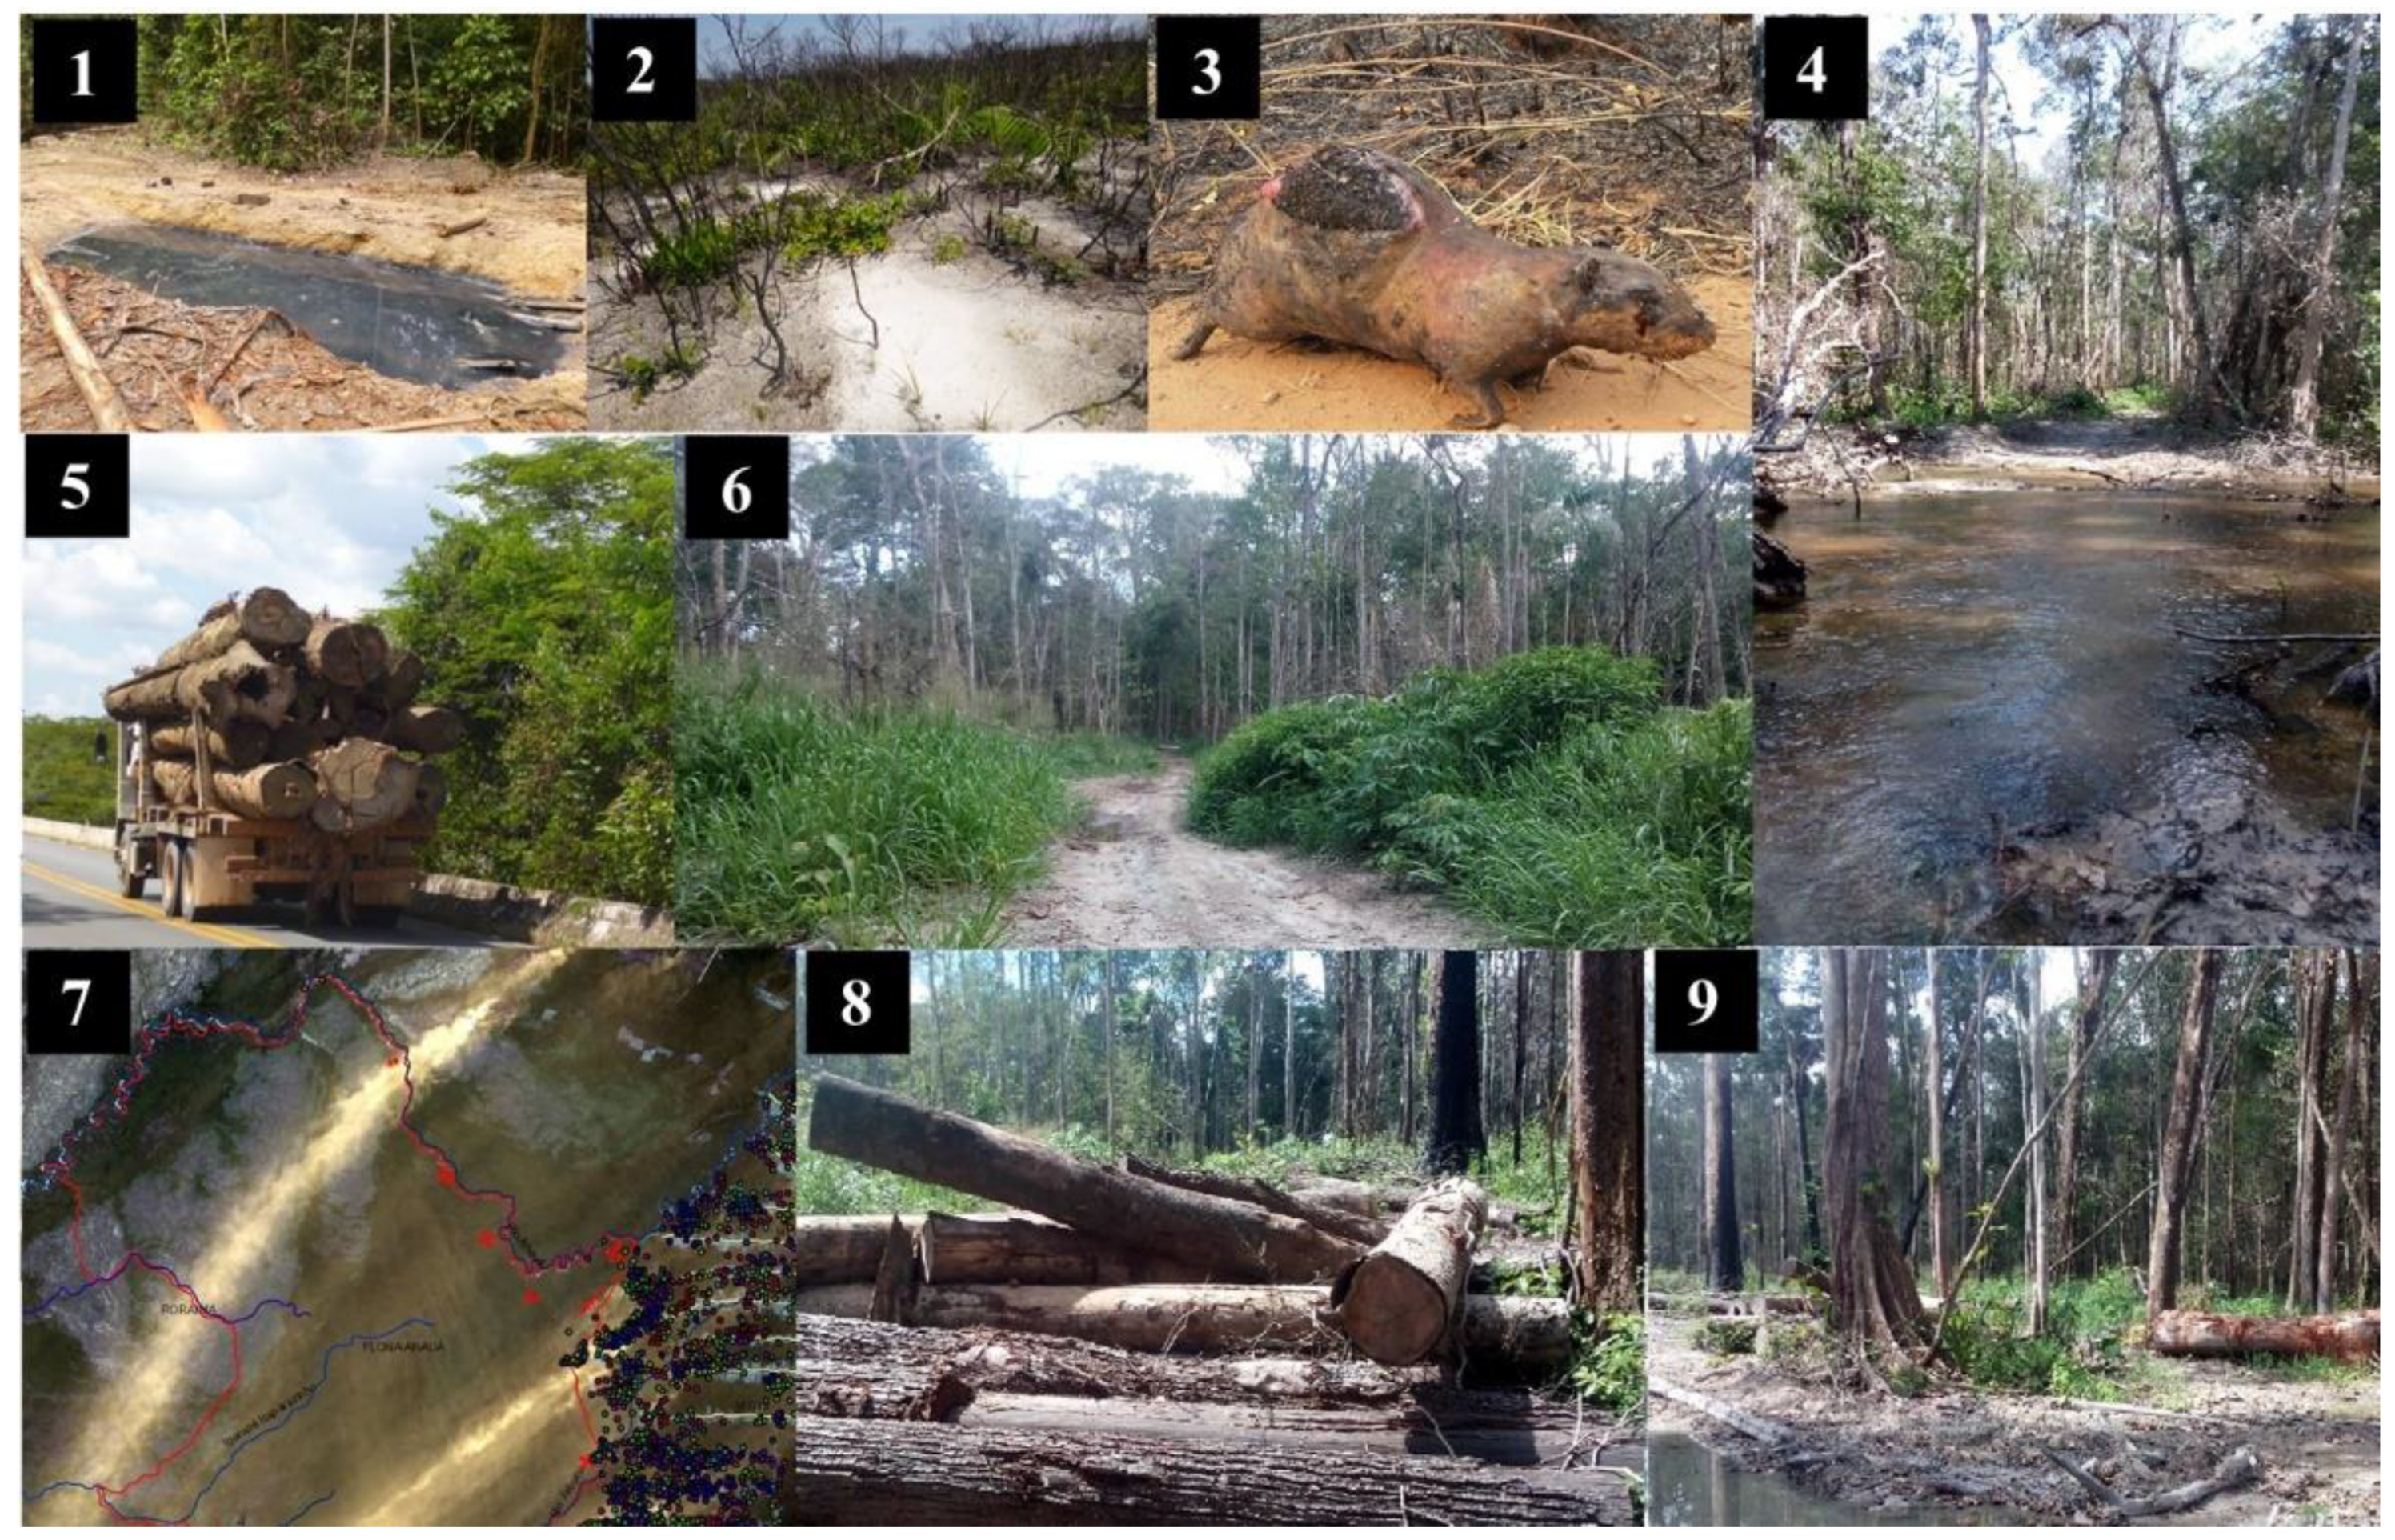
Figure 7.
Use of reflectance images in the visible (Red and Green) and near-infrared (NIR) range from the Landsat 8 satellite for the detection of changes in land use and land cover caused by deforestation, forest degradation and forest fires in the period from 2015 to 2017 within and around the Anauá National Forest, in southern Roraima, Brazil. Where: 1) Vegetation in red using the near-infrared (NIR) band; 2) Changes in vegetation due to anthropogenic actions are shown in light blue tones, characterizing deforestation, forest degradation and forest fires; NOTE: more details [7].
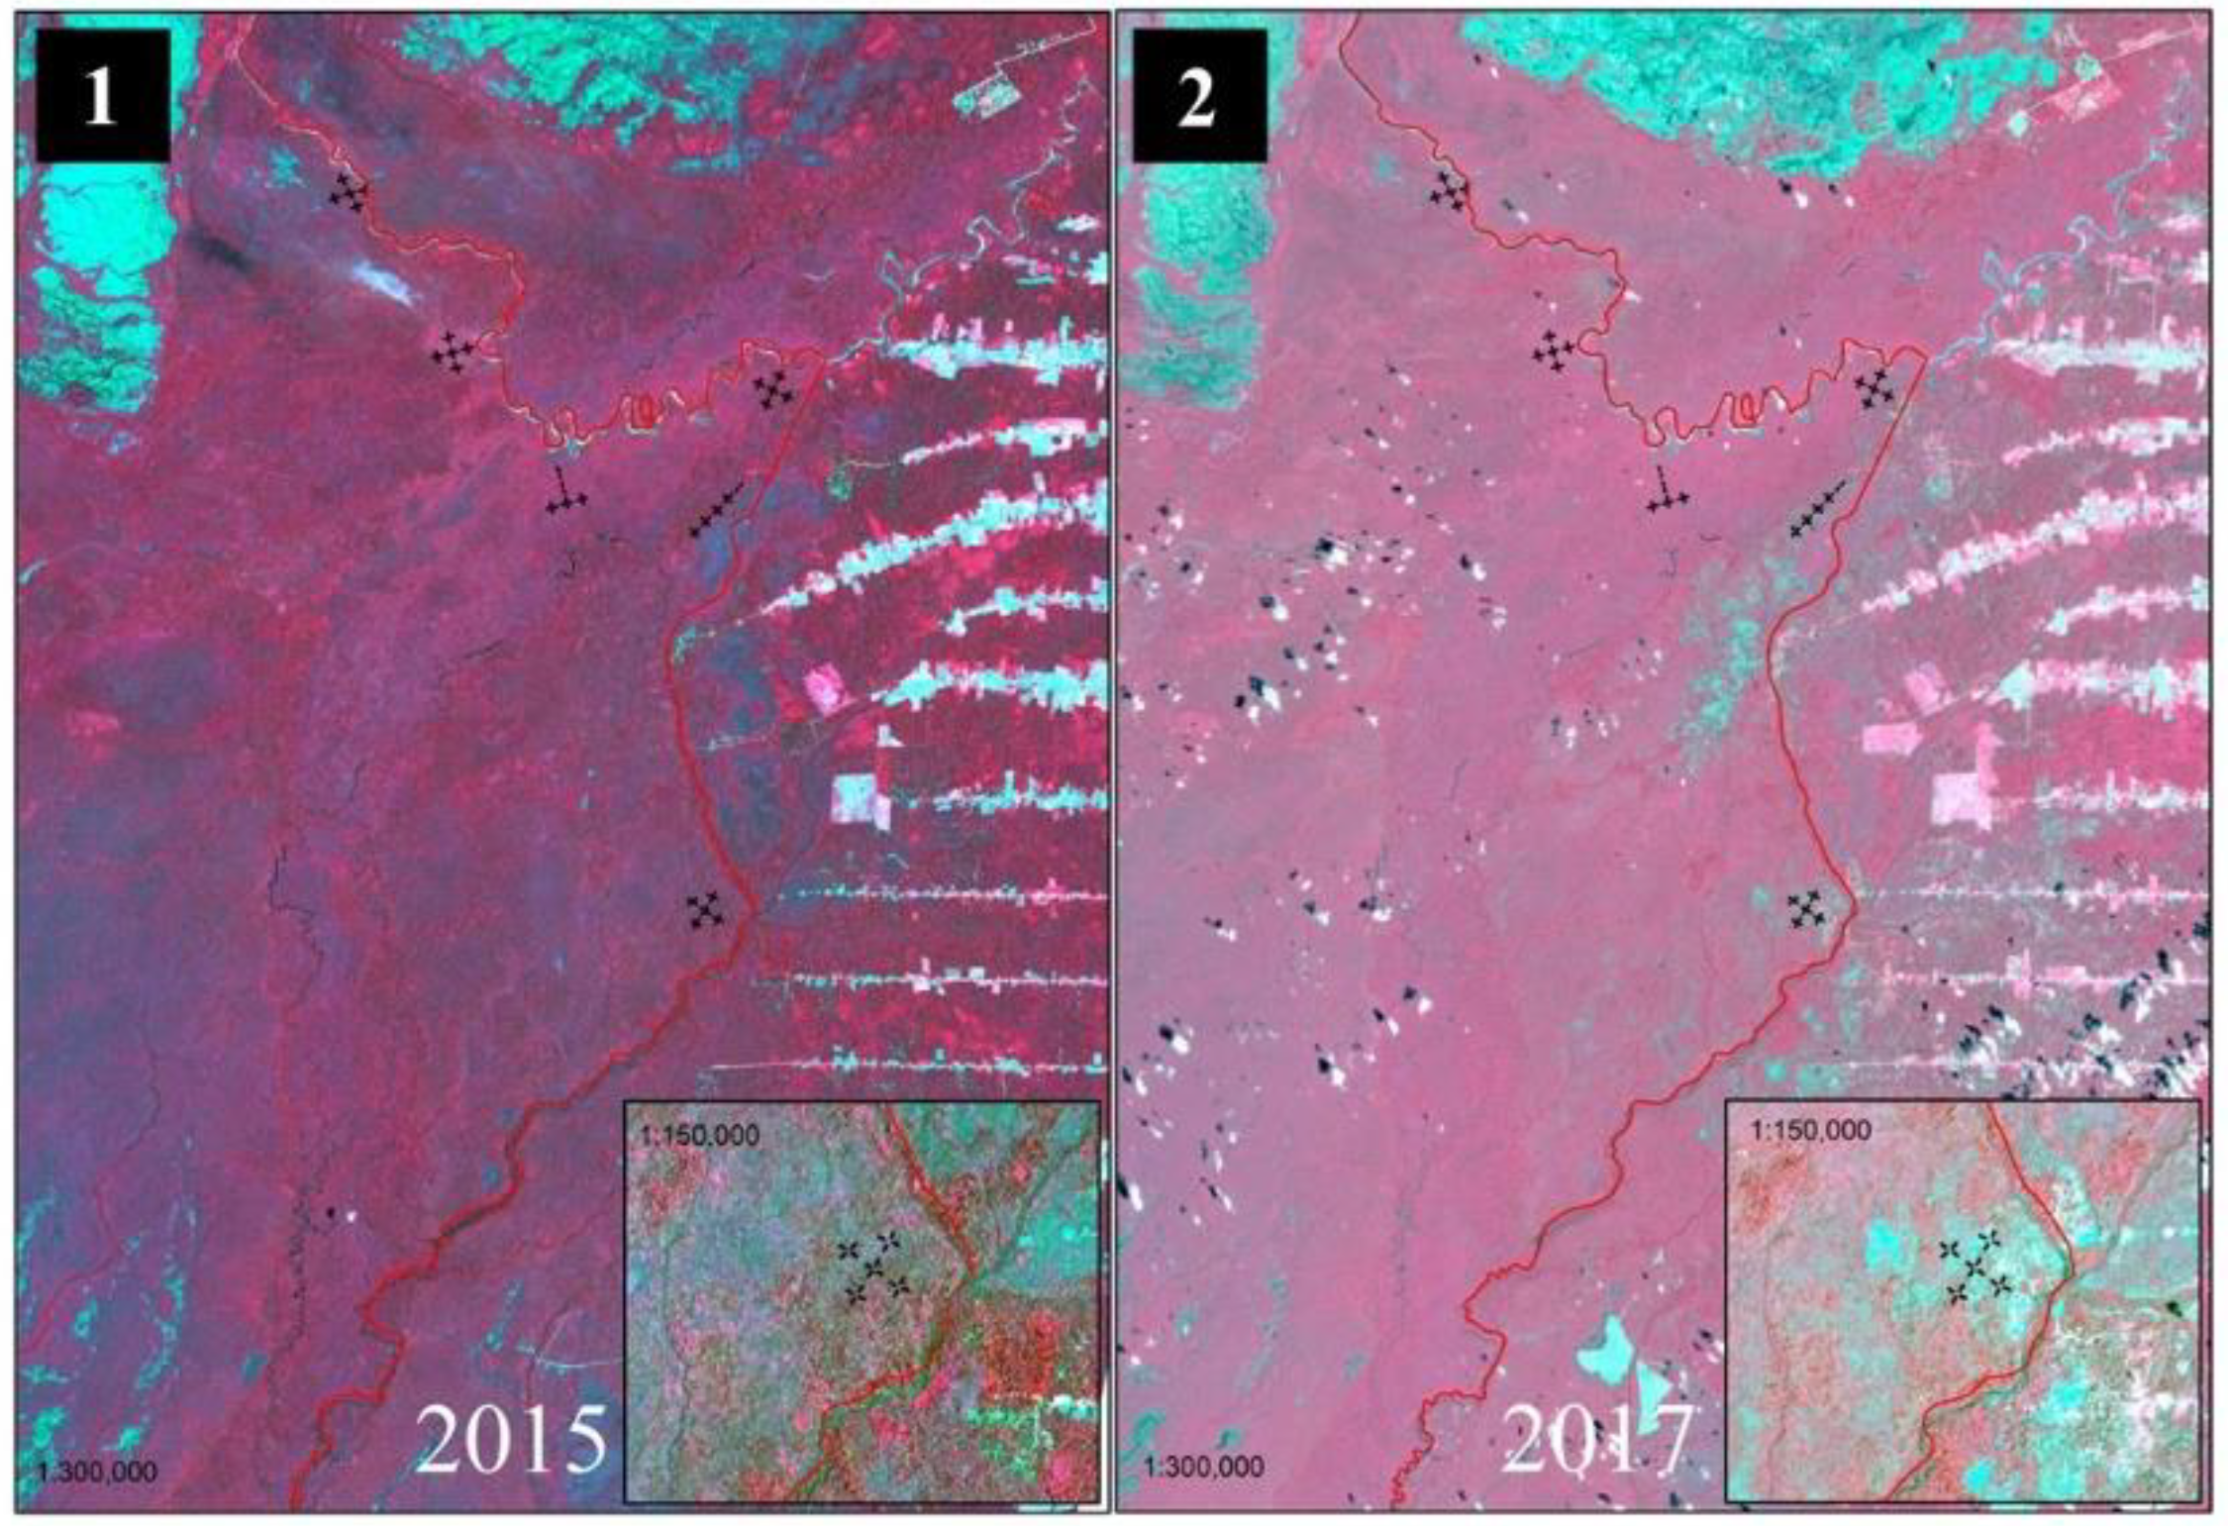

Table 1.
Floristic composition, taxonomy and forest structure of the Anauá National Forest, in southern Roraima, Brazil.
Table 1.
Floristic composition, taxonomy and forest structure of the Anauá National Forest, in southern Roraima, Brazil.
| Scientific Name | Treesi | D | DBH | TH | BA | V | Biomass | Carbon | ||||||||
|---|---|---|---|---|---|---|---|---|---|---|---|---|---|---|---|---|
| AGB | BGB | B | AGC | BGC | C | |||||||||||
| Anacardiaceae | ||||||||||||||||
| Anacardium giganteum W. Hancock ex Engl. | 16 | 0.53 | 32.0 | ± | 24.3 | 19.0 | ± | 6.7 | 0.066 | 0.612 | 0.8699 | 0.1790 | 0.8914 | 0.4176 | 0.0859 | 0.4279 |
| Anacardium parvifolium Ducke | 1 | 0.03 | 27.5 | - | - | 19.5 | - | - | 0.002 | 0.015 | 0.0277 | 0.0037 | 0.0292 | 0.0133 | 0.0018 | 0.0140 |
| Anacardium sp. | 1 | 0.03 | 40.3 | - | - | 23.2 | - | - | 0.004 | 0.036 | 0.0575 | 0.0094 | 0.0597 | 0.0276 | 0.0045 | 0.0286 |
| Astronium lecointei Ducke | 2 | 0.07 | 16.3 | ± | 5.3 | 15.3 | ± | 2.3 | 0.001 | 0.010 | 0.0212 | 0.0022 | 0.0227 | 0.0102 | 0.0010 | 0.0109 |
| Spondias sp. | 57 | 1.90 | 40.2 | ± | 13.2 | 19.7 | ± | 2.9 | 0.266 | 2.333 | 3.5666 | 0.6326 | 3.6839 | 1.7120 | 0.3036 | 1.7683 |
| Tapirira guianensis Aubl. | 18 | 0.60 | 28.1 | ± | 13.4 | 17.1 | ± | 2.8 | 0.045 | 0.379 | 0.6175 | 0.0976 | 0.6434 | 0.2964 | 0.0468 | 0.3088 |
| Anisophylleaceae | ||||||||||||||||
| Anisophyllea guianensis Sandwith | 4 | 0.13 | 15.3 | ± | 3.5 | 14.9 | ± | 1.6 | 0.003 | 0.018 | 0.0373 | 0.0037 | 0.0401 | 0.0179 | 0.0018 | 0.0192 |
| Anisophyllea manausensis Pires & W.A.Rodrigues | 1 | 0.03 | 18.9 | - | - | 15.0 | - | - | 0.001 | 0.007 | 0.0135 | 0.0014 | 0.0144 | 0.0065 | 0.0007 | 0.0069 |
| Annonaceae | ||||||||||||||||
| Anaxagorea brevipes Benth. | 218 | 7.27 | 18.2 | ± | 9.2 | 15.2 | ± | 2.8 | 0.237 | 1.846 | 3.3266 | 0.4430 | 3.5138 | 1.5968 | 0.2126 | 1.6866 |
| Annona ambotay Aubl. | 2 | 0.07 | 13.3 | ± | 2.5 | 14.0 | ± | 1.2 | 0.001 | 0.006 | 0.0139 | 0.0012 | 0.0150 | 0.0067 | 0.0006 | 0.0072 |
| Annona neoinsignis H. Rainer | 2 | 0.07 | 17.6 | ± | 7.7 | 15.6 | ± | 3.4 | 0.002 | 0.013 | 0.0254 | 0.0028 | 0.0271 | 0.0122 | 0.0014 | 0.0130 |
| Annona sp. 1 | 19 | 0.63 | 16.3 | ± | 5.8 | 15.1 | ± | 2.4 | 0.015 | 0.107 | 0.2130 | 0.0233 | 0.2274 | 0.1022 | 0.0112 | 0.1092 |
| Annona sp. 2 | 1 | 0.03 | 10.3 | - | - | 12.5 | - | - | 0.000 | 0.002 | 0.0043 | 0.0003 | 0.0047 | 0.0020 | 0.0002 | 0.0022 |
| Bocageopsis multiflora (Mart.) R.E.Fr. | 202 | 6.73 | 17.6 | ± | 4.5 | 15.6 | ± | 1.8 | 0.174 | 1.258 | 2.5017 | 0.2723 | 2.6715 | 1.2008 | 0.1307 | 1.2823 |
| Duguetia chrysea Maas | 363 | 12.10 | 15.7 | ± | 4.5 | 14.4 | ± | 1.5 | 0.252 | 1.796 | 3.6661 | 0.3806 | 3.9285 | 1.7598 | 0.1827 | 1.8857 |
| Duguetia trunciflora Maas & A.H.Gentry | 3 | 0.10 | 15.4 | ± | 1.6 | 14.7 | ± | 0.9 | 0.002 | 0.013 | 0.0276 | 0.0027 | 0.0298 | 0.0133 | 0.0013 | 0.0143 |
| Guatteria scytophylla Diels | 55 | 1.83 | 19.9 | ± | 9.1 | 15.3 | ± | 2.4 | 0.069 | 0.537 | 0.9675 | 0.1277 | 1.0212 | 0.4644 | 0.0613 | 0.4902 |
| Guatteria sp. | 3 | 0.10 | 18.4 | ± | 6.0 | 15.5 | ± | 2.7 | 0.003 | 0.021 | 0.0408 | 0.0046 | 0.0435 | 0.0196 | 0.0022 | 0.0209 |
| Onychopetalum amazonicum R.E. Fr. | 1 | 0.03 | 17.3 | - | - | 15.8 | - | - | 0.001 | 0.006 | 0.0114 | 0.0012 | 0.0122 | 0.0055 | 0.0006 | 0.0059 |
| Xylopia amazonica R.E. Fr. | 105 | 3.50 | 18.7 | ± | 5.2 | 15.9 | ± | 2.0 | 0.103 | 0.759 | 1.4749 | 0.1677 | 1.5705 | 0.7080 | 0.0805 | 0.7538 |
| Xylopia benthamii R.E.Fr. | 8 | 0.27 | 11.3 | ± | 1.2 | 13.0 | ± | 0.6 | 0.003 | 0.018 | 0.0409 | 0.0033 | 0.0445 | 0.0196 | 0.0016 | 0.0214 |
| Xylopia polyantha R.E.Fr. | 17 | 0.57 | 17.2 | ± | 5.3 | 15.0 | ± | 1.7 | 0.014 | 0.104 | 0.2055 | 0.0225 | 0.2194 | 0.0987 | 0.0108 | 0.1053 |
| Xylopia sp. | 7 | 0.23 | 17.4 | ± | 2.9 | 14.6 | ± | 0.7 | 0.006 | 0.041 | 0.0827 | 0.0086 | 0.0885 | 0.0397 | 0.0041 | 0.0425 |
| Apocynaceae | ||||||||||||||||
| Ambelania duckei Markgr. | 14 | 0.47 | 14.3 | ± | 5.0 | 13.7 | ± | 1.3 | 0.008 | 0.059 | 0.1218 | 0.0124 | 0.1307 | 0.0584 | 0.0059 | 0.0627 |
| Aspidosperma album (Vahl) Benoist ex Pichon | 4 | 0.13 | 14.9 | ± | 3.1 | 14.6 | ± | 1.5 | 0.002 | 0.017 | 0.0351 | 0.0034 | 0.0378 | 0.0168 | 0.0016 | 0.0181 |
| *Other species ... | ... | ... | ... | ... | ... | ... | ... | ... | ... | ... | ... | ... | ... | ... | ||
| Undetermined | 123 | 4.10 | 24.3 | ± | 11.7 | 17.4 | ± | 3.6 | 0.234 | 1.911 | 3.2181 | 0.4817 | 3.3680 | 1.5447 | 0.2312 | 1.6166 |
| Dead trees | 1,033 | 34.43 | 21.5 | ± | 13.4 | 16.3 | ± | 3.5 | 1.742 | 14.623 | 23.8278 | 3.8586 | 24.8688 | 11.4373 | 1.8521 | 11.9370 |
| Total (Ds and Ld) | 14,730 | 491 | - | - | - | - | - | - | 22.7 | 187.4 | 313.2 | 48.2 | 327.8 | 150.3 | 23.1 | 157.3 |
* Where: Treesi = total number of individuals per species in the 30 hectares of the forest inventory (FI); D = density of individuals per species per hectare, Trees ha-1; DBH = mean and standard deviation of diameter at breast height, in cm; TH = mean and standard deviation of total height, in meters; BA = basal area per species per hectare, in m² ha-1; V = commercial timber volume per species per hectare, in m3 ha-1; AGB = aboveground dry biomass per species, in Mg ha-1; BGB = belowground dry biomass per species, in Mg ha-1; TB = total dry biomass per species, in Mg ha-1; Carbon: AGC = aboveground carbon per species, in Mg ha-1; BGC = belowground carbon per species, in Mg ha-1; C = total carbon per species, in Mg ha-1. *Other species ...= the complete list can be viewed in Supplementary Material (Table S2). .
Table 2.
Hyperdominant tree families of the Anauá National Forest, in southern Roraima, Brazil.
| Ranking | Botanical Family | Horizontal Structure | Carbon | |||||||||||
|---|---|---|---|---|---|---|---|---|---|---|---|---|---|---|
| Treesi | BAi | ADi | RDi | ADoi | RDoi | ADIVi | RDIVi | VCi% | FIVi% | AGC | BGC | C | ||
| 1º | Fabaceae | 1,738 | 104.8 | 57.9 | 12.7 | 3.5 | 16.6 | 0.3 | 5.0 | 14.7 | 11.4 | 22.8 | 3.8 | 23.7 |
| 2º | Arecaceae | 2,555 | 57.7 | 85.2 | 18.7 | 1.9 | 9.2 | 0.3 | 5.0 | 13.9 | 10.9 | 13.3 | 1.4 | 14.3 |
| 3º | Sapotaceae | 1,311 | 84.7 | 43.7 | 9.6 | 2.8 | 13.4 | 0.3 | 4.8 | 11.5 | 9.3 | 18.4 | 3.1 | 19.1 |
| 4º | Lecythidaceae | 906 | 38.1 | 30.2 | 6.6 | 1.3 | 6.0 | 0.3 | 4.8 | 6.3 | 5.8 | 8.4 | 1.3 | 8.8 |
| 5º | Annonaceae | 1,006 | 26.4 | 33.5 | 7.3 | 0.9 | 4.2 | 0.3 | 4.7 | 5.8 | 5.4 | 6.0 | 0.7 | 6.4 |
| 6º | Vochysiaceae | 372 | 43.3 | 12.4 | 2.7 | 1.4 | 6.9 | 0.3 | 4.2 | 4.8 | 4.6 | 9.2 | 1.7 | 9.5 |
| 7º | Moraceae | 453 | 29.7 | 15.1 | 3.3 | 1.0 | 4.7 | 0.3 | 4.6 | 4.0 | 4.2 | 6.5 | 1.1 | 6.7 |
| 8º | Chrysobalanaceae | 611 | 22.9 | 20.4 | 4.5 | 0.8 | 3.6 | 0.3 | 4.2 | 4.1 | 4.1 | 5.1 | 0.7 | 5.4 |
| 9º | Burseraceae | 649 | 17.0 | 21.6 | 4.7 | 0.6 | 2.7 | 0.3 | 4.8 | 3.7 | 4.1 | 3.9 | 0.5 | 4.1 |
| 10º | Lauraceae | 515 | 20.4 | 17.2 | 3.8 | 0.7 | 3.2 | 0.3 | 4.1 | 3.5 | 3.7 | 4.6 | 0.6 | 4.8 |
| Subtotal | 10,116 | 445 | 337 | 74 | 15 | 71 | 3 | 46 | 72 | 64 | 98.2 | 14.9 | 102.9 | |
| Other species* | 4,614 | 237 | 119 | 26 | 6 | 29 | 3 | 54 | 28 | 36 | 52.1 | 8.2 | 54.4 | |
| Total (Ds and Ld)* | 14,730 | 683 | 457 | 100 | 21 | 100 | 6 | 100 | 100 | 100 | 150.3 | 23.1 | 157.3 | |
*Including the count of dead trees. Where: Treesi = total number of individuals per botanical family in the 30 hectares of the FI; BAi = basal area per botanical family (m²); DAi = absolute density per botanical family; RDi = relative density per botanical family; ADoi = absolute dominance per species; RDoi = relative dominance per species; ADIVi = absolute species diversity per botanical family; RDIVi = relative species diversity per botanical family; CVi% = coverage value per botanical family (%); ecological importance value per botanical family (FIVi%); AGB = aboveground dry biomass per botanical family, in Mg ha-1; BGB = belowground dry biomass per botanical family, in Mg ha-1; B = total dry biomass per botanical family, in Mg ha-1; Carbon: AGC = aboveground carbon per botanical family, in Mg ha-1; BGC = belowground carbon by botanical family, in Mg ha-1; C = total carbon by botanical family, in Mg ha-1.
Table 3.
Hyperdominant tree species of the Anauá National Forest, in southern Roraima, Brazil.
| Ranking | Species | Horizontal Structure | Carbon | |||||||||||
|---|---|---|---|---|---|---|---|---|---|---|---|---|---|---|
| Treesi | BAi | ADi | RDi | ADoi | RDoi | AFi | RFi | CVi% | IVi% | AGC | BGC | C | ||
| 1º | Euterpe precatoria | 1,151 | 15.8 | 38.4 | 8.4 | 0.5 | 2.5 | 81.7 | 2.1 | 5.5 | 4.3 | 3.7 | 0.3 | 4.0 |
| 2º | Pouteria macrophylla | 561 | 23.9 | 18.7 | 4.1 | 0.8 | 3.8 | 75.0 | 1.9 | 3.9 | 3.3 | 5.3 | 0.7 | 5.6 |
| 3º | Inga alba | 574 | 19.4 | 19.1 | 4.2 | 0.6 | 3.1 | 85.0 | 2.1 | 3.6 | 3.1 | 4.4 | 0.5 | 4.7 |
| 4º | Brosimum acutifolium | 358 | 21.0 | 11.9 | 2.6 | 0.7 | 3.3 | 84.2 | 2.1 | 3.0 | 2.7 | 4.6 | 0.7 | 4.8 |
| 5º | Protium rubrum | 504 | 10.2 | 16.8 | 3.7 | 0.3 | 1.6 | 84.2 | 2.1 | 2.6 | 2.5 | 2.4 | 0.2 | 2.5 |
| 6º | Sapium glandulosum | 267 | 26.1 | 8.9 | 1.9 | 0.9 | 4.1 | 44.2 | 1.1 | 3.0 | 2.4 | 5.6 | 1.0 | 5.9 |
| 7º | Attalea maripa | 409 | 19.7 | 13.6 | 3.0 | 0.7 | 3.1 | 43.3 | 1.1 | 3.1 | 2.4 | 4.4 | 0.6 | 4.7 |
| 8º | Astrocaryum murumuru | 536 | 12.9 | 17.9 | 3.9 | 0.4 | 2.0 | 43.3 | 1.1 | 3.0 | 2.3 | 3.0 | 0.3 | 3.2 |
| 9º | Manilkara huberi | 145 | 27.3 | 4.8 | 1.1 | 0.9 | 4.3 | 36.7 | 0.9 | 2.7 | 2.1 | 5.7 | 1.2 | 5.8 |
| 10º | Qualea paraensis | 194 | 23.2 | 6.5 | 1.4 | 0.8 | 3.7 | 45.0 | 1.1 | 2.5 | 2.1 | 4.9 | 0.9 | 5.1 |
| Subtotal | 4,699 | 200 | 157 | 34 | 7 | 32 | 623 | 16 | 33 | 27 | 44.1 | 6.6 | 46.3 | |
| Other species* | 10,031 | 483 | 300 | 66 | 14 | 68 | 3,358 | 84 | 67 | 73 | 95.4 | 14.8 | 99.8 | |
| Total (Ds and Ld) | 14,730 | 683 | 457 | 100 | 21 | 100 | 3,980 | 100 | 100 | 100 | 139.5 | 21.3 | 146.0 | |
Table 4.
Comparisons between diversity metrics for Dense Ombrophilous Forest (Ds), Forested Campinarana (Ld) and Campinarana/Ombrophilous Forest Contact (LO) environments in the Brazilian Legal Amazon.
Table 4.
Comparisons between diversity metrics for Dense Ombrophilous Forest (Ds), Forested Campinarana (Ld) and Campinarana/Ombrophilous Forest Contact (LO) environments in the Brazilian Legal Amazon.
| Authors | Brazilian Legal Amazon | Ds | LO | Ld | H’ | α |
|---|---|---|---|---|---|---|
| Condé et al., 2025 (This study) |
Rorainópolis-RR | X | 4,43 | 75,27 | ||
| X | 4,26 | 57,23 | ||||
| Condé e Tonini (2013) | Caracaraí-RR | X | 3,27 | - | ||
| Alves e Miranda (2008) | Almeirim-PA | X | 4,25 | - | ||
| Oliveira et al. (2008) | Manaus-AM | X | 5,10 | - | ||
| Miranda (2000) | Pimenta Bueno-RO | X | 3,88 | - | ||
| Oliveira e Mori (1999) | Projeto Dinâmica Biológica de Fragmentos Florestais (PDBFF) próximo à Manaus-AM | X | - | 205,08 | ||
| Amaral (1996) | Região do Rio Urucu-AM | X | - | 140,51 | ||
| Tello (1995) | Manaus-AM | X | - | 53,01 |
Where: Ds = Dense Ombrophilous Forest; LOt = Campinarana/Ombrophilous Forest Contact; Ld = Forested Campinarana; H’ = Shannon index; α = Fisher’s alpha.
Table 5.
Estimated number of trees, basal area, and commercial timber volume per hectare and per mapped area (stratum) in Dense Ombrophilous Forest (Ds), Forested Campinarana (Ld), and General Forest (Ds and Ld) for the Anauá National Forest, in southern Roraima, Brazil.
Table 5.
Estimated number of trees, basal area, and commercial timber volume per hectare and per mapped area (stratum) in Dense Ombrophilous Forest (Ds), Forested Campinarana (Ld), and General Forest (Ds and Ld) for the Anauá National Forest, in southern Roraima, Brazil.
| Forest physiognomies | Stratum (ha) | Trees | BA | V | ||||||||||||
|---|---|---|---|---|---|---|---|---|---|---|---|---|---|---|---|---|
| (ha) | (m² ha-1) | (106 m²) | (m³ ha-1) | (106 m³) | ||||||||||||
| Ds | 71.161 | 486 | ± | 21 | 23,2 | ± | 1,1 | 1,7 | ± | 0,1 | 192,9 | ± | 10,9 | 13,7 | ± | 0,1 |
| Ld | 116.907 | 496 | ± | 23 | 22,3 | ± | 1,3 | 2,6 | ± | 0,1 | 162,6 | ± | 10,4 | 19,0 | ± | 0,9 |
|
Total (Ds and Ld) |
188.068 | 492 | ± | 16 | 22,6 | ± | 0,8 | 4,3 | ± | 0,2 | 174,1 | ± | 7,4 | 32,7 | ± | 1,4 |
Where: Stratified Random Sampling (SRS) = 15 hectares in Ds and 15 hectares in Ld; Mapped area (ha) = spectrally classified by pixel (Maximum Likelihood) in the R(5), G(4), B(3) composition of the OLI sensor of the Landsat-8 platform; NOTE = values referring to the mean (x) and confidence interval (95% CI).
Table 6.
Estimate of dry biomass and forest carbon stored per hectare, by mapped area (stratum) and by forest typology of the Anauá National Forest, in southern Roraima, Brazil.
Table 6.
Estimate of dry biomass and forest carbon stored per hectare, by mapped area (stratum) and by forest typology of the Anauá National Forest, in southern Roraima, Brazil.
| Forest physiognomies | Stratum (ha) | Biomass | |||||||||||||||||
| AGB | BGB | B | |||||||||||||||||
| (Mg ha-1) | (106 Mg) | (Mg ha-1) | (106 Mg) | (Mg ha-1) | (106 Mg) | ||||||||||||||
| Ds | 71.161 | 322,3 | ± | 14,2 | 22,9 | ± | 0,1 | 49,8 | ± | 3,5 | 3,5 | ± | 0,1 | 332,3 | ± | 14,2 | 23,6 | ± | 0,1 |
| Ld | 116.907 | 213,9 | ± | 21,7 | 25,0 | ± | 1,5 | 26,4 | ± | 4,0 | 3,1 | ± | 0,3 | 245,1 | ± | 25,8 | 28,7 | ± | 1,8 |
|
Total (Ds and Ld) |
188.068 | 254,9 | ± | 13,3 | 47,9 | ± | 2,5 | 35,3 | ± | 2,7 | 6,6 | ± | 0,5 | 278,1 | ± | 15,0 | 52,3 | ± | 2,8 |
| Forest physiognomies | Stratum (ha) | Carbon | |||||||||||||||||
| AGC | BGC | C | |||||||||||||||||
| (Mg ha-1) | (106 Mg) | (Mg ha-1) | (106 Mg) | (Mg ha-1) | (106 Mg) | ||||||||||||||
| Ds | 71.161 | 156,3 | ± | 6,9 | 11,1 | ± | 0,1 | 24,2 | ± | 1,7 | 1,7 | ± | 0,1 | 161,2 | ± | 6,9 | 11,5 | ± | 0,1 |
| Ld | 116.907 | 101,6 | ± | 10,3 | 11,9 | ± | 0,7 | 12,5 | ± | 1,9 | 1,5 | ± | 0,2 | 116,4 | ± | 12,2 | 13,6 | ± | 0,8 |
|
Total (Ds and Ld) |
188.068 | 122,3 | ± | 6,3 | 23,0 | ± | 1,2 | 16,9 | ± | 1,3 | 3,2 | ± | 0,2 | 133,3 | ± | 7,2 | 25,1 | ± | 1,4 |
Where: Stratified Random Sampling (SRS) = 15 hectares in Ds and 15 hectares in Ld; Mapped area (ha) = spectrally classified by pixel (Maximum Likelihood) in the R(5), G(4), B(3) composition of the OLI sensor of the Landsat-8 platform; AGB = aboveground dry biomass; BGB = belowground dry biomass; B = total dry biomass; AGC = aboveground carbon; BGC = belowground carbon; C = total carbon; NOTE = values referring to the mean (x) and confidence interval (95% CI).
Table 7.
Estimate of the potential for exploitation of timber forest products (TFP) and non-timber forest products (NTFP) per hectare and per mapped area (Strata) for the Anauá National Forest, in southern Roraima, Brazil.
Table 7.
Estimate of the potential for exploitation of timber forest products (TFP) and non-timber forest products (NTFP) per hectare and per mapped area (Strata) for the Anauá National Forest, in southern Roraima, Brazil.
| NTFPs | Category 1: Palm trees and juvenile trees with a diameter between 10 < DBH < 31.8 cm | ||||||||||||
| Forest physiognomies | Juvenile trees | Juvenile commercial volume | |||||||||||
| ha (m³) | Stratum (106 m³) | ha (m³) | Stratum (106 m³) | ||||||||||
| DS | 422.3 | ± | 20.8 | 30.1 | ± | 0.1 | 77.6 | ± | 2.8 | 5.5 | ± | 0.1 | |
| LD | 431.3 | ± | 22.4 | 50.4 | ± | 1.8 | 74.1 | ± | 3.9 | 8.7 | ± | 0.3 | |
| Total (Ds and Ld) | 427.9 | ± | 15.3 | 80.5 | ± | 2.9 | 75.4 | ± | 2.5 | 14.2 | ± | 0.5 | |
| NTFPs and TFP | Category 2: Pre-harvestable trees with a diameter between 31.8 < DBH < 50.0 cm | ||||||||||||
| Forest physiognomies | Pre-exploitable trees | Volume comercial pré-explorável | |||||||||||
| ha (m³) | Stratum (106 m³) | ha (m³) | Stratum (106 m³) | ||||||||||
| DS | 42.5 | ± | 4.0 | 3.0 | ± | 0.1 | 42.4 | ± | 4.1 | 3.0 | ± | 0.1 | |
| LD | 48.5 | ± | 4.8 | 5.7 | ± | 0.4 | 43.4 | ± | 4.5 | 5.1 | ± | 0.4 | |
| Total (Ds and Ld) | 46.2 | ± | 3.1 | 8.7 | ± | 0.6 | 43.0 | ± | 3.0 | 8.1 | ± | 0.6 | |
| TFP | Category 3: Exploitable trees with DBH > 50.0 cm | ||||||||||||
| Forest physiognomies | Explorable trees | Exploitable commercial volume | |||||||||||
| ha (m³) | Stratum (106 m³) | ha (m³) | Stratum (106 m³) | ||||||||||
| DS | 21.2 | ± | 2.4 | 1.5 | ± | 0.1 | 72.9 | ± | 11 | 5.2 | ± | 0.1 | |
| LD | 16.2 | ± | 2.3 | 1.9 | ± | 0.2 | 45.1 | ± | 9.1 | 5.3 | ± | 0.8 | |
| Total (Ds and Ld) | 18.1 | ± | 1.6 | 3.4 | ± | 0.3 | 55.6 | ± | 7.0 | 10.5 | ± | 1.3 | |
Where: Stratified Random Sampling (SRS) = 15 hectares in Ds and 15 hectares in Ld; Mapped area (ha) = spectrally classified by pixel (Maximum Likelihood) in the R(5), G(4), B(3) composition of the OLI sensor of the Landsat-8 platform; Strata: 71,161 ha of Dense Ombrophilous Forest (Ds); 116,907 ha of Forested Campinarana (Ld); 188,068 ha of Total (Ds and Ld); NOTE = values referring to mean (x) and confidence interval (95% CI).
Disclaimer/Publisher’s Note: The statements, opinions and data contained in all publications are solely those of the individual author(s) and contributor(s) and not of MDPI and/or the editor(s). MDPI and/or the editor(s) disclaim responsibility for any injury to people or property resulting from any ideas, methods, instructions or products referred to in the content. |
© 2025 by the authors. Licensee MDPI, Basel, Switzerland. This article is an open access article distributed under the terms and conditions of the Creative Commons Attribution (CC BY) license (http://creativecommons.org/licenses/by/4.0/).
Copyright: This open access article is published under a Creative Commons CC BY 4.0 license, which permit the free download, distribution, and reuse, provided that the author and preprint are cited in any reuse.


