
Submitted:
22 November 2025
Posted:
24 November 2025
You are already at the latest version
Abstract
Background/Aims: To develop an image linearization process and a program capable of quantifying vertical and left-right asymmetries observed in macular scans. We then sought to verify its applicability in clinical settings.
Methods: In this single-center cross-sectional study, we examined 37 consecutive patients diagnosed with open-angle glaucoma in one eye, with the other eye being normal. Spectral-domain OCT images were automatically processed by a program we developed to straighten the disc-macula and macula-temporal raphe lines. The following parameters were then analyzed: 1) Mean inner retinal thickness difference between the superior and inferior segments, 2) Vertical Asymmetry Score, and 3) Quadrantal Asymmetry Score. These parameters were automatically measured, and their values were compared between the two eyes..
Results: We analyzed 37 healthy eyes and 37 POAG eyes. After linearization, the mean inner retinal thickness for the normal and POAG groups was 93.4 µm (interquartile range [IQR]: 90.1-98.5) and 80.3 µm (IQR: 77.3-85.0), respectively. The Vertical Asymmetry Score was 6.80 (IQR: 6.15-7.25) for healthy eyes and 9.69 (IQR: 9.16-11.58) for POAG eyes. The Quadrantal Asymmetry Score was 6.35 (IQR: 5.94-7.19) for healthy eyes and 8.47 (IQR: 8.11-9.63) for POAG eyes. Significant differences were found between groups for all parameters (p< 0.001). The Vertical Asymmetry Score (AUC = 0.967, p< 0.001) and Quadrantal Asymmetry Score (AUC = 0.946, p< 0.001) demonstrated significantly greater accuracy in detecting glaucoma compared to the mean inner retinal thickness (AUC = 0.743).
Conclusion: The developed linearization program and asymmetry scores have shown promise as parameters for detecting glaucomatous changes in macular scans using spectral-domain OCT.
Keywords:
glaucoma
; optical coherence tomography
; macular asymmetry
; temporal raphe
; linearization algorithm
1. Introduction
Glaucoma, a chronic and irreversible ocular condition, is distinguished by the degeneration and depletion of retinal ganglion cells (RGCs) and their corresponding axons within the retina [1,2,3,4]. This progressive optic-nerve impairment consequently leads to the manifestation of distinct visual-field abnormalities. The deleterious impact of glaucoma on visual health is of significant concern, as it stands as the second most prevalent cause of avoidable blindness globally [5]. According to recent statistics, an estimated 3.6 million individuals aged 50 years and above experienced vision loss due to glaucoma in the year 2020 [6]. This alarming figure highlights the urgent need for enhanced preventive measures, early detection strategies, and effective therapeutic interventions to mitigate the growing burden of glaucoma-related visual impairment.
Optical Coherence Tomography (OCT), a non-invasive imaging technique, has emerged as a valuable tool in diagnosing and monitoring glaucoma by providing detailed structural information of the retina and optic nerve head. In recent years, researchers have turned their attention to exploring novel OCT biomarkers that may aid in the early detection and characterization of glaucoma. The temporal raphe, a distinctive anatomical landmark in the retina, has garnered considerable interest as a potential biomarker in glaucoma research [7,8,9,10,11,12,13,14,15]. It delineates the horizontal demarcation between the superior and inferior hemispheres of the retina, and its integrity assumes a pivotal role in sustaining retinal functionality. Recent investigations employing OCT imaging have identified diverse temporal raphe indications, encompassing thinning, which hold potential as markers for the recognition of glaucomatous retinal neurodegeneration and early-stage glaucomatous impairment. Nevertheless, the assessment of such vertical asymmetry within the macula presently remains a subjective appraisal reliant on the observer, lacking instruments equipped with integrated analysis programs for its quantitative evaluation.
Thus, the principal objective of this study is to develop a program capable of quantifying the vertical asymmetry, left-right asymmetry, or both, observed in macular scans, and to subsequently verify its applicability in clinical settings.
2. Methods
2.1. Study Enrollment and Participants
This cross-sectional study was approved by the Ethics Committee of Saitama Medical University (No. byou2023-051) and was conducted in accordance with the Declaration of Helsinki. Owing to the retrospective nature of the study, the requirement for additional informed consent was waived.
All participants underwent a comprehensive ophthalmologic examination, including best-corrected visual acuity (BCVA), slit-lamp biomicroscopy, intraocular pressure (IOP) measurement using Goldmann applanation tonometry, and dilated fundus examination. Standard automated perimetry (SAP) was performed using the Humphrey Field Analyzer (Carl Zeiss Meditec, Dublin, CA) with the 24-2 Swedish Interactive Threshold Algorithm (SITA) Standard program. Axial length (AL) and central corneal thickness (CCT) were measured using an optical biometer (OA-2000, Tomey Corp., Nagoya, Japan). Eligible eyes were required to have BCVA of 20/50 or better, AL <30 mm, reliable SAP results (<20% fixation loss, <15% false-negative errors, and <15% false-positive errors), and adequate OCT image quality (signal strength >7). No exclusions were applied for refractive error, CCT, or prior ocular surgery if the above conditions were met.
Eyes were excluded if they had a history of glaucoma surgery, vitreoretinal or corneal surgery, clinically significant cataract, corneal opacity, retinal disease, or non-glaucomatous optic neuropathy. Eyes with pathological myopia or suspected pathologic changes—including diffuse or patchy chorioretinal atrophy, lacquer cracks, myopic choroidal neovascularization, or macular atrophy—were excluded to avoid confounding glaucomatous structural alterations.
2.2. Glaucoma Diagnosis
Glaucoma was diagnosed based on characteristic optic nerve head (ONH) changes and corresponding visual field defects. ONH abnormalities included a vertical cup-to-disc ratio ≥0.7, neuroretinal rim narrowing or notching (rim width ≤0.1), and/or localized retinal nerve fiber layer (RNFL) defects whose edges at the ONH margin exceeded those at adjacent major retinal vessels and diverged in arcuate or wedge-shaped patterns. Visual field defects were deemed glaucomatous when at least one of the Anderson–Patella criteria was satisfied: (1) a cluster of ≥3 points in the pattern deviation plot within one hemifield (superior or inferior) with P <0.05, including ≥1 point at P <0.01; (2) a glaucoma hemifield test result outside normal limits; or (3) pattern standard deviation with P <0.05. Glaucomatous eyes were required to have open angles on gonioscopy and mean deviation (MD) >–6 dB. Pre-perimetric glaucomatous eyes presenting ONH structural changes without VF defects were also included. Diagnosis for each eye was made independently by two glaucoma specialists (M.S. and H.I.), with disagreements resolved by a third adjudicator (T.S.). Normal fellow eyes were required to have IOP <21 mmHg, normal-appearing ONH and RNFL on fundus examination and stereo disc photographs, and no VF abnormalities.
2.3. Canon OCT Imaging
All participants underwent macular imaging using spectral-domain OCT (OCT-A1, Canon, Tokyo, Japan). The system operates at a wavelength of 855 nm with an A-scan rate of 70,000 scans per second, providing axial and transverse resolutions of approximately 3 µm and 20 µm, respectively.
Macular inner retinal layer thickness measurements were automatically obtained for subsequent analysis.
2.4. Image Processing
Image processing was performed using a custom-developed algorithm (Figure 1).
- A built-in algorithm automatically detected and centered the fovea.
- The center of the optic disc was identified, and each image was rotated such that the disc–fovea axis became horizontal (referred to as the “Rotation image”).
- Linearization Program: After detecting the disc and foveal centers, the region superior to the disc–fovea line was stretched and the region inferior to it was compressed to ensure complete horizontal alignment of the disc–fovea axis. The temporal region within ±60 degrees from the fovea was preserved without distortion to maintain the anatomical configuration of the temporal raphe.
- Retinal thickness at corresponding locations after linearization was computed using a nearest-neighbor matching algorithm, a widely used method for point-to-point correspondence following geometric transformation.
This procedure enabled standardized comparison of symmetric points across the macula.
Figure 1.
Image Processing Method; The custom image-processing pipeline consists of the following steps: 1. Foveal Centering: A built-in algorithm automatically detects the foveal center and positions it at the center of the OCT image. 2. Disc–Fovea Alignment: The center of the optic disc is automatically identified, and the image is rotated so that the disc–fovea axis becomes horizontal. The resulting image is referred to as the “Rotation image.”; 3. Linearization Procedure: The region above the disc–fovea line is stretched.; The region below the disc–fovea line is compressed.; The temporal region within ±60 degrees of the fovea is preserved without distortion.; This transformation aligns both the disc–fovea line and the temporal raphe horizontally, enabling standardized geometric comparison of corresponding macular locations.
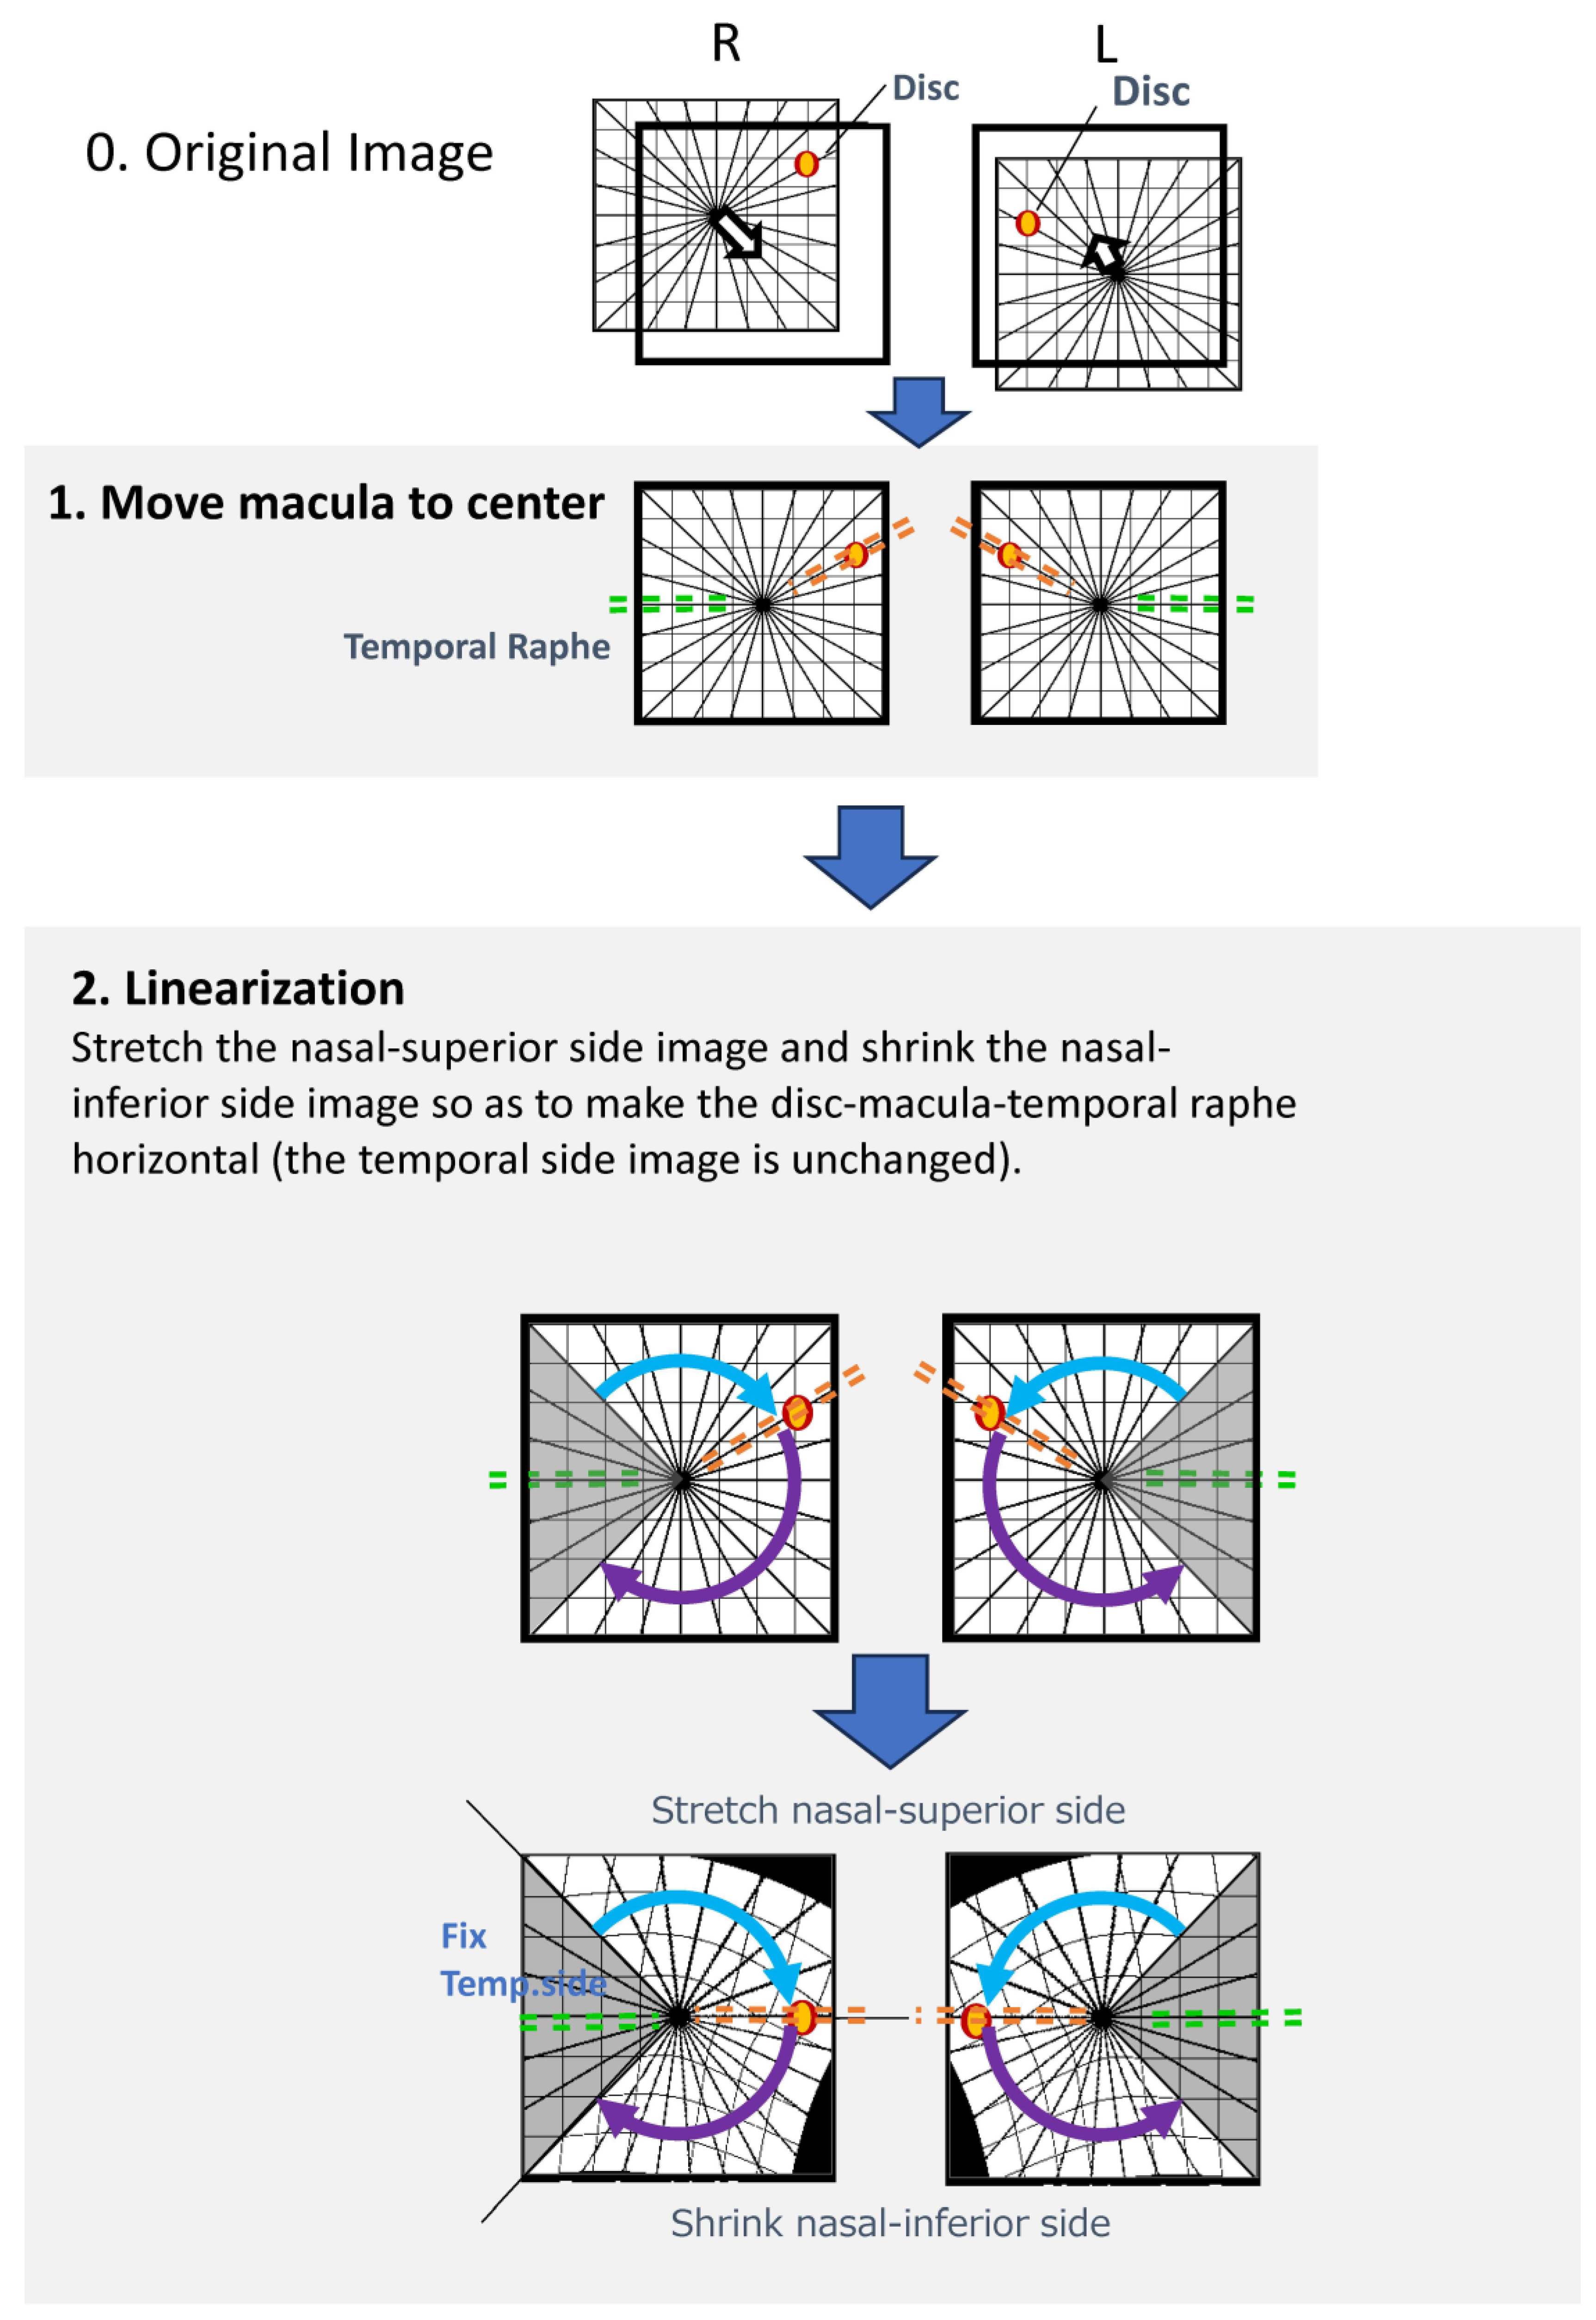
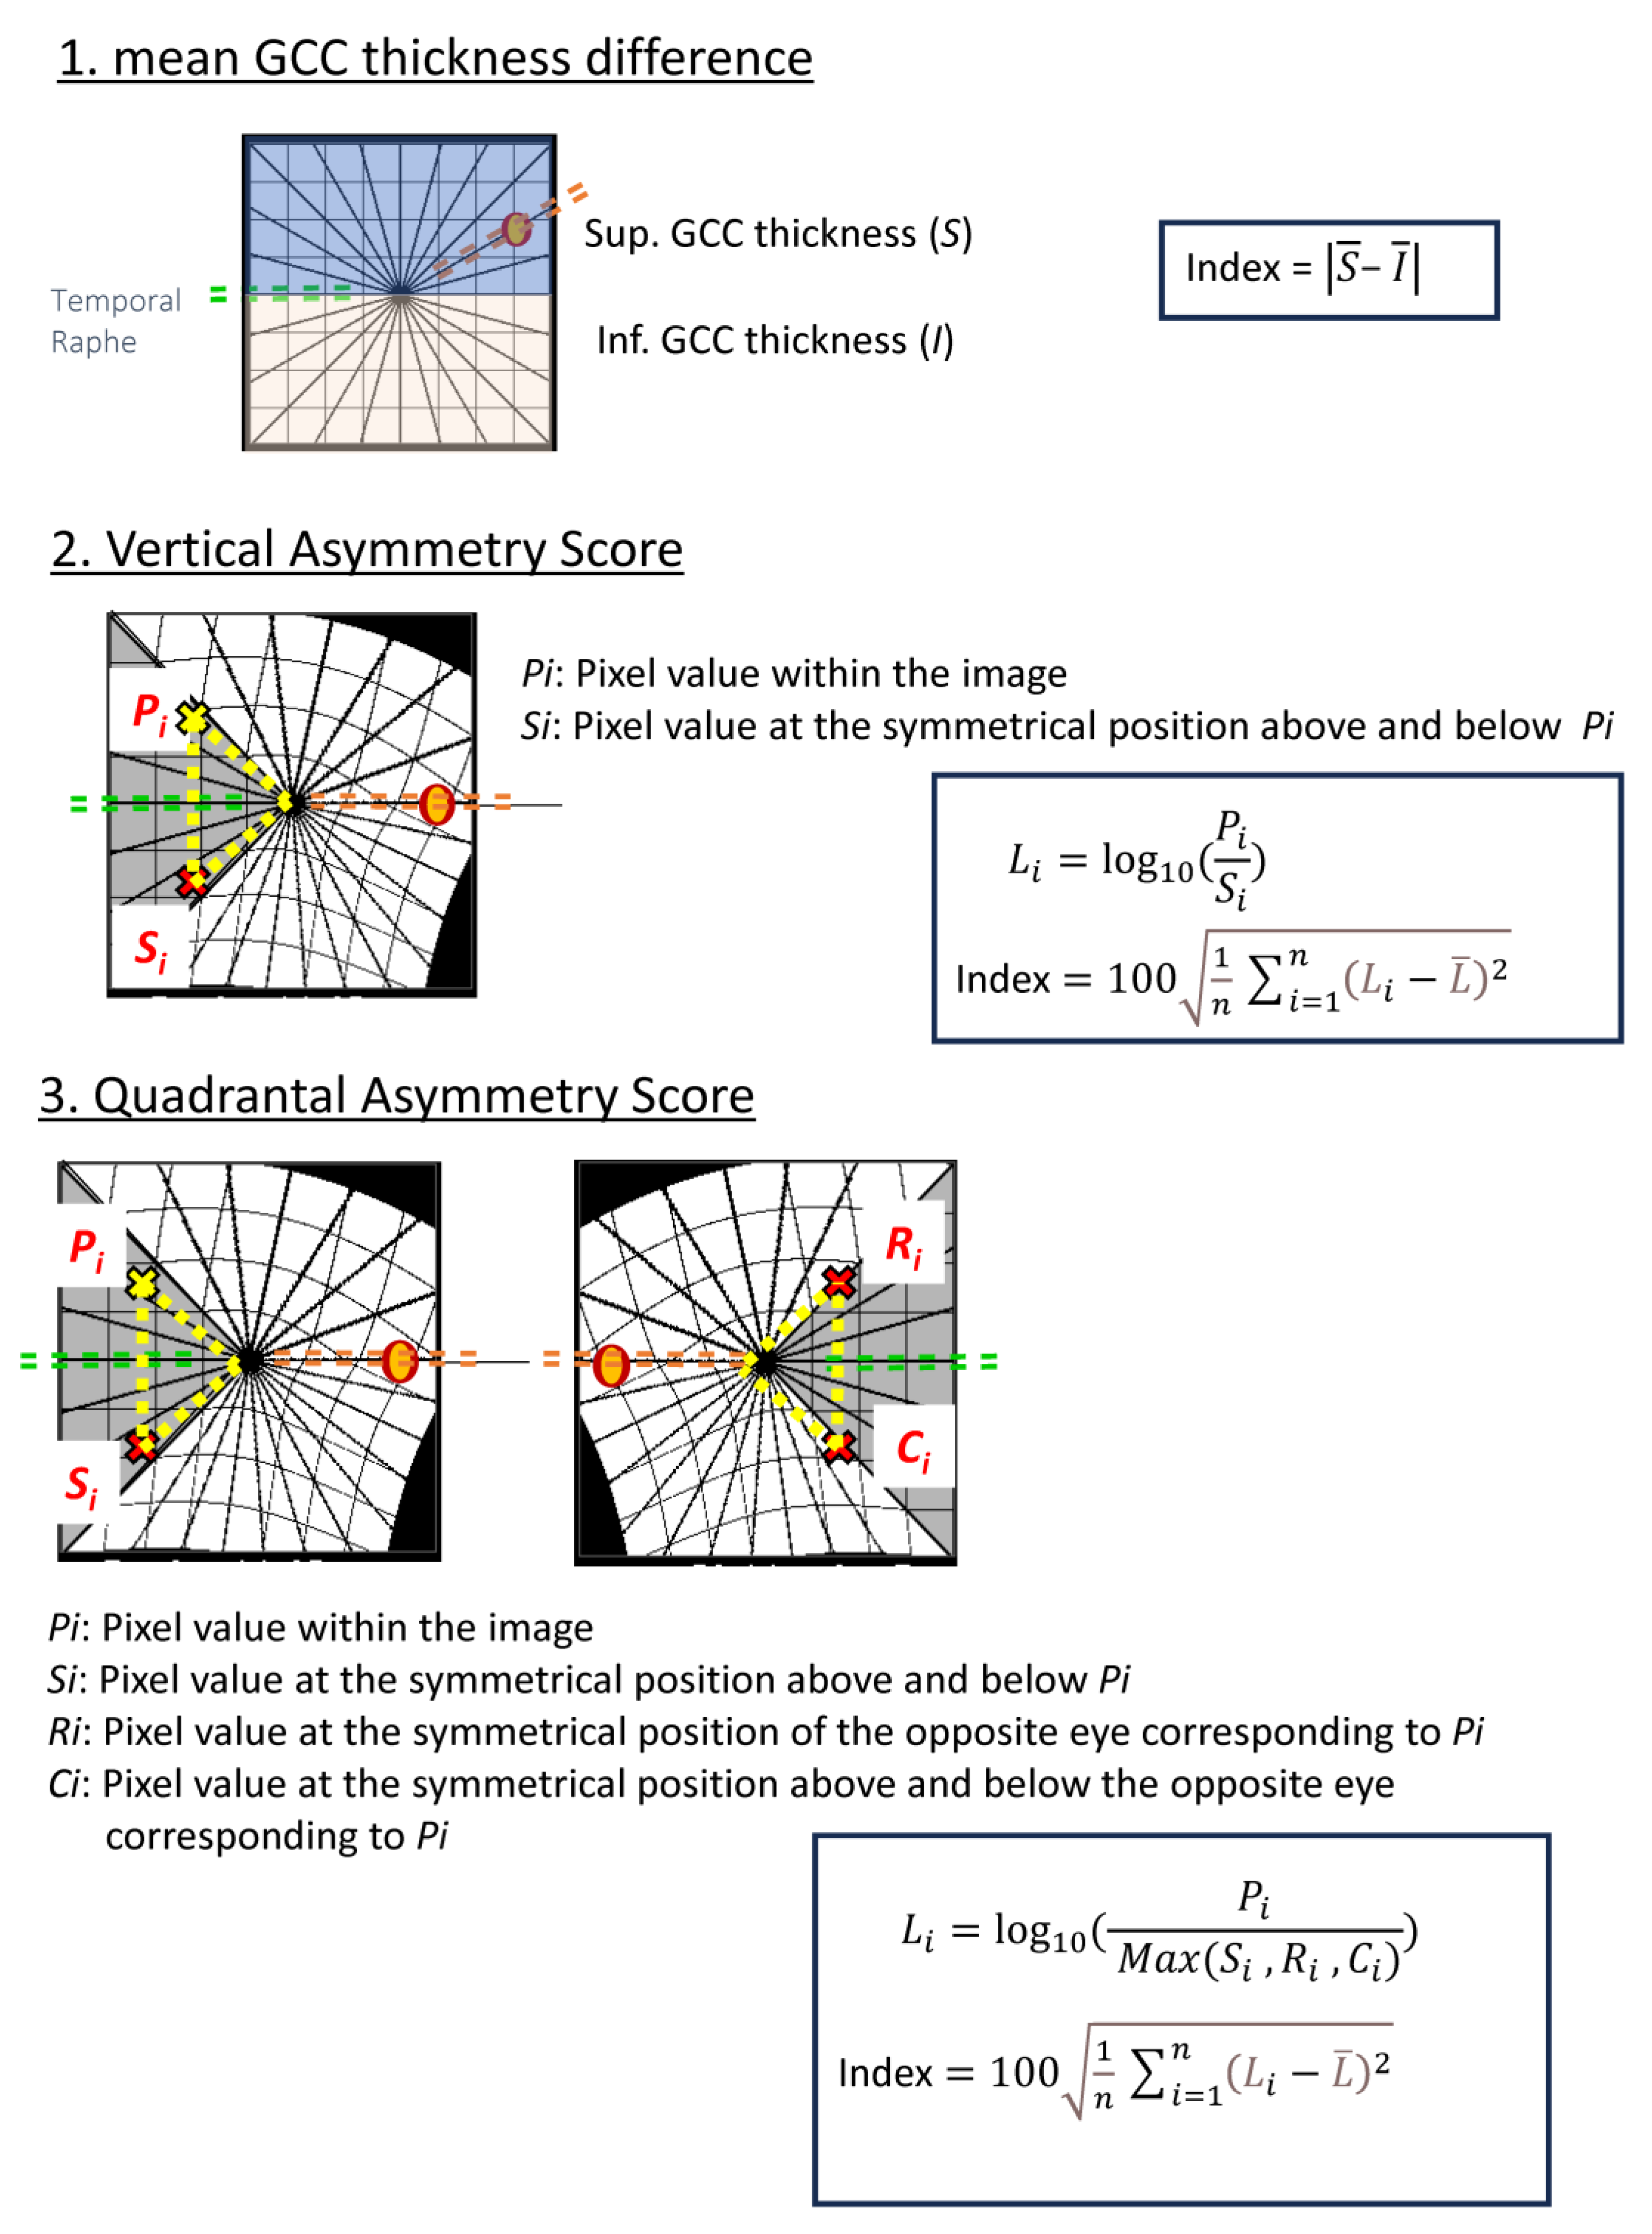
Figure 2.
Calculation Methods for Each Parameter; (1) Mean GCC Thickness Difference: Pointwise differences in ganglion cell complex (GCC) thickness are computed across the macula.; (2) Vertical Asymmetry Score: For each macular pixel , the GCC thickness difference from its vertically mirrored counterpart is calculated. The standard deviation of all pointwise differences, multiplied by 100, defines the Vertical Asymmetry Score.; (3) Quadrantal Asymmetry Score: For each pixel , GCC thickness is compared with three symmetric locations: vertically mirrored , horizontally/temporal raphe–mirrored , and the corresponding mirrored point in the fellow eye . The maximum of these symmetric reference values is identified, and the difference from is calculated. The standard deviation of these differences, multiplied by 100, defines the Quadrantal Asymmetry Score. Diagrammatic representations show pixel correspondences used for each parameter.
2.5. Asymmetry Score Computation
2.5.1. Vertical Asymmetry Score
For each image, the difference in ganglion cell complex (GCC) thickness between vertically symmetric points above and below the fovea was calculated. The distribution of these pointwise differences (up to 65,536 points per image) was obtained, and the standard deviation multiplied by 100 was defined as the Vertical Asymmetry Score.
2.5.2. Quadrantal Asymmetry Score
For each measurement point, GCC thickness was compared with three corresponding symmetric points: vertically mirrored, horizontally mirrored, and oblique mirror points defined relative to the foveal center. The maximum GCC thickness among these three symmetric locations was identified, and the difference from this maximum value was computed. The standard deviation of all resulting thickness differences, multiplied by 100, was defined as the Quadrantal Asymmetry Score.
2.6. Statistical Analysis
Differences between glaucomatous and normal eyes were compared using the paired t-test or Student’s t-test, as appropriate. Statistical significance was set at P <0.05 for two-tailed tests. Continuous variables are presented as mean (95% confidence interval), except for age, which is reported as median (interquartile range). Receiver operating characteristic (ROC) analyses were performed to evaluate the diagnostic performance of each parameter.
All analyses were conducted using JMP Pro version 16 (SAS Institute, Cary, NC, USA).
3. Results
3.1. Participant Characteristics
A total of 37 patients with unilateral glaucoma were included (37 glaucomatous eyes and 37 fellow normal eyes). The median age of the participants was 68 years. There were no significant differences between glaucomatous and normal eyes in visual acuity, central corneal thickness, intraocular pressure, or axial length. As expected, visual field sensitivity differed significantly between the two groups. The demographic and clinical characteristics are summarized in Table 1.
3.2. OCT Parameters
Table 2 summarizes the macular OCT measurements. The mean inner retinal layer thickness was significantly thinner in glaucomatous eyes compared with normal eyes. The superior–inferior thickness difference was also greater in glaucomatous eyes. Both the Vertical Asymmetry Score and the Quadrantal Asymmetry Score were significantly higher in the glaucoma group than in the normal group. A representative case is shown in Figure 3, illustrating a 48-year-old woman with unilateral glaucoma. The glaucomatous eye exhibited markedly increased Vertical Asymmetry (10.66) and Quadrantal Asymmetry (7.61) compared with the fellow normal eye (Vertical Asymmetry 5.45; Quadrantal Asymmetry 4.62), demonstrating the ability of these metrics to capture early macular structural changes.
3.3. Diagnostic Performance
Table 3 and Figure 4 present the diagnostic accuracy of each parameter for glaucoma. The area under the ROC curve (AUC) was 0.743 (95% CI, 0.627–0.859) for the mean inner retinal thickness difference, 0.967 (95% CI, 0.937–0.999) for the Vertical Asymmetry Score, and 0.946 (95% CI, 0.898–0.994) for the Quadrantal Asymmetry Score. Both the Vertical Asymmetry Score and the Quadrantal Asymmetry Score demonstrated significantly greater diagnostic performance than the conventional superior–inferior thickness difference.
4. Discussion
In this study, we demonstrated the ability to detect glaucomatous eyes more sensitively than conventional imaging by utilizing the difference in macular superior and inferior hemiretina thickness, emphasized through a linearization program for the temporal raphe sign. This was made possible by employing a linearization program to meticulously analyze the differences in thickness between the superior and inferior hemiretina in the macular region.
Recent progress in OCT technology has been pivotal in advancing our understanding of glaucoma, particularly in its early stages. A key discovery has been the differentiation in thickness of the inner retinal layers located temporally to the macula. This difference, observed across the horizontal meridian, was first noted by Kim et al. in 2015. [8] They described this phenomenon as ‘Hemifield Difference across Horizontal Raphe’ and underscored its diagnostic value in glaucoma detection. Moreover, these researchers also pointed out that the temporal raphe sign, a specific change observed in glaucomatous eyes, is instrumental in distinguishing glaucoma from other types of optic neuropathies. [9] Our study’s results align with these previous findings, providing further evidence of the sign’s diagnostic significance.
One challenge in the study of glaucoma has been the anatomical variations between individuals, particularly concerning the relative positions of the optic nerve head and the macula. It has been reported, for instance, that these two critical eye components are not aligned at the same height and that there is considerable individual variability in the angle formed between them. Hood and colleagues have contributed to this understanding by reporting that, on average, the fovea is situated approximately 8 degrees below the optic nerve head. [15] However, they also highlighted the existence of substantial individual differences in this positioning. The fovea is generally located approximately 6 to 8 vertically below the optic disc in healthy individuals with wide interindividual variation. [16,17,18]
The asymmetry in the trajectory of nerve fibers extending from the optic nerve head to the macula is an important aspect to consider. This is especially true when examining the thickness of the peripapillary retinal nerve fiber layer (cpRNFL), a quantification technique that has been utilized since the time of Time-Domain OCT (TD-OCT). The Garway-Heath map’s asymmetric nature is also linked to its evaluation methodology, which centers around the optic nerve head. Despite the advancements in OCT technology, current commercially available OCT models with built-in programs can only measure the thickness of the inner retinal layers in a superior and inferior orientation. However, none of these models are equipped to detect asymmetry scores. Our study addresses this gap by developing an automatic program that linearizes the optic nerve head and the temporal raphe, thereby enhancing the ability to detect glaucoma. Typically, the optic nerve head information is incorporated in the assessment, leading to an expansion of the superior retina and a contraction of the inferior retina. After this adjustment, the program calculates the difference in inner retinal layer thickness at each symmetric point, as well as the average value and variance of these differences. The significance of this approach lies in its ability to capture local variability, as the variance in thickness differences increases with localized disparities. This is particularly relevant in early-stage glaucoma, where local thinning of the nerve fiber layer thickness is a characteristic structural change.
It is widely acknowledged that the inner retinal layer undergoes thinning as glaucoma progresses. However, there is also natural individual variation in the thickness of this layer in healthy eyes. Distinguishing between thinning due to early glaucomatous structural changes and mere individual differences poses a significant challenge when relying solely on average measurements of inner retinal layer thickness. Glaucoma is a leading cause of blindness in developed countries, and the thickness of the macular retina is closely associated with the fixation point, directly impacting the quality of vision (QOV). Hence, the ability to detect early glaucomatous changes in the macular retinal thickness accurately and sensitively is of paramount importance in glaucoma treatment. Our program, which calculates the difference in inner retinal layer thickness in the macular region both superiorly and inferiorly, could prove to be an invaluable tool in the diagnosis and management of early-stage glaucoma. This tool might also be beneficial for cases that are traditionally challenging to diagnose using OCT, such as those involving early-stage glaucoma, high myopia, or concurrent fundus diseases.
We acknowledge the following limitations in our study. First, the linearization program used in this study may not accurately reflect the actual variation in retinal thickness. This program was beneficial in correcting the angle between the optic nerve head and the fovea and in reflecting the difference in retinal thickness between the upper and lower inner layers. Further research is necessary to determine whether it accurately reflects the local structural and functional relationship. Second, our study is cross-sectional. In this study, glaucoma was diagnosed based on the results of visual field tests. Recent reports have suggested that the standard automated visual field program 24-2 might miss early glaucoma cases, where scotomas appear near the fixation point. Future research will focus on preperimetric glaucoma. Third, our study was limited to Asian (Japanese) subjects. As the average retinal thickness has been reported to vary by race, the reference values for symmetry scores might also differ in other racial groups.
In conclusion, the linearization correction program developed in our study has demonstrated superior glaucoma detection capabilities compared to traditional measurement methods. This program, which focuses on the temporal raphe and calculates the difference in inner retinal layer thickness in the macular region, shows promise in detecting structural changes characteristic of early-stage glaucoma. Its implementation could represent a significant advancement in the early detection and management of this prevalent and potentially debilitating eye condition.
Supplementary Materials
The following supporting information can be downloaded at the website of this paper posted on Preprints.org.
Author Contributions Statement
Conceptualization: T.S., K.S.; Methodology: T.S., K.S.; Investigation: M.S., H. Ibuki, H. Ishii, J.K.; Data Curation: M.S., H. Ibuki, H. Ishii; Formal Analysis: T.S., K.S.; Writing – Original Draft: T.S.; Writing – Review & Editing: All authors; Supervision: K.S.; Approval of Final Manuscript: All authors.
Competing interests
The authors declare no competing interests.
Funding support
This work No funding supported this research.
Data availability
The datasets generated and/or analyzed during the current study are available from the corresponding author upon reasonable request.
References
- Weinreb RN, Khaw PT. Primary open-angle glaucoma. Lancet 2004;363:1711-1720.
- Weinreb RN, Leung CK, Crowston JG, et al. Primary open-angle glaucoma. Nat Rev Dis Primers 2016;2:16067.
- Weinreb RN, Aung T, Medeiros FA. The pathophysiology and treatment of glaucoma: a review. Jama 2014;311:1901-1911.
- Jayaram, H.; Kolko, M.; Friedman, D.S.; Gazzard, G. Glaucoma: now and beyond. Lancet 2023, 402, 1788–1801. [Google Scholar] [CrossRef] [PubMed]
- Cook C, Foster P. Epidemiology of glaucoma: what’s new? Can J Ophthalmol 2012;47:223-226.
- Collaborators GBaVI, Study VLEGotGBoD. Causes of blindness and vision impairment in 2020 and trends over 30 years, and prevalence of avoidable blindness in relation to VISION 2020: the Right to Sight: an analysis for the Global Burden of Disease Study. Lancet Glob. Health 2021, 9, e144–e160. [Google Scholar] [CrossRef] [PubMed]
- Kim, Y.K.; Ha, A.; Na, K.I.; Kim, H.J.; Jeoung, J.W.; Park, K.H. Temporal Relation between Macular Ganglion Cell–Inner Plexiform Layer Loss and Peripapillary Retinal Nerve Fiber Layer Loss in Glaucoma. Ophthalmology 2017, 124, 1056–1064. [Google Scholar] [CrossRef] [PubMed]
- Kim, Y.K.; Yoo, B.W.; Kim, H.C.; Park, K.H. Automated Detection of Hemifield Difference across Horizontal Raphe on Ganglion Cell–Inner Plexiform Layer Thickness Map. Ophthalmology 2015, 122, 2252–2260. [Google Scholar] [CrossRef] [PubMed]
- Lee, J.; Kim, Y.K.; Ha, A.; Kim, Y.W.; Baek, S.U.; Kim, J.-S.; Lee, H.J.; Kim, D.W.; Jeoung, J.W.; Kim, S.-J.; et al. Temporal Raphe Sign for Discrimination of Glaucoma from Optic Neuropathy in Eyes with Macular Ganglion Cell–Inner Plexiform Layer Thinning. Ophthalmology 2019, 126, 1131–1139. [Google Scholar] [CrossRef] [PubMed]
- Ha, A.; Kim, Y.K.; Kim, J.-S.; Jeoung, J.W.; Park, K.H. Temporal Raphe Sign in Elderly Patients With Large Optic Disc Cupping: Its Evaluation as a Predictive Factor for Glaucoma Conversion. Arch. Ophthalmol. 2020, 219, 205–214. [Google Scholar] [CrossRef] [PubMed]
- Yoshikawa, Y.; Shoji, T.; Kanno, J.; Ibuki, H.; Weinreb, R.N.; Araie, M.; Shinoda, K. Glaucomatous vertical vessel density asymmetry of the temporal raphe detected with optical coherence tomography angiography. Sci. Rep. 2020, 10, 1–9. [Google Scholar] [CrossRef] [PubMed]
- Huang, G.; Luo, T.; Gast, T.J.; Burns, S.A.; Malinovsky, V.E.; Swanson, W.H. Imaging Glaucomatous Damage Across the Temporal Raphe. Investig. Opthalmology Vis. Sci. 2015, 56, 3496–3504. [Google Scholar] [CrossRef] [PubMed]
- Bak, E.; Kim, Y.W.; Ha, A.; Kim, Y.K.; Park, K.H.; Jeoung, J.W. Pre-perimetric Open Angle Glaucoma with Young Age of Onset: Natural Clinical Course and Risk Factors for Progression. Arch. Ophthalmol. 2020, 216, 121–131. [Google Scholar] [CrossRef] [PubMed]
- Mohammadzadeh, V.; Fatehi, N.; Yarmohammadi, A.; Lee, J.W.; Sharifipour, F.; Daneshvar, R.; Caprioli, J.; Nouri-Mahdavi, K. Macular imaging with optical coherence tomography in glaucoma. Surv. Ophthalmol. 2020, 65, 597–638. [Google Scholar] [CrossRef] [PubMed]
- Hood, D.C. Improving our understanding, and detection, of glaucomatous damage: An approach based upon optical coherence tomography (OCT). Prog. Retin. Eye Res. 2017, 57, 46–75. [Google Scholar] [CrossRef] [PubMed]
- Kim KE, Jeoung JW, Park KH, Kim DM, Kim SH. Diagnostic classification of macular ganglion cell and retinal nerve fiber layer analysis: differentiation of false-positives from glaucoma. Ophthalmology 2015;122:502-510.
- Jonas, J.B.; Nguyen, N.X.; Naumann, G.O. The Retinal Nerve Fiber Layer in Normal Eyes. Ophthalmology 1989, 96, 627–632. [Google Scholar] [CrossRef] [PubMed]
- Hood, D.C.; Raza, A.S.; de Moraes, C.G.V.; Liebmann, J.M.; Ritch, R. Glaucomatous damage of the macula. Prog. Retin. Eye Res. 2013, 32, 1–21. [Google Scholar] [CrossRef] [PubMed]
Figure 3.
Representative case of a 48-year-old woman with unilateral glaucoma. The left panels show the color fundus photograph, visual field test results, macular ganglion cell complex (GCC) thickness map, and GCC significance map. The right panels display the corresponding asymmetry analyses obtained using the linearization program. The glaucomatous eye demonstrates elevated Vertical Asymmetry Score (V-Asy) and Quadrantal Asymmetry Score (Q-Asy) compared with the fellow normal eye (normal eye: V-Asy = 5.45, Q-Asy = 4.62; glaucomatous eye: V-Asy = 10.66, Q-Asy = 7.61). These findings illustrate the ability of the proposed asymmetry metrics to detect early macular structural damage associated with glaucoma.
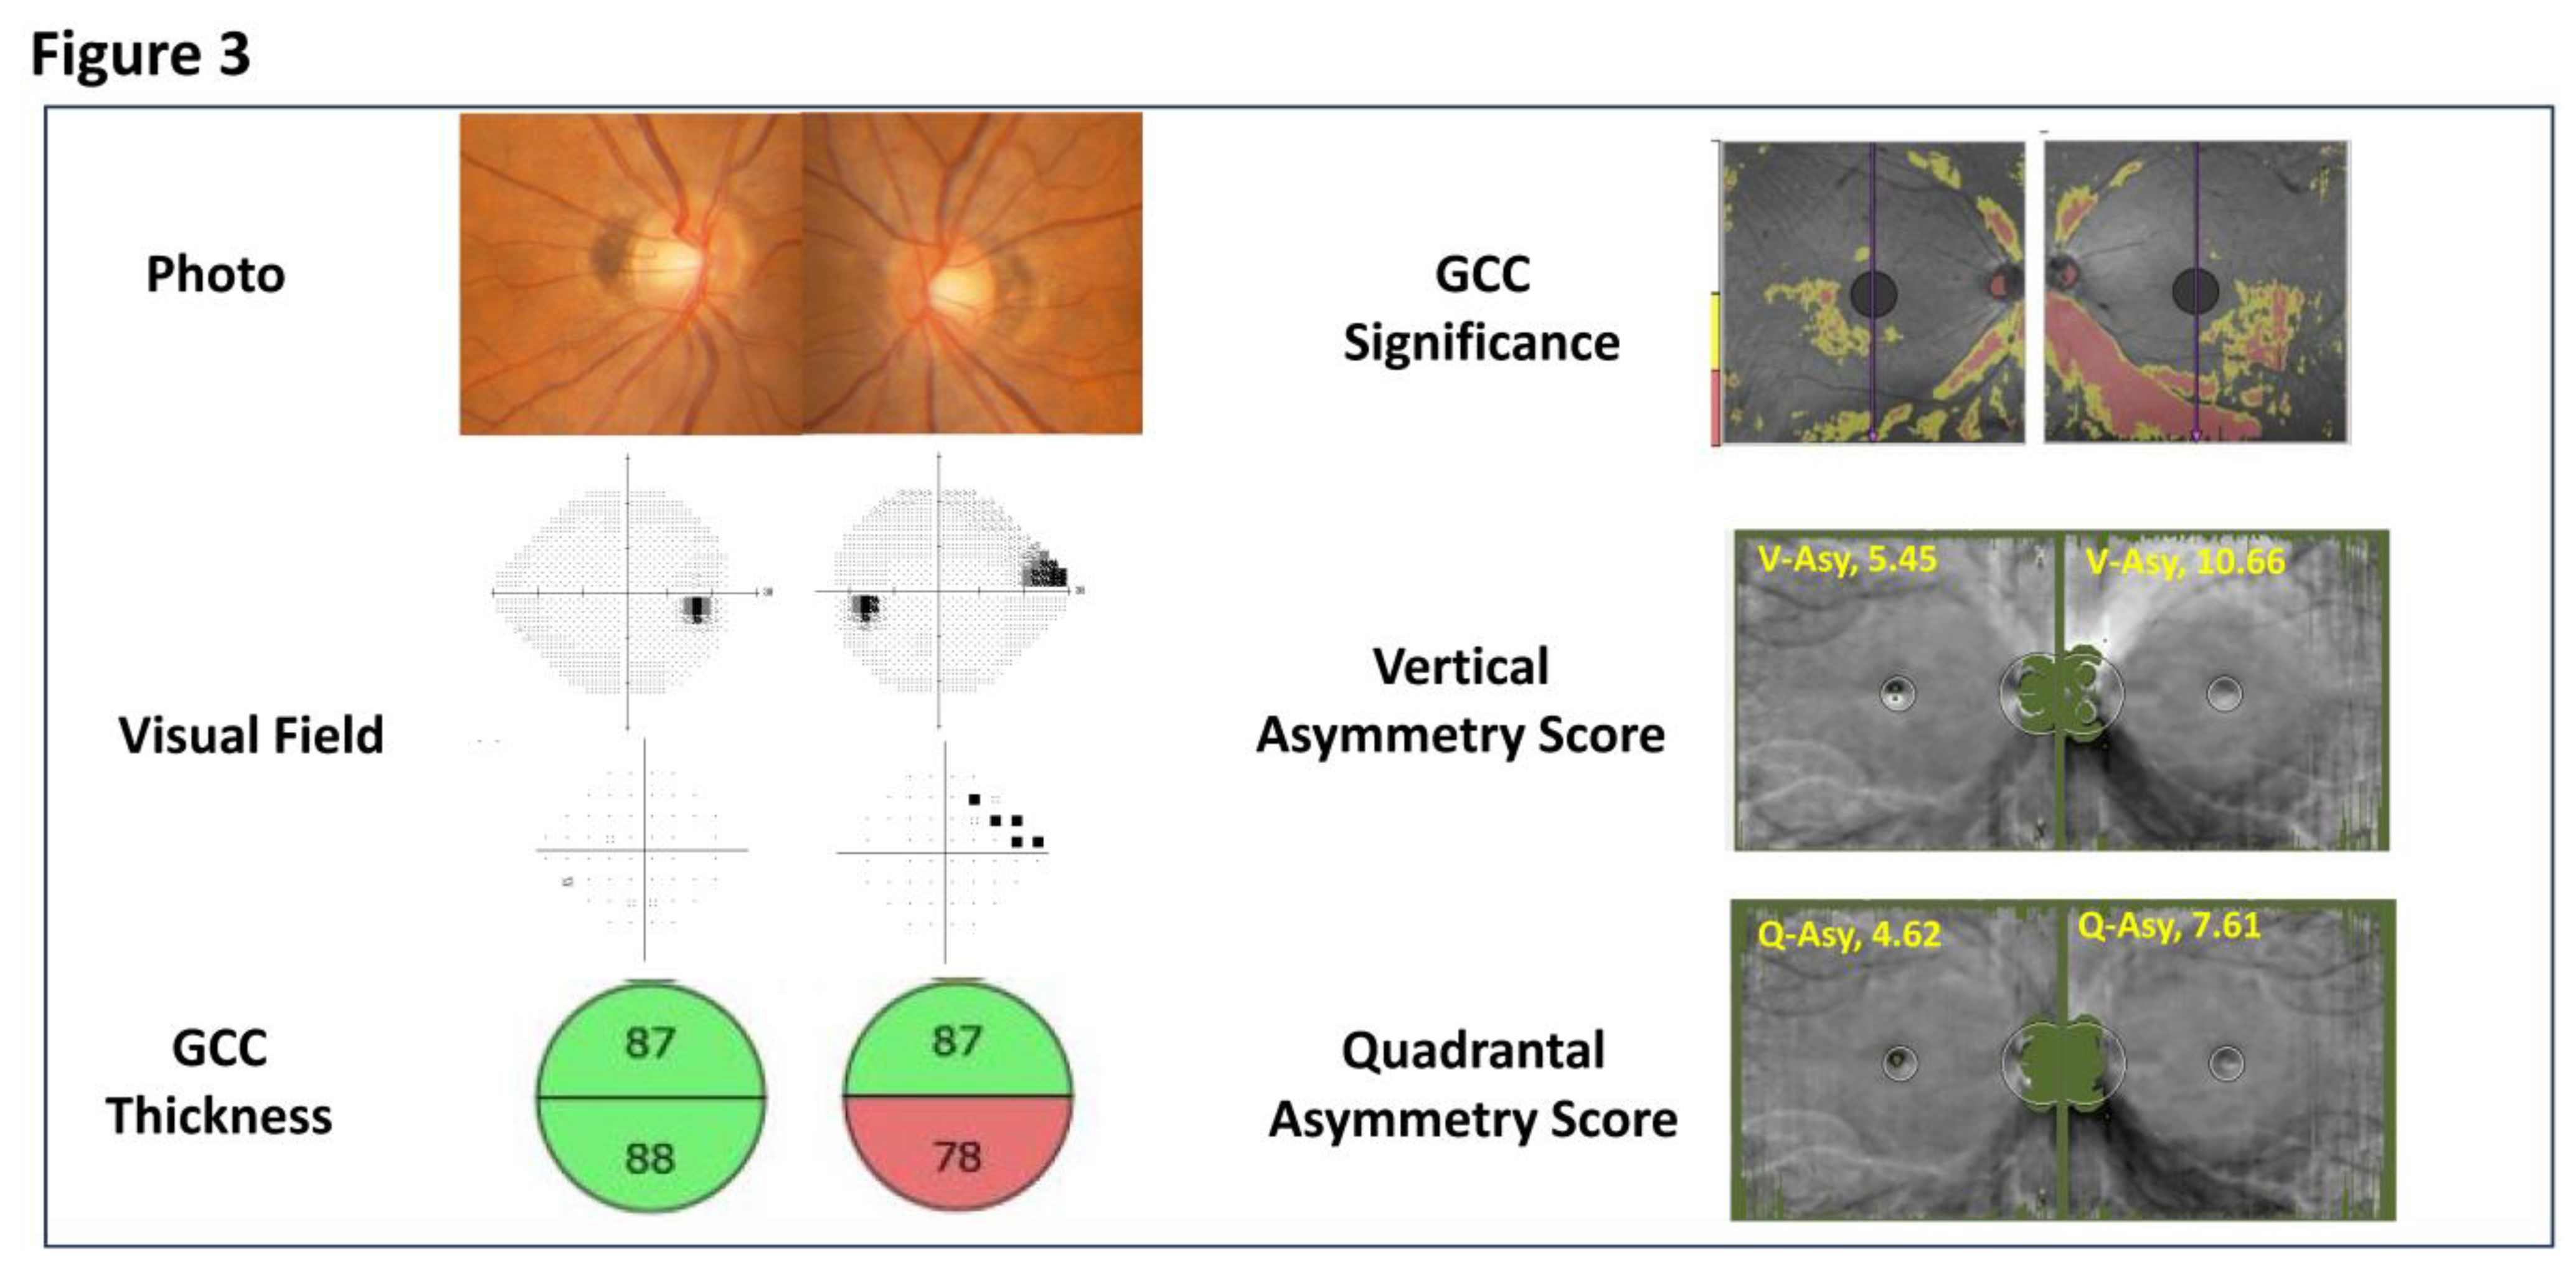
Figure 4.
Receiver operating characteristic (ROC) curves demonstrating the diagnostic performance of three macular OCT parameters for detecting glaucoma. The ROC curves compare the mean inner retinal thickness difference (Mean Difference), the Vertical Asymmetry Score, and the Quadrantal Asymmetry Score. The area under the curve (AUC) values were 0.743 for the Mean Difference, 0.967 for the Vertical Asymmetry Score, and 0.946 for the Quadrantal Asymmetry Score. Both the Vertical Asymmetry Score and Quadrantal Asymmetry Score showed markedly superior diagnostic accuracy compared with the conventional superior–inferior thickness difference measure.
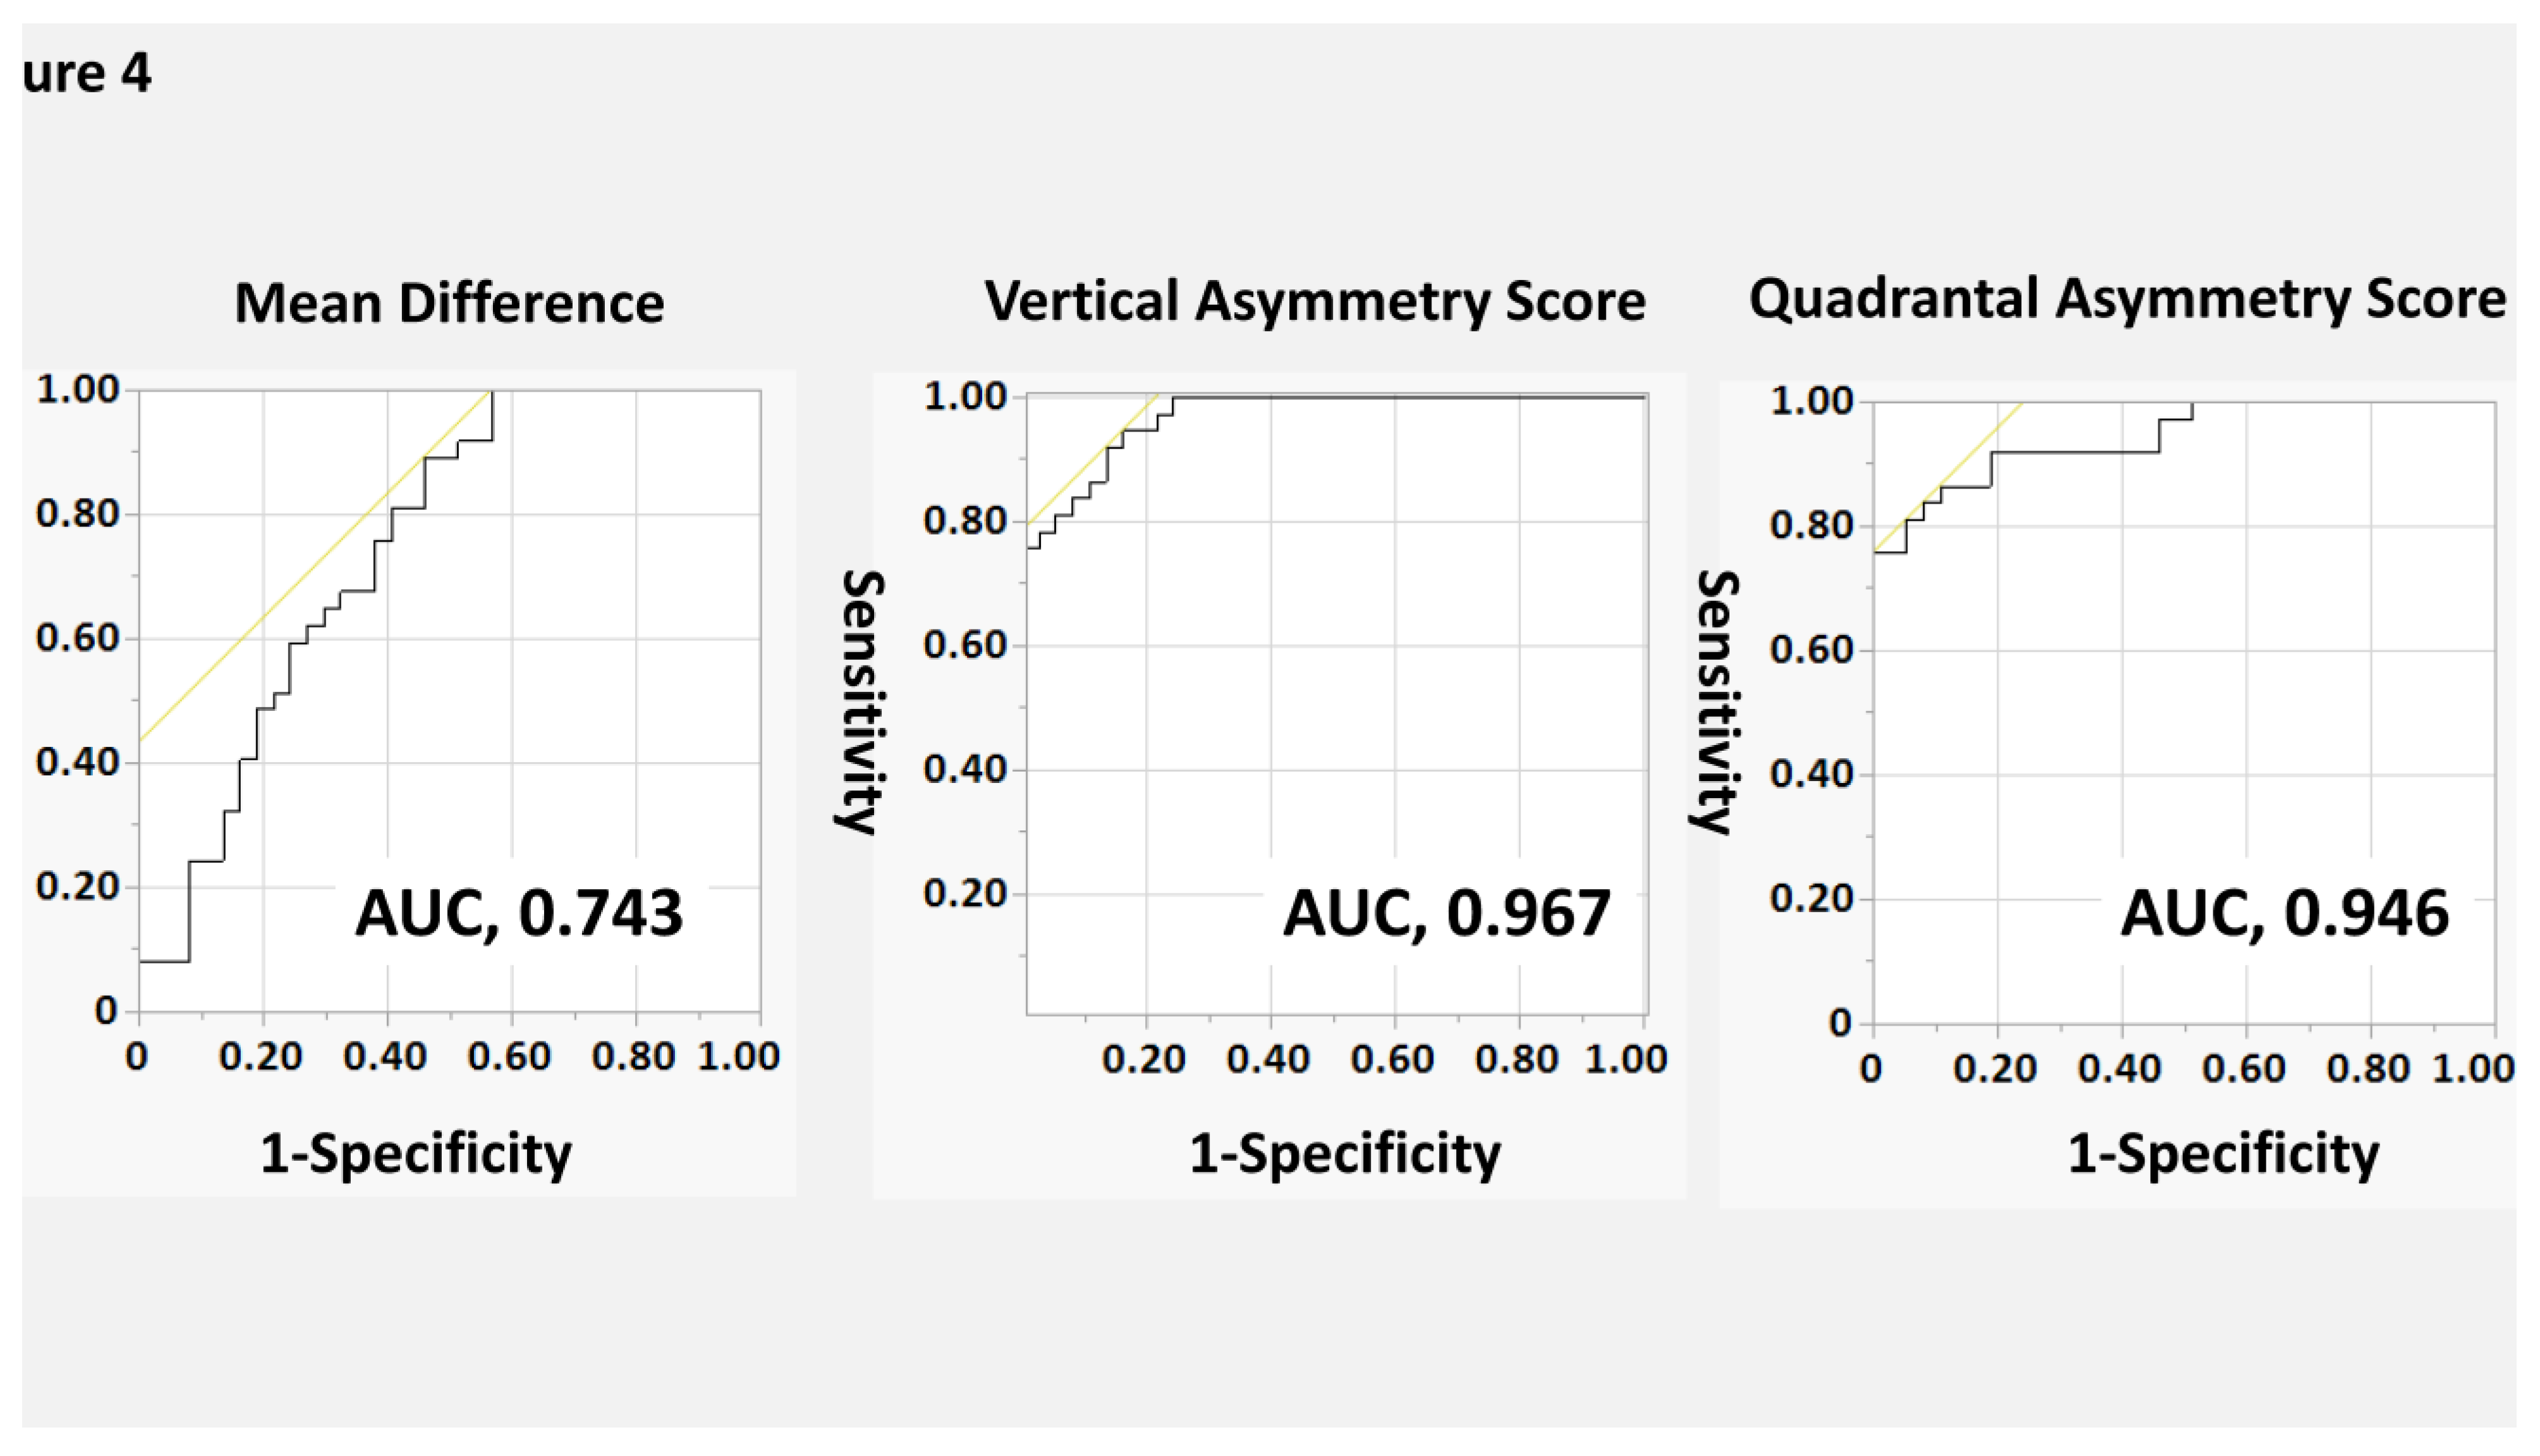

Table 1.
Demographic and Clinical Characteristics of the Study Participants.
| Healthy | Glaucoma | P value | |
| number of patients | 37 | ||
| Age (years) | 68 (50, 76) | ||
| Sex (male / female) | 14 / 23 | ||
| Axial length (mm) | 24.3 (23.1, 26.7) | 24.4 (23.2, 26.8) | 0.798 |
| Central corneal thickness (μm) | 521 ± 30 | 522 ± 36 | 0.980 |
| Visual acuity (Log MAR) | -0.08 (-0.08, -0.08) | -0.08 (-0.08, 0.03) | 0.186 |
| Introcular pressure (mmHg) | 13.6 ± 3.5 | 13.1 ± 4.6 | 0.636 |
| HFA 24-2 MD (dB) | 0.2 (-2.0, 0.7) | -4.7 (-11.7, -2.1) | <0.001 |
Abbreviations: HFA = Humphrey Field Analyzer; MD = Mean deviation; LogMAR = logarithm of the minimum angle of resolution. For normally distributed variables, results are shown as mean ± standard deviation; for non–normally distributed variables, results are shown as median (interquartile range). Data expressed as mean ± standard deviation were compared with paired t test. Data expressed as the median (interquartile range) were compared using the nonparametric Wilcoxon signed rank test. McNemar’s test was used to compare the frequencies of medication use between surgery group and non-surgery group.
Table 2.
Macular OCT Parameters in Normal and Glaucomatous Eyes.
| Variables | Healthy | Glaucoma | P value |
| Inner Retinal Thickness | |||
| Average (µm) | 93.4 (90.1, 98.5) | 80.3 (77.3, 85.0) | < 0.001 |
| Superior (µm) | 93.8 (90.2, 97.5) | 81.6 (76.6, 88.9)) | < 0.001 |
| Inferior (µm) | 93.5 (90.1, 98.4) | 78.4 (73.1, 88.6) | < 0.001 |
| Mean Difference (µm) | 2.66 (1.65, 5.17) | 6.94 (2.80, 12.54) | < 0.001 |
| Asymmetry Score | |||
| Vertical Asymmetry Score | 6.80 (6.15, 7.25) | 9.69 (9.16, 11.58) | < 0.001 |
| Quadrantal Asymmetry Score | 6.35 (5.94, 7.19) | 8.47 (8.11, 9.63) | < 0.001 |
Results are shown as median (interquartile range).
Table 3.
Diagnostic Performance of Macular OCT Parameters for Detecting Glaucoma.
| Variables | AUC (95%CI) | P value* | P value† |
| Mean Difference | 0.743 (0.627 - 0.859) | Reference | |
| Vertical Asymmetry Score | 0.967 (0.937 - 0.999) | < 0.001 | Reference |
| Quadrantal Asymmetry Score | 0.946 (0.898 - 0.994) | < 0.001 | 0.238 |
* P value when the reference value is the AUC of the mean difference; †P value when the reference value is the AUC of the vertical asymmetry score.
Disclaimer/Publisher’s Note: The statements, opinions and data contained in all publications are solely those of the individual author(s) and contributor(s) and not of MDPI and/or the editor(s). MDPI and/or the editor(s) disclaim responsibility for any injury to people or property resulting from any ideas, methods, instructions or products referred to in the content. |
© 2025 by the authors. Licensee MDPI, Basel, Switzerland. This article is an open access article distributed under the terms and conditions of the Creative Commons Attribution (CC BY) license (http://creativecommons.org/licenses/by/4.0/).
Copyright: This open access article is published under a Creative Commons CC BY 4.0 license, which permit the free download, distribution, and reuse, provided that the author and preprint are cited in any reuse.


