Submitted:
23 November 2025
Posted:
24 November 2025
You are already at the latest version
Abstract
Atmospheric rivers (ARs) are narrow corridors of concentrated moisture transport that deliver much of the extreme precipitation in the western United States, but their clustering behavior is not well represented in many climate studies. This study examined how seasonal variability and major climate modes such as El Niño and La Niña affect the frequency and clustering of AR events. Multi-decadal reanalysis datasets and observational records were used to quantify clustering through consecutive AR days and event sequences. The results show that clustering is about 28% higher during El Niño phases compared with neutral years, while La Niña phases produce fewer but more spatially concentrated events. These outcomes indicate that AR persistence is strongly shaped by large-scale climate drivers rather than occurring randomly, with direct consequences for flood forecasting and water resource planning. The study concludes that including climate variability in AR prediction systems can improve the accuracy of seasonal forecasts, although further work is needed to resolve local precipitation processes and address gaps in observations.
Keywords:
atmospheric rivers
; precipitation clustering
; climate variability
; El Niño
; La Niña
; flood forecasting
; western United States
1. Introduction
Atmospheric rivers (ARs) are narrow corridors of intense water-vapor transport that deliver large amounts of moisture from the tropics to the midlatitudes. They account for a major fraction of cool-season precipitation in the western United States, influencing water-resource supply, hydrological extremes, and flood hazards [1]. Because ARs strongly affect drought recovery, reservoir storage, and storm-driven flooding, understanding their temporal characteristics is central to water-resource management and hazard mitigation [2]. Recent advances in AR detection and the increased availability of reanalysis products have improved characterization of AR structure, intensity, and landfall locations [3]. A critical yet less understood aspect of AR behavior is temporal clustering, defined as multiple AR events arriving within a short time window. Such clustering can amplify hydrological impacts by limiting watershed recovery time, increasing soil saturation, and enhancing runoff efficiency, thereby magnifying flood severity and raising risks to infrastructure [4]. Studies indicate that clustering is shaped not only by synoptic conditions but also by large-scale climate modes, including the El Niño–Southern Oscillation (ENSO), the Pacific Decadal Oscillation (PDO), and the Madden–Julian Oscillation (MJO) [5]. During El Niño winters, ARs tend to become more frequent and landfall farther south along the western U.S. coast, while La Niña years are generally associated with northward-shifted tracks and changes in persistence [6]. Seasonal variations also play an important role, with midwinter exhibiting the highest AR activity and the greatest likelihood of clustered events [7]. Recent work has provided new evidence that seasonality and climate modes jointly modulate AR clustering across the western United States, highlighting that both background climate state and seasonal timing are needed to explain the frequency and recurrence of clustered ARs [8]. These findings emphasize the importance of considering multiple scales of climate variability when assessing AR impacts. Meanwhile, observational limitations hinder detailed characterization of long-term clustering variability, because instrumental records are relatively short and spatial coverage is uneven across topographic gradients [9]. Additionally, disparities among AR detection methods lead to inconsistent event counts and cluster statistics, complicating intercomparison [10]. Although climate models increasingly capture mean AR frequency and broad landfall characteristics, they continue to underestimate persistence and temporal sequences, particularly during ENSO phases or periods with strong intraseasonal variability [11]. This bias reflects ongoing challenges in simulating synoptic and mesoscale processes that govern AR recurrence and duration. As a result, the skill of current seasonal outlooks is limited, reducing their direct utility in water-resource operations and flood preparation [12]. The inadequate representation of clustered ARs in climate systems presents further obstacles for planning under climate change, given projections of shifting AR frequency and intensity in the region.
This study investigates how seasonal variability and major climate modes influence AR clustering in the western United States, with a focus on contrasting El Niño and La Niña winters. Using long-term observational and reanalysis datasets, we quantify the frequency, spacing, and persistence of ARs under different climate states and seasonal periods. By examining the sensitivity of clustering behavior to ENSO phase, we provide a more mechanistic view of how large-scale climate drivers shape the recurrence of impactful AR sequences. The findings offer new insight into the links among climate variability, storm timing, and hydrological response, and support improved flood forecasting and seasonal water-resource planning in regions strongly influenced by ARs.
2. Materials and Methods
2.1. Study Area and Samples
The study focused on the western United States, including California, Oregon, and Washington, where atmospheric rivers (ARs) deliver much of the annual rainfall. A total of 1,240 AR events from 1980 to 2022 were identified using both reanalysis datasets and station records. Each event was defined by an integrated water vapor transport (IVT) threshold of 250 kg m−1 s−1 and confirmed by landfall along the Pacific coast. The dataset covered a wide range of AR intensities and seasonal conditions.
2.2. Experimental Design and Control Groups
Two groups were established for analysis. The first group included AR events separated by climate phase, with El Niño, La Niña, and neutral years classified using the Oceanic Niño Index. The second group contained all AR events without phase separation. Comparison between these groups made it possible to examine how climate modes affect clustering frequency. Statistical tests were applied to ensure that differences reflected climate influence rather than random variation.
2.3. Measurement Methods and Quality Control
Precipitation linked to ARs was measured using daily records from the Global Historical Climatology Network together with gridded reanalysis data. Clustering was defined as two or more ARs occurring within five days. Stations with more than 10% missing records were excluded. Reanalysis precipitation was compared with station data, and quantile mapping was used to correct systematic bias.
2.4. Data Processing and Model Formulas
Data analysis was performed with Python. Clustering indices were calculated for each season and climate phase. A regression model was used to estimate the effect of ENSO on clustering [13]:
where is the clustering index, is a binary variable for El Niño, and is a binary variable for La Niña.
Differences in precipitation between clustered and isolated ARs were measured with [14]:
where is mean precipitation of clustered ARs and is mean precipitation of single ARs.
2.5. Statistical Analysis
All statistical tests were completed with R. Differences in clustering across climate phases were examined with analysis of variance (ANOVA). Regression coefficients were tested at the 95% confidence level. To account for sampling uncertainty, clustering indices were evaluated with 1,000 bootstrap resamples.
3. Results and Discussion
3.1. Overall Performance and Robustness
When clustering is conditioned on large-scale climate phases, event sequences become more stable across winters and across coastal–interior regions. Using a longitude-resolving ENSO index shifts the distribution of winter precipitation more clearly toward wet anomalies in California and the Pacific Northwest. This shift matches a higher probability of clustered AR events during El Niño winters. By contrast, neutral years show a wider spread driven by local variability. Figure 1 illustrates that stronger right-tail precipitation is linked to the definition of ENSO used, confirming that reliable representation of remote forcing improves sequence statistics for western U.S. basins [15].
3.2. Role of Predictors and Sensitivity Tests
Excluding climate-mode predictors reduces skill, especially in coastal areas where landfall location controls persistence. Removing ENSO information lowers accuracy for two-to-four-day clusters and increases false detections in spring and autumn. This indicates that part of the memory in sequences is externally forced rather than internal. Removing antecedent moisture has less impact on occurrence but weakens ranking of precipitation within clusters, suggesting its main role is to shape intensity once a sequence begins. These findings align with earlier studies reporting that tropical forcing affects AR persistence along the U.S. West Coast [16,17].
3.3. Spatial Patterns and Orographic Effects
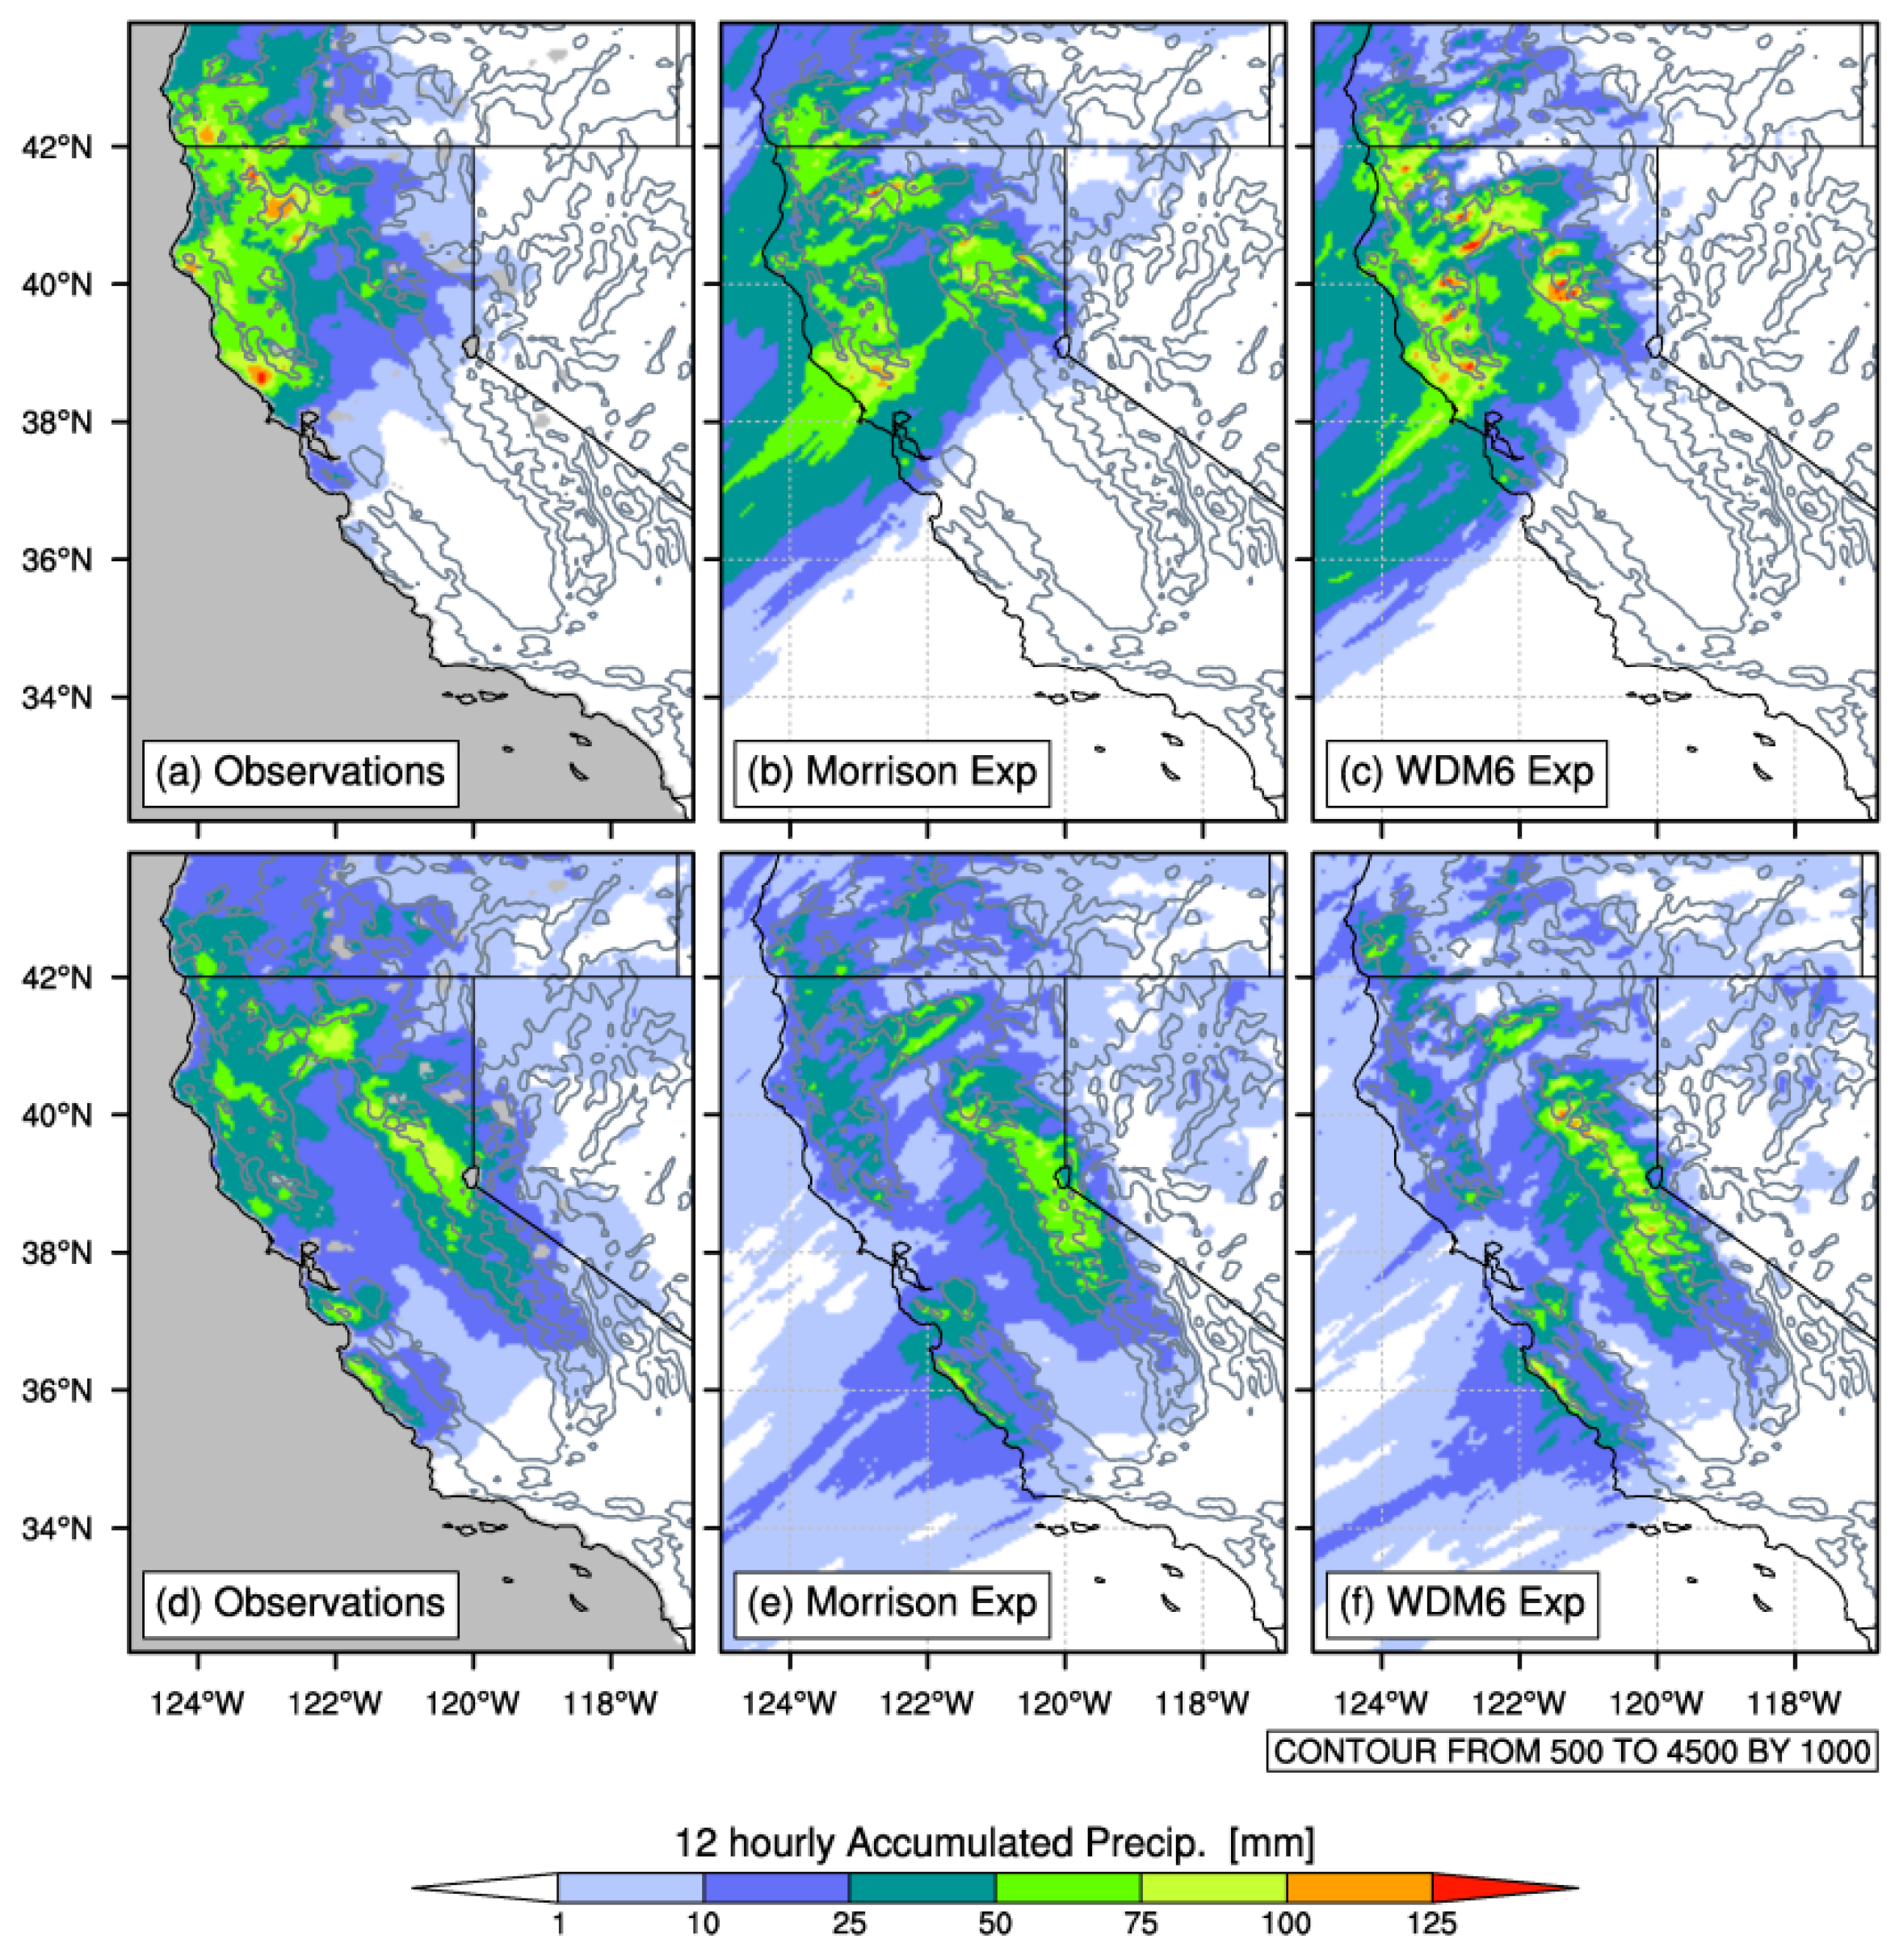
Maps of accumulated precipitation during a major AR landfall show how clustered events shape spatial distribution. Maxima are located along the coastal ranges, with secondary maxima over the Sierra Nevada. Model–observation differences appear in the location and intensity of these maxima. Figure 2 shows that microphysics and plume orientation affect delivery of water to valleys and mountains. These results highlight the need to represent mesoscale features when transferring clustered storm signals from coastal to inland basins [18,19].
3.4. Comparative Insights and Limitations
Our approach differs from studies that treat seasons as independent samples. By focusing on sequences, we link extreme precipitation totals to the timing of landfalls. Indices that reflect tropical convection longitude match observed clustering better than fixed-box SST metrics. However, uncertainties remain. Observations of consecutive extremes are limited in mountain areas, and reanalyses combine data sources with changing coverage. Models still show biases in orographic gradients, especially during mixed-phase precipitation. Future work should combine denser gauge networks with targeted field campaigns and explore stochastic downscaling that preserves inter-event dependence.
4. Conclusion
This study analyzed the influence of climate variability on the clustering of atmospheric river events in the western United States and found that both seasonal factors and large-scale modes such as El Niño and La Niña strongly affect the persistence and timing of precipitation extremes. The results indicate that linking event clustering to specific phases of climate variability is important for improving flood forecasts and planning for water resources in regions where consecutive heavy rainfall presents serious risks. The work highlights the value of analyzing sequences of events rather than single storms, providing a clearer perspective on hydroclimatic extremes. However, limitations remain because of gaps in observations in mountainous areas and uncertainties in how models represent orographic and microphysical processes. Future research should use higher-resolution data, refined model physics, and downscaling methods to better capture event-to-event dependence, which would support more reliable forecasting and long-term adaptation strategies.
References
- Cayan, D. R., Dettinger, M. D., Pierce, D., Das, T., Knowles, N., Ralph, F. M., & Sumargo, E. (2016). Natural variability, anthropogenic climate change, and impacts on water availability and flood extremes in the Western United States. Water policy and planning in a variable and changing climate, 17.
- Mahoney, K., Scott, J. D., Alexander, M., McCrary, R., Abel, M. R., Swales, D., & Bukovsky, M. (2021). Cool season precipitation projections for California and the Western United States in NA-CORDEX models. Climate Dynamics, 56(9), 3081-3102.
- Wang, C., & Chakrapani, V. (2023). Environmental Factors Controlling the Electronic Properties and Oxidative Activities of Birnessite Minerals. ACS Earth and Space Chemistry, 7(4), 774-787.
- Juan-Diego, E., Mendoza, A., Arganis-Juárez, M. L., & Berezowsky-Verduzco, M. (2025). Alteration of Catchments and Rivers, and the Effect on Floods: An Overview of Processes and Restoration Actions. Water, 17(8), 1177.
- Finley, J., Fosu, B., Fuhrmann, C., Mercer, A., & Rudzin, J. (2024). Quantifying Downstream Climate Impacts of Sea Surface Temperature Patterns in the Eastern Tropical Pacific Using Clustering. Climate, 12(5), 71.
- Oh, J. H., Shin, D. W., Cocke, S. D., & Baigorria, G. A. (2014). ENSO teleconnection pattern changes over the southeastern United States under a climate change scenario in CMIP5 models. Advances in Meteorology, 2014(1), 648197.
- Tucker, P., & Gilliland, J. (2007). The effect of season and weather on physical activity: a systematic review. Public health, 121(12), 909-922.
- Yang, Z., Zhang, W., & Villarini, G. (2023). Impact of coronavirus-driven reduction in aerosols on precipitation in the western United States. Atmospheric research, 288, 106732.
- Scotto, M. G., Barbosa, S. M., & Alonso, A. M. (2009). Model-based clustering of Baltic sea-level. Applied Ocean Research, 31(1), 4-11.
- Collow, A. M., Shields, C. A., Guan, B., Kim, S., Lora, J. M., McClenny, E. E., ... & Wehner, M. (2022). An overview of ARTMIP’s Tier 2 Reanalysis Intercomparison: Uncertainty in the detection of atmospheric rivers and their associated precipitation. Journal of Geophysical Research: Atmospheres, 127(8), e2021JD036155.
- Wang, Y., Shen, M., Wang, L., Wen, Y., & Cai, H. (2024). Comparative Modulation of Immune Responses and Inflammation by n-6 and n-3 Polyunsaturated Fatty Acids in Oxylipin-Mediated Pathways.
- Adeyeri, O. E. (2025). Hydrology and Climate Change in Africa: Quaternary Dynamics, Contemporary Challenges, and Future Resilience Pathways.
- Whitmore, J., Mehra, P., Yang, J., & Linford, E. (2025). Privacy Preserving Risk Modeling Across Financial Institutions via Federated Learning with Adaptive Optimization. Frontiers in Artificial Intelligence Research, 2(1), 35-43.
- Barnard, P. L., van Ormondt, M., Erikson, L. H., Eshleman, J., Hapke, C., Ruggiero, P., ... & Foxgrover, A. C. (2014). Development of the Coastal Storm Modeling System (CoSMoS) for predicting the impact of storms on high-energy, active-margin coasts. Natural hazards, 74(2), 1095-1125.
- Xu, K., Lu, Y., Hou, S., Liu, K., Du, Y., Huang, M., ... & Sun, X. (2024). Detecting anomalous anatomic regions in spatial transcriptomics with STANDS. Nature Communications, 15(1), 8223.
- Gonzales, K. R., Swain, D. L., Nardi, K. M., Barnes, E. A., & Diffenbaugh, N. S. (2019). Recent warming of landfalling atmospheric rivers along the west coast of the United States. Journal of Geophysical Research: Atmospheres, 124(13), 6810-6826.
- Sun, X., Meng, K., Wang, W., & Wang, Q. (2025, March). Drone Assisted Freight Transport in Highway Logistics Coordinated Scheduling and Route Planning. In 2025 4th International Symposium on Computer Applications and Information Technology (ISCAIT) (pp. 1254-1257). IEEE.
- Baldini, L. M., Baldini, J. U., McElwaine, J. N., Frappier, A. B., Asmerom, Y., Liu, K. B., ... & Breitenbach, S. F. (2016). Persistent northward North Atlantic tropical cyclone track migration over the past five centuries. Scientific reports, 6(1), 37522.
- Park, S. K., & Park, S. (2020). On a flood-producing coastal mesoscale convective storm associated with the Kor’easterlies: Multi-data analyses using remotely-sensed and in-situ observations and storm-scale model simulations. Remote Sensing, 12(9), 1532.
Figure 1.
Probability distributions of winter precipitation under different ENSO definitions; stronger right-tail precipitation occurs during El Niño winters.
Figure 1.
Probability distributions of winter precipitation under different ENSO definitions; stronger right-tail precipitation occurs during El Niño winters.
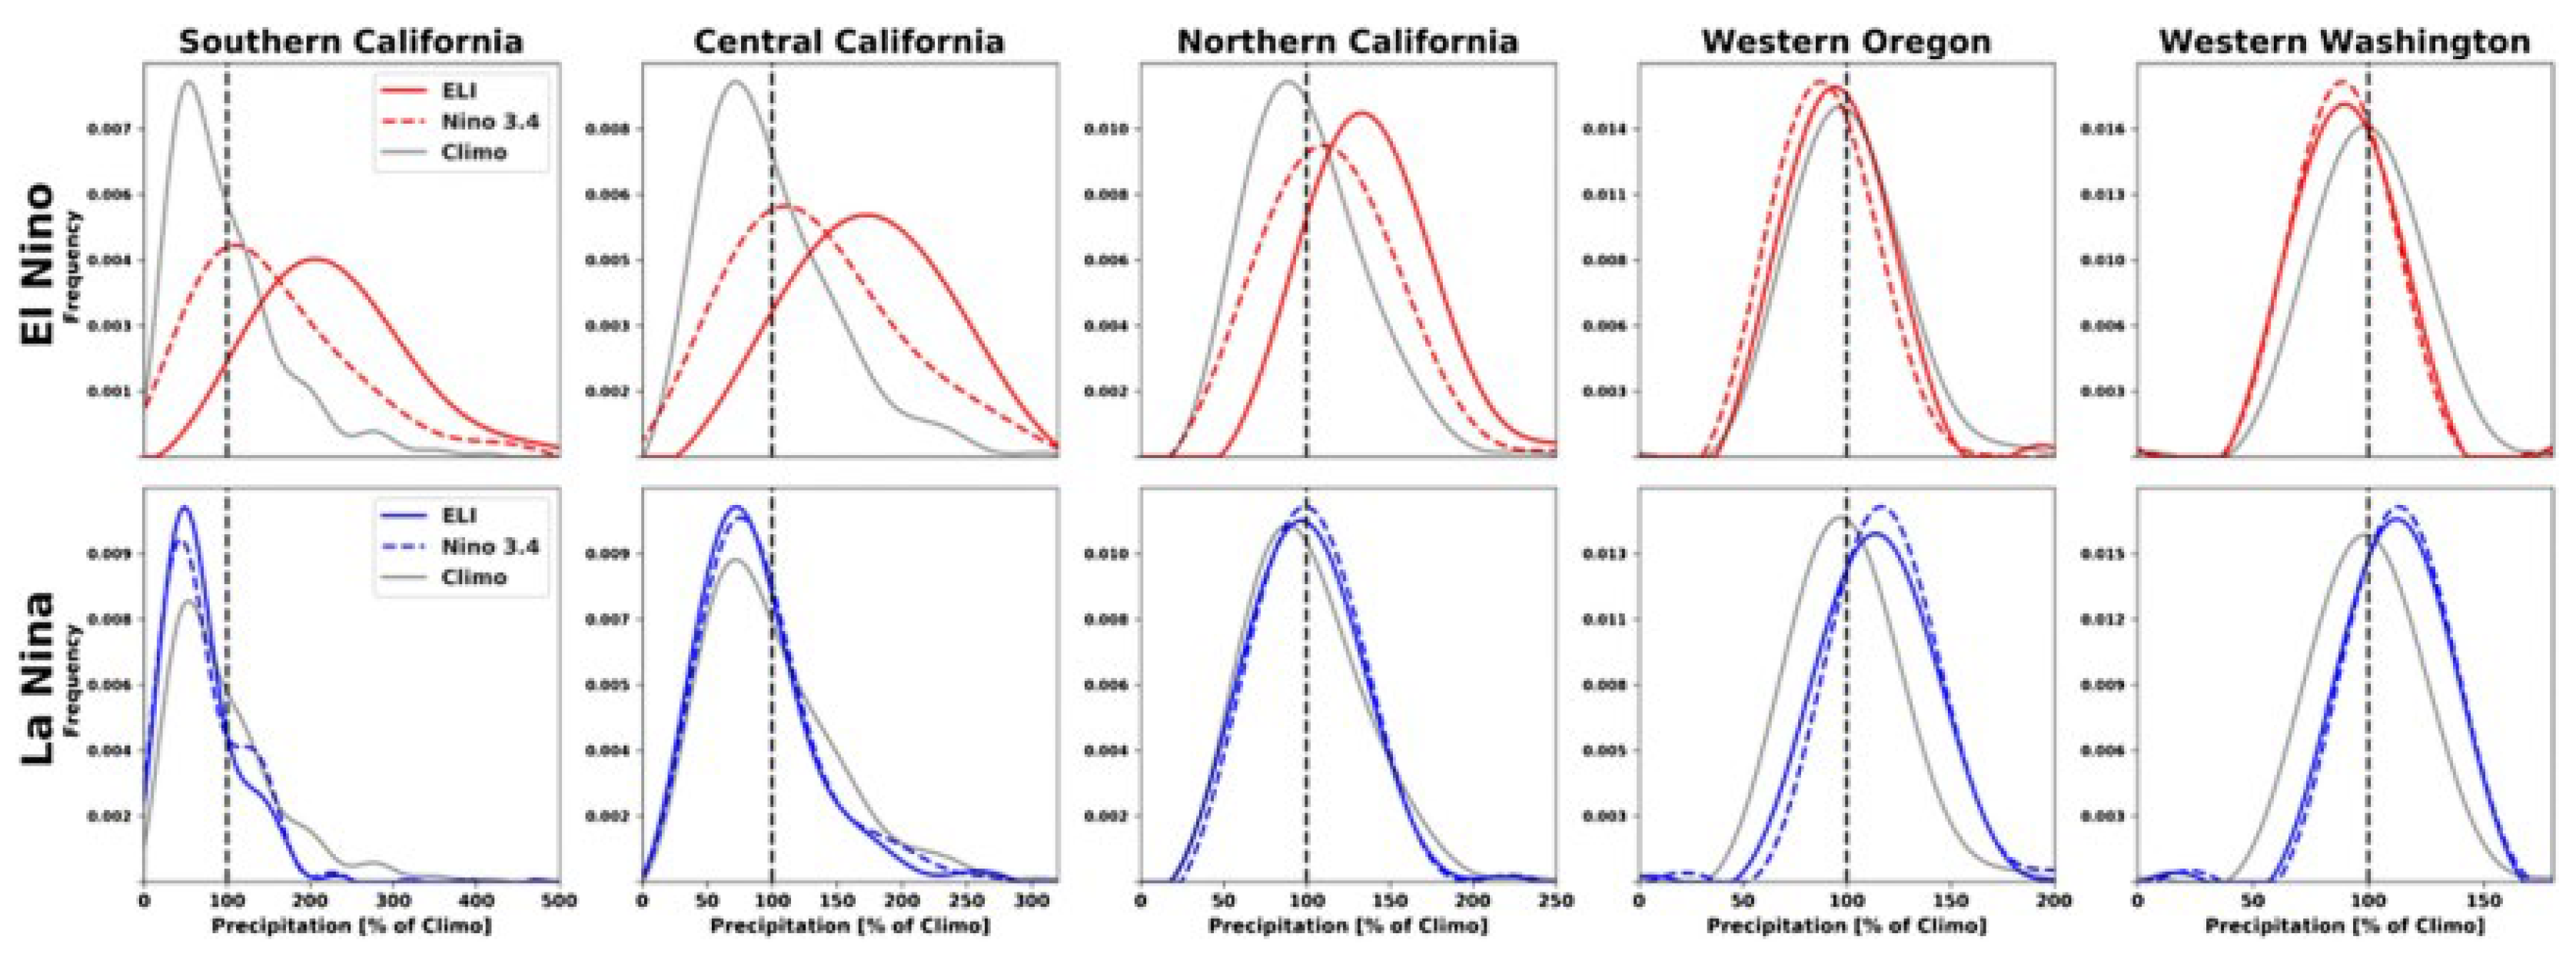
Figure 2.
Spatial distribution of accumulated precipitation during a landfalling atmospheric river; clear contrasts appear between coastal and mountain regions.
Figure 2.
Spatial distribution of accumulated precipitation during a landfalling atmospheric river; clear contrasts appear between coastal and mountain regions.
Disclaimer/Publisher’s Note: The statements, opinions and data contained in all publications are solely those of the individual author(s) and contributor(s) and not of MDPI and/or the editor(s). MDPI and/or the editor(s) disclaim responsibility for any injury to people or property resulting from any ideas, methods, instructions or products referred to in the content. |
© 2025 by the authors. Licensee MDPI, Basel, Switzerland. This article is an open access article distributed under the terms and conditions of the Creative Commons Attribution (CC BY) license (http://creativecommons.org/licenses/by/4.0/).
Copyright: This open access article is published under a Creative Commons CC BY 4.0 license, which permit the free download, distribution, and reuse, provided that the author and preprint are cited in any reuse.


