
Submitted:
21 November 2025
Posted:
26 November 2025
You are already at the latest version
Abstract
The paper discusses the evolution of convolutional (CNN) and recurrent (RNN) artificial neural networks in applications for Building Information Modeling (BIM). The paper outlines the milestones observed in the last two decades. The article organizes the current state of knowledge and technology in terms of three aspects: (1) computer visualization coupled with BIM models (detection, segmentation, and quality verification in images, videos, and point clouds), (2) sequence and time series modeling (prediction of costs, energy, work progress, risk), (3) integration of deep learning results with the semantics and topology of Industry Foundation Classes (IFC) models. The paper identifies the most used architectures, typical data pipelines (synthetic data from BIM models, transfer learning, mapping results to IFC elements) and practical limitations: lack of standardized benchmarks, high annotation costs, domain gap between synthetic and real data, and discontinuous interoperability. We indicate directions for development: combining CNN/RNN with graph models and transformers for wider use of synthetic data and semi-/supervised learning, as well as explainability methods that increase trust in AECOO (Architecture, Engineering, Construction, Owners & Operators) processes. A practical case study presents a new application, Bimetria, which uses a hybrid CNN/OCR (Optical Character Recognition) solution to generate 3D models with estimates based on two-dimensional drawings. A deep review shows that although the importance of attention-based and graph-based architectures is growing, CNN and RNN remain an important part of the BIM process, especially in engineering tasks requiring stability and low latency. The paper also raises some fundamental questions to which we are still seeking answers. Thus, the article not only presents the innovative new Bimetria tool but also aims to stimulate discussion about the dynamic development of AI (Artificial Intelligence) in BIM.
Keywords:
uilding information modeling
; CNN
; RNN
; OCR
; IFC
; AECOO
; artificial intelligence
; Bimetria
1. Introduction
Over the last two decades, Building Information Modeling (BIM) has emerged as the fundamental paradigm for the digitization of the broadly understood construction industry – AECOO (Architecture, Engineering, Construction, Owners & Operators) [1]. BIM combines geometric data, semantics (high-level relationships), and non-graphical data into coherent, shared models that support decision-making from the concept and design stage, through project implementation, to the maintenance and operation stage [2,3]. At the same time, there has been a strong evolution in artificial neural networks [4]. Convolutional Neural Networks (CNN) have become the standard in spatial-visual tasks [5], and Recurrent Neural Networks (RNN) in sequence and time series modeling [6]. The convergence of the relative maturity of BIM ecosystems with the maturity of CNN/RNN has triggered a wave of applications that promise automation, scalability, and greater efficiency of engineering processes.
Despite significant progress, the evolution of Artificial Intelligence (AI) is still ongoing, and new obstacles are being overcome [7]. However, there is a lack of standardized benchmarks dedicated to BIM tasks [8], the cost of annotation in native environments is high, and the differences between synthetic data (generated from models) and real data (from construction sites, scans, photos) make it difficult to transfer new solutions into practice [9]. In addition, the lack of seamless interoperability and different versions of IFC (Industry Foundation Classes) standards complicates the replicability and comparability of results [10], and the limited “explainability” of AI models undermines confidence in applications critical to key costs or schedules [11], which are most important in the construction investment process. At the same time, the only source of truth, the so-called CDE (Common Data Environment), does not always function well in investment processes [12], which hinders the development of SaaS (Software as a Service). These barriers point to the need for work that will not only present existing solutions but also organize the evolution and ask questions to which we still do not know the answers.
The aim of this article was to conduct a synthetic review of the literature related to the evolution of CNN and RNN in BIM applications and to organize the current state of knowledge in three complementary perspectives: (1) computer visualization coupled with BIM models (detection, segmentation, and quality verification in images, videos, and point clouds), (2) sequence and time series modeling (prediction of costs, energy, work progress, and risk), (3) integration of deep learning results with the semantics and topology of IFC models. In each of these areas, the dominant architectures, typical data flows (including the use of synthetic data and learning methods), and a set of evaluation metrics used in practice were identified. At the same time, limitations and gaps that hinder the large-scale implementation of BIM–AI were pointed out.
The article is not only review-oriented but also discussion-oriented. Several fundamental questions are posed that will determine the direction of research and practice in the coming years. The research questions are as follows:
- When are classic CNN/RNN sufficient for BIM tasks, and when do models that explore relationships and attention (transformers) give an advantage?
- How can model predictions be linked to IFC elements and relationships so that they are operationalizable in workflows and CDE systems?
- What balance between synthetic and real data minimizes the domain gap while reducing the already high cost of annotation?
- What XAI (Explainable AI) mechanisms are practically useful for engineers and how can their value be measured?
- What are the minimum requirements (data schemas, APIs, metrics) needed to make results comparable and transferable between tools?
The contribution of this work is a synthesis of scattered results into a coherent typology of tasks and methods, facilitating the selection of architectures for BIM problems. The research identified implementation barriers and formulated directions for development: combining CNN/RNN with graph models and transformers, wider use of synthetic data and semi-supervised and unsupervised learning, and the implementation of “explainability” methods as a standard of good practice in AEC.
The structure of the article is as follows. Section 1 covers the Introduction, section 2 presents theoretical background and terminology, as well as the origins and evolution of CNN/RNN. Section 3 discusses the new Bimetria (CNN) tool – its operation and pipeline. Section 4 discusses future research directions, identifies limitations, gaps, and challenges, and attempts to answer the fundamental questions posed. Section 5 presents recommendations and conclusions.
2. Evolution of CNN/RNN
The first concepts of neural networks dominated until the 1990s, but computational limitations and the vanishing gradient problem hampered the development of deep architectures. Convolutions became standard in images (LeCun/LeNet-5 ideas) [13], but their potential only fully revealed itself in the era of GPUs and big data. In 2012, a major milestone was reached with the “AlexNet” network by Krizhevsky, Sutskever, and Hinton [14]. Their model outperformed the competition in ImageNet, demonstrating that deep CNNs radically improve image classification quality through scaling. Since then, we have seen an avalanche of similar architectures. The following can be considered further milestones in the development of CNNs and RNNs:
- 2013 – word2vec by Tomas Mikolov et al. [15];
- 2014 – seq2seq Sutskever, Vinyals, Le [16];
- 2016 – AlphaGo (DeepMind) [17];
- 2017 – Transformer (“Attention Is All You Need”) as a milestone in the architecture behind GPT-x [18];
- 2018 – GPT1 – the first LLM from OpenAI [19];
- 2019 – GPT2 (described in the media as “too dangerous to release”) [20];
- 2022 – GPT3.5 – public debut of ChatGPT on November 30, 2022 [21];
- 2023 – GPT4 – “Sparks of Artificial General Intelligence” [22];
- 2025 – GPT5 – with a built-in “thinking” mode, whose approach corresponds to the concept of System 2 (Kahneman) [23] used in the description of reasoning models.
Key events are mapped on the timeline in Figure 1.
As a result, BIM has access to CNN components that enable the detection and segmentation of structural elements, quality control in images or videos, and the integration of results with IFC models. At the same time, RNNs were also developing. For example, LSTM/GRU models (2014) established the standard for modeling time series and event sequences, and seq2seq (2014) showed how to map variable-length sequences to other sequences. The introduction of the attention mechanism (2014) shifted the emphasis to dynamic weighting of time steps, which improved performance and stability. For BIM, this translated into forecasting delays, costs, energy, and analysis of operational logs/records throughout the life cycle of a building.
With the advent of AlphaGo (a system combining deep CNN with reinforcement learning and tree search, which defeated champion Lee Sedol), it was proven that the combination of perception (CNN), memory/planning, and expert data scales to tasks with astronomical state space. AlphaGo Zero went even further, learning “from scratch” solely through self-play. Although Go has nothing to do with BIM, these milestones have changed the mental model of system design, as instead of solely supervised pipelines, the role of feedback, simulation, and decision policies is growing, which in turn translates into planning, scheduling, and active learning on synthetic data in AECOO.
The evolution can be seen as three eras in the development of BIM-AI (Figure 2):
- 2D perception (2012–2016) including CNN (AlexNet→ResNet, U-Net) and detection/segmentation of elements in images and videos, including the first linking to BIM.
- Sequences and decisions (2014–2017) including LSTM/GRU with attention mechanisms and cost/deadline forecasting, as well as the integration of predictions with decisions and policies.
- Geometry and relations (2017 to present) covering PointNet/GNN/sparse-3D solutions and the important HR-Net [24], including direct work on point clouds and IFC graphs, and the maturation of self-supervised methods.
CNNs remain the backbone choice for visual tasks, especially where stability and low latency are important. RNNs (LSTM/GRU) are still practical for time series and event logs, although some tasks are being taken over by attention architectures. Geometric DL (GNN/3D) is crucial when predictions must be topologically and semantically consistent with IFC. Self-/semi-supervised + synthetics are the most effective response to benchmark deficiencies and high annotation costs.
3. Example of Bimetria
This chapter presents a practical implementation of the previously discussed concepts of deep learning in the context of BIM, namely the Bimetria system. The aim is to show how the combination of convolutional neural networks (CNN) and optical character recognition (OCR), supported by domain rules and a geometric reconstruction stage, can automate the transition from 2D drawings in the form of scans or PDF files to structured information about a building object and to an IFC model ready for use in AECOO processes. This example complements the literature review with a practical dimension, highlighting the trade-offs between accuracy and stability, limitations due to data quality and diversity, and architectural decisions dictated by engineering design requirements.
At a high level, Bimetria implements a processing chain that includes preliminary cleaning and normalization of drawing sheets, detection and segmentation of graphic elements such as symbols, lines, and dimensions using CNN models, extraction of descriptive content and dimensional numbers using OCR methods, merging of geometric and semantic information, reconstruction of three-dimensional elements along with their parameterization, mapping to IFC classes and relations, followed by data integrity validation and export of results. The system in question takes a pragmatic approach that includes transfer learning, semi-supervised labeling, and consistency checking rules, which together allow for repeatable results in production conditions.
3.1. Input Data
The starting point for the Bimetria pipeline is a single 2D drawing sheet (Figure 3), which is the source of geometric and semantic information used to reconstruct the 3D model. A 2D drawing usually contains layers of a mixed nature: construction graphics, installation symbols, dimensions, text descriptions, legends, and title blocks. In practice, both vector PDF files and raster PDF, PNG, and JPEG files (including scans and photos of sheets) can be fed into the system. The goal of the actions embedded in the system is to obtain an image with stable visual properties, in which the topological relationships between lines, symbols, and text are not blurred.
To obtain results that are as close to reality as possible at the outset, the user defines information about the storeys by adding or subtracting records and entering the necessary data. For each storey to be analyzed, the ordinates of the base and top of the structural and partition walls should be assigned.
In the circulation of documentation, it often happens that projections are transmitted in the form of scans or photographs of printed sheets, which are captured in a perspective that distorts the drawing. Therefore, the first step is to straighten the image. This is done using a dedicated straightening tool, which, after the user has marked four corners of a known rectangle, gives the projection an appearance like the original drawing.
The next step in preparing the image is to improve its readability using ESRGAN [25], a machine-trained model for improving the quality of raster images. This stage involves correcting the sharpness of lines and characters, and for scans or photos with uneven lighting, brightness adjustment is used.
To later map to IFC, it is crucial to preserve information about units and scales, so the user first assigns a scale to the drawing by calibrating the design using dimensions in two perpendicular axes.
This set of input data is standardized, described with metadata, and enriched with reliable annotations, thus providing CNN models and the OCR component with the conditions for stable detection of 2D elements and for subsequent deterministic transfer of information to 3D space in the BIM environment and IFC structures. As a result, a single 2D drawing becomes a fully-fledged knowledge carrier that can be transformed into a coherent, parametric model used in further stages of the design process.
3.2. Image Recognition Model
The image recognition process begins with dividing the image into square tiles, which optimize the model’s performance and are used to calculate the number of times the application is used by the user. From this point on, the processes related to the recognition of elements in images take place on separate parts, thus minimizing the risk of failure of the operation due to the large size of the input data.
The core of Bimetria is a two-stage image recognition model tailored to the specifics of technical drawings. The first part is segmentation based on a network that allows for the stable separation of three types of regions: walls with columns, openings, and the background constituting the rest of the drawing. The direct results of image recognition have imperfections resulting from the prediction process, which is why they are immediately subjected to automatic analysis and correction to generate output data in the form of rectangles with appropriate dimensions and angles while maintaining the relationships between elements (Figure 4).
The model was trained in a multi-task scheme. The model’s performance was designed for production use. The model uses quantization and agile convolution blocks, which enables the processing of large sheets in a time acceptable to the user using appropriate GPU (Graphics Processing Unit) cloud resources. Stability between drawing versions was achieved through input normalization and color calibration mechanisms. In the second stage of image recognition, the model separates masonry walls from reinforced concrete elements and distinguishes between windows and doors (Figure 5).
The third stage of data recognition on projections is an add-on to the model that is the core of the OCR application, which analyzes the image for text data. The model recognizes letters and numbers that carry information and then selects those that are relevant to the recognized elements. Information is filtered based on both content and geometric position. Ultimately, parameters such as the height and width of openings and the height of windowsills are selected.
After the data in the images have been recognized, the coordinates of the elements in the form of the beginning and end of the axes and the thickness of the elements are generated on the basis of the generated raster data on walls, reinforced concrete elements, windows, and doors. The elements are assigned parameters read by OCR, and a JSON file is created to store all this information in a specific structure.
3.3. Verification of Results
After completing all stages related to the recognition of elements and information on the input data, the user has the option to verify the results. This is done on the basis of vector data displayed on the input image. At this stage, the user has the option to add missing elements, remove redundant elements, and edit parameters. Once the user approves the design, the data in the JSON file is updated.
3.3. Quantity Takeoff
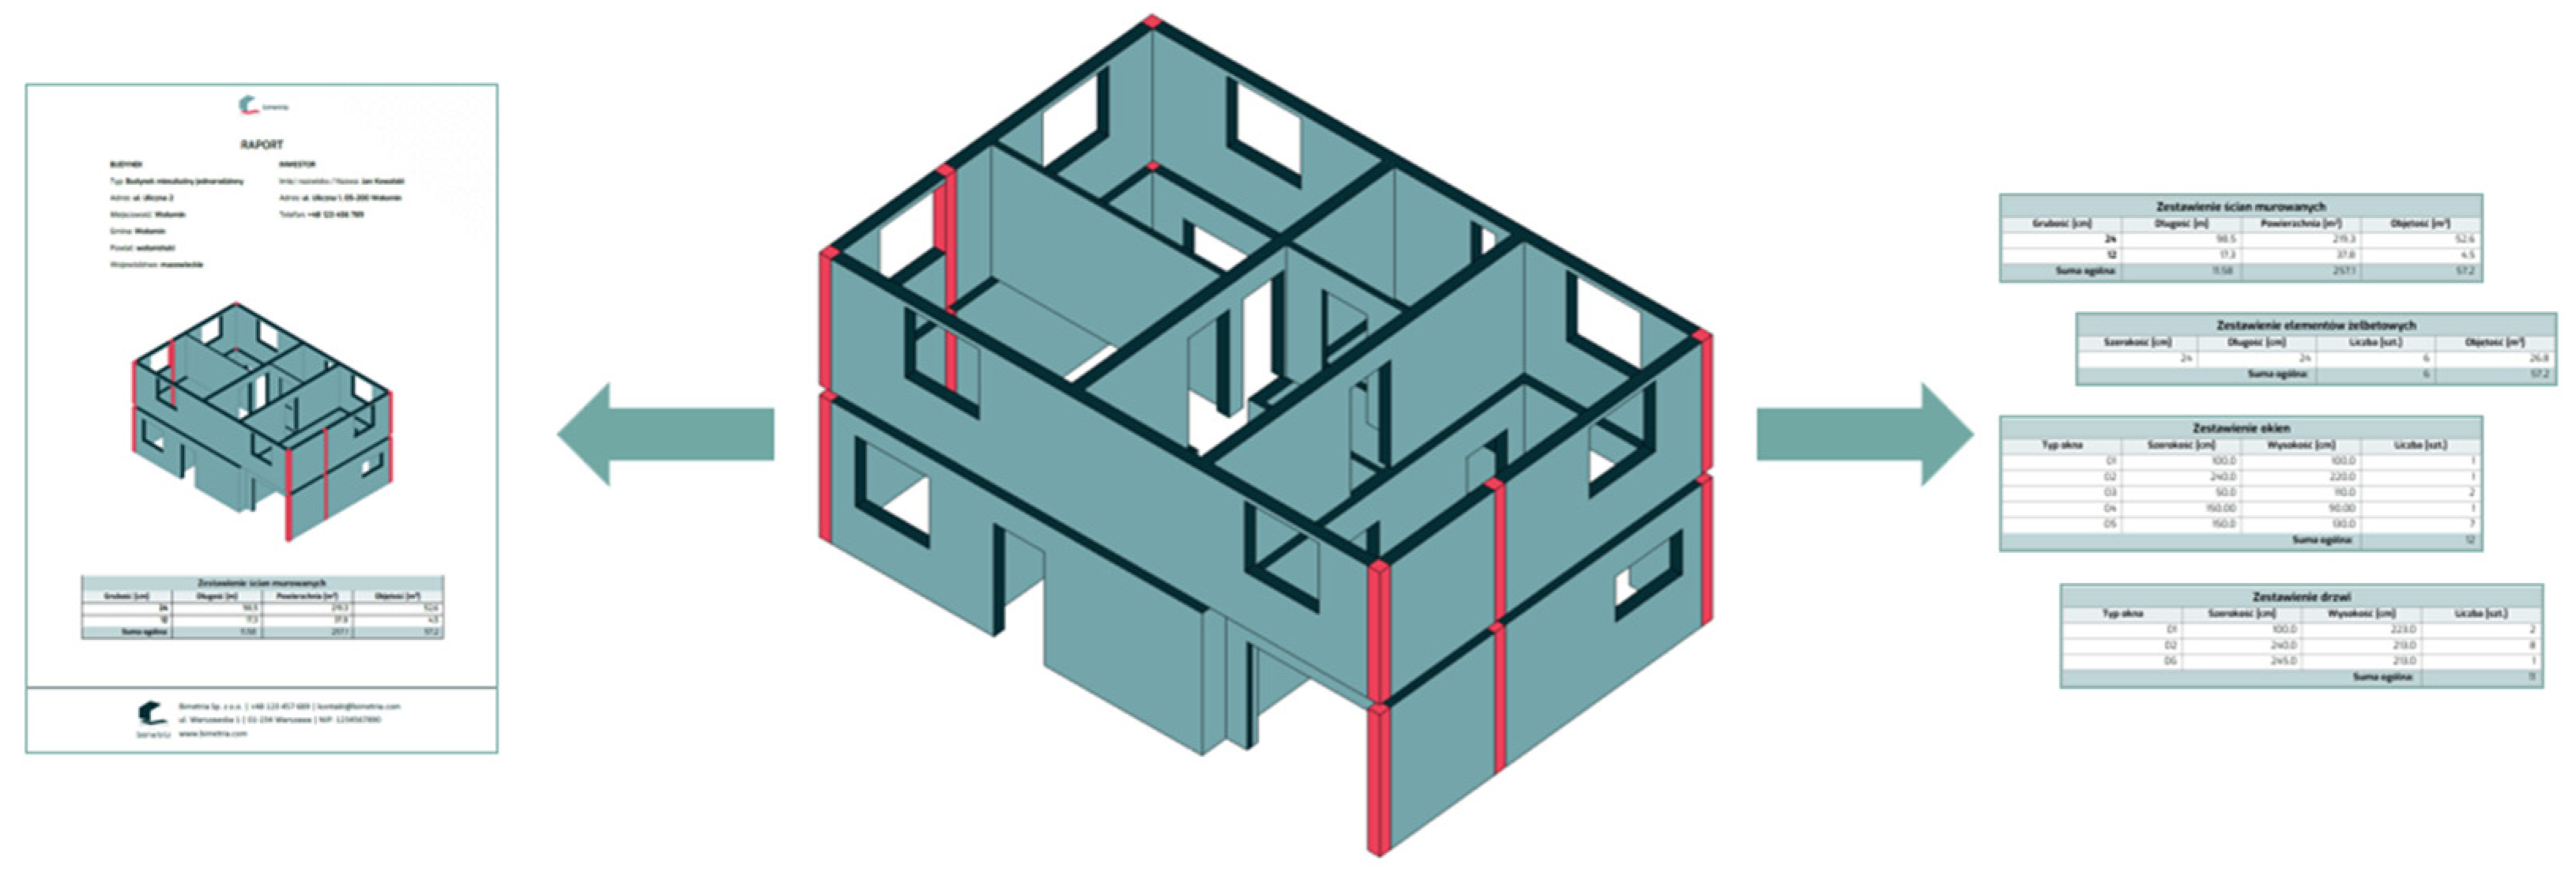
Based on the verification data, an IFC model containing all recognized elements is generated. The model is displayed in the application for better visual verification.
Quantities are calculated based on the approved data contained in the JSON file. The values that are calculated are areas, volumes, and numbers of elements. They are exported to tables in CSV/XLSX format, which can be downloaded and used for any calculations and analyses.
The application also generates a downloadable PDF report, allowing for quick printing and transfer of information if paper documentation is used in the process. It contains a 3D view of the BIM model and tables with quantities (Figure 6). Quantity surveying in Bimetria is the stage of converting image recognition results into measurement values used for cost estimation and planning purchases or construction works. The starting point is a structured graph of elements obtained from masks and object detection with neighborhood relations and links to OCR readings. On this basis, the system determines the base quantities (lengths, areas, volumes) in accordance with a set of measurement rules, then converts them to target units and combines them with the classification of elements.
The process begins with the normalization of units and versioning of the sheet: all dimensions are converted to SI metrics, and the sheet is given an identifier and scale signature, which guarantees the repeatability of calculations between successive revisions. Recording relationships allows for the distinction between gross and net values, which is crucial for most standard catalogs (subtracting openings, including/excluding recesses, treating columns in floors, etc.).
For masonry and reinforced concrete walls, the system calculates lengths from alignment and developed areas from thickness determined based on the legend or layer caption; if the thickness is not explicitly stated, inference rules based on symbols and line scale are used, and the result is marked with a certain degree of uncertainty. Openings are subtracted from the net areas according to a minimum area threshold to avoid interference from small marker recognition artifacts. The measurement values are accompanied by a margin of uncertainty resulting from error propagation: the system aggregates segmentation deviations, OCR reading quality, and scale calibration accuracy.
The result of this stage is a bill of quantities organized according to the classification of elements. At the BIM level, the data is transferred to IFC structures. At the same time, CSV/XLSX reports and filter views are generated, enabling the mapping of items to cost estimate items, with the system able to use assignments to industry dictionaries and codes used in cost estimation. This integration allows for direct feeding into 5D processes, and thanks to input versioning and deterministic measurement rules, the lists are comparable between project revisions and suitable for tracking changes.
4. Discussion
The U-Net network was the starting point for the development of Bimetria and, in general, should be considered a breakthrough. In turn, thanks to the HR-Net network, i.e., its application to the analysis of documentation and details, much better results (accuracy) were obtained than in the case of U-Net. Due to its high resolution throughout the network, only HR-Net allows for the determination of, among other things, wall polygons in a manner acceptable from the point of view of quantity surveying.
The results of the literature review and the Bimetria case study allow us to look at the evolution of CNN/RNN in BIM from a more nuanced perspective than a simple exposure to “old” networks vs. “new” transformers. On the one hand, there is a clear shift in the focus of research towards attention-based architectures, graphs, and point clouds, which better capture 3D geometry and topological relationships in IFC models. On the other hand, practice shows that mature and well-understood components are still crucial for many critical tasks: convolutional networks segmenting 2D images, classic RNN/LSTM for time series, and simple language/embedding models that can be relatively easily integrated into existing engineering processes. Bimetria fits into this logic of “reasonable conservatism”: instead of chasing the latest benchmarks, it uses the proven HR-Net network and OCR modules to solve a specific, business-critical problem – the transition from 2D drawings to BIM models and bills of quantities.
An analysis of Bimetria’s pipeline provides a partial answer to the question posed in the introduction about when classic CNN/RNN are “sufficient.” For a highly structured domain such as technical drawings, with well-designed pre-processing (scale normalization, distortion correction, resolution improvement) and a limited but precise object dictionary, convolutional networks still provide stable segmentation and element detection. The key is not so much the architecture itself, but rather its integration with domain rules (e.g., inferring missing wall thickness based on context) and rigorous user-level quality control woven into the verification process. From this point of view, more complex graph models or transformers could improve some marginal cases (complex details, non-standard symbols), but they are not a prerequisite for achieving production usability in typical building designs.
An important conclusion that emerges from a comparison of literature and the Bimetria example is the central role of the intermediate layer between prediction and the BIM/IFC world. In the proposed solution, this function is performed by a structured description in JSON format, which stores both the coordinates and semantics of the recognized elements. It is this layer that enables the mapping of CNN/OCR results to IFC objects, their subsequent use in quantity surveying processes, and tracking changes between revisions. Literature often assumes that an “intelligent” model will find the right representation on its own, but from an AECOO practice perspective, explicit, auditable bridges between input data, prediction, and the BIM model are key. This approach also promotes explainability: the designer or user not only receives a numerical result, but also the ability to trace which parts of the drawing generated specific IFC objects and what the quantity survey values are.
The issue of balance between synthetic and real data and the problem of domain gap manifests itself in Bimetria in a slightly different way than in typical scientific research. Instead of building huge synthetic corpora, the system relies on so-called dirty documentation from real projects, and the diversity of drawing styles, formats, scanning artifacts, and human errors is treated as a natural problem. While this limits the possibility of precise comparison with other solutions (lack of public benchmarks), it better reflects the actual conditions of implementation. In the broader context of BIM–AI, this suggests that it may make sense to build smaller, “local” data ecosystems around specific applications and organizations, rather than striving for a single correct and universal reference set.
The final topic of discussion concerns explainability and trust in AI systems in BIM. In literature, XAI is often reduced to general techniques for visualizing attention or feature importance, while experience with Bimetria indicates that from the user’s perspective, simple but well-integrated mechanisms are key: overlaying segmentation results on the original drawing, the ability to manually correct and immediately recalculate measurements, and versioning of input data and results. “Operational explainability” understood in this way may be less impressive than advanced XAI methods, but it better addresses the real needs of designers and cost estimators. It seems that in the coming years, it will be precisely such pragmatic solutions, combining mature CNN/RNN architecture with well-designed data semantics and user interfaces, that will determine whether AI becomes an integral part of everyday BIM workflows or remains mainly the domain of research experiments.
5. Conclusions
The article provides a synthetic overview of the evolution of convolutional and recurrent neural networks in BIM applications against the backdrop of the broader development of deep learning methods, showing how the community has progressed from simple 2D perception tasks to models that operate directly on point clouds, IFC graphs, and event sequences in the object lifecycle. The authors organize the current state of knowledge into three complementary perspectives: computer visualization coupled with BIM models (detection, segmentation, and quality control in images, videos, and point clouds), sequence and time series modeling (cost, energy, work progress, and risk forecasts), and the integration of deep learning results with the semantics and topology of IFC models and CDE environments. Based on a review of the literature from the last two decades, the dominant architectures (including the U-Net and HR-Net family, LSTM/GRU, 3D and graph networks, transformers), typical pipelines, and main implementation barriers have been identified, among which the key ones are: the lack of standardized benchmarks dedicated to BIM tasks, the high cost of annotation in native environments, the domain gap between synthetic and real data, the limited interoperability of the IFC standard, and the insufficient explainability of AI models in cost- and schedule-critical applications. The literature review is supplemented by a case study of the Bimetria system, which uses a hybrid processing chain based on CNN, OCR, domain rules, indirect representation in JSON format, and geometric reconstruction to strongly automate the transition from 2D drawings (scans, PDF) to an IFC model integrated with quantity takeoff and cost estimation processes, while illustrating that mature and well-understood CNN/RNN architectures can be “sufficient” in many tasks if embedded in a carefully designed workflow and user verification mechanisms. Thus, the article proposes a framework typology of BIM-AI tasks and methods, formulates a set of fundamental questions concerning, among other things, the role of classical CNN/RNN models in relation to attention-based models, the balance between synthetic and real data, practically useful explainability, and minimum interoperability requirements, and indicates directions for further development aimed at building scalable, explainable, and comparable tools that can become a permanent part of everyday practice in the broadly understood construction industry – AECOO.
Funding
This research received no external funding.
Data Availability Statement
No new data were created or analyzed in this study.
Acknowledgments
The author would like to thank the reviewers for their feedback, insightful comments, and assistance in improving the article.
Conflicts of Interest
The author declares no conflicts of interest.
References
- Criminale, A.; Langar, S. (2017, April). Challenges with BIM implementation: a review of literature. In 53rd ASC annual international conference proceedings (pp. 329–335).
- Meng, Q.; Zhang, Y.; Li, Z.; Shi, W.; Wang, J.; Sun, Y. . & Wang, X. A review of integrated applications of BIM and related technologies in whole building life cycle. Engineering, Construction and Architectural Management 2020, 27, 1647–1677. [Google Scholar]
- Borkowski, A.S. Evolution of BIM: Epistemology, genesis and division into periods. Journal of Information Technology in Construction 2023, 28. [Google Scholar] [CrossRef]
- Ding, S.; Li, H.; Su, C.; Yu, J.; & Jin, F. Evolutionary artificial neural networks: a review. Artificial Intelligence Review 2013, 39, 251–260. [Google Scholar] [CrossRef]
- Xu, F.; & Liu, Q. Building energy consumption optimization method based on convolutional neural network and BIM. Alexandria Engineering Journal 2023, 77, 407–417. [Google Scholar] [CrossRef]
- Al-Sinan, M.A.; Bubshait, A.A.; & Aljaroudi, Z. Generation of construction scheduling through machine learning and BIM: A blueprint. Buildings 2024, 14, 934. [Google Scholar] [CrossRef]
- Jatobá, M.; Santos, J.; Gutierriz, I.; Moscon, D.; Fernandes, P.O.; & Teixeira, J.P. P. Evolution of artificial intelligence research in human resources. Procedia Computer Science 2019, 164, 137–142. [Google Scholar] [CrossRef]
- Liu, Y.; Huang, H.; Gao, G.; Ke, Z.; Li, S.; & Gu, M. Dataset and benchmark for as-built BIM reconstruction from real-world point cloud. Automation in Construction 2025, 173, 106096. [Google Scholar] [CrossRef]
- Ying, H.; Sacks, R.; & Degani, A. Synthetic image data generation using BIM and computer graphics for building scene understanding. Automation in Construction 2023, 154, 105016. [Google Scholar] [CrossRef]
- Gerbino, S.; Cieri, L.; Rainieri, C.; & Fabbrocino, G. On BIM interoperability via the IFC standard: An assessment from the structural engineering and design viewpoint. Applied Sciences 2021, 11, 11430. [Google Scholar] [CrossRef]
- Love, P.E.; Matthews, J.; Fang, W.; Porter, S.; Luo, H.; & Ding, L. Explainable artificial intelligence in construction: The content, context, process, outcome evaluation framework. arXiv 2022, arXiv:2211.06561. [Google Scholar] [CrossRef]
- Borkowski, A.S.; Brożyna, J.; Litwin, J.; Rączka, W.; & Szporanowicz, A. Use of the CDE environment in team collaboration in BIM. Informatyka, Automatyka, Pomiary w Gospodarce i Ochronie Środowiska 2023, 13. [Google Scholar] [CrossRef]
- LeCun, Y. (2015). LeNet-5, convolutional neural networks. URL: http://yann.lecun.com/exdb/lenet, 20, 14. (accessed on 12 September 2025).
- Krizhevsky, A.; Sutskever, I.; & Hinton, G.E. E. Imagenet classification with deep convolutional neural networks. Advances in neural information processing systems 2012, 25. [Google Scholar] [CrossRef]
- Mikolov, T.; Chen, K.; Corrado, G.; & Dean, J. Efficient estimation of word representations in vector space. arXiv 2013, arXiv:1301.3781. [Google Scholar] [CrossRef]
- Sutskever, I.; Vinyals, O.; & Le, Q.V. V. Sequence to sequence learning with neural networks. Advances in neural information processing systems 2014, 27. [Google Scholar]
- Silver, D.; Huang, A.; Maddison, C.J.; Guez, A.; Sifre, L.; Van Den Driessche, G. . & Hassabis, D. Mastering the game of Go with deep neural networks and tree search. Nature 2016, 529, 484–489. [Google Scholar] [PubMed]
- Vaswani, A.; Shazeer, N.; Parmar, N.; Uszkoreit, J.; Jones, L.; Gomez, A.N. . & Polosukhin, I. Attention is all you need. Advances in neural information processing systems 2017, 30. [Google Scholar]
- Radford, A.; Narasimhan, K.; Salimans, T.; Sutskever, I. Improving language understanding by generative pre-training. 2018. [Google Scholar]
- https://openai.com/index/better-language-models/?utm_source=chatgpt.com (accessed on September 30, 2025).
- Ouyang, L.; Wu, J.; Jiang, X.; Almeida, D.; Wainwright, C.; Mishkin, P. . & Lowe, R. Training language models to follow instructions with human feedback. Advances in neural information processing systems 2022, 35, 27730–27744. [Google Scholar]
- Bubeck, S.; Chandrasekaran, V.; Eldan, R.; Gehrke, J.; Horvitz, E.; Kamar, E. ;... & Zhang, Y. Sparks of artificial general intelligence: early experiments with GPT-4 (2023). arXiv 2023, arXiv:2303.12712, 1. [Google Scholar]
- Kahneman, D. Thinking, fast and slow, 2011; Farrar, Straus and Giroux.
- Sun, K.; Xiao, B.; Liu, D.; Wang, J. Deep high-resolution representation learning for human pose estimation. In Proceedings of the IEEE/CVF conference on computer vision and pattern recognition; 2019; pp. 5693–5703. [Google Scholar]
- Wang, X.; Yu, K.; Wu, S.; Gu, J.; Liu, Y.; Dong, C.; ...; Change Loy, C. Esrgan: Enhanced super-resolution generative adversarial networks. In Proceedings of the European conference on computer vision (ECCV) workshops; pp. 0–0.
Figure 1.
Timeline and milestones in the development of RNN/CNN (source: own work).
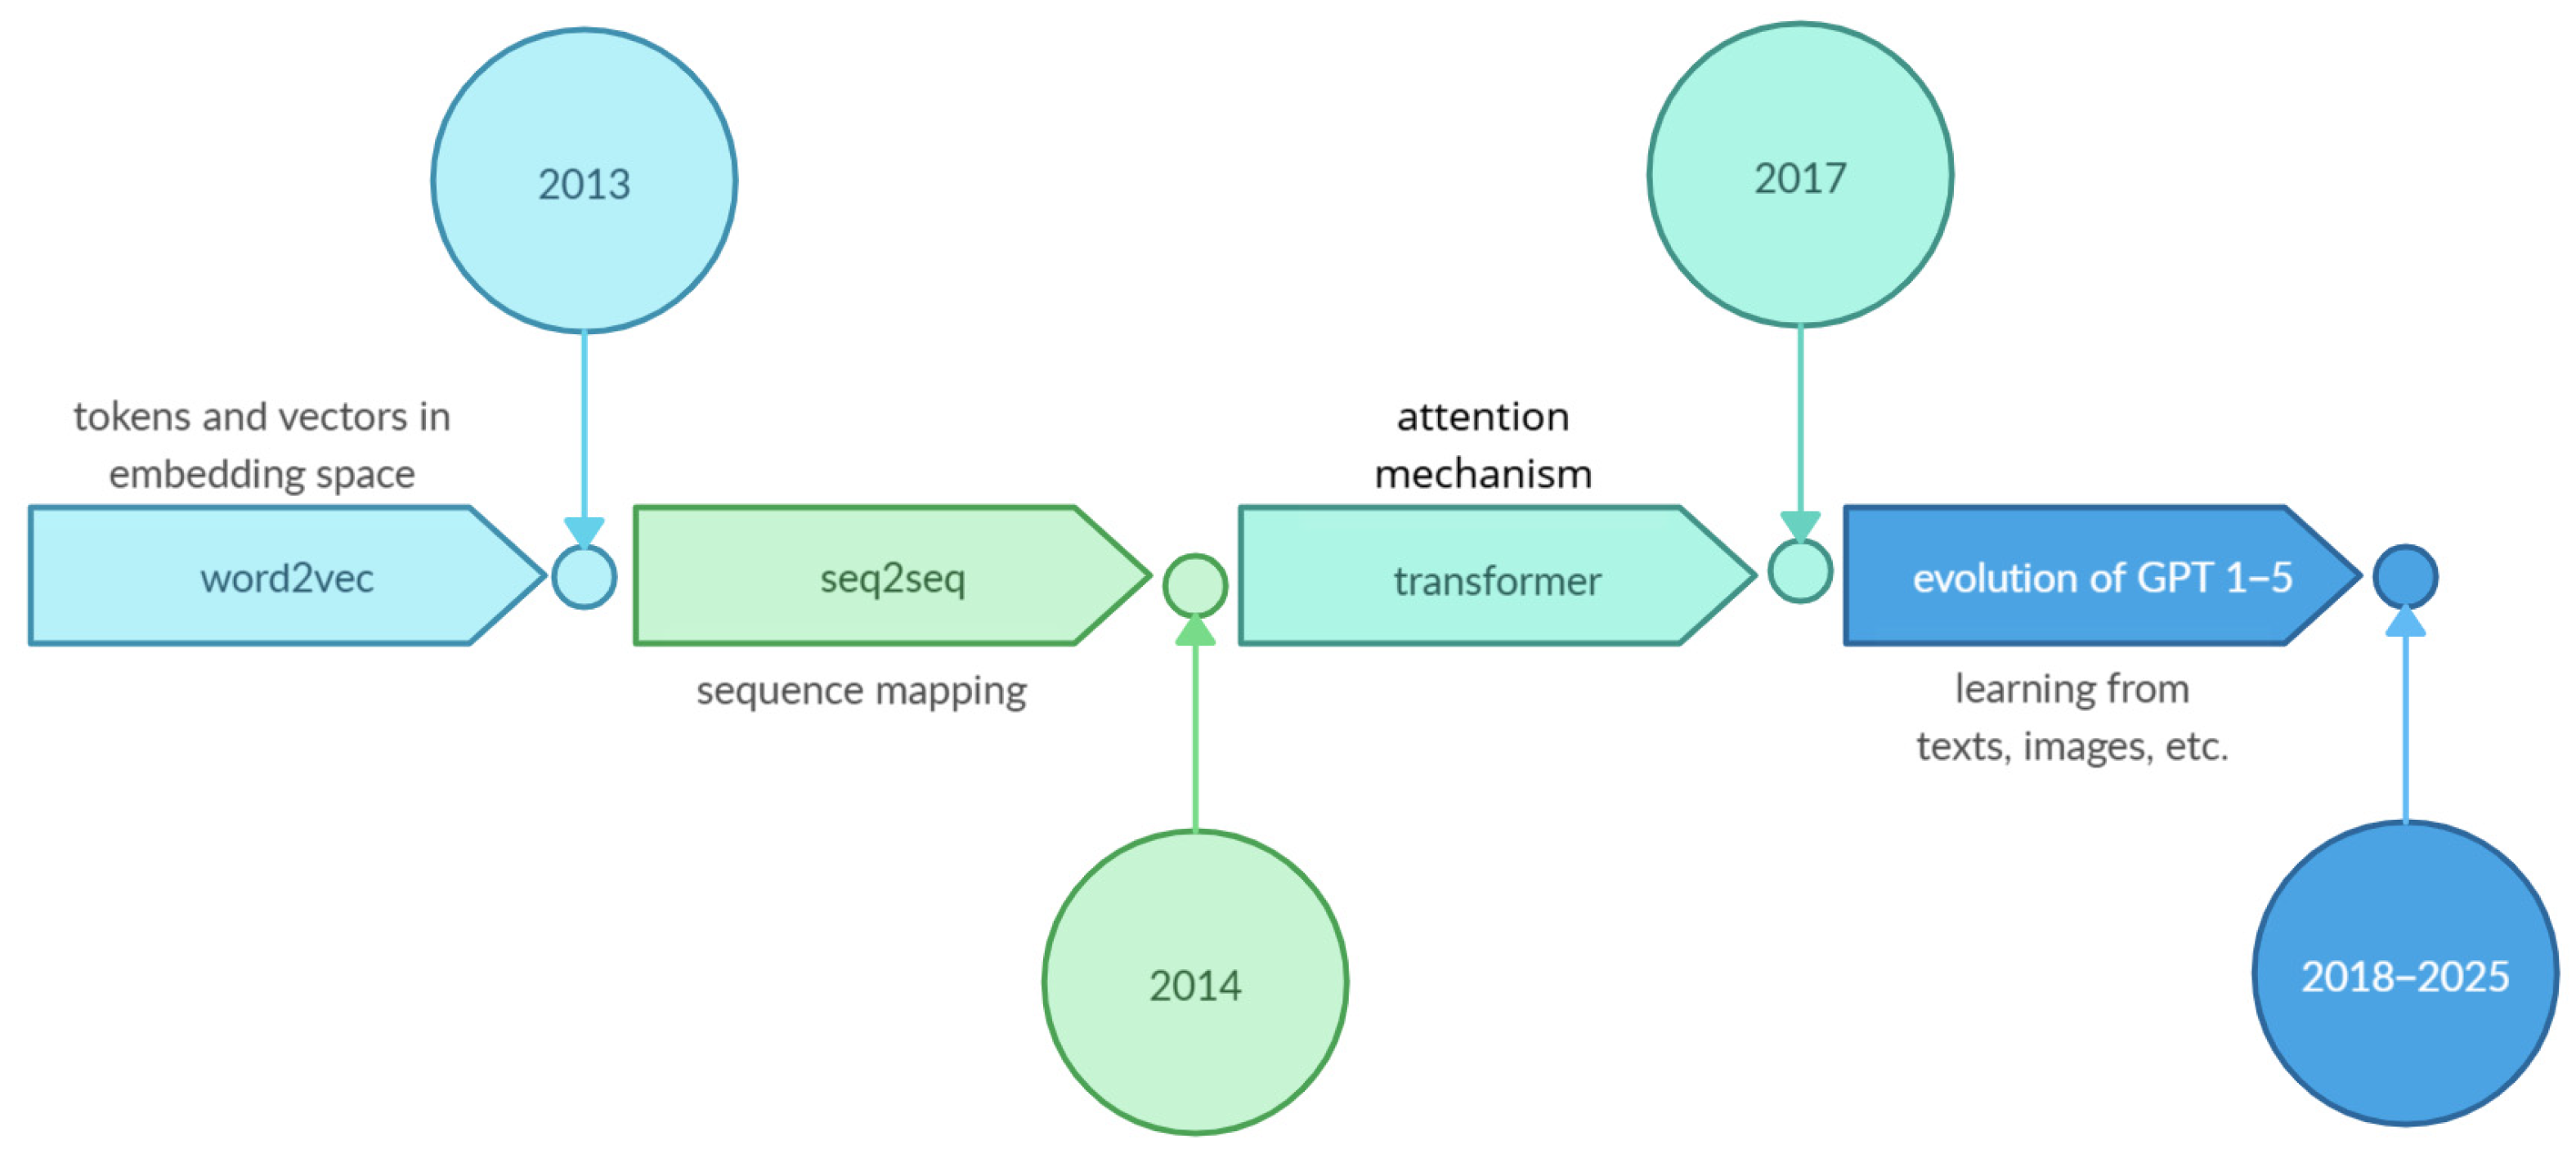
Figure 2.
Three eras in the development of BIM–AI (source: own work).
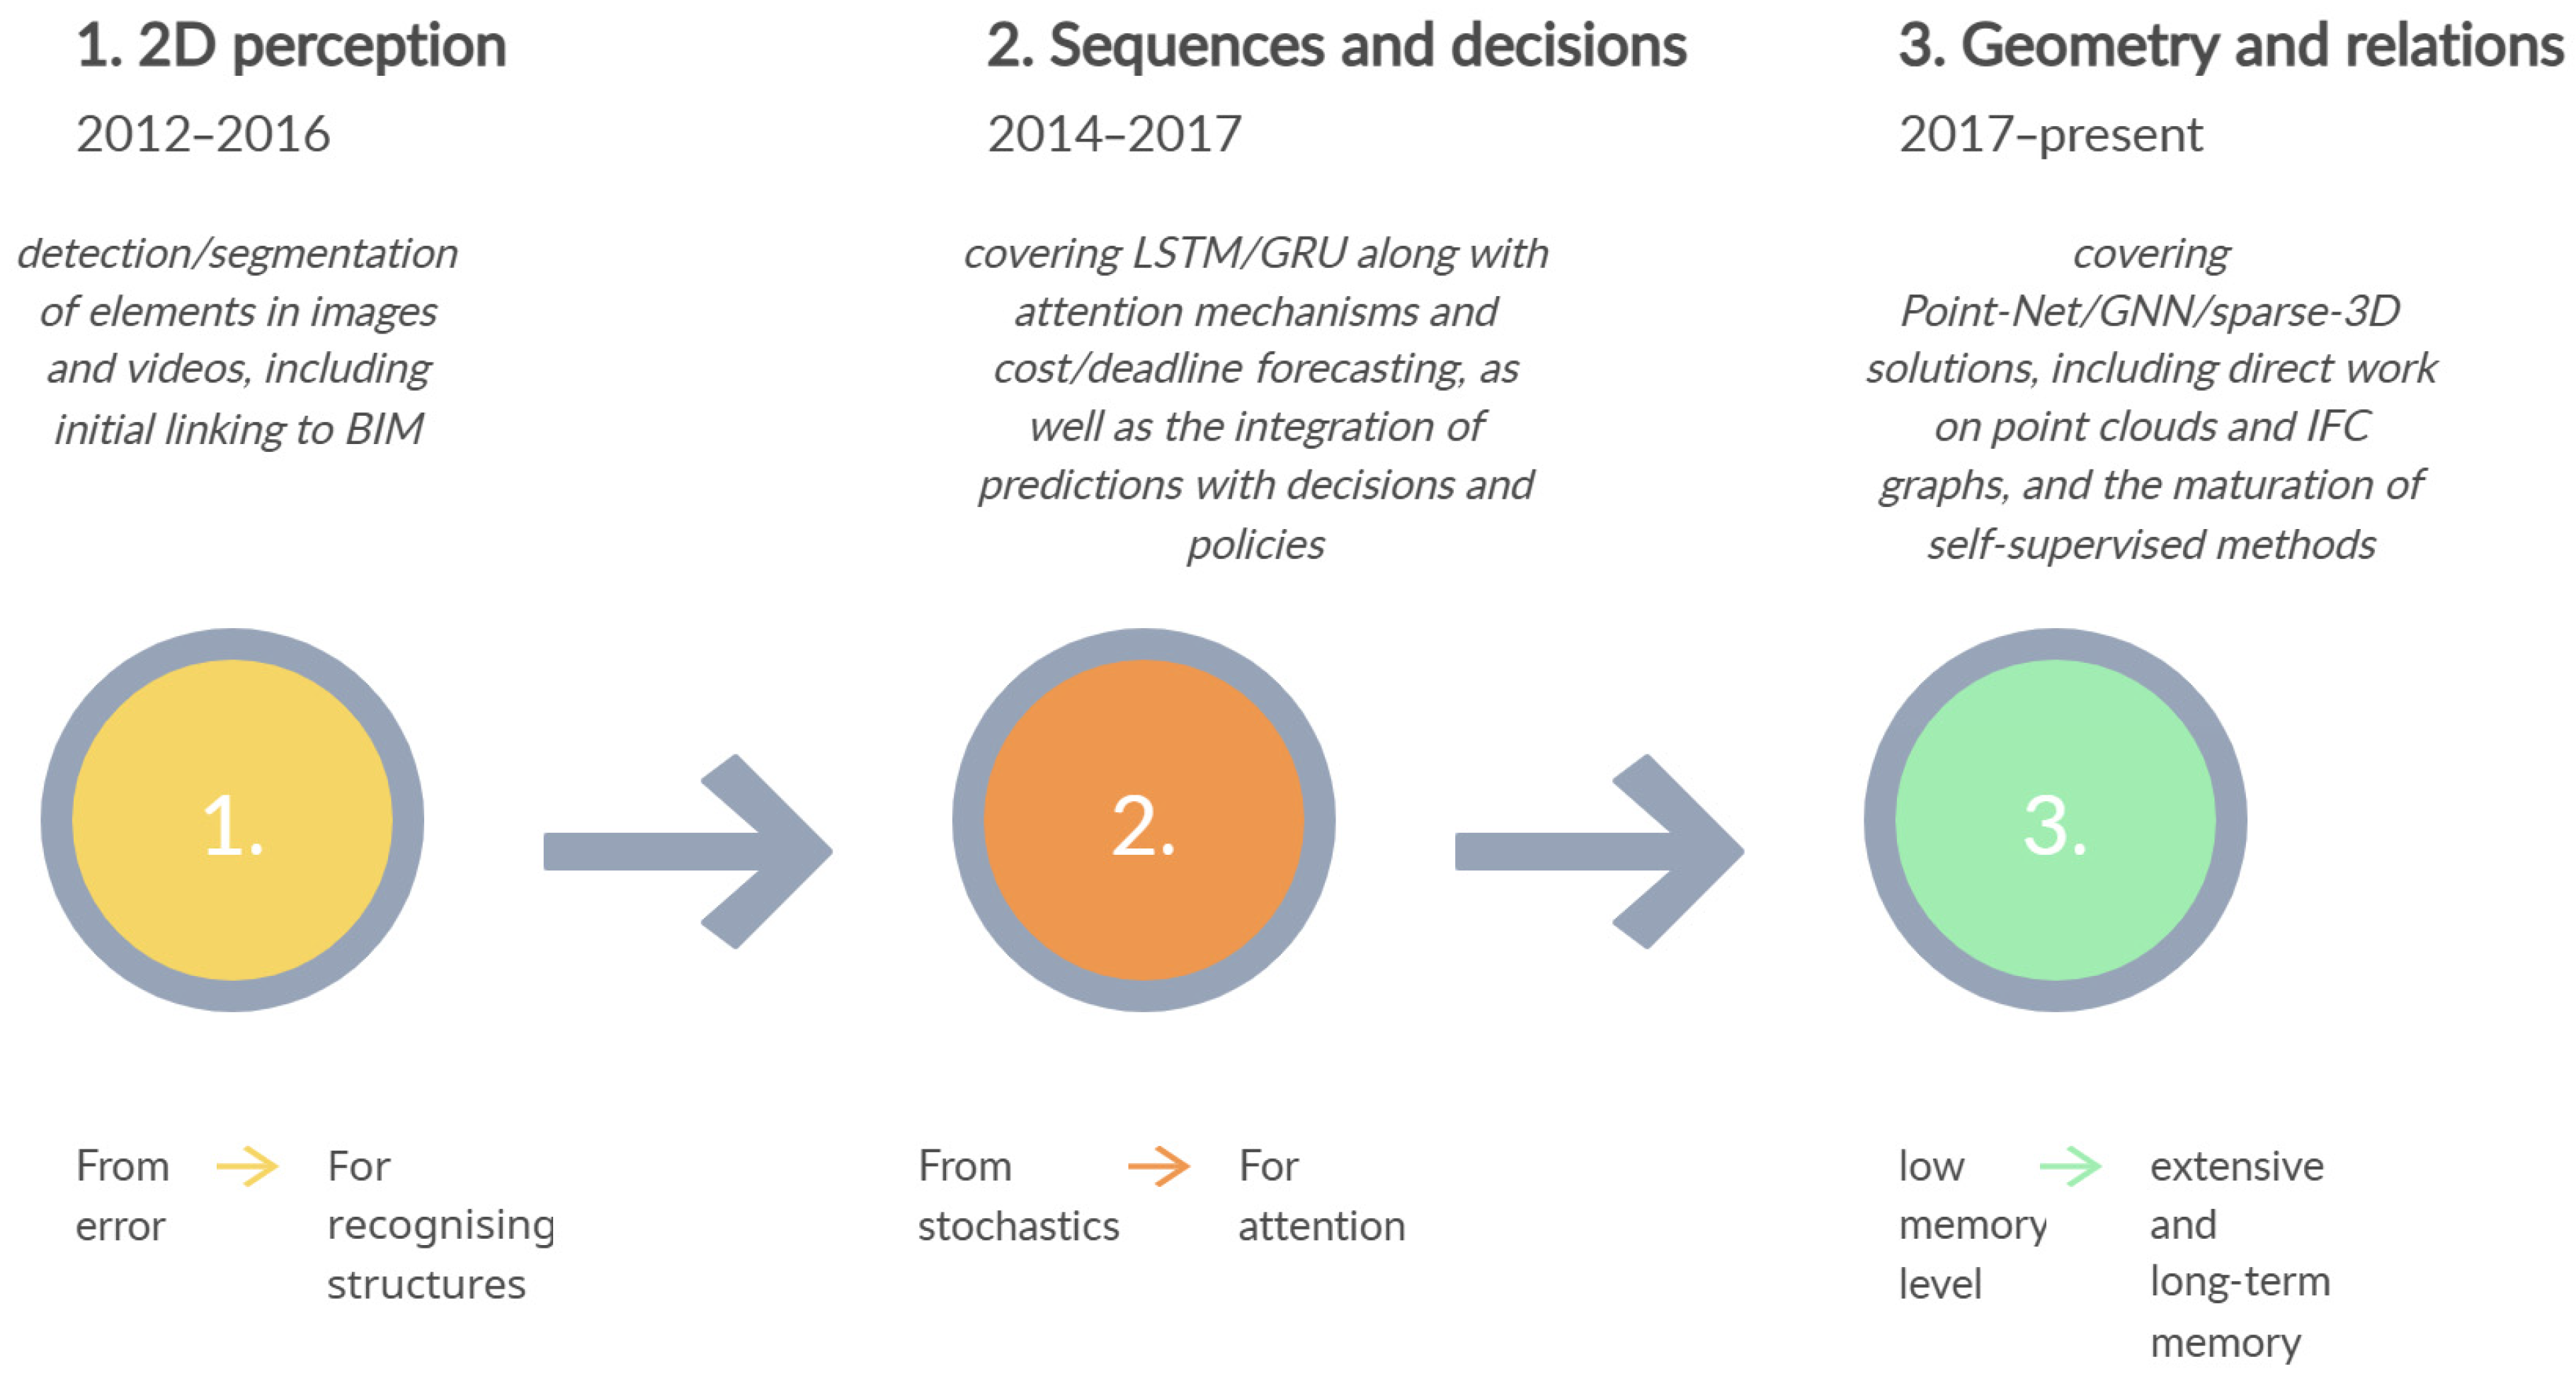
Figure 3.
Image uploaded to the model at the input (source: own study, Bimetria, 2025).
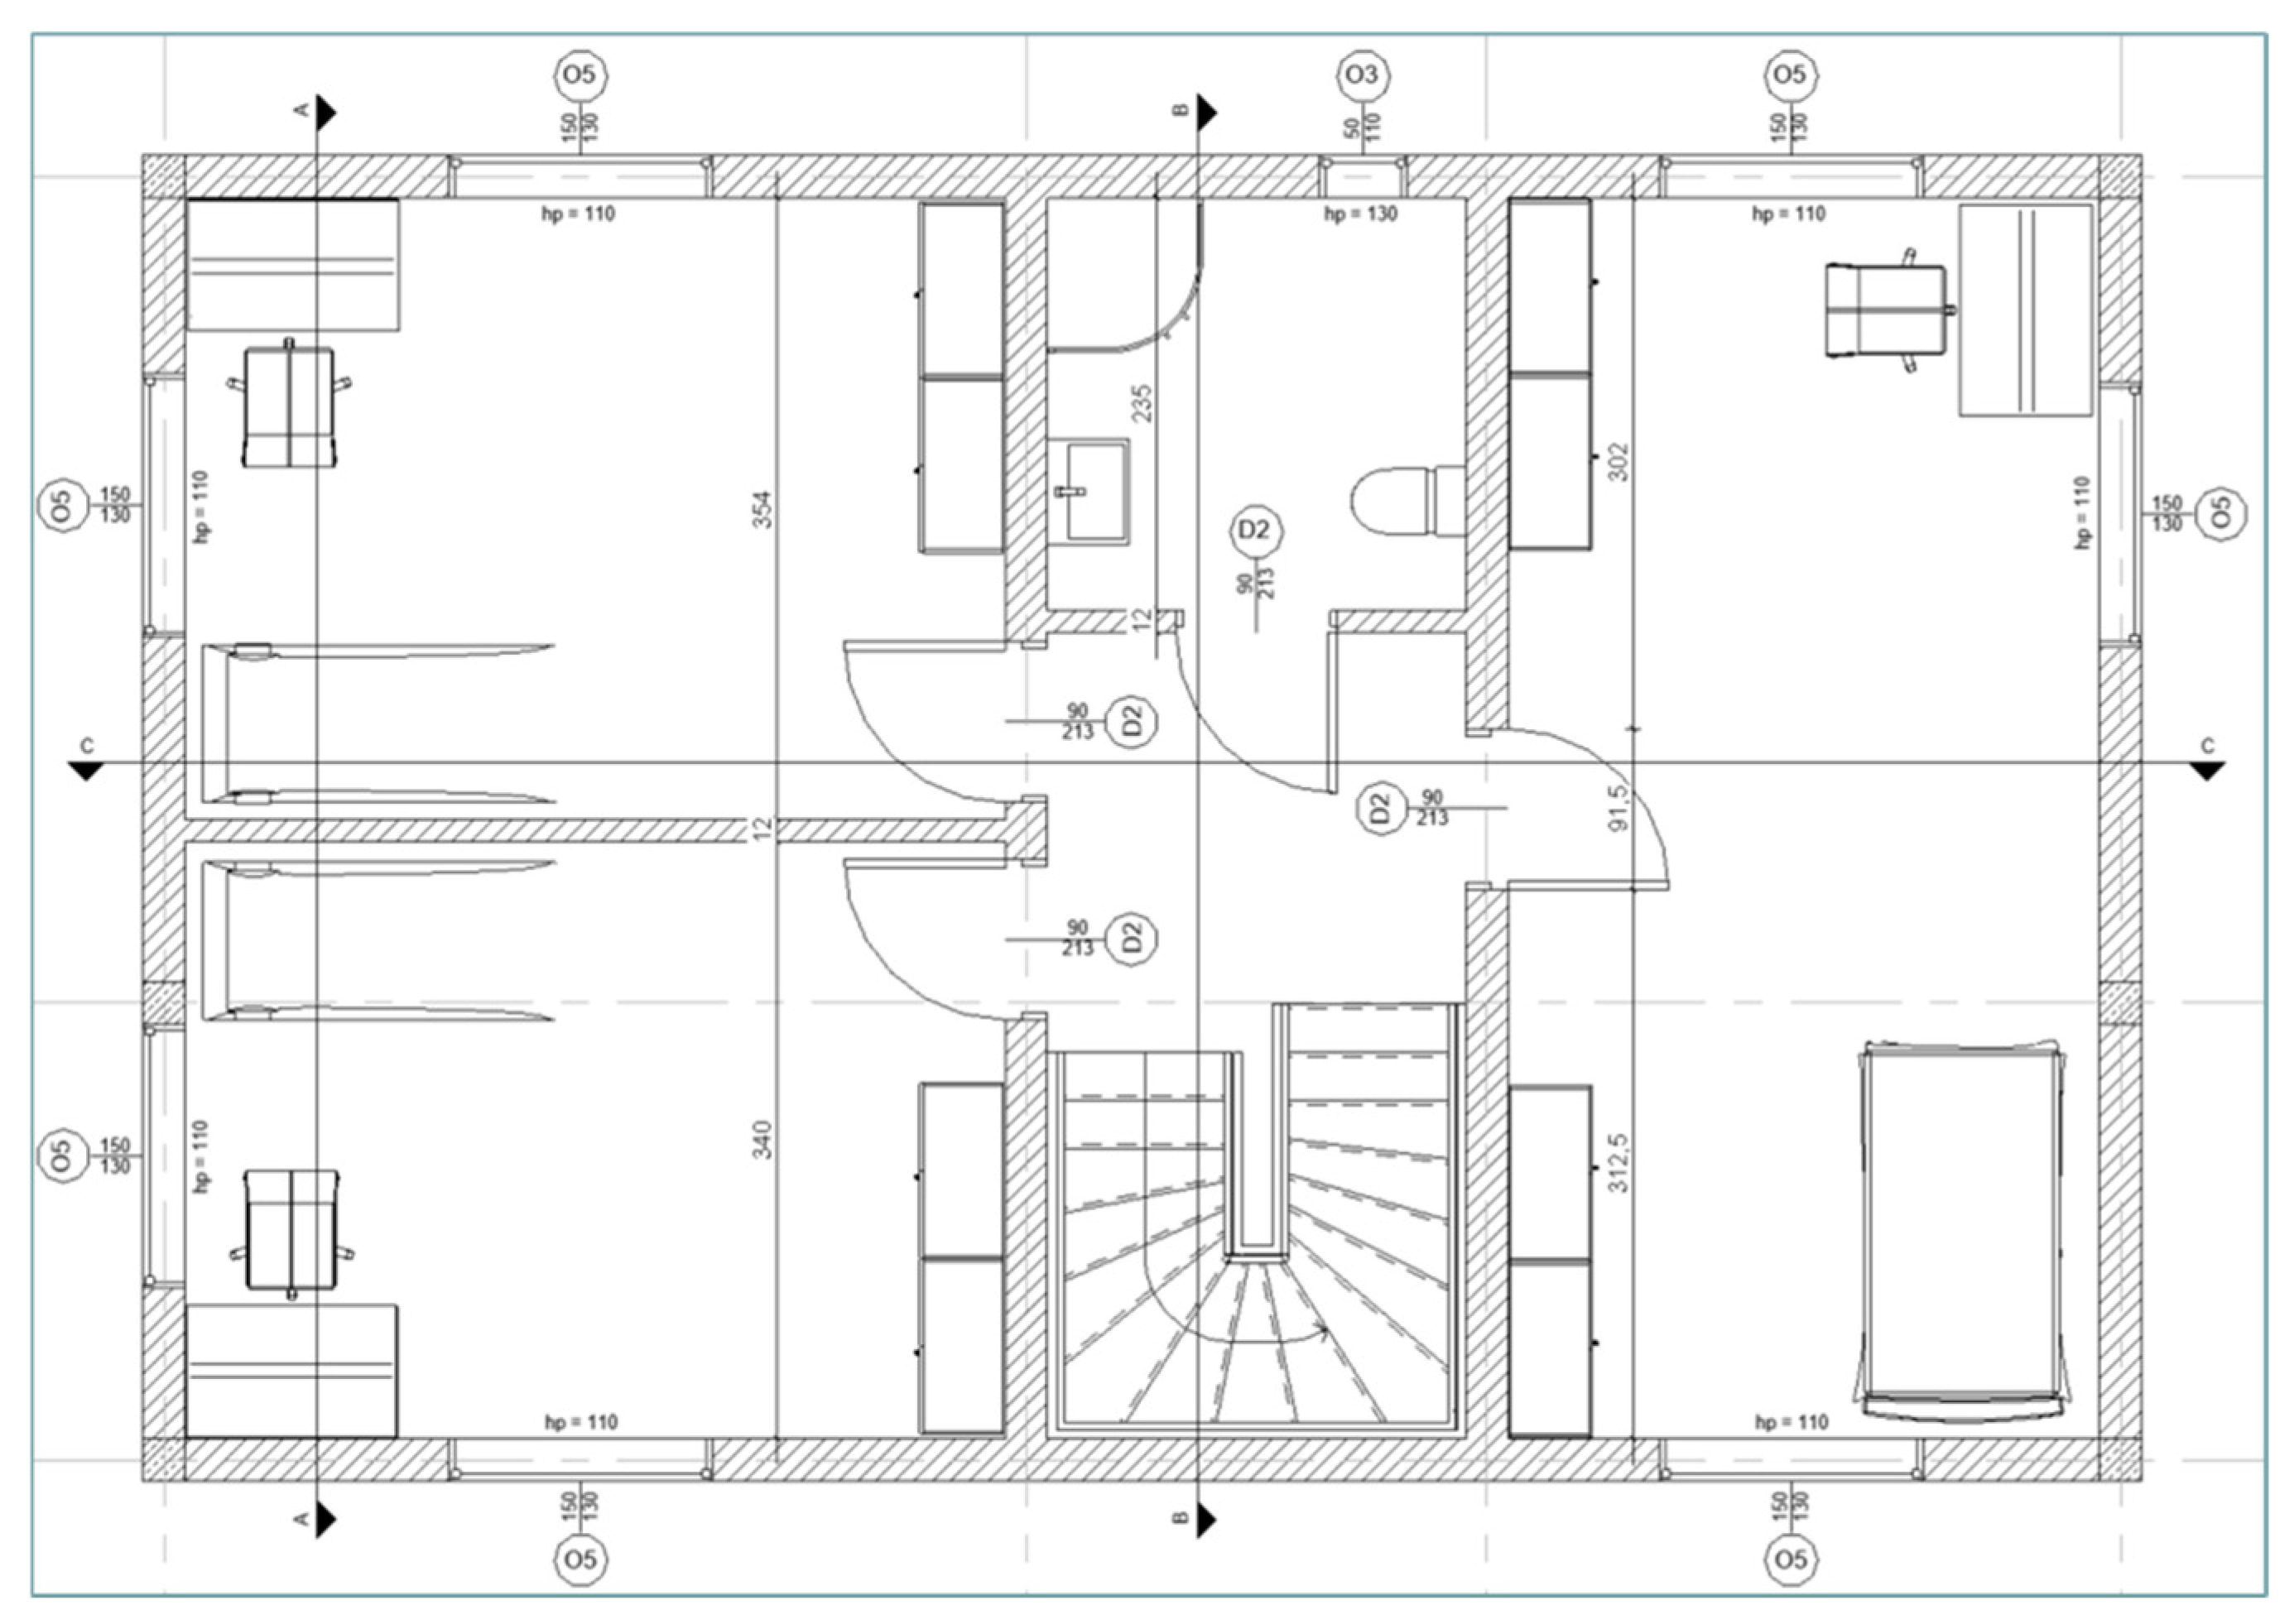
Figure 4.
The first stage of image recognition (source: own work, Bimetria, 2025).
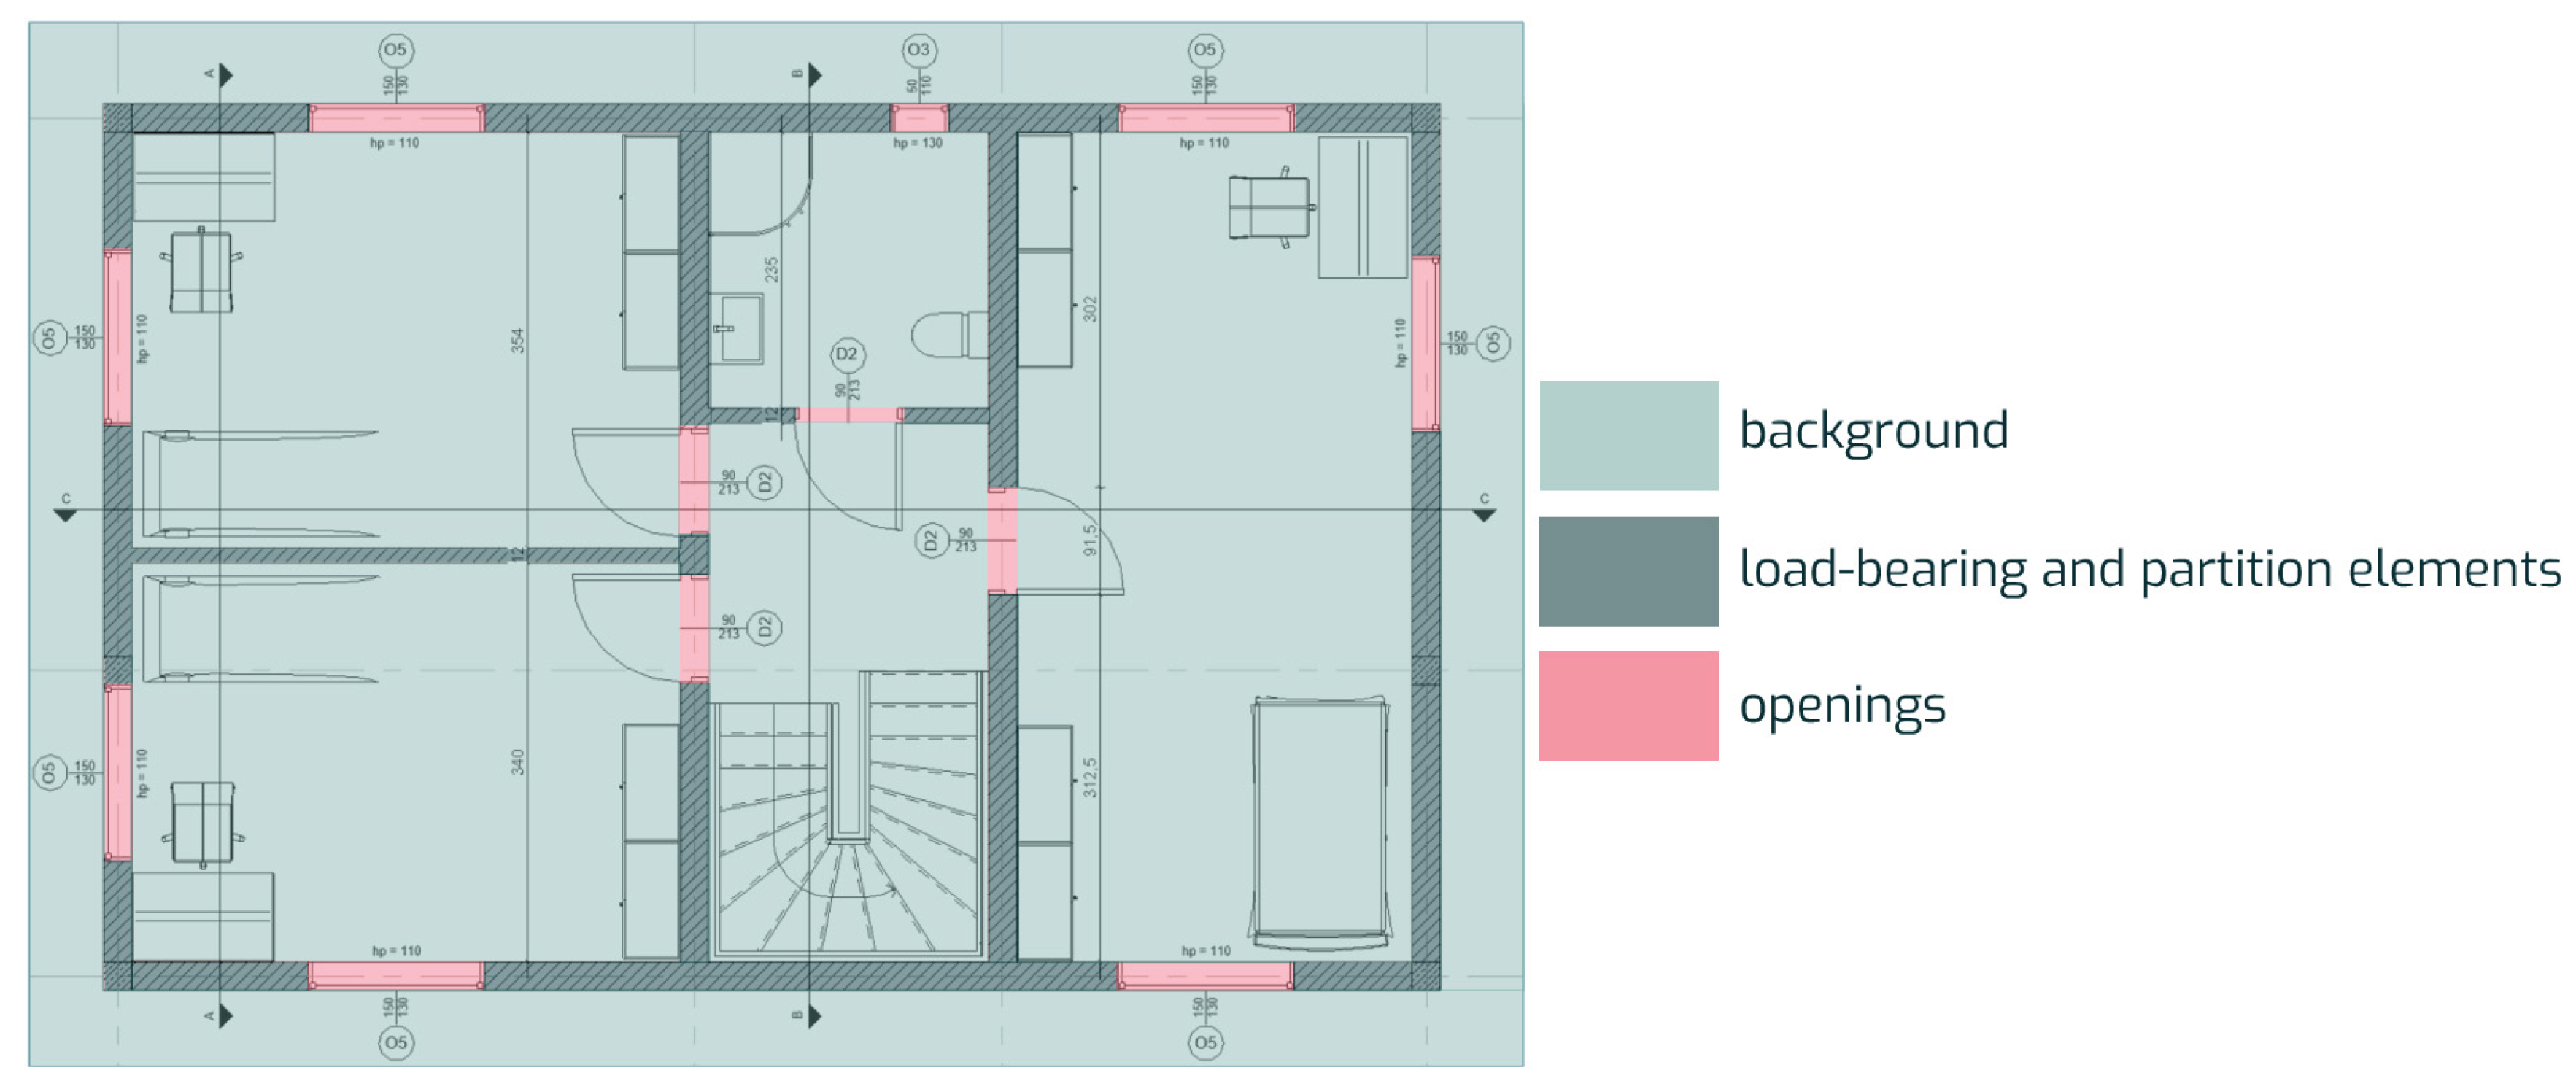
Figure 5.
The second stage of image recognition (source: own work, Bimetria, 2025).
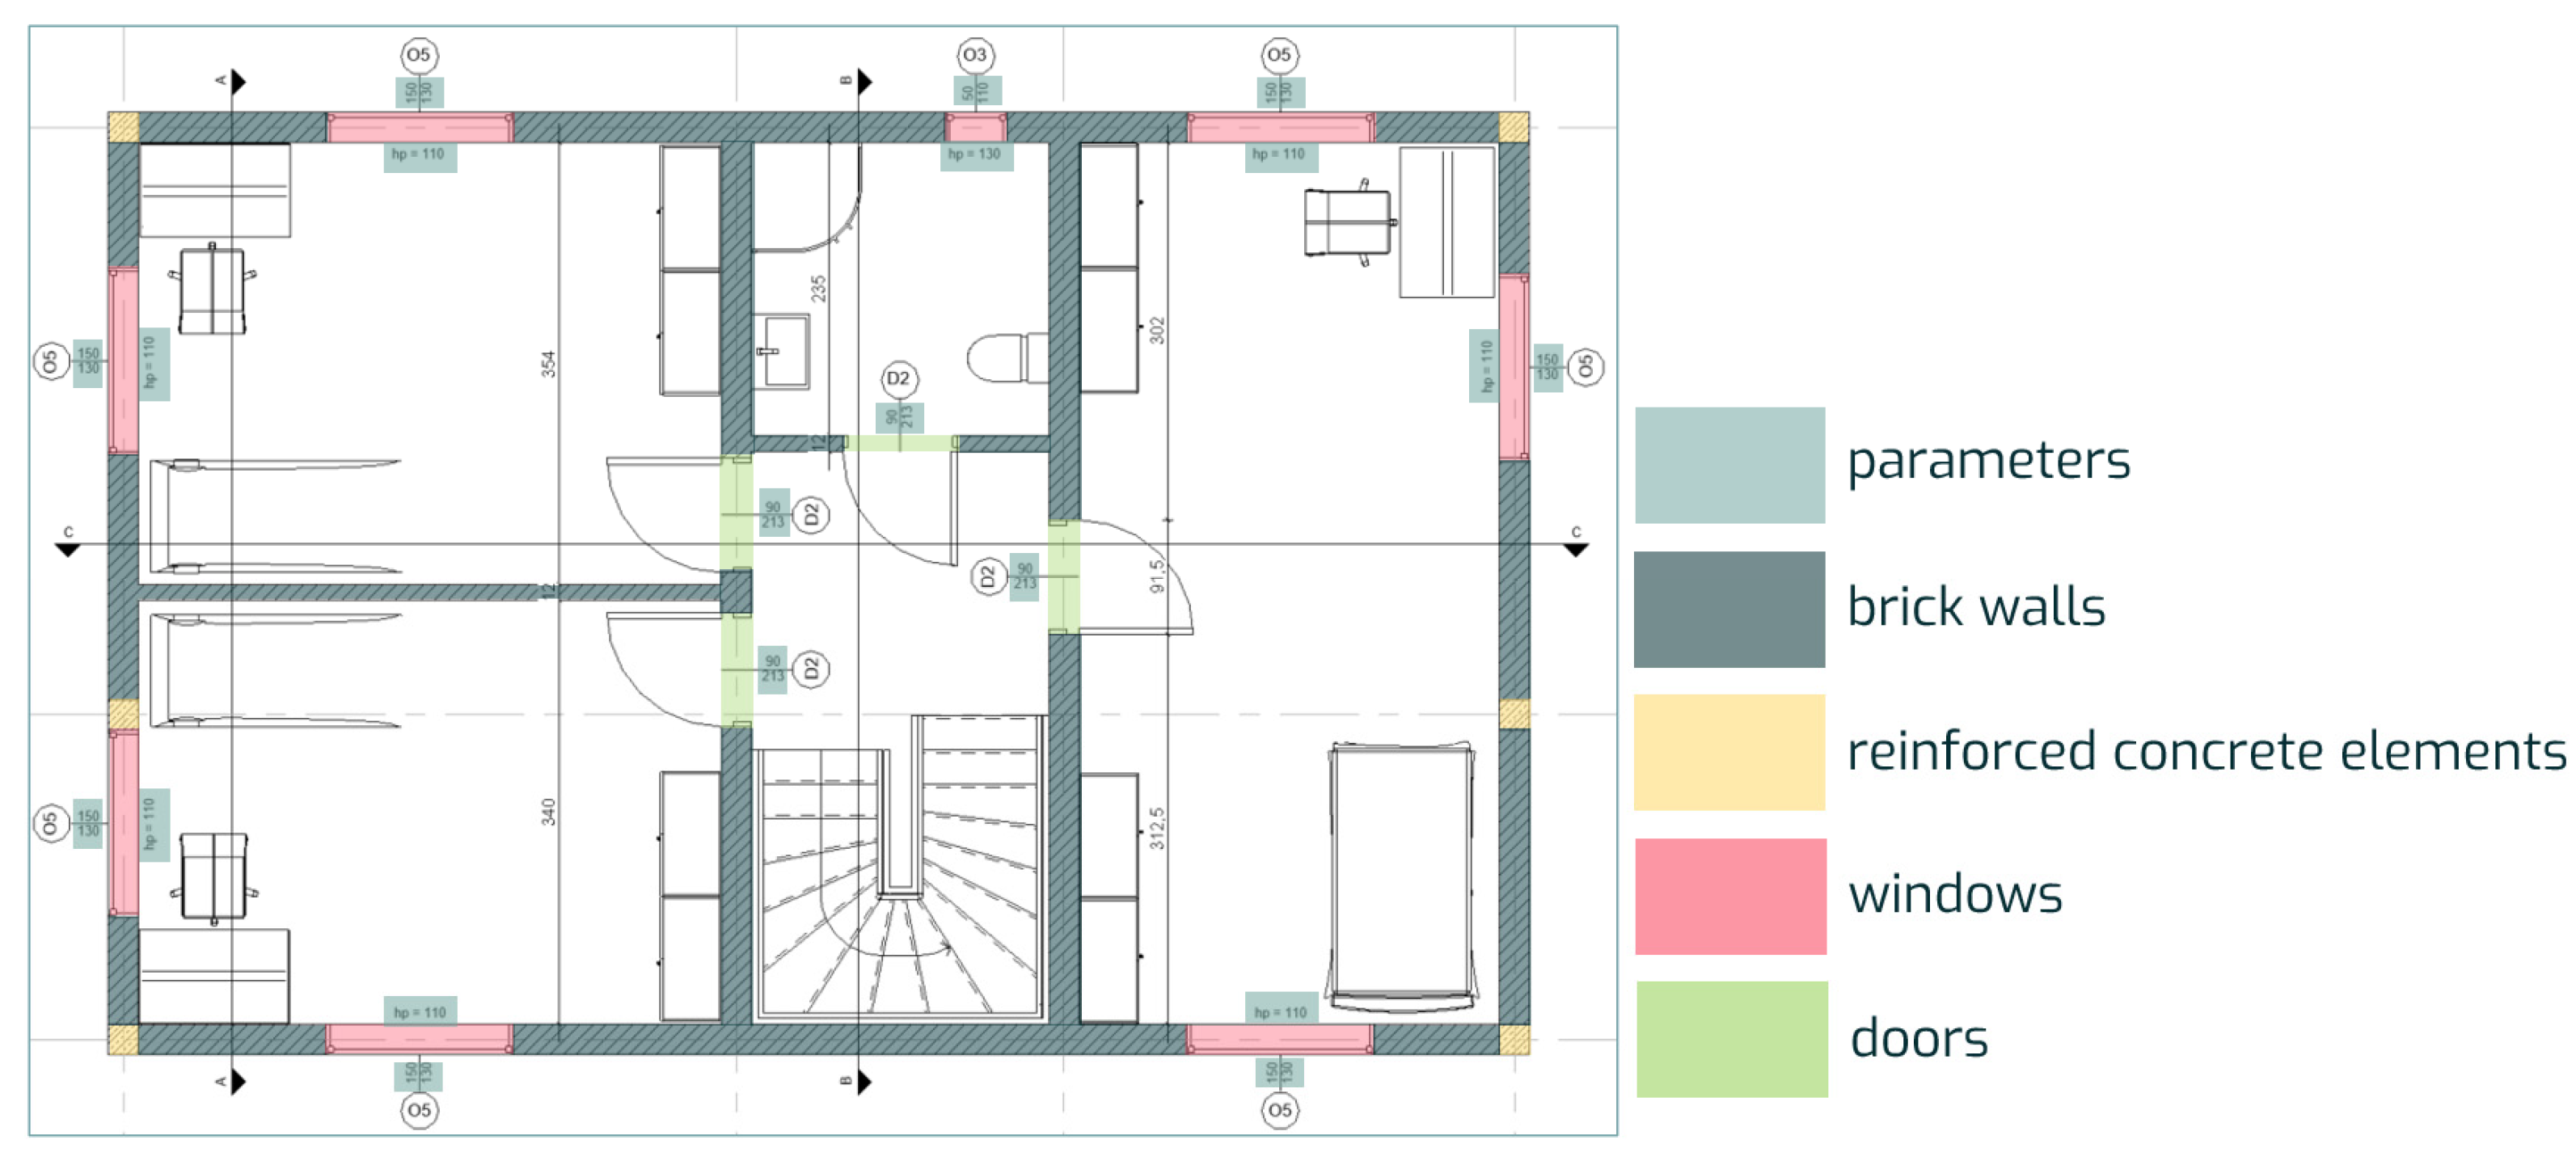
Figure 6.
BIM model with bill of quantities values (source: own study, Bimetria, 2025).
Disclaimer/Publisher’s Note: The statements, opinions and data contained in all publications are solely those of the individual author(s) and contributor(s) and not of MDPI and/or the editor(s). MDPI and/or the editor(s) disclaim responsibility for any injury to people or property resulting from any ideas, methods, instructions or products referred to in the content. |
© 2025 by the authors. Licensee MDPI, Basel, Switzerland. This article is an open access article distributed under the terms and conditions of the Creative Commons Attribution (CC BY) license (http://creativecommons.org/licenses/by/4.0/).
Copyright: This open access article is published under a Creative Commons CC BY 4.0 license, which permit the free download, distribution, and reuse, provided that the author and preprint are cited in any reuse.


