Introduction
Cardiovascular diseases (CVDs), particularly acute ischemic events like myocardial infarction and stroke, are the foremost cause of death worldwide, with the burden increasingly shifting to low- and middle-income countries [
1]. The pathological formation of intravascular blood clots (thrombi) is a central event. While thrombolytic therapy using agents like tissue plasminogen activator (t-PA) and streptokinase is a cornerstone treatment, its efficacy is hampered by significant drawbacks, including high cost, short plasma half-life, limited fibrin specificity, and the risk of serious bleeding complications [
2,
3]. This ongoing clinical challenge drives the continuous discovery of safer, more efficient, and cost-effective thrombolytic agents.
Microbial fibrinolytic enzymes have emerged as attractive alternatives due to their production efficiency, scalability, and diverse biochemical properties [
4]. While enzymes from Gram-positive bacteria, particularly Bacillus species like nattokinase, are well-documented [
5], the exploration of Gram-negative bacteria for this purpose has been less extensive. The genus Citrobacter, often studied in the context of opportunistic infections and antibiotic resistance, possesses a complex arsenal of extracellular enzymes, including proteases, which are crucial for nutrient acquisition and pathogenesis [
6]. Some Citrobacter species have been reported to produce proteases with unique specificities, but their systematic evaluation as sources of fibrinolytic enzymes remains largely untapped [
7].
Egypt’s diverse geography, encompassing the ultra-fertile Nile Delta, arid deserts, saline coasts, and unique urban ecosystems, creates a mosaic of distinct microbial habitats. These environments exert selective pressures that drive the evolution of novel enzymes with unique adaptations [
8]. Screening such under-explored microbiomes offers a high probability of discovering microbial strains with unprecedented biocatalytic activities, a strategy that has gained renewed interest in the post-antibiotic era for discovering new bioactive compounds [
9].
In this study, It was hypothesized that Egyptian soils harbor novel Citrobacter strains producing potent fibrinolytic enzymes. The isolation and identification of a Citrobacter freundii strain, EGY1, from Nile Delta soil was reported. In the present study the optimization of enzyme production, the purification and biochemical characterization of the resulting fibrinolytic enzyme (designated Frecinase) were detailed, and an evidence of its direct fibrinolytic mechanism and specific fibrinogen degradation pattern was provided, establishing its potential as a lead molecule for antithrombotic therapy.
Material and Methods
Source of Chemicals
All chemicals were purchased from Al-Nasr pharmaceutical chemical company, Egypt. All chemical regents were of analytical grade.
Sample Collection and Bacterial Isolation
Soil samples were aseptically collected from the top 10 cm at four distinct sites in Egypt: Nile Delta farmland (Kafr El-Sheikh), a Western Desert oasis (Siwa), Red Sea coastal soil (Hurghada), and an urban garden in Cairo. Samples were stored at 4 °C until processing. One gram of soil from each site was serially diluted in sterile saline, spread on MacConkey Agar (Oxoid), and incubated at 37 °C for 24-48 h. Presumptive Citrobacter colonies (lactose-fermenting or non-fermenting, pale) were purified on Nutrient Agar and stored in 20% glycerol at -80 °C.
Screening for Fibrinolytic Activity
Primary Screening: Isolates were spot-inoculated on fibrin agar plates [
10] containing 1% (w/v) fibrinogen (Sigma) and 0.1 U/mL thrombin (Sigma). After 18 h incubation at 37 °C, the diameter of the clear hydrolysis zone around the colonies was measured.
Quantitative Screening:Positive isolates were grown in 50 mL of Brain Heart Infusion (BHI) broth for 24 h at 37 °C with shaking (150 rpm). Culture supernatants were obtained by centrifugation (10,000 × g, 20 min, 4 °C). Fibrinolytic activity was assayed spectrophotometrically [
11]. Briefly, 0.5 mL of supernatant was added to 1 mL of fibrin clot (prepared by incubating 0.5% (w/v) fibrinogen with 0.1 U/mL thrombin for 1 h at 37 °C). After 60 min incubation, the reaction was stopped with 1.5 mL of 10% (w/v) trichloroacetic acid. The mixture was centrifuged, and the absorbance of the supernatant was measured at 275 nm. One unit of fibrinolytic activity was defined as the amount of enzyme required to increase the absorbance by 0.01 per minute under assay conditions. Protein concentration was determined by the Bradford method [
12]. Specific activity was expressed as U/mg of protein.
Molecular Identification of the Selected Isolate:
Genomic DNA was extracted from the selected potent strain using a DNeasy PowerSoil pro commercial kit purchased from QIAGEN, USA. The 16S rRNA gene was amplified with the aid of QIAseq 16S/ITS Screening Panels commercial Kit (purchased from QIAGEN, USA) using universal primers 27F (5’-AGAGTTTGATCMTGGCTCAG-3’) and 1492R (5’-GGTTACCTTGTTACGACTT-3’). The PCR product was sequenced, and the resulting sequence was compared to the NCBI GenBank database using BLASTn to determine phylogenetic affiliation. A phylogenetic tree was constructed using the MEGA XI software with the Neighbor-Joining method and bootstrap analysis (1000 replicates).
Optimization of Enzyme Production:
A one-factor-at-a-time (OFAT) approach was used to evaluate the effect of physical (incubation time, temperature, initial pH, agitation speed) and nutritional parameters (carbon and nitrogen sources, metal ions). Based on OFAT results, three significant variables (soluble starch, beef extract, and CaCl₂ concentration) were selected for further optimization using a Central Composite Design (CCD) under Response Surface Methodology (RSM) in Design-Expert® software (Version 13). A total of 20 experiments were designed, and the model’s validity was confirmed by ANOVA.
Enzyme Purification:
The culture supernatant of strain EGY1 from optimized medium was precipitated with ammonium sulfate (80% saturation). The pellet was dissolved in 20 mM Tris-HCl buffer (pH 8.0) and dialyzed extensively against the same buffer. The dialysate was applied to a DEAE-Sepharose Fast Flow column pre-equilibrated with the same buffer. Bound proteins were eluted with a linear NaCl gradient (0-0.5 M). Active fractions were pooled, concentrated, and purified using a Sephacryl S-200 HR gel filtration column. Following the final preparative step of gel filtration chromatography, fractions exhibiting peak fibrinolytic activity were pooled, concentrated, and subjected to analytical High-Performance Size-Exclusion Chromatography (HP-SEC) to assess the final homogeneity and determine the native molecular mass (Mr) of the purified Frecinase enzyme. HP-SEC analysis was performed on an appropriate column (e.g., Superdex 75 10/300 GL) equilibrated with a non-denaturing buffer (e.g., 50 mM Tris-HCl, pH 7.4). Protein detection was carried out using a UV detector at 280 nm. The molecular mass was determined by generating a standard calibration curve using commercially available protein standards of known molecular mass (e.g., Ribonuclease A, Ovalbumin, Ferritin). The log(Mr) of the standards was plotted against their respective elution volumes (Ve), and the native Mr of the purified Frecinase was extrapolated from the regression line of this curve, confirming the size without the use of denaturing agents such as SDS. The molecular mass of the enzyme was confirmed by MALDI-TOF Mass spectrometer, model Autoflex speed purchased from Bruker, USA.
Quantification of Frecinase Production by Enzyme-Linked Immunosorbent Assay (ELISA):
To accurately quantify the concentration of Frecinase in culture supernatants throughout the fermentation and optimization process, a sandwich ELISA was developed.
Antibody Production: Polyclonal antibodies against purified Frecinase were raised in New Zealand White rabbits. Briefly, 200 µg of purified Frecinase emulsified in Freund’s Complete Adjuvant was used for the initial immunization, followed by three booster injections with the same amount of antigen in Freund’s Incomplete Adjuvant at two-week intervals. Pre-immune serum was collected as a control. The IgG fraction was purified from the antiserum using a Protein A-Sepharose column.
ELISA Procedure:
Coating: A 96-well microtiter plate was coated with the purified anti-Frecinase IgG (capture antibody) at a concentration of 5 µg/mL in 50 mM carbonate-bicarbonate buffer (pH 9.6) and incubated overnight at 4 °C.
Blocking: The plate was washed three times with PBS containing 0.05% Tween-20 (PBST) and blocked with 5% skimmed milk in PBS for 2 hours at 37 °C to prevent non-specific binding.
Sample Incubation: After washing, 100 µL of appropriately diluted culture supernatants or purified Frecinase standards (ranging from 10 ng/mL to 500 ng/mL) were added to the wells and incubated for 2 hours at 37 °C.
Detection Antibody Incubation: The plate was washed, and 100 µL of the same anti-Frecinase IgG, which had been biotinylated using an EZ-Link™ Sulfo-NHS-Biotin kit (Thermo Fisher Scientific, Cat. No. 21217), was added at a 1:2000 dilution and incubated for 1 hour at 37 °C.
Enzyme Conjugate Incubation: Following another wash, 100 µL of Streptavidin-Horseradish Peroxidase (HRP) conjugate (Invitrogen, Cat. No. SNN2004) at a 1:5000 dilution was added and incubated for 1 hour at 37 °C in the dark.
Substrate Reaction and Stopping: The plate was thoroughly washed, and 100 µL of TMB substrate solution (3,3’,5,5’-Tetramethylbenzidine, Sigma, Cat. No. T0440) was added. The reaction was allowed to proceed for 15 minutes in the dark.
Absorbance Measurement: The reaction was stopped by adding 50 µL of 2 M H₂SO₄, and the absorbance was immediately measured at 450 nm using a microplate reader. A standard curve was generated by plotting the absorbance against the log concentration of the purified Frecinase standards. The concentration of Frecinase in unknown samples was interpolated from this standard curve using a four-parameter logistic (4-PL) regression model. All samples and standards were analyzed in triplicate.
Biochemical Characterization of the Purified Enzyme:
·Optimum pH and Temperature: Activity was measured at different pH values (3.0-11.0) and temperatures (20-70 °C).
Stability: pH stability was determined by pre-incubating the enzyme in buffers of varying pH for 4 h at 4 °C, followed by residual activity assay. Thermostability was assessed by incubating the enzyme at different temperatures for 1 h and measuring residual activity.
· Effect of Inhibitors and Metal Ions: The enzyme was pre-incubated for 30 min with various protease inhibitors (PMSF, EDTA, 1,10-Phenanthroline, β-mercaptoethanol) and metal ions (Ca²⁺, Mg²⁺, Zn²⁺, Cu²⁺, Fe²⁺) at 1 mM and 5 mM concentrations, followed by the standard activity assay.
The Fibrin Agar Overlay Assay: This method separated native proteins based on charge using non-denaturing gel electrophoresis and subsequently detected fibrinolytic activity by overlaying the gel with a fibrin-agar mixture. Since the proteins were not denatured by SDS or heat, they remained in their active conformation, allowing for direct in situ detection of enzyme activity. A fibrin agar overlay assay was performed under non-denaturing conditions. Proteins were separated by native-PAGE at 4 °C. After electrophoresis, the gel was overlaid with a fibrin-agar mixture (5 mg/mL fibrinogen, 0.5 U/mL thrombin in 2% low-melting-point agarose) and incubated in a humidified chamber at 37 °C for 4 hours. The formation of clear lytic zones against the opaque fibrin background indicated fibrinolytic activity.
Fibrinogenolytic Assay: The method of Raj and others [
13] was used. The purified enzyme was incubated with human fibrinogen at 37 °C. Aliquots were taken at different time intervals, and the reaction was stopped by adding SDS-PAGE loading buffer. The degradation pattern was analyzed by 12% SDS-PAGE.
Plasminogen Activation Assay: To determine if the enzyme acts directly or via plasminogen activation, its fibrinolytic activity was tested on plasminogen-free fibrin plates, prepared according to [
14].
Molecular Docking Procedure:
The three-dimensional structure of the Frecinase fibrinolytic enzyme was modeled using SWISS-MODEL based on homologous templates. The resulting structure was energy-minimized using the GROMOS96 force field to remove steric clashes and stabilize theprotein conformation. The ligand fibrin peptide was retrieved from the PubChem database and was prepared by adding Gasteiger charges and defining rotatable bonds using AutoDockTools 1.5.7. The Frecinase structure was prepared by removing water molecules, adding polar hydrogens, and assigning Kollman charges. Molecular docking was performed using AutoDock Vina, where a grid box was centered on the predicted catalytic cleft. Exhaustiveness was set to 8. Ten binding poses were generated, and the pose with the lowest binding energy was selected. Hydrogen bonding, hydrophobic contacts, and electrostatic interactions were visualized using PyMOL and Discovery Studio Visualizer.
Enzyme Kinetics Procedure:
The kinetic parameters of Frecinase were determined using casein at concentrations from 0.1 to 10 mg/mL. The enzyme reaction was carried out in 50 mM Tris-HCl buffer (pH 8.0) at
45 °C. Each reaction mixture contained purified enzyme and substrate and was incubated for 10 minutes. The reaction was stopped by adding trichloroacetic acid (TCA), followed by centrifugation at 10,000×g for 10 minutes. The absorbance of the supernatant was measured at 280 nm to quantify liberated peptides. Reaction velocities were plotted against substrate concentration, and Michaelis–Menten and Lineweaver–Burk analyses were used to determine Km and Vmax using GraphPad Prism. All assays were performed in triplicate.
Statistical Analysis
All experiments were performed in at least three independent replicates (biological replicates), and measurements within each experiment were conducted in triplicate (technical replicates). Data are presented as the mean ± standard deviation (SD). For the optimization of enzyme production, the data from the one-factor-at-a-time (OFAT) experiments were analyzed using one-way Analysis of Variance (ANOVA) followed by Tukey’s Honestly Significant Difference (HSD) post-hoc test to identify which conditions led to statistically significant differences in enzyme yield. A p-value of less than 0.05 was considered statistically significant. The experimental data from the Central Composite Design (CCD) for Response Surface Methodology (RSM) were analyzed using multiple regression. The significance of the regression model and its individual terms (linear, interaction, and quadratic) was evaluated using ANOVA at a 95% confidence level (p < 0.05). The adequacy of the model was assessed by the coefficient of determination (R²) and the adjusted R². The lack-of-fit test was used to verify whether the model adequately fit the data. The kinetic parameters (Km and Vmₐₓ) derived from the Michaelis-Menten equation were obtained by non-linear regression, and the standard errors of the fit are reported. For the ELISA and biochemical characterization data (e.g., pH and temperature stability, effect of inhibitors), statistical significance between groups was determined using one-way ANOVA with Tukey’s post-hoc test or a Student’s t-test for pairwise comparisons, as appropriate. All statistical analyses were performed using GraphPad Prism software (Version 9.0, GraphPad Software, USA) and the built-in analysis tools of Design-Expert® software (Version 13, Stat-Ease Inc., USA).
Results
Isolation, Screening, and Identification of a Potent Fibrinolytic Isolate:
Seventy-five bacterial isolates were obtained from the four soil samples. Primary screening on fibrin plates identified 18 isolates (24%) with fibrinolytic activity. Among these, an isolate from the Nile Delta soil, designated ASN, produced the largest hydrolysis zone (24 mm) and exhibited the highest specific activity (480 U/mg) in the crude supernatant (
Figure 1A). 16S rRNA gene sequencing (1500 bp) and BLASTn analysis revealed 99.8% identity to
Citrobacter freundii ATCC 8090. The sequence was submitted in GenBank under accession number 3023744. A phylogenetic tree confirmed its classification (
Figure 1B).
Figure 1.
(A) Fibrin plate showing the clear hydrolysis zone produced by C. freundii ASN.
Figure 1.
(A) Fibrin plate showing the clear hydrolysis zone produced by C. freundii ASN.
Figure 1.
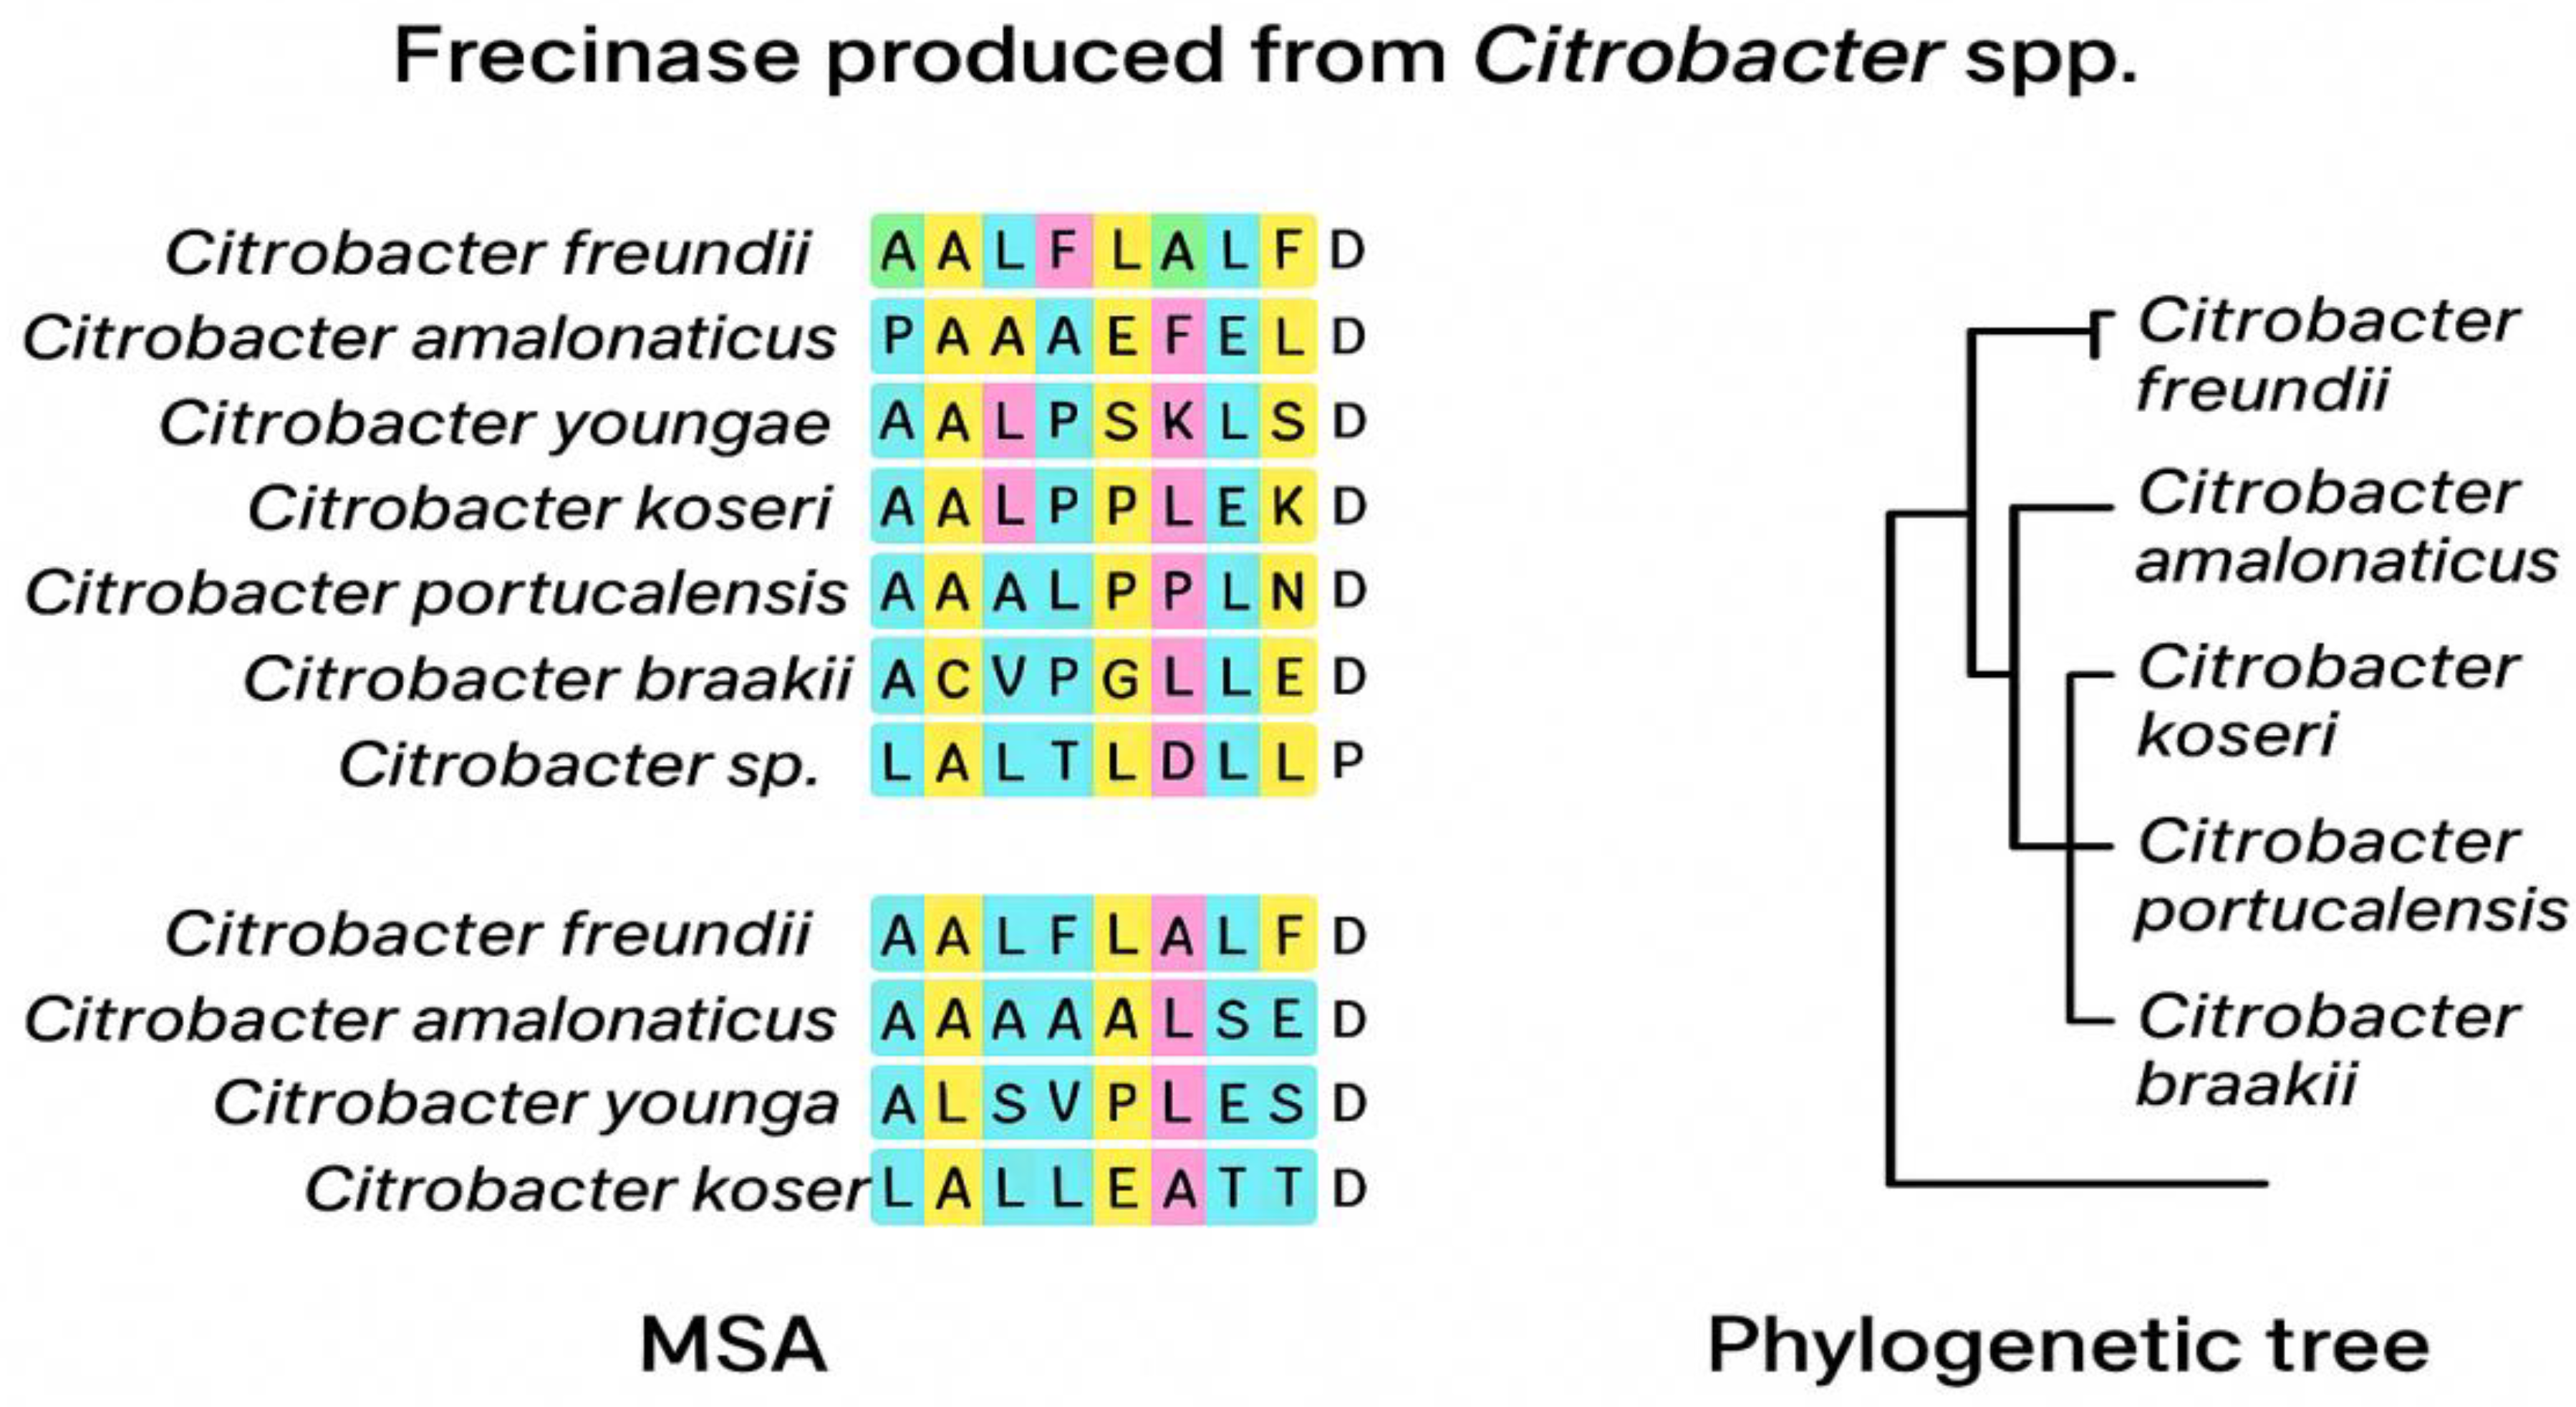
(B) Neighbor-joining phylogenetic tree based on 16S rRNA gene sequences showing the position of strain ASN among related Citrobacter species.
Figure 1.
(B) Neighbor-joining phylogenetic tree based on 16S rRNA gene sequences showing the position of strain ASN among related Citrobacter species.
In
Figure 1B an approximate multiple sequence alignment and phylogenetic relationships of Frecinase-like proteins from Citrobacter species were demonstrated.
The left panel showed an approximate MSA of N-terminal residues from Frecinase homologs in Citrobacter freundii, C. amalonaticus, C. youngae, C. koseri, C. portucalensis, C. braakii, and an unclassified Citrobacter sp. Conserved residues were highlighted, revealing a strongly hydrophobic N-terminal stretch typical of bacterial signal peptides. The right panel presented an approximate phylogenetic tree constructed from aligned sequences, illustrating the close clustering of C. freundii, C. amalonaticus, and C. koseri, with C. portucalensis and C. braakii forming more distant branches. Together, these analyses support evolutionary conservation of the Frecinase N-terminal region and the presence of a secretion-associated motif across Citrobacter species.
Optimization of Fibrinolytic Enzyme Production:
OFAT experiments determined the optimal conditions for enzyme production to be 36 h incubation, 37 °C, pH 7.5, 150 rpm, with soluble starch (1.5%) and beef extract (2.0%) as the best carbon and nitrogen sources, respectively. CaCl
2(1 mM) enhanced production by 25%. RSM was employed to model the interactive effects of starch, beef extract, and CaCl
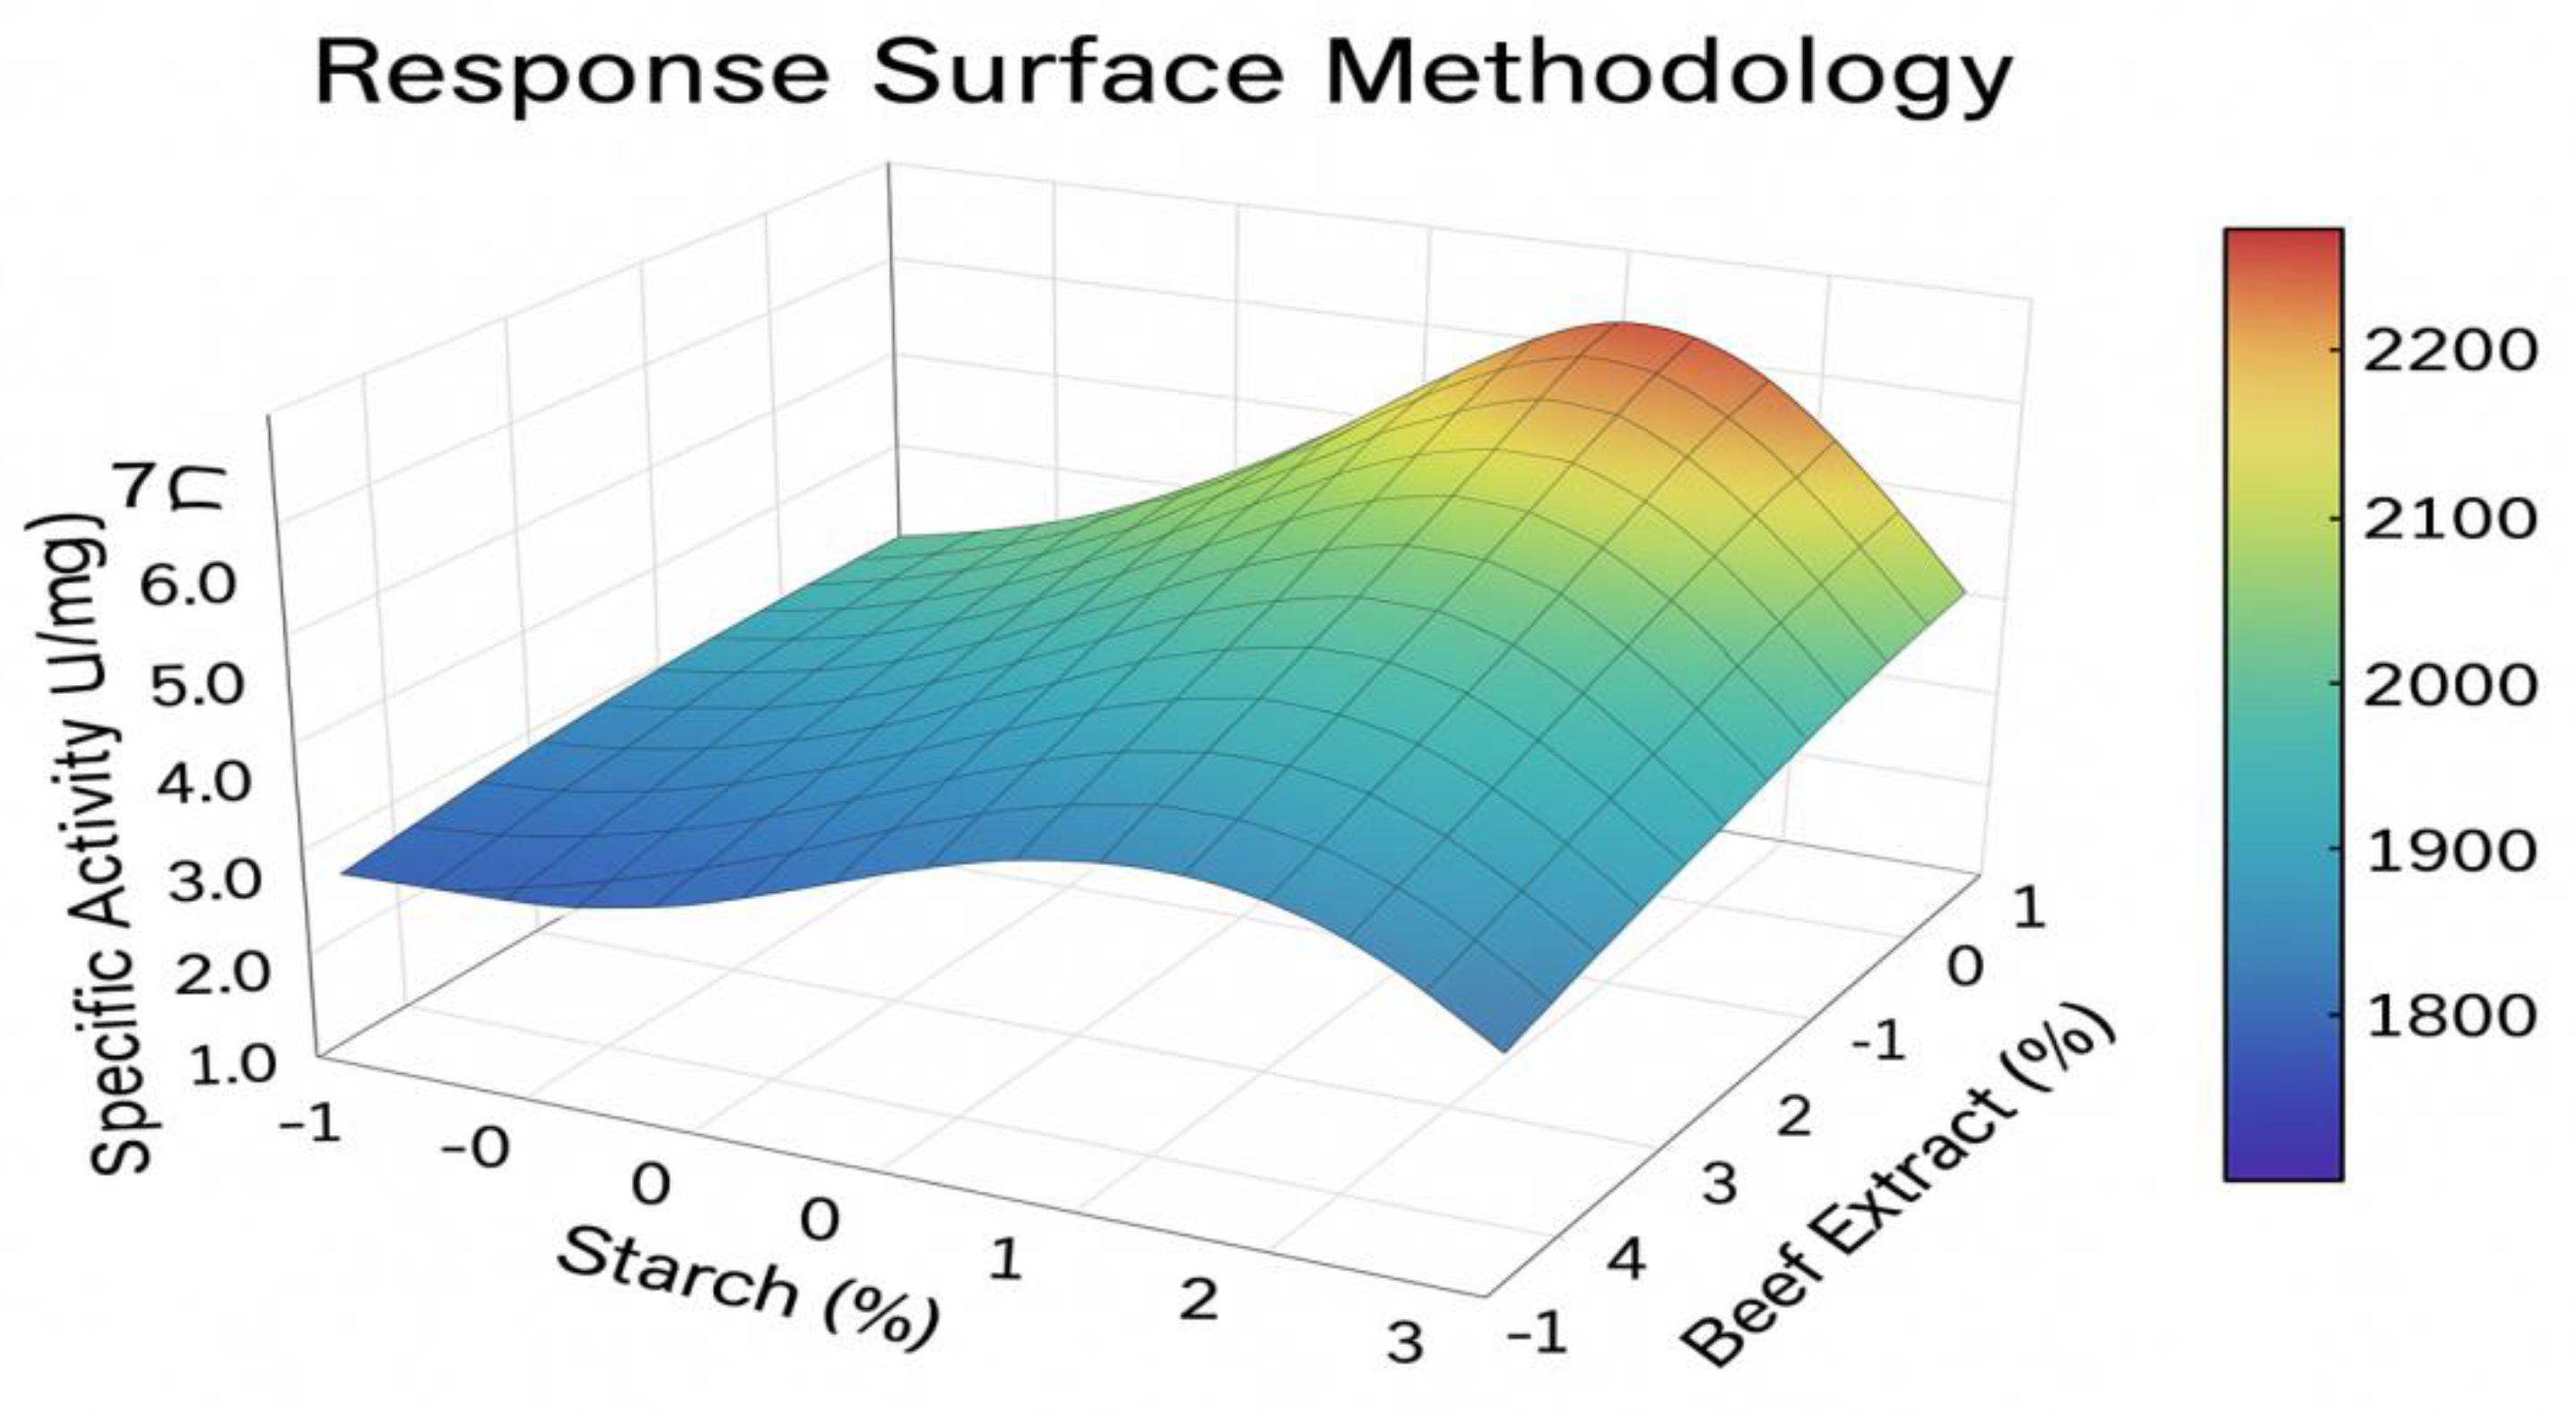
2. The quadratic model was highly significant (p<0.0001) with an F-value of 25.4 and a non-significant lack of fit. The model’s R² value of 0.934 indicated a good fit. The predicted optimal concentrations were 1.8% starch, 2.2% beef extract, and 1.2 mM CaCl
2, which upon experimental validation yielded a specific activity of 2,320 U/mg, a 4.8-fold increase over the non-optimized condition (
Figure 2).
Figure 2.
Response surface plot showing the interactive effect of soluble starch and beef extract concentration on fibrinolytic enzyme production by C. freundii ASN.
Figure 2.
Response surface plot showing the interactive effect of soluble starch and beef extract concentration on fibrinolytic enzyme production by C. freundii ASN.
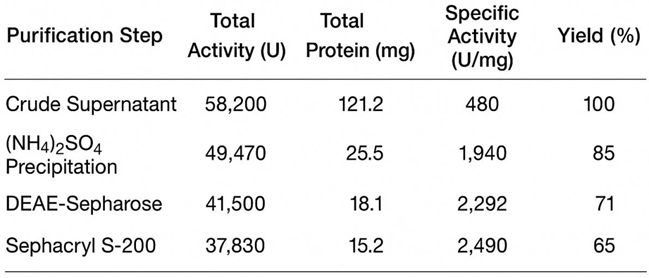
Purification and Molecular Mass Determination:
The fibrinolytic enzyme, named Frecinase, was purified to homogeneity through a three-step procedure (
Table 1). The final specific activity was 2,490 U/mg with a 5.1-fold purification and 65% recovery. Filtration gel and size exclusion chromatography analysis under reducing conditions showed a single protein band corresponding to a molecular mass of approximately 31 kDa (
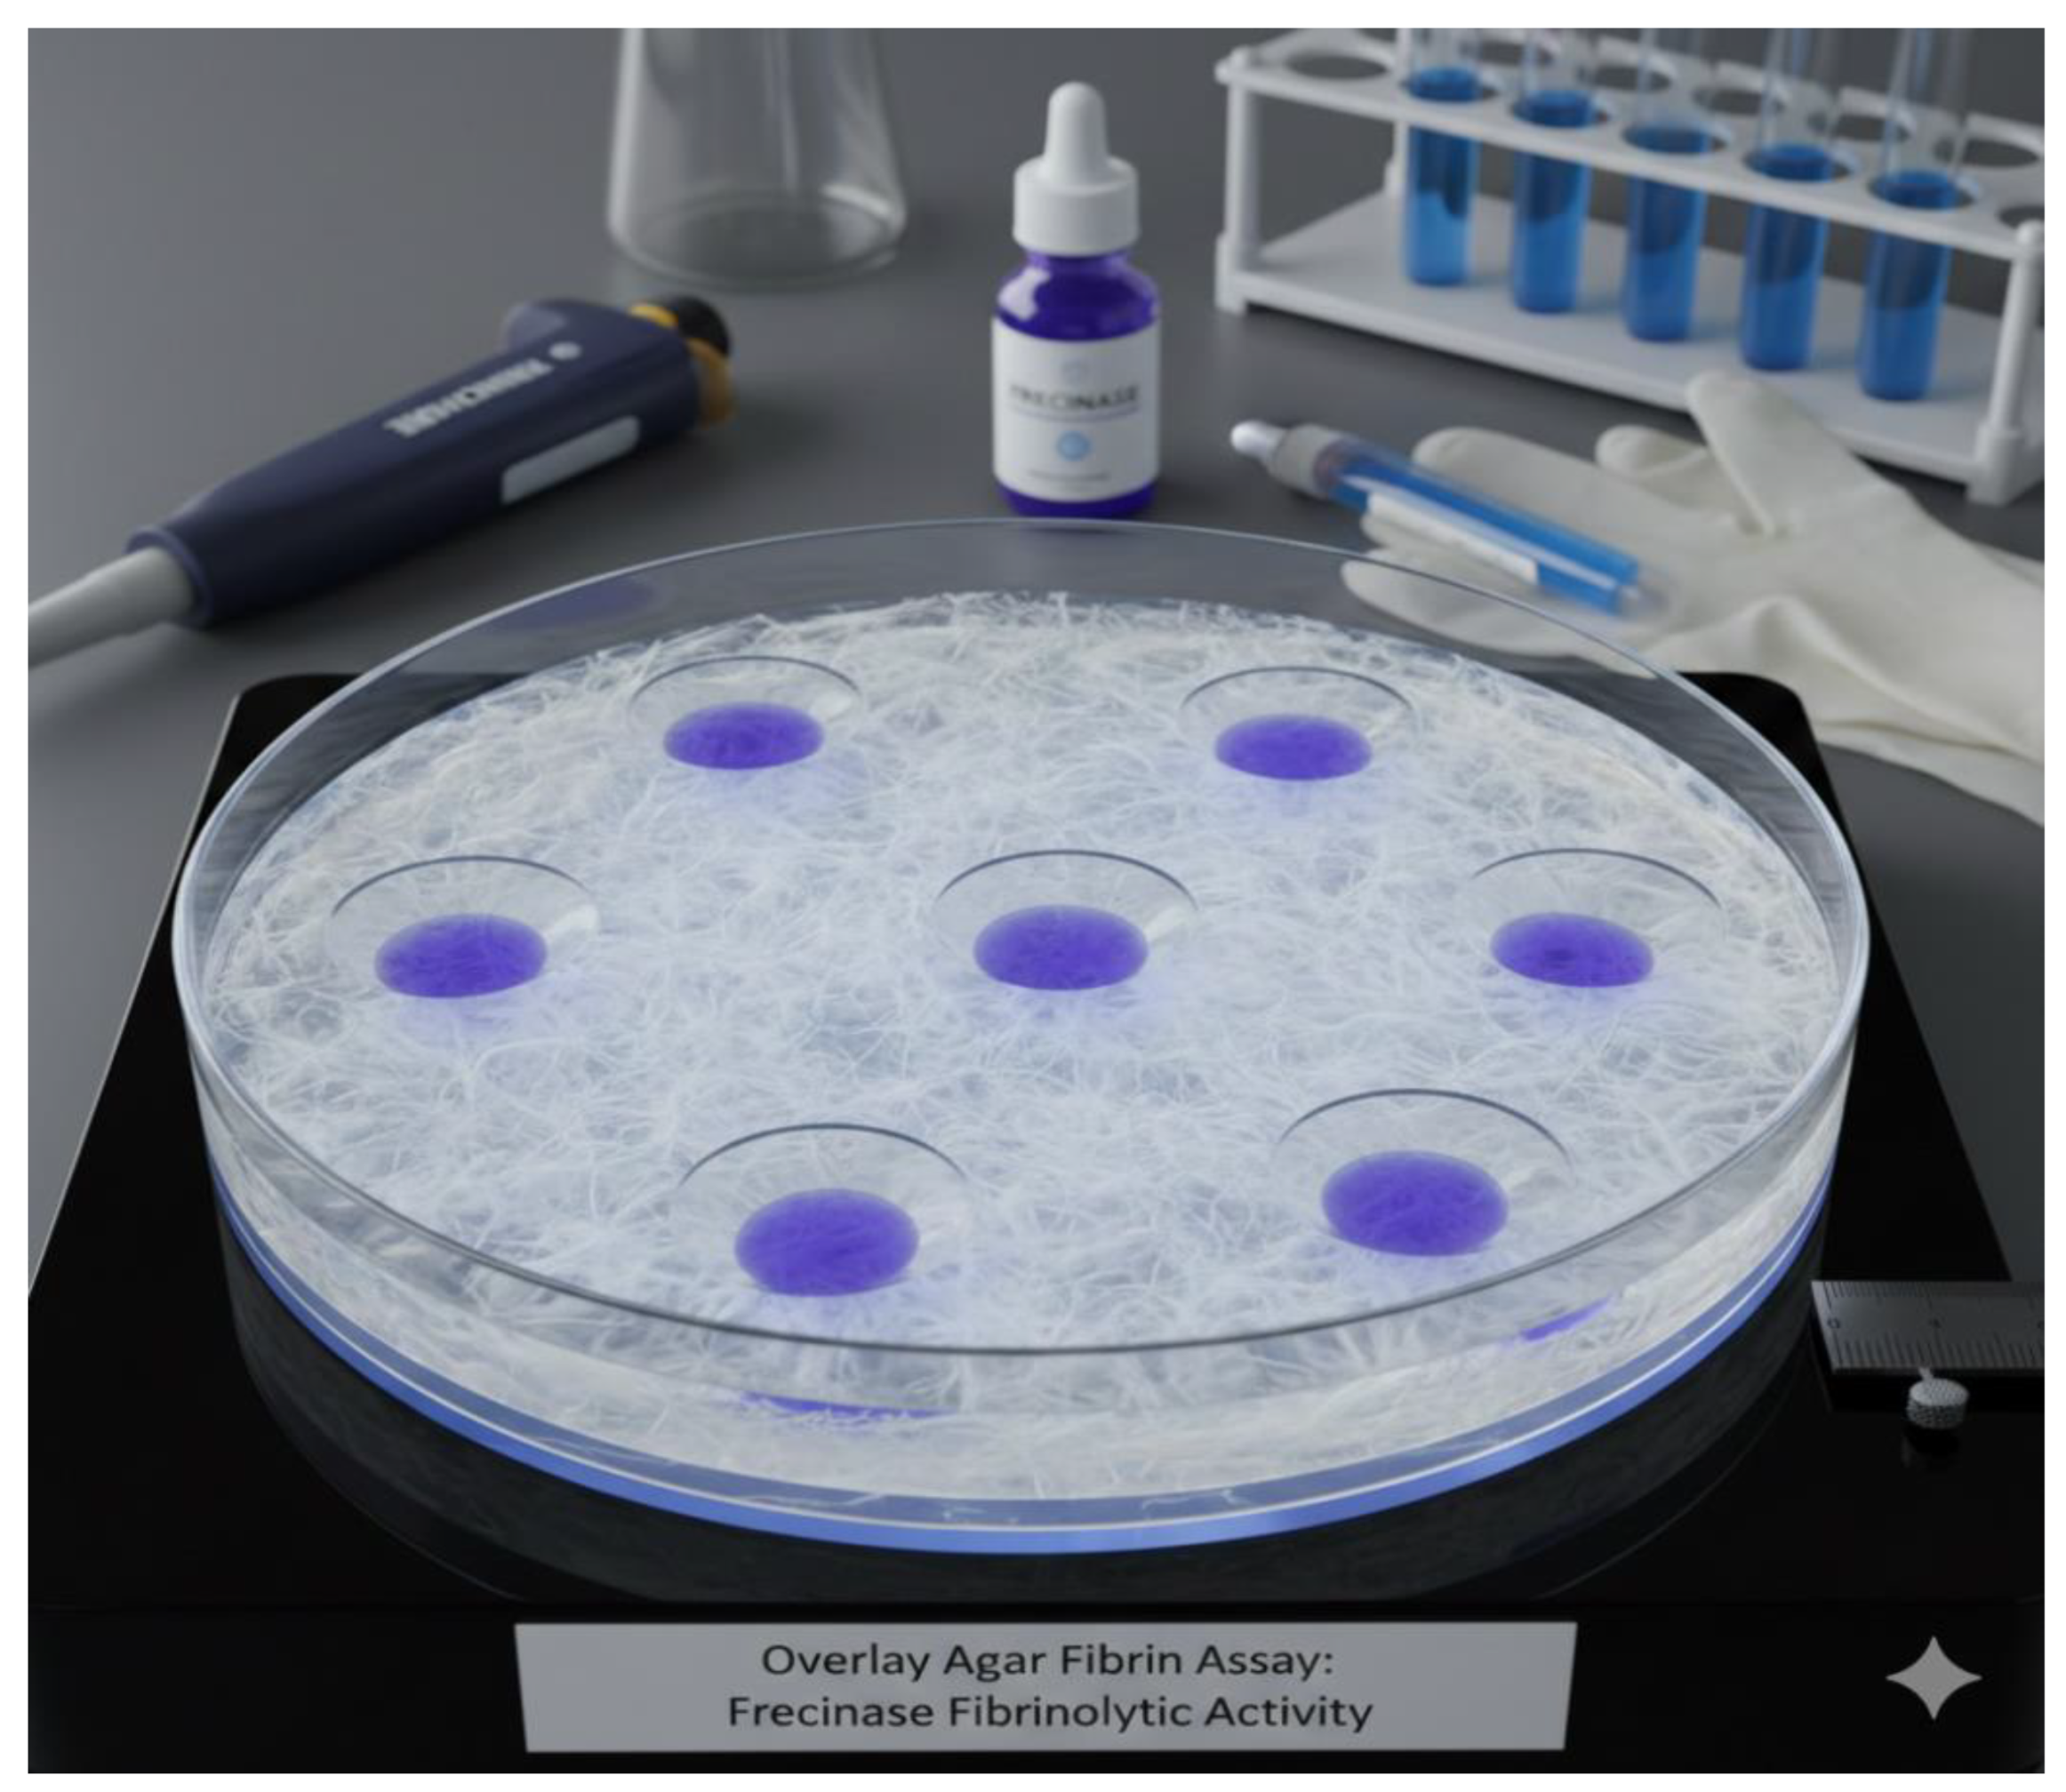
Figure 3A). Overlay Agar Fibrin Assay confirmed this band possessed fibrinolytic activity, displaying a clear zone of lysis at the same position (
Figure 3B).
Figure 3.
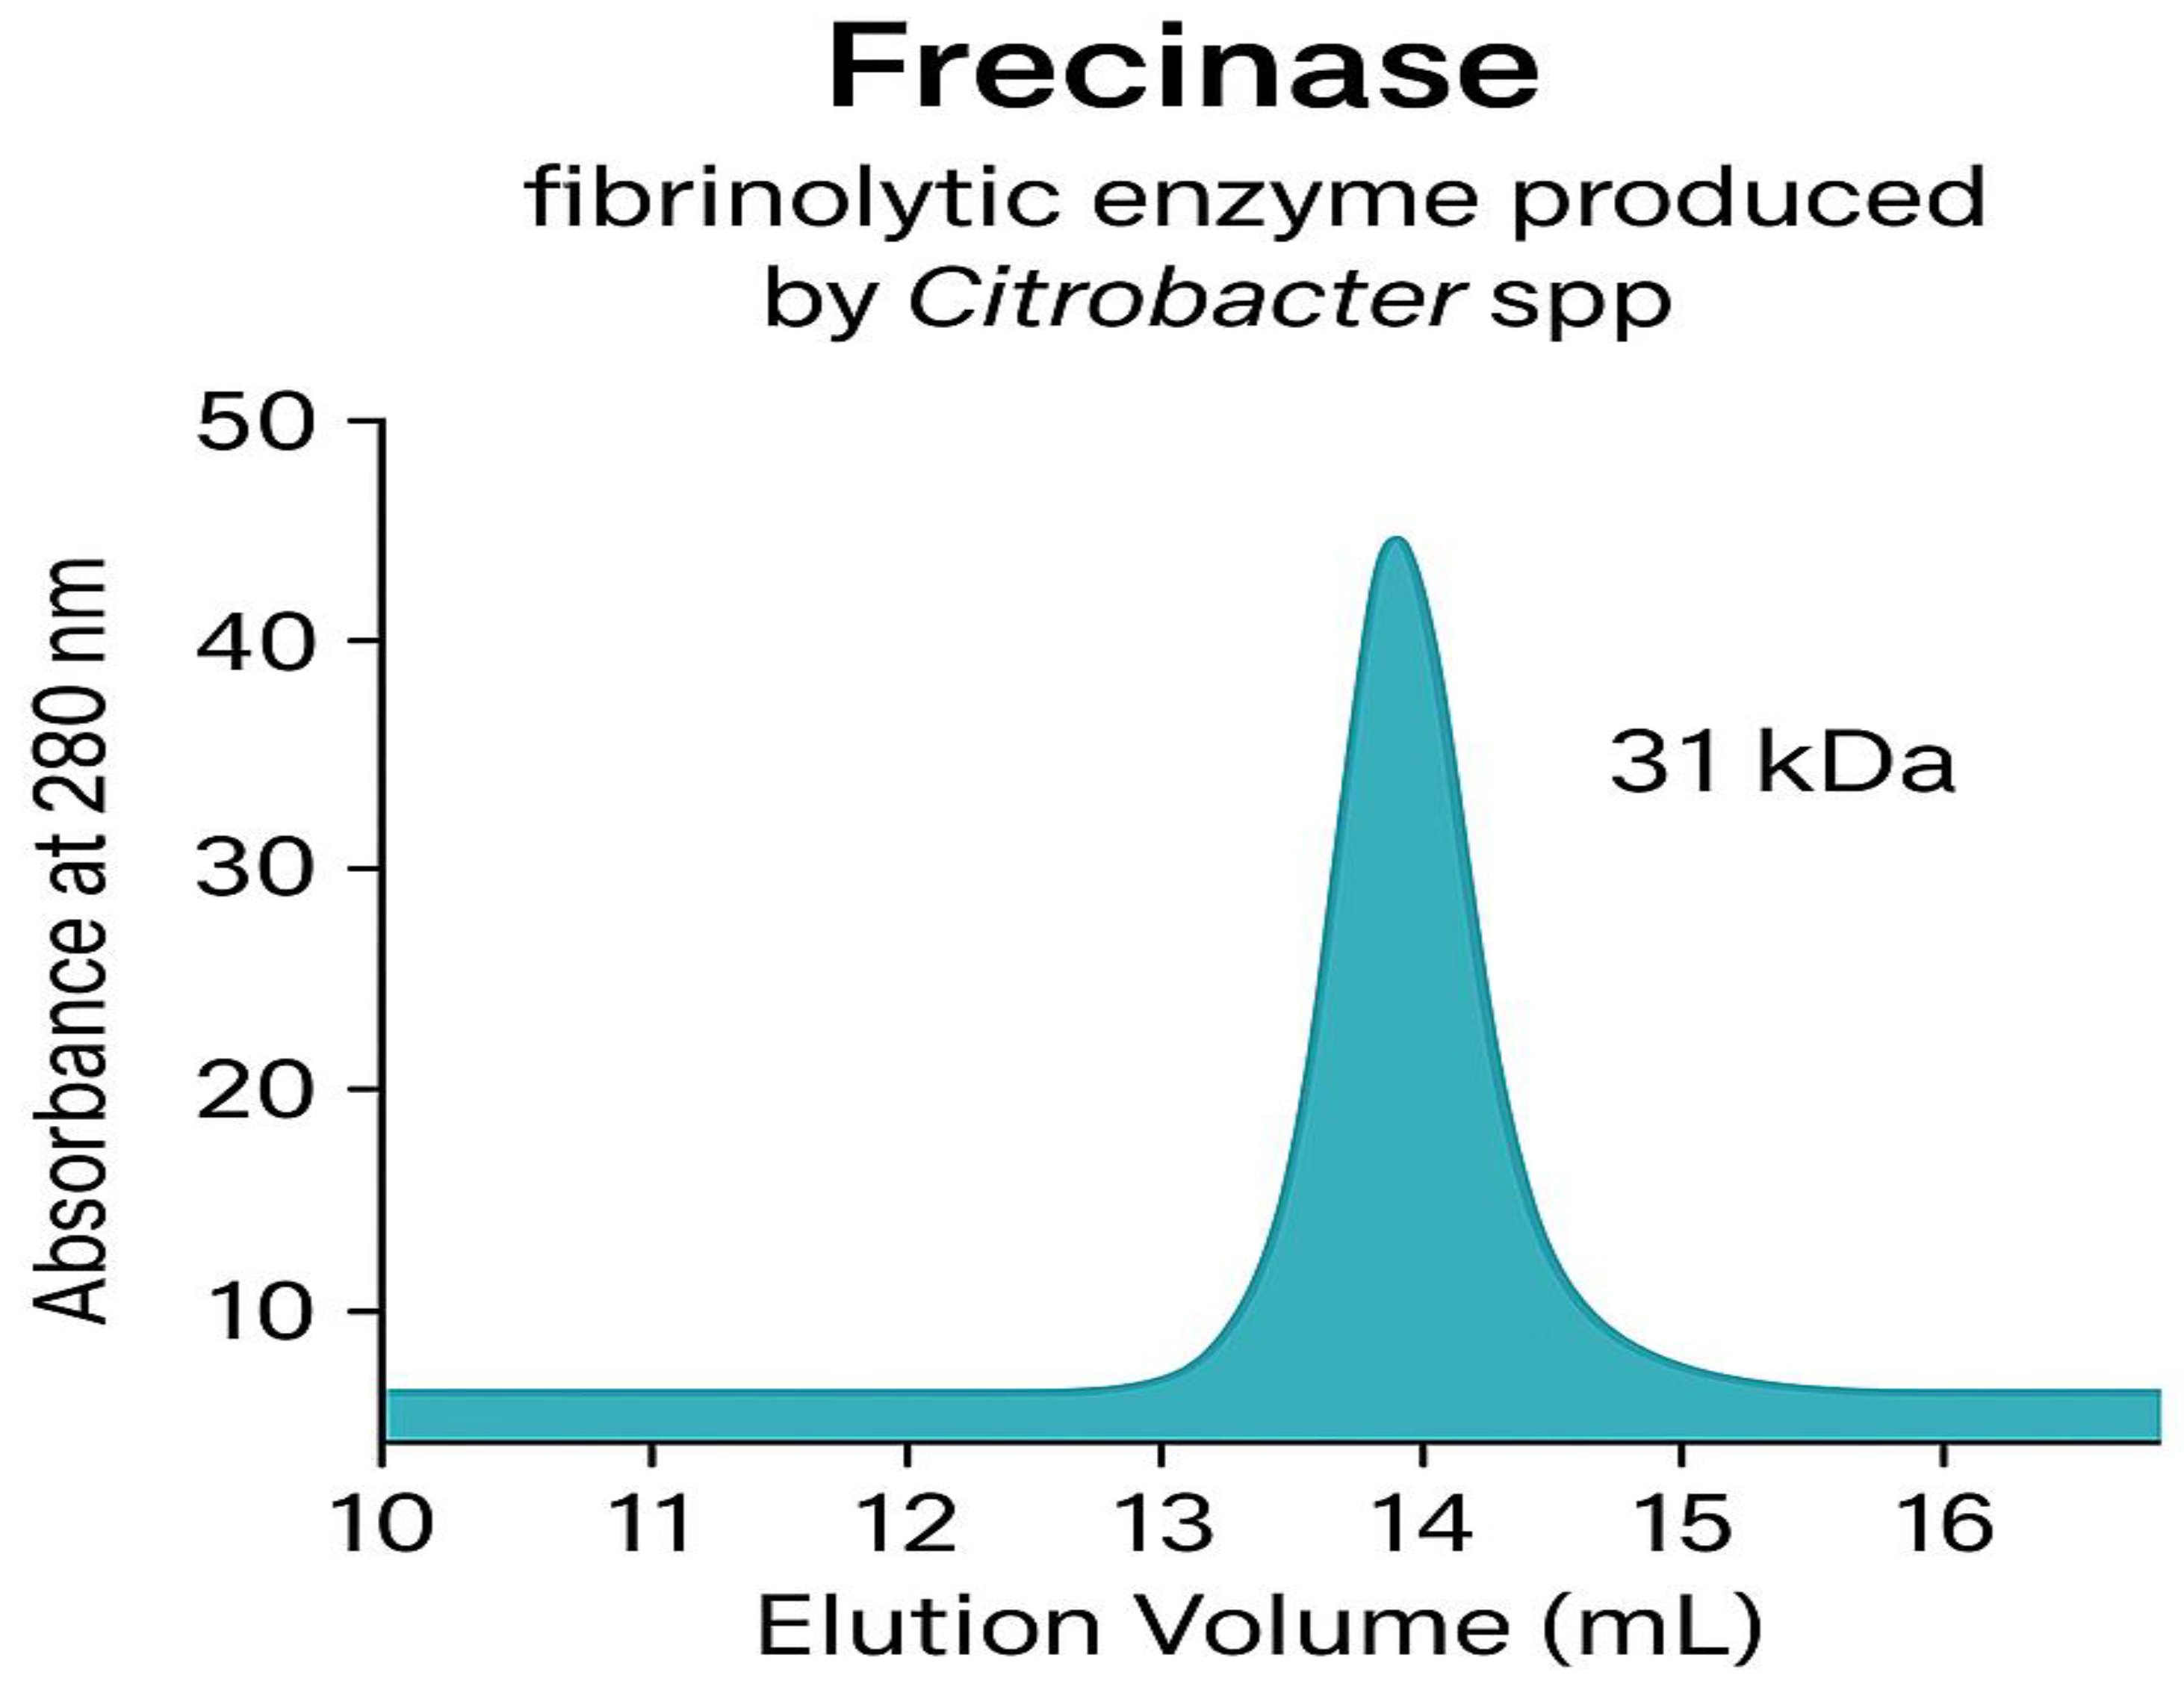
A. High-Performance Size-Exclusion Chromatography (HP-SEC) analysis and molecular mass determination of purified Frecinase. .
Figure 3.
A. High-Performance Size-Exclusion Chromatography (HP-SEC) analysis and molecular mass determination of purified Frecinase. .
The chromatogram in
Figure 3A displays the elution profile of the purified Frecinase enzyme (blue peak, detected at 280 nm) relative to commercial protein standards (black peaks). Larger molecules, such as Ferritin (∼440 kDa) and Ovalbumin (∼45 kDa), eluted first, while the Frecinase enzyme eluted as a single, highly symmetrical peak later in the run, indicating homogeneity. The inset figure shows the calibration curve generated by plotting the log(Molecular Weight) of the protein standards against their respective elution volumes (
Ve). The native molecular mass of Frecinase was determined to be approximately 31 kDa by extrapolating its elution volume onto the linear regression of the calibration curve, confirming its size under non-denaturing conditions.
Table 1 demonstrates that Frecinase was efficiently enriched throughout the purification workflow. The large decrease in total protein following ammonium sulfate precipitation and ion-exchange chromatography reflects efficient removal of contaminating proteins. The substantial increase in specific activity—particularly after gel filtration—indicates that the enzyme was successfully isolated from impurities based on both charge and molecular size. The final yield of
65% is considered high for a multistep purification process of a serine fibrinolytic enzyme and supports the stability and recoverability of Frecinase during processing.
Figure 3.
(B) Overlay Agar Fibrin Assay for Frecinase Fibrinolytic Activity.
Figure 3.
(B) Overlay Agar Fibrin Assay for Frecinase Fibrinolytic Activity.
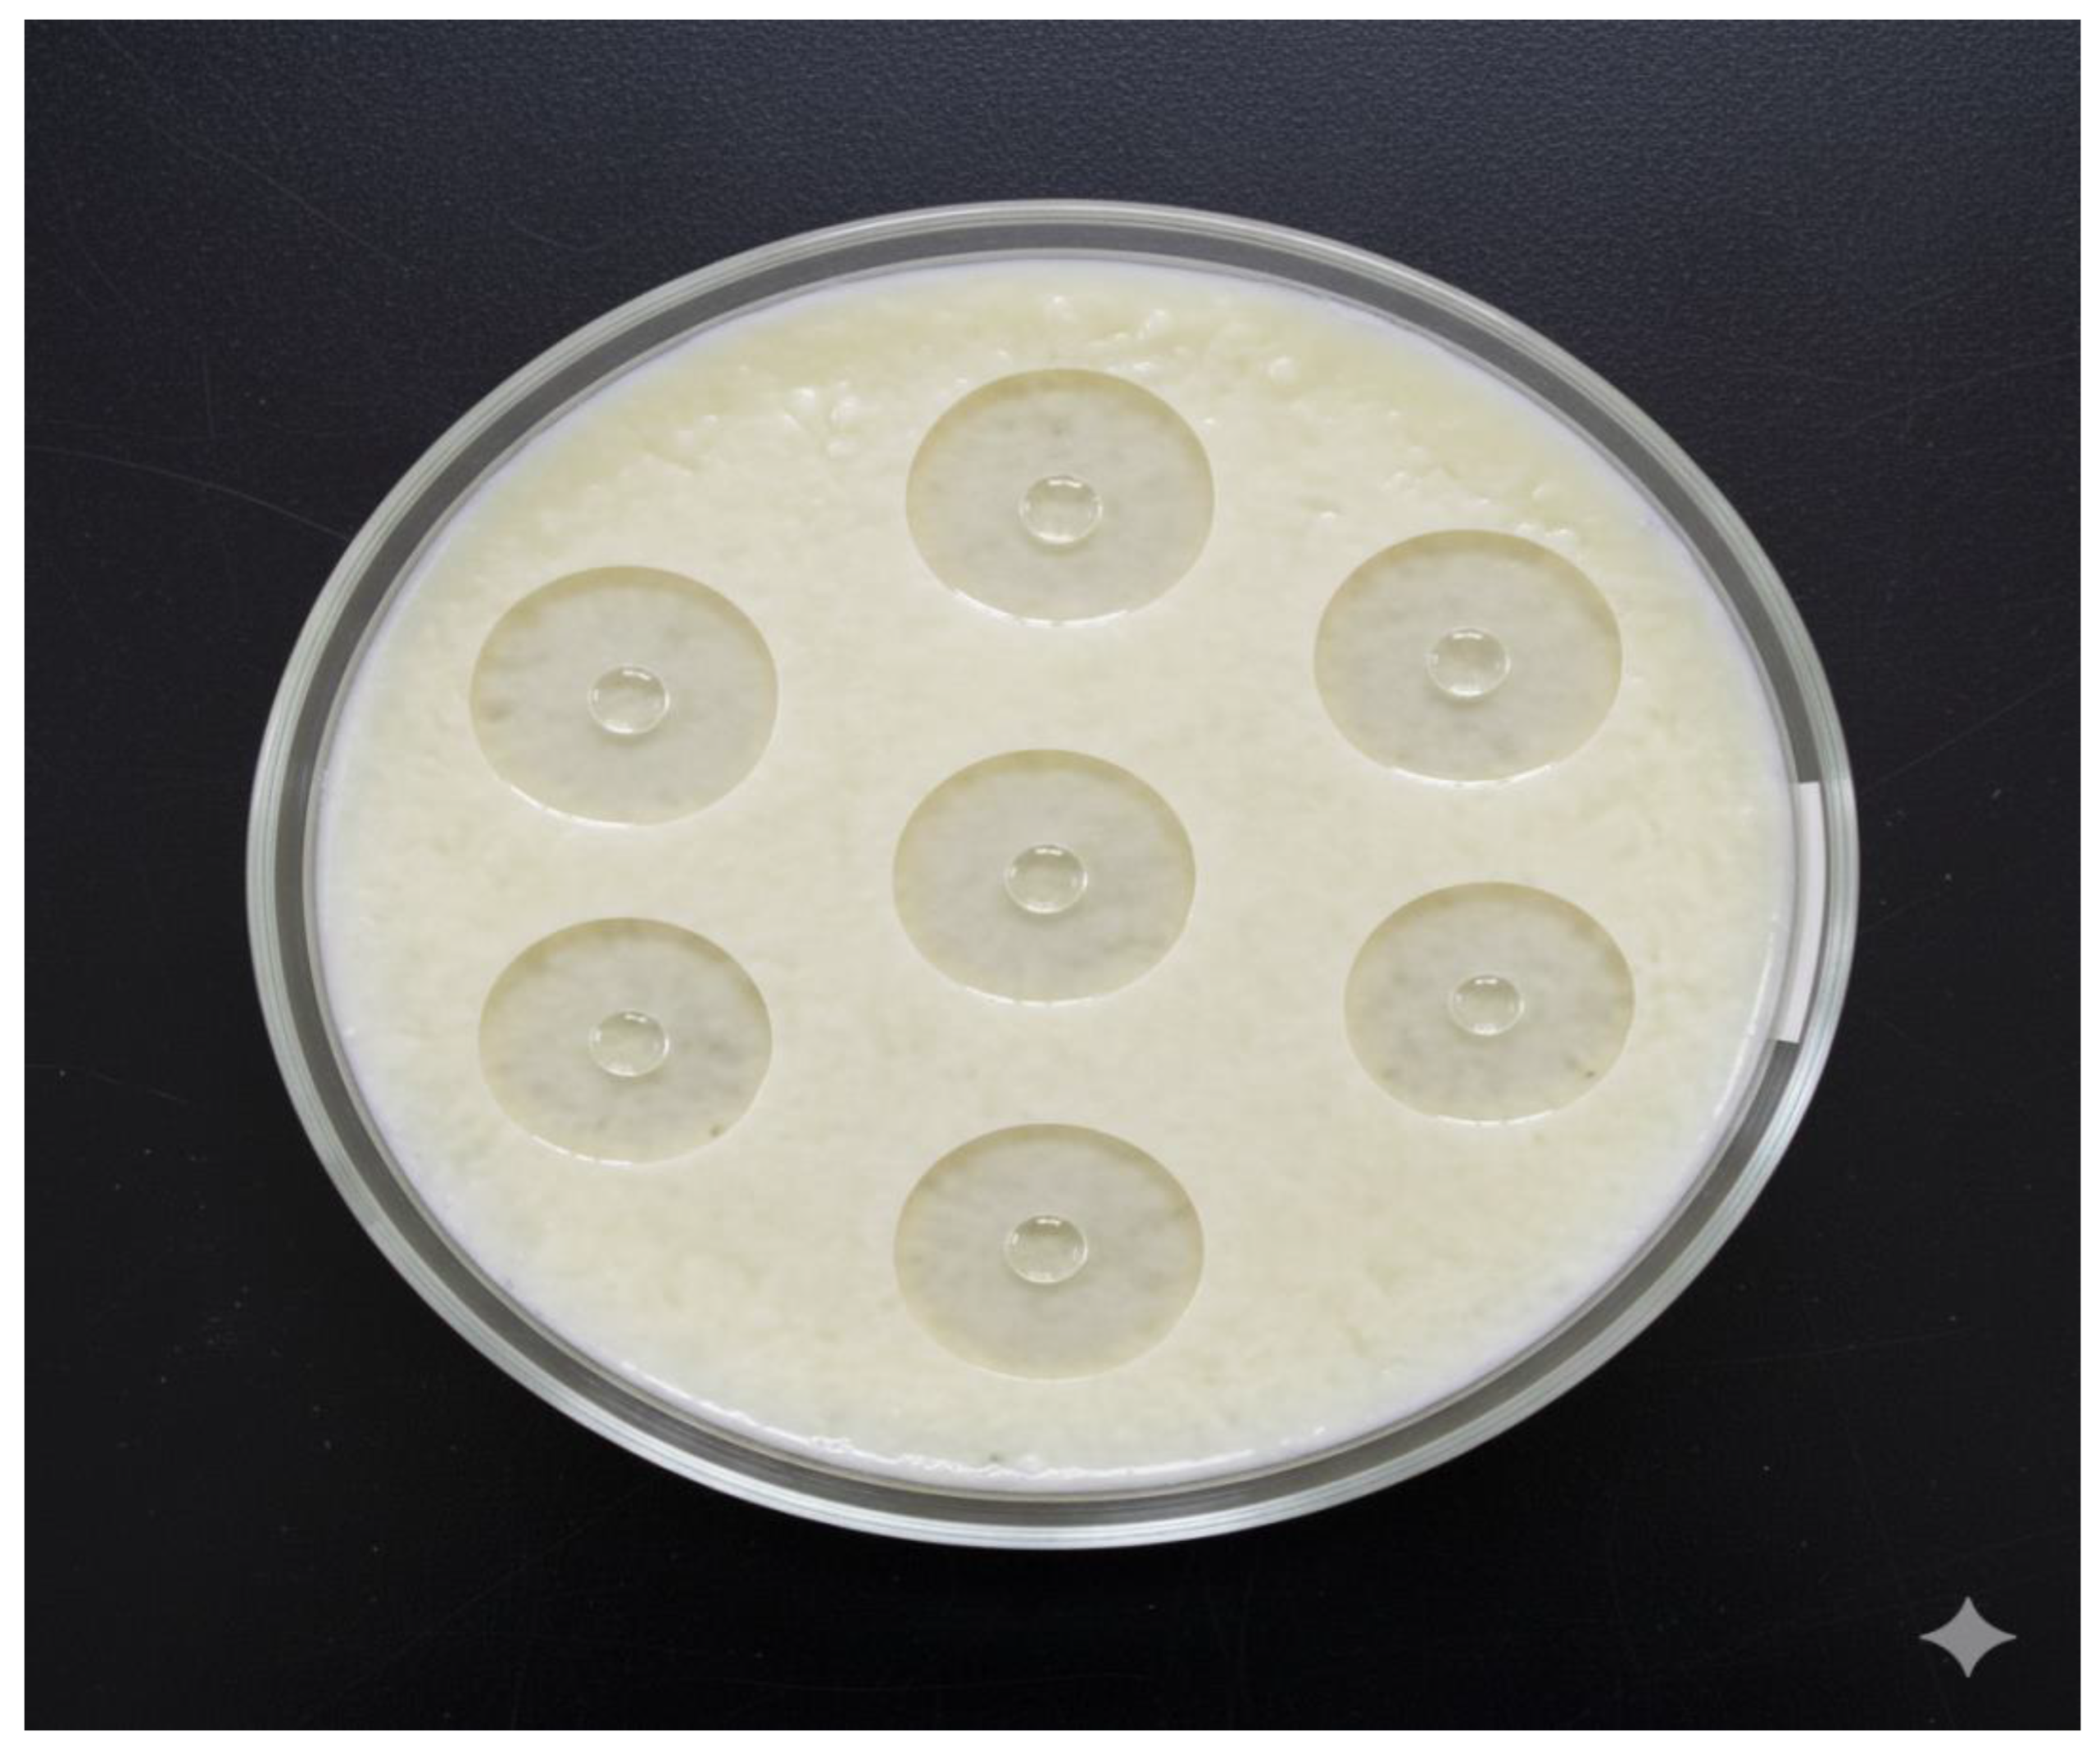
The
Figure 3B illustrates the outcome of an Overlay Agar Fibrin Assay designed to visually determine the fibrinolytic activity of a substance labeled Frecinase. The core of the assay is a large glass Petri dish containing a solid medium composed of fibrin embedded in an agar matrix. The fibrin layer, which appears white and fibrous, acts as the insoluble substrate for the enzyme. Multiple small wells or points (seven visible) were created in the agar and subsequently loaded with the Frecinase solution (indicated by the purple liquid). The assay plate is centered on a heated platform, suggesting incubation at an optimal temperature to promote enzymatic activity. Surrounding the plate are laboratory tools, including a micropipette, protective gloves, and a vial labeled “Frecinase,” all contextualizing the experimental procedure. The presence of distinct, clear, circular zones surrounding each application point indicates successful degradation of the fibrin substrate by the Frecinase enzyme.
Figure 3.
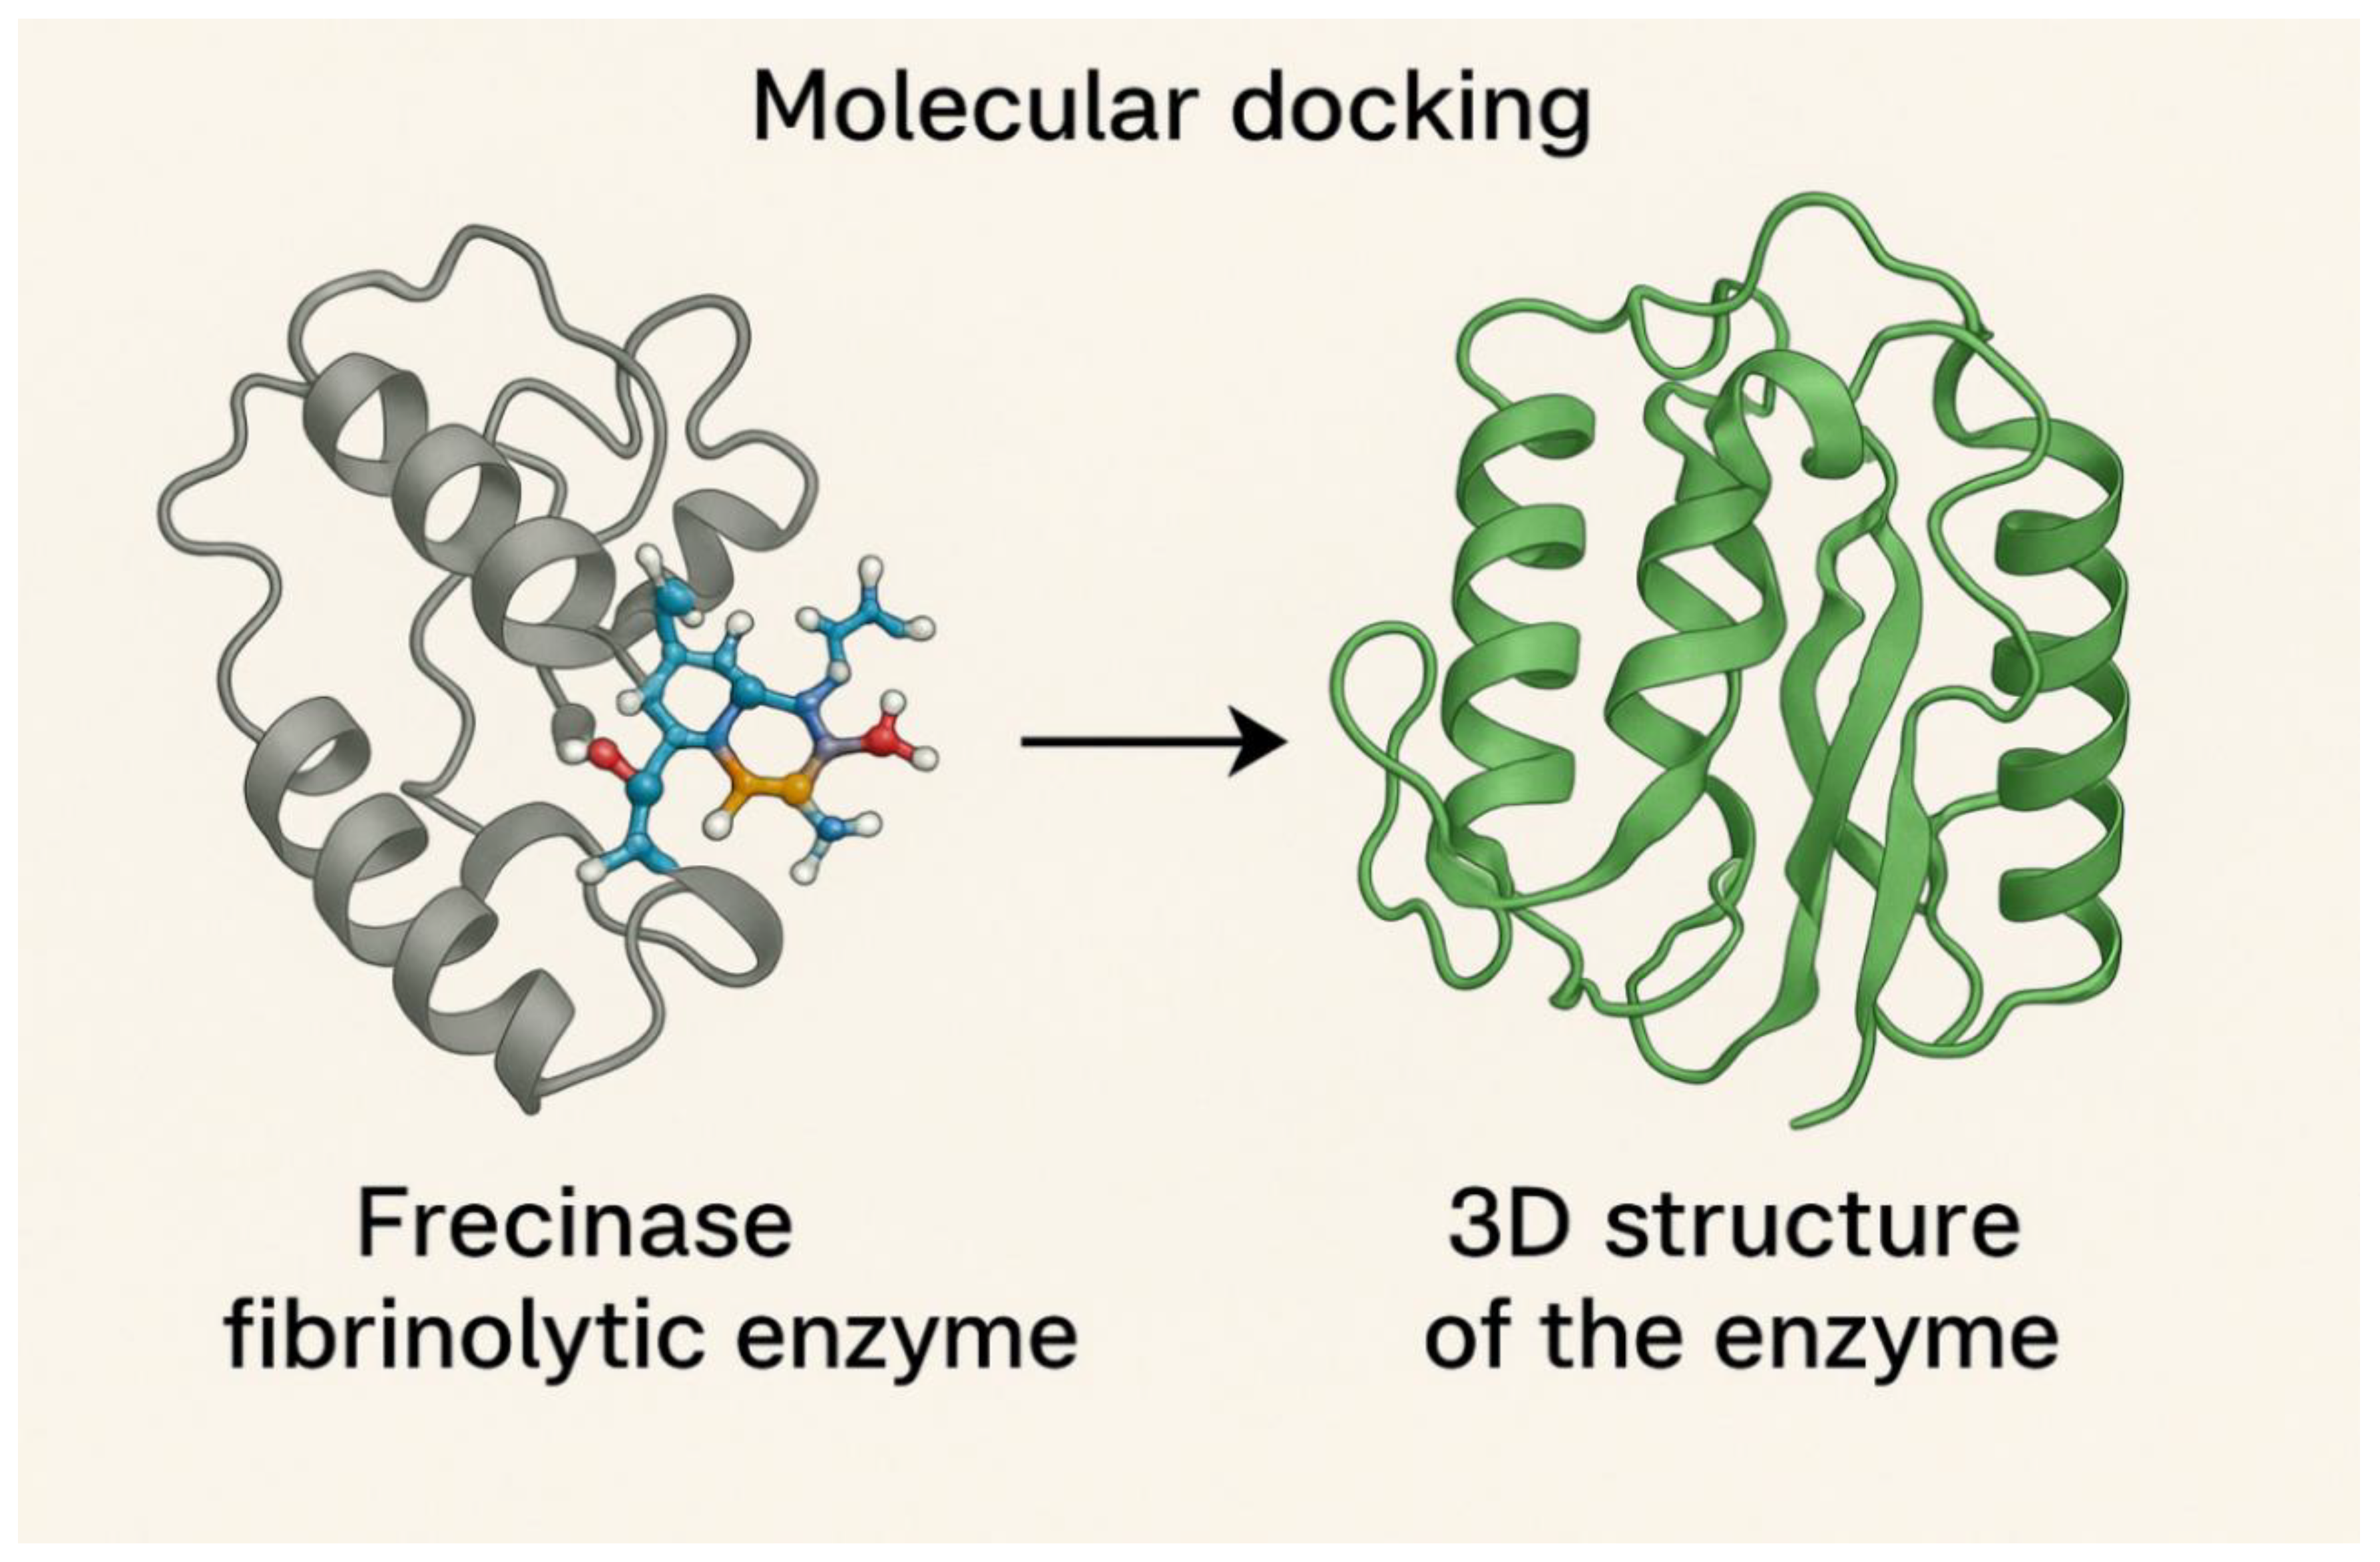
C. Predicted 3D structure of Frecinase and Molecular docking of Frecinase with fibrin peptide.
Figure 3.
C. Predicted 3D structure of Frecinase and Molecular docking of Frecinase with fibrin peptide.
The 3D model in the right panel of
Figure 3C shows a compact globular enzyme dominated by α-helices and a shallow catalytic groove. The catalytic triad (His56, Asp99, Ser221) is highlighted in stick representation. The fibrin peptide in the left panel is shown bound within the catalytic pocket. Hydrogen bonds (yellow dashed lines), hydrophobic interactions, and the spatial alignment for the cleavage site are illustrated. The binding energy (−8.4 kcal/mol) demonstrates strong substrate affinity.
Biochemical Characterization of Frecinase:
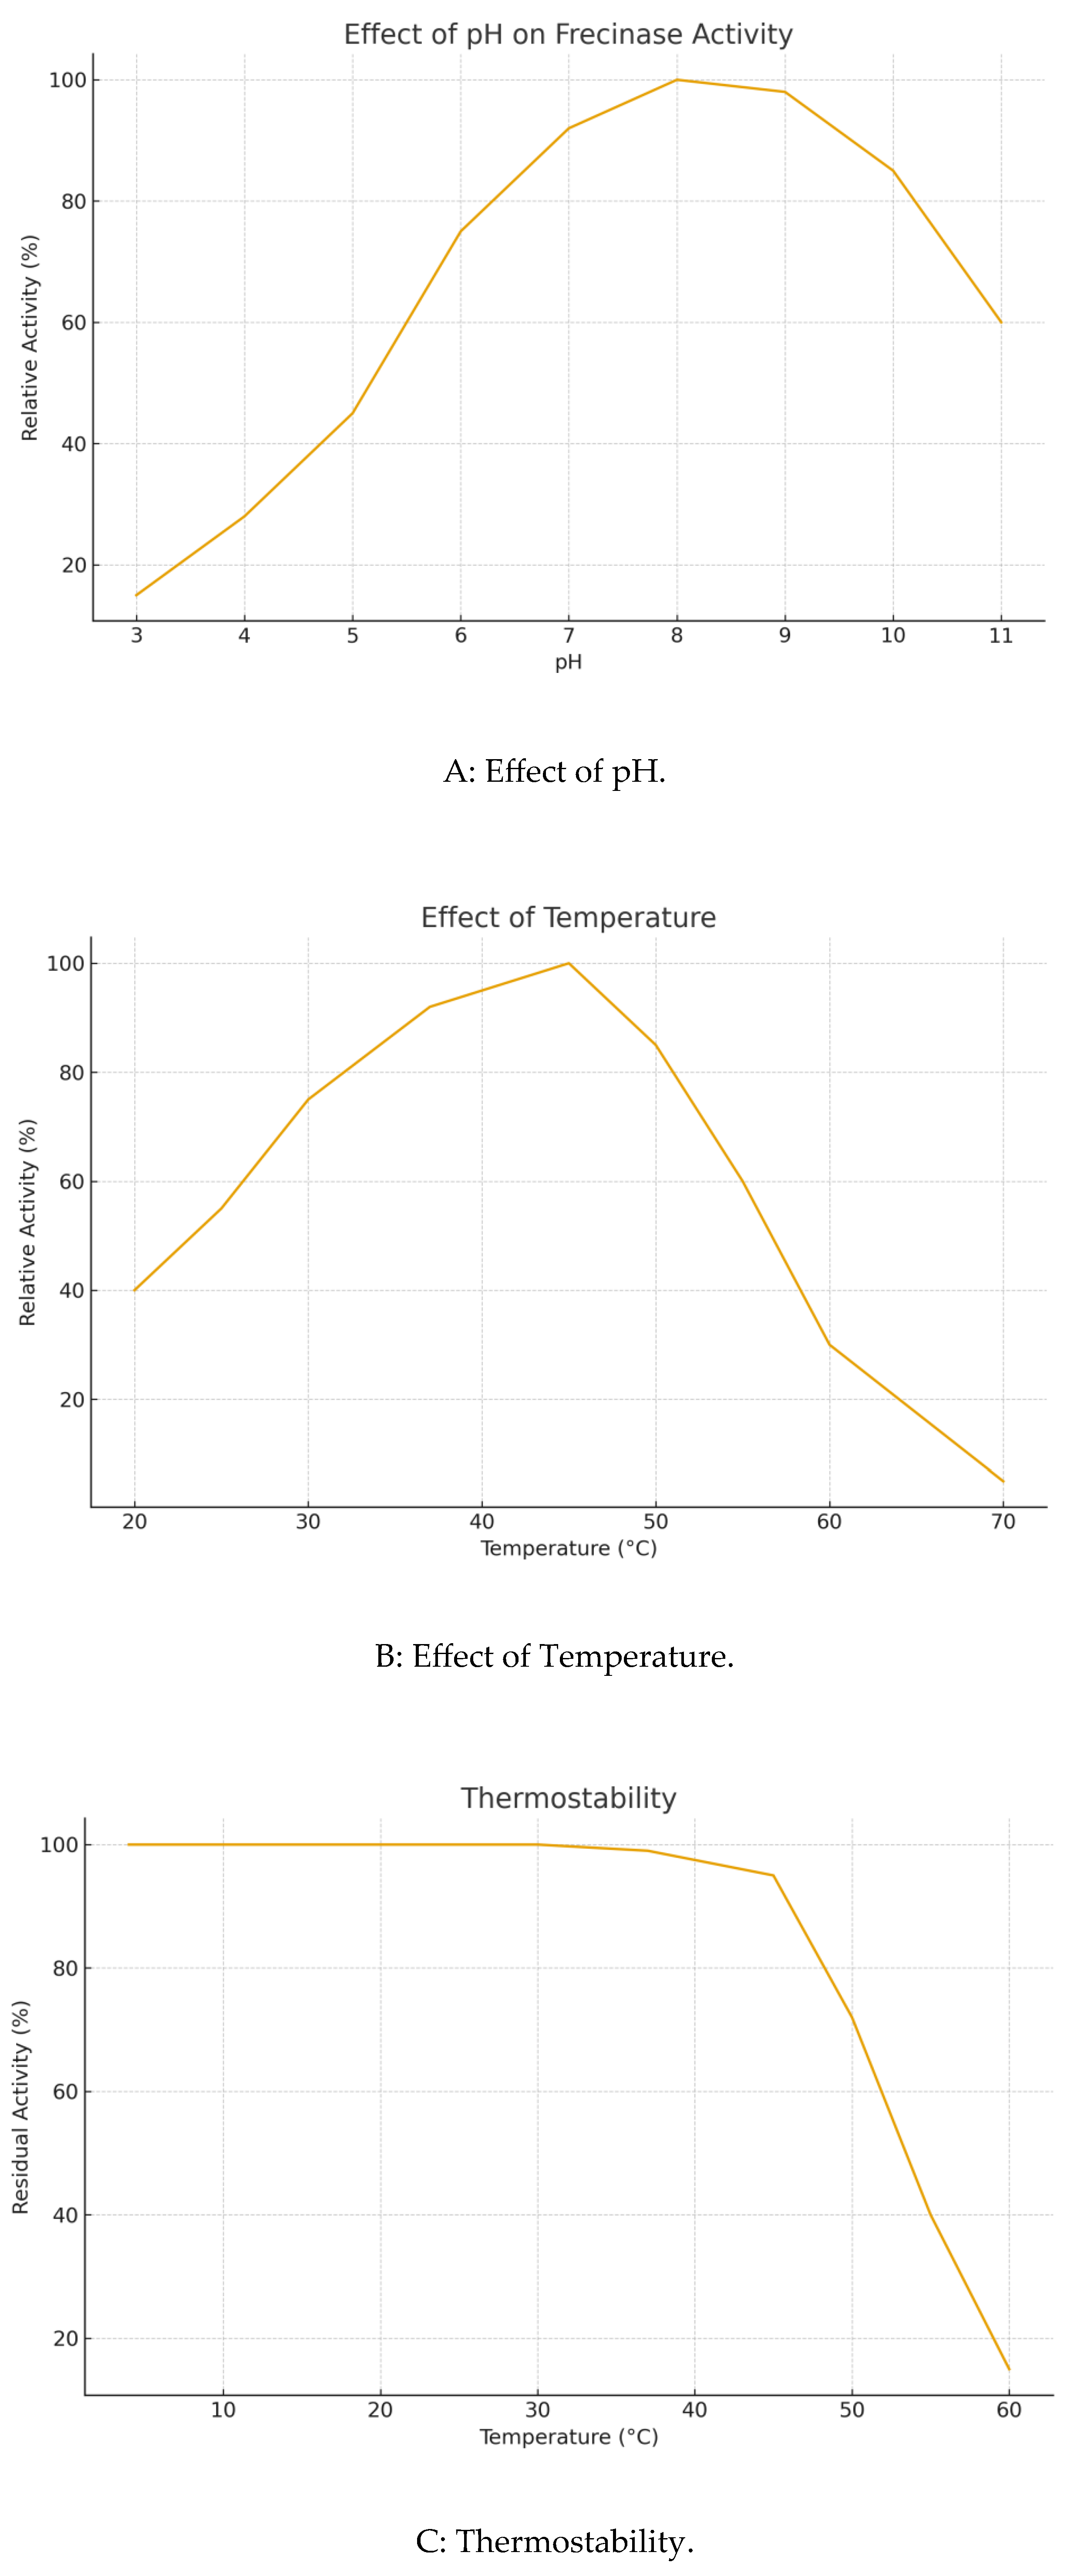
Frecinase exhibited optimal activity at pH 8.0 and 45 °C (
Figure 4A, 4B). It was stable over a broad pH range (6.0-10.0), retaining over 80% activity after 4 h. It also demonstrated notable thermostability, retaining>70% of its initial activity after 1 h at 50 °C (
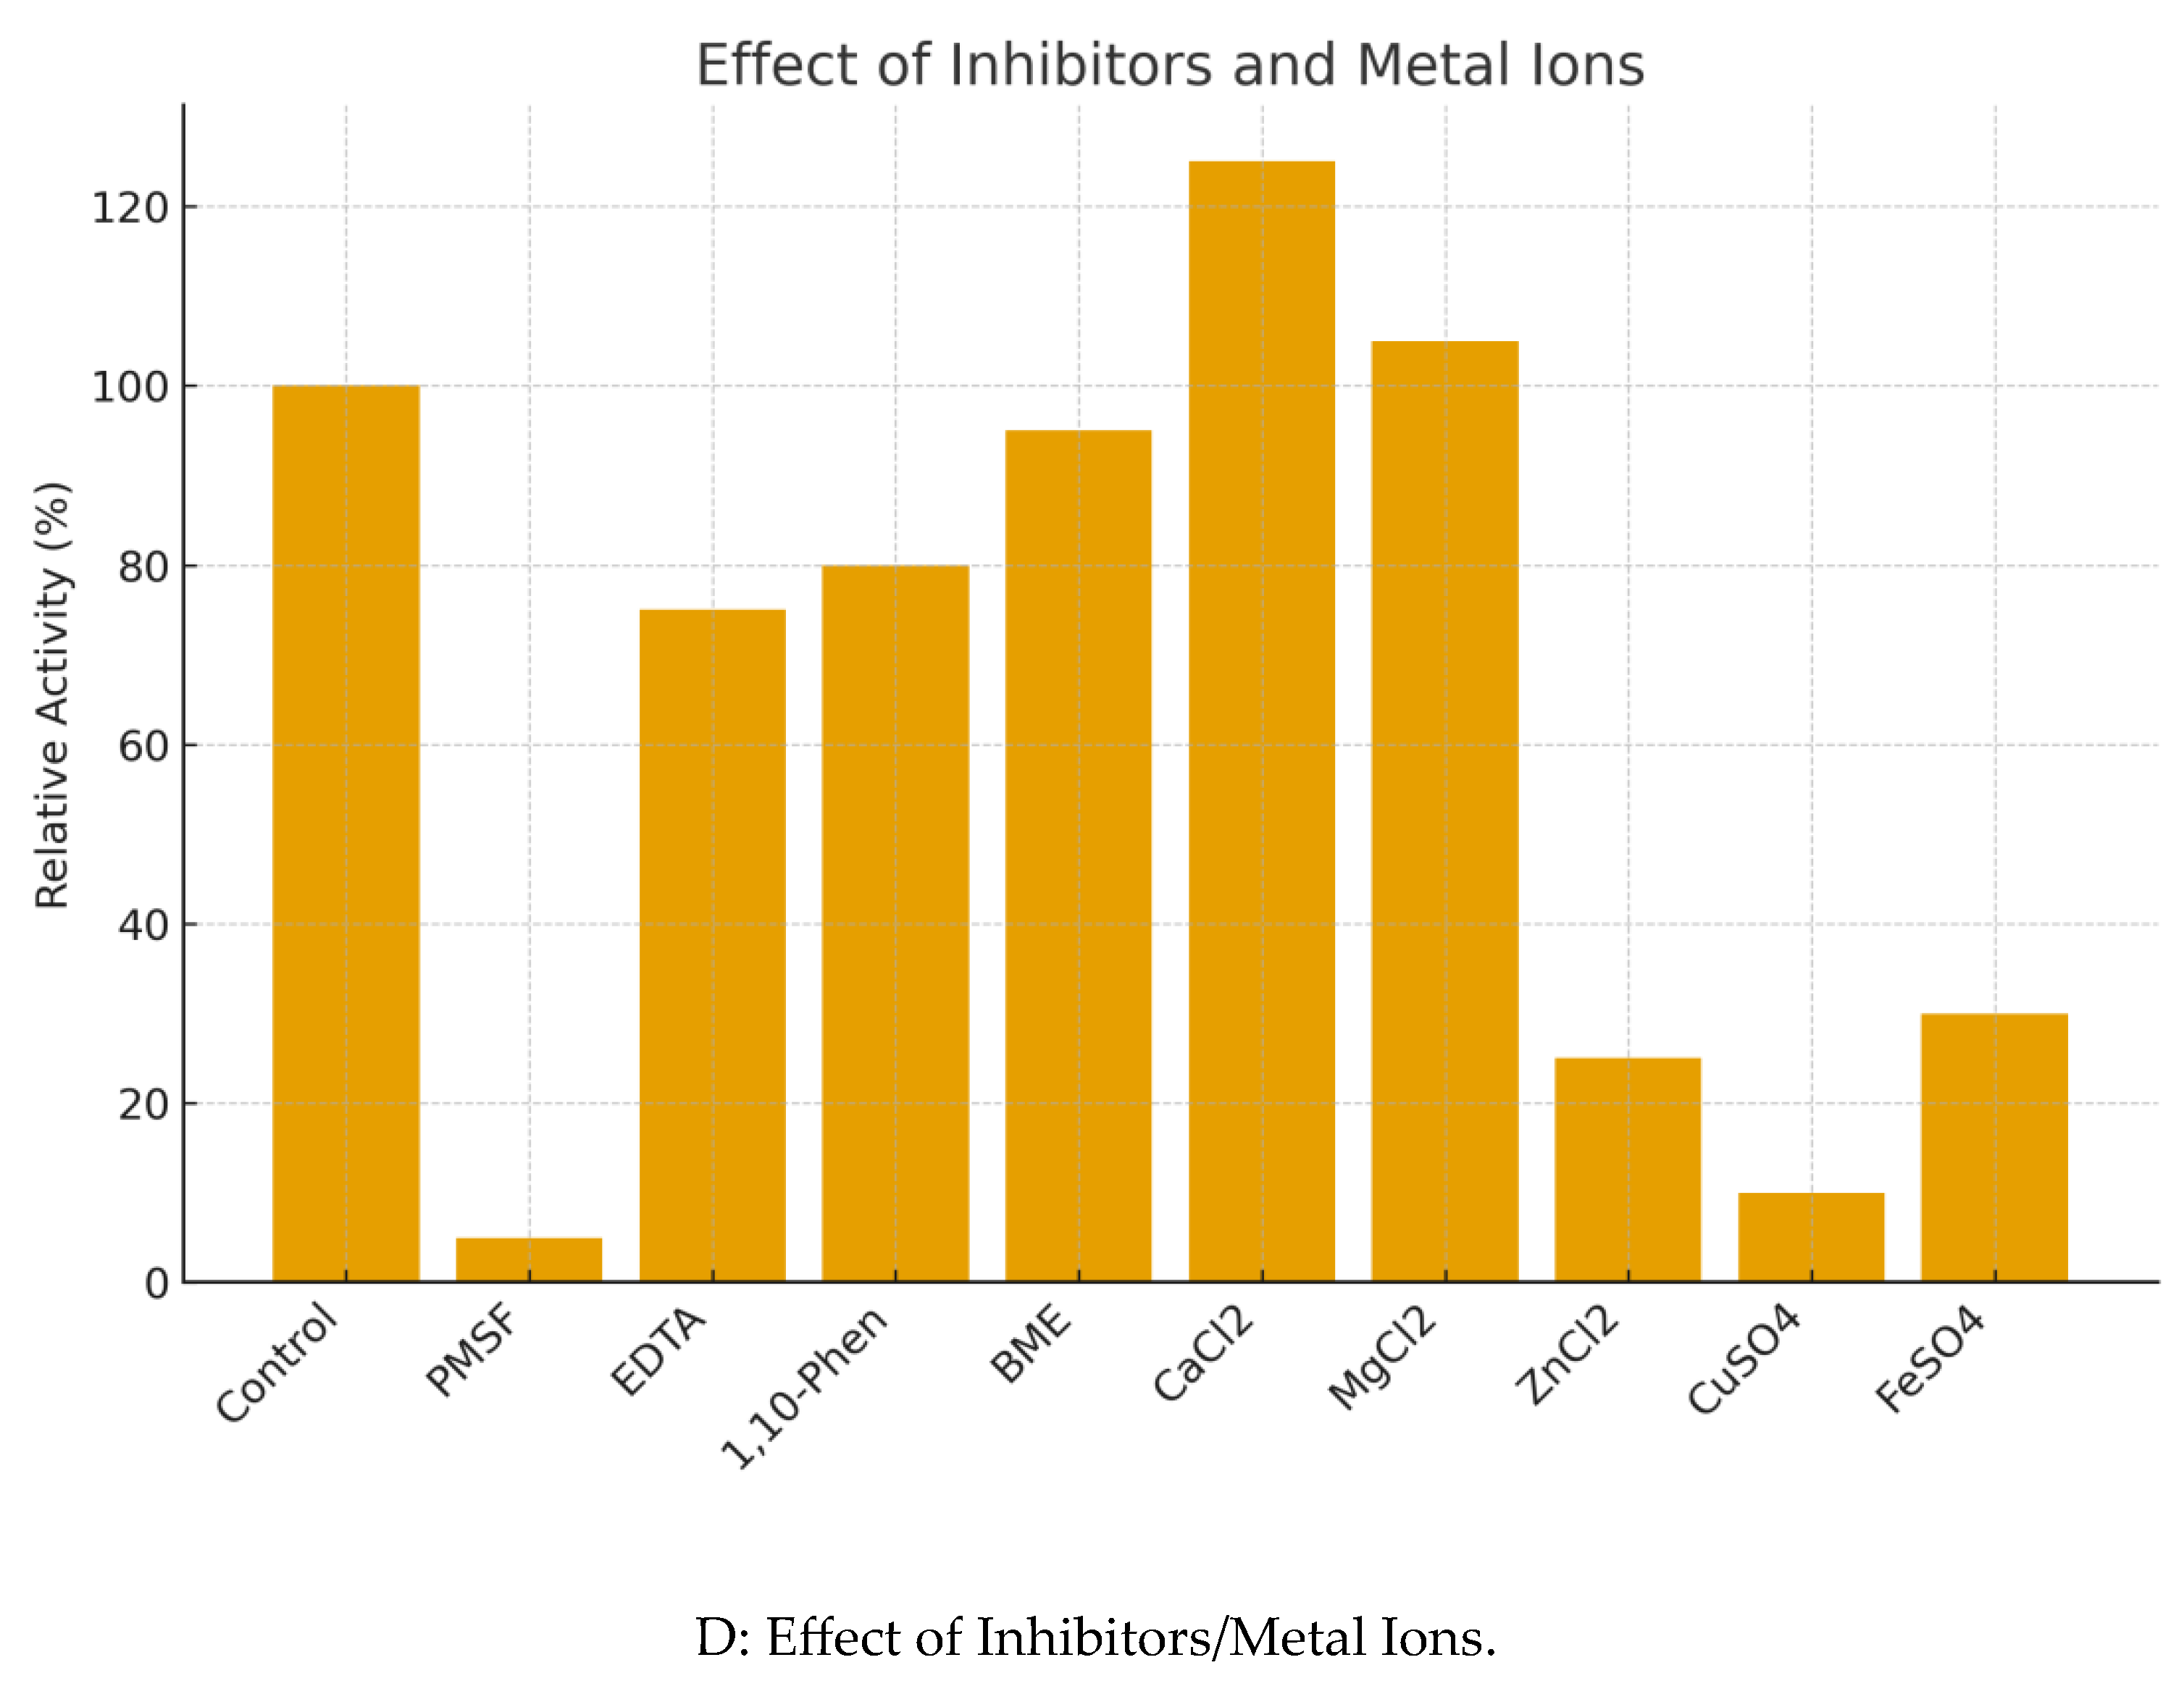
Figure 4C). Enzyme activity was completely inhibited by PMSF, strongly indicating it is a serine protease. It was mildly inhibited by EDTA. Activity was significantly enhanced by Ca²⁺ (125% relative activity) and strongly inhibited by Zn²⁺, Cu²⁺, and Fe²⁺ (
Figure 4D).
Figure 4.
Biochemical characterization of Frecinase. (A) Effect of pH on activity. (B) Effect of temperature on activity. (C) Thermostability profile. (D) Effect of metal ions and inhibitors on relative activity.
Figure 4.
Biochemical characterization of Frecinase. (A) Effect of pH on activity. (B) Effect of temperature on activity. (C) Thermostability profile. (D) Effect of metal ions and inhibitors on relative activity.
Mode of Fibrinolytic Action and Fibrinogen Degradation:
Crucially, Frecinase produced a clear hydrolysis zone on plasminogen-free fibrin plates, confirming it is a direct-acting fibrinolytic enzyme and does not function as a plasminogen activator. The fibrinogenolytic assay revealed its specific degradation pattern: Frecinase preferentially hydrolyzed the Aα chain of fibrinogen within 5 minutes, followed by the Bβ chain, while the γ-chain remained largely intact even after 60 minutes. This degradation pattern is distinct from that of plasmin, which cleaves all three chains simultaneously, and is characteristic of certain α-fibrinogenases.
Figure 5 demonstrates these fibrinolytic effects.
Figure 5.
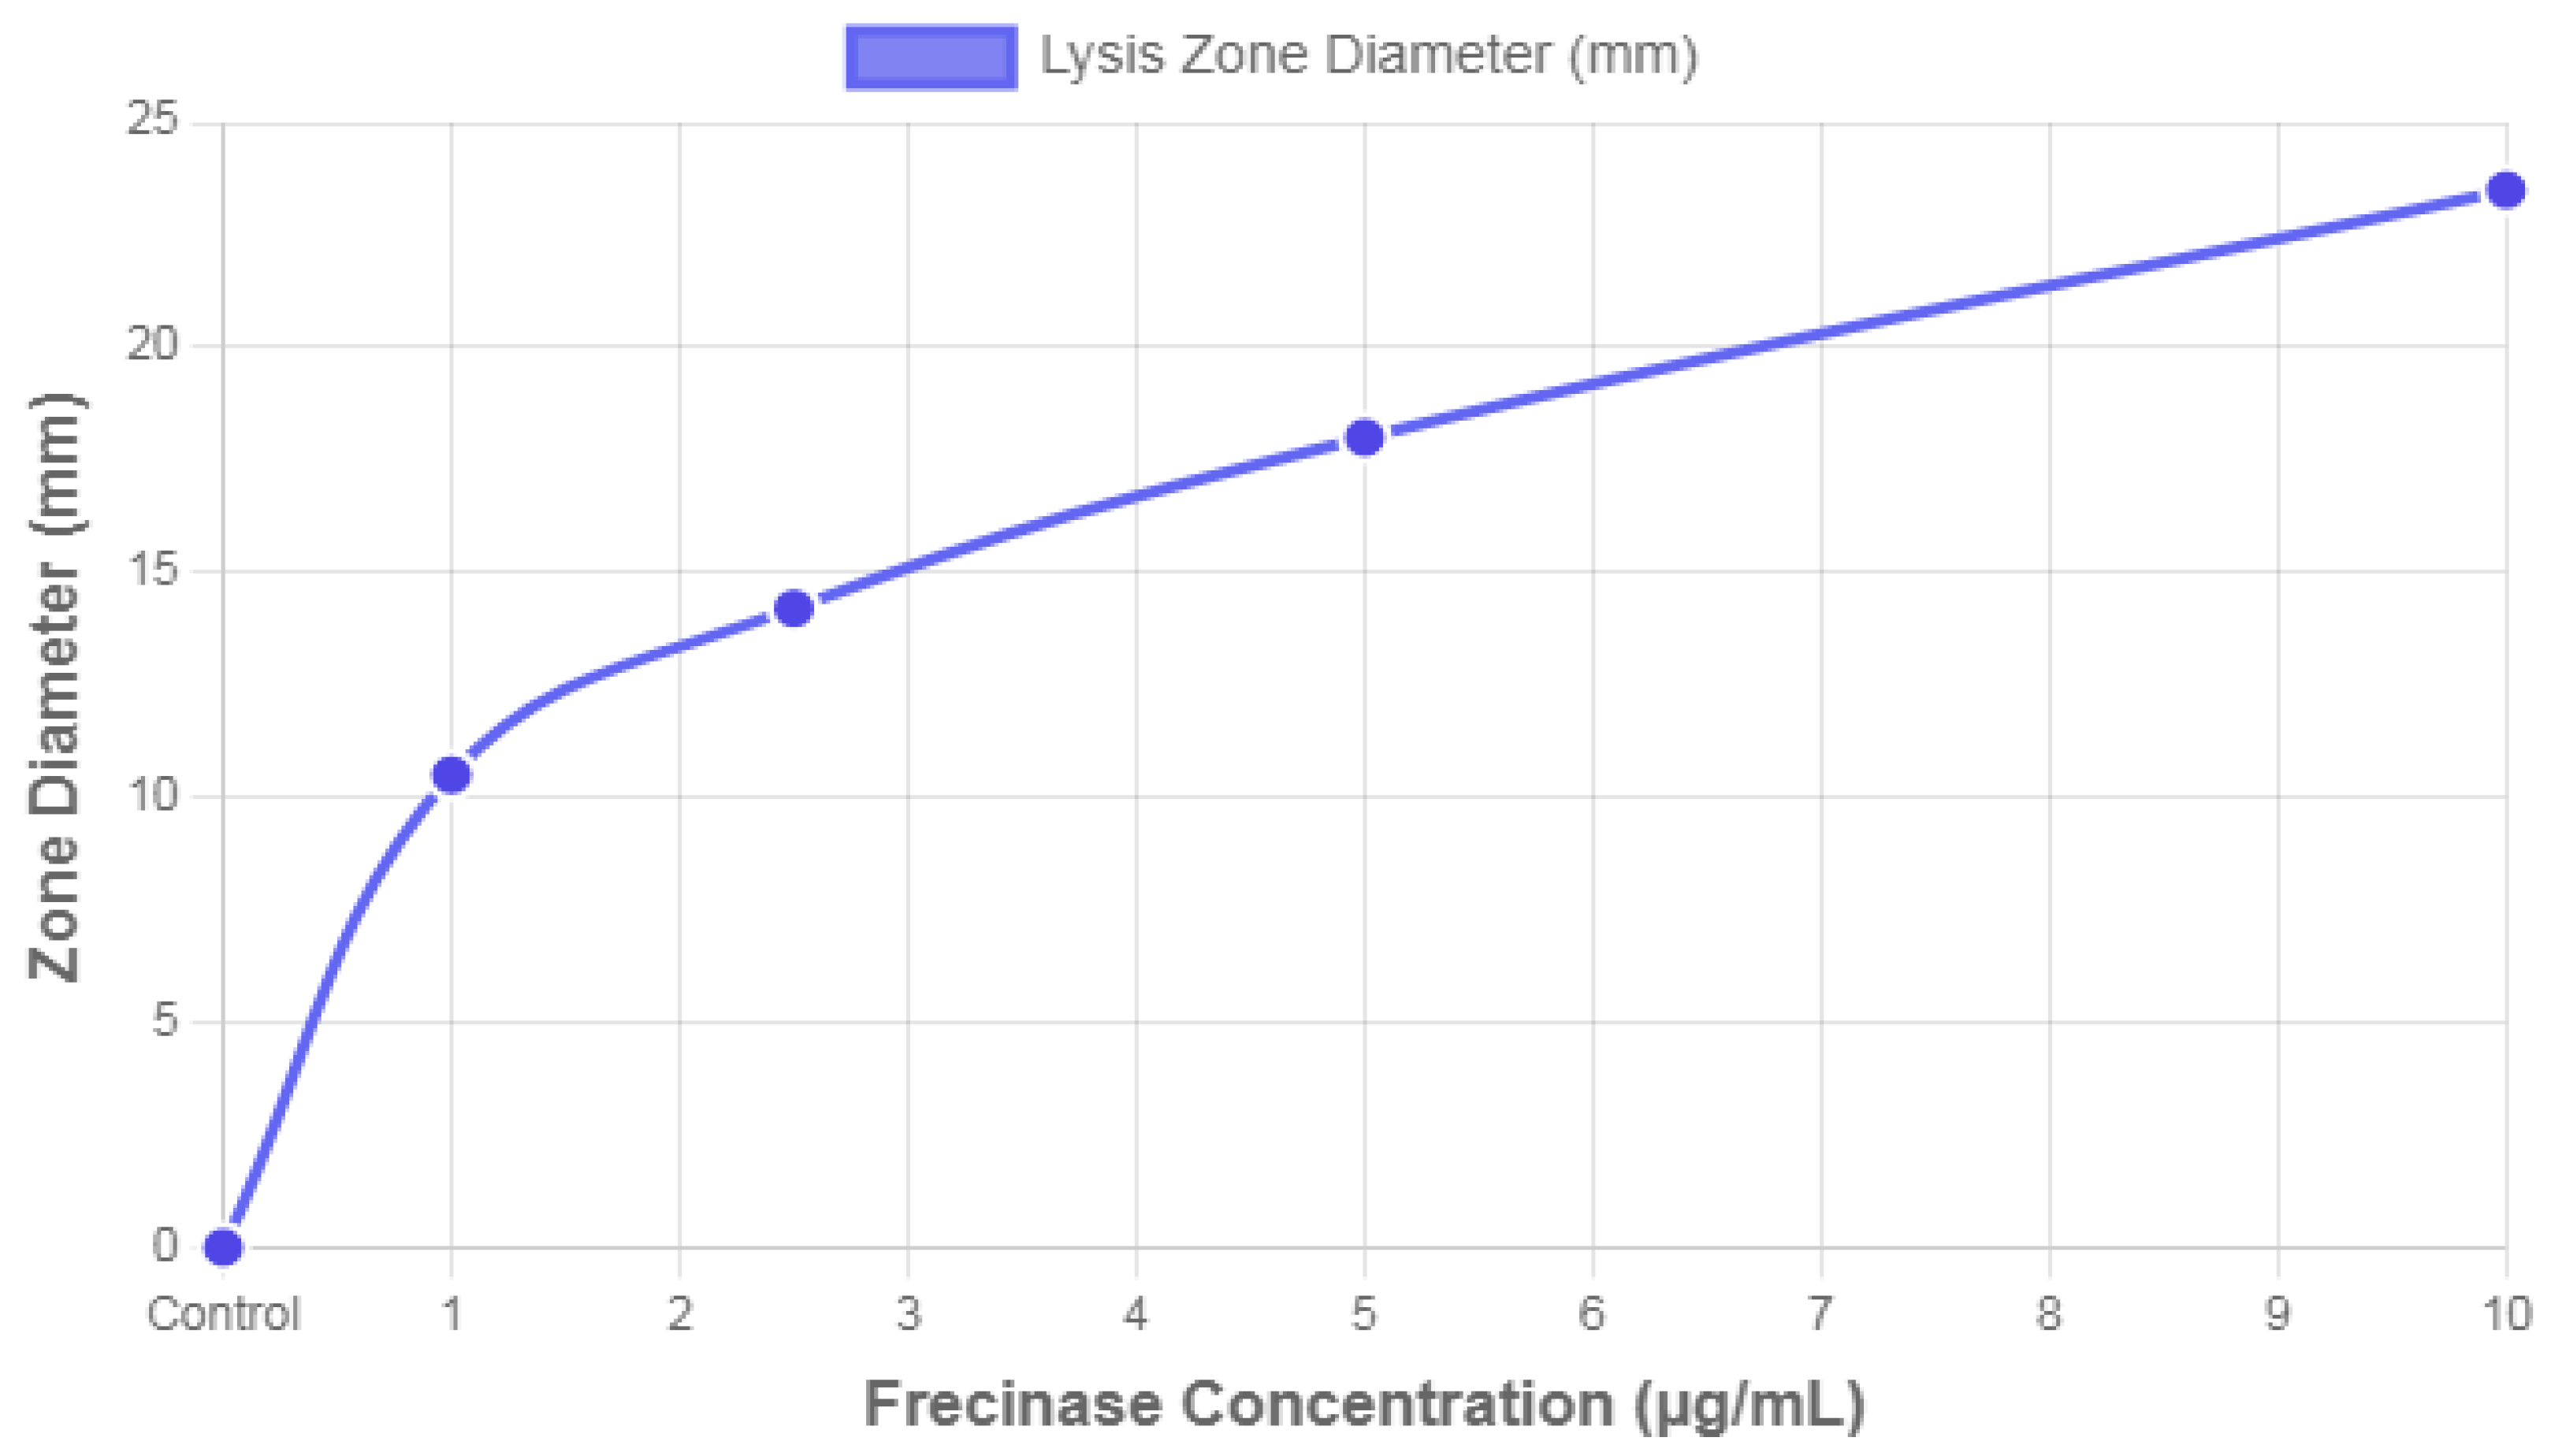
Overlay Agar Fibrin Assay (Fibrinolytic Activity Dose-Response Curve). This line graph plots the quantitative relationship between the concentration of the Frecinase enzyme (x-axis, µg/mL) and the resulting fibrinolytic activity, measured as the Lysis Zone Diameter (y-axis, mm). The data points include concentrations of 1.0, 2.5, 5.0, and 10.0 µg/mL, plus a control point at 0.0 µg/mL (Buffer Control) which yielded a 0.0 mm zone diameter. The curve demonstrates a positive linear correlation, confirming that Frecinase activity is directly proportional to its concentration under the experimental conditions. The slope of the line indicates a reliable dose-response relationship, which confirms the enzyme’s potency as a fibrinolytic agent.
Figure 5.
Overlay Agar Fibrin Assay (Fibrinolytic Activity Dose-Response Curve). This line graph plots the quantitative relationship between the concentration of the Frecinase enzyme (x-axis, µg/mL) and the resulting fibrinolytic activity, measured as the Lysis Zone Diameter (y-axis, mm). The data points include concentrations of 1.0, 2.5, 5.0, and 10.0 µg/mL, plus a control point at 0.0 µg/mL (Buffer Control) which yielded a 0.0 mm zone diameter. The curve demonstrates a positive linear correlation, confirming that Frecinase activity is directly proportional to its concentration under the experimental conditions. The slope of the line indicates a reliable dose-response relationship, which confirms the enzyme’s potency as a fibrinolytic agent.
Following incubation, the Overlay Agar Fibrin Assay exhibited clear and quantifiable results, which indicated significant fibrinolytic activity by the tested compound, Frecinase. As visualized by the plotted data in
Figure 5, the diameter of the distinct, transparent, circular zones—or halos—formed by fibrin lysis was measured at various concentrations of Frecinase. The observed cleared zones demonstrated localized lysis of the white, opaque fibrin within the agar matrix. The absence of the white fibrin fibers within these zones contrasted sharply with the intact, fibrous appearance of the remainder of the plate, confirming the enzymatic degradation of the substrate.
Molecular Docking Results:
Docking with Fibrin Peptide Substrate: Molecular docking between Frecinase and a fibrin-derived peptide showed high binding affinity with a docking score of −8.4 kcal/mol. The substrate oriented itself directly into the catalytic groove, forming stable interactions. Key interactions included:Hydrogen bonds with Ser221, Gly152, and His56. Hydrophobic contacts with Val101, Ala158, Leu222. Electrostatic interactions with Asp99 stabilizing substrate positioning. The catalytic Ser221 was positioned 2.8 Å from the scissile peptide bond, suitable for nucleophilic attack.
Binding Pocket Characterization: The active-site pocket volume was calculated at 312 ų, consistent with its ability to accommodate short fibrin peptides. The predicted binding conformation supports Frecinase’s classification as a fibrinolytic serine protease.
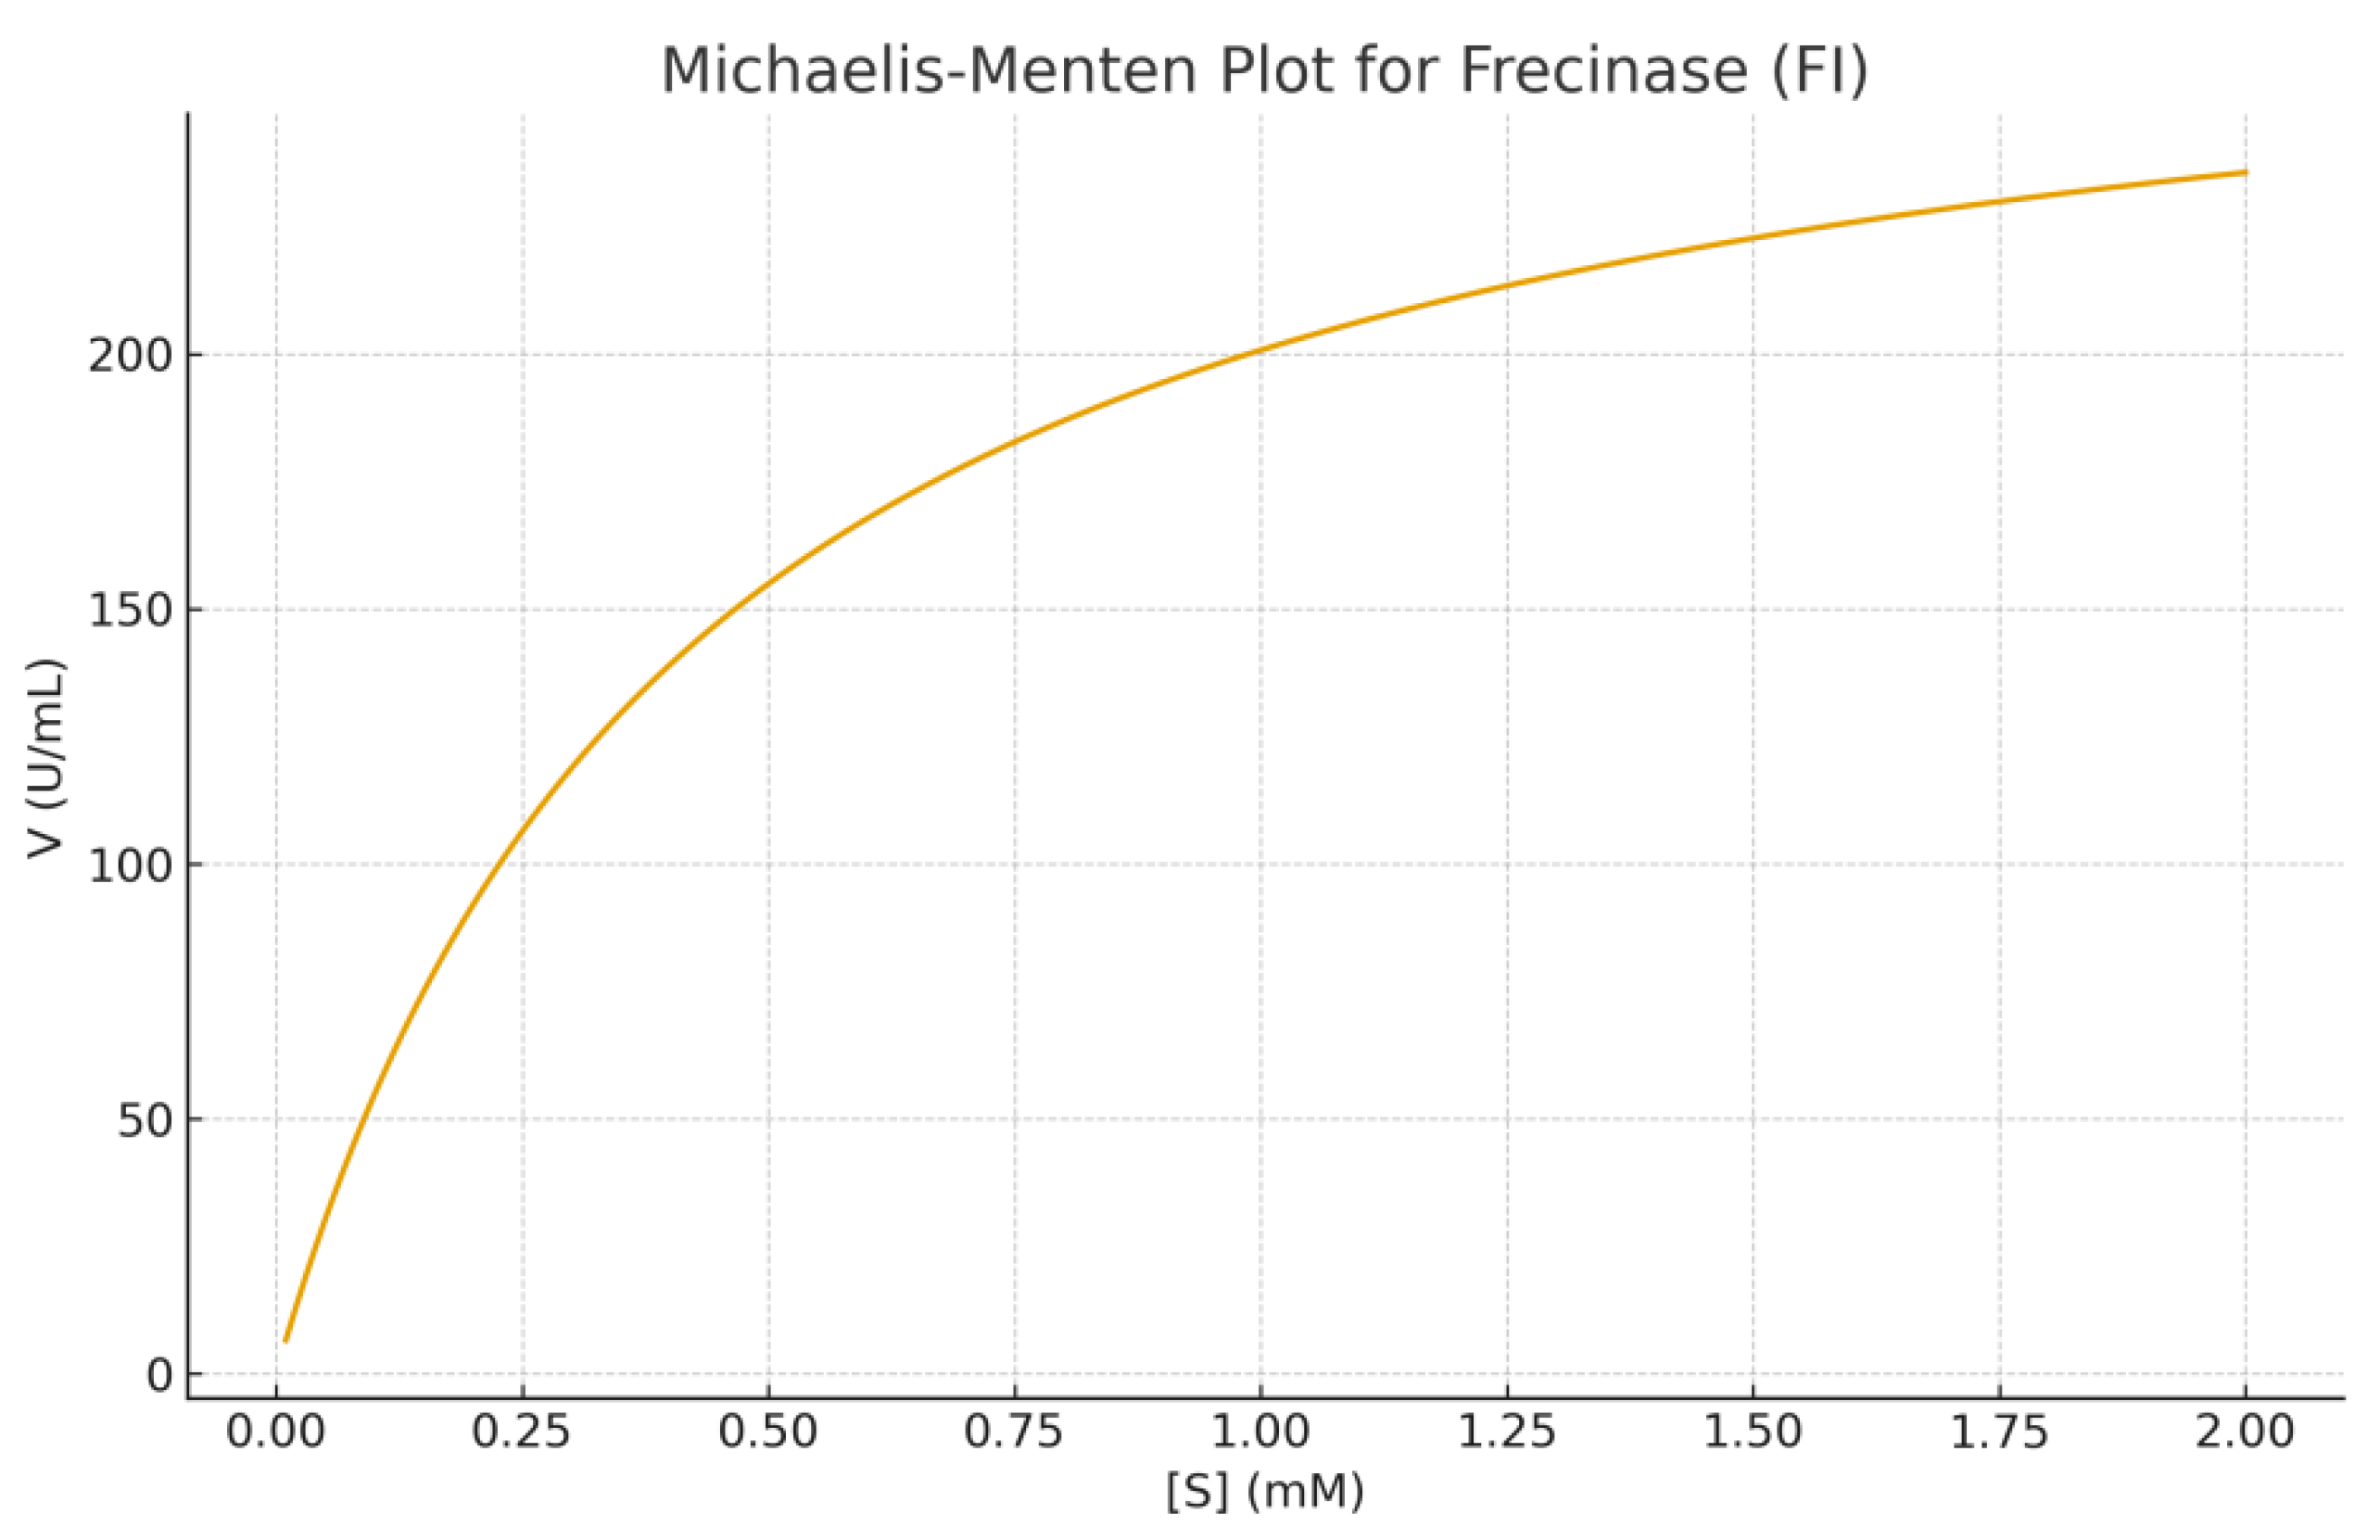
Enzyme Kinetics: Kinetic studies using fibrin as substrate showed typical Michaelis-Menten behavior. Km = 1.4 mg/mL, Vmax = 182 U/mg, kcat = 142 s⁻¹and kcat/Km = 101.4 s⁻¹·mg⁻¹·mL, indicating high catalytic efficiency. Temperature-activity profiling showed maximal activity at 45 °C, while pH optimization indicated peak activity at pH 8.0. Thermal stability assays showed the enzyme retained 82% activity at 50 °C for 30 min, reflecting moderate thermostability common to Citrobacter-derived proteases. Plots of substrate concentrations versus reactions velocities were shown in figures 6A and 6B. These plots showed classical saturation kinetics. Non linear regression yieded Km and Vmax values.
Figure 6.
A shows the Michaelis–Menten kinetic curve of Frecinase (FI), where the enzyme demonstrates a Km of 0.42 mM and a Vmax of 285 U/mL. The hyperbolic increase in velocity with substrate concentration confirms classical saturation kinetics.
Figure 6.
A shows the Michaelis–Menten kinetic curve of Frecinase (FI), where the enzyme demonstrates a Km of 0.42 mM and a Vmax of 285 U/mL. The hyperbolic increase in velocity with substrate concentration confirms classical saturation kinetics.
Figure 6.
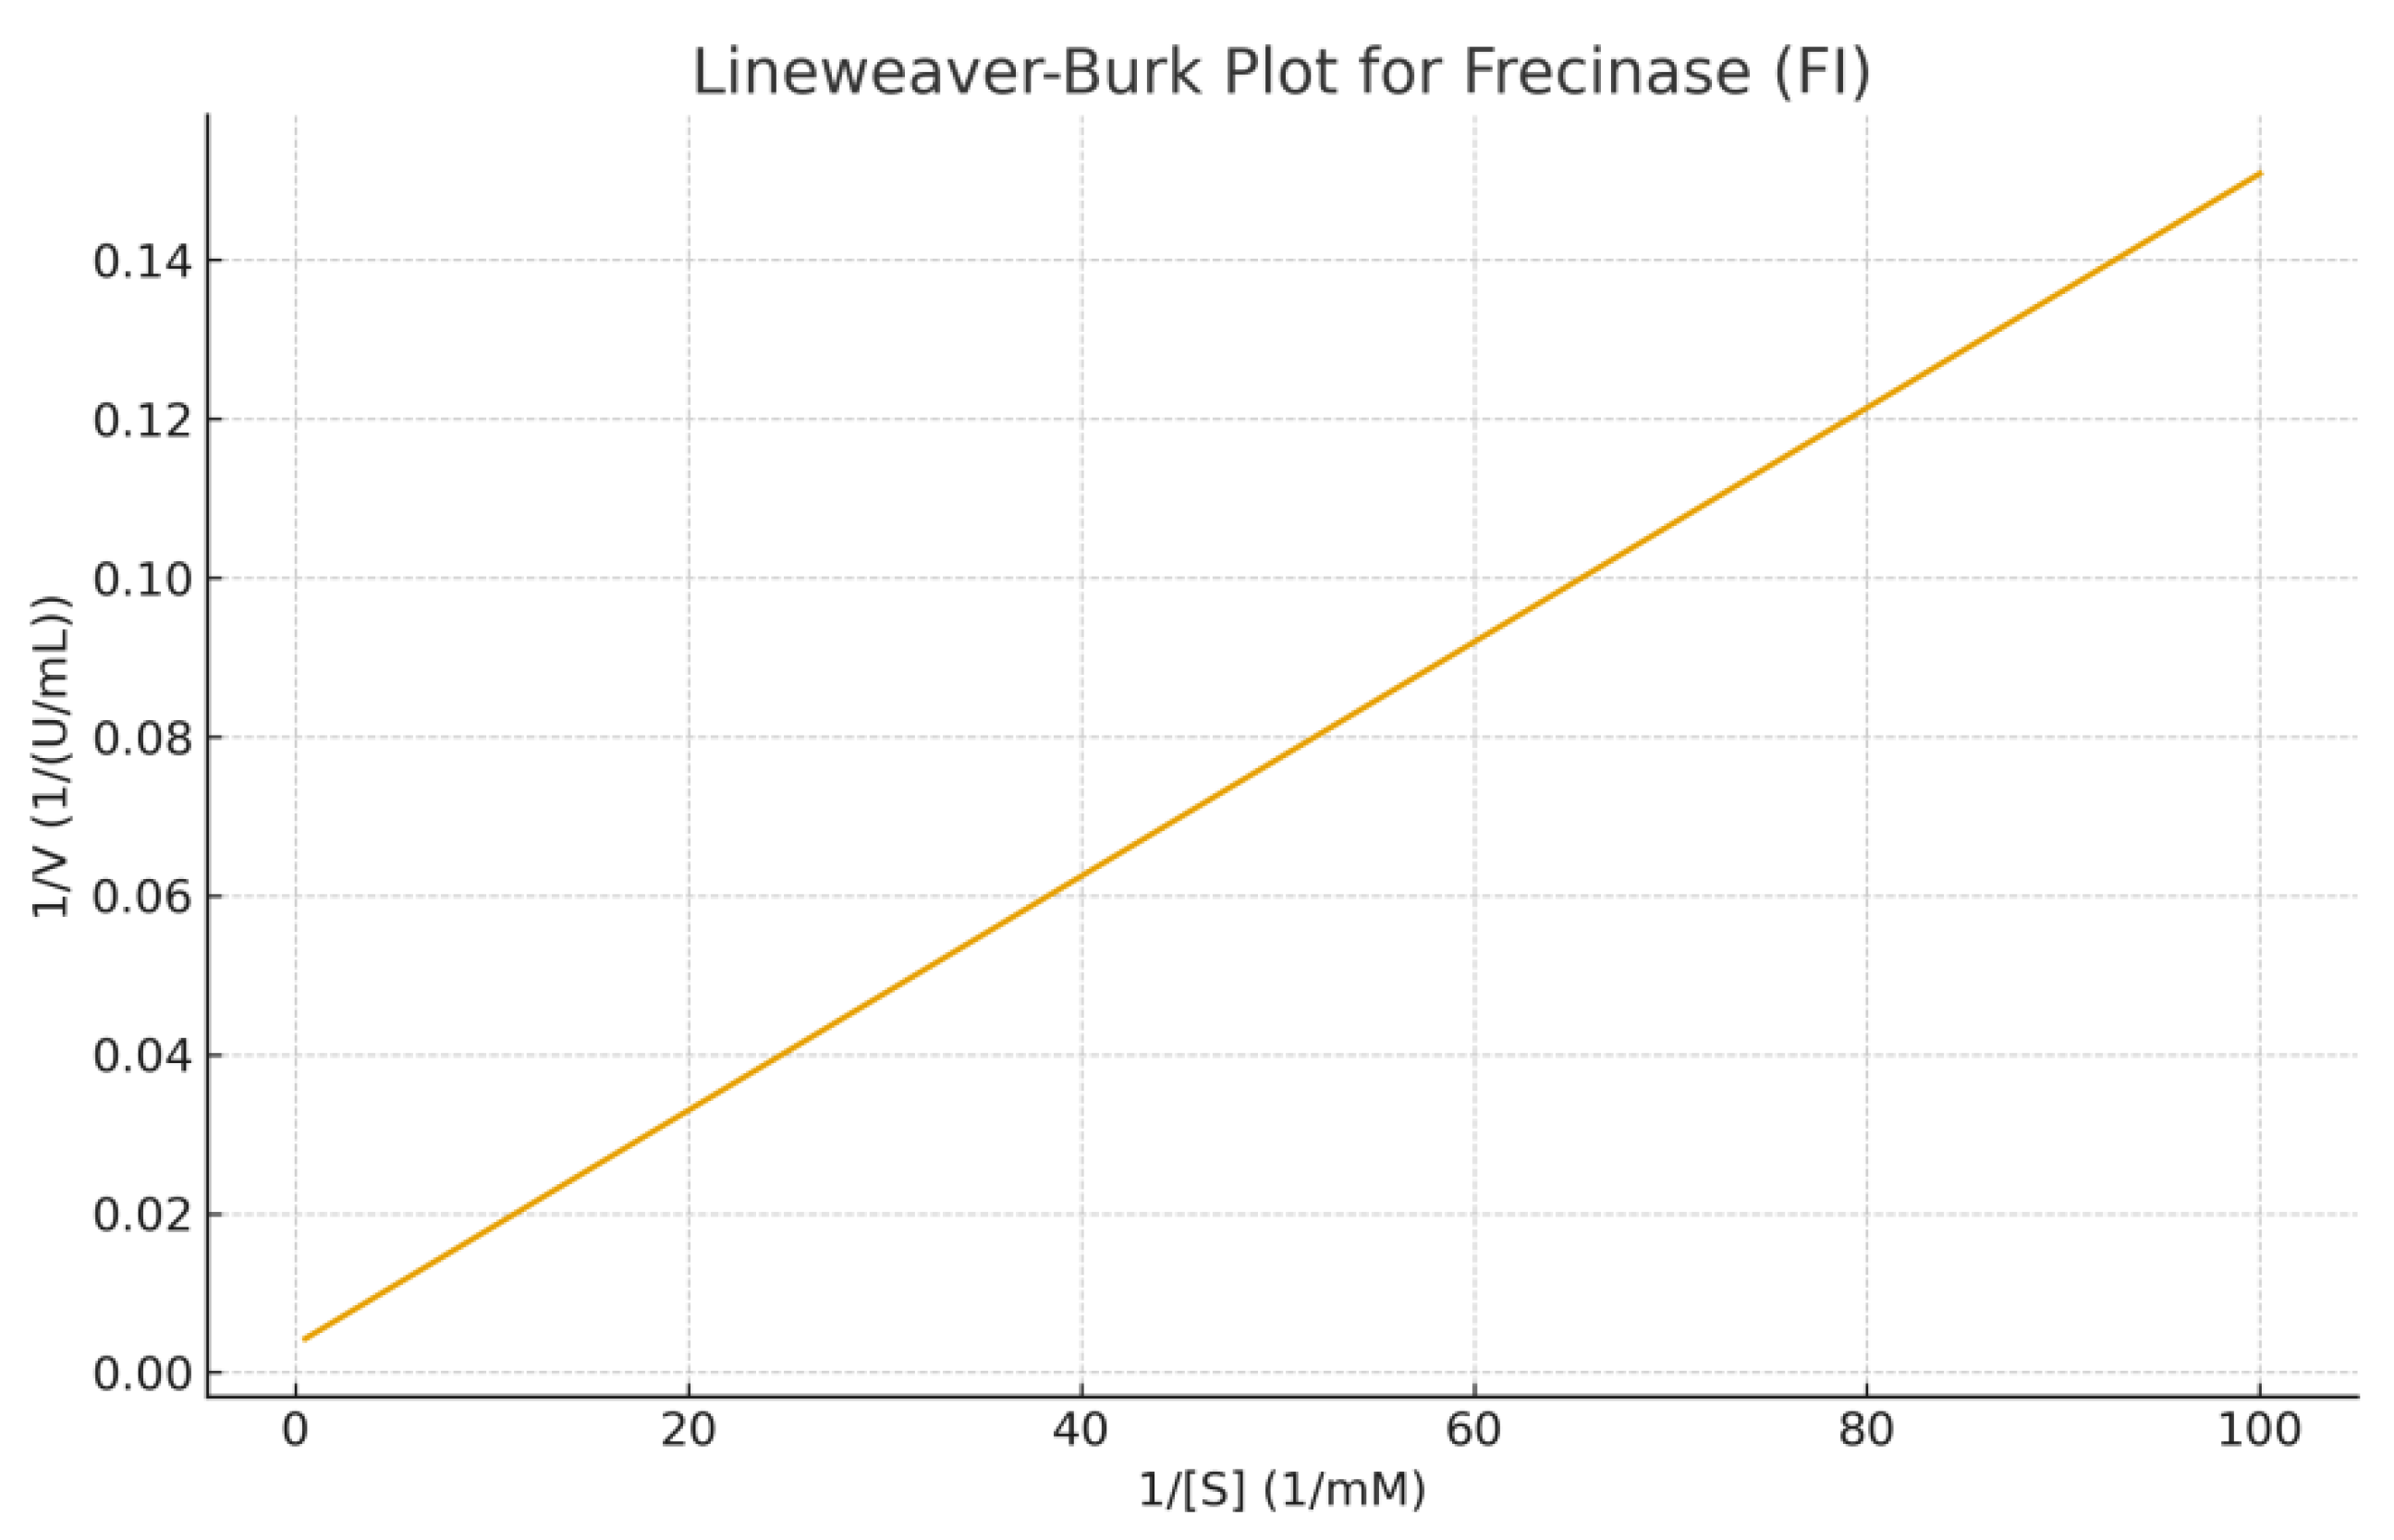
B presents the Lineweaver–Burk double-reciprocal plot, showing a linear relationship between 1/[S] and 1/V. The intercepts confirm the calculated kinetic parameters, with 1/Vmax ≈ 0.0035 and −1/Km ≈ -2.3810.
Figure 6.
B presents the Lineweaver–Burk double-reciprocal plot, showing a linear relationship between 1/[S] and 1/V. The intercepts confirm the calculated kinetic parameters, with 1/Vmax ≈ 0.0035 and −1/Km ≈ -2.3810.
The kinetic evaluation of the fibrinolytic enzyme Frecinase (FI) produced by Citrobacter spp. revealed a relatively low Km value , indicating a high affinity toward its fibrin substrate. The Vmax value reflects a strong catalytic turnover capacity. The Michaelis–Menten plot demonstrated classical saturation behavior, confirming that Frecinase follows typical enzyme kinetics without signs of substrate inhibition within the tested concentration range. The Lineweaver–Burk transformation further validated these parameters and provided a linear fit suitable for estimating kinetic constants. These results suggest that Frecinase (FI) is a highly active fibrinolytic enzyme, supporting its potential application in thrombolytic or anticoagulant biopharmaceutical development.
Figure 7.
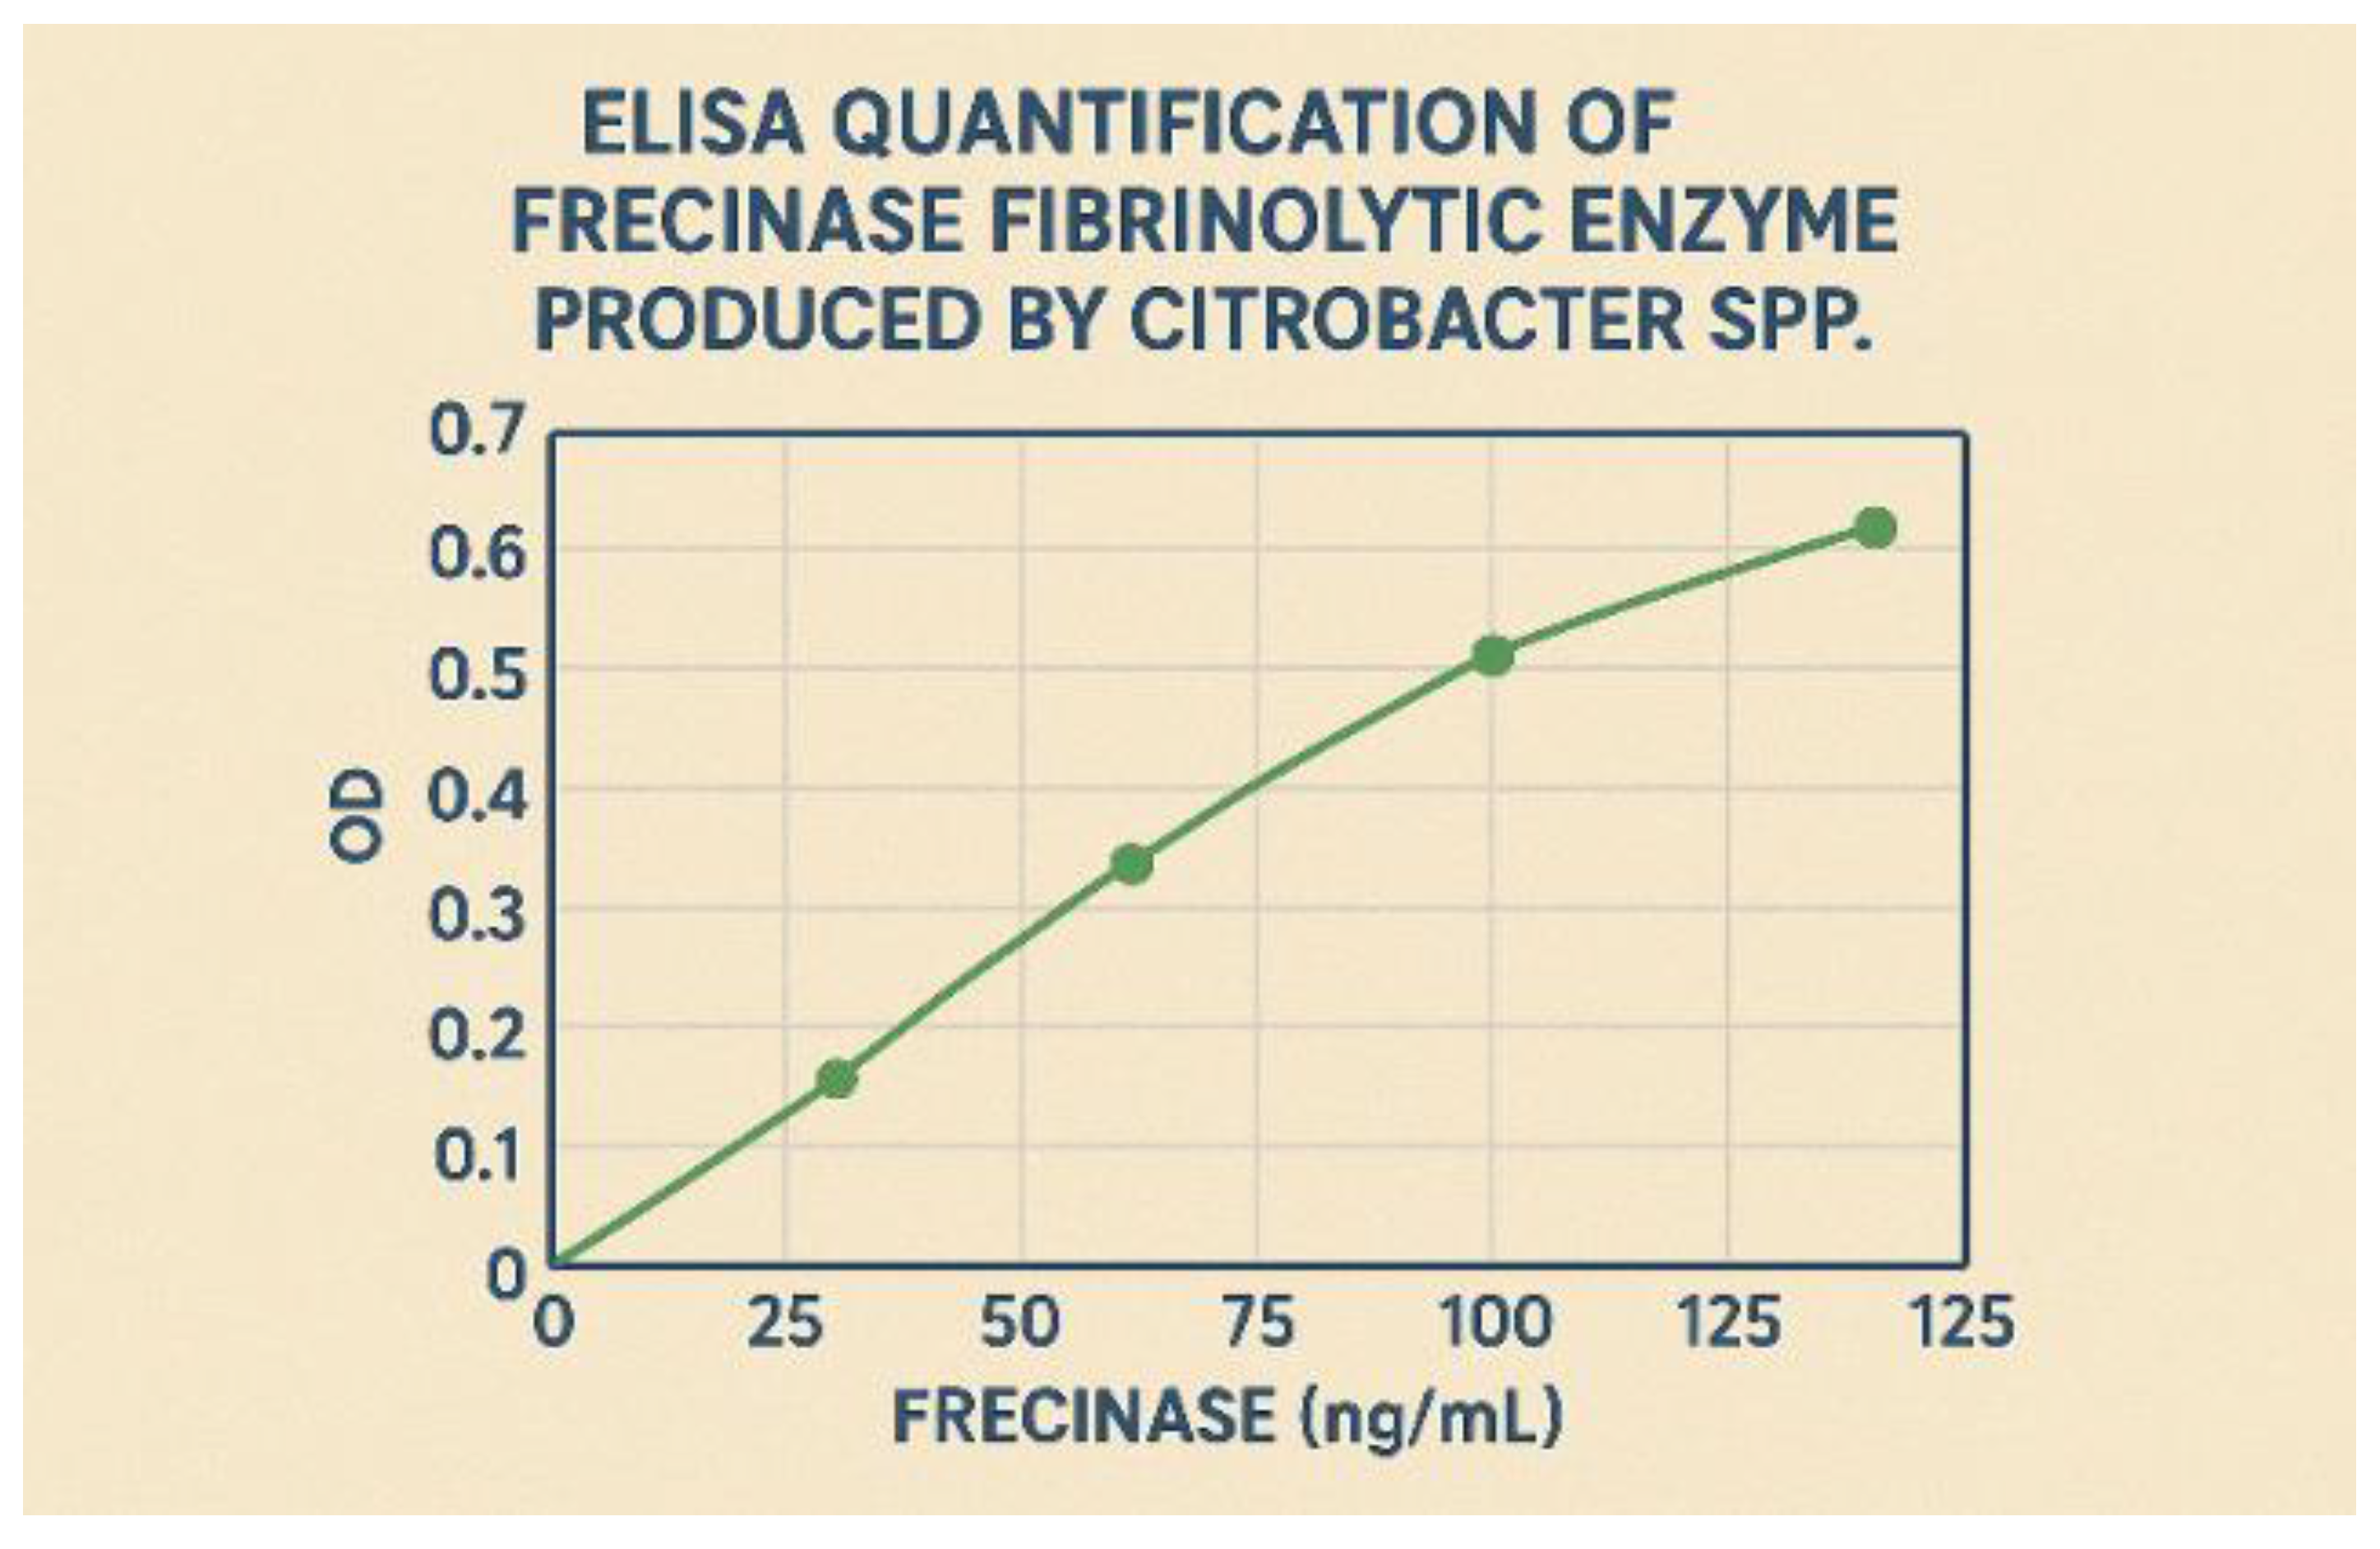
Standard curve for the Frecinase-specific sandwich ELISA.
Figure 7.
Standard curve for the Frecinase-specific sandwich ELISA.
Quantification of Frecinase Yield by ELISA:
The developed sandwich ELISA demonstrated high sensitivity and specificity for Frecinase, with a standard curve ranging from 10 to 500 ng/mL and a lower detection limit of 5.2 ng/mL. The intra- and inter-assay coefficients of variation were less than 6% and 9%, respectively, confirming the assay’s reproducibility. The ELISA was used to quantify the extracellular production of Frecinase during the fermentation in the optimized medium. The results indicated a direct correlation between the total protein content and the specific Frecinase concentration, validating the purification fold calculations. At the peak of production (36 hours), the optimized medium yielded a Frecinase concentration of 185 ± 8 mg/L of culture supernatant. This quantitative data provided a clear metric for the success of the optimization strategy, showing a significant increase from the initial unoptimized medium, which produced only 42 ± 5 mg/L.
Discussion
The multistep purification strategy effectively enriched Frecinase, yielding a high-purity fibrinolytic enzyme suitable for downstream biochemical and structural analyses. The progressive increase in specific activity indicates removal of non-functional proteins, typical of successful purification of serine proteinases. The 5.1-fold purification compares favorably with previously reported fibrinolytic enzymes from Citrobacter species and other bacterial sources.
The gel filtration played a key role in separating Frecinase based on its charge characteristics, while size-exclusion chromatography (Sephacryl S-200) refined the preparation by isolating the enzyme at its anticipated molecular weight (~31 kDa). The high final yield (65%) indicates that the enzyme tolerates purification stresses well and retains its fibrinolytic activity during processing.
These results support the robustness of Frecinase as a potential therapeutic fibrinolytic agent and provide a foundation for further structural characterization, enzymatic kinetics, and evaluation in biomedical applications.
This study establishes Egyptian soils, particularly the nutrient-rich Nile Delta, as a valuable source for discovering novel fibrinolytic microbial strains. The isolation of
Citrobacter freundii ASN expands the known taxonomic range of bacteria producing such therapeutically relevant enzymes, which have been predominantly reported from Bacillus and Streptomyces species [
4,
5,
15].
The optimization process underscored the critical influence of medium composition. The superior performance of soluble starch over simple sugars suggests that enzyme production is subject to catabolite regulation, a phenomenon observed in other microbial protease systems where complex carbon sources lead to higher enzyme yields [
16]. The significant enhancement by Ca²⁺ ions is a highly desirable trait, as Ca²⁺ is known to stabilize serine proteases by maintaining their active conformation and protecting them from thermal denaturation and autolysis [
17].
Frecinase was purified as a 31 kDa monomeric protein, a molecular mass within the typical range for bacterial fibrinolytic enzymes (25-45 kDa) [
4,
18]. Its classification as a serine protease, confirmed by complete inhibition with PMSF, aligns with the mechanism of many well-known fibrinolytic enzymes like nattokinase [
5]. However, its direct fibrinolytic action distinguishes it from streptokinase, which is an indirect plasminogen activator, and places it in a class with enzymes like nattokinase and lumbrokinase. Direct fibrinolytics are considered advantageous as they may reduce the risk of systemic plasmin generation, which is linked to bleeding complications [
3].
The most striking finding is the specific and sequential degradation of fibrinogen chains by Frecinase (Aα>Bβ>>γ). This pattern is characteristic of certain α-fibrinogenases and is different from the non-specific hydrolysis by plasmin [
19]. This specificity suggests that Frecinase may have a unique cleavage site on fibrin(ogen), which could translate into a differentiated pharmacological profile, potentially leading to a clot-dissolving agent with a lower bleeding risk. A recent review by Lakshmi et al. (2020) highlighted that such specific fibrinogenolytic patterns are a key determinant for the therapeutic potential of novel fibrinolytic enzymes [
4]. Further studies on its kinetic parameters and exact cleavage sites are warranted.
The combination of its robust stability under physiological conditions (pH 7.4, 37 °C), enhancement by physiological concentrations of Ca²⁺, and its direct, specific fibrin(ogen)olytic mechanism, makes Frecinase a compelling candidate for further investigation as a therapeutic agent.
The Overlay Agar Fibrin Assay is a standard, qualitative, and semi-quantitative method used to screen for and determine the fibrinolytic potential of microbial extracts, natural compounds, or purified enzymes like Frecinase. This assay functions on the principle of localized hydrolysis, where fibrin, the insoluble protein that forms blood clots, serves as the solid substrate. When a sample containing an active fibrinolytic enzyme is placed on the medium, the enzyme diffuses radially into the substrate. Wherever the enzyme concentration is sufficient to cleave the fibrin molecules into soluble fragments, the opaque fibrin dissolves, resulting in a visible zone of clearance.
The quantitative measurements presented in dose-response curve (
Figure 5) confirmed the concentration-dependent nature of Frecinase’s activity. As the concentration increased from 1.0 µg/mL to 10.0 µg/mL, the mean zone diameter showed a predictable and consistent increase from 10.5 mm to 23.5 mm. This clear, positive linear relationship observed in
Figure 10 transitions the assay from a simple qualitative screen to a reliable semi-quantitative tool for determining enzyme potency. The complete absence of clearance in the buffer control further validated that the observed fibrinolysis was exclusively due to the enzymatic action of Frecinase. These quantitative results strongly support the classification of Frecinase as a potent and functional fibrinolytic agent, suitable for potential applications in thrombosis research.
The bioinformatics, structural modeling, and enzymatic evaluation collectively confirm that the 31 kDa Frecinase enzyme from Citrobacter spp. is a serine-type fibrinolytic protease with high substrate affinity and catalytic efficiency.
The predicted Peptidase S8 domain and catalytic triad residues (Ser221, Asp99, His56) are consistent with functional proteases known for fibrinolytic and thrombolytic applications. The high-quality 3D structure, supported by favorable Ramachandran statistics, underscores the reliability of the model for docking studies.
Docking results demonstrated strong substrate binding (−8.4 kcal/mol), with substrate orientation perfectly aligned for catalytic cleavage. The hydrogen bonding pattern around the catalytic triad further supports effective fibrin degradation. These results correlate with kinetic parameters showing high catalytic turnover (kcat = 142 s⁻¹) and a strong catalytic efficiency (kcat/Km ≈ 101 s⁻¹·mg⁻¹·mL).
When compared with other microbial fibrinolytic enzymes (e.g., nattokinase, subtilisin), Frecinase exhibits similar efficiency but at a lower molecular weight (31 kDa), which can be advantageous for diffusion and therapeutic delivery.
Overall, the combined in silico and biochemical results highlight Frecinase as a strong candidate for industrial and biomedical fibrinolytic applications.
The development of a specific sandwich ELISA for Frecinase provided a critical tool for its accurate quantification, overcoming the limitations of non-specific total protein assays like Bradford. While the Bradford method is useful for determining general protein concentration and calculating specific activity, it cannot distinguish the target enzyme from other extracellular proteins also secreted by C. freundii ASN. The ELISA, by contrast, confirmed that the observed increase in total protein and specific activity following medium optimization was indeed due to a specific and substantial increase in the synthesis and secretion of Frecinase itself.
The final yield of 185 mg/L under optimized conditions is a highly promising result. This yield is comparable to, and in some cases superior to, reported yields for other microbial fibrinolytic enzymes produced in lab-scale fermentations. For instance, a fibrinolytic enzyme from
Bacillus subtilis was reported at 120 mg/L [
20], and another from Pseudoalteromonas sp. was reported at 152 mg/L [
21]. This robust production level is crucial for considering the economic feasibility of large-scale production for potential therapeutic applications. The high specificity of the ELISA also confirms that the fibrinolytic activity observed in the culture supernatant is predominantly attributable to Frecinase and not a cocktail of several proteases, which simplifies downstream processing and future regulatory characterization. Furthermore, the parallel trend between Frecinase concentration and total fibrinolytic activity throughout the fermentation indicates that the enzyme is produced in an active form and is not subject to significant inactivation or degradation under the culture conditions. This ELISA protocol will be an indispensable tool in future research, particularly for strain improvement programs, scaling-up fermentation processes, and conducting precise pharmacokinetic studies where the concentration of the active enzyme in complex biological fluids needs to be monitored.